arXiv:1305.0309v1 [astro-ph.IM] 1 May 2013 Draft version May 3, 2013 Preprint typeset using L A T E X style emulateapj v. 5/2/11 THE INFLUENCE OF MOTION AND STRESS ON OPTICAL FIBERS Jeremy D. Murphy a,c , Gary J. Hill b , Phillip J. MacQueen b , Trey Taylor b , Ian Soukup e , Walter Moreira b , Mark E. Cornell b , John Good b , Seth Anderson c , Lindsay Fuller c , Hanshin Lee b , Andreas Kelz d , Marc Rafal b , Tom Rafferty b , Sarah Tuttle b , Brian Vattiat b Draft version May 3, 2013 ABSTRACT We report on extensive testing carried out on the optical fibers for the VIRUS instrument. The primary result of this work explores how 10+ years of simulated wear on a VIRUS fiber bundle affects both transmission and focal ratio degradation (FRD) of the optical fibers. During the accelerated lifetime tests we continuously monitored the fibers for signs of FRD. We find that transient FRD events were common during the portions of the tests when motion was at telescope slew rates, but dropped to negligible levels during rates of motion typical for science observation. Tests of fiber transmission and FRD conducted both before and after the lifetime tests reveal that while transmission values do not change over the 10+ years of simulated wear, a clear increase in FRD is seen in all 18 fibers tested. This increase in FRD is likely due to microfractures that develop over time from repeated flexure of the fiber bundle, and stands in contrast to the transient FRD events that stem from localized stress and subsequent modal diffusion of light within the fibers. There was no measurable wavelength dependence on the increase in FRD over 350 nm to 600 nm. We also report on bend radius tests conducted on individual fibers and find the 266 μm VIRUS fibers to be immune to bending-induced FRD at bend radii of R ≥ 10 cm. Below this bend radius FRD increases slightly with decreasing radius. Lastly, we give details of a degradation seen in the fiber bundle currently deployed on the Mitchell Spectrograph (formally VIRUS-P) at McDonald Observatory. The degradation is shown to be caused by a localized shear in a select number of optical fibers that leads to an explosive form of FRD. In a few fibers, the overall transmission loss through the instrument can exceed 80%. These results are important for the VIRUS instrument, and for both current and proposed instruments that make use of optical fibers, particularly when the fibers are in continual motion during an observation, or experience repeated mechanical stress during their deployment. Subject headings: Optical Fibers, Focal Ratio Degradation, VIRUS, VIRUS-P, Mitchell Spectrograph, HETDEX 1. INTRODUCTION First proposed for use in astronomical instrumentation by Angel et al. (1977) optical fibers have revolutionized the field over the past 3 decades. This revolution has come about due to the flexibility optical fibers offer in re-routing the light from thetelescope focal plane to a more convenient location. The gain for this technological advance is clear as issues of instrument weight, size, stability, and temperature control are made largely obsolete. However, this advantage comes at a cost as fibers constitute an added element in the instrument’s optical path. Moreover, optical fibers are not entirely stable light guides, and while their characteristics have been studied in a comprehensive and systematic way by several groups (Ramsey 1988; Schmoll et al. 2003; Crause et al. 2008; Poppett & Allington-Smith 2010b), little work has been focused on their behavior during periods of motion and accumulated stress, with notable and valuable exceptions (Craig et al. 1988; Clayton 1989; Avila 1998; Bryant et al. 2010; Haynes et al. 2011; Bryant et al. 2011). As both current (Bershady et al. 2004; Kelz et al. 2004; Smith et al. 2004; Roth et al. 2005; Kelz et al. 2006b; Tuttle et al. 2008; Wilson et al. 2010) and proposed instrumentation (Navarro et al. 2010; Saunders et al. 2010) is making heavy use of optical fibers, with many instruments requiring repeated motion of the fiber optics, a clear understanding of their properties under these conditions is needed. Transmission and focal ratio degradation (FRD) are the two properties of optical fibers that are generally of most interest for astronomical instrumentation. Unlike transmission values, which are now routinely supplied by the fiber vendor and, over a wide wavelength range, are generally repeatable in the lab, FRD measurements are typically left to the individual groups responsible for the instrument. This is in large part due to two related issues in quantifying FRD. One, due to the low levels of light involved in measuring FRD, and the significant potential for systematic errors introduced by the experimental set-up, accurate measurements of FRD are challenging. Two, there is not one single source of FRD, but rather several affects of fiber polishing, mounting, and on-telescope application that drive the various causes of a divergent output light cone that we generally refer to under the generic term of FRD.(Haynes et al. 2011) [email protected] a Princeton University, Department of Astrophysical Sciences, 4 Ivy Lane, Peyton Hall, Princeton, NJ 08544 b The University of Texas, McDonald Observatory, 2515 Speedway C1402, Austin, Texas, USA 78712-1206 c The University of Texas, Department of Astronomy, 2515 Speedway C1400, Austin, Texas, USA 78712-1205 d Leibniz-Institut f¨ ur Astrophysik, An der Sternwarte 16, 14482 Potsdam, Germany e The Center for Electromechanics, The University of Texas, 1 University Station PRC R7000, Austin, Texas 78712

Welcome message from author
This document is posted to help you gain knowledge. Please leave a comment to let me know what you think about it! Share it to your friends and learn new things together.
Transcript
arX
iv:1
305.
0309
v1 [
astr
o-ph
.IM
] 1
May
201
3Draft version May 3, 2013Preprint typeset using LATEX style emulateapj v. 5/2/11
THE INFLUENCE OF MOTION AND STRESS ON OPTICAL FIBERS
Jeremy D. Murphya,c, Gary J. Hillb, Phillip J. MacQueenb,Trey Taylorb, Ian Soukupe, Walter Moreirab, Mark E. Cornellb, John Goodb,Seth Andersonc, Lindsay Fullerc, Hanshin Leeb, Andreas Kelzd, Marc Rafalb,
Tom Raffertyb, Sarah Tuttleb, Brian Vattiatb
Draft version May 3, 2013
ABSTRACT
We report on extensive testing carried out on the optical fibers for the VIRUS instrument. Theprimary result of this work explores how 10+ years of simulated wear on a VIRUS fiber bundle affectsboth transmission and focal ratio degradation (FRD) of the optical fibers. During the acceleratedlifetime tests we continuously monitored the fibers for signs of FRD. We find that transient FRD eventswere common during the portions of the tests when motion was at telescope slew rates, but dropped tonegligible levels during rates of motion typical for science observation. Tests of fiber transmission andFRD conducted both before and after the lifetime tests reveal that while transmission values do notchange over the 10+ years of simulated wear, a clear increase in FRD is seen in all 18 fibers tested.This increase in FRD is likely due to microfractures that develop over time from repeated flexureof the fiber bundle, and stands in contrast to the transient FRD events that stem from localizedstress and subsequent modal diffusion of light within the fibers. There was no measurable wavelengthdependence on the increase in FRD over 350 nm to 600 nm. We also report on bend radius testsconducted on individual fibers and find the 266 µm VIRUS fibers to be immune to bending-inducedFRD at bend radii of R ≥ 10 cm. Below this bend radius FRD increases slightly with decreasingradius. Lastly, we give details of a degradation seen in the fiber bundle currently deployed on theMitchell Spectrograph (formally VIRUS-P) at McDonald Observatory. The degradation is shown tobe caused by a localized shear in a select number of optical fibers that leads to an explosive form ofFRD. In a few fibers, the overall transmission loss through the instrument can exceed 80%. Theseresults are important for the VIRUS instrument, and for both current and proposed instruments thatmake use of optical fibers, particularly when the fibers are in continual motion during an observation,or experience repeated mechanical stress during their deployment.Subject headings: Optical Fibers, Focal Ratio Degradation, VIRUS, VIRUS-P, Mitchell Spectrograph,
HETDEX
1. INTRODUCTION
First proposed for use in astronomical instrumentation by Angel et al. (1977) optical fibers have revolutionized thefield over the past 3 decades. This revolution has come about due to the flexibility optical fibers offer in re-routing thelight from thetelescope focal plane to a more convenient location. The gain for this technological advance is clear asissues of instrument weight, size, stability, and temperature control are made largely obsolete. However, this advantagecomes at a cost as fibers constitute an added element in the instrument’s optical path. Moreover, optical fibers arenot entirely stable light guides, and while their characteristics have been studied in a comprehensive and systematicway by several groups (Ramsey 1988; Schmoll et al. 2003; Crause et al. 2008; Poppett & Allington-Smith 2010b), littlework has been focused on their behavior during periods of motion and accumulated stress, with notable and valuableexceptions (Craig et al. 1988; Clayton 1989; Avila 1998; Bryant et al. 2010; Haynes et al. 2011; Bryant et al. 2011). Asboth current (Bershady et al. 2004; Kelz et al. 2004; Smith et al. 2004; Roth et al. 2005; Kelz et al. 2006b; Tuttle et al.2008; Wilson et al. 2010) and proposed instrumentation (Navarro et al. 2010; Saunders et al. 2010) is making heavyuse of optical fibers, with many instruments requiring repeated motion of the fiber optics, a clear understanding oftheir properties under these conditions is needed.Transmission and focal ratio degradation (FRD) are the two properties of optical fibers that are generally of most
interest for astronomical instrumentation. Unlike transmission values, which are now routinely supplied by the fibervendor and, over a wide wavelength range, are generally repeatable in the lab, FRD measurements are typically leftto the individual groups responsible for the instrument. This is in large part due to two related issues in quantifyingFRD. One, due to the low levels of light involved in measuring FRD, and the significant potential for systematic errorsintroduced by the experimental set-up, accurate measurements of FRD are challenging. Two, there is not one singlesource of FRD, but rather several affects of fiber polishing, mounting, and on-telescope application that drive the variouscauses of a divergent output light cone that we generally refer to under the generic term of FRD.(Haynes et al. 2011)
[email protected] Princeton University, Department of Astrophysical Sciences, 4 Ivy Lane, Peyton Hall, Princeton, NJ 08544b The University of Texas, McDonald Observatory, 2515 Speedway C1402, Austin, Texas, USA 78712-1206c The University of Texas, Department of Astronomy, 2515 Speedway C1400, Austin, Texas, USA 78712-1205d Leibniz-Institut fur Astrophysik, An der Sternwarte 16, 14482 Potsdam, Germanye The Center for Electromechanics, The University of Texas, 1 University Station PRC R7000, Austin, Texas 78712
2
However, despite these challenges, several groups have quantified FRD via a number of different techniques. (Ramsey1988; Craig et al. 1988; Schmoll et al. 1998; Avila 1998; Carrasco & Parry 1994; Schmoll et al. 2003; Crause et al.2008; Murphy et al. 2008; Haynes et al. 2008; Brunner et al. 2010; Poppett & Allington-Smith 2010a)FRD is typically defined as any increase in the output angle (i.e output f-ratio, hereafter f/out) of light when
compared to the input angle. In an ideal fiber, the input f/ratio (f/in) will be preserved through the fiber, with norays being scattered to larger output angles. In this case, f/in = f/out and the fiber does not suffer from FRD. Forthis work we broaden the definition of FRD to include the scattering of rays to lower angles as well as higher ones.Another way to express this modified definition of FRD is by saying that no FRD corresponds to no radial scatteringof the light injected into a fiber. We employ this modified definition of FRD because VIRUS uses a Schmidt cameradesign (Hill et al. 2010). With such a camera design, light thrown into the central obscuration (see Figure 2) can landon the back of the CCD, leading to both loss of overall transmission and the possibility of scattered light. Note thatwhile there are multiple sources of FRD seen in our various tests, we leave the majority of the discussion of the sourcesof FRD for §6, and focus on its quantifiable effects. Therefore we will use the generic term “FRD” throughout thiswork to mean any affect that leads to radial scattering of light within a fiber.In this work we report on tests performed on both individual fibers and fiber bundles for use in the Visible Integral-
field Replicable Unit Spectrograph (VIRUS) (Hill et al. 2010). VIRUS is a fiber-fed spectrograph currently underconstruction to carry out the Hobby Eberly Telescope Dark Energy eXperiment (HETDEX) (Hill et al. 2008). Com-posed of 75 integral field units (IFU), each ∼ 22 m long and made of 448 optical fibers, (Kelz et al. 2006a) VIRUS willemploy the use of fiber optics in astronomical instrumentation on a unprecedented scale. As the Hobby-Eberly Tele-scope (HET) tracker is in continual motion during a science observation, a clear understanding of both the behaviorof fibers while in motion, and the effect several years of motion have on the fiber properties, is essential.The outline of this paper is as follows. In §2 we provide an overview of our experimental set-ups and method of
analysis of FRD. Bend radius tests conducted on 3 different fiber types are detailed in §3. Our main results are found in§4, where we describe the lifetime fiber tests carried out on a single VIRUS fiber bundle, and the changes we observedover the course of the tests. Then, in §5, we report on a specific case for the current science IFU (often referred toas a “fiber bundle” throughout this work) in use on the Mitchell Spectrograph (formally VIRUS-P) (MacQueen et al.2008) where FRD in 18 fibers has increased over time, in some cases substantially. In certain fibers the increase inFRD is extreme, leading to a ≥ 80% drop in overall fiber transmission. In §6 we discuss the implications each of theseresults has for the VIRUS instrument and other projects which employ fibers, particularly if the fibers are mobile orexperience repeated motions or localized stress during their deployment.
2. TESTING METHODS
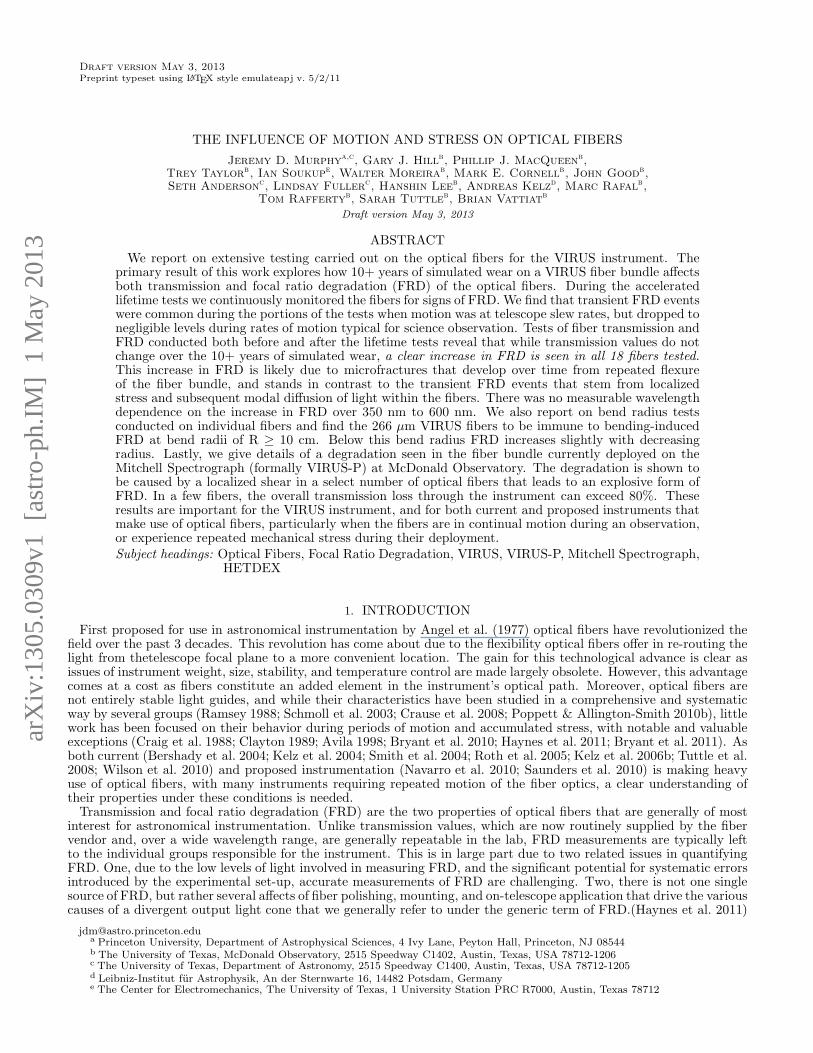
Our primary tests of transmission and FRD follow the method laid out in Murphy et al. (2008) (hereafter M08). Weprovide an overview of our test set-up and method for measuring transmission and FRD here, leaving the interestedreader to reference M08 for further details. Since the work presented in M08 was conducted, the test bench has beenautomated. During this modification process we improved the diffusion of the input light source and removed the onelens (element #5 in Figure 3 of M08) as other improvements to the test bench made this focusing lens unnecessary.The layout of the rest of the test bench remains unchanged from M08, and is shown in Figure 1. Two 45-degree pickoffmirrors (elements #6 and #9) create a shadow at ∼f/8 that mimics the secondary of a typical telescope. In Figure 2we show far-field images and cross-sectional profiles of the spot that the test bench creates at its focus (left 2 images)and the output after the light has passed the length of a fiber (right 2 images). The central obscuration created by thepickoff mirrors has proven incredibly informative in our analysis of FRD as it allows us to explore FRD effects thatradially scatter light into the central obscuration. An iris placed in the collimated light path (element #8) is used toset the f/in of the test bench. A cone-style FRD analysis and transmission measurement are conducted at 9 discretewavelengths (∼ 10 nm FWHM) between 350 nm and 600 nm. This method involves using the second mirror (element#10) to focus the collimated light from the test bench onto the end of an individual fiber. The fiber is placed at thefocus of the second mirror and therefore sees a cone of light input at f/3.65. This light is very similar to the light seenby the fibers on the telescope.The first two frames in Figure 2 show a typical far-field image and cross-sectional profile of the “input” spot (i.e.
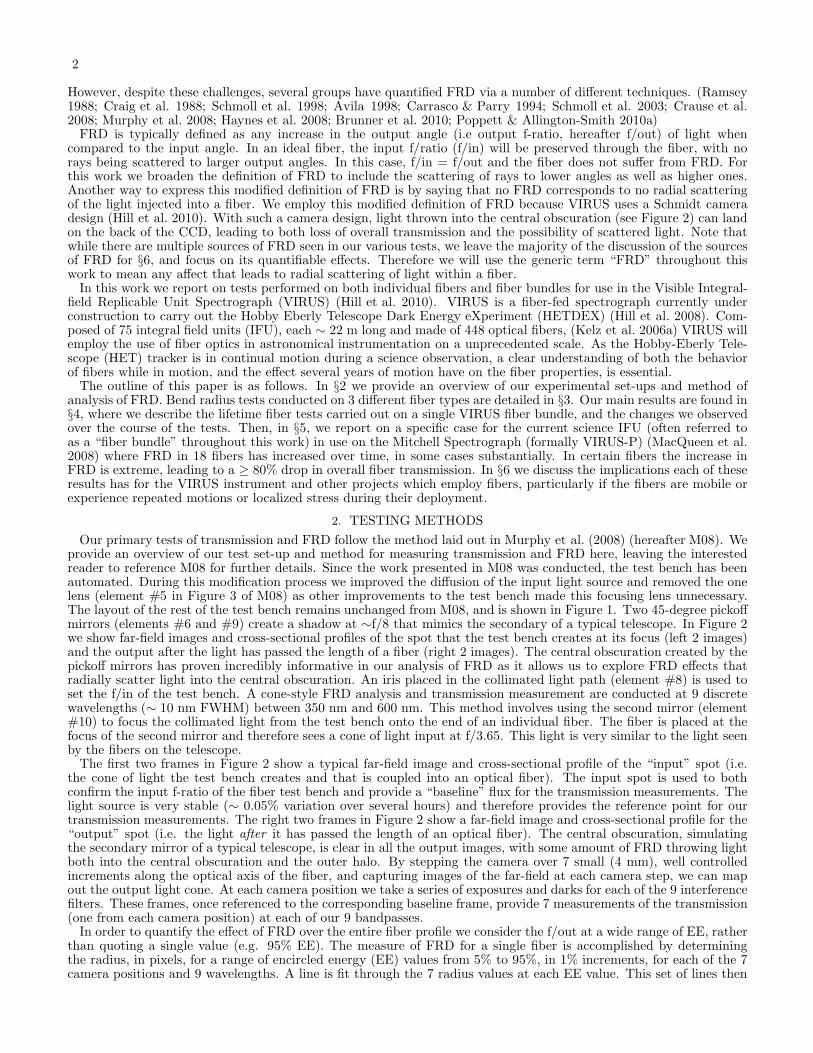
the cone of light the test bench creates and that is coupled into an optical fiber). The input spot is used to bothconfirm the input f-ratio of the fiber test bench and provide a “baseline” flux for the transmission measurements. Thelight source is very stable (∼ 0.05% variation over several hours) and therefore provides the reference point for ourtransmission measurements. The right two frames in Figure 2 show a far-field image and cross-sectional profile for the“output” spot (i.e. the light after it has passed the length of an optical fiber). The central obscuration, simulatingthe secondary mirror of a typical telescope, is clear in all the output images, with some amount of FRD throwing lightboth into the central obscuration and the outer halo. By stepping the camera over 7 small (4 mm), well controlledincrements along the optical axis of the fiber, and capturing images of the far-field at each camera step, we can mapout the output light cone. At each camera position we take a series of exposures and darks for each of the 9 interferencefilters. These frames, once referenced to the corresponding baseline frame, provide 7 measurements of the transmission(one from each camera position) at each of our 9 bandpasses.In order to quantify the effect of FRD over the entire fiber profile we consider the f/out at a wide range of EE, rather
than quoting a single value (e.g. 95% EE). The measure of FRD for a single fiber is accomplished by determiningthe radius, in pixels, for a range of encircled energy (EE) values from 5% to 95%, in 1% increments, for each of the 7camera positions and 9 wavelengths. A line is fit through the 7 radius values at each EE value. This set of lines then
VIRUS Optical Fibers 3
Fig. 1.— A schematic of the fiber optic test bench used for the transmission and FRD measurements presented here. The primary opticalelements are the same as in Murphy et al. (2008; hereafter M08)Murphy et al. (2008), with slight changes in the illumination system. Thearrows indicate the path of light through the test bench. The light source (#1) is diffused down to achieve a very even illumination onthe 700 µm pinhole (#5) which sits at the focus of the first mirror (#7). The first of two 45◦ pickoff mirrors (#6) send the light from thepinhole to the first mirror where it comes back collimated. An iris (#8) sets the input f-ratio, and a second mirror (#10) and 45◦ pickoffmirror (#9) focuses the light down onto the end of an individual fiber. The final spot size we couple into the fiber is ∼ 170 µm, whichslightly underfills the 266 µm diameter fibers and is similar to a 1.0 arcsec point source for the VIRUS instrument.
Fig. 2.— Far-field image and cross-sectional profile of the input spot (left 2 figures) coming from our fiber optic test bench. Shown in theright 2 images are similar frames, but showing a typical output spot after the light has passed through an optical fiber. The radial scatteringof light to both higher and lower output angles, which we define as FRD for this work, is clearly evident. An encircled energy (EE) analysisof the far-field image at each of 7 discrete camera positions returns an output focal ratio (f/out) measurement at 1% increments betweenan EE of 5% and 95%. These values are then used to reconstruct the output light cone and quantify the FRD of a single fiber.
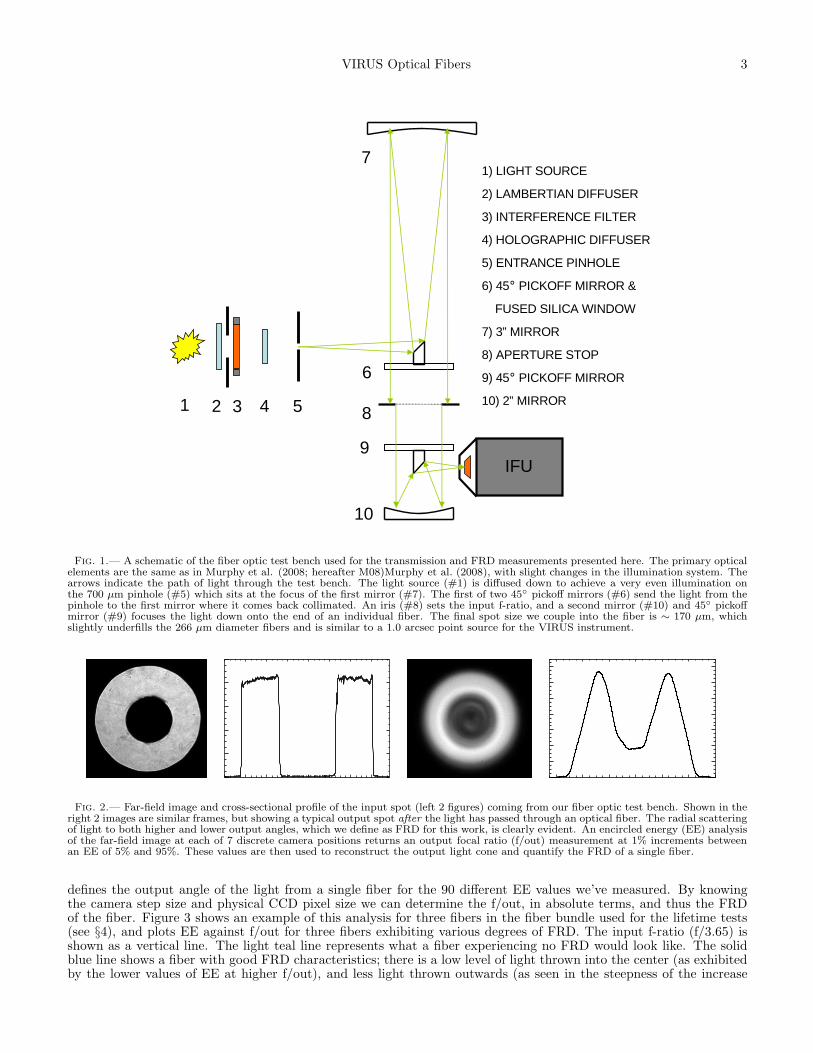
defines the output angle of the light from a single fiber for the 90 different EE values we’ve measured. By knowingthe camera step size and physical CCD pixel size we can determine the f/out, in absolute terms, and thus the FRDof the fiber. Figure 3 shows an example of this analysis for three fibers in the fiber bundle used for the lifetime tests(see §4), and plots EE against f/out for three fibers exhibiting various degrees of FRD. The input f-ratio (f/3.65) isshown as a vertical line. The light teal line represents what a fiber experiencing no FRD would look like. The solidblue line shows a fiber with good FRD characteristics; there is a low level of light thrown into the center (as exhibitedby the lower values of EE at higher f/out), and less light thrown outwards (as seen in the steepness of the increase
4
Fig. 3.— Encircled Energy (EE) as a function of f/out for three fibers from the lifetime test fiber bundle showing a range of FRD. Byplotting a wide range of EE vs f/out (rather than quoting the f/out value at a single EE value) we are able to map out the effects of FRDover the entire output spot. The vertical green line marks our f/in value of f/3.65 while a second red line denotes the f/3.47 (95% EE)tolerance for the VIRUS spectrograph. The light teal line plots the theoretical EE vs. f/out in the case of no FRD; EE remains flat at 0%until the inner edge of the central obscuration is hit, then climbs as R2, in accord with the increase in area of the integrated circle thatdefines our EE, then flattens out again once at 100% when the outer edge of the spot is reached. The solid blue line plots data from a fiberexhibiting typical levels of FRD. The short-dashed green line shows more FRD, yet with the predominant increase coming as faster rays(i.e. light scattered outward). For the fiber plotted as a long-dash red line we see FRD scattering light into both faster and slower rays(i.e. outward and into the central obscuration). A critical point to note is the way in which the fiber exhibiting the worst FRD crossesover the other fibers. This cross-over is characteristic of an increase in FRD, as light is thrown into both the central obscuration and outerhalo. Two of the three fibers plotted do not meet the specification of 95% EE within f/3.47. However, the lifetime test fiber bundle wasnot polished to specification and neither input or output cover-plate and index-matching gel was installed for these tests.
in EE at lower f/out). The short-dash green fiber shows a slight worsening of FRD, primarily in the outer halo. Thelong-dash red fiber shows significant FRD, with elevated levels of light both in the central obscuration and the outerhalo. Figure 3 reveals an interesting effect of a well-studied phenomena of optical fibers. Rays incident on a fiber athigher f/in suffer from higher FRD (e.g. Ramsey (1988); Poppett & Allington-Smith (2010b)). As the rays near thecentral obscuration are incident at higher f/in (∼ f/8) than those near the outer edge of the input spot (∼ f/3.6), theysuffer from more FRD than those near the edge of the input spot. Therefore, the severity of the FRD experiencedby a ray is a function of it’s incident angle, which changes smoothly from the center of the input spot to the outeredges. If the strength of the FRD on the central rays is not strong enough to send the light entirely outside f/3.65, youshould expect to see a piling-up effect of the light in the output spot. We see such an effect, as evidenced by the blueFRD vs. EE curve being steeper between ∼f/5 to ∼f/3.5 than the curve showing the theoretical light profile of a fiberexperiencing no FRD. You can also see this effect directly, although not in a quantified way, by visually inspecting thefar-field images of the output spots (Figure 2).
3. BEND RADIUS TESTS
In order to set a fiber bend radius limit for the VIRUS instrument we conducted a series of tests to explore theinfluence of fiber bending on FRD. Three different fiber types were tested: CeramOptec UV265/292P/320, FibertechAS266/292UVPI/318 and F & T 266/292. The three, 10 m length fibers were inserted into furcation tubing, mountedwith standard SMA905 fiber connectors, then both ends were polished by hand and tested for their bend radiuscharacteristics. First, each fiber was tested twice for FRD without any bends in the fiber, once through each end ofthe fiber. Then, the fiber was laid flat on a table, with a single loop placed into the center of the fiber. Care was takennot to add any extra twists into the fiber when making the loop. The fiber was then tested for FRD at increasingbend radii from R = 15 cm to R = 1.5 cm. The fiber was then retested in the same manner, yet coupling light intothe other end of the fiber.As the results for all three fibers are very similar, we have plotted the results from just the Fibertech fiber in Figure
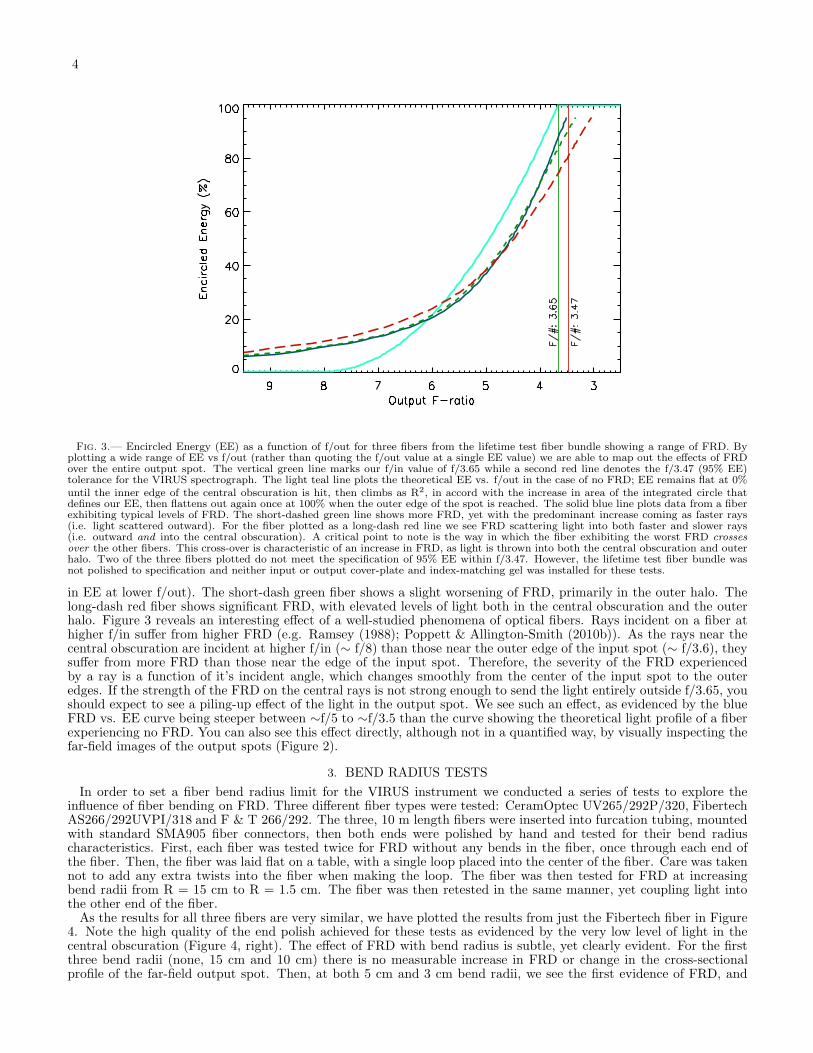
4. Note the high quality of the end polish achieved for these tests as evidenced by the very low level of light in thecentral obscuration (Figure 4, right). The effect of FRD with bend radius is subtle, yet clearly evident. For the firstthree bend radii (none, 15 cm and 10 cm) there is no measurable increase in FRD or change in the cross-sectionalprofile of the far-field output spot. Then, at both 5 cm and 3 cm bend radii, we see the first evidence of FRD, and

VIRUS Optical Fibers 5
Fig. 4.— Left: EE vs f/out for 6 bend radii tested on a single fiber (Fibertech AS266/292UVPI/318). The tests were performed on single∼ 6 m fibers, mounted in standard ferrules at both ends, and polished by hand. A single loop was placed at the midpoint of the fiber.No measurable increase in FRD occurs between the no bend, 15 cm, and 10 cm bend radii. At the bend radii of 5 cm and 3 cm a smallincrease in FRD is seen, yet only into the central obscuration. We believe this light comes from the slower (∼f/8) rays near the centralobscuration which are more prone to being scattered by stress-induced modal diffusion. At Rbend = 1.5 cm a further increase in FRD isobserved, this time with scattering observed into both the central obscuration and the outer halo. The inset in the upper-right shows aclose-up of the cross-over of the EE vs. f/out lines characteristic of FRD. Right: Cross-sectional profiles of the far-field images for all 6bend radii. Note that not only does bending-induced FRD scatter rays into the outer halo and central obscuration, but generally smoothsthe cross-sectional profile. The two insets show a closeup of the outer halo and central obscuration.
note an interesting affect; FRD is evident in the central obscuration, but not in the outer halo. This stems from thesame affect described in the previous section, with the ∼f/8 rays near the central obscuration suffering from strongerFRD. It is only when the bend radius reaches 1.5 cm that we see clear FRD into the outer halo. It is also worth notingthe mode mixing that occurs with bend radius, as seen in the smoothing of the cross-sectional profiles, plotted to theright in Figure 4.
4. LIFETIME FIBER TESTS
There are two critical aspects of the VIRUS IFU performance we want to understand and that were not explored inM08 or in other published work. First, how do optical fibers behave while in motion, and do these effects depend onthe rate of fiber motion, if at all? This understanding is necessary for VIRUS as the HET tracks its targets via motionof a suite of mirrors at prime focus (called the Prime Focus Instrument Package, or PFIP). The VIRUS fiber inputheads are connected to the PFIP and are thus subject to the motions required to both point and track the telescope.The second question we seek to address is how do the properties of a VIRUS fiber bundle change over time due to theaccumulation of wear. In order to explore these questions we simulated 10.2 years of wear (188.7 km of linear travel)on a single VIRUS fiber bundle. The simulated motion was carried out between February and May, 2011 on a test rigdesigned and built for this purpose. The complete details of the test apparatus are given in Soukup et al. (2010). InFigure 5 we show pictures of the final test configuration (left two images) and a single frame (right) from a cameraplaced to monitor the motion of the optical fibers relative to their protective conduit.To briefly summarize the test apparatus, the test platform is moved by 6 actuators, allowing linear motion in X,
Y and rotation (rho). The range of travel is designed to simulate the motion the fibers will experience from thePFIP. A lower stage provides motion at the bottom half of the fiber bundle to simulate the motion coming from thetelescope tracking (see Figures 6 and 8 in Soukup et al. (2010)). Three distinct “tracks” were run, simulating a rangeof observation tracks that HETDEX will take on the sky. A wide range of track rates were explored, yet all fall intoone of three categories: “quiescent”, “observation”, and “slew”. For the quiescent stage, all motion is stopped andaffords a reference for the tests. In the observation mode, the fibers are moved at typical telescope tracking rates(0.77 to 1.3 mm/sec) in order to explore the affect of fiber motion on our science frames. Lastly, slew mode covers thefastest rates of motion on the HET, similar to typical telescope slew rates. A wider range in the rate of motion wasexplored in this mode (24.3 to 140 mm/sec), yet as the results were quantitatively similar, they have been includedin the same designation. In order to reach the goal of 10 years of simulated life within ∼ 4 months, the majority ofthe lifetime tests were run in the slew mode. As the current VIRUS calibration plan makes use of the ∼ 90 secondrewind of the telescope for capturing arc and flat field frames, a clear understanding of the fiber behavior during theslew mode is also critical to the HETDEX project.
4.1. METHODS
For the lifetime tests we wanted to capture potential changes in the fiber behavior taking place on short timescales (5to 30 seconds) and do so over a large number of fibers simultaneously. Yet the tests described in M08 and outlined in§3 are carried out on individual fibers, with a complete set of transmission and FRD tests taking ∼ 1 hour. To achievethe goal of sampling both a large number of fibers and doing it at a rapid cadence we took an heuristic approach to
6
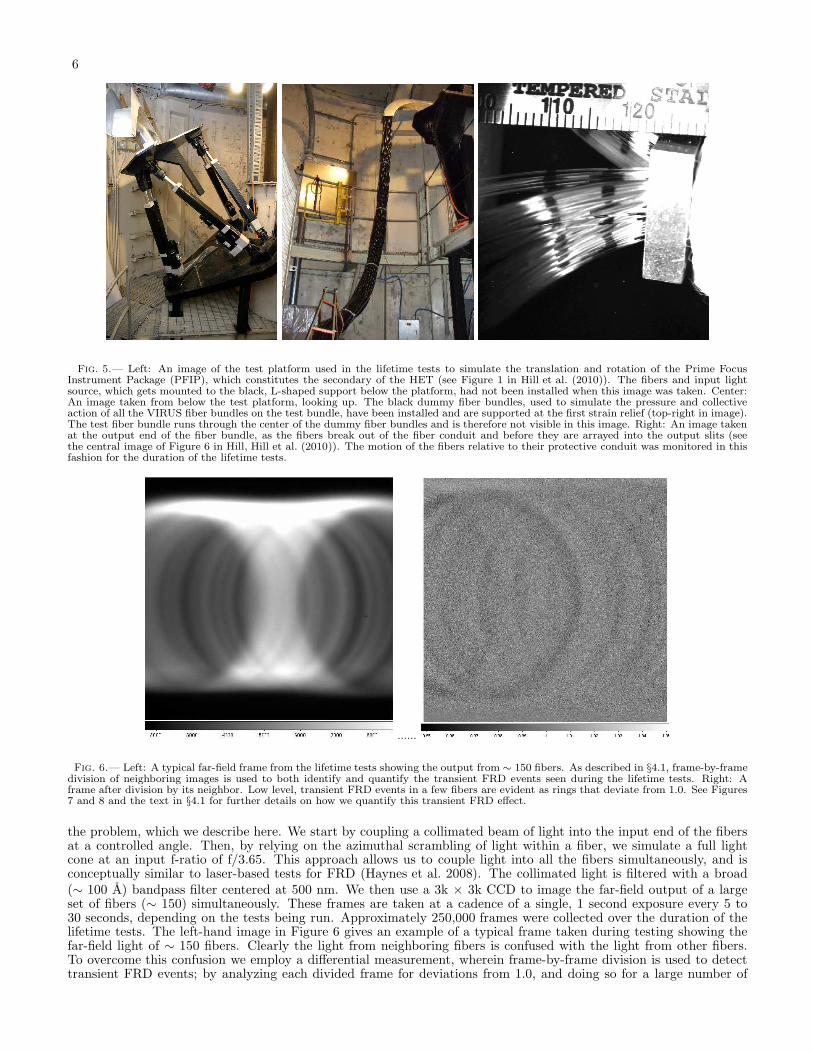
Fig. 5.— Left: An image of the test platform used in the lifetime tests to simulate the translation and rotation of the Prime FocusInstrument Package (PFIP), which constitutes the secondary of the HET (see Figure 1 in Hill et al. (2010)). The fibers and input lightsource, which gets mounted to the black, L-shaped support below the platform, had not been installed when this image was taken. Center:An image taken from below the test platform, looking up. The black dummy fiber bundles, used to simulate the pressure and collectiveaction of all the VIRUS fiber bundles on the test bundle, have been installed and are supported at the first strain relief (top-right in image).The test fiber bundle runs through the center of the dummy fiber bundles and is therefore not visible in this image. Right: An image takenat the output end of the fiber bundle, as the fibers break out of the fiber conduit and before they are arrayed into the output slits (seethe central image of Figure 6 in Hill, Hill et al. (2010)). The motion of the fibers relative to their protective conduit was monitored in thisfashion for the duration of the lifetime tests.
......
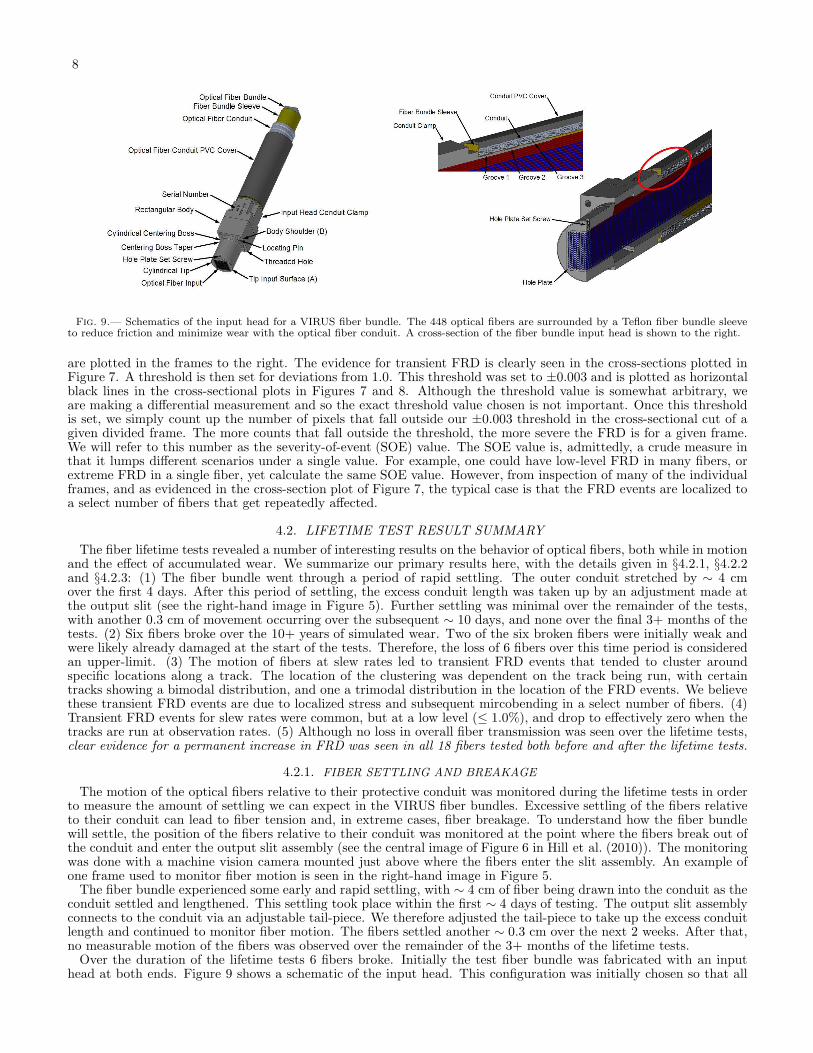
Fig. 6.— Left: A typical far-field frame from the lifetime tests showing the output from ∼ 150 fibers. As described in §4.1, frame-by-framedivision of neighboring images is used to both identify and quantify the transient FRD events seen during the lifetime tests. Right: Aframe after division by its neighbor. Low level, transient FRD events in a few fibers are evident as rings that deviate from 1.0. See Figures7 and 8 and the text in §4.1 for further details on how we quantify this transient FRD effect.
the problem, which we describe here. We start by coupling a collimated beam of light into the input end of the fibersat a controlled angle. Then, by relying on the azimuthal scrambling of light within a fiber, we simulate a full lightcone at an input f-ratio of f/3.65. This approach allows us to couple light into all the fibers simultaneously, and isconceptually similar to laser-based tests for FRD (Haynes et al. 2008). The collimated light is filtered with a broad(∼ 100 A) bandpass filter centered at 500 nm. We then use a 3k × 3k CCD to image the far-field output of a largeset of fibers (∼ 150) simultaneously. These frames are taken at a cadence of a single, 1 second exposure every 5 to30 seconds, depending on the tests being run. Approximately 250,000 frames were collected over the duration of thelifetime tests. The left-hand image in Figure 6 gives an example of a typical frame taken during testing showing thefar-field light of ∼ 150 fibers. Clearly the light from neighboring fibers is confused with the light from other fibers.To overcome this confusion we employ a differential measurement, wherein frame-by-frame division is used to detecttransient FRD events; by analyzing each divided frame for deviations from 1.0, and doing so for a large number of

VIRUS Optical Fibers 7
Fig. 7.— Left: A divided frame from a slew rate of travel and showing evidence for weak, transient FRD events in several fibers. Eachfaint circle, visible only in the divided frame, indicates a single fiber that is experiencing some level of transient FRD, likely due to atemporary localized shear. The horizontal rectangles indicate the regions of the frame that are median-combined along the Y-direction,then plotted to quantify the severity of FRD. Right: A plot of the median-combined frame cross-sections for 400 divided frames. The tworegions are both centered around 1.00 but have been offset by ±0.01 in the figure for visual clarity. The horizontal black lines indicate the±0.003 thresholds used to quantify the severity-of-event (SOE) parameter as described in the text.
Fig. 8.— Left: A divided frame, same as in Figure 7 but for a quiescent period of the testing. Right: The cross-sections of 400 dividedframes. None of these 400 frames show any evidence for transient FRD. During observation rates, the level of FRD events were extremelylow and very similar to the frames shown here. See Figures 19 and 20 in the Appendix for the SOE results of a track run at observationrates.
frames over a long baseline, we are able to determine both the severity of the FRD events and how the events arecorrelated to the motion of the test platform. An example of a single divided frame is shown to the right in Figure 6.For each frame, information on the platform position (X, Y and rho), the lower stage position, and both temperatureand humidity at two locations, near the input and output ends of the fiber bundle, were recorded. No measurableaffect from humidity was seen, so we do not discuss it further. Plots of the various parameters against one another(see §4.2.2) allows us to explore correlations and better understand the causes of the transient FRD events.In order to quantify the transient FRD events seen in the lifetime tests, two regions from each set of divided frames
are selected for analysis. These two regions are then median combined along the Y-direction and plotted as a cross-section through the frame division. Figures 7 and 8 show examples of this process for a slew and quiescent period ofthe testing, respectively. The left-hand frame in Figures 7 and 8 show a single divided frame, with the regions selectedfor analysis shown as green rectangles in Figure 7; the cross-sections of those regions are plotted to the right. Thedivided cross-section values are centered around 1.0 yet have been offset in the plot by ±0.01 for visual clarity. Notethat although we have shown a single, divided frame to the left in these figures, the cross-sections of 400 divided frames
8
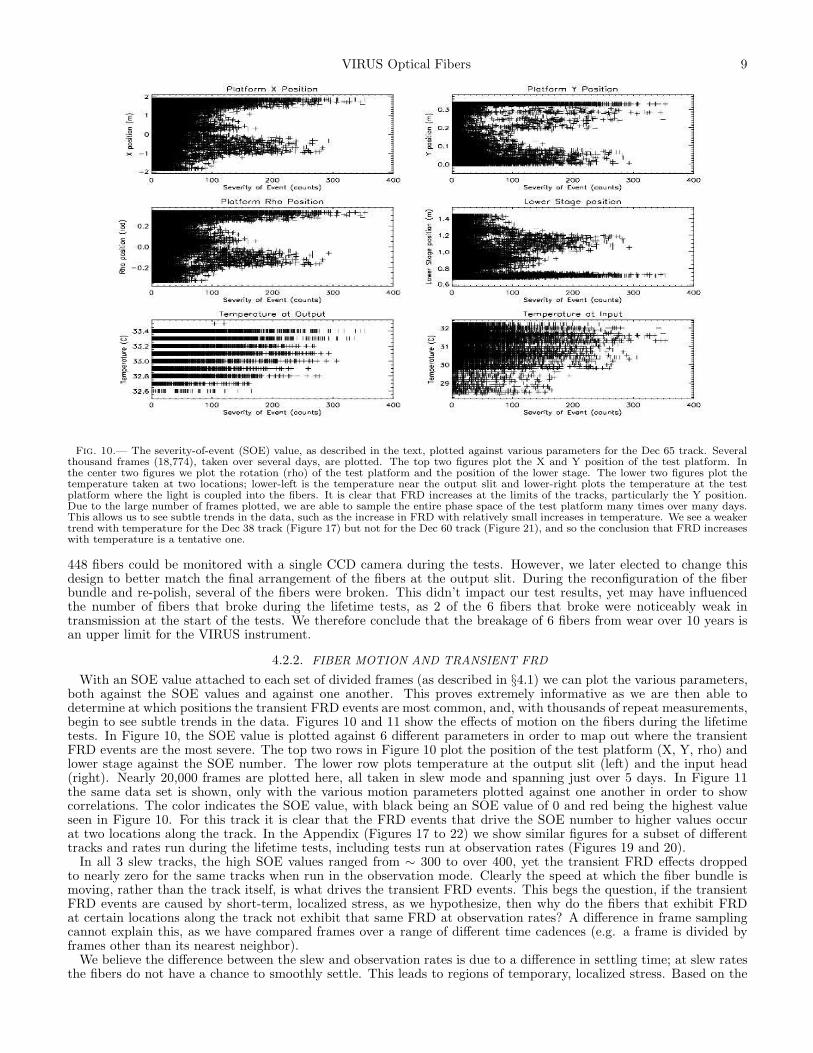
Fig. 9.— Schematics of the input head for a VIRUS fiber bundle. The 448 optical fibers are surrounded by a Teflon fiber bundle sleeveto reduce friction and minimize wear with the optical fiber conduit. A cross-section of the fiber bundle input head is shown to the right.
are plotted in the frames to the right. The evidence for transient FRD is clearly seen in the cross-sections plotted inFigure 7. A threshold is then set for deviations from 1.0. This threshold was set to ±0.003 and is plotted as horizontalblack lines in the cross-sectional plots in Figures 7 and 8. Although the threshold value is somewhat arbitrary, weare making a differential measurement and so the exact threshold value chosen is not important. Once this thresholdis set, we simply count up the number of pixels that fall outside our ±0.003 threshold in the cross-sectional cut of agiven divided frame. The more counts that fall outside the threshold, the more severe the FRD is for a given frame.We will refer to this number as the severity-of-event (SOE) value. The SOE value is, admittedly, a crude measure inthat it lumps different scenarios under a single value. For example, one could have low-level FRD in many fibers, orextreme FRD in a single fiber, yet calculate the same SOE value. However, from inspection of many of the individualframes, and as evidenced in the cross-section plot of Figure 7, the typical case is that the FRD events are localized toa select number of fibers that get repeatedly affected.
4.2. LIFETIME TEST RESULT SUMMARY
The fiber lifetime tests revealed a number of interesting results on the behavior of optical fibers, both while in motionand the effect of accumulated wear. We summarize our primary results here, with the details given in §4.2.1, §4.2.2and §4.2.3: (1) The fiber bundle went through a period of rapid settling. The outer conduit stretched by ∼ 4 cmover the first 4 days. After this period of settling, the excess conduit length was taken up by an adjustment made atthe output slit (see the right-hand image in Figure 5). Further settling was minimal over the remainder of the tests,with another 0.3 cm of movement occurring over the subsequent ∼ 10 days, and none over the final 3+ months of thetests. (2) Six fibers broke over the 10+ years of simulated wear. Two of the six broken fibers were initially weak andwere likely already damaged at the start of the tests. Therefore, the loss of 6 fibers over this time period is consideredan upper-limit. (3) The motion of fibers at slew rates led to transient FRD events that tended to cluster aroundspecific locations along a track. The location of the clustering was dependent on the track being run, with certaintracks showing a bimodal distribution, and one a trimodal distribution in the location of the FRD events. We believethese transient FRD events are due to localized stress and subsequent mircobending in a select number of fibers. (4)Transient FRD events for slew rates were common, but at a low level (≤ 1.0%), and drop to effectively zero when thetracks are run at observation rates. (5) Although no loss in overall fiber transmission was seen over the lifetime tests,clear evidence for a permanent increase in FRD was seen in all 18 fibers tested both before and after the lifetime tests.
4.2.1. FIBER SETTLING AND BREAKAGE
The motion of the optical fibers relative to their protective conduit was monitored during the lifetime tests in orderto measure the amount of settling we can expect in the VIRUS fiber bundles. Excessive settling of the fibers relativeto their conduit can lead to fiber tension and, in extreme cases, fiber breakage. To understand how the fiber bundlewill settle, the position of the fibers relative to their conduit was monitored at the point where the fibers break out ofthe conduit and enter the output slit assembly (see the central image of Figure 6 in Hill et al. (2010)). The monitoringwas done with a machine vision camera mounted just above where the fibers enter the slit assembly. An example ofone frame used to monitor fiber motion is seen in the right-hand image in Figure 5.The fiber bundle experienced some early and rapid settling, with ∼ 4 cm of fiber being drawn into the conduit as the
conduit settled and lengthened. This settling took place within the first ∼ 4 days of testing. The output slit assemblyconnects to the conduit via an adjustable tail-piece. We therefore adjusted the tail-piece to take up the excess conduitlength and continued to monitor fiber motion. The fibers settled another ∼ 0.3 cm over the next 2 weeks. After that,no measurable motion of the fibers was observed over the remainder of the 3+ months of the lifetime tests.Over the duration of the lifetime tests 6 fibers broke. Initially the test fiber bundle was fabricated with an input
head at both ends. Figure 9 shows a schematic of the input head. This configuration was initially chosen so that all
VIRUS Optical Fibers 9
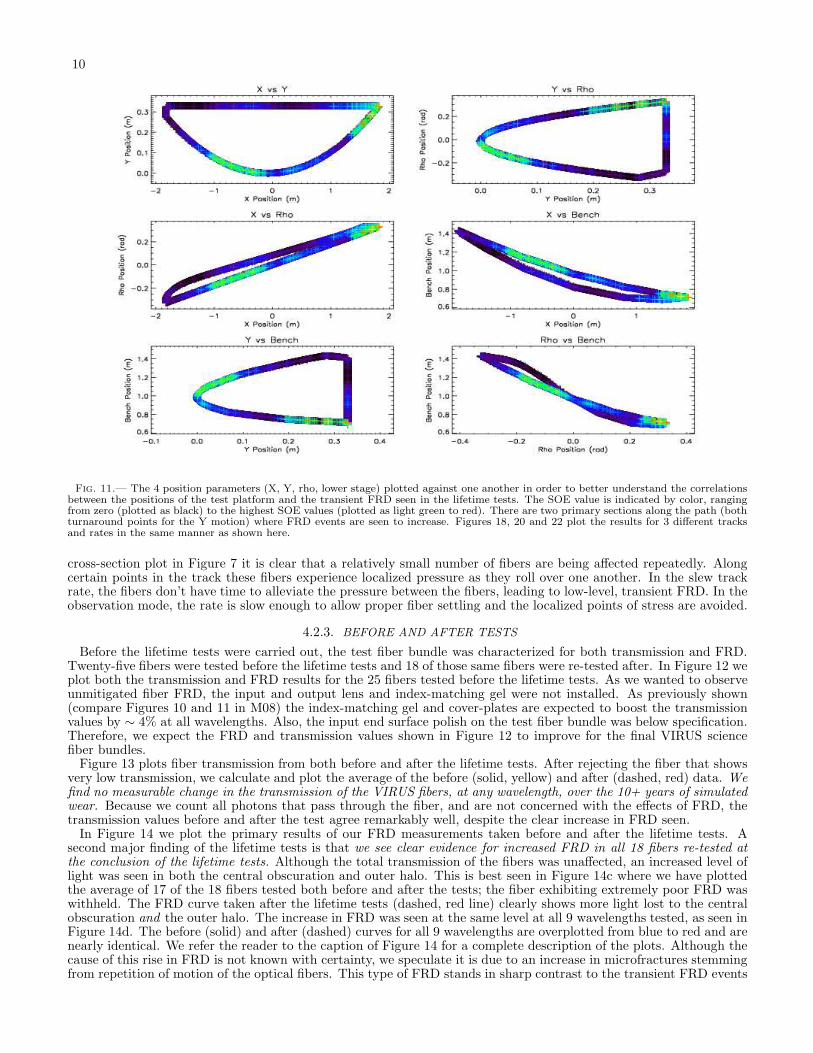
Fig. 10.— The severity-of-event (SOE) value, as described in the text, plotted against various parameters for the Dec 65 track. Severalthousand frames (18,774), taken over several days, are plotted. The top two figures plot the X and Y position of the test platform. Inthe center two figures we plot the rotation (rho) of the test platform and the position of the lower stage. The lower two figures plot thetemperature taken at two locations; lower-left is the temperature near the output slit and lower-right plots the temperature at the testplatform where the light is coupled into the fibers. It is clear that FRD increases at the limits of the tracks, particularly the Y position.Due to the large number of frames plotted, we are able to sample the entire phase space of the test platform many times over many days.This allows us to see subtle trends in the data, such as the increase in FRD with relatively small increases in temperature. We see a weakertrend with temperature for the Dec 38 track (Figure 17) but not for the Dec 60 track (Figure 21), and so the conclusion that FRD increaseswith temperature is a tentative one.
448 fibers could be monitored with a single CCD camera during the tests. However, we later elected to change thisdesign to better match the final arrangement of the fibers at the output slit. During the reconfiguration of the fiberbundle and re-polish, several of the fibers were broken. This didn’t impact our test results, yet may have influencedthe number of fibers that broke during the lifetime tests, as 2 of the 6 fibers that broke were noticeably weak intransmission at the start of the tests. We therefore conclude that the breakage of 6 fibers from wear over 10 years isan upper limit for the VIRUS instrument.
4.2.2. FIBER MOTION AND TRANSIENT FRD
With an SOE value attached to each set of divided frames (as described in §4.1) we can plot the various parameters,both against the SOE values and against one another. This proves extremely informative as we are then able todetermine at which positions the transient FRD events are most common, and, with thousands of repeat measurements,begin to see subtle trends in the data. Figures 10 and 11 show the effects of motion on the fibers during the lifetimetests. In Figure 10, the SOE value is plotted against 6 different parameters in order to map out where the transientFRD events are the most severe. The top two rows in Figure 10 plot the position of the test platform (X, Y, rho) andlower stage against the SOE number. The lower row plots temperature at the output slit (left) and the input head(right). Nearly 20,000 frames are plotted here, all taken in slew mode and spanning just over 5 days. In Figure 11the same data set is shown, only with the various motion parameters plotted against one another in order to showcorrelations. The color indicates the SOE value, with black being an SOE value of 0 and red being the highest valueseen in Figure 10. For this track it is clear that the FRD events that drive the SOE number to higher values occurat two locations along the track. In the Appendix (Figures 17 to 22) we show similar figures for a subset of differenttracks and rates run during the lifetime tests, including tests run at observation rates (Figures 19 and 20).In all 3 slew tracks, the high SOE values ranged from ∼ 300 to over 400, yet the transient FRD effects dropped
to nearly zero for the same tracks when run in the observation mode. Clearly the speed at which the fiber bundle ismoving, rather than the track itself, is what drives the transient FRD events. This begs the question, if the transientFRD events are caused by short-term, localized stress, as we hypothesize, then why do the fibers that exhibit FRDat certain locations along the track not exhibit that same FRD at observation rates? A difference in frame samplingcannot explain this, as we have compared frames over a range of different time cadences (e.g. a frame is divided byframes other than its nearest neighbor).We believe the difference between the slew and observation rates is due to a difference in settling time; at slew rates
the fibers do not have a chance to smoothly settle. This leads to regions of temporary, localized stress. Based on the
10
Fig. 11.— The 4 position parameters (X, Y, rho, lower stage) plotted against one another in order to better understand the correlationsbetween the positions of the test platform and the transient FRD seen in the lifetime tests. The SOE value is indicated by color, rangingfrom zero (plotted as black) to the highest SOE values (plotted as light green to red). There are two primary sections along the path (bothturnaround points for the Y motion) where FRD events are seen to increase. Figures 18, 20 and 22 plot the results for 3 different tracksand rates in the same manner as shown here.
cross-section plot in Figure 7 it is clear that a relatively small number of fibers are being affected repeatedly. Alongcertain points in the track these fibers experience localized pressure as they roll over one another. In the slew trackrate, the fibers don’t have time to alleviate the pressure between the fibers, leading to low-level, transient FRD. In theobservation mode, the rate is slow enough to allow proper fiber settling and the localized points of stress are avoided.
4.2.3. BEFORE AND AFTER TESTS
Before the lifetime tests were carried out, the test fiber bundle was characterized for both transmission and FRD.Twenty-five fibers were tested before the lifetime tests and 18 of those same fibers were re-tested after. In Figure 12 weplot both the transmission and FRD results for the 25 fibers tested before the lifetime tests. As we wanted to observeunmitigated fiber FRD, the input and output lens and index-matching gel were not installed. As previously shown(compare Figures 10 and 11 in M08) the index-matching gel and cover-plates are expected to boost the transmissionvalues by ∼ 4% at all wavelengths. Also, the input end surface polish on the test fiber bundle was below specification.Therefore, we expect the FRD and transmission values shown in Figure 12 to improve for the final VIRUS sciencefiber bundles.Figure 13 plots fiber transmission from both before and after the lifetime tests. After rejecting the fiber that shows
very low transmission, we calculate and plot the average of the before (solid, yellow) and after (dashed, red) data. Wefind no measurable change in the transmission of the VIRUS fibers, at any wavelength, over the 10+ years of simulatedwear. Because we count all photons that pass through the fiber, and are not concerned with the effects of FRD, thetransmission values before and after the test agree remarkably well, despite the clear increase in FRD seen.In Figure 14 we plot the primary results of our FRD measurements taken before and after the lifetime tests. A
second major finding of the lifetime tests is that we see clear evidence for increased FRD in all 18 fibers re-tested atthe conclusion of the lifetime tests. Although the total transmission of the fibers was unaffected, an increased level oflight was seen in both the central obscuration and outer halo. This is best seen in Figure 14c where we have plottedthe average of 17 of the 18 fibers tested both before and after the tests; the fiber exhibiting extremely poor FRD waswithheld. The FRD curve taken after the lifetime tests (dashed, red line) clearly shows more light lost to the centralobscuration and the outer halo. The increase in FRD was seen at the same level at all 9 wavelengths tested, as seen inFigure 14d. The before (solid) and after (dashed) curves for all 9 wavelengths are overplotted from blue to red and arenearly identical. We refer the reader to the caption of Figure 14 for a complete description of the plots. Although thecause of this rise in FRD is not known with certainty, we speculate it is due to an increase in microfractures stemmingfrom repetition of motion of the optical fibers. This type of FRD stands in sharp contrast to the transient FRD events
VIRUS Optical Fibers 11
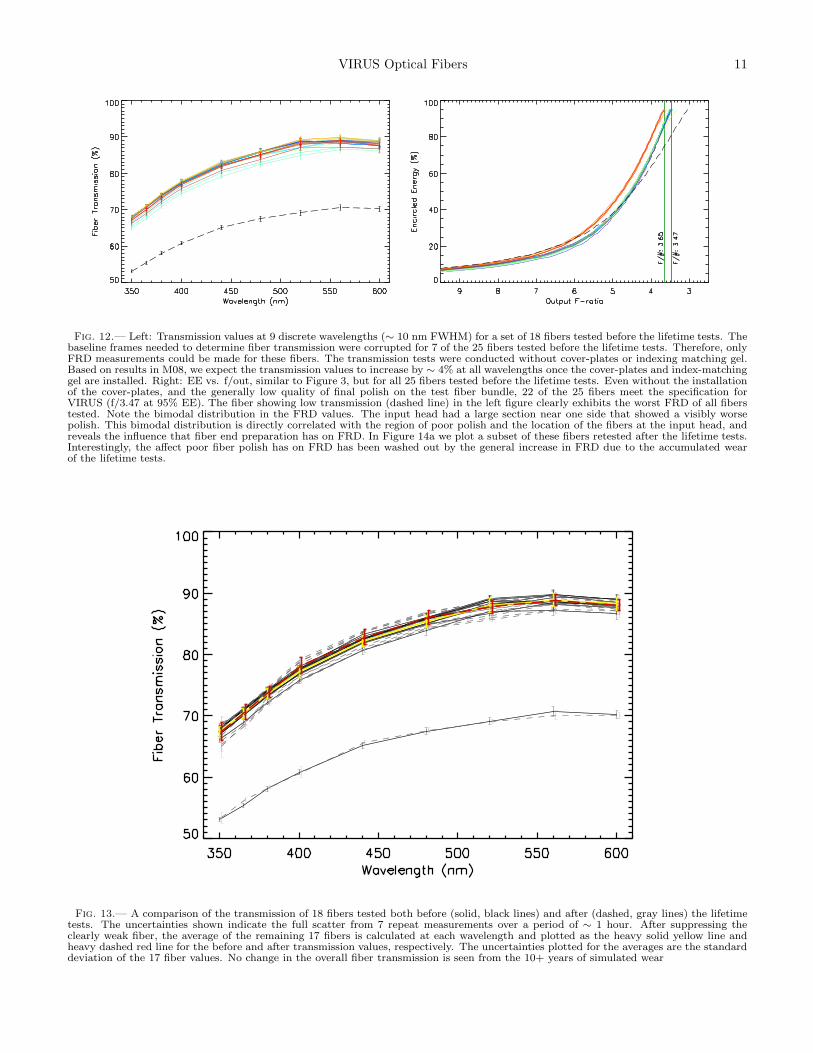
Fig. 12.— Left: Transmission values at 9 discrete wavelengths (∼ 10 nm FWHM) for a set of 18 fibers tested before the lifetime tests. Thebaseline frames needed to determine fiber transmission were corrupted for 7 of the 25 fibers tested before the lifetime tests. Therefore, onlyFRD measurements could be made for these fibers. The transmission tests were conducted without cover-plates or indexing matching gel.Based on results in M08, we expect the transmission values to increase by ∼ 4% at all wavelengths once the cover-plates and index-matchinggel are installed. Right: EE vs. f/out, similar to Figure 3, but for all 25 fibers tested before the lifetime tests. Even without the installationof the cover-plates, and the generally low quality of final polish on the test fiber bundle, 22 of the 25 fibers meet the specification forVIRUS (f/3.47 at 95% EE). The fiber showing low transmission (dashed line) in the left figure clearly exhibits the worst FRD of all fiberstested. Note the bimodal distribution in the FRD values. The input head had a large section near one side that showed a visibly worsepolish. This bimodal distribution is directly correlated with the region of poor polish and the location of the fibers at the input head, andreveals the influence that fiber end preparation has on FRD. In Figure 14a we plot a subset of these fibers retested after the lifetime tests.Interestingly, the affect poor fiber polish has on FRD has been washed out by the general increase in FRD due to the accumulated wearof the lifetime tests.
Fig. 13.— A comparison of the transmission of 18 fibers tested both before (solid, black lines) and after (dashed, gray lines) the lifetimetests. The uncertainties shown indicate the full scatter from 7 repeat measurements over a period of ∼ 1 hour. After suppressing theclearly weak fiber, the average of the remaining 17 fibers is calculated at each wavelength and plotted as the heavy solid yellow line andheavy dashed red line for the before and after transmission values, respectively. The uncertainties plotted for the averages are the standarddeviation of the 17 fiber values. No change in the overall fiber transmission is seen from the 10+ years of simulated wear
12
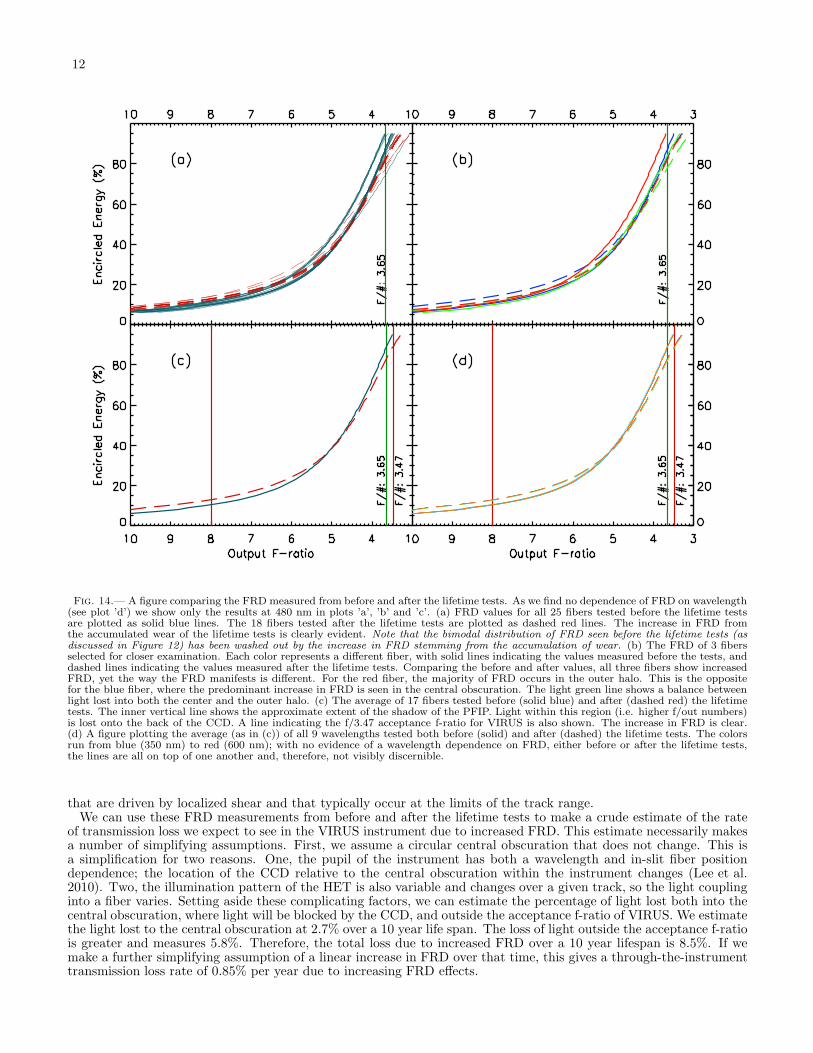
Fig. 14.— A figure comparing the FRD measured from before and after the lifetime tests. As we find no dependence of FRD on wavelength(see plot ’d’) we show only the results at 480 nm in plots ’a’, ’b’ and ’c’. (a) FRD values for all 25 fibers tested before the lifetime testsare plotted as solid blue lines. The 18 fibers tested after the lifetime tests are plotted as dashed red lines. The increase in FRD fromthe accumulated wear of the lifetime tests is clearly evident. Note that the bimodal distribution of FRD seen before the lifetime tests (asdiscussed in Figure 12) has been washed out by the increase in FRD stemming from the accumulation of wear. (b) The FRD of 3 fibersselected for closer examination. Each color represents a different fiber, with solid lines indicating the values measured before the tests, anddashed lines indicating the values measured after the lifetime tests. Comparing the before and after values, all three fibers show increasedFRD, yet the way the FRD manifests is different. For the red fiber, the majority of FRD occurs in the outer halo. This is the oppositefor the blue fiber, where the predominant increase in FRD is seen in the central obscuration. The light green line shows a balance betweenlight lost into both the center and the outer halo. (c) The average of 17 fibers tested before (solid blue) and after (dashed red) the lifetimetests. The inner vertical line shows the approximate extent of the shadow of the PFIP. Light within this region (i.e. higher f/out numbers)is lost onto the back of the CCD. A line indicating the f/3.47 acceptance f-ratio for VIRUS is also shown. The increase in FRD is clear.(d) A figure plotting the average (as in (c)) of all 9 wavelengths tested both before (solid) and after (dashed) the lifetime tests. The colorsrun from blue (350 nm) to red (600 nm); with no evidence of a wavelength dependence on FRD, either before or after the lifetime tests,the lines are all on top of one another and, therefore, not visibly discernible.
that are driven by localized shear and that typically occur at the limits of the track range.We can use these FRD measurements from before and after the lifetime tests to make a crude estimate of the rate
of transmission loss we expect to see in the VIRUS instrument due to increased FRD. This estimate necessarily makesa number of simplifying assumptions. First, we assume a circular central obscuration that does not change. This isa simplification for two reasons. One, the pupil of the instrument has both a wavelength and in-slit fiber positiondependence; the location of the CCD relative to the central obscuration within the instrument changes (Lee et al.2010). Two, the illumination pattern of the HET is also variable and changes over a given track, so the light couplinginto a fiber varies. Setting aside these complicating factors, we can estimate the percentage of light lost both into thecentral obscuration, where light will be blocked by the CCD, and outside the acceptance f-ratio of VIRUS. We estimatethe light lost to the central obscuration at 2.7% over a 10 year life span. The loss of light outside the acceptance f-ratiois greater and measures 5.8%. Therefore, the total loss due to increased FRD over a 10 year lifespan is 8.5%. If wemake a further simplifying assumption of a linear increase in FRD over that time, this gives a through-the-instrumenttransmission loss rate of 0.85% per year due to increasing FRD effects.
VIRUS Optical Fibers 13
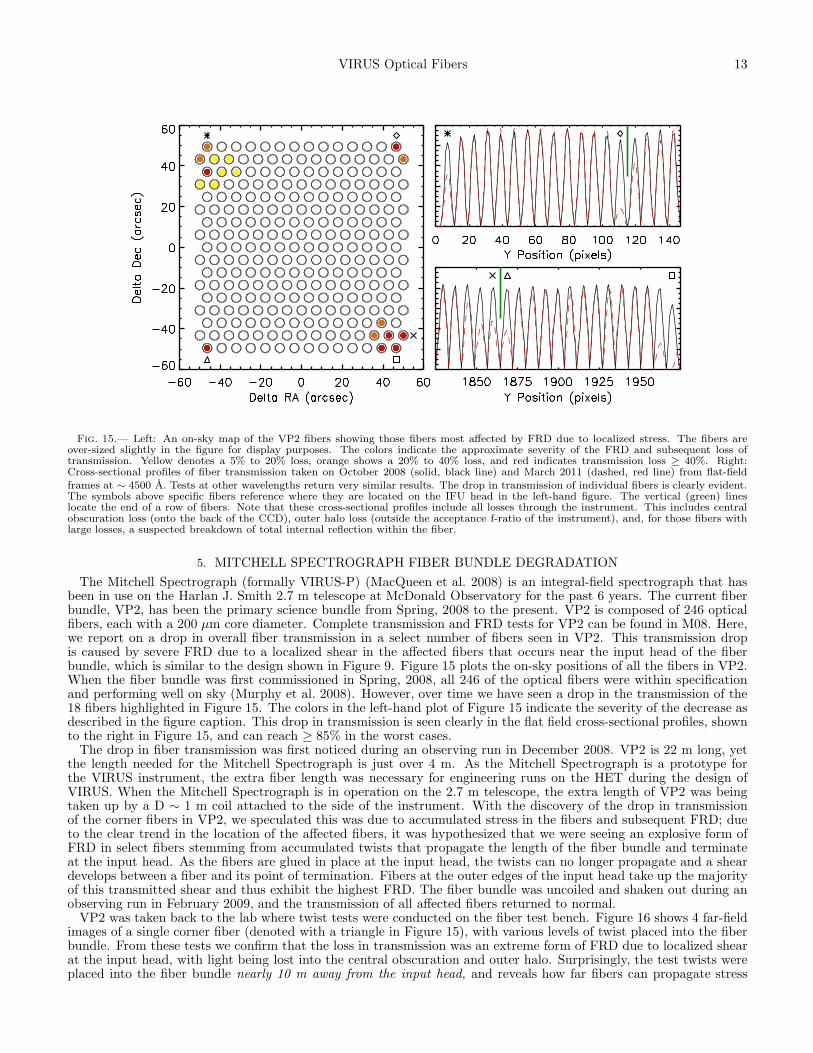
Fig. 15.— Left: An on-sky map of the VP2 fibers showing those fibers most affected by FRD due to localized stress. The fibers areover-sized slightly in the figure for display purposes. The colors indicate the approximate severity of the FRD and subsequent loss oftransmission. Yellow denotes a 5% to 20% loss, orange shows a 20% to 40% loss, and red indicates transmission loss ≥ 40%. Right:Cross-sectional profiles of fiber transmission taken on October 2008 (solid, black line) and March 2011 (dashed, red line) from flat-fieldframes at ∼ 4500 A. Tests at other wavelengths return very similar results. The drop in transmission of individual fibers is clearly evident.The symbols above specific fibers reference where they are located on the IFU head in the left-hand figure. The vertical (green) lineslocate the end of a row of fibers. Note that these cross-sectional profiles include all losses through the instrument. This includes centralobscuration loss (onto the back of the CCD), outer halo loss (outside the acceptance f-ratio of the instrument), and, for those fibers withlarge losses, a suspected breakdown of total internal reflection within the fiber.
5. MITCHELL SPECTROGRAPH FIBER BUNDLE DEGRADATION
The Mitchell Spectrograph (formally VIRUS-P) (MacQueen et al. 2008) is an integral-field spectrograph that hasbeen in use on the Harlan J. Smith 2.7 m telescope at McDonald Observatory for the past 6 years. The current fiberbundle, VP2, has been the primary science bundle from Spring, 2008 to the present. VP2 is composed of 246 opticalfibers, each with a 200 µm core diameter. Complete transmission and FRD tests for VP2 can be found in M08. Here,we report on a drop in overall fiber transmission in a select number of fibers seen in VP2. This transmission dropis caused by severe FRD due to a localized shear in the affected fibers that occurs near the input head of the fiberbundle, which is similar to the design shown in Figure 9. Figure 15 plots the on-sky positions of all the fibers in VP2.When the fiber bundle was first commissioned in Spring, 2008, all 246 of the optical fibers were within specificationand performing well on sky (Murphy et al. 2008). However, over time we have seen a drop in the transmission of the18 fibers highlighted in Figure 15. The colors in the left-hand plot of Figure 15 indicate the severity of the decrease asdescribed in the figure caption. This drop in transmission is seen clearly in the flat field cross-sectional profiles, shownto the right in Figure 15, and can reach ≥ 85% in the worst cases.The drop in fiber transmission was first noticed during an observing run in December 2008. VP2 is 22 m long, yet
the length needed for the Mitchell Spectrograph is just over 4 m. As the Mitchell Spectrograph is a prototype forthe VIRUS instrument, the extra fiber length was necessary for engineering runs on the HET during the design ofVIRUS. When the Mitchell Spectrograph is in operation on the 2.7 m telescope, the extra length of VP2 was beingtaken up by a D ∼ 1 m coil attached to the side of the instrument. With the discovery of the drop in transmissionof the corner fibers in VP2, we speculated this was due to accumulated stress in the fibers and subsequent FRD; dueto the clear trend in the location of the affected fibers, it was hypothesized that we were seeing an explosive form ofFRD in select fibers stemming from accumulated twists that propagate the length of the fiber bundle and terminateat the input head. As the fibers are glued in place at the input head, the twists can no longer propagate and a sheardevelops between a fiber and its point of termination. Fibers at the outer edges of the input head take up the majorityof this transmitted shear and thus exhibit the highest FRD. The fiber bundle was uncoiled and shaken out during anobserving run in February 2009, and the transmission of all affected fibers returned to normal.VP2 was taken back to the lab where twist tests were conducted on the fiber test bench. Figure 16 shows 4 far-field
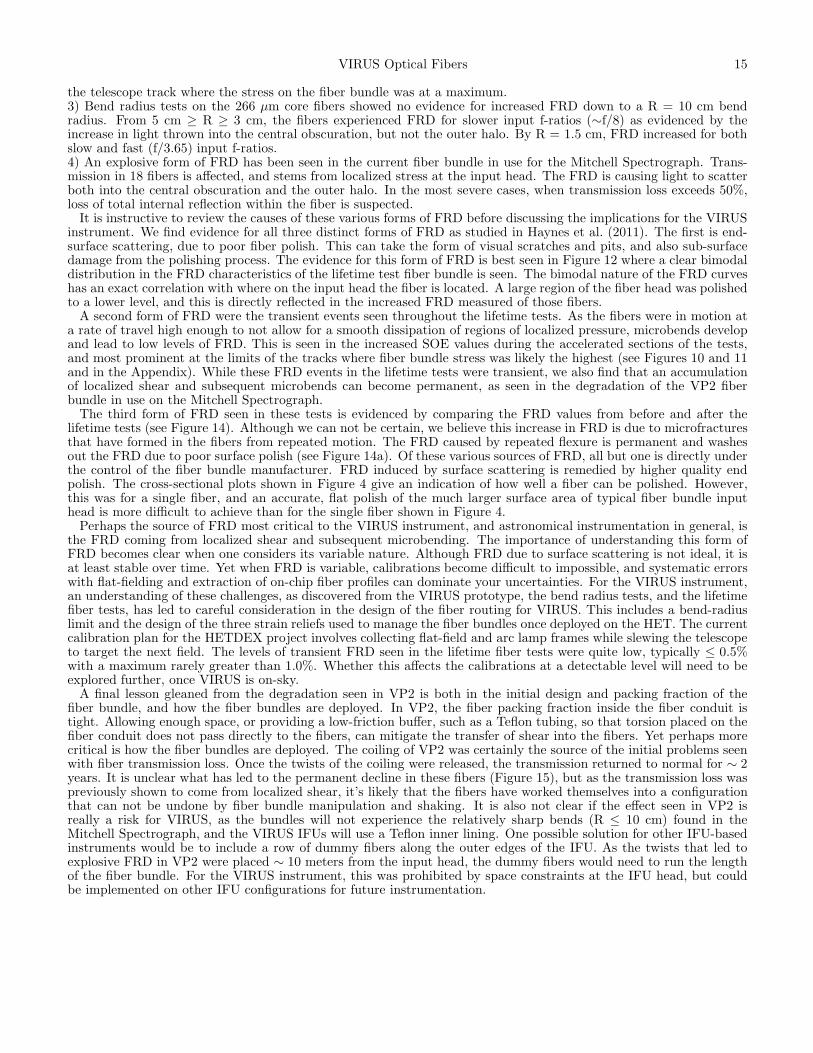
images of a single corner fiber (denoted with a triangle in Figure 15), with various levels of twist placed into the fiberbundle. From these tests we confirm that the loss in transmission was an extreme form of FRD due to localized shearat the input head, with light being lost into the central obscuration and outer halo. Surprisingly, the test twists wereplaced into the fiber bundle nearly 10 m away from the input head, and reveals how far fibers can propagate stress

14
Fig. 16.— Far-field images of a single fiber in VP2 affected by FRD stemming from localized shear at the input head of the IFU. Thefiber shown here is denoted by the triangle in Figure 15. The four frames shown come from different levels of twist placed into the fiberbundle. Even in the most extreme case (upper-left), where the central obscuration is entirely filled, the twist applied was a single “figure8” put into the bundle ∼ 10 m away from the input head. In the lower-right corner the bundle has been fully relaxed and the FRD issubstantially reduced.
before manifesting its results. It is very likely that, in the most extreme cases, where overall transmission loss exceeds40%, the localized shear is causing loss of total internal reflection and thus significant light loss into the fiber cladding.Regrettably, testing for loss of total internal reflection was not done while VP2 was in the lab, so this hypothesisremains untested. We also note that, like the FRD seen in the lifetime tests, we see no evidence for a dependence onwavelength in the loss of transmission due to localized shear. In Poppett & Allington-Smith (2007) they see a trendof increasing FRD with wavelength over the 450–700 nm range of their tests. However, this trend is clear in their dataat the slower f-ratios of their tests (e.g. f/in ≥ 10), but is not readily apparent in their results at f/in ≤ 5, which isthe range for our tests.Since the discovery of this FRD effect, the fiber bundle was re-routed on the telescope to remove any loops. This
change in routing alleviated the twisting stress and returned the overall transmission of all affected fibers back tonormal. Fiber transmission, when not being affected by this stress-induced form of FRD, has been shown to be verystable (Adams et al. 2011). However, over the course of the past year, the transmission of these affected fibers has beendeclining. Attempts at relieving the stress with manipulation and re-routing of the fiber bundle have failed, and thelow transmission of the affected fibers is now permanent. We note that the fiber routing for the Mitchell Spectrograph,even after the elimination of the fiber coil, has numerous places where the bend radius is at or tighter than the 10 cmlimit set for the VIRUS instrument. In §6 we give further discussion of the implication of this transmission loss forVIRUS and other IFU fed spectrographs.
6. DISCUSSION
We give a recap of the tests presented here, then discuss what implications this work has for both the VIRUSinstrument and other projects which employ fiber optics that experience stress or motion during science observationsor deployment. In summary:1) We find clear evidence for an increase in FRD due to the accumulation of wear from repeated motion. Surprisingly,FRD due to poor fiber surface polish is effectively washed out by this new FRD, which likely comes from microfracturesformed by repeated motion. This increase in FRD shows no dependence on wavelength. Although FRD is found toincrease with wear, no loss in overall transmission was seen in the same fibers.2) Fiber motion leads to low-level (≤ 1.0%), transient FRD events in a select number of fibers. The rate necessary tomanifest these FRD events is typical of a telescope at a slew rate of travel (e.g. 40 to 120 mm/sec). When the fiberswere moved at a rate typical of a science observation (e.g. 0.8 to 1.3 mm/sec), the transient FRD events dropped toa negligible level. These FRD events tended to cluster into bimodal or trimodal distributions along the the limits of
VIRUS Optical Fibers 15
the telescope track where the stress on the fiber bundle was at a maximum.3) Bend radius tests on the 266 µm core fibers showed no evidence for increased FRD down to a R = 10 cm bendradius. From 5 cm ≥ R ≥ 3 cm, the fibers experienced FRD for slower input f-ratios (∼f/8) as evidenced by theincrease in light thrown into the central obscuration, but not the outer halo. By R = 1.5 cm, FRD increased for bothslow and fast (f/3.65) input f-ratios.4) An explosive form of FRD has been seen in the current fiber bundle in use for the Mitchell Spectrograph. Trans-mission in 18 fibers is affected, and stems from localized stress at the input head. The FRD is causing light to scatterboth into the central obscuration and the outer halo. In the most severe cases, when transmission loss exceeds 50%,loss of total internal reflection within the fiber is suspected.It is instructive to review the causes of these various forms of FRD before discussing the implications for the VIRUS
instrument. We find evidence for all three distinct forms of FRD as studied in Haynes et al. (2011). The first is end-surface scattering, due to poor fiber polish. This can take the form of visual scratches and pits, and also sub-surfacedamage from the polishing process. The evidence for this form of FRD is best seen in Figure 12 where a clear bimodaldistribution in the FRD characteristics of the lifetime test fiber bundle is seen. The bimodal nature of the FRD curveshas an exact correlation with where on the input head the fiber is located. A large region of the fiber head was polishedto a lower level, and this is directly reflected in the increased FRD measured of those fibers.A second form of FRD were the transient events seen throughout the lifetime tests. As the fibers were in motion at
a rate of travel high enough to not allow for a smooth dissipation of regions of localized pressure, microbends developand lead to low levels of FRD. This is seen in the increased SOE values during the accelerated sections of the tests,and most prominent at the limits of the tracks where fiber bundle stress was likely the highest (see Figures 10 and 11and in the Appendix). While these FRD events in the lifetime tests were transient, we also find that an accumulationof localized shear and subsequent microbends can become permanent, as seen in the degradation of the VP2 fiberbundle in use on the Mitchell Spectrograph.The third form of FRD seen in these tests is evidenced by comparing the FRD values from before and after the
lifetime tests (see Figure 14). Although we can not be certain, we believe this increase in FRD is due to microfracturesthat have formed in the fibers from repeated motion. The FRD caused by repeated flexure is permanent and washesout the FRD due to poor surface polish (see Figure 14a). Of these various sources of FRD, all but one is directly underthe control of the fiber bundle manufacturer. FRD induced by surface scattering is remedied by higher quality endpolish. The cross-sectional plots shown in Figure 4 give an indication of how well a fiber can be polished. However,this was for a single fiber, and an accurate, flat polish of the much larger surface area of typical fiber bundle inputhead is more difficult to achieve than for the single fiber shown in Figure 4.Perhaps the source of FRD most critical to the VIRUS instrument, and astronomical instrumentation in general, is
the FRD coming from localized shear and subsequent microbending. The importance of understanding this form ofFRD becomes clear when one considers its variable nature. Although FRD due to surface scattering is not ideal, it isat least stable over time. Yet when FRD is variable, calibrations become difficult to impossible, and systematic errorswith flat-fielding and extraction of on-chip fiber profiles can dominate your uncertainties. For the VIRUS instrument,an understanding of these challenges, as discovered from the VIRUS prototype, the bend radius tests, and the lifetimefiber tests, has led to careful consideration in the design of the fiber routing for VIRUS. This includes a bend-radiuslimit and the design of the three strain reliefs used to manage the fiber bundles once deployed on the HET. The currentcalibration plan for the HETDEX project involves collecting flat-field and arc lamp frames while slewing the telescopeto target the next field. The levels of transient FRD seen in the lifetime fiber tests were quite low, typically ≤ 0.5%with a maximum rarely greater than 1.0%. Whether this affects the calibrations at a detectable level will need to beexplored further, once VIRUS is on-sky.A final lesson gleaned from the degradation seen in VP2 is both in the initial design and packing fraction of the
fiber bundle, and how the fiber bundles are deployed. In VP2, the fiber packing fraction inside the fiber conduit istight. Allowing enough space, or providing a low-friction buffer, such as a Teflon tubing, so that torsion placed on thefiber conduit does not pass directly to the fibers, can mitigate the transfer of shear into the fibers. Yet perhaps morecritical is how the fiber bundles are deployed. The coiling of VP2 was certainly the source of the initial problems seenwith fiber transmission loss. Once the twists of the coiling were released, the transmission returned to normal for ∼ 2years. It is unclear what has led to the permanent decline in these fibers (Figure 15), but as the transmission loss waspreviously shown to come from localized shear, it’s likely that the fibers have worked themselves into a configurationthat can not be undone by fiber bundle manipulation and shaking. It is also not clear if the effect seen in VP2 isreally a risk for VIRUS, as the bundles will not experience the relatively sharp bends (R ≤ 10 cm) found in theMitchell Spectrograph, and the VIRUS IFUs will use a Teflon inner lining. One possible solution for other IFU-basedinstruments would be to include a row of dummy fibers along the outer edges of the IFU. As the twists that led toexplosive FRD in VP2 were placed ∼ 10 meters from the input head, the dummy fibers would need to run the lengthof the fiber bundle. For the VIRUS instrument, this was prohibited by space constraints at the IFU head, but couldbe implemented on other IFU configurations for future instrumentation.
16
REFERENCES
Adams, J. J., Blanc, G. A., Hill, G. J., Gebhardt, K., Drory, N.,Hao, L., Bender, R., Byun, J., Ciardullo, R., Cornell, M. E.,Finkelstein, S. L., Fry, A., Gawiser, E., Gronwall, C., Hopp, U.,Jeong, D., Kelz, A., Kelzenberg, R., Komatsu, E., MacQueen,P. J., Murphy, J., Odoms, P. S., Roth, M., Schneider, D. P.,Tufts, J. R., & Wilkinson, C. P. 2011, The AstrophysicalJournal, Supplement, 192, 5
Angel, J. R. P., Adams, M. T., Boroson, T. A., & Moore, R. L.1977, The Astrophysical Journal, 218, 776
Avila, G. 1998, in Astronomical Society of the Pacific ConferenceSeries, Vol. 152, Fiber Optics in Astronomy III, ed. S. Arribas,E. Mediavilla, & F. Watson, 44–+
Bershady, M. A., Andersen, D. R., Harker, J., Ramsey, L. W., &Verheijen, M. A. W. 2004, Astronomical Soc. of the Pacific,116, 565
Brunner, S., Burton, A., Crane, J., Zhao, B., Hearty, F. R.,Wilson, J. C., Carey, L., Leger, F., Skrutskie, M., Schiavon, R.,& Majewski, S. R. 2010, in Society of Photo-OpticalInstrumentation Engineers (SPIE) Conference Series, Vol. 7735,Society of Photo-Optical Instrumentation Engineers (SPIE)Conference Series
Bryant, J. J., O’Byrne, J. W., Bland-Hawthorn, J., & Leon-Saval,S. G. 2010, in Society of Photo-Optical InstrumentationEngineers (SPIE) Conference Series, Vol. 7735, Society ofPhoto-Optical Instrumentation Engineers (SPIE) ConferenceSeries
Bryant, J. J., O’Byrne, J. W., Bland-Hawthorn, J., & Leon-Saval,S. G. 2011, Mon. Not. R. astr. Soc., 415, 2173
Carrasco, E., & Parry, I. R. 1994, Mon. Not. R. astr. Soc., 271, 1Clayton, C. A. 1989, Astronomical Soc. of the Pacific, 213, 502Craig, W. W., Hailey, C. J., & Brodie, J. P. 1988, in
Astronomical Society of the Pacific Conference Series, Vol. 3,Fiber Optics in Astronomy, ed. S. C. Barden, 41–51
Crause, L., Bershady, M., & Buckley, D. 2008, in Society ofPhoto-Optical Instrumentation Engineers (SPIE) ConferenceSeries, Vol. 7014, Society of Photo-Optical InstrumentationEngineers (SPIE) Conference Series
Haynes, D. M., Withford, M. J., Dawes, J. M., Haynes, R., &Bland-Hawthorn, J. 2008, in Society of Photo-OpticalInstrumentation Engineers (SPIE) Conference Series, Vol. 7018,Society of Photo-Optical Instrumentation Engineers (SPIE)Conference Series
Haynes, D. M., Withford, M. J., Dawes, J. M., Lawrence, J. S., &Haynes, R. 2011, Mon. Not. R. astr. Soc., 414, 253
Hill, G. J., Gebhardt, K., Komatsu, E., Drory, N., MacQueen,P. J., Adams, J. J., Blanc, G. A., Koehler, R., Rafal, M., Roth,M. M., Kelz, A., Gronwall, C., Ciardullo, R., & Schneider,D. P. 2008, in Panoramic Views of the Universe, ASPconference series
Hill, G. J., Lee, H., Vattiat, B. L., Adams, J. J., Marshall, J. L.,Drory, N., Depoy, D. L., Blanc, G., Bender, R., Booth, J. A.,Chonis, T., Cornell, M. E., Gebhardt, K., Good, J., Grupp, F.,Haynes, R., Kelz, A., MacQueen, P. J., Mollison, N., Murphy,J. D., Rafal, M. D., Rambold, W. N., Roth, M. M., Savage, R.,& Smith, M. P. 2010, in Society of Photo-OpticalInstrumentation Engineers (SPIE) Conference Series, Vol. 7735,Society of Photo-Optical Instrumentation Engineers (SPIE)Conference Series
Kelz, A., Bauer, S. M., Grupp, F., Hill, G. J., Popow, E.,Palunas, P., Roth, M. M., MacQueen, P. J., & Tripphahn, U.2006a, in Presented at the Society of Photo-OpticalInstrumentation Engineers (SPIE) Conference, Vol. 6273,Optomechanical Technologies for Astronomy. Edited byAtad-Ettedgui, Eli; Antebi, Joseph; Lemke, Dietrich.Proceedings of the SPIE, Volume 6273, pp. 62733W (2006).
Kelz, A., Verheijen, M., Roth, M. M., Laux, U., & Bauer, S.-M.2004, in Presented at the Society of Photo-OpticalInstrumentation Engineers (SPIE) Conference, Vol. 5492,Ground-based Instrumentation for Astronomy. Edited by AlanF. M. Moorwood and Iye Masanori. Proceedings of the SPIE,Volume 5492, pp. 719-730 (2004)., ed. A. F. M. Moorwood &M. Iye, 719–730
Kelz, A., Verheijen, M. A. W., Roth, M. M., Bauer, S. M., Becker,T., Paschke, J., Popow, E., Sanchez, S. F., & Laux, U. 2006b,Publications of the Astronomical Society of the Pacific, 118, 129
Lee, H., Hill, G. J., Marshall, J. L., Vattiat, B. L., & Depoy, D. L.2010, in Society of Photo-Optical Instrumentation Engineers(SPIE) Conference Series, Vol. 7735, Society of Photo-OpticalInstrumentation Engineers (SPIE) Conference Series
MacQueen, P. J., Hill, G. J., Smith, M. P., Tufts, J. R., Barnes,S. I., Roth, M. M., Kelz, A., Adams, J. J., Blanc, G., Murphy,J. D., Altmann, W., Wesley, G. L., Segura, P. R., Good, J. M.,Goertz, J. A., Edmonston, R. D., & Wilkinson, C. P. 2008, inProc. SPIE, Vol. 7014-257, Astronomical Telescopes andInstrumentation
Murphy, J. D., MacQueen, P. J., Hill, G. J., Grupp, F., Kelz, A.,Palunas, P., Roth, M., & Fry, A. 2008, in Society ofPhoto-Optical Instrumentation Engineers (SPIE) ConferenceSeries, Vol. 7018, Society of Photo-Optical InstrumentationEngineers (SPIE) Conference Series
Navarro, R., Chemla, F., Bonifacio, P., Flores, H., Guinouard, I.,Huet, J.-M., Puech, M., Royer, F., Pragt, J. H., Wulterkens,G., Sawyer, E. C., Caldwell, M. E., Tosh, I. A. J., Whalley,M. S., Woodhouse, G. F. W., Spano, P., di Marcantonio, P.,Andersen, M. I., Dalton, G. B., Kaper, L., & Hammer, F. 2010,in Society of Photo-Optical Instrumentation Engineers (SPIE)Conference Series, Vol. 7735, Society of Photo-OpticalInstrumentation Engineers (SPIE) Conference Series
Poppett, C., & Allington-Smith, J. 2010a, in Society ofPhoto-Optical Instrumentation Engineers (SPIE) ConferenceSeries, Vol. 7735, Society of Photo-Optical InstrumentationEngineers (SPIE) Conference Series
Poppett, C. L., & Allington-Smith, J. R. 2007, Mon. Not. R. astr.Soc., 379, 143
—. 2010b, Mon. Not. R. astr. Soc., 404, 1349Ramsey, L. W. 1988, in Astronomical Society of the Pacific
Conference Series, Vol. 3, Fiber Optics in Astronomy, ed. S. C.Barden, 26–39
Roth, M. M., Kelz, A., Fechner, T., Hahn, T., Bauer, S.-M.,Becker, T., Bohm, P., Christensen, L., Dionies, F., Paschke, J.,Popow, E., Wolter, D., Schmoll, J., Laux, U., & Altmann, W.2005, Publications of the Astronomical Society of the Pacific,117, 620
Saunders, W., Colless, M., Saunders, I., Hopkins, A., Goodwin,M., Heijmans, J., Brzeski, J., & Farrell, T. 2010, in Society ofPhoto-Optical Instrumentation Engineers (SPIE) ConferenceSeries, Vol. 7735, Society of Photo-Optical InstrumentationEngineers (SPIE) Conference Series
Schmoll, J., Popow, E., & Roth, M. M. 1998, in AstronomicalSociety of the Pacific Conference Series, Vol. 152, Fiber Opticsin Astronomy III, ed. S. Arribas, E. Mediavilla, & F. Watson,64–+
Schmoll, J., Roth, M. M., & Laux, U. 2003, Astronomical Soc. ofthe Pacific, 115, 854
Smith, G. A., Saunders, W., Bridges, T., Churilov, V., Lankshear,A., Dawson, J., Correll, D., Waller, L., Haynes, R., & Frost, G.2004, in Society of Photo-Optical Instrumentation Engineers(SPIE) Conference Series, Vol. 5492, Society of Photo-OpticalInstrumentation Engineers (SPIE) Conference Series, ed.A. F. M. Moorwood & M. Iye, 410–420
Soukup, I. M., Beno, J. H., Hayes, R. J., Heisler, J. T., Mock,J. R., Mollison, N. T., Good, J. M., Hill, G. J., Vattiat, B. L.,Murphy, J. D., Anderson, S. C., Bauer, S. M., Kelz, A., Roth,M. M., & Fahrenthold, E. P. 2010, in Society of Photo-OpticalInstrumentation Engineers (SPIE) Conference Series, Vol. 7735,Society of Photo-Optical Instrumentation Engineers (SPIE)Conference Series
Tuttle, S. E., Schiminovich, D., Milliard, B., Grange, R., Martin,D. C., Rahman, S., Deharveng, J.-M., McLean, R., Tajiri, G.,& Matuszewski, M. 2008, in Society of Photo-OpticalInstrumentation Engineers (SPIE) Conference Series, Vol. 7014,Society of Photo-Optical Instrumentation Engineers (SPIE)Conference Series
Wilson, J. C., Hearty, F., Skrutskie, M. F., Majewski, S.,Schiavon, R., Eisenstein, D., Gunn, J., Blank, B., Henderson,C., Smee, S., Barkhouser, R., Harding, A., Fitzgerald, G.,Stolberg, T., Arns, J., Nelson, M., Brunner, S., Burton, A.,Walker, E., Lam, C., Maseman, P., Barr, J., Leger, F., Carey,L., MacDonald, N., Horne, T., Young, E., Rieke, G., Rieke, M.,O’Brien, T., Hope, S., Krakula, J., Crane, J., Zhao, B., Carr,M., Harrison, C., Stoll, R., Vernieri, M. A., Holtzman, J.,Shetrone, M., Allende-Prieto, C., Johnson, J., Frinchaboy, P.,Zasowski, G., Bizyaev, D., Gillespie, B., & Weinberg, D. 2010,in Society of Photo-Optical Instrumentation Engineers (SPIE)Conference Series, Vol. 7735, Society of Photo-OpticalInstrumentation Engineers (SPIE) Conference Series
VIRUS Optical Fibers 17
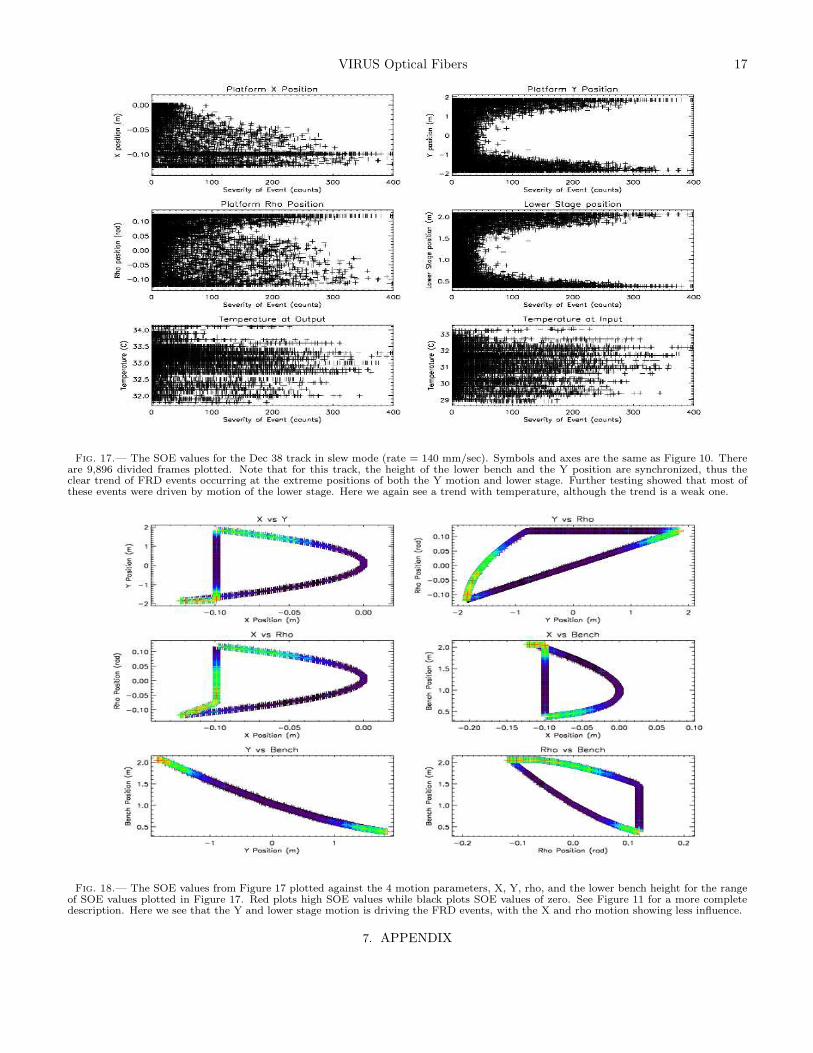
Fig. 17.— The SOE values for the Dec 38 track in slew mode (rate = 140 mm/sec). Symbols and axes are the same as Figure 10. Thereare 9,896 divided frames plotted. Note that for this track, the height of the lower bench and the Y position are synchronized, thus theclear trend of FRD events occurring at the extreme positions of both the Y motion and lower stage. Further testing showed that most ofthese events were driven by motion of the lower stage. Here we again see a trend with temperature, although the trend is a weak one.
Fig. 18.— The SOE values from Figure 17 plotted against the 4 motion parameters, X, Y, rho, and the lower bench height for the rangeof SOE values plotted in Figure 17. Red plots high SOE values while black plots SOE values of zero. See Figure 11 for a more completedescription. Here we see that the Y and lower stage motion is driving the FRD events, with the X and rho motion showing less influence.
7. APPENDIX
18
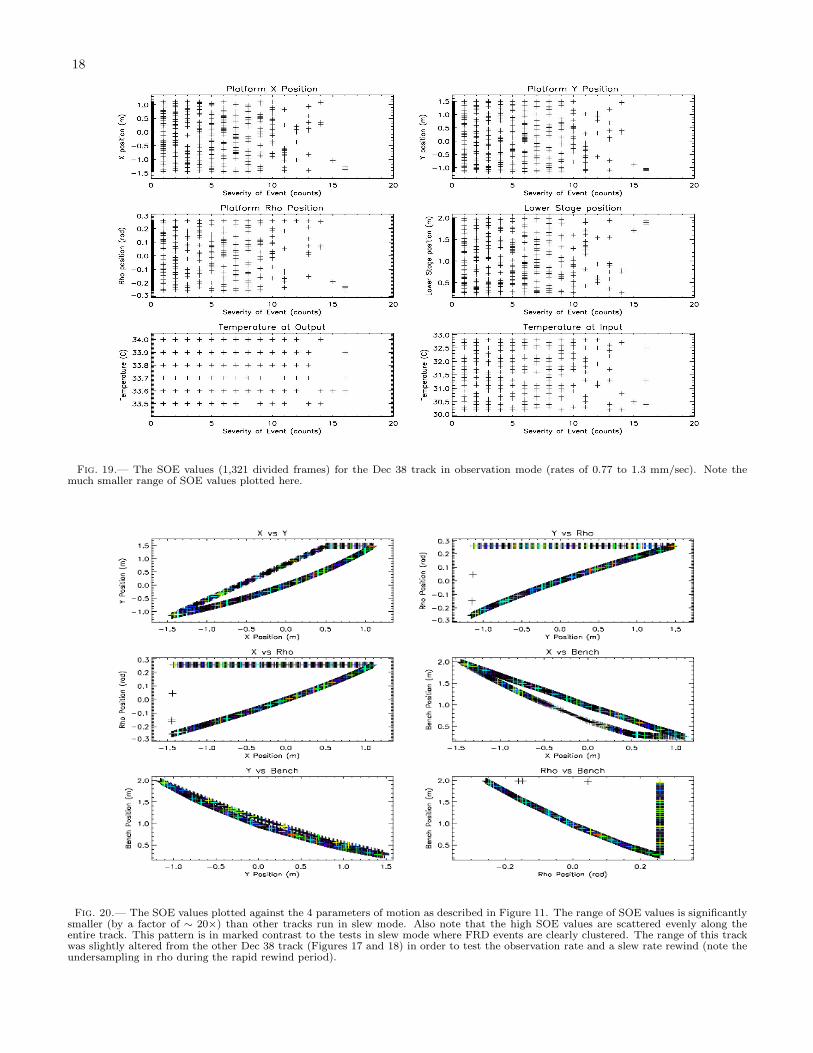
Fig. 19.— The SOE values (1,321 divided frames) for the Dec 38 track in observation mode (rates of 0.77 to 1.3 mm/sec). Note themuch smaller range of SOE values plotted here.
Fig. 20.— The SOE values plotted against the 4 parameters of motion as described in Figure 11. The range of SOE values is significantlysmaller (by a factor of ∼ 20×) than other tracks run in slew mode. Also note that the high SOE values are scattered evenly along theentire track. This pattern is in marked contrast to the tests in slew mode where FRD events are clearly clustered. The range of this trackwas slightly altered from the other Dec 38 track (Figures 17 and 18) in order to test the observation rate and a slew rate rewind (note theundersampling in rho during the rapid rewind period).
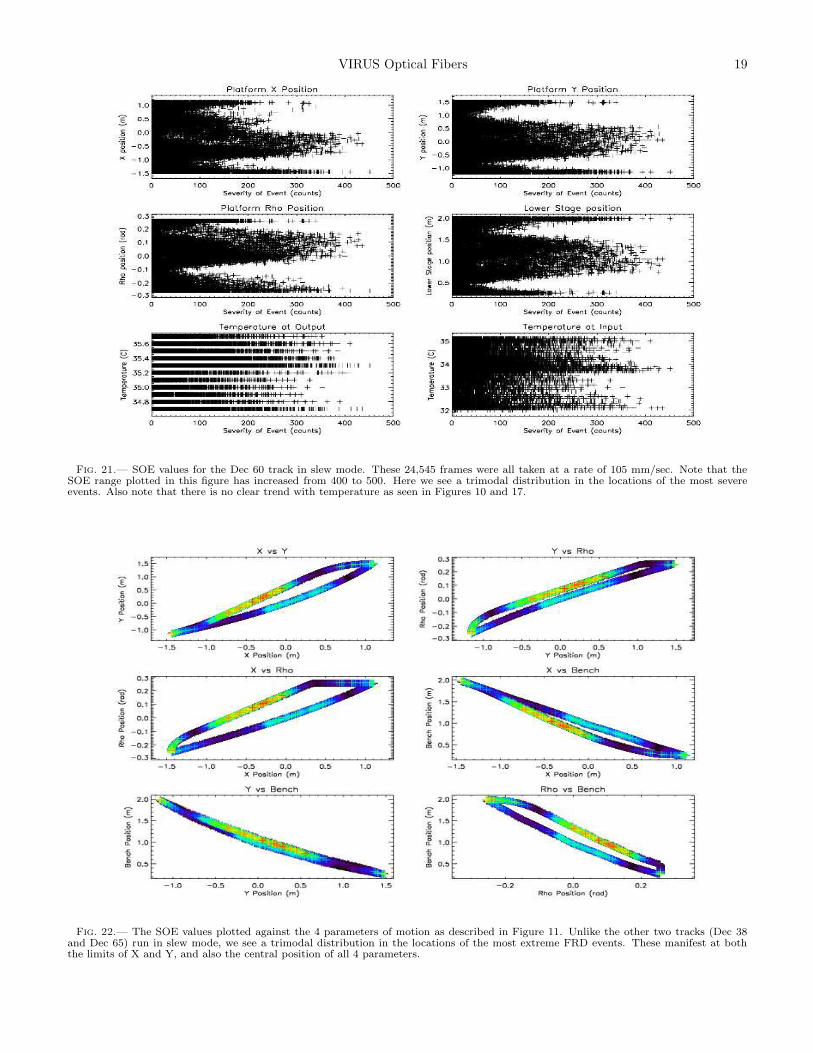
VIRUS Optical Fibers 19
Fig. 21.— SOE values for the Dec 60 track in slew mode. These 24,545 frames were all taken at a rate of 105 mm/sec. Note that theSOE range plotted in this figure has increased from 400 to 500. Here we see a trimodal distribution in the locations of the most severeevents. Also note that there is no clear trend with temperature as seen in Figures 10 and 17.
Fig. 22.— The SOE values plotted against the 4 parameters of motion as described in Figure 11. Unlike the other two tracks (Dec 38and Dec 65) run in slew mode, we see a trimodal distribution in the locations of the most extreme FRD events. These manifest at boththe limits of X and Y, and also the central position of all 4 parameters.
Related Documents


![Behavior of Random Hole Optical Fibers under Gamma Ray ...Radiation effects on doped/pure silica core optical fibers have been widely studied [5-9]. The influence of cladding co-dopants](https://static.cupdf.com/doc/110x72/5fa1a9dd2767a021433c2a80/behavior-of-random-hole-optical-fibers-under-gamma-ray-radiation-effects-on.jpg)