University of Tennessee, Knoxville University of Tennessee, Knoxville Trace: Tennessee Research and Creative Trace: Tennessee Research and Creative Exchange Exchange Masters Theses Graduate School 8-2019 THE INFLUENCE OF MINDFUL EATING AND/OR INTUITIVE THE INFLUENCE OF MINDFUL EATING AND/OR INTUITIVE EATING APPROACHES ON DIETARY INTAKE: A SYSTEMATIC EATING APPROACHES ON DIETARY INTAKE: A SYSTEMATIC REVIEW REVIEW Hannah Grider University of Tennessee, [email protected] Follow this and additional works at: https://trace.tennessee.edu/utk_gradthes Recommended Citation Recommended Citation Grider, Hannah, "THE INFLUENCE OF MINDFUL EATING AND/OR INTUITIVE EATING APPROACHES ON DIETARY INTAKE: A SYSTEMATIC REVIEW. " Master's Thesis, University of Tennessee, 2019. https://trace.tennessee.edu/utk_gradthes/5498 This Thesis is brought to you for free and open access by the Graduate School at Trace: Tennessee Research and Creative Exchange. It has been accepted for inclusion in Masters Theses by an authorized administrator of Trace: Tennessee Research and Creative Exchange. For more information, please contact [email protected]. brought to you by CORE View metadata, citation and similar papers at core.ac.uk provided by University of Tennessee, Knoxville: Trace

Welcome message from author
This document is posted to help you gain knowledge. Please leave a comment to let me know what you think about it! Share it to your friends and learn new things together.
Transcript
University of Tennessee, Knoxville University of Tennessee, Knoxville
Trace: Tennessee Research and Creative Trace: Tennessee Research and Creative
Exchange Exchange
Masters Theses Graduate School
8-2019
THE INFLUENCE OF MINDFUL EATING AND/OR INTUITIVE THE INFLUENCE OF MINDFUL EATING AND/OR INTUITIVE
EATING APPROACHES ON DIETARY INTAKE: A SYSTEMATIC EATING APPROACHES ON DIETARY INTAKE: A SYSTEMATIC
REVIEW REVIEW
Hannah Grider University of Tennessee, [email protected]
Follow this and additional works at: https://trace.tennessee.edu/utk_gradthes
Recommended Citation Recommended Citation Grider, Hannah, "THE INFLUENCE OF MINDFUL EATING AND/OR INTUITIVE EATING APPROACHES ON DIETARY INTAKE: A SYSTEMATIC REVIEW. " Master's Thesis, University of Tennessee, 2019. https://trace.tennessee.edu/utk_gradthes/5498
This Thesis is brought to you for free and open access by the Graduate School at Trace: Tennessee Research and Creative Exchange. It has been accepted for inclusion in Masters Theses by an authorized administrator of Trace: Tennessee Research and Creative Exchange. For more information, please contact [email protected].
brought to you by COREView metadata, citation and similar papers at core.ac.uk
provided by University of Tennessee, Knoxville: Trace
THE INFLUENCE OF MINDFUL EATING AND/OR INTUITIVE EATING APPROACHES ON DIETARY
INTAKE: A SYSTEMATIC REVIEW
A Thesis Presented for the Master of Science
Degree The University of Tennessee, Knoxville
Hannah Shelby Grider August 2019
ii
ABSTRACT
Research on restrained eating has led to the belief that an eating style that relies on physiological cues of hunger and fullness may enhance dietary outcomes as compared to an eating style that relies on cognitive control. Two types of interventions have been developed to assist with the development of an eating style that relies on cues of physiological need. These interventions focus on mindful eating (ME) and intuitive eating (IE). This systematic review examined how ME and IE interventions influence dietary intake, and how well the interventions influenced ME and IE by reporting outcomes when they were assessed with a validated tool.
The selection of literature followed the PRISMA systematic review process, in which PubMed, CINAHL and PsycINFO databases were searched. Studies were included if they met the following criteria: randomized trial design, in which one arm was an intervention with an ME or IE component and there was at least one other arm that was a control or active comparison; enrolled participants were of a healthy weight or with overweight or obesity and were at least 18 years of age; and outcomes of energy intake or diet quality were reported at baseline and post-intervention.
A total of 14 studies, represented by 15 articles, were included, which were comprised of 9 ME interventions and 5 IE interventions. Eight studies, representing 9 articles, reported on energy intake, with six studies reporting no significant differences between groups. Twelve studies, representing 13 articles, reported on diet quality, with 7 studies reporting no significant differences between groups. Four studies measured ME and IE with a validated tool, which revealed ME or IE interventions did not consistently increase ME or IE.
Overall, evidence suggests that ME and IE interventions do not influence dietary intake; however, future research using validated tools to measure ME and IE is needed. Without the measurement of ME or IE, it is hard to conclude whether participants adopt the ME and IE approaches, and what effect these interventions have on dietary intake. PROSPERO registration number: CRD42019128135
iii
TABLE OF CONTENTS
CHAPTER ONE: LITERATURE REVIEW ....................................................................... 1 COGNITIVE CONTROL OF EATING ............................................................................ 1 MINDFUL EATING ........................................................................................................ 3 INTUITIVE EATING ....................................................................................................... 5 MEASURING MINDFUL EATING AND INTUITIVE EATING ......................................... 6 EVALUATION OF MINDFUL EATING AND INTUITIVE EATING ................................ 10 SPECIFIC AIMS .......................................................................................................... 14
CHAPTER TWO: MANUSCRIPT .................................................................................. 16 BACKGROUND ........................................................................................................... 16 MATERIALS AND METHODS ..................................................................................... 19
Criteria of Studies (PICO) ......................................................................................... 19 Type of Studies ..................................................................................................... 19 Type of Participants .............................................................................................. 19 Type of Interventions ............................................................................................. 19 Type of Comparisons ............................................................................................ 19 Type of Outcome Measures .................................................................................. 20
Search Methods for Identification of Studies ............................................................ 20 Electronic Searches .............................................................................................. 20 Search Strategy .................................................................................................... 21 Quality Assessment .............................................................................................. 21 Selection and Review Process .............................................................................. 21
RESULTS .................................................................................................................... 22 Study Selection ........................................................................................................ 22 Study Characteristics ............................................................................................... 22 Results of Studies .................................................................................................... 25
No Intervention Comparison ................................................................................. 25 Waitlist Comparison .............................................................................................. 26 Active Intervention Comparison ............................................................................ 28 Risk of Bias ........................................................................................................... 30
DISCUSSION .............................................................................................................. 31 LIST OF REFERENCES ................................................................................................ 37 APPENDICES ................................................................................................................ 45
APPENDIX I: THE BOUNDARY MODEL ..................................................................... 46 APPENDIX II: PRISMA CHECKLIST ........................................................................... 47 APPENDIX III: SEARCH TERMS ................................................................................ 49 APPENDIX IV: SELECTION FLOW CHART ............................................................... 51 APPENDIX V: MODIFIED DOWNS AND BLACK CHECKLIST ................................... 52 APPENDIX VI: SUMMARY TABLE .............................................................................. 55 APPENDIX VII: KEY FINDINGS TABLE ...................................................................... 63
VITA ............................................................................................................................... 67
1
CHAPTER ONE: LITERATURE REVIEW COGNITIVE CONTROL OF EATING
An individual’s eating behavior is often assumed to be in response to hunger,
which represents the biological need for food in order to survive (i.e., depleted energy
stores, biological need for food, food consumed until satiated) (Wardle, 1988). However,
our social and cultural environment promotes eating in the absence of the physiological
need for food. For example, individuals can eat in response to many internal or external
cues that are not related to actual depleted energy stores, such as eating in response to
food availability, the palatability of food, negative or positive emotions, or social norms
(i.e., eating at a social event). All of these examples can result in eating when one is not
hungry, or in biological need for food. When eating is separated from biological need,
one’s ability to self-regulate food intake in response to biological need is hypothesized
to diminish (Wardle, 1988). This lack of self-regulation is thought to contribute to
overweight and obesity (Wardle, 1988), which, according to the 2015-2016 National
Center for Health Statistics (NCHS) data brief, affects almost 40% of adults in the U.S.
(“Adult Obesity Facts | Overweight & Obesity | CDC,” 2018).
When eating is for reasons other than hunger (physiological need), internal cues
indicating that physiological need for food are diminished will not be provided. Thus,
there will be no physiological cue to stop eating. Due to this lack of feedback, it is
believed when eating is occurring for reasons other than hunger, cognitive control over
eating is needed to avert excessive energy intake, and thereby prevent overweight and
obesity (Wardle, 1988). Cognitive control is the process of using cognitions to recognize
and change behavior to achieve a goal or task (Posner & Snyder, 1975). It is the
process of using cognitions to override automatic responses and inhibit inappropriate
responses to achieve a goal or task. Thus, cognitive control over eating is the process
of limiting or changing eating behavior to align with a specific eating goal (Wardle,
1988). For example, cognitive control of eating is seen when one chooses to or not to
consume food based on a desired health outcome and/or dietary goal (i.e., eat 5 to 9
servings of fruits and vegetables a day, limiting saturated fat to < 10% of energy intake).
When cognitive control is implemented to prevent excessive energy intake, goals that
limit food intake are set (Wardle, 1988).
2
While using cognitive control to guide eating may assist with changing dietary
intake, it has been proposed that cognitive control of eating may also create problematic
eating behaviors. In 1983, Herman and Polivy (1983) developed the boundary model of
eating (See Appendix I – All tables and figures are located in the appendix) (Herman &
Polivy, 1983). The boundary model explains how the physiological states of hunger and
fullness are the lower and upper boundaries that determine food intake. The lower limit
is considered the hunger boundary, in which the physiological response would be to eat.
The upper limit is considered the fullness boundary, in which the physiological response
is to stop eating. These boundaries act as guides for hunger and fullness, but an
individual can eat below or above these boundaries. Outside the hunger and fullness
boundaries are areas of aversion, in which an individual would feel uncomfortably
hungry or full. The area between the upper and lower limits is considered the zone of
biological indifference, or the feeling of being neither hungry nor satisfied. In this model,
cognitive control over eating is depicted as a specific amount of food to consume that
has been set, and this amount is less than the physiological upper limit of intake. This
means that the limit that is under cognitive control is in the zone of biological
indifference. When this cognitive controlled boundary is breached or surpassed, eating
patterns can become chaotic, as eating has not been tied to physiological cues of
hunger, and especially fullness (Herman & Polivy, 1983).
Herman and Polivy tested this theory through a preload study design involving
individuals who engaged in cognitive control over eating (restrained eaters) and
individuals who rely on physiological signs (unrestrained eaters) to guide eating
(Herman & Polivy, 1983). A preload design gives participants differing sizes of
“preloads” prior to the consumption of an ad libitum meal. With this design, it is believed
that when individuals are eating based upon physiological needs, a small preload
produces greater consumption in the meal as compared to a large preload. In Herman
and Polivy’s study, unrestrained eaters ate in this manner. However, when the
restrained eaters were given a small preload, they consumed a small amount at the ad
libitum meal. After a large preload was consumed, the restrained eaters consumed a
large amount of food at the ad libitum meal. This style of eating was thought to show
that the small preload allowed the individuals to stay within their eating boundary, while
3
the large preload pushed the individuals past the controlled boundary and as these
restrained eaters could not identify the cues of fullness, they consumed large amounts
of food in the meal. Research on “restrained eating” has led to the hypothesis that an
eating style that relies on physiological cues of hunger and fullness may be better than
an eating style that relies on cognitive control (Wardle, 1988). Two types of
interventions have been developed to assist with the development of an eating style that
relies on cues of physiological need (Kabat-Zinn, 2015; Tribole & Resch, 1995). These
interventions focus on mindful eating (ME) and intuitive eating (IE). MINDFUL EATING
The concept of mindfulness originates from the Buddhist religion (Kabat-Zinn,
2015). It can be defined as being purposefully and non-judgmentally present in the
current moment, or the act of paying attention. Mindfulness can be achieved through
different techniques, such as meditation, breathing exercises, yoga, and intentional
observation (Kabat-Zinn, 2015). These techniques can be applied to activities of daily
living, such as walking, driving, and eating. Dr. Kabat-Zinn from the University of
Massachusetts Medical School applied mindfulness techniques to patients with mental
health and chronic pain who were unable to find relief from usual treatment (Noonan,
2014). He developed mindfulness-based stress reduction (MBSR) therapy. MBSR
therapy consists of an 8-week program, which includes classes on meditation,
breathing, and yoga, along with homework exercises, gratitude journaling, and logging
positive events. These techniques have shown improvements in mental and physical
health and are still used today (Noonan, 2014). Mindfulness is also used in Acceptance
and Commitment Therapy (ACT) as a component to enhance awareness and reduce
emotional and automatic behavioral responses. ACT challenges individuals to accept
their thoughts and emotional response to situations via mindfulness, while committing to
behavior change that is in line with their values (Boucher et al., 2016). Due to the focus
being on internal responses, mindfulness therapies have been hypothesized to be
beneficial for treatment in individuals with depression and anxiety (Hofmann et al.,
2010), eating disorders (Godfrey et al., 2015), those who struggle with emotional eating,
and weight loss (Forman & Butryn, 2015).
4
Mindfulness has also been applied to eating. ME is the act of paying attention to
food during consumption. It is the act of having sensual awareness and focusing on the
experience with food (Nelson, 2017). The intent is not weight loss or to restrict intake;
however, it is believed that if one is mindful of their food experience and consumption,
the result will be eating less and selecting foods that are consistent with one’s desired
health outcome (Nelson, 2017). ME is thought to aid an individual in being aware of
their internal (i.e., thoughts/emotions) and external (i.e., environment) cues to inhibit
overeating, and thus, improve problematic eating behaviors (Framson et al., 2009).
While the goal of ME interventions is not weight loss, ME approaches have been
applied to weight loss interventions. Weight loss interventions have solely included
teaching the principles of ME to promote weight loss, or have included these principles
in conjunction with a standard behavioral weight loss program as a supplemental way to
promote weight loss (Olson & Emery, 2015).
ME interventions implement mindfulness training through different techniques
(Kristeller, 2010). ME training begins with deep breathing and meditations. The goal of
meditation is to allow the individual to focus their mind on their eating experience
without other distraction. These exercises are aimed to help individuals bring awareness
to the sensation of hunger and fullness, tastes, and emotional triggers for specific food
choices. ME training often begins with mindfully eating a food, and a common food used
in this exercise is raisins. While eating the raisin, individuals are encouraged to focus on
the flavor, texture, thoughts, and feelings, while savoring each raisin fully. The goal is to
reveal a different experience than what one has previously had while eating a raisin,
due to eating the raisin mindlessly. As the training progresses, participants are
challenged with lower nutrient, higher calorically dense food items, or foods that the
individual craves or over consumes. The participants are challenged to eat the foods
mindfully, just as they did with the raisins. Participants are asked to report their hunger
before the meal with a focus on the distinction between physical hunger rather than
emotional hunger, and pay attention to their fullness level throughout. In addition, this
strategy is used to help participants determine their taste satisfactions, understand liking
versus wanting foods (i.e., enjoying food versus craving food), and how and why they
make food choices. At the completion of the training, individuals should be able to
5
choose quality foods over quantity and be attune with their physiological hunger and
fullness cues to control overeating behaviors (Kristeller, 2010). INTUITIVE EATING
Developed by Elyse Resch and Evelyn Tribole in 1995, the IE model was aimed
to encourage individuals to reject the diet mentality (Tribole & Resch, 1995). The diet
mentality is the process of relying on non-physiological factors, such as cognitive control
to determine intake, rather than relying on the body’s natural self-regulation system. For
example, the diet mindset would be, “does this food fit my calorie goal for the day?” and
the IE mindset would be, “I can eat whatever food I desire.” IE is eating based on
physiological hunger and satiety cues rather than external cues (Tribole & Resch,
1995). External cues can include emotions, food availability, seeing or smelling food,
social settings where eating is encouraged or the norm, serving sizes, or food
packaging. Thus, IE involves training an individual to focus on responding to physical
sensations in order to determine the body’s needs. There are three central factors to IE:
1) unconditional permission to eat when hungry and whatever food is desired; 2) eating
for physical reasons, not emotional; 3) and relying on internal hunger and satiety cues
to determine when and how much one should eat (Tribole & Resch, 1995). The IE belief
is that individuals are not overweight or obese due to excessive intake or inactivity, but
due to eating for non-physiological reasons (Gast & Hawks, 1998).
Participants of IE interventions are taught the ten principles of IE: 1) reject the
diet mentality; 2) honor your hunger; 3) make peace with food; 4) challenge the food
police (i.e., categorizing good versus bad food); 5) respect your fullness; 6) discover the
satisfaction factor from food; 7) honor your feelings without using food; 8) respect your
body; 9) exercise – feel the difference (i.e., exercise for enjoyment not punishment for
overeating); 10) honor your health (Tribole & Resch, 1995). IE is implemented through
education on the ten principles along with exercises for participants to practice
implementing the principles. Exercises include committing to giving up the diet mentality
(i.e., a set of rules that dictates when and what a person should eat); being attune with
hunger cues, such as stomach growling, and responding by making time to eat; giving
oneself permission to eat whatever is desired with no restrictions; and responding to
emotions without using food, but using other strategies like bubble baths, massages, or
6
yoga classes (Tribole & Resch, 1995). Like mindfulness, the intention of IE interventions
is not weight loss, the intention is to promote attunement with the physiological
sensations of hunger and fullness to determine eating and promote “gentle” nutrition
(i.e., choosing foods that are healthy for the body), which may result in weight loss
(Tribole & Resch, 1995). MEASURING MINDFUL EATING AND INTUITIVE EATING
To ascertain implementation of ME and IE, several assessment tools have been
developed. One validated scale of ME is known as the Mindful Eating Questionnaire
(MEQ) (Framson et al., 2009). The MEQ is a 27-item scale with 5 subscales, 1)
disinhibition, 2) awareness, 3) external cues, 4) emotional response, and 5) distraction
(Framson et al., 2009). Response options for each item are, “never/rarely,”
“sometimes,” “often,” and “usually/always.” Each item is scored from 1 to 4, where
higher scores indicate more mindful eating. The disinhibition section asks questions
regarding the ability to stop eating when feeling full. Awareness refers to the ability to be
aware of your five senses and emotions throughout the eating experience. External
cues refer to the ability to recognize when eating is occurring in the absence of
biological hunger. Emotional response refers to the ability to be aware of how emotions
(i.e., stress) affect eating. Lastly, distraction refers to the ability to focus on the eating
experience without letting the mind wander throughout (Framson et al., 2009). Thus, the
MEQ was validated by 314 individuals, which included 81% females with 41% practicing
yoga more than 1 hour per week. The mean age was 42.0 (SD = 14.4) years and the
mean BMI was 24.2 (SD = 5.1 kg/m2). For internal consistency reliability, the MEQ
summary score had a Cronbach alpha of 0.64. Internal consistency reliability measures
if all questions on a scale/test consistently measures the concept it is suppose to
measure (Tavakol & Dennick, 2011). Cronbach alpha is the measurement of a scale’s
reliability. A Cronbach alpha greater than 0.70 is considered acceptable (Tavakol &
Dennick, 2011). Higher MEQ scores were also associated with greater number of years
of yoga practice and greater number of minutes of practice per week. The association
between minutes per week of yoga practice and MEQ score was independent of other
physical activity, which provides evidence of construct validity. Construct validity
determines if a scale as a whole measures the concept it sought out to measure,
7
therefore, the MEQ showed evidence of construct validity by higher scores being
associated with greater number of years of yoga practice, as previous research shows
association between practicing yoga and mindfulness abilities (Kristal et al, 2005).
Lastly, cognitive control was inversely correlated with the other subscales, which
provides evidence that cognitive control is independent from the elements of ME
(Framson et al., 2009). The MEQ showed low internal consistency reliability, and
through the associations of yoga practice and independence from cognitive control, the
MEQ showed good construct validity.
Another measure of ME is the Mindful Eating Scale (MES) (Hulbert-Williams et
al., 2014). The MES was developed to further expand the MEQ by adding a subscale to
measure “acceptance” or “non-judgment” ability an individual has during an eating
experience. The MES was aimed to be more in line with the standard definitions of
mindfulness that Dr. Kabat-Zinn originally published. The items focus more on eating-
related behaviors. The scale contains 74-items with responses on a 4-point Likert scale.
The 6 subscales include acceptance, awareness, act with awareness, non-reactivity,
routine, and unstructured eating. Factor analysis was conducted on 127 students with a
mean age of 25.7 (SD = 8.9) years, who were 77.2% females. The sample had a mean
BMI of 23.6 (SD = 3.5 kg/m2). Five of the 6 subscales had good internal consistency
reliability, with Cronbach alphas of 0.75 or higher, while the sixth subscale, unstructured
eating, had a Cronbach alpha of 0.60. All 6 subscales showed convergent validity
(p<.01) when examining correlations between the MES and other measures of
mindfulness, acceptance, personality, and eating pathology (Hulbert-Williams et al.,
2014). Convergent validity measures the relation between two scales that measure the
same concept (Strauss & Smith, 2009). Thus, the MES showed good convergent
validity and high internal consistency reliability scores in all except one subscale.
Lastly, the Mindful Eating Behavior Scale (MEBS) is another measure of ME
(Winkens et al., 2018). The MEBS is a 17-item scale with four subscales: focused
eating, hunger and satiety cues, eating with awareness, and eating without distraction.
The MEBS measures the attention element of ME separate from other eating behaviors
such as emotional and restrained eating. For example, “I watch TV while eating.” The
items are scored from 1 to 5 with 1 meaning never and 5 meaning very often.
8
Participants, 1,227, were included from the Longitudinal Aging Study (LASA) and the
Food-Related Behavior study to compute the internal reliabilities and convergent validity
for the MEBS (Hoogendijk et al., 2016). The participants had a mean age of 68.8± 8.1
years and 51.8% were female. The mean BMI was 27.2± 4.6 kg/m2. The internal
consistency reliabilities were considered high for all four subscales. The internal
consistency Cronbach alpha was 0.85 for focused eating, 0.89 for hunger and satiety
cues, 0.81 for eating with awareness, and 0.70 for the eating without distraction domain.
Due to low interfactor correlations, it is recommended that the scale not be scored by
combining the four domains. Good preliminary convergent validity was seen as the
scores from the MEBS showed significant correlations with relevant variables measured
in LASA Nutrition and the Food-Related Behavior study, such as psychological eating
styles, satisfaction with weight, satisfaction with life, perceived stress, depressive
symptoms, self-regulation, and self-esteem (Winkens et al., 2018).
There are three validated IE scales, two are known as the intuitive eating scale
(IES) (Hawks, Merrill, & Madanat, 2004; Tylka, 2006), and the third is known as the
intuitive eating scale-2 (IES-2) (Tylka & Kroon Van Diest, 2013). The scales are used to
assess the five characteristics an intuitive eater should obtain. The first characteristic is
the ability to recognize the physical signs of hunger, satisfaction, and fullness. For
example, “Without trying, I naturally select the right types and amounts of food to be
healthy.” Second, the intuitive eater has the ability to recognize the nutritional needs of
the body. The third is recognizing the satisfaction factor of food by appreciating the
feeling of nourishment and fullness from food. Fourth, the intuitive eater values the
health and energy provided through food as opposed to body appearance. Fifth, the
intuitive eater is able to reject dieting as a mean for weight control, but to have an
unrestrained relationship with food to promote healthy weight management and positive
body image (Hawks, Merrill, & Madanat, 2004).
The original IES was developed in 2004, and consists of 27-items (Hawks,
Merrill, & Madanat, 2004). The items are scored on a 5-point Likert scale ranging from
“strongly agree” to “strongly disagree.” The scale contains 4 subscales: intrinsic eating,
extrinsic eating, antidieting, and self-care. The validation of the IES included 391
undergraduate students participating in a health education and physical education
9
class. The mean age was 20.6 (SD = 3.4) years, and the participants were 41.6%
female. The subscale’s Cronbach alphas for internal consistency reliability varied.
Extrinsic eating and anti-dieting subscales scored high with 0.79 and 0.93, but intrinsic
eating and self-care subscales scored low score with 0.42 and 0.58. To test convergent
validity, the IES was given with the Cognitive Behavioral Dieting Scale (CBDS) (Martz et
al., 1996), which measures restrictive dieting practices. Pearson correlation coefficients
between the CBDS and the four subscales of the IES showed all relationships between
subscales, except self-care, to be statistically significant negative relationships. Test-
retest reliability was assessed 4 weeks later after initial questionnaire completion, which
yielded the correlation coefficient of 0.85 (p<.0001), which indicates good reliability
(Hawks, Merrill, & Madanat, 2004).
In 2006, Tylka collected data from 1,260 mostly white, college females to develop
and validate the Intuitive Eating Scale (IES) (Tylka, 2006). The scale consists of 21-
items with 3 subscales: unconditional permission to eat, eating for physical rather than
emotional reasons, and reliance on internal hunger/satiety cues. The responses are on
a 5-point Likert scale. Internal consistency reliability resulted in Cronbach alphas of 0.85
for the total IES scores, 0.87 for the unconditional permission to eat subscale, 0.85 for
the eating for physical rather than emotional reasons subscale, and 0.72 for the reliance
on internal hunger/satiety cues subscale. IES scores showed construct validity by being
positively related to measures of self-esteem, optimism, proactive coping, and
satisfaction with life, and related in a negative direction to eating disorder
symptomatology, BMI, and body dissatisfaction. Test-retest reliability showed the total
IES and subscale scores were internally consistent in all studies and remained stable
over a 3-week period with test-retest reliability estimates being 0.90 for the total IES
score. The IES shows reliability and validity in college females, measuring an
individual’s ability to follow physiological hunger and fullness cues when determining
when, what, and how much one should consume (Tylka, 2006).
The IES-2 is a revised version of Tylka’s IES (Tylka, 2006), which includes 23
items with responses presented on a 5-point Likert scale. The IES-2 has an additional
subscale called body-food choice congruence (Tylka & Kroon Van Diest, 2013). The
body-food choice congruence subscale assesses an individual’s ability to engage in
10
“gentle nutrition,” which can be defined as making food choices that honor health and
body functioning (Tylka & Kroon Van Diest, 2013). The IES-2 contains 11 items from the
original IES and 12 additional items. The new items evolved from the Intuitive Eating
book written by Tribole and Resch (Tribole & Resch, 1995). To validate the scale, Tylka
and Kroon Van Diest (2013) collected data from a sample of 1,405 women and 1,195
men. The sample included mostly white individuals from a large midwestern university,
and ages ranged from 18 to 56 years. Internal consistency reliability for women and
men were 0.87 and 0.89 for the total 23-item IES-2, 0.93 and 0.92 for eating for physical
rather than emotional reasons, 0.81 and 0.82 for unconditional permission to eat, 0.88
and 0.89 for reliance on hunger and satiety cues, and 0.87 and 0.85 for body-food
choice congruence. The original IES and IES-2 showed construct overlap as the
convergent validity between the IES-2 and the IES were 0.80 or higher for total and
subscale scores. Construct validity was seen with IES-2 scores positively related to
body appreciation, self-esteem, and satisfaction with life. Scores were inversely related
to eating disorder symptomatology, poor interoceptive awareness, body surveillance,
body shame, BMI, and internalization of media appearance ideals. The IES-2 total and
subscale scores showed test-retest reliability, as scores remained stable across a 3-
week period (Tylka & Kroon Van Diest, 2013). EVALUATION OF MINDFUL EATING AND INTUITIVE EATING Previous systematic reviews have examined the effects of ME and IE on different
health and psychological factors. One systematic review of IE interventions examined
their influence on disordered eating, body image, emotional functioning, and other
psychosocial correlates in adult women (Bruce & Ricciardelli, 2016). Twenty-four cross-
sectional studies were included. Participants were female, aged 18 years or older, with
the majority of studies containing university students (n = 17). Eight of the 24 studies
examined IE in relation to eating pathology, in which all showed IE was inversely
associated to eating pathology, such as binge eating, bulimia, food preoccupation, and
unhealthy weight loss practices. The review also included studies measuring body
image. Eight studies measured body appreciation, which showed IE correlated with
body appreciation in a positive direction in all studies. Two studies measured body
satisfaction, which found IE practices associated with greater body satisfaction. Five
11
studies measured body surveillance (i.e., habitually monitoring appearance), which
showed IE correlated with lower body surveillance. Seven studies examined emotional
functioning and found that IE was inversely associated with negative affect and
depression, but IE was not associated with state and trait anxiety. Two studies, which
examined management of emotions, found that greater levels of IE were associated
with better emotional management. All included studies measured IE using a validated
measure of IE. Twenty studies used the IES created by Tylka in 2006, with one study
using only two questions from this scale (Tylka, 2006). One study used the IES created
by Hawks and colleagues in 2004 (Hawks, Merrill, & Madanat, 2004). The remaining
three studies used the IES-2 (Bruce & Ricciardelli, 2016; Tylka & Kroon Van Diest,
2013).
Another systematic review conducted by Schaefer and Magnuson (2014)
examined the physical and psychological effects of IE interventions. Twenty studies
were included, nine were randomized control trials, one randomized with no control
group, one non-randomized quasi-experimental with a control group, and nine
prospective cohort studies with no comparison groups. Comparison groups varied
between no intervention comparisons or active interventions, including traditional weight
control programs or social support only groups. From the studies included, most
participants were adult females without a clinically diagnosed eating disorder. The
majority of the included studies contained samples of individuals with overweight or
obesity. The majority of the reporting focused on within group comparisons with few
between group comparisons included. Six out of nine studies showed within group
reductions in dietary restraint for the intervention groups. One showed a significant
within group increase in dietary restraint, and two of the nine studies showed no
significant within group change. Nine studies measured disordered eating behaviors,
such as bulimia, binge eating, and disinhibition. Of the nine, seven showed a significant
within group decrease for the intervention group while the other two studies showed no
significant change within the intervention group. Nineteen studies measured weight
status. Four studies showed a within group decrease for weight in the intervention
group, one showed a within group increase in weight for the control group, the rest
showed no significant change in weight status after the intervention was implemented.
12
Five studies assessed markers of cardiovascular risk, such as total cholesterol, LDL
and HDL cholesterol, and triglycerides. Findings for markers were inconsistent among
studies. Six studies measured blood pressure, with five studies showing improvements
within the intervention groups. One study measured symptoms of metabolic syndrome,
which found no significant differences between the intervention and control group. Four
studies measured dietary intake. Of these studies, three studies included a
measurement of diet quality. Of these three studies, one found a significant decrease in
fat intake in the intervention group compared to the control. For the other two studies
that measured diet quality, one showed within group improvements for both the
intervention and control groups and the other found no significant within group changes
for both the intervention and control groups in various diet quality measures. In regards
to energy intake, all four studies measured this variable, with one study showing a
significant decrease in average energy intake in the intervention group when compared
to the control. One study found a significant within group decrease in energy intake for
the intervention and control group. The other two studies measuring energy intake
found no significant within group differences. One limitation of the review was the lack of
included studies directly measuring IE. IE was measured through indirect measures,
such as interoceptive awareness and decreased dietary restraint, but no study included
a measurement of IE directly (Schaefer & Magnuson, 2014).
Clifford and colleagues (2015) conducted a systematic review on non-diet
approaches, including ME, IE, Health at Every Size (HAES), size acceptance, joyful
movement, normalization of eating patterns, and psychoeducation. The review aimed to
determine the effects of non-diet approaches on different health outcomes, including
weight, biochemical measures, food and activity behaviors, body image, and mental
health. No specific type of participant was focused on in the review. Fourteen
randomized control trials (RCTs) and 2 quasi-experimental studies were included.
Comparisons were made to a no intervention control group or a diet group. Diet groups
consisted of a calorie deficit goal or a specific diet eliminating certain foods groups in
order to create an energy deficit with the goal of the intervention being weight loss.
Thirteen of the 16 included studies measured change in weight status with none
showing a significant between group weight loss. In regards to reduction of dietary
13
restraint and disinhibition, two out of the four studies that measured this variable found
significant reductions in the intervention group when compared to the control. Seven
studies measured body image avoidance/body dissatisfaction with one study finding a
significant improvement in the intervention group when compared to the control. Three
studies measured emotional eating with one finding significant between group
improvements in the intervention group. Five studies measured disordered eating, with
two studies finding significant improvements in the intervention group when compared
to the control. Four of six studies that measured psychological measures such as self-
esteem, depression, and emotional well-being, found significant between group
improvements in the intervention group. Five of the sixteen included studies assessed
dietary intake. Three studies measured energy intake with all resulting in no significant
difference between groups. Three of the five studies that measured dietary intake
included measures to assess diet quality with one study showing improvements in trans
fat, fiber, and sugar for the intervention group when compared to the control, and
another study found significant between group improvement in fruit and vegetable
intake when compared to the control. The last study of the three showed no significant
difference between groups. In regards to IE and ME measures, four studies were ME
focused, but none measured ME. Seven studies included an IE intervention. Of these
seven studies, only one measured IE, which used the IES to measure; however, no
between group differences were seen in total IES score at post intervention. Overall,
significant differences were only seen in psychological measures, such as depression,
self-esteem, and emotional well-being (Clifford et al., 2015).
All three reviews focus on a broad range non-diet approaches with various
outcomes of interest (Bruce & Ricciardelli, 2016; Clifford et al., 2015; Schaefer &
Magnuson, 2014). Bruce and Ricciardelli (2016) only looked at psychological outcomes,
while the other two reviews focused on psychological and varying health outcomes
(Clifford et al., 2015; Schaefer & Magnuson, 2014). The types of study designs varied
among reviews. Bruce and Ricciardelli (2016) included cross-sectional studies. Clifford
and colleagues (2015) included quasi-experimental and RCTs that included a
comparison or control group. Schafer and Magnuson (2014) included studies that were
randomized control trials (RCTs), quasi-experimental, and prospective cohort studies.
14
The majority of their conclusions were made from within group comparisons, as half of
the included studies did not contain a control or comparison group. In addition, studies
were not evaluated or eliminated based on methodological quality (Schaefer &
Magnuson, 2014). Bruce and Ricciardelli (2016) as well as Clifford and colleagues
(2015) did not eliminate individuals with an eating disorder; therefore applying
conclusions to a general population is difficult. As for use of ME and IE measures,
Bruce and Ricciardelli (2016) included studies that measured IE. Clifford and colleagues
(2015) included one study that measured IE, which used a validated tool, but none of
the ME interventions measured ME. Lastly, none of the studies included in Schaefer
and Magnuson (2014) colleagues’ review included a measure of IE. Thus, conclusions
on whether the interventions were implemented and had effect are limited. SPECIFIC AIMS
ME and IE principles believe one will select foods the body needs and foods that
are in line with one’s health desires (Nelson, 2017; Tribole & Resch, 1995), yet
systematic reviews in this area have not focused on dietary intake as a primary
outcome. Two of the three systematic reviews mentioned previously examined dietary
intake with a total of eight studies reporting on this variable (Clifford et al., 2015;
Schaefer & Magnuson, 2014). Though both reviews included studies examining energy
intake measures, only four of the eight studies measuring dietary intake, had a measure
of diet quality. Improvement in diet quality was not defined nor did either review
specifically focus on this outcome. In addition, Schaefer and Magnuson (2014) made
conclusions from within group comparisons with only one study reported as a between
group comparison. Bruce and Ricciardelli (2016) included studies that measured IE,
which all studies used validated tools; however, the study designs were cross-sectional.
Therefore, IE scores can only be associated with outcomes of interest (Bruce &
Ricciardelli, 2016). Between the remaining two systematic reviews, only one study
included in Clifford and colleagues’ (2015) review measured IE, which resulted in no
significant differences in IE total scores between the intervention and comparison group.
Furthermore, two of the three systematic reviews did not exclude participants that had
eating pathology, so conclusions are unable to be applied to a general population
(Bruce & Ricciardelli, 2016; Clifford et al., 2015). Therefore, to better understand how
15
ME and/or IE interventions influence dietary intake in populations without disordered
eating, this systematic review examined how ME and IE interventions, evaluated using
a randomized trial design, influence dietary intake in individuals of varying weight status
who did not have a diagnosis of an eating disorder. Furthermore, to enhance
understanding of how well the interventions influenced ME and IE, ME and IE outcomes
were reported when they were assessed with a validated tool.
16
CHAPTER TWO: MANUSCRIPT BACKGROUND
Cognitive control is the process of using cognitions to recognize and change
behavior to achieve a goal or task (Diamond, 2013). Cognitions can be used to override
automatic responses and inhibit inappropriate responses to achieve a goal or task.
Thus, cognitive control over eating is the process of limiting or changing eating behavior
to align with a specific eating goal (Wardle, 1988). For example, cognitive control of
eating is seen when one chooses to or not to consume food based on a desired health
outcome and/or dietary goal (i.e., eat 5 to 9 servings of fruits and vegetables a day,
limiting saturated fat to < 10% of energy intake). When cognitive control is implemented
to prevent excessive energy intake, goals that limit food intake are set. While using
cognitive control to guide eating may assist with changing dietary intake, it has been
proposed that cognitive control of eating may also create problematic eating behaviors
(Wardle, 1988). Research on “restrained eating” has led to the hypothesis that an eating
style that relies on physiological cues of hunger and fullness may be better than an
eating style that relies on cognitive control (Wardle, 1988). Two types of interventions
have been developed to assist with the development of an eating style that relies on
cues of physiological need (Kabat-Zinn, 2015; Tribole & Resch, 1995). These
interventions focus on mindful eating (ME) and intuitive eating (IE).
ME is the act of paying attention to food during consumption, and having
awareness and focusing on the experience with food (Nelson, 2017). The intent is not
weight loss or to restrict intake; however, it is believed that if one is mindful of their food
experience and consumption, the result will be eating less and selecting foods that are
consistent with one’s desired health outcome (Nelson, 2017). Similarly, the IE model
was aimed to encourage individuals to reject the diet mentality (Tribole & Resch, 1995).
The diet mentality is the process of relying on non-physiological factors, such as
cognitive control to determine intake, rather than relying on the body’s natural self-
regulation system. IE is eating based on physiological hunger and satiety cues rather
than external cues (Tribole & Resch, 1995). External cues can include emotions, food
availability, seeing or smelling food, social settings where eating is encouraged or the
norm, serving sizes, or food packaging. Thus, IE involves training an individual to focus
17
on responding to physical sensations in order to determine the body’s needs (Tribole &
Resch, 1995).
Though the aim of ME and IE is to listen to the body’s cues to drive eating, few
systematic reviews have focused on how these approaches influence dietary intake,
particularly diet quality. Previous systematic reviews have examined the effects of ME
and IE on different psychological and health factors (Bruce & Ricciardelli, 2016; Clifford
et al., 2015; Schaefer & Magnuson, 2014). One systematic review examined IE
interventions’ influence on disordered eating, body image, emotional functioning, and
other psychosocial correlates in adult women (Bruce & Ricciardelli, 2016). Twenty-four
cross-sectional studies were included. Participants were female, aged 18 years or older,
with the majority of studies containing university students (n = 17). Results showed IE
was inversely associated to eating pathology and associated with positive body image
and better emotional management. All studies included in the review measured IE, with
one study using only two questions from the IES created by Tylka in 2006 (Bruce &
Ricciardelli, 2016; Tylka, 2006).
Another systematic review conducted by Schaefer and Magnuson (2014)
examined the physical and psychological outcomes from IE interventions. The review
included RCTs, quasi-experimental designs, and prospective cohort studies. Most
participants were adult females without a clinically diagnosed eating disorder. The
majority of the reported results focused on within group comparisons with few between
group comparisons included. In regards to dietary intake, four of the twenty included
studies measured this outcome. Of these studies, three studies included a
measurement of diet quality, with one finding a significant decrease in fat intake in the
intervention group compared to the control; however, within group comparisons were
reported for the remaining two studies showing improvements for both the intervention
and control groups. Four studies measured energy intake, with one study showing a
significant decrease in average energy intake in the intervention group when compared
to the control. One study found a significant within group decrease in energy intake for
the intervention and control group. The other two studies measuring energy intake
found no significant within group differences. In regards to IE measures, no study
18
included in the review measured IE. Thus, implementation of IE and the effect of the
intervention are unable to be assessed (Schaefer & Magnuson, 2014).
Lastly, Clifford and colleagues (2015) conducted a systematic review on non-diet
approaches, including ME, IE, Health at Every Size (HAES), size acceptance, joyful
movement, normalization of eating patterns, and psychoeducation. The review aimed to
determine the effects of non-diet approaches on different health outcomes, including
weight, biochemical measures, food and activity behaviors, body image, and mental
health. No specific type of participant was focused on in the review. The review included
randomized control trials (RCTs) and quasi-experimental studies. Overall, the review
concluded significant differences were seen in psychological measures, such as
depression, self-esteem, and emotional well-being. In regards to energy intake, three
studies measured with all resulting in no significant differences between groups. Three
of the sixteen studies, included measures to determine diet quality with one study
showing improvements in trans fat, fiber, and sugar for the intervention group when
compared to the control, and another study found significant between group
improvement in fruit and vegetable intake when compared to the control. The last study
of the three showed no significant difference between groups. Of these studies that
found significant differences in diet quality, one was a ME intervention while the others
were joyful movement and size acceptance approaches. The ME intervention did not
measure ME, thus, conclusions cannot be made in regards to how the intervention
influenced ME nor how ME influences diet quality (Clifford et al., 2015).
Therefore, few reviews have reported on how ME and IE approaches influence
dietary intake, specifically diet quality, nor has this been a main focus of any previous
review. Therefore, to better understand how ME and/or IE interventions influence
dietary intake in populations without disordered eating, this systematic review examined
how ME and IE interventions, evaluated using a randomized trial design, influence
dietary intake in individuals of varying weight status who do not have a diagnosis of an
eating disorder. Furthermore, to enhance understanding of how well the interventions
influenced ME and IE, ME and IE outcomes were reported when they were assessed
with a validated tool.
19
MATERIALS AND METHODS The review of the literature was conducted according to the guidelines specified
by the Preferred Reporting Items for Systematic Reviews and Meta Analyses (PRISMA)
statement (Moher et al., 2009) (See Appendix II). The systematic review protocol was
registered at PROSPERO and is awaiting approval, registration number 128135.
Criteria of Studies (PICO)
Type of Studies
Studies included were randomized trials, which included an intervention of ME or
IE that had a minimum intervention duration of an initial appointment and at least one
follow-up (i.e., phone, in-person, mobile application). Only studies published in the
English language were included.
Type of Participants
Studies were included if participants were adults aged 18 years and older.
Studies who enrolled individuals of a healthy weight or with overweight or obesity were
included as this review focused on IE and ME approaches as a means of influencing
dietary intake. Studies were excluded if participants reported as being underweight,
having an eating disorder (i.e., anorexia, bulimia nervosa, binge eating disorder), or
other health conditions in which dietary restrictions have been applied.
Type of Interventions
The interventions included were required to have a component of ME or IE, but
did not have to solely be an ME or IE intervention. Interventions that met the inclusion
criteria taught and encouraged participants to eat intuitively, mindfully, or based on
hunger and fullness cues. There was no specified intervention setting and no restriction
on intervention personnel for inclusion purposes.
Type of Comparisons
Studies were included if a randomized trial design was used, in which one arm
was an intervention with an ME or IE component and there was at least one other arm
that was a control or active comparison. A control comparison included a non-
20
intervention control (i.e., wait-list control, assessment only control) or usual care. All
other comparisons were considered active interventions.
Type of Outcome Measures
Studies were included if the outcomes of energy intake or diet quality were
reported at baseline and post-intervention. Diet quality was defined based upon dietary
components targeted in the Dietary Guidelines for Americans (DGAs) (US Department
of Health and Human Services; US Department of Agriculture, 2015) or based on a
Healthy Eating Index score (Kennedy et al.,1995). Studies needed to report on only one
component of the DGAs to be considered as reporting on diet quality. Studies were
included if the DGAs that were used to determine diet quality were the guidelines that
were in place at the time the study was conducted. If the year the study was conducted
was not available, the year the study was published was used to determine inclusion.
An improvement in diet quality was reflected by an increase in foods/nutrients within the
DGAs that are commonly targeted to increase (i.e., fruits, vegetables, whole grains, fat-
free or low fat diary, a variety of protein foods, and oils containing monounsaturated and
polyunsaturated fat) (US Department of Health and Human Services; US Department of
Agriculture, 2015). Diet quality improvement was also considered observed if there was
a decrease in foods/nutrients that are commonly targeted within the DGAs to decrease
(i.e., added sugars, saturated fat, sodium, and alcohol) (US Department of Health and
Human Services; US Department of Agriculture, 2015). The Healthy Eating Index (HEI)
measured diet quality by assessing how intake aligned with the DGAs (Kennedy et al.,
1995). Higher scores on the HEI indicated higher diet quality. Search Methods for Identification of Studies
Electronic Searches
For this review, PubMed, CINAHL and PsycINFO databases were searched. In
addition, references of eligible studies were examined. Studies published or in press
between 1980, as no earlier date has been used for systematic reviews of ME or IE
(Clifford et al., 2015), and an end date of October 2018, were included.
21
Search Strategy
An initial search by a single author using key terms for ME and IE was performed
(see Appendix III). The initial reviewer determined rejection of studies through abstract
screening. If the abstract could not be rejected with certainty, the full text article was
obtained for further evaluation. For articles pulled to review, two reviewers (HG and HR)
independently assessed and determined a study’s eligibility. Any doubts for inclusion
were discussed and resolved. See Appendix IV for how article selection was
documented.
Quality Assessment
The modified Downs and Black checklist was used to assess risk of bias for each
study that met the inclusion criteria (Downs & Black, 1998). The modified Downs and
Black checklist is a checklist for the assessment of the methodological quality of
randomized studies of health care interventions (Downs & Black, 1998) (see Appendix
V). The checklist is a 27-item scale with possible values ranging from 0 to 28. The
checklist has 5 different assessment categories: reporting, external validity, internal
validity – bias, internal validity – confounding, and power. The modified checklist
simplified the power question by awarding a single point if a study had sufficient power
to detect an effect, where the probability value for a difference being due to chance was
<5%. A higher score indicated better quality with 28-24 points considered excellent, 23-
19 points considered good, 18-14 points considered fair, and less than 14 points
considered poor (O’Connor et al., 2015).
Selection and Review Process
The selection of literature followed the PRISMA systematic review process,
which included individual collection of studies that met inclusion criteria, formation of a
summary table, and verifying key findings (Moher et al., 2009). A summary table was
formulated by one reviewer (HG) from each study that was included (see Appendix VI).
The table included documentation of study author(s) and year published, sample size,
participant gender, participant weight status (mean BMI), participant age (mean in
years), intervention duration, assessment time points with retention rate, intervention
contact time, ME/IE intervention components, dietary intervention components included
22
in ME/IE interventions, other components included in ME/IE interventions,
control/comparison interventions, validated ME/IE measurements, dietary assessment
methods with length of recall, indication of reported energy intake, and/or diet quality
variables. One reviewer, HR, reviewed the summary table and verified the data. One
reviewer, HG, created a key findings table to summarize outcomes of energy intake
and/or diet quality, weight, body mass index (BMI), and ME and IE measures (see
Appendix VII). The focus in the key findings table was on between-group comparisons,
reporting comparisons between the intervention group and either a comparison and/ or
control group. If a study had 3 groups, comparisons between all three groups were
reported. Significant and non-significant findings were reported.
RESULTS Study Selection
A total of 194 abstracts were retrieved through database searching for abstract
screening against inclusion criteria (see Appendix IV for Selection Flow Chart). The
abstract screening resulted in 38 articles identified for full-text review. After reading the
full texts, 14 articles were identified for inclusion. References of eligible articles were
screened for inclusion, resulting in one additional article included for analysis. As a
result, 15 articles, representing 14 studies, were included for the review.
Study Characteristics Fifteen articles, representing 14 randomized control trials with an intervention
containing ME or IE were included. See Appendix VI for the table of study
characteristics. Studies were grouped into three categories: no intervention, waitlist
control, and active comparisons. Nine of the 14 included studies, representing 10 of 15
articles, were ME interventions (Carmody et al., 2008; Daubenmier et al, 2012; Gardiner
et al., 2017; Ingraham et al., 2017; Mason et al., 2016; Miller et al., 2012; Miller et al.,
2014; Spadaro et al., 2018; Timmerman et al., 2012; van Berkel et al., 2014) and five
were IE interventions (Anglin et al., 2013; Cole & Horacek, 2010; Järvelä-Reijonen et
al., 2018; Leblanc et al., 2012; Mensinger et al., 2016). Comparison groups of the
included studies varied. Three studies included a comparison group with no intervention
(Cole & Horacek, 2010; Järvelä-Reijonen et al., 2018; van Berkel et al., 2014). Five
studies included a waitlist comparison group as the comparison (Carmody et al., 2008;
23
Daubenmier et al., 2012; Ingraham et al., 2017; Leblanc et al., 2012; Timmerman et al.,
2012). Seven articles, representing six studies, included a comparison that contained an
active intervention (Anglin et al., 2013; Gardiner et al., 2017; Mason et al., 2016;
Mensinger et al., 2016; Miller et al., 2012; Miller et al., 2014; Spadaro et al., 2018).
Comparisons that were active interventions were interventions that focused on dietary
prescriptions with calorie or macronutrient goals and/or physical activity components
(Anglin et al., 2013; Mason et al., 2016; Mensinger et al., 2016; Miller et al., 2012; Miller
et al., 2014; Spadaro et al., 2018); however, one active intervention comparison only
differed in regards to implementation, but both the intervention and comparison groups
received the same ME intervention (Gardiner et al., 2017).
Participants in the included studies were predominantly female with body mass
indices (BMI) of overweight and obese. The duration of the interventions included were
mostly short, with the shortest being 6 weeks (Anglin et al., 2013; Timmerman et al.,
2012) and the longest being 6 months (Mensinger et al., 2016; Spadaro et al., 2018;
van Berkel et al., 2014). Intervention total contact time varied among studies with the
shortest length of contact time being 9 hours (Järvelä-Reijonen et al., 2018) and the
longest being 46.5 hours (Mason et al., 2016). All but two of the interventions involved
group classes for implementation (Anglin et al., 2013; Gardiner et al., 2017).
Some included ME and IE interventions were multi-component interventions.
One study included a standard behavioural weight loss program with ME incorporated
(Spardaro et al., 2018), while another study included general principles of weight
management alongside ME training (Timmerman et al., 2012). Five of the 14 studies
included interventions that were Mindfulness-Based Stress Reduction (MBSR)
interventions with ME training (Daubenmier et al., 2012; Gardiner et al., 2017; Ingraham
et al., 2017; Mason et al., 2016; Spadaro et al., 2018). One study incorporated IE
alongside acceptance and commitment therapy (ACT) (Järvelä-Reijonen et al., 2018).
Lastly, Carmody and colleagues’ (2008) intervention were dietary and cooking classes
that incorporated ME. Seven studies included physical activity components (Anglin et
al., 2013; Gardiner et al., 2017; Ingraham et al., 2017; Järvelä-Reijonen et al., 2018;
Mason et al., 2016; Spadaro et al., 2018; van Berkel et al., 2014). ME and IE
Interventions varied in aspects of nutrition goals. Seven articles, representing six
24
studies included no nutrition specific goal for the ME or IE intervention (Cole & Horacek,
2010; Järvelä-Reijonen et al., 2018; Leblanc et al., 2012; Mensinger et al., 2016; Miller
et al., 2012; Miller et al., 2014; van Berkel et al., 2014); three studies provided specific
nutrition goals (Ingraham et al., 2017; Mason et al., 2016; Spadaro et al., 2018), such as
caloric restriction; four studies provided nutrition education (Carmody et al., 2008;
Daubenmier et al., 2012; Gardiner et al., 2017; Timmerman et al., 2012), and for one
study it was unclear if a specific dietary goal was provided (Anglin et al., 2013). All
studies that included additional dietary interventions were ME focused interventions
(Carmody et al., 2008; Daubenmier et al., 2012; Gardiner et al., 2017; Ingraham et al.,
2017; Mason et al., 2016; Spardaro et al., 2018; Timmerman et al., 2012).
Eight studies, representing nine articles, reported energy intake (Anglin et al.,
2013; Carmody et al., 2008; Cole & Horacek, 2010; Daubenmier et al., 2012; Leblanc et
al., 2012; Miller et al., 2012; Miller et al., 2014; Spadaro et al., 2018; Timmerman et al.,
2012). Twelve studies, representing thirteen articles, reported on diet quality (Carmody
et al., 2008; Cole & Horacek, 2010; Daubenmier et al., 2012; Gardiner et al., 2017;
Ingraham et al., 2017; Järvelä-Reijonen et al., 2018; Leblanc et al., 2012; Mason et al.,
2016; Mensinger et al., 2016; Miller et al., 2012; Miller et al., 2014; Timmerman et al.,
2012; van Berkel et al., 2014). Studies varied in dietary assessment measures. Four
studies, representing five articles, used a food frequency questionnaire (Daubenmier et
al., 2012; Mason et al., 2016; Miller et al., 2012; Miller et al., 2014; Spadaro et al.,
2018). Three studies used food records (Anglin et al., 2013; Cole & Horacek, 2010;
Leblanc et al., 2012). Two studies used 24-hour dietary recall (Carmody et al., 2008;
Timmerman et al., 2012). For diet quality, various questionnaires were used among
studies (Mensinger et al., 2016; van Berkel et al., 2014), while others developed
questions from NHANES (Gardiner et al., 2017) and the Behavioral Risk Factor
Surveillance System (Ingraham et al., 2017). Other studies that measured diet quality
used various indexes to determine diet quality (Cole & Horacek, 2010; Järvelä-Reijonen
et al., 2018). Four studies used validated tools to measure ME or IE (Ingraham et al.,
2017; Järvelä-Reijonen et al., 2018; Mason et al., 2016; Mensinger et al., 2016) Two
studies used the IES (Järvelä-Reijonen et al., 2018; Mensinger et al., 2016) and two
used the MEQ (Ingraham et al., 2017; Mason et al., 2016).
25
In regards to anthropometrics, of the 14 studies, 11 studies, representing 12
articles, measured weight (Anglin et al., 2013; Carmody et al., 2008; Cole & Horacek,
2010; Daubenmier et al, 2012; Gardiner et al., 2017; Ingraham et al., 2017; Leblanc et
al., 2012; Mensinger et al., 2016; Miller et al., 2012; Miller et al., 2014; Spadaro et al.,
2018; Timmerman et al., 2012). Seven of these studies measuring weight, representing
eight articles, were ME interventions (Carmody et al., 2008; Daubenmier et al, 2012;
Ingraham et al., 2017; Gardiner et al., 2017; Miller et al., 2012; Miller et al., 2014;
Spadaro et al., 2018; Timmerman et al., 2012); however, two studies measured weight,
but did not report their findings (Gardiner et al., 2017; Ingraham et al., 2017). Four IE
interventions reported weight results (Anglin et al., 2013; Cole & Horacek, 2010;
Leblanc et al., 2012; Mensinger et al., 2016). BMI was measured in a total of eleven
studies, representing 12 articles, (Anglin et al., 2013; Carmody et al., 2008; Cole &
Horacek, 2010; Daubenmier et al, 2012; Gardiner et al., 2017; Ingraham et al., 2017;
Leblanc et al., 2012; Mensinger et al., 2016 Miller et al., 2012; Miller et al., 2014;
Spadaro et al., 2018; Timmerman et al., 2012). Seven of these studies measuring BMI,
representing eight articles, were ME interventions (Carmody et al., 2008; Daubenmier et
al, 2012; Gardiner et al., 2017; Ingraham et al., 2017; Miller et al., 2012; Miller et al.,
2014; Spadaro et al., 2018; Timmerman et al., 2012); however, four studies that
measured BMI did not report their findings (Carmody et al., 2008; Gardiner et al., 2017;
Ingraham et al., 2017; Timmerman et al., 2012). Four IE interventions included reported
BMI results (Anglin et al., 2013; Cole & Horacek, 2010; Leblanc et al., 2012; Mensinger
et al., 2016).
Results of Studies
No Intervention Comparison
See Appendix VII for the table of key findings. Three studies of the fourteen
studies included a comparison group that received no intervention (Cole & Horacek,
2010; Järvelä-Reijonen et al., 2018; van Berkel et al., 2014). One of the three studies
was a ME intervention (van Berkel et al., 2014) and two were IE interventions (Cole &
Horacek, 2010; Järvelä-Reijonen et al., 2018). Cole and Horacek (2010) reported on
26
energy intake, which found no significant difference between the intervention and
comparison groups.
All three studies reported on diet quality. Van Berkel and colleagues (2014)
measured fruit intake, which resulted in no significant between group differences. Cole
and Horacek (2010) measured fiber; percent calories from protein, carbohydrates, and
fat; and HEI. Results showed no significant between group differences. Lastly, Järvelä-
Reijonen and colleagues (2018) measured participant’s index of diet quality score,
which resulted in no significant between group differences.
In regards to weight and BMI, only Cole and Horacek (2010) measured these
outcomes. Results from both weight and BMI measures showed no significant between
group differences (Cole & Horacek, 2010). Järvelä-Reijonen and colleagues (2018)
were the only study of the three to use a validated IE measure; however, there was no
significant difference between the intervention and the comparison group.
Waitlist Comparison
Five of the fourteen total studies had a waitlist comparison group (Carmody et al.,
2008; Daubenmier et al, 2012; Ingraham et al., 2017; Leblanc et al., 2012; Timmerman
et al., 2012). Four of the five studies were ME interventions (Carmody et al., 2008;
Daubenmier et al, 2012; Ingraham et al., 2017; Timmerman et al., 2012), and one was
an IE intervention (Leblanc et al., 2012). Four studies measured energy intake
(Carmody et al., 2008; Daubenmier et al, 2012; Leblanc et al., 2012; Timmerman et al.,
2012). Three of these studies did not find significant between group differences in
energy intake (Carmody et al., 2008; Daubenmier et al, 2012; Leblanc et al., 2012).
However, Timmerman and colleagues (2012) found a significantly lower energy intake
for the intervention group when compared to the comparison group (P=0.0002).
All five studies reported on diet quality (Carmody et al., 2008; Daubenmier et al,
2012; Ingraham et al., 2017; Leblanc et al., 2012; Timmerman et al., 2012). Timmerman
and colleagues (2012) only examined fat intake, which they found a significantly lower
fat intake for the intervention group as compared to the comparison group (P=0.001);
however, other included studies examining the percentage of calories from fat did not
find a significant difference between the intervention and comparison group (Carmody
et al., 2008; Daubenmier et al, 2012; Leblanc et al., 2012). Carmody and colleagues
27
(2008) examined saturated fat intake, and found significantly lower intake in the
intervention group when compared to the comparison group (P=0.0004). Furthermore,
three studies examined percent calories from protein, in which all found no significant
between group differences (Carmody et al., 2008; Daubenmier et al, 2012; Leblanc et
al., 2012). However, Carmody and colleagues (2008) examined animal and vegetable
protein intake. Animal protein intake was significantly lower for the intervention as
compared to the comparison group (P=0.03), and vegetable protein was significantly
higher for the intervention as compared to comparison group (P=0.0002) (Carmody et
al., 2008). Two studies measured percent calories from carbohydrates which all found
no significant between group differences (Daubenmier et al., 2012; Leblanc et al.,
2012). Ingraham and colleagues (2017) examined fruit and vegetable intake, which
results showed no significant between group differences. Two studies measured fiber
intake with one study showing a significantly higher intake in the intervention when
compared to the comparison group (Carmody et al., 2008), and the other showing no
significant difference (Leblanc et al., 2012). Furthermore, one study examined the type
of fiber being consumed, which found no significant between group differences in
soluble fiber, but did find a significantly greater intake in insoluble fiber for the
intervention when compared to the comparison group (Carmody et al., 2008). Only one
study included measurements of sodium, calcium, and percentage of calories from
alcohol, which all resulted in no significant between group differences (Leblanc et al.,
2012).
All five studies measured weight (Carmody et al., 2008; Daubenmier et al, 2012;
Ingraham et al., 2017; Leblanc et al., 2012 Timmerman et al., 2012); however,
Ingraham and colleagues (2017) did not report the results. Three studies did not find
significant between group differences in weight (Carmody et al., 2008; Daubenmier et
al, 2012; Leblanc et al., 2012). However, Timmerman and colleagues (2012) found a
significant decrease in weight for the intervention group when compared to the
comparison group (P=0.03). All five studies also measured BMI, but three did not report
the results (Carmody et al., 2008; Ingraham et al., 2017; Timmerman et al., 2012). The
remaining two studies found no significant between group differences in BMI
(Daubenmier et al., 2012; Leblanc et al., 2012). Lastly, one study included a validated
28
tool to measure ME, however, results were not significant between groups (Ingraham et
al., 2017).
Active Intervention Comparison
Of the fourteen total studies, six studies, represented in seven articles, had an
active intervention comparison group (Anglin et al., 2013; Gardiner et al., 2017; Mason
et al., 2016; Mensinger et al., 2016; Miller et al., 2012; Miller et al., 2014; Spadaro et al.,
2018). Two of the six studies were IE interventions (Anglin et al., 2013; Mensinger et al.,
2016), and the remaining four studies, representing five articles, were ME interventions
(Gardiner et al., 2017; Mason et al., 2016; Miller et al., 2012; Miller et al., 2014; Spadaro
et al., 2018). Three studies, representing four articles, measured energy intake (Anglin
et al., 2013; Miller et al., 2012; Miller et al., 2014; Spadaro et al., 2018). Anglin and
colleagues (2013) found significantly lower energy intake in the comparison group when
compared to the intervention group during weeks 3, 5, and 6. The remaining two
studies, representing three articles, that measured energy intake found no significant
between group comparisons (Miller et al., 2012; Miller et al., 2014; Spadaro et al.,
2018).
Of the six studies that included an active intervention comparison, four studies,
representing five articles, measured diet quality (Gardiner et al., 2017; Mason et al.,
2016; Mensinger et al., 2016; Miller et al., 2012; Miller et al., 2014). Three of the four
studies measured fruit and vegetable intake (Gardiner et al., 2017; Mensinger et al.,
2016; Miller et al., 2014). Of those three studies, two found no significant between group
comparisons (Mensinger et al., 2016; Miller et al., 2014). One study resulted in
significantly greater fruit intake in the intervention group when compared to the
comparison group (Gardiner et al., 2017). In this study, both the intervention and
comparison group received nutrition education on the five fruit and vegetable
recommendations, the Harvard School of Public Health’s healthy eating, and the
principles of the Diabetes Prevention Program (Gardiner et al., 2017). One study
measured whole grains, red meat, and fish, which found no significant differences
between groups (Gardiner et al., 2017). Similarly, no significant outcomes were seen
between groups in Miller and colleagues’ (2014) study when measuring grains, meat,
fish, poultry, and eggs. Miller and colleagues (2012) examined various fat intake
29
measures, which found a significant between group decrease in trans fat for the
comparison group; however, saturated fat, monounsaturated and polyunsaturated fat,
cholesterol, and percent calories from fat all resulted in no significant between group
changes. The intervention group did not receive a nutrition intervention, but the active
comparison group had a goal to make a 500 calorie reduction per day with 50% of
calories from carbohydrates, and less than 30% from fat, as well as medical nutrition
therapy focused on portion control of carbohydrates and fat (Miller et al., 2012). Miller
and colleagues (2014) also measured dairy intake and found no significant between
group changes. One study measured soda intake, but found no between group
differences (Gardiner et al., 2017). Miller and colleagues (2014) measured soda,
fats/oils, and sweets, but found no significant between group changes. Mason and
colleagues (2016) measured change in sweets consumption, which resulted in no
significant between group change for 0 to 6 months and 0 to 12 months; however, when
change in sweets consumption was assessed for 6 to 12 months, results showed a
significant increase in the comparison group when compared to the intervention group
(P=0.035). Both the intervention and comparison groups received a nutrition
prescription to reduce calories per day by 500 calories, decrease calorically dense,
nutrient poor foods, and increase fruit, vegetables, healthy oils and proteins (Mason et
al., 2016).
Five of the six studies, representing six articles, measured weight (Anglin et al.,
2013; Gardiner et al., 2017; Mensinger et al., 2016; Miller et al., 2012; Miller et al., 2014;
Spadaro et al., 2018). Mensinger and colleagues (2016) found that weight was
significantly lower for the comparison when compared to the intervention group at the 6-
month assessment (P=0.001), but by the 24-month assessment, the difference between
the comparison and intervention group was not significant. Anglin and colleagues
(2013) and Spadaro and colleagues (2018) found significant between group differences
in weight; however results were conflicting. Anglin and colleagues (2013) observed a
significant between group decrease in weight that favored the comparison group
(P<0.05), but in Spadaro and colleagues’ study (2018), the intervention group had a
significantly lower weight when compared to the comparison group (P=0.029). For the
remaining three studies that assessed weight, one study did not report the outcome at
30
follow-up (Gardiner et al., 2017), and the remaining study, represented in two articles,
found no significant weight change between the intervention and comparisons groups at
the time points reported (Miller et al., 2012; Miller et al., 2014).
Five of the six studies, represented in six articles, measured BMI (Anglin et al.,
2013; Gardiner et al., 2017; Mensinger et al., 2016; Miller et al., 2012; Miller et al., 2014;
Spadaro et al., 2018). Of these five studies, one did not report on the results (Gardiner
et al., 2017). Mensinger and colleagues (2016) found the comparison group to have a
significantly lower BMI as compared to the intervention at the 6-month assessment
(P=0.002); however, by 24 months, the difference between groups was not significant.
Spadaro and colleagues (2018) found the intervention group to have a significantly
lower BMI when compared to the comparison group at the 6-month assessment time
point (P=0.031). Anglin and colleagues (2013) as well as Miller and colleagues (2012)
found no significant difference between intervention and comparison groups at the time
points reported. One article by Miller and colleagues (2014) did not report on BMI
results.
Two of the six studies used a validated IE or ME measure (Mason et al., 2016;
Mensinger et al., 2016). Mensinger and colleagues (2016) used the IES, which resulted
in the intervention group having a significantly higher score on the IES when compared
to the comparison group (P=0.006); however, by the 24-month assessment, the
difference was no longer significant. Mason and colleagues (2016) measured ME with
the MEQ, which between group comparisons resulted in no significant change from
baseline to 6 months, a significant increase for the intervention group from baseline to
12 months (P=0.036), and no significant change from 6 to 12 months.
Risk of Bias
The modified Downs and Black Checklist was used to assess the methodological
quality of the included studies (Downs & Black, 1998). The majority of scores were low
with the highest score being 21 and the lowest score being 10. The average bias
assessment score was 13.6, which indicates a poor quality assessment rating. The
average score for the reporting category was 7.1 out of 11 points. The average score for
the external validity category was 0.27 out of 3 points. In regards to internal validity, the
bias category averaged to 3.1 out of 7 points, and the confounding category averaged
31
to 3.1 out of 6 points. For the power category, the average score was 0.27 out of 1
points.
DISCUSSION The purpose of this systematic review was to examine how ME and IE
interventions, evaluated using a randomized trial design, influence dietary intake in
individuals of varying weight status who did not have a diagnosis of an eating disorder.
Furthermore, to enhance understanding of how well the interventions influenced ME
and IE, ME and IE outcomes were reported when they were assessed with a validated
tool. The overall findings from the review resulted in the majority of studies, 10 studies
representing 11 articles out of the total 14 studies representing 15 articles, not finding
significant differences between intervention and comparison groups in energy intake
(Carmody et al., 2008; Cole & Horacek 2010; Daubenmier et al., 2012; Leblanc et al.,
2012; Miller et al., 2012; Miller et al., 2014; Spadaro et al., 2018), and diet quality (Cole
& Horacek 2010; Daubenmier et al., 2012; Ingraham et al., 2017; Järvelä-Reijonen,
2018; Leblanc et al., 2012; Mensinger et al., 2016; van Berkel et al., 2014). While not a
primary outcome of the review, weight and BMI outcomes were also examined in the
included studies. Similar to dietary outcomes, the majority of studies reporting on
weight and/or BMI also did not find significant differences between the ME or IE
intervention and the comparison groups (Anglin et al., 2013; Carmody et al., 2008; Cole
& Horacek 2010; Daubenmier et al., 2012; Leblanc et al., 2012; Miller et al., 2012; Miller
et al., 2014).
Of the 8 studies, representing 9 articles (Anglin et al., 2013; Carmody et al.,
2008; Cole & Horacek, 2010; Daubenmier et al., 2012; Leblanc et al., 2012; Miller et al.,
2012; Miller et al., 2014; Spadaro et al., 2018; Timmerman et al., 2012) that measured
energy intake, six studies, representing 7 articles, revealed no significant differences
(Carmody et al., 2008; Cole & Horacek, 2010; Daubenmier et al., 2012; Leblanc et al.,
2012; Miller et al., 2012; Miller et al., 2014; Spadaro et al., 2018). Only two studies
revealed significant differences (Anglin et al., 2013; Timmerman et al., 2012), which
were mixed. These results as a whole indicate that ME and IE interventions did not alter
energy intake.
32
Of the 12 studies, representing 13 articles (Carmody et al., 2008; Cole &
Horacek 2010; Daubenmier et al., 2012; Gardiner et al., 2017; Ingraham et al., 2017;
Järvelä-Reijonen, 2018; Leblanc et al., 2012; Mason et al., 2016; Mensinger et al.,
2016; Miller et al., 2012; Miller et al., 2014; Timmerman et al., 2012; van Berkel et al.,
2014), that measured diet quality, the majority of the studies, 7, found no significant
differences between the groups (Cole & Horacek 2010; Daubenmier et al., 2012;
Ingraham et al., 2017; Järvelä-Reijonen, 2018; Leblanc et al., 2012; Mensinger et al.,
2016; van Berkel et al., 2014). The significant differences seen among studies were
sparse as well as inconsistent, with some studies finding diet quality to be higher in the
intervention group (Carmody et al., 2008; Gardiner et al., 2017; Mason et al., 2016;
Timmerman et al., 2012) when compared to the comparison group and others finding
the opposite (Miller et al., 2012). For example, Miller and colleagues (2012) found a
significant decrease for the comparison group when compared to the intervention group
in total fat intake. In contrast, Timmerman and colleagues (2012) found a significantly
lower fat intake in the intervention group when compared to the comparison group.
However, when percent calories from fat was examined, all studies that measured this
variable did not find significant differences between the groups (Carmody et al., 2008;
Cole & Horacek, 2010; Daubenmier et al., 2012; Leblanc et al., 2012; Miller et al.,
2012). Thus, results as a whole indicate that ME and IE interventions did not alter diet
quality.
Though not the focus of this review, 11 studies, represented by 12 articles
measured weight or BMI (Anglin et al., 2013; Carmody et al., 2008; Cole & Horacek
2010; Daubenmier et al., 2012; Gardiner et al., 2017; Ingraham et al., 2017; Leblanc et
al., 2012; Mensinger et al., 2016; Miller et al., 2012; Miller et al., 2014; Spadaro et al.,
2018; Timmerman et al., 2012); however two of these studies did not report weight
outcomes (Gardiner et al., 2017; Ingraham et al., 2017), and four of these studies did
not report BMI outcomes (Carmody et al., 2008; Gardiner et al., 2017; Ingraham et al.,
2017; Timmerman et al., 2012). Five of the nine studies, representing 10 articles, that
measured weight and reported results did not find significant differences in weight
between intervention and comparison groups (Carmody et al., 2008; Cole & Horacek,
2010; Daubenmier et al., 2012; Leblanc et al., 2012; Miller et al., 2012; Miller et al.,
33
2014). As for BMI, five of the seven studies that measured and reported outcomes did
not find significant differences between groups (Anglin et al., 2013; Cole & Horacek et
al., 2010; Daubenmier et al., 2012; Leblanc et al., 2012; Miller et al., 2012). Of the
studies that found significant differences between groups in weight and/or BMI,
conclusions varied, with half seeing reductions in the intervention when compared to the
comparison group (Spadaro et al., 2018; Timmerman et al., 2012) and the other half
seeing reductions in the comparison group when compared to the intervention (Anglin et
al., 2013; Mensinger et al., 2016). Thus, results indicate ME and IE interventions did not
alter weight and BMI.
Only four of the 14 studies used ME or IE validated tools to measure ME or IE
differences between intervention and comparison groups. Two studies were ME
interventions (Ingraham et al., 2017; Mason et al., 2016) and two were IE interventions
(Järvelä-Reijonen, 2018; Mensinger et al., 2016). The IE interventions measured IE
through the IES (Tylka, 2006). One study did not find significant differences in IES
scores between groups (Järvelä-Reijonen, 2018). Mensinger and colleagues (2016)
showed a significantly higher IES score for the intervention group when compared to the
comparison group that was not maintained across time. The MEQ (Framson et al.,
2009) was used as the tool for the two ME interventions (Ingraham et al., 2017; Mason
et al., 2016). One study did not find significant differences in MEQ scores between
groups (Ingraham et al., 2017). Mason and colleagues (2016) revealed a significant
increase in ME for the intervention group when compared to the comparison group at
the 0 to 12 month assessment point; however, the 0 to 6 month and 6 to 12 month
assessment points did not reveal significant differences in ME. Thus, results indicate
the evaluated ME or IE interventions did not consistently increase ME or IE. The lack of
assessing ME or IE in the majority of the investigations, combined with the poor
outcomes regarding ME and IE in interventions designed to increase ME or IE, indicates
that it is not clear if an intervention has been designed that is efficacious regarding
enhancing ME and IE. Furthermore, even if changes in dietary intake were found
between the groups in the reviewed studies, as it is not clear that the ME or IE
intervention actually increased ME or IE, changes in dietary intake may not be a
consequence of ME or IE.
34
In comparison to other systematic reviews examining non-dieting approaches
and dietary intake (Clifford et al., 2015; Schaefer & Magnuson, 2014), results from this
review are similar. From Schaefer and Magnuson’s (2014) review, IE interventions did
not appear to influence dietary intake. While Clifford and colleagues (2015) found that
non-diet interventions enhanced psychological outcomes, such as depression, self-
esteem, and emotional well-being, results did not find that that these interventions
influenced dietary intake. Another finding from this investigation that is consistent
amongst previous reviews is the lack of ME or IE measurement in the investigations
(Anglin et al., 2013; Carmody et al., 2008; Cole & Horacek 2010; Daubenmier et al.,
2012; Gardiner et al., 2017; Leblanc et al., 2012; Miller et al., 2012; Miller et al., 2014;
Spadaro et al., 2018; Timmerman et al., 2012; van Berkel et al., 2014). In the previously
published reviews (Clifford et al., 2015; Schaefer & Magnuson, 2014), only one study
included in Clifford and colleagues’ (2015) review measured IE, which resulted in no
significant differences in IE total scores between the intervention and comparison group.
This investigation also found that the included studies were of poor quality in
regards to risk bias. In Schaefer and Magnuson’s (2014) review, risk of publication bias
was noted as only nine of the twenty studies were RCTs, and in Clifford and colleagues’
(2015) review, it was noted that all studies were included in their analysis that had a
comparison or control group, regardless of the design quality or mention of statistical
power. In regards to this review, the majority of the included studies showed a poor
(less than 14 points) quality assessment score through the modified Downs and Black
Checklist, indicating a high risk of bias among included studies. Investigations scored
poorly in every category of the checklist; however, the external validity (0.27 average
out of 3 points) and power (0.27 average out of 1 point) categories were consistently
low, thus affecting the overall average score. Furthermore, these interventions are not
of long duration; therefore it is difficult to determine if these interventions have long-term
effects on dietary intake. The majority of samples used in the investigations were small
and homogeneous, containing mostly females with overweight or obesity; therefore,
generalizability to other populations is limited. There was a lack of consistency of what
comprised an ME or IE intervention. For example, in this review, some ME or IE
interventions did not include a dietary goal, while others did. Lastly, most of the studies
35
included in this review, as well as other systematic reviews, did not measure ME or IE
with validated tools. Thus, it is not clear if the interventions were actually effective at
increasing ME or IE.
There were several strengths of this review. This review followed the PRISMA
guidelines, which included individual collection of studies that meet inclusion criteria,
formation of a summary table, and verifying key findings. This review also included
several sources to identify relevant articles that met inclusion criteria, PubMed, CINAHL
and PsycINFO databases. Another strength was examining only outcomes collected
from RCTs that included a comparison group. Though there are several strengths,
limitations of this systematic review exist. First, the search was limited to only articles
published in the English language. Second, dietary intake was assessed by self-
reported measures, which leaves margin for error in outcomes collected. Third, while
the review included RCTs, there were issues in methodology among included studies.
ME and IE interventions rely on the physiological signs of hunger and fullness to
control eating; however, these approaches may not be helpful for individuals with a
disease/condition that alters the “natural” cues of hunger and fullness. For example, in
thyroid disease, such as hyper- and hypothyroidism, appetite regulation can be altered
due to hormonal imbalances (Amin et al., 2011). In hyperthyroidism, the overactive
thyroid hormones can act on the hypothalamus and stimulate the feeling of hunger, thus
altering the “natural” cue of hunger. The same type of mechanism occurs in
hypothyroidism, the lack of thyroid hormone production suppresses the feeling of
hunger, thus resulting in lack of appetite and no desire to eat (Amin et al., 2011).
Another example would be in individuals with diabetes. A side effect of high blood
glucose levels (hyperglycemia) is polyphagia, an increased sensation of hunger.
Advising an individual with diabetes to rely on physiological cues of hunger or fullness to
determine eating could mislead an individual into thinking they are hungry when they
actually are not (Ramachandran, 2014). Additionally, apart from the presence of
disease, lifestyle habits, such as lack of sleep, can alter the physiological feelings of
hunger and fullness (Knutson & Van Cauter, 2008). Lack of sleep can result in an
increase in the hunger hormone, ghrelin, and a decrease in the fullness hormone, leptin,
thus resulting in an increase in appetite, despite the body’s “natural” cue of hunger. The
36
mechanism behind the increase in ghrelin is thought to be due to lack of sleep
increasing stress and increasing orexinergic activity in the hypothalamus of the brain,
which results in the decrease in leptin and increase in ghrelin (Knutson & Van Cauter,
2008). Thus, when appetite regulation is altered/defected, ME and IE interventions may
not be appropriate.
Overall, this review identified key areas of future research needs in the area of
ME and IE interventions and their influence on dietary intake. Future research needs to
include process evaluation methods in order to determine intervention implementation.
In addition, the use of validated tools for measurements of ME and IE are needed.
Lastly, future interventions need to apply consistent intervention implementation, be of
longer duration, contain heterogeneous samples, and contain larger sample sizes.
Without the measurement of ME or IE, it is hard to conclude whether participants adopt
the ME and IE approaches, and what effect these interventions have on dietary intake.
In addition, the variation of implementation among interventions also influences
conclusions due to the inconsistencies of interventions applying dietary goals (i.e., some
interventions include dietary goals while others do not). While these interventions are
based upon the principal that being more attune with one’s body will result in change,
particularly enhancements in diet quality and reductions in excessive energy intake,
(Kabat-Zinn, 2015; Tribole & Resch, 1995), at this time evidence suggests that ME and
IE interventions do not influence dietary intake.

37
LIST OF REFERENCES
38
Adult Obesity Facts | Overweight & Obesity | CDC. (2018, August 14). Retrieved
December 21, 2018, from https://www.cdc.gov/obesity/data/adult.html
Amin, A., Dhillo, W. S., & Murphy, K. G. (2011). The central effects of thyroid hormones
on appetite. Journal of Thyroid Research, 2011.
https://doi.org/10.4061/2011/306510
Anglin, J. C., Borchardt, N., Ramos, E., & Mhoon, K. (2013). Diet quality of adults using
intuitive eating for weight loss – pilot study. Nutrition and Health, 22(3–4), 255–
264. https://doi.org/10.1177/0260106015601943
Bilman, E., Kleef, E. van, & Trijp, H. van. (2017). External cues challenging the internal
appetite control system — overview and practical implications. Critical Reviews in
Food Science and Nutrition, 57(13), 2825–2834.
https://doi.org/10.1080/10408398.2015.1073140
Boucher, S., Edwards, O., Gray, A., Nada-Raja, S., Lillis, J., Tylka, T. L., & Horwath, C.
C. (2016). Teaching intuitive eating and acceptance and commitment therapy skills
via a web-based intervention: a pilot single-arm intervention study. JMIR Research
Protocols, 5(4). https://doi.org/10.2196/resprot.5861
Bruce, L. J., & Ricciardelli, L. A. (2016). A systematic review of the psychosocial
correlates of intuitive eating among adult women. Appetite, 96, 454–472.
https://doi.org/10.1016/j.appet.2015.10.012
Carmody, J., Olendzki, B., Reed, G., Andersen, V., & Rosenzweig, P. (2008). A Dietary
Intervention for recurrent prostate cancer after definitive primary treatment: results
of a randomized pilot trial. Urology, 72(6), 1324–1328.
https://doi.org/10.1016/j.urology.2008.01.015
Clifford, D., Ozier , A., Bundros, J., Moore, J., Kreiser, A., & Neyman Morris, M. (2015).
Impact of non-diet approaches on attitudes, behaviors, and health outcomes: a
systematic review. Journal of Nutrition Education and Behavior, 47(2), 143-155.e1.
https://doi.org/10.1016/j.jneb.2014.12.002
Cole, R. E., & Horacek, T. (2010, May). Effectiveness of the my body knows when
intuitive-eating pilot program [Text]. https://doi.org/info:doi/10.5993/AJHB.34.3.4
Daubenmier, J., Lin, J., Blackburn, E., Hecht, F. M., Kristeller, J., Maninger, N., … Epel,
E. (2012). Changes in stress, eating, and metabolic factors are related to changes
39
in telomerase activity in a randomized mindfulness intervention pilot study.
Psychoneuroendocrinology, 37(7), 917–928.
https://doi.org/10.1016/j.psyneuen.2011.10.008
Daubenmier, J., Moran, P. J., Kristeller, J., Acree, M., Bacchetti, P., Kemeny, M. E., …
Hecht, F. M. (2016). Effects of a mindfulness-based weight loss intervention in
adults with obesity: a randomized clinical trial. Obesity (Silver Spring, Md.), 24(4),
794–804. https://doi.org/10.1002/oby.21396
Downs, S. H., & Black, N. (1998). The feasibility of creating a checklist for the
assessment of the methodological quality both of randomized and non-randomized
studies of health care interventions. Journal of Epidemiology and Community
Health, 52(6), 377–384.
Forman, E. M., & Butryn, M. L. (2015). A new look at the science of weight control: how
acceptance and commitment strategies can address the challenge of self-
regulation. Appetite, 84, 171–180. https://doi.org/10.1016/j.appet.2014.10.004
Framson, C., Kristal, A. R., Schenk, J., Littman, A. J., Zeliadt, S., & Benitez, D. (2009).
Development and validation of the mindful eating questionnaire. Journal of the
American Dietetic Association, 109(8), 1439–1444.
https://doi.org/10.1016/j.jada.2009.05.006
Gardiner, P. M., McCue, K. D., Negash, L. M., Cheng, T., White, L. F., Yinusa-
Nyahkoon, L., … Bickmore, T. W. (2017). Engaging women with an embodied
conversational agent to deliver mindfulness and lifestyle recommendations: a
feasibility randomized control trial. Patient Education and Counseling, 100(9),
1720–1729. https://doi.org/10.1016/j.pec.2017.04.015
Gast, J., & Hawks, S. R. (1998). Weight loss education: the challenge of a new
paradigm. Health Education & Behavior, 25(4), 464–473.
https://doi.org/10.1177/109019819802500405
Godfrey, K. M., Gallo, L. C., & Afari, N. (2015). Mindfulness-based interventions for
binge eating: a systematic review and meta-analysis. Journal of Behavioral
Medicine, 38(2), 348–362. https://doi.org/10.1007/s10865-014-9610-5
40
Hawks, S., Merrill, R. M., & Madanat, H. N. (2004). The intuitive eating scale:
development and preliminary validation. American Journal of Health Education,
35(2), 90–99. https://doi.org/10.1080/19325037.2004.10603615
Herman, C. P., & Polivy, J. (1983). A boundary model for the regulation of eating.
Psychiatric Annals, 13(12), 918–927. https://doi.org/10.3928/0048-5713-19831201-
03
Hofmann, S. G., Sawyer, A. T., Witt, A. A., & Oh, D. (2010). The effect of mindfulness-
based therapy on anxiety and depression: a meta-analytic review. Journal of
Consulting and Clinical Psychology, 78(2), 169–183.
https://doi.org/10.1037/a0018555
Hoogendijk, E. O., Deeg, D. J. H., Poppelaars, J., van der Horst, M., Broese van
Groenou, M. I., Comijs, H. C., … Huisman, M. (2016). The longitudinal aging study
amsterdam: cohort update 2016 and major findings. European Journal of
Epidemiology, 31(9), 927–945. https://doi.org/10.1007/s10654-016-0192-0
Hulbert-Williams, L., Nicholls, W., Joy, J., & Hulbert-Williams, N. (2014). Initial validation
of the mindful eating scale. Mindfulness, 5(6), 719–729.
https://doi.org/10.1007/s12671-013-0227-5
Ingraham, N., Harbatkin, D., Lorvick, J., Plumb, M., & Minnis, A. M. (2017). Women’s
health and mindfulness (WHAM): a randomized intervention among older
lesbian/bisexual women. Health Promotion Practice, 18(3), 348–357.
https://doi.org/10.1177/1524839916670874
Järvelä-Reijonen, E., Karhunen, L., Sairanen, E., Muotka, J., Lindroos, S., Laitinen, J.,
… Kolehmainen, M. (2018). The effects of acceptance and commitment therapy on
eating behavior and diet delivered through face-to-face contact and a mobile app:
a randomized controlled trial. The International Journal of Behavioral Nutrition and
Physical Activity, 15. https://doi.org/10.1186/s12966-018-0654-8
Kabat-Zinn, J. (2015). Mindfulness. Mindfulness, 6(6), 1481–1483.
https://doi.org/10.1007/s12671-015-0456-x
Kennedy, E. T., Ohls, J., Carlson, S., & Fleming, K. (1995). The healthy eating index:
design and applications. Journal of the American Dietetic Association, 95(10),
1103–1108. https://doi.org/10.1016/S0002-8223(95)00300-2
41
Knutson, K. L., & Van Cauter, E. (2008). Associations between sleep loss and
increased risk of obesity and diabetes. Annals of the New York Academy of
Sciences, 1129, 287–304. https://doi.org/10.1196/annals.1417.033
Kristal, A. R., Littman, A. J., Benitez, D., & White, E. (2005). Yoga practice is associated
with attenuated weight gain in healthy, middle-aged men and women. Alternative
Therapies in Health and Medicine, 11(4), 28–33.
Kristeller, J. L., & Wolever, R. Q. (2010). Mindfulness-based eating awareness training
for treating binge eating disorder: the conceptual foundation. Eating Disorders,
19(1), 49–61. https://doi.org/10.1080/10640266.2011.533605
Leblanc, V., Provencher, V., Bégin, C., Corneau, L., Tremblay, A., & Lemieux, S.
(2012). Impact of a health-at-every-size intervention on changes in dietary intakes
and eating patterns in premenopausal overweight women: Results of a randomized
trial. Clinical Nutrition, 31(4), 481–488. https://doi.org/10.1016/j.clnu.2011.12.013
Martz, D. M., Sturgis, E. T., & Gustafson, S. B. (1996). Development and preliminary
validation of the cognitive behavioral dieting scale. International Journal of Eating
Disorders, 19(3), 297–309. https://doi.org/10.1002/(SICI)1098-
108X(199604)19:3<297::AID-EAT9>3.0.CO;2-H
Mason, A. E., Epel, E. S., Kristeller, J., Moran, P. J., Dallman, M., Lustig, R. H., …
Daubenmier, J. (2016). Effects of a mindfulness-based intervention on mindful
eating, sweets consumption, and fasting glucose levels in obese adults: data from
the SHINE randomized controlled trial. Journal of Behavioral Medicine, 39(2), 201–
213. https://doi.org/10.1007/s10865-015-9692-8
Mensinger, J. L., Calogero, R. M., Stranges, S., & Tylka, T. L. (2016). A weight-neutral
versus weight-loss approach for health promotion in women with high BMI: a
randomized-controlled trial. Appetite, 105, 364–374.
https://doi.org/10.1016/j.appet.2016.06.006
Miller, C. K., Kristeller, J. L., Headings, A., & Nagaraja, H. (2014). Comparison of a
mindful eating intervention to a diabetes self-management intervention among
adults with type 2 diabetes: a randomized controlled trial. Health Education &
Behavior : The Official Publication of the Society for Public Health Education,
41(2), 145–154. https://doi.org/10.1177/1090198113493092
42
Miller, C. K., Kristeller, J. L., Headings, A., Nagaraja, H., & Miser, W. F. (2012).
Comparative effectiveness of a mindful eating intervention to a diabetes self-
management intervention among adults with type 2 diabetes: a pilot study. Journal
of the Academy of Nutrition and Dietetics, 112(11), 1835–1842.
https://doi.org/10.1016/j.jand.2012.07.036
Moher, D., Liberati, A., Tetzlaff, J., & Altman, D. G. (2009). Preferred reporting items for
systematic reviews and meta-analyses: the PRISMA statement. PLoS Medicine,
6(7). https://doi.org/10.1371/journal.pmed.1000097
Nelson, J. B. (2017). Mindful eating: the art of presence while you eat. Diabetes
Spectrum : A Publication of the American Diabetes Association, 30(3), 171–174.
https://doi.org/10.2337/ds17-0015
Noonan, S. (2014). Mindfulness-based stress reduction. The Canadian Veterinary
Journal, 55(2), 134–135.
O’Connor, S. R., Tully, M. A., Ryan, B., Bradley, J. M., Baxter, G. D., & McDonough, S.
M. (2015). Failure of a numerical quality assessment scale to identify potential risk
of bias in a systematic review: a comparison study. BMC Research Notes, 8.
https://doi.org/10.1186/s13104-015-1181-1
Olson, K. L., & Emery, C. F. (2015). Mindfulness and weight loss: a systematic review.
Psychosomatic Medicine, 77(1), 59–67.
https://doi.org/10.1097/PSY.0000000000000127
Posner, M., & Snyder, C. (1975). Attention and Cogntive Control. In R. L. Solso (Ed.),
Information Processing and Cognition (pp. 55–85).
Ramachandran, A. (2014). Know the signs and symptoms of diabetes. The Indian
Journal of Medical Research, 140(5), 579–581.
Schaefer, J. T., & Magnuson, A. B. (2014). A review of interventions that promote eating
by internal cues. Journal of the Academy of Nutrition and Dietetics, 114(5), 734–
760. https://doi.org/10.1016/j.jand.2013.12.024
Spadaro, K. C., Davis, K. K., Sereika, S. M., Gibbs, B. B., Jakicic, J. M., & Cohen, S. M.
(2018). Effect of mindfulness meditation on short-term weight loss and eating
behaviors in overweight and obese adults: A randomized controlled trial. Journal of
43
Complementary and Integrative Medicine, 15(2). https://doi.org/10.1515/jcim-2016-
0048
Strauss, M. E., & Smith, G. T. (2009). Construct validity: advances in theory and
methodology. Annual Review of Clinical Psychology, 5, 1–25.
https://doi.org/10.1146/annurev.clinpsy.032408.153639
Tavakol, M., & Dennick, R. (2011). Making sense of Cronbach’s alpha. International
Journal of Medical Education, 2, 53–55. https://doi.org/10.5116/ijme.4dfb.8dfd
Timmerman, G. M., & Brown, A. (2012). The effect of a mindful restaurant eating
intervention on weight management in women. Journal of Nutrition Education and
Behavior, 44(1), 22–28. https://doi.org/10.1016/j.jneb.2011.03.143
Tribole, E., & Resch, E. (1995). Intuitive eating: a recovery book for the chronic dieter.
New York: St. Martin’s Press.
Tylka, T. L. (2006). Development and psychometric evaluation of a measure of intuitive
eating. Journal of Counseling Psychology, 53(2), 226–240.
https://doi.org/10.1037/0022-0167.53.2.226
Tylka, T. L., & Kroon Van Diest, A. (2013). The intuitive eating scale–2: item refinement
and psychometric evaluation with college women and men. Journal of Counseling
Psychology, 60(1), 137–153. https://doi.org/10.1037/a0030893
US Department of Health and Human Services; US Department of Agriculture. (2015).
2015-2020 Dietary Guidelines for Americans. 8th ed. Washington, DC: US Dept of
Health and Human Services. Retrieved from https://health.gov/DietaryGuidelines/
van Berkel, J., Boot, C. R., Proper, K. I., Bongers, P. M., & van der Beek, A. J. (2014).
Effectiveness of a worksite mindfulness-based multi-component intervention on
lifestyle behaviors. International Journal of Behavioral Nutrition and Physical
Activity, 11(1), 9. https://doi.org/10.1186/1479-5868-11-9
Wardle, J. (1988). Cognitive control of eating. Journal of Psychosomatic Research,
32(6), 607–612. https://doi.org/10.1016/0022-3999(88)90009-8
Winkens, L. H. H., van Strien, T., Barrada, J. R., Brouwer, I. A., Penninx, B. W. J. H., &
Visser, M. (2018). The mindful eating behavior scale: development and
psychometric properties in a sample of dutch adults aged 55 years and older.

44
Journal of the Academy of Nutrition and Dietetics, 118(7), 1277-1290.e4.
https://doi.org/10.1016/j.jand.2018.01.015

45
APPENDICES
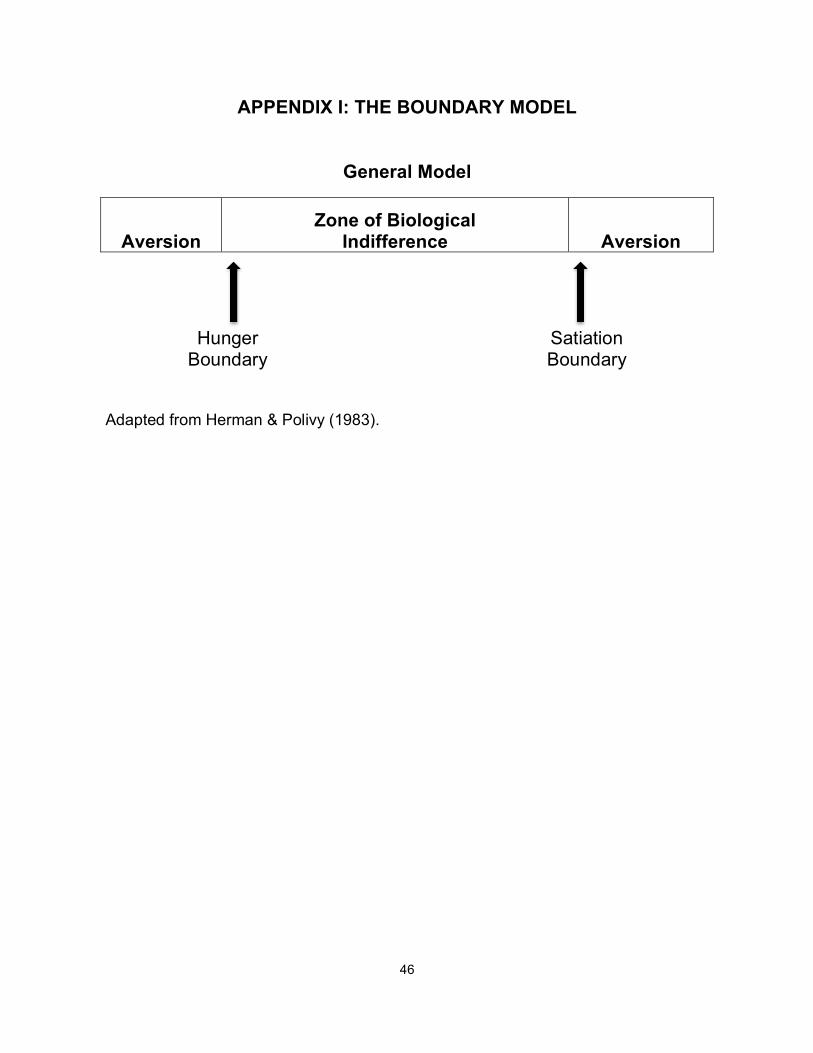
46
APPENDIX I: THE BOUNDARY MODEL
General Model
Aversion Zone of Biological
Indifference Aversion
Hunger Boundary
Satiation Boundary
Adapted from Herman & Polivy (1983).
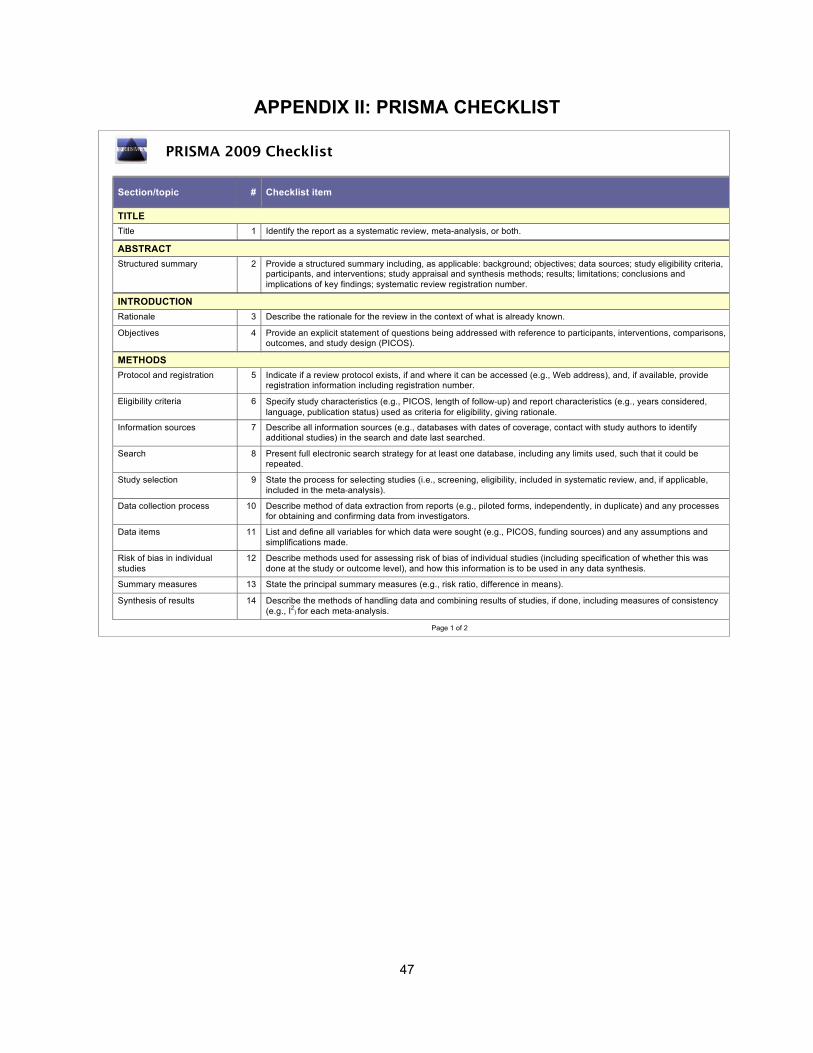
47
APPENDIX II: PRISMA CHECKLIST
PRISMA 2009 Checklist
Section/topic # Checklist item Reported on page #
TITLE Title 1 Identify the report as a systematic review, meta-analysis, or both. ABSTRACT Structured summary 2 Provide a structured summary including, as applicable: background; objectives; data sources; study eligibility criteria,
participants, and interventions; study appraisal and synthesis methods; results; limitations; conclusions and implications of key findings; systematic review registration number.
INTRODUCTION Rationale 3 Describe the rationale for the review in the context of what is already known. Objectives 4 Provide an explicit statement of questions being addressed with reference to participants, interventions, comparisons,
outcomes, and study design (PICOS).
METHODS Protocol and registration 5 Indicate if a review protocol exists, if and where it can be accessed (e.g., Web address), and, if available, provide
registration information including registration number.
Eligibility criteria 6 Specify study characteristics (e.g., PICOS, length of follow-up) and report characteristics (e.g., years considered, language, publication status) used as criteria for eligibility, giving rationale.
Information sources 7 Describe all information sources (e.g., databases with dates of coverage, contact with study authors to identify additional studies) in the search and date last searched.
Search 8 Present full electronic search strategy for at least one database, including any limits used, such that it could be repeated.
Study selection 9 State the process for selecting studies (i.e., screening, eligibility, included in systematic review, and, if applicable, included in the meta-analysis).
Data collection process 10 Describe method of data extraction from reports (e.g., piloted forms, independently, in duplicate) and any processes for obtaining and confirming data from investigators.
Data items 11 List and define all variables for which data were sought (e.g., PICOS, funding sources) and any assumptions and simplifications made.
Risk of bias in individual studies
12 Describe methods used for assessing risk of bias of individual studies (including specification of whether this was done at the study or outcome level), and how this information is to be used in any data synthesis.
Summary measures 13 State the principal summary measures (e.g., risk ratio, difference in means). Synthesis of results 14 Describe the methods of handling data and combining results of studies, if done, including measures of consistency
(e.g., I2) for each meta-analysis.
Page 1 of 2
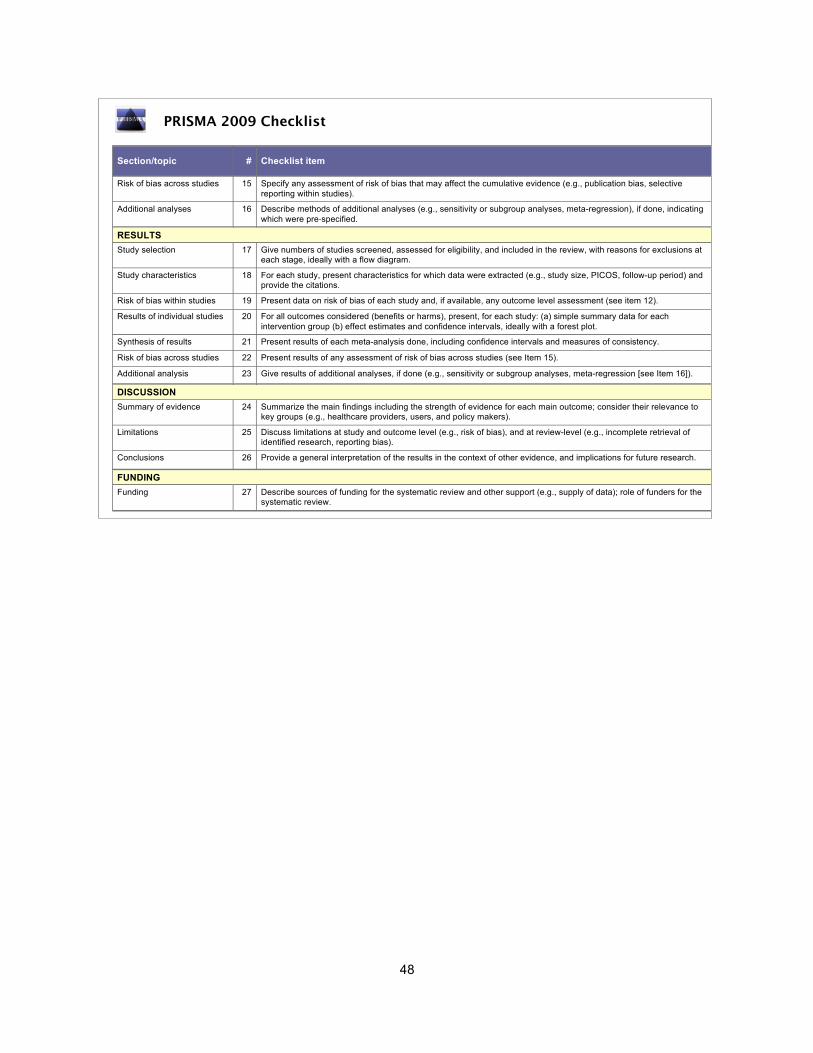
48
PRISMA 2009 Checklist
Section/topic # Checklist item Reported on page #
Risk of bias across studies 15 Specify any assessment of risk of bias that may affect the cumulative evidence (e.g., publication bias, selective reporting within studies).
Additional analyses 16 Describe methods of additional analyses (e.g., sensitivity or subgroup analyses, meta-regression), if done, indicating which were pre-specified.
RESULTS Study selection 17 Give numbers of studies screened, assessed for eligibility, and included in the review, with reasons for exclusions at
each stage, ideally with a flow diagram.
Study characteristics 18 For each study, present characteristics for which data were extracted (e.g., study size, PICOS, follow-up period) and provide the citations.
Risk of bias within studies 19 Present data on risk of bias of each study and, if available, any outcome level assessment (see item 12). Results of individual studies 20 For all outcomes considered (benefits or harms), present, for each study: (a) simple summary data for each
intervention group (b) effect estimates and confidence intervals, ideally with a forest plot.
Synthesis of results 21 Present results of each meta-analysis done, including confidence intervals and measures of consistency. Risk of bias across studies 22 Present results of any assessment of risk of bias across studies (see Item 15). Additional analysis 23 Give results of additional analyses, if done (e.g., sensitivity or subgroup analyses, meta-regression [see Item 16]).
DISCUSSION Summary of evidence 24 Summarize the main findings including the strength of evidence for each main outcome; consider their relevance to
key groups (e.g., healthcare providers, users, and policy makers).
Limitations 25 Discuss limitations at study and outcome level (e.g., risk of bias), and at review-level (e.g., incomplete retrieval of identified research, reporting bias).
Conclusions 26 Provide a general interpretation of the results in the context of other evidence, and implications for future research.
FUNDING Funding 27 Describe sources of funding for the systematic review and other support (e.g., supply of data); role of funders for the
systematic review.
From: Moher D, Liberati A, Tetzlaff J, Altman DG, The PRISMA Group (2009). Preferred Reporting Items for Systematic Reviews and Meta-Analyses: The PRISMA Statement. PLoS Med 6(7): e1000097. doi:10.1371/journal.pmed1000097
For more information, visit: www.prisma-statement.org.
Page 2 of 2
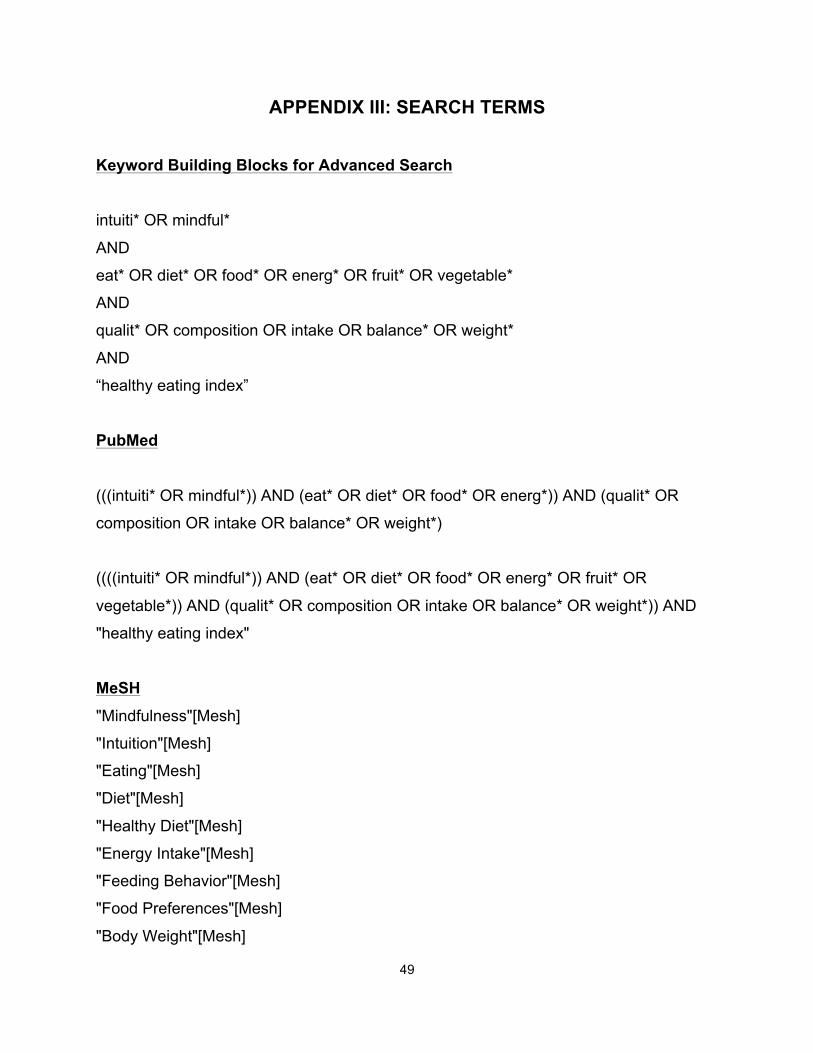
49
APPENDIX III: SEARCH TERMS
Keyword Building Blocks for Advanced Search intuiti* OR mindful*
AND
eat* OR diet* OR food* OR energ* OR fruit* OR vegetable*
AND
qualit* OR composition OR intake OR balance* OR weight*
AND
“healthy eating index”
PubMed
(((intuiti* OR mindful*)) AND (eat* OR diet* OR food* OR energ*)) AND (qualit* OR
composition OR intake OR balance* OR weight*)
((((intuiti* OR mindful*)) AND (eat* OR diet* OR food* OR energ* OR fruit* OR
vegetable*)) AND (qualit* OR composition OR intake OR balance* OR weight*)) AND
"healthy eating index"
MeSH "Mindfulness"[Mesh]
"Intuition"[Mesh]
"Eating"[Mesh]
"Diet"[Mesh]
"Healthy Diet"[Mesh]
"Energy Intake"[Mesh]
"Feeding Behavior"[Mesh]
"Food Preferences"[Mesh]
"Body Weight"[Mesh]
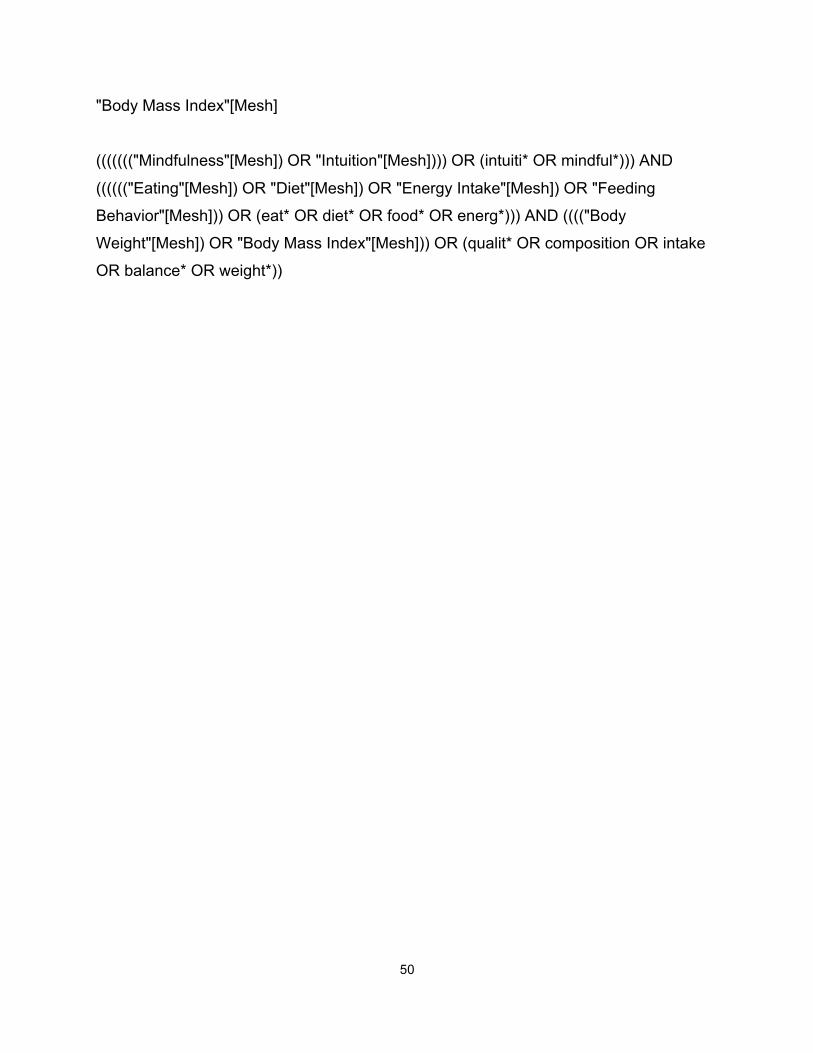
50
"Body Mass Index"[Mesh]
((((((("Mindfulness"[Mesh]) OR "Intuition"[Mesh]))) OR (intuiti* OR mindful*))) AND
(((((("Eating"[Mesh]) OR "Diet"[Mesh]) OR "Energy Intake"[Mesh]) OR "Feeding
Behavior"[Mesh])) OR (eat* OR diet* OR food* OR energ*))) AND (((("Body
Weight"[Mesh]) OR "Body Mass Index"[Mesh])) OR (qualit* OR composition OR intake
OR balance* OR weight*))
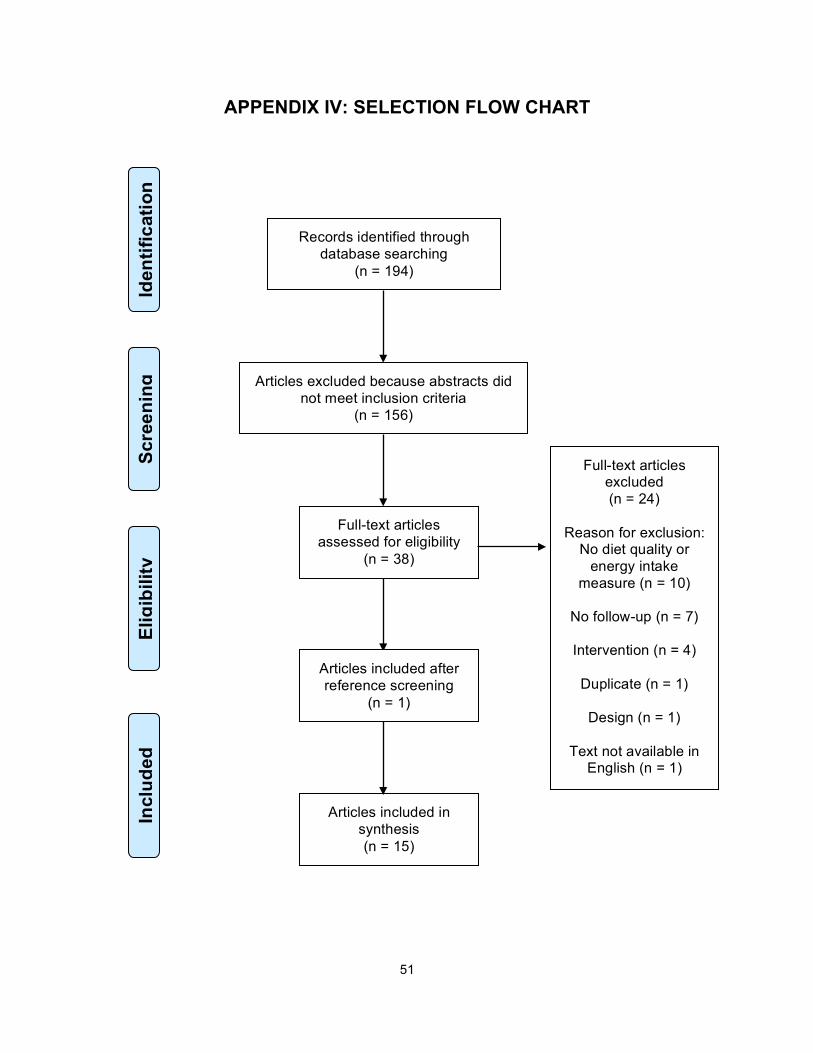
51
APPENDIX IV: SELECTION FLOW CHART
Records identified through database searching
(n = 194)
Scre
enin
g In
clud
ed
Elig
ibili
ty
Iden
tific
atio
n
Articles excluded because abstracts did not meet inclusion criteria
(n = 156)
Full-text articles assessed for eligibility
(n = 38)
Full-text articles excluded (n = 24)
Reason for exclusion:
No diet quality or energy intake
measure (n = 10)
No follow-up (n = 7)
Intervention (n = 4)
Duplicate (n = 1)
Design (n = 1)
Text not available in English (n = 1)
Articles included in synthesis (n = 15)
Articles included after reference screening
(n = 1)
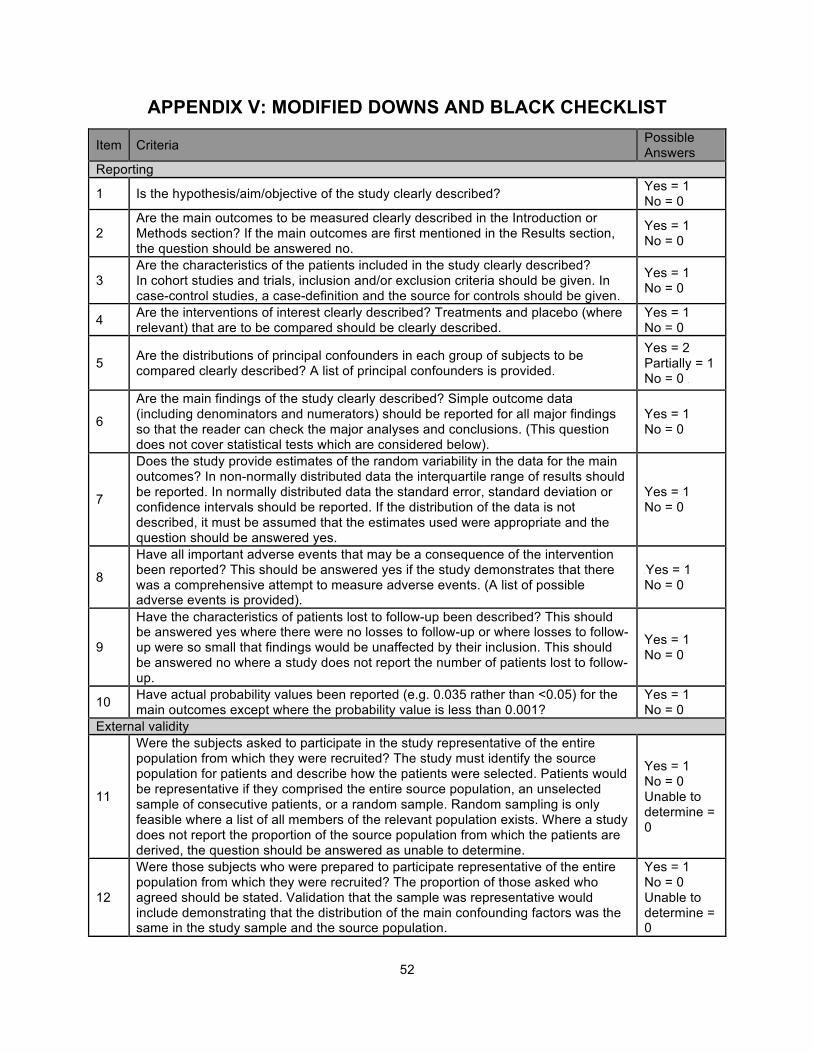
52
APPENDIX V: MODIFIED DOWNS AND BLACK CHECKLIST
Item Criteria Possible Answers
Reporting
1 Is the hypothesis/aim/objective of the study clearly described? Yes = 1 No = 0
2 Are the main outcomes to be measured clearly described in the Introduction or Methods section? If the main outcomes are first mentioned in the Results section, the question should be answered no.
Yes = 1 No = 0
3 Are the characteristics of the patients included in the study clearly described? In cohort studies and trials, inclusion and/or exclusion criteria should be given. In case-control studies, a case-definition and the source for controls should be given.
Yes = 1 No = 0
4 Are the interventions of interest clearly described? Treatments and placebo (where relevant) that are to be compared should be clearly described.
Yes = 1 No = 0
5 Are the distributions of principal confounders in each group of subjects to be compared clearly described? A list of principal confounders is provided.
Yes = 2 Partially = 1 No = 0
6
Are the main findings of the study clearly described? Simple outcome data (including denominators and numerators) should be reported for all major findings so that the reader can check the major analyses and conclusions. (This question does not cover statistical tests which are considered below).
Yes = 1 No = 0
7
Does the study provide estimates of the random variability in the data for the main outcomes? In non-normally distributed data the interquartile range of results should be reported. In normally distributed data the standard error, standard deviation or confidence intervals should be reported. If the distribution of the data is not described, it must be assumed that the estimates used were appropriate and the question should be answered yes.
Yes = 1 No = 0
8
Have all important adverse events that may be a consequence of the intervention been reported? This should be answered yes if the study demonstrates that there was a comprehensive attempt to measure adverse events. (A list of possible adverse events is provided).
Yes = 1 No = 0
9
Have the characteristics of patients lost to follow-up been described? This should be answered yes where there were no losses to follow-up or where losses to follow-up were so small that findings would be unaffected by their inclusion. This should be answered no where a study does not report the number of patients lost to follow-up.
Yes = 1 No = 0
10 Have actual probability values been reported (e.g. 0.035 rather than <0.05) for the main outcomes except where the probability value is less than 0.001?
Yes = 1 No = 0
External validity
11
Were the subjects asked to participate in the study representative of the entire population from which they were recruited? The study must identify the source population for patients and describe how the patients were selected. Patients would be representative if they comprised the entire source population, an unselected sample of consecutive patients, or a random sample. Random sampling is only feasible where a list of all members of the relevant population exists. Where a study does not report the proportion of the source population from which the patients are derived, the question should be answered as unable to determine.
Yes = 1 No = 0 Unable to determine = 0
12
Were those subjects who were prepared to participate representative of the entire population from which they were recruited? The proportion of those asked who agreed should be stated. Validation that the sample was representative would include demonstrating that the distribution of the main confounding factors was the same in the study sample and the source population.
Yes = 1 No = 0 Unable to determine = 0

53
13
Were the staff, places, and facilities where the patients were treated, representative of the treatment the majority of patients receive? For the question to be answered yes the study should demonstrate that the intervention was representative of that in use in the source population. The question should be answered no if, for example, the intervention was undertaken in a specialist centre unrepresentative of the hospitals most of the source population would attend.
Yes = 1 No = 0 Unable to determine = 0
Internal validity - bias
14 Was an attempt made to blind study subjects to the intervention they have received? For studies where the patients would have no way of knowing which intervention they received, this should be answered yes.
Yes = 1 No = 0 Unable to determine = 0
15 Was an attempt made to blind those measuring the main outcomes of the intervention?
Yes = 1 No = 0 Unable to determine = 0
16
If any of the results of the study were based on “data dredging”, was this made clear? Any analyses that had not been planned at the outset of the study should be clearly indicated. If no retrospective unplanned subgroup analyses were reported, then answer yes.
Yes = 1 No = 0 Unable to determine = 0
17
In trials and cohort studies, do the analyses adjust for different lengths of follow-up of patients, or in case-control studies, is the time period between the intervention and outcome the same for cases and controls? Where follow-up was the same for all study patients the answer should be yes. If different lengths of follow-up were adjusted for by, for example, survival analysis the answer should be yes. Studies where differences in follow-up are ignored should be answered no.
Yes = 1 No = 0 Unable to determine = 0
18
Were the statistical tests used to assess the main outcomes appropriate? The statistical techniques used must be appropriate to the data. For example nonparametric methods should be used for small sample sizes. Where little statistical analysis has been undertaken but where there is no evidence of bias, the question should be answered yes. If the distribution of the data (normal or not) is not described it must be assumed that the estimates used were appropriate and the question should be answered yes.
Yes = 1 No = 0 Unable to determine = 0
19
Was compliance with the intervention/s reliable? Where there was non- compliance with the allocated treatment or where there was contamination of one group, the question should be answered no. For studies where the effect of any misclassification was likely to bias any association to the null, the question should be answered yes.
Yes = 1 No = 0 Unable to determine = 0
20
Were the main outcome measures used accurate (valid and reliable)? For studies where the outcome measures are clearly described, the question should be answered yes. For studies which refer to other work or that demonstrates the outcome measures are accurate, the question should be answered as yes.
Yes = 1 No = 0 Unable to determine = 0
Internal validity - confounding (selection bias)
21
Were the patients in different intervention groups (trials and cohort studies) or were the cases and controls (case-control studies) recruited from the same population? For example, patients for all comparison groups should be selected from the same hospital. The question should be answered unable to determine for cohort and case-control studies where there is no information concerning the source of patients included in the study.
Yes = 1 No = 0 Unable to determine = 0
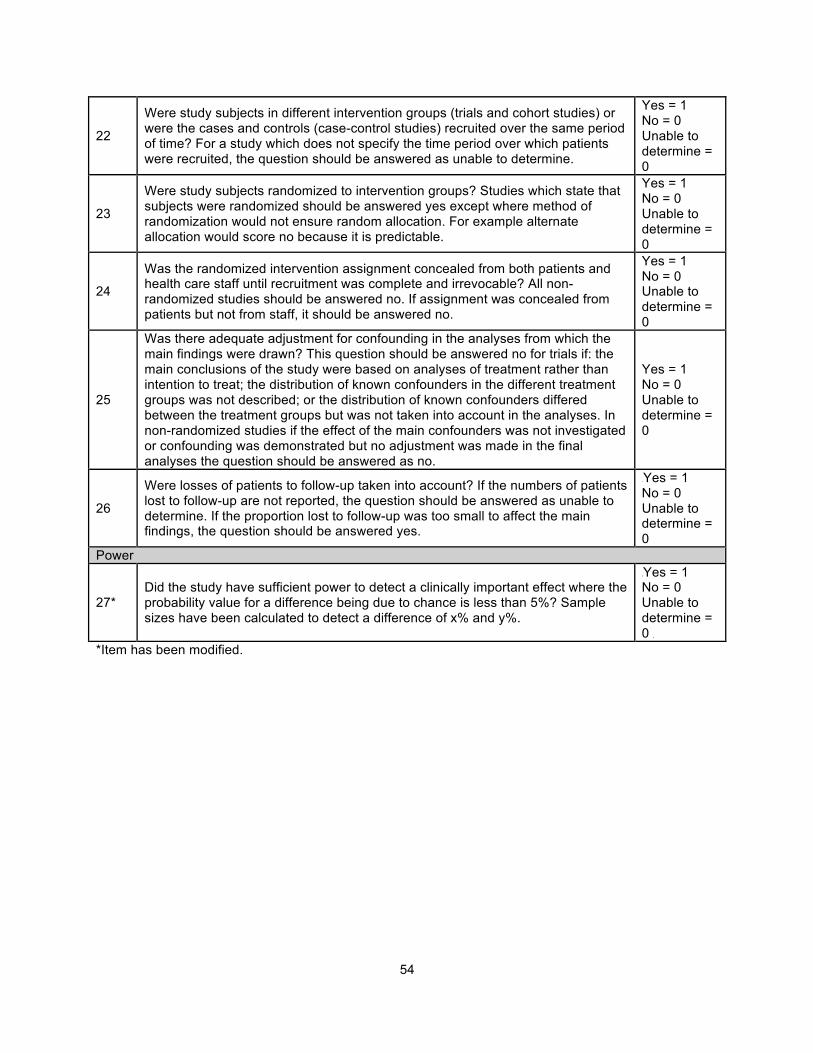
54
22
Were study subjects in different intervention groups (trials and cohort studies) or were the cases and controls (case-control studies) recruited over the same period of time? For a study which does not specify the time period over which patients were recruited, the question should be answered as unable to determine.
Yes = 1 No = 0 Unable to determine = 0
23
Were study subjects randomized to intervention groups? Studies which state that subjects were randomized should be answered yes except where method of randomization would not ensure random allocation. For example alternate allocation would score no because it is predictable.
Yes = 1 No = 0 Unable to determine = 0
24
Was the randomized intervention assignment concealed from both patients and health care staff until recruitment was complete and irrevocable? All non- randomized studies should be answered no. If assignment was concealed from patients but not from staff, it should be answered no.
Yes = 1 No = 0 Unable to determine = 0
25
Was there adequate adjustment for confounding in the analyses from which the main findings were drawn? This question should be answered no for trials if: the main conclusions of the study were based on analyses of treatment rather than intention to treat; the distribution of known confounders in the different treatment groups was not described; or the distribution of known confounders differed between the treatment groups but was not taken into account in the analyses. In non-randomized studies if the effect of the main confounders was not investigated or confounding was demonstrated but no adjustment was made in the final analyses the question should be answered as no.
Yes = 1 No = 0 Unable to determine = 0
26
Were losses of patients to follow-up taken into account? If the numbers of patients lost to follow-up are not reported, the question should be answered as unable to determine. If the proportion lost to follow-up was too small to affect the main findings, the question should be answered yes.
Yes = 1 No = 0 Unable to determine = 0
Power
27* Did the study have sufficient power to detect a clinically important effect where the probability value for a difference being due to chance is less than 5%? Sample sizes have been calculated to detect a difference of x% and y%.
Yes = 1 No = 0 Unable to determine = 0
*Item has been modified.
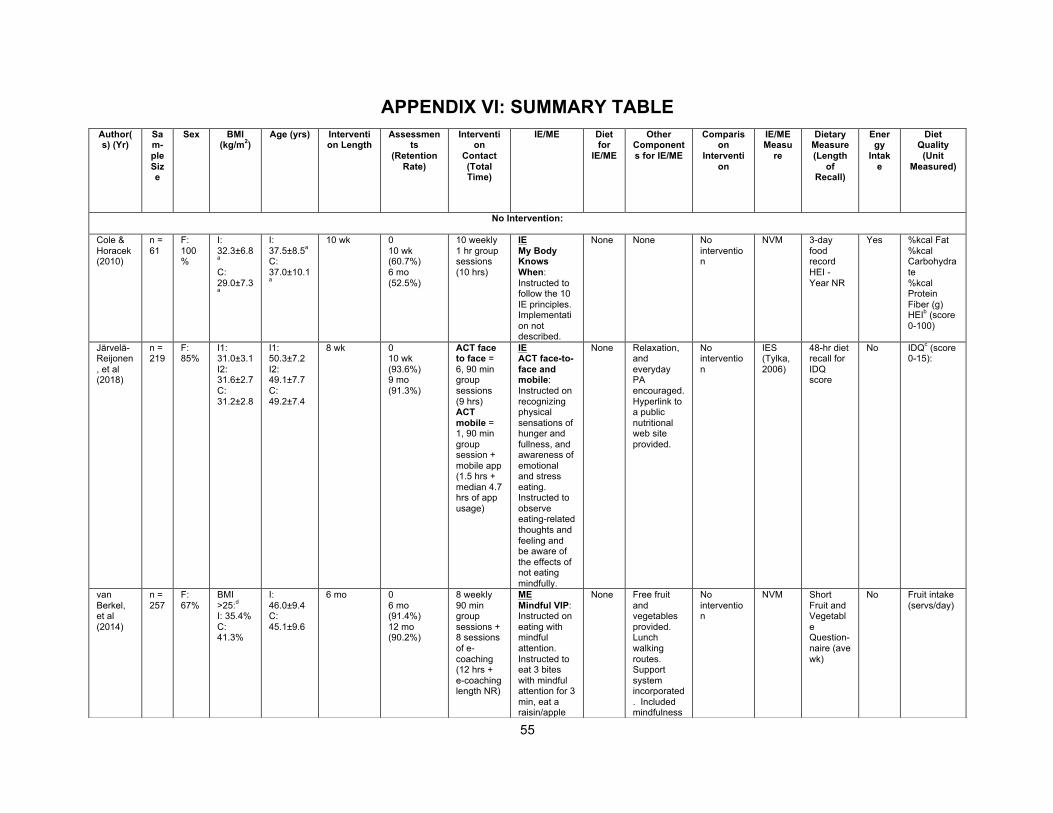
55
APPENDIX VI: SUMMARY TABLE Author(s) (Yr)
Sam-ple Size
Sex BMI (kg/m2)
Age (yrs) Intervention Length
Assessments
(Retention Rate)
Intervention
Contact (Total Time)
IE/ME Diet for
IE/ME
Other Components for IE/ME
Comparison
Intervention
IE/ME Measu
re
Dietary Measure (Length
of Recall)
Energy
Intake
Diet Quality
(Unit Measured)
No Intervention:
Cole & Horacek (2010)
n = 61
F: 100%
I: 32.3±6.8a
C: 29.0±7.3a
I: 37.5±8.5a
C: 37.0±10.1a
10 wk 0 10 wk (60.7%) 6 mo (52.5%)
10 weekly 1 hr group sessions (10 hrs)
IE My Body Knows When: Instructed to follow the 10 IE principles. Implementation not described.
None None No intervention
NVM 3-day food record HEI - Year NR
Yes %kcal Fat %kcal Carbohydrate %kcal Protein Fiber (g) HEIb (score 0-100)
Järvelä-Reijonen, et al (2018)
n = 219
F: 85%
I1: 31.0±3.1 I2: 31.6±2.7 C: 31.2±2.8
I1: 50.3±7.2 I2: 49.1±7.7 C: 49.2±7.4
8 wk 0 10 wk (93.6%) 9 mo (91.3%)
ACT face to face = 6, 90 min group sessions (9 hrs) ACT mobile = 1, 90 min group session + mobile app (1.5 hrs + median 4.7 hrs of app usage)
IE ACT face-to-face and mobile: Instructed on recognizing physical sensations of hunger and fullness, and awareness of emotional and stress eating. Instructed to observe eating-related thoughts and feeling and be aware of the effects of not eating mindfully.
None Relaxation, and everyday PA encouraged. Hyperlink to a public nutritional web site provided.
No intervention
IES (Tylka, 2006)
48-hr diet recall for IDQ score
No IDQc (score 0-15):
van Berkel, et al (2014)
n = 257
F: 67%
BMI >25:d
I: 35.4% C: 41.3%
I: 46.0±9.4 C: 45.1±9.6
6 mo 0 6 mo (91.4%) 12 mo (90.2%)
8 weekly 90 min group sessions + 8 sessions of e-coaching (12 hrs + e-coaching length NR)
ME Mindful VIP: Instructed on eating with mindful attention. Instructed to eat 3 bites with mindful attention for 3 min, eat a raisin/apple
None Free fruit and vegetables provided. Lunch walking routes. Support system incorporated. Included mindfulness
No intervention
NVM Short Fruit and Vegetable Question-naire (ave wk)
No Fruit intake (servs/day)
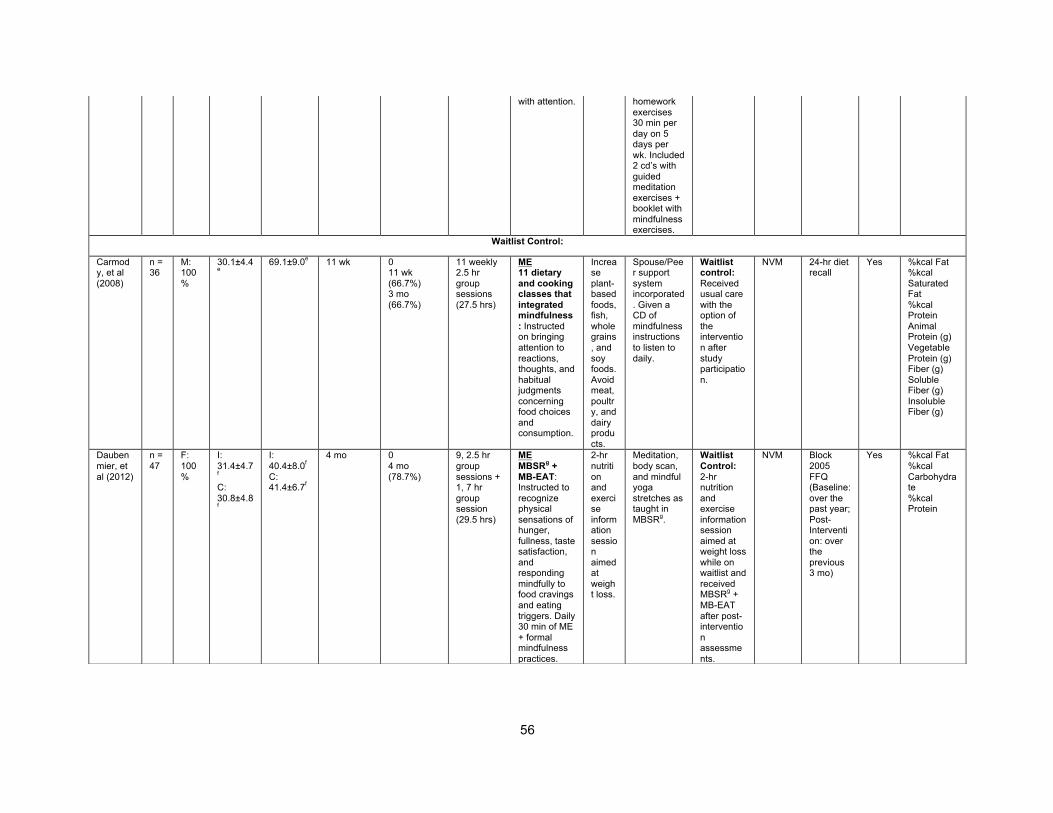
56
with attention. homework exercises 30 min per day on 5 days per wk. Included 2 cd’s with guided meditation exercises + booklet with mindfulness exercises.
Waitlist Control:
Carmody, et al (2008)
n = 36
M: 100%
30.1±4.4e
69.1±9.0e 11 wk 0 11 wk (66.7%) 3 mo (66.7%)
11 weekly 2.5 hr group sessions (27.5 hrs)
ME 11 dietary and cooking classes that integrated mindfulness: Instructed on bringing attention to reactions, thoughts, and habitual judgments concerning food choices and consumption.
Increase plant-based foods, fish, whole grains, and soy foods. Avoid meat, poultry, and dairy products.
Spouse/Peer support system incorporated. Given a CD of mindfulness instructions to listen to daily.
Waitlist control: Received usual care with the option of the intervention after study participation.
NVM 24-hr diet recall
Yes %kcal Fat %kcal Saturated Fat %kcal Protein Animal Protein (g) Vegetable Protein (g) Fiber (g) Soluble Fiber (g) Insoluble Fiber (g)
Daubenmier, et al (2012)
n = 47
F: 100%
I: 31.4±4.7f
C: 30.8±4.8f
I: 40.4±8.0f
C: 41.4±6.7f
4 mo 0 4 mo (78.7%)
9, 2.5 hr group sessions + 1, 7 hr group session (29.5 hrs)
ME MBSRg + MB-EAT: Instructed to recognize physical sensations of hunger, fullness, taste satisfaction, and responding mindfully to food cravings and eating triggers. Daily 30 min of ME + formal mindfulness practices.
2-hr nutrition and exercise information session aimed at weight loss.
Meditation, body scan, and mindful yoga stretches as taught in MBSRg.
Waitlist Control: 2-hr nutrition and exercise information session aimed at weight loss while on waitlist and received MBSRg + MB-EAT after post-intervention assessments.
NVM Block 2005 FFQ (Baseline: over the past year; Post-Intervention: over the previous 3 mo)
Yes %kcal Fat %kcal Carbohydrate %kcal Protein
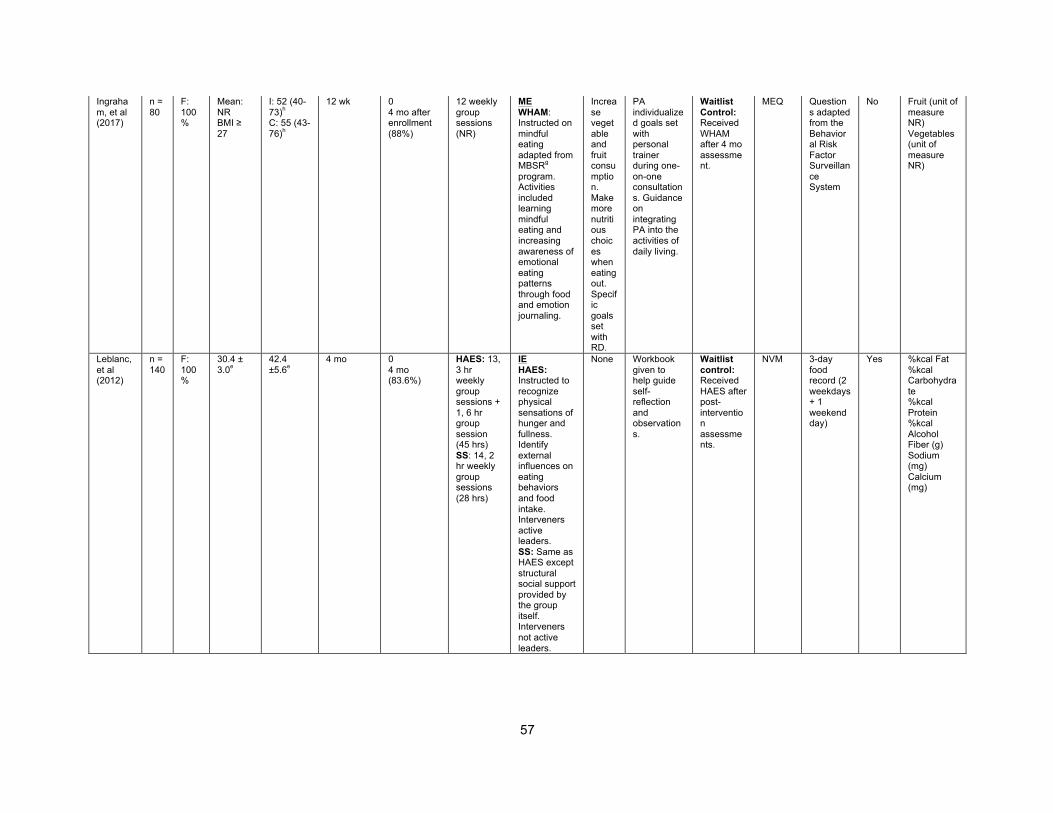
57
Ingraham, et al (2017)
n = 80
F: 100%
Mean: NR BMI ≥ 27
I: 52 (40-73)h
C: 55 (43-76)h
12 wk 0 4 mo after enrollment (88%)
12 weekly group sessions
(NR)
ME WHAM: Instructed on mindful eating adapted from MBSRg program. Activities included learning mindful eating and increasing awareness of emotional eating patterns through food and emotion journaling.
Increase vegetable and fruit consumption. Make more nutritious choices when eating out. Specific goals set with RD.
PA individualized goals set with personal trainer during one-on-one consultations. Guidance on integrating PA into the activities of daily living.
Waitlist Control: Received WHAM after 4 mo assessment.
MEQ Questions adapted from the Behavioral Risk Factor Surveillance System
No Fruit (unit of measure NR) Vegetables (unit of measure NR)
Leblanc, et al (2012)
n = 140
F: 100%
30.4 ± 3.0e
42.4 ±5.6e
4 mo 0 4 mo (83.6%)
HAES: 13, 3 hr weekly group sessions + 1, 6 hr group session (45 hrs) SS: 14, 2 hr weekly group sessions (28 hrs)
IE HAES: Instructed to recognize physical sensations of hunger and fullness. Identify external influences on eating behaviors and food intake. Interveners active leaders. SS: Same as HAES except structural social support provided by the group itself. Interveners not active leaders.
None Workbook given to help guide self-reflection and observations.
Waitlist control: Received HAES after post-intervention assessments.
NVM 3-day food record (2 weekdays + 1 weekend day)
Yes %kcal Fat %kcal Carbohydrate %kcal Protein %kcal Alcohol Fiber (g) Sodium (mg) Calcium (mg)
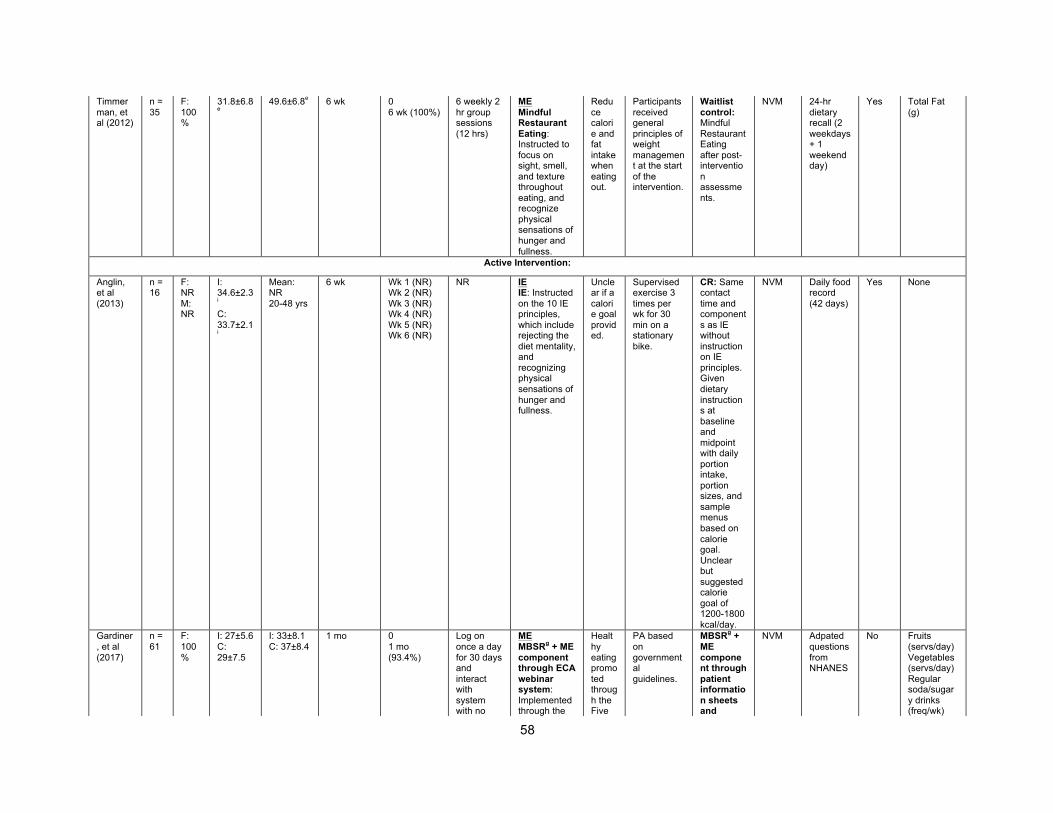
58
Timmerman, et al (2012)
n = 35
F: 100%
31.8±6.8e
49.6±6.8e 6 wk 0 6 wk (100%)
6 weekly 2 hr group sessions (12 hrs)
ME Mindful Restaurant Eating: Instructed to focus on sight, smell, and texture throughout eating, and recognize physical sensations of hunger and fullness.
Reduce calorie and fat intake when eating out.
Participants received general principles of weight management at the start of the intervention.
Waitlist control: Mindful Restaurant Eating after post-intervention assessments.
NVM 24-hr dietary recall (2 weekdays + 1 weekend day)
Yes Total Fat (g)
Active Intervention:
Anglin, et al (2013)
n = 16
F: NR M: NR
I: 34.6±2.3i
C: 33.7±2.1i
Mean: NR 20-48 yrs
6 wk Wk 1 (NR) Wk 2 (NR) Wk 3 (NR) Wk 4 (NR) Wk 5 (NR) Wk 6 (NR)
NR IE IE: Instructed on the 10 IE principles, which include rejecting the diet mentality, and recognizing physical sensations of hunger and fullness.
Unclear if a calorie goal provided.
Supervised exercise 3 times per wk for 30 min on a stationary bike.
CR: Same contact time and components as IE without instruction on IE principles. Given dietary instructions at baseline and midpoint with daily portion intake, portion sizes, and sample menus based on calorie goal. Unclear but suggested calorie goal of 1200-1800 kcal/day.
NVM Daily food record (42 days)
Yes None
Gardiner, et al (2017)
n = 61
F: 100%
I: 27±5.6 C: 29±7.5
I: 33±8.1 C: 37±8.4
1 mo 0 1 mo (93.4%)
Log on once a day for 30 days and interact with system with no
ME MBSRg + ME component through ECA webinar system: Implemented through the
Healthy eating promoted through the Five
PA based on governmental guidelines.
MBSRg + ME component through patient information sheets and
NVM Adpated questions from NHANES
No Fruits (servs/day) Vegetables (servs/day) Regular soda/sugary drinks (freq/wk)
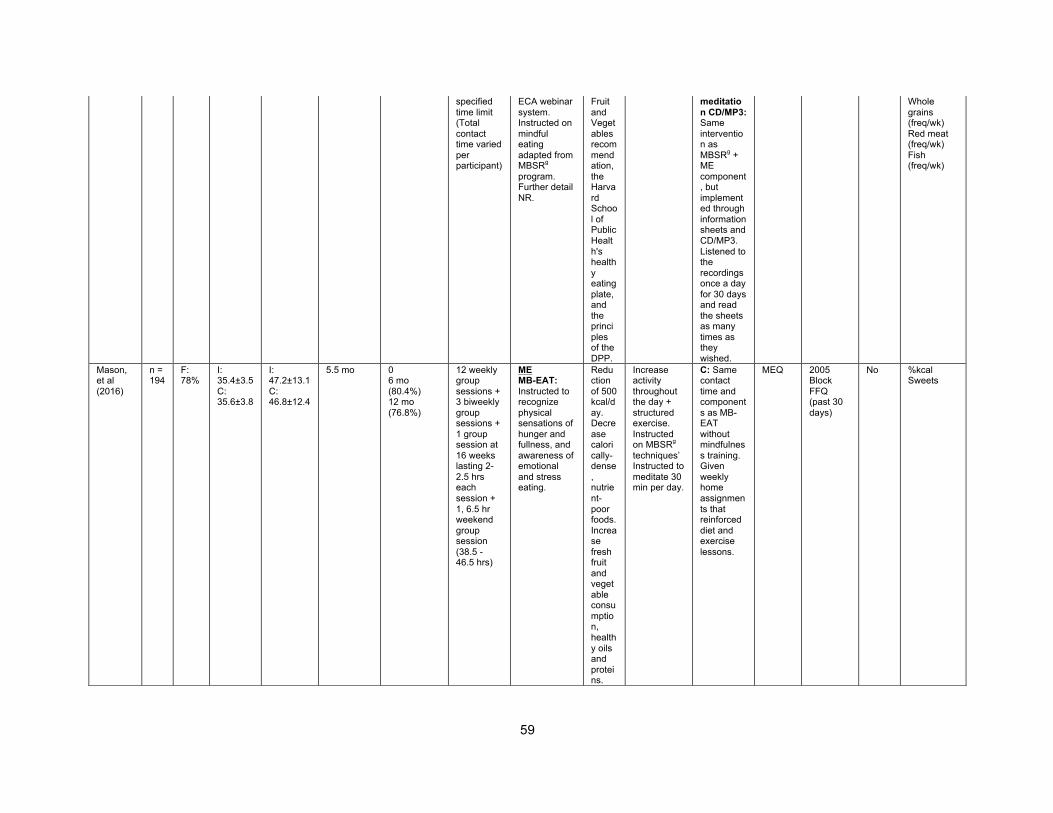
59
specified time limit (Total contact time varied per participant)
ECA webinar system. Instructed on mindful eating adapted from MBSRg program. Further detail NR.
Fruit and Vegetables recommendation, the Harvard School of Public Health's healthy eating plate, and the principles of the DPP.
meditation CD/MP3: Same intervention as MBSRg + ME component, but implemented through information sheets and CD/MP3. Listened to the recordings once a day for 30 days and read the sheets as many times as they wished.
Whole grains (freq/wk) Red meat (freq/wk) Fish (freq/wk)
Mason, et al (2016)
n = 194
F: 78%
I: 35.4±3.5 C: 35.6±3.8
I: 47.2±13.1 C: 46.8±12.4
5.5 mo 0 6 mo (80.4%) 12 mo (76.8%)
12 weekly group sessions + 3 biweekly group sessions + 1 group session at 16 weeks lasting 2-2.5 hrs each session + 1, 6.5 hr weekend group session (38.5 - 46.5 hrs)
ME MB-EAT: Instructed to recognize physical sensations of hunger and fullness, and awareness of emotional and stress eating.
Reduction of 500 kcal/day. Decrease calorically-dense, nutrient-poor foods. Increase fresh fruit and vegetable consumption, healthy oils and proteins.
Increase activity throughout the day + structured exercise. Instructed on MBSRg
techniques’ Instructed to meditate 30 min per day.
C: Same contact time and components as MB-EAT without mindfulness training. Given weekly home assignments that reinforced diet and exercise lessons.
MEQ 2005 Block FFQ (past 30 days)
No %kcal Sweets
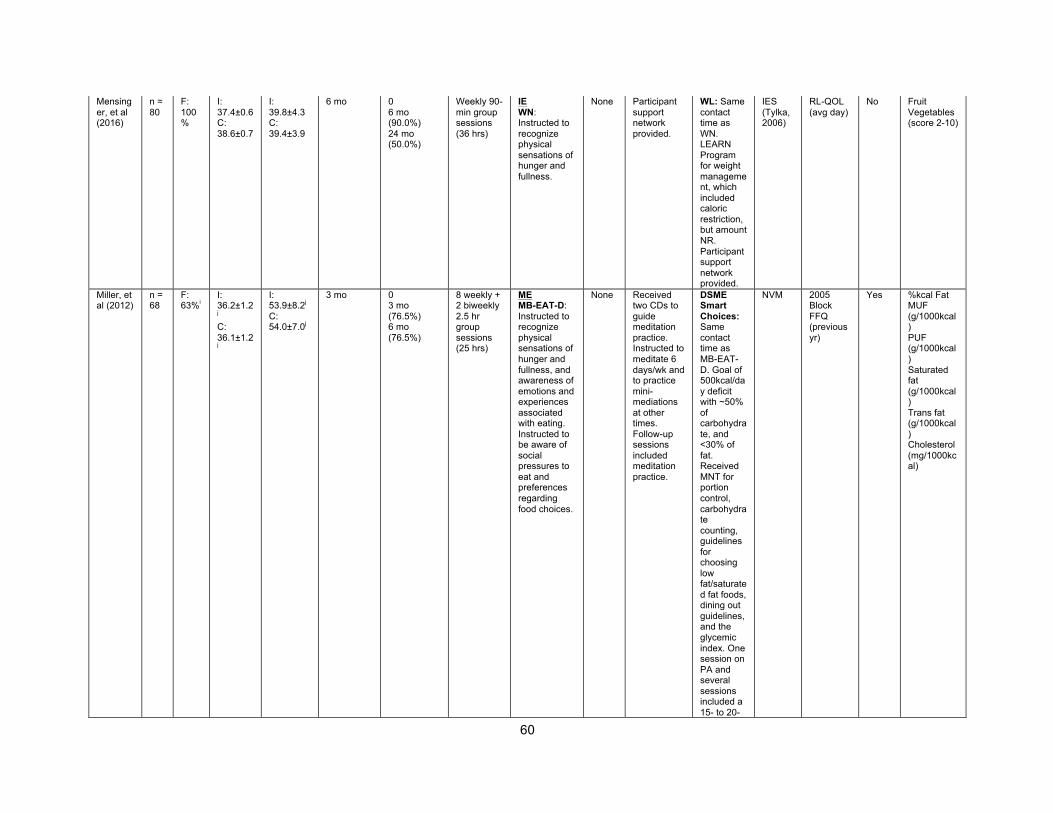
60
Mensinger, et al (2016)
n = 80
F: 100%
I: 37.4±0.6 C: 38.6±0.7
I: 39.8±4.3 C: 39.4±3.9
6 mo 0 6 mo (90.0%) 24 mo (50.0%)
Weekly 90-min group sessions (36 hrs)
IE WN: Instructed to recognize physical sensations of hunger and fullness.
None Participant support network provided.
WL: Same contact time as WN. LEARN Program for weight management, which included caloric restriction, but amount NR. Participant support network provided.
IES (Tylka, 2006)
RL-QOL (avg day)
No Fruit Vegetables (score 2-10)
Miller, et al (2012)
n = 68
F: 63%i
I: 36.2±1.2j
C: 36.1±1.2j
I: 53.9±8.2j
C: 54.0±7.0j
3 mo 0 3 mo (76.5%) 6 mo (76.5%)
8 weekly + 2 biweekly 2.5 hr group sessions (25 hrs)
ME MB-EAT-D: Instructed to recognize physical sensations of hunger and fullness, and awareness of emotions and experiences associated with eating. Instructed to be aware of social pressures to eat and preferences regarding food choices.
None Received two CDs to guide meditation practice. Instructed to meditate 6 days/wk and to practice mini-mediations at other times. Follow-up sessions included meditation practice.
DSME Smart Choices: Same contact time as MB-EAT-D. Goal of 500kcal/day deficit with ~50% of carbohydrate, and <30% of fat. Received MNT for portion control, carbohydrate counting, guidelines for choosing low fat/saturated fat foods, dining out guidelines, and the glycemic index. One session on PA and several sessions included a 15- to 20-
NVM 2005 Block FFQ (previous yr)
Yes %kcal Fat MUF (g/1000kcal) PUF (g/1000kcal) Saturated fat (g/1000kcal) Trans fat (g/1000kcal) Cholesterol (mg/1000kcal)
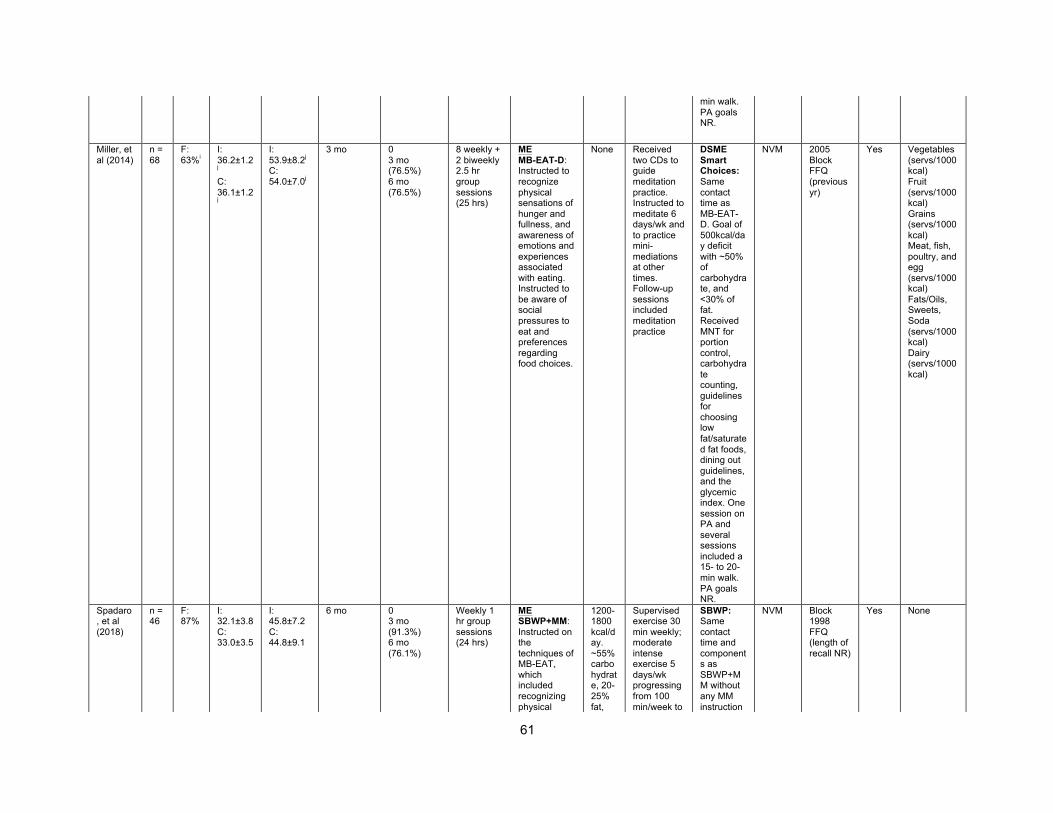
61
min walk. PA goals NR.
Miller, et al (2014)
n = 68
F: 63%i
I: 36.2±1.2j
C: 36.1±1.2j
I: 53.9±8.2j
C: 54.0±7.0j
3 mo 0 3 mo (76.5%) 6 mo (76.5%)
8 weekly + 2 biweekly 2.5 hr group sessions (25 hrs)
ME MB-EAT-D: Instructed to recognize physical sensations of hunger and fullness, and awareness of emotions and experiences associated with eating. Instructed to be aware of social pressures to eat and preferences regarding food choices.
None Received two CDs to guide meditation practice. Instructed to meditate 6 days/wk and to practice mini-mediations at other times. Follow-up sessions included meditation practice
DSME Smart Choices: Same contact time as MB-EAT-D. Goal of 500kcal/day deficit with ~50% of carbohydrate, and <30% of fat. Received MNT for portion control, carbohydrate counting, guidelines for choosing low fat/saturated fat foods, dining out guidelines, and the glycemic index. One session on PA and several sessions included a 15- to 20-min walk. PA goals NR.
NVM 2005 Block FFQ (previous yr)
Yes Vegetables (servs/1000 kcal) Fruit (servs/1000 kcal) Grains (servs/1000 kcal) Meat, fish, poultry, and egg (servs/1000 kcal) Fats/Oils, Sweets, Soda (servs/1000 kcal) Dairy (servs/1000 kcal)
Spadaro, et al (2018)
n = 46
F: 87%
I: 32.1±3.8 C: 33.0±3.5
I: 45.8±7.2 C: 44.8±9.1
6 mo 0 3 mo (91.3%) 6 mo (76.1%)
Weekly 1 hr group sessions (24 hrs)
ME SBWP+MM: Instructed on the techniques of MB-EAT, which included recognizing physical
1200-1800 kcal/day. ~55% carbohydrate, 20-25% fat,
Supervised exercise 30 min weekly; moderate intense exercise 5 days/wk progressing from 100 min/week to
SBWP: Same contact time and components as SBWP+MM without any MM instruction
NVM Block 1998 FFQ (length of recall NR)
Yes None
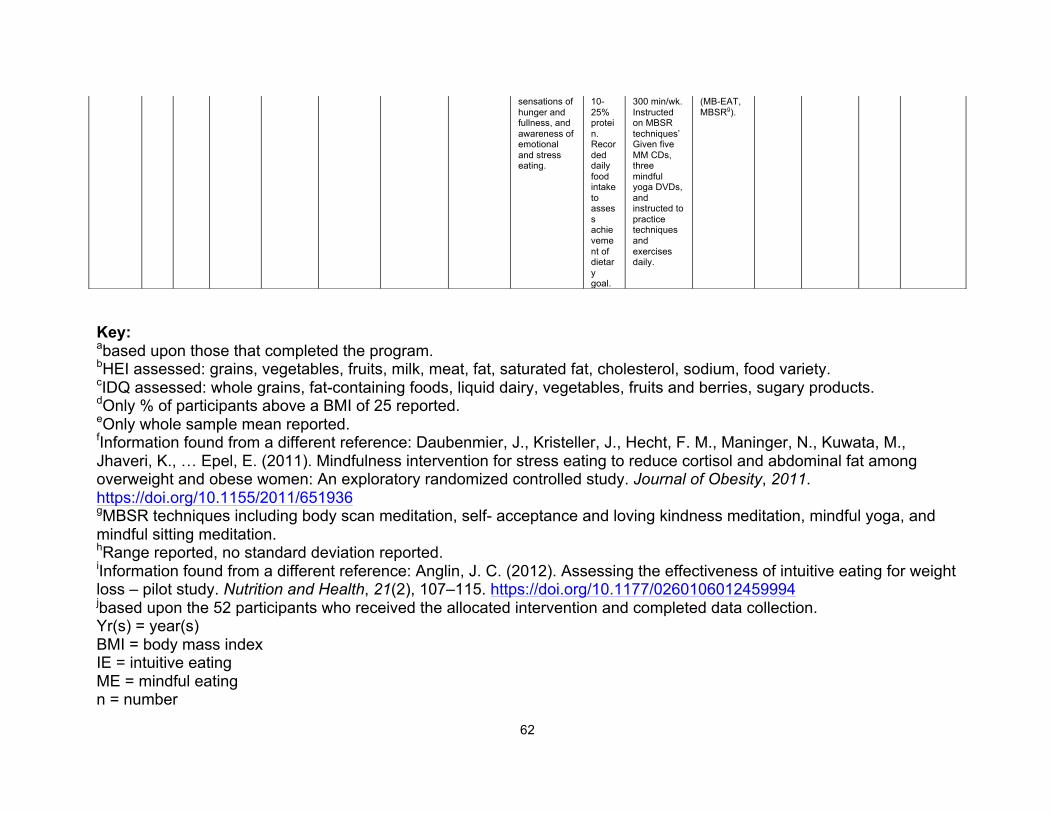
62
Key: abased upon those that completed the program. bHEI assessed: grains, vegetables, fruits, milk, meat, fat, saturated fat, cholesterol, sodium, food variety. cIDQ assessed: whole grains, fat-containing foods, liquid dairy, vegetables, fruits and berries, sugary products. dOnly % of participants above a BMI of 25 reported. eOnly whole sample mean reported. fInformation found from a different reference: Daubenmier, J., Kristeller, J., Hecht, F. M., Maninger, N., Kuwata, M., Jhaveri, K., … Epel, E. (2011). Mindfulness intervention for stress eating to reduce cortisol and abdominal fat among overweight and obese women: An exploratory randomized controlled study. Journal of Obesity, 2011. https://doi.org/10.1155/2011/651936 gMBSR techniques including body scan meditation, self- acceptance and loving kindness meditation, mindful yoga, and mindful sitting meditation. hRange reported, no standard deviation reported. iInformation found from a different reference: Anglin, J. C. (2012). Assessing the effectiveness of intuitive eating for weight loss – pilot study. Nutrition and Health, 21(2), 107–115. https://doi.org/10.1177/0260106012459994 jbased upon the 52 participants who received the allocated intervention and completed data collection. Yr(s) = year(s) BMI = body mass index IE = intuitive eating ME = mindful eating n = number
sensations of hunger and fullness, and awareness of emotional and stress eating.
10-25% protein. Recorded daily food intake to assess achievement of dietary goal.
300 min/wk. Instructed on MBSR techniques’ Given five MM CDs, three mindful yoga DVDs, and instructed to practice techniques and exercises daily.
(MB-EAT, MBSRg).
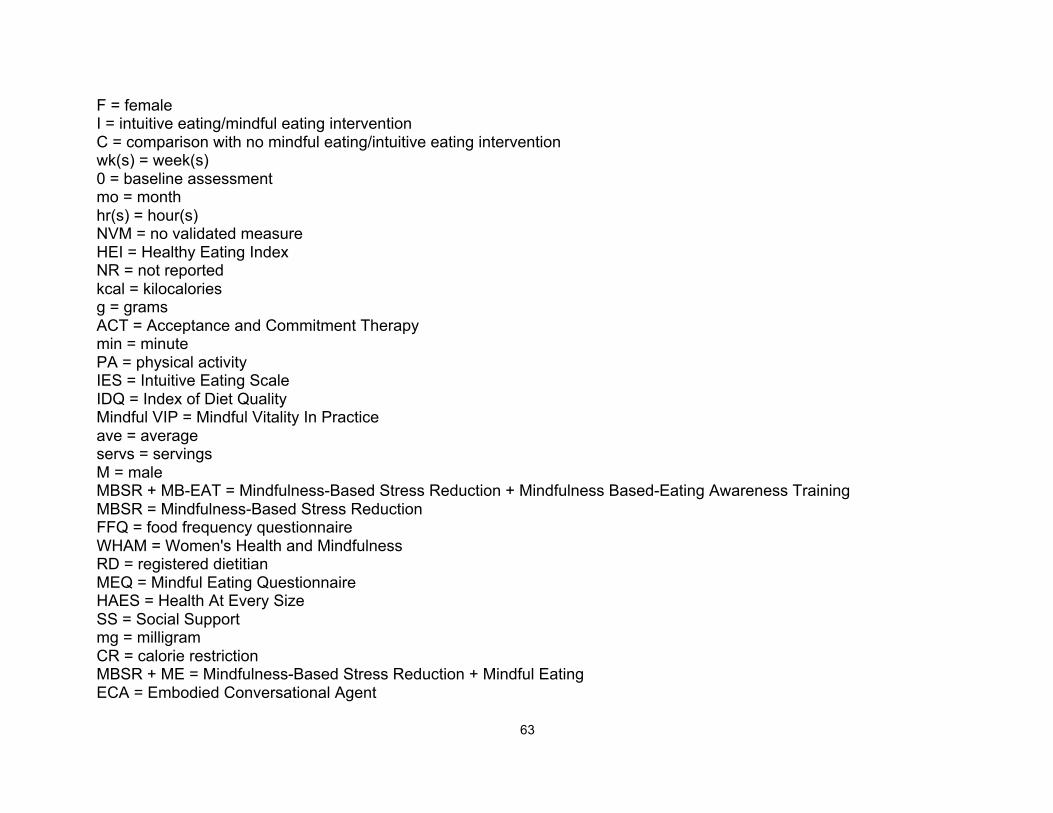
63
F = female I = intuitive eating/mindful eating intervention C = comparison with no mindful eating/intuitive eating intervention wk(s) = week(s) 0 = baseline assessment mo = month hr(s) = hour(s) NVM = no validated measure HEI = Healthy Eating Index NR = not reported kcal = kilocalories g = grams ACT = Acceptance and Commitment Therapy min = minute PA = physical activity IES = Intuitive Eating Scale IDQ = Index of Diet Quality Mindful VIP = Mindful Vitality In Practice ave = average servs = servings M = male MBSR + MB-EAT = Mindfulness-Based Stress Reduction + Mindfulness Based-Eating Awareness Training MBSR = Mindfulness-Based Stress Reduction FFQ = food frequency questionnaire WHAM = Women's Health and Mindfulness RD = registered dietitian MEQ = Mindful Eating Questionnaire HAES = Health At Every Size SS = Social Support mg = milligram CR = calorie restriction MBSR + ME = Mindfulness-Based Stress Reduction + Mindful Eating ECA = Embodied Conversational Agent
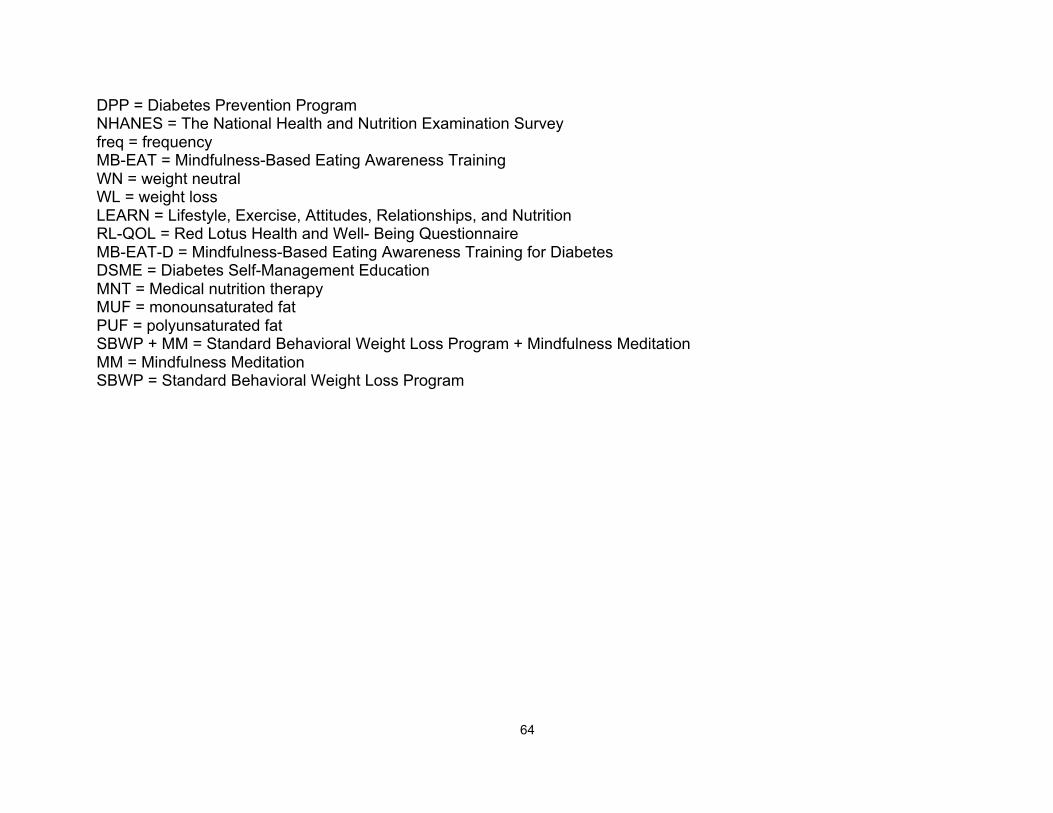
64
DPP = Diabetes Prevention Program NHANES = The National Health and Nutrition Examination Survey freq = frequency MB-EAT = Mindfulness-Based Eating Awareness Training WN = weight neutral WL = weight loss LEARN = Lifestyle, Exercise, Attitudes, Relationships, and Nutrition RL-QOL = Red Lotus Health and Well- Being Questionnaire MB-EAT-D = Mindfulness-Based Eating Awareness Training for Diabetes DSME = Diabetes Self-Management Education MNT = Medical nutrition therapy MUF = monounsaturated fat PUF = polyunsaturated fat SBWP + MM = Standard Behavioral Weight Loss Program + Mindfulness Meditation MM = Mindfulness Meditation SBWP = Standard Behavioral Weight Loss Program
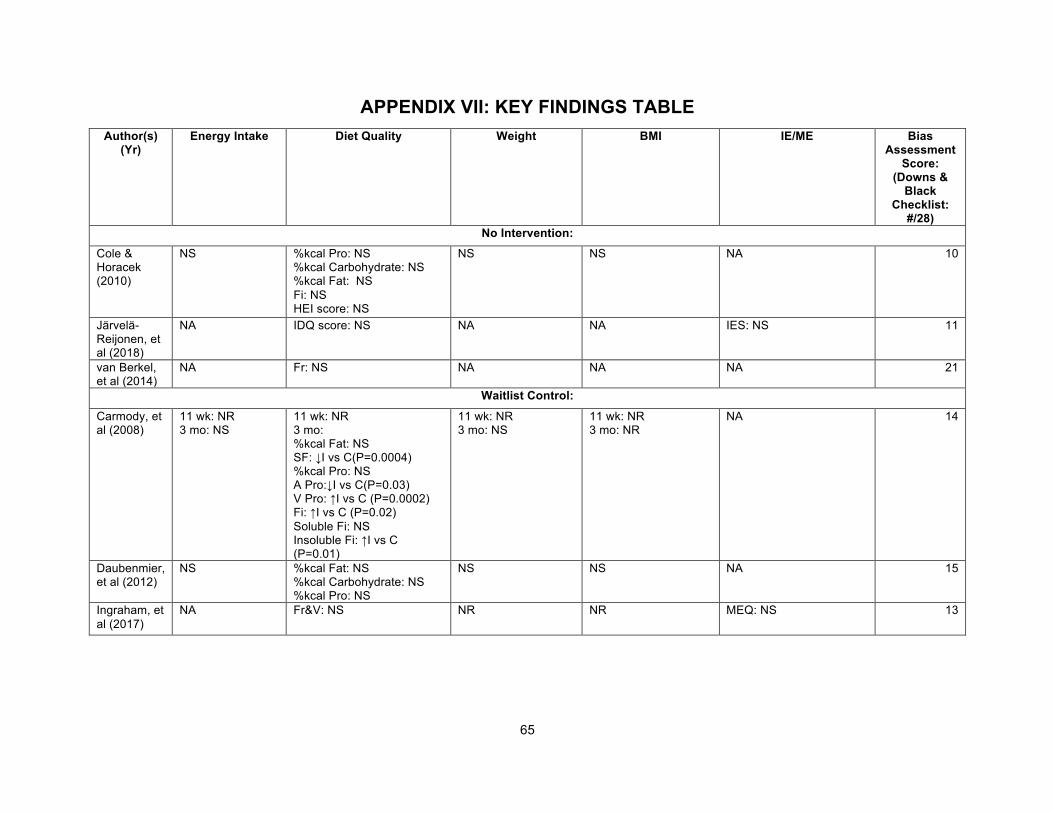
65
APPENDIX VII: KEY FINDINGS TABLE Author(s)
(Yr) Energy Intake Diet Quality Weight BMI IE/ME Bias
Assessment Score:
(Downs & Black
Checklist: #/28)
No Intervention: Cole & Horacek (2010)
NS %kcal Pro: NS %kcal Carbohydrate: NS %kcal Fat: NS Fi: NS HEI score: NS
NS NS NA 10
Järvelä-Reijonen, et al (2018)
NA IDQ score: NS NA NA IES: NS 11
van Berkel, et al (2014)
NA Fr: NS NA NA NA 21
Waitlist Control:
Carmody, et al (2008)
11 wk: NR 3 mo: NS
11 wk: NR 3 mo: %kcal Fat: NS SF: ↓I vs C(P=0.0004) %kcal Pro: NS A Pro:↓I vs C(P=0.03) V Pro: ↑I vs C (P=0.0002) Fi: ↑I vs C (P=0.02) Soluble Fi: NS Insoluble Fi: ↑I vs C (P=0.01)
11 wk: NR 3 mo: NS
11 wk: NR 3 mo: NR
NA 14
Daubenmier, et al (2012)
NS %kcal Fat: NS %kcal Carbohydrate: NS %kcal Pro: NS
NS NS NA 15
Ingraham, et al (2017)
NA Fr&V: NS NR NR MEQ: NS 13
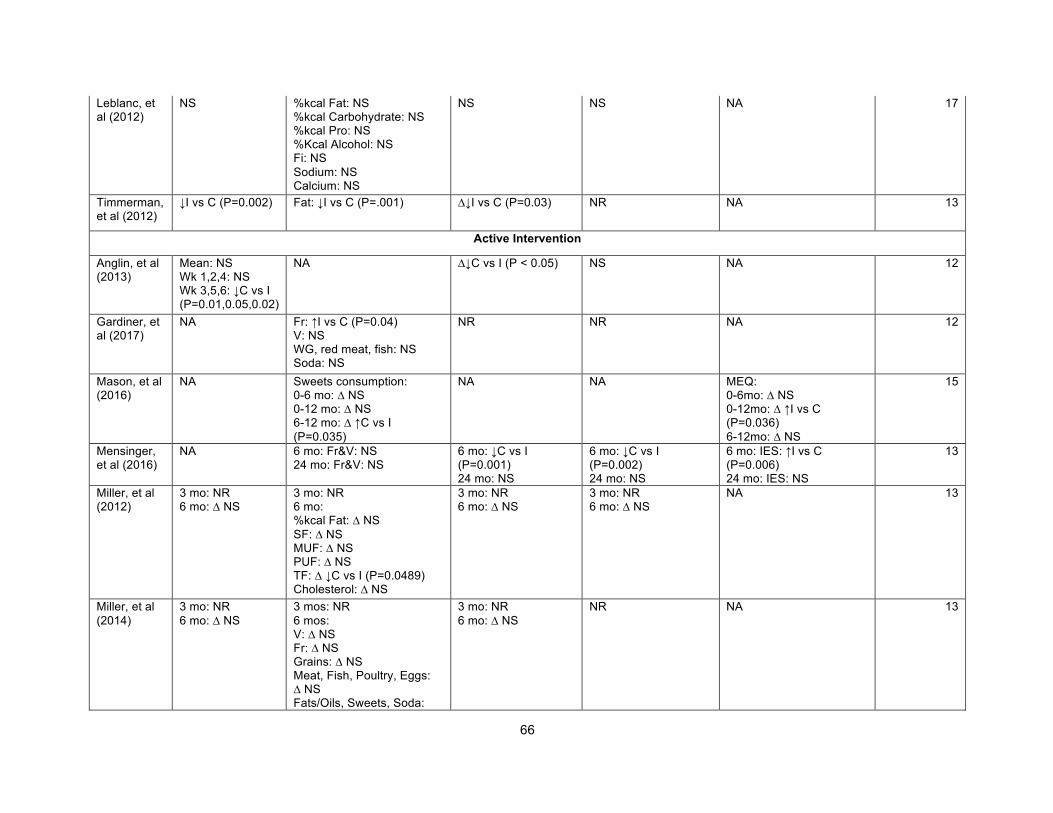
66
Leblanc, et al (2012)
NS %kcal Fat: NS %kcal Carbohydrate: NS %kcal Pro: NS %Kcal Alcohol: NS Fi: NS Sodium: NS Calcium: NS
NS NS NA 17
Timmerman, et al (2012)
↓I vs C (P=0.002) Fat: ↓I vs C (P=.001) ∆↓I vs C (P=0.03) NR NA 13
Active Intervention
Anglin, et al (2013)
Mean: NS Wk 1,2,4: NS Wk 3,5,6: ↓C vs I (P=0.01,0.05,0.02)
NA ∆↓C vs I (P < 0.05) NS NA 12
Gardiner, et al (2017)
NA Fr: ↑I vs C (P=0.04) V: NS WG, red meat, fish: NS Soda: NS
NR NR NA 12
Mason, et al (2016)
NA Sweets consumption: 0-6 mo: ∆ NS 0-12 mo: ∆ NS 6-12 mo: ∆ ↑C vs I (P=0.035)
NA NA MEQ: 0-6mo: ∆ NS 0-12mo: ∆ ↑I vs C (P=0.036) 6-12mo: ∆ NS
15
Mensinger, et al (2016)
NA 6 mo: Fr&V: NS 24 mo: Fr&V: NS
6 mo: ↓C vs I (P=0.001) 24 mo: NS
6 mo: ↓C vs I (P=0.002) 24 mo: NS
6 mo: IES: ↑I vs C (P=0.006) 24 mo: IES: NS
13
Miller, et al (2012)
3 mo: NR 6 mo: ∆ NS
3 mo: NR 6 mo: %kcal Fat: ∆ NS SF: ∆ NS MUF: ∆ NS PUF: ∆ NS TF: ∆ ↓C vs I (P=0.0489) Cholesterol: ∆ NS
3 mo: NR 6 mo: ∆ NS
3 mo: NR 6 mo: ∆ NS
NA 13
Miller, et al (2014)
3 mo: NR 6 mo: ∆ NS
3 mos: NR 6 mos: V: ∆ NS Fr: ∆ NS Grains: ∆ NS Meat, Fish, Poultry, Eggs: ∆ NS Fats/Oils, Sweets, Soda:
3 mo: NR 6 mo: ∆ NS
NR NA 13
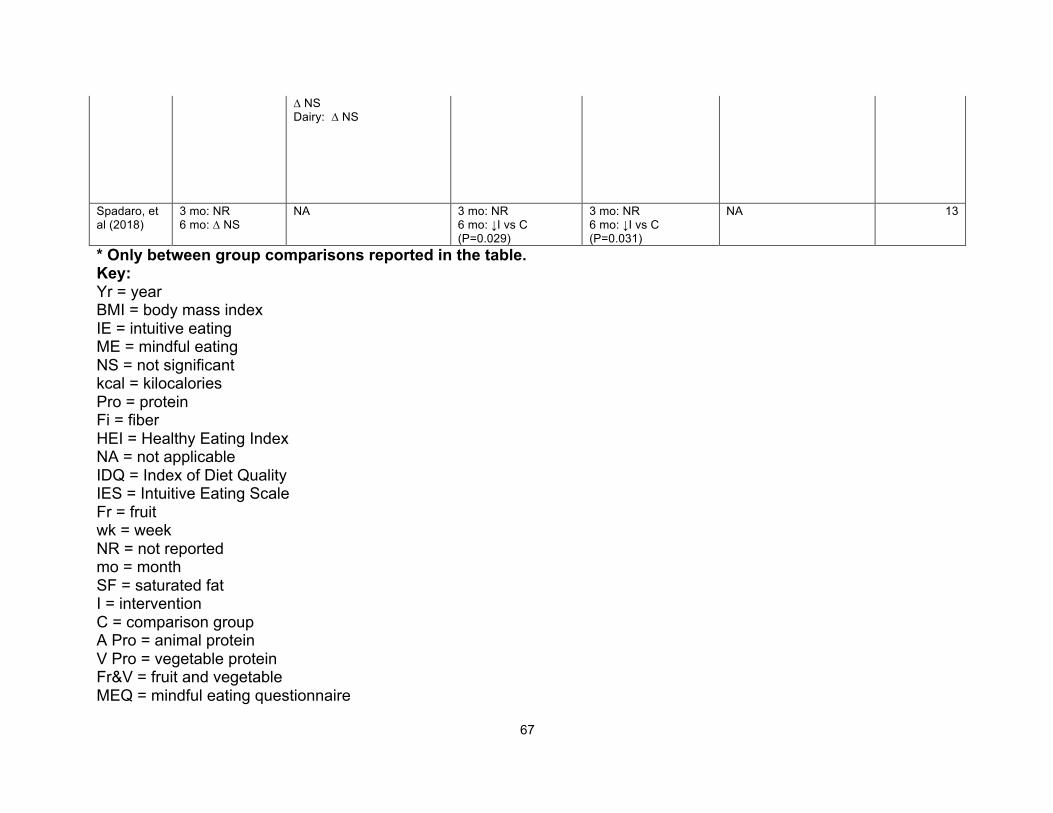
67
∆ NS Dairy: ∆ NS
Spadaro, et al (2018)
3 mo: NR 6 mo: ∆ NS
NA 3 mo: NR 6 mo: ↓I vs C (P=0.029)
3 mo: NR 6 mo: ↓I vs C (P=0.031)
NA 13
* Only between group comparisons reported in the table. Key: Yr = year BMI = body mass index IE = intuitive eating ME = mindful eating NS = not significant kcal = kilocalories Pro = protein Fi = fiber HEI = Healthy Eating Index NA = not applicable IDQ = Index of Diet Quality IES = Intuitive Eating Scale Fr = fruit wk = week NR = not reported mo = month SF = saturated fat I = intervention C = comparison group A Pro = animal protein V Pro = vegetable protein Fr&V = fruit and vegetable MEQ = mindful eating questionnaire
68
∆ = delta V = vegetables WG = whole grains MUF = monounsaturated fat PUF = polyunsaturated fat TF = trans fat
69
VITA Hannah Grider was born in Memphis, TN, to the parents of Paul Grider and Nena
Mandino. She has an older brother, Jesse Grider, and two stepsiblings, Taylor and Trey
Cash. She attended Trinity Christian Academy in Jackson, TN from kindergarten
through 12th grade. After graduation, she went to the University of Tennessee, Martin
where she received a Bachelors degree in Family and Consumer Sciences with the
concentration of Dietetics. She then decided she wanted to continue her education by
pursuing a Masters degree and work to become a registered dietitian. Hannah is
currently earning her Masters of Science degree in Public Health Nutrition from the
University of Tennessee, Knoxville (UTK). While pursuing her Masters degree, she will
also be completing UTK’s dietetic internship to become a certified registered dietitian.
Upon completion, Hannah hopes to practice in the outpatient setting. She has particular
interest in working with people with diabetes, and hopes to become a certified diabetes
educator one day.
Related Documents