Centro de Tecnologia Mineral Ministério da Ciência e Tecnologia Coordenação de Inovação Tecnológica – CTEC Serviço de Processamento Mineral - SEPM A INFLUÊNCIA DA MICRO ESTRUTURA DO DESEMPENHO DO PISO PORCELÂNICO BRANCO Patrícia Maria Tenório Cavalcante Eng a Mecânica, D. Mt Rio de Janeiro Julho / 2004 CT2004-066-00 Comunicação Técnica Elaborada e Publicada na Revista Ceramics Internacional 30 (2004) páginas 953 à 963.

Welcome message from author
This document is posted to help you gain knowledge. Please leave a comment to let me know what you think about it! Share it to your friends and learn new things together.
Transcript

Centro de Tecnologia Mineral
Ministério da Ciência e Tecnologia Coordenação de Inovação Tecnológica – CTEC
Serviço de Processamento Mineral - SEPM
A INFLUÊNCIA DA MICRO ESTRUTURA DO DESEMPENHO
DO PISO PORCELÂNICO BRANCO
Patrícia Maria Tenório Cavalcante
Enga Mecânica, D. Mt
Rio de Janeiro Julho / 2004
CT2004-066-00 Comunicação Técnica Elaborada e Publicada na Revista Ceramics Internacional 30 (2004) páginas 953 à 963.
Ceramics International 30 (2004) 953–963
The influence of microstructure on the performanceof white porcelain stoneware
P.M. Tenorio Cavalcantea, M. Dondib, G. Ercolanib, G. Guarinib,C. Melandrib, M. Raimondob,∗, E. Rocha e Almendraa
a UFRJ-COPPE, Federal University of Rio de Janeiro, Rio de Janeiro, Brazilb CNR-Institute of Science and Technology for Ceramics, via Granarolo, 64 48018 Faenza, Italy
Received 1 September 2003; received in revised form 13 October 2003; accepted 7 November 2003
Available online 20 March 2004
Abstract
In the last years polished white porcelain stoneware tiles, coupling the smooth and glossy surface with the increased body whiteness, get aprominent role on the market. The bright white colour is obtained by adding noteworthy quantity of opacifiers, such as zircon, corundum andspinel. To better understand the complex relationships among the microstructure and the mechanical, tribological and functional behaviourof this class of products, four polished white porcelain stoneware tiles were selected and thoroughly characterized by a wide spectrum ofchemico-physical and microstructural analyses. Products exhibit excellent mechanical properties (flexural strength, Young modulus, fracturetoughness) with a clear dependence of these properties on porosity and phase composition. Mullite and zircon tend to increase the mechanicalperformances, through a predominant mechanism of matrix reinforcement, while quartz plays an opposite role.© 2003 Elsevier Ltd and Techna Group S.r.l. All rights reserved.
Keywords: A. Sintering; B. Microstructure-final; C. Mechanical properties; D. Porcelain
1. Introduction
Porcelain stoneware is a ceramic material with a verycompact structure (water absorption<0.5%: group BIa ofISO 13006), made up of crystalline phases (new formedand residual ones) embedded in a glassy matrix, obtainedby fast single firing (maximum temperature about 1200◦C,less than 60 min cold to cold)[1,2].
In the last decade, the growth rate of the global productionof porcelain stoneware tiles increased more than other ce-ramic products; in fact, the excellent technical properties[3],together with the even more improved aesthetic appearance[4], gave porcelain stoneware a prominent role on the tilemarket[5]. This great commercial success made it possibleto concentrate considerable resources in developing differ-ent types of porcelain stoneware tiles, which can be classi-fied on the basis of their different surface or bulk properties.Both the surface (rough, textured, polished, lapped, glazed,etc.) and the bulk appearance (i.e. translucency, whiteness,
∗ Corresponding author. Tel.:+39-0546-699718;fax: +39-0546-46381.
E-mail address: [email protected] (M. Raimondo).
etc.) influence, though in a different way, the product per-formances[6,7].
Among such different typologies, the last years recordeda significant advance in the production of polished tiles,having smooth and highly glossy surfaces compared to theuntreated ones[8]. However, the occurrence of some draw-backs during the polishing procedures, mainly due to theopening of the closed porosity and formation of superficialflaws[9], leads to a worsening of the functional properties inworking conditions, especially the resistance to stain[10,11]and the wear behaviour[12,13].
Most studies available in the literature refer essentially tounglazed porcelain stoneware tiles, leaving significant op-portunities for investigating the other typologies. In particu-lar, the white porcelain stoneware, obtained by special bodyformulations able to get a bright white colour, is not fullyinvestigated and a lot of aspects, from raw materials prop-erties to processing conditions, should be better understood[14].
The white porcelain stoneware is obtained by special rawmaterials batches, containing low amounts of ball clays andkaolin (25–30%), high percentage of feldspars as fluxes(50–60%) and some quartz sands (5–10%). The increased
0272-8842/$30.00 © 2003 Elsevier Ltd and Techna Group S.r.l. All rights reserved.doi:10.1016/j.ceramint.2003.11.002

954 P.M. Tenorio Cavalcante et al. / Ceramics International 30 (2004) 953–963
whiteness, which gives added aesthetic value to the product,is achieved with a noteworthy quantity (5–15%) of opaci-fiers (zircon, corundum, spinel)[15,16]. The microstructureof the fired products is strictly dependent on the particularbody composition and has a decisive influence on the me-chanical, tribological and functional behaviour of this classof products[2,3].
In this standview, the behaviour of polished white porce-lain stoneware tiles was thoroughly investigated by a widespectrum of chemico-physical and microstructural analy-ses, focusing the attention on a better understanding of thecomplex relationships among microstructural, mechanical,tribological and functional characteristics. Besides the bulkproperties, the surface state and their sensitivity to the wear-ing phenomena occurring in working conditions, have beenalso evaluated.
2. Materials and methods
Four typologies of polished and unglazed white porcelainstoneware tiles, well representing the variability of the cur-rent production, were selected.
These products, named C, E, N and P, respectively, werefully characterized in terms of compositional, microstruc-tural, technological and functional properties.
The phase composition was quantitatively determined byX-ray powder diffraction (Rigaku Miniflex, Ni-filtered CuK� radiation) with the Reference Intensity Ratio method(CaF2 as internal standard)[17]. The amount of glassyphase was estimated by difference. The experimental erroris within 5% relative.
The chemical composition was determined by inductivelycoupled plasma-optical emission spectroscopy (ICP-OES,Varian Liberty 200) on the solution obtained by melting thesample with lithium tetraborate at 1200◦C.
Open porosity and bulk density were quantified measuringthe dry weight, the water-saturated weight and the weightsuspended in water, according to ISO 10545-3. Total poros-ity was calculated by the ratio between bulk density andspecific weight, measured by He pycnometer (Micromerit-ics Multivolume Pycnometer 1305); closed porosity was es-timated by difference.
For each product typology, the modulus of rupture wasmeasured with a 3-points flexural method (ISO 10545-4)on 7–10 tiles (400 mm× 400 mm or 600 mm× 450 mm).An Instron 1195 instrument was used to determine the fol-lowing mechanical properties on specimens cut off fromcommercial items: 4-points flexural strength (EN 843-1 on45 mm× 4 mm× 3 mm specimens), Young modulus (ENV843-2 on 70 mm× 2 mm× 10 mm specimens), as well asfracture toughness on 20 mm× 4 mm× 3 mm bars with thesingle edge notched beam method (ENV 13234).
The surface microhardness was determined by a Zwick3212 Vickers indenter (ENV 843–4, load of 0.3 kg), whilethe surface roughness, expressed as bothRa (average rough-
ness) andRt (maximum depression), was determined with aTaylor–Hobson instrument, according to CEN 85.
To simulate the wearing phenomena occurring on thetiles surface, both the PEI superficial wear resistance (ISO10545-7) and the deep abrasion resistance (ISO 10545-6)were tested. The superficial resistance, measured after fourwear steps (1500, 2100, 6000 and 12,000 rounds), is ex-pressed as the volume of material removed from the surfaceconverting the weight loss by the bulk density. The volumeof material removed in the deep abrasion test is calculatedby measuring the chord length of the groove.
The functional properties were evaluated in terms of sur-face stain resistance and cleanability, utilising the red stain-ing agent (Fe2O3 in a low molecular weight oil) and threedifferent cleaning steps (WW: warm water, ND: warm watercoupled with a neutral pH detergent, AD: warm water cou-pled with an abrasive alkaline pH detergent), according toISO 10545-14. The staining after each cleaning step was ap-praised through a colorimetric measurement (ISO 10545-16,Hunterlab Miniscan XE Plus): the difference between thesurface colour before and after the staining and cleaning op-erations is expressed as:�E = (�L∗2 + �a∗2 + �b∗2)1/2,where�L∗, �a∗ and�b∗ are the difference of the CieLabparametersL∗, a∗ andb∗, considering the as-received pol-ished surface as reference.
The microstructure of the gold coated surfaces andcross-sections was also investigated through the SEM mi-crographies obtained with a Leica Cambridge Stereoscan360 instrument. With the aim to locate the stress concentra-tion areas, the crack sources and the preferred propagationpathway, a fractographic analysis (ASTM C 1322) wasalso performed through SEM observations on the fracturedsurface originated during the 4-points mechanical tests.
3. Results and discussion
3.1. Chemical and phase composition
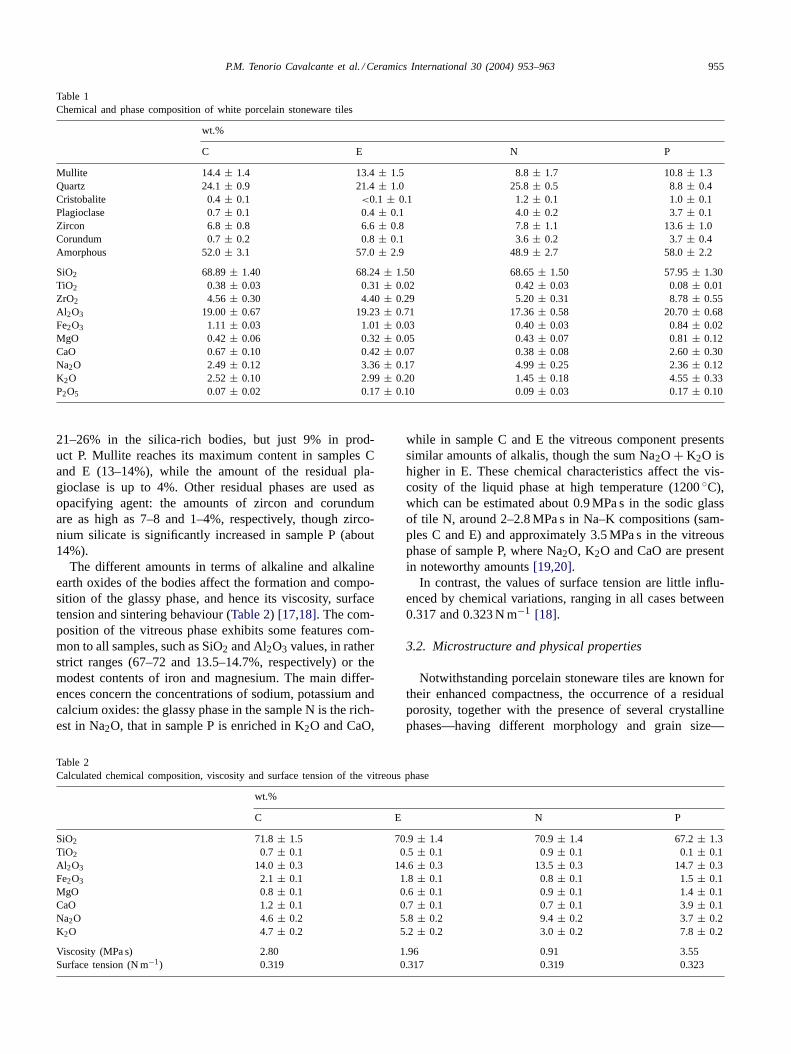
White porcelain stoneware tiles are produced with differ-ent body formulations; chemical data indicate several possi-ble routes, all characterized by very low amounts of iron andtitanium, together with a high content of ZrO2 to achievethe lightest colouring (Table 1). In most bodies, silica andalumina are around 68–69 and 17–19%, respectively, but al-kaline oxides can be more or less abundant, predominantlysodic (body N) or sodic-potassic in similar amounts (bod-ies C and E). A completely different route is followed forbody P: a relatively low amount of silica (58%) is coupledwith high percentages of Al2O3 and ZrO2, while, as fluxing,potassic oxide is prevailing over CaO and Na2O.
The phase composition shows a certain variability ofthe amounts of both new formed and residual components(Table 1). The amorphous phase is the most abundant com-ponent of the ceramic bodies, ranging from 49 to 58%.Quartz is the main crystalline phase, being in the range
P.M. Tenorio Cavalcante et al. / Ceramics International 30 (2004) 953–963 955
Table 1Chemical and phase composition of white porcelain stoneware tiles
wt.%
C E N P
Mullite 14.4 ± 1.4 13.4± 1.5 8.8± 1.7 10.8± 1.3Quartz 24.1± 0.9 21.4± 1.0 25.8± 0.5 8.8± 0.4Cristobalite 0.4± 0.1 <0.1 ± 0.1 1.2± 0.1 1.0± 0.1Plagioclase 0.7± 0.1 0.4± 0.1 4.0± 0.2 3.7± 0.1Zircon 6.8± 0.8 6.6± 0.8 7.8± 1.1 13.6± 1.0Corundum 0.7± 0.2 0.8± 0.1 3.6± 0.2 3.7± 0.4Amorphous 52.0± 3.1 57.0± 2.9 48.9± 2.7 58.0± 2.2
SiO2 68.89± 1.40 68.24± 1.50 68.65± 1.50 57.95± 1.30TiO2 0.38 ± 0.03 0.31± 0.02 0.42± 0.03 0.08± 0.01ZrO2 4.56 ± 0.30 4.40± 0.29 5.20± 0.31 8.78± 0.55Al2O3 19.00± 0.67 19.23± 0.71 17.36± 0.58 20.70± 0.68Fe2O3 1.11 ± 0.03 1.01± 0.03 0.40± 0.03 0.84± 0.02MgO 0.42± 0.06 0.32± 0.05 0.43± 0.07 0.81± 0.12CaO 0.67± 0.10 0.42± 0.07 0.38± 0.08 2.60± 0.30Na2O 2.49± 0.12 3.36± 0.17 4.99± 0.25 2.36± 0.12K2O 2.52± 0.10 2.99± 0.20 1.45± 0.18 4.55± 0.33P2O5 0.07 ± 0.02 0.17± 0.10 0.09± 0.03 0.17± 0.10
21–26% in the silica-rich bodies, but just 9% in prod-uct P. Mullite reaches its maximum content in samples Cand E (13–14%), while the amount of the residual pla-gioclase is up to 4%. Other residual phases are used asopacifying agent: the amounts of zircon and corundumare as high as 7–8 and 1–4%, respectively, though zirco-nium silicate is significantly increased in sample P (about14%).
The different amounts in terms of alkaline and alkalineearth oxides of the bodies affect the formation and compo-sition of the glassy phase, and hence its viscosity, surfacetension and sintering behaviour (Table 2) [17,18]. The com-position of the vitreous phase exhibits some features com-mon to all samples, such as SiO2 and Al2O3 values, in ratherstrict ranges (67–72 and 13.5–14.7%, respectively) or themodest contents of iron and magnesium. The main differ-ences concern the concentrations of sodium, potassium andcalcium oxides: the glassy phase in the sample N is the rich-est in Na2O, that in sample P is enriched in K2O and CaO,
Table 2Calculated chemical composition, viscosity and surface tension of the vitreous phase
wt.%
C E N P
SiO2 71.8 ± 1.5 70.9± 1.4 70.9± 1.4 67.2± 1.3TiO2 0.7 ± 0.1 0.5± 0.1 0.9± 0.1 0.1± 0.1Al2O3 14.0 ± 0.3 14.6± 0.3 13.5± 0.3 14.7± 0.3Fe2O3 2.1 ± 0.1 1.8± 0.1 0.8± 0.1 1.5± 0.1MgO 0.8 ± 0.1 0.6± 0.1 0.9± 0.1 1.4± 0.1CaO 1.2± 0.1 0.7± 0.1 0.7± 0.1 3.9± 0.1Na2O 4.6 ± 0.2 5.8± 0.2 9.4± 0.2 3.7± 0.2K2O 4.7 ± 0.2 5.2± 0.2 3.0± 0.2 7.8± 0.2
Viscosity (MPa s) 2.80 1.96 0.91 3.55Surface tension (N m−1) 0.319 0.317 0.319 0.323
while in sample C and E the vitreous component presentssimilar amounts of alkalis, though the sum Na2O + K2O ishigher in E. These chemical characteristics affect the vis-cosity of the liquid phase at high temperature (1200◦C),which can be estimated about 0.9 MPa s in the sodic glassof tile N, around 2–2.8 MPa s in Na–K compositions (sam-ples C and E) and approximately 3.5 MPa s in the vitreousphase of sample P, where Na2O, K2O and CaO are presentin noteworthy amounts[19,20].
In contrast, the values of surface tension are little influ-enced by chemical variations, ranging in all cases between0.317 and 0.323 N m−1 [18].
3.2. Microstructure and physical properties
Notwithstanding porcelain stoneware tiles are known fortheir enhanced compactness, the occurrence of a residualporosity, together with the presence of several crystallinephases—having different morphology and grain size—
956 P.M. Tenorio Cavalcante et al. / Ceramics International 30 (2004) 953–963
Table 3Physical and mechanical properties of white porcelain stoneware tiles
C E N P
Open porosity (vol.%) 0.03± 0.02 0.12± 0.06 0.09± 0.03 0.08± 0.03Water absorption (wt.%) 0.01± 0.01 0.05± 0.02 0.09± 0.01 0.03± 0.01Total porosity (vol.%) 3.77± 0.02 4.88± 0.03 3.39± 0.02 6.04± 0.04Bulk density (g cm−3) 2.47 ± 0.01 2.46± 0.01 2.48± 0.01 2.51± 0.01Specific weight (g cm−3) 2.57 ± 0.02 2.59± 0.02 2.59± 0.02 2.67± 0.033-points flexural strength (MPa) 56.3± 4.3 50.7± 1.9 42.5± 3.4 48.7± 8.74-points flexural strength (MPa) 88.4± 4.5 75.0± 1.5 76.0± 2.1 65.0± 4.1Young modulus (GPa) 77.0± 0.2 69.0± 0.2 72.0± 0.2 74.0± 0.2Fracture toughness (MPa m0.5) 1.31 ± 0.04 1.16± 0.04 1.25± 0.04 1.14± 0.06Critical defect size (�m) 145± 10 158± 8 179± 11 204± 24
enclosed in a glassy matrix, involves the development of avery complex microstructure[2,3].
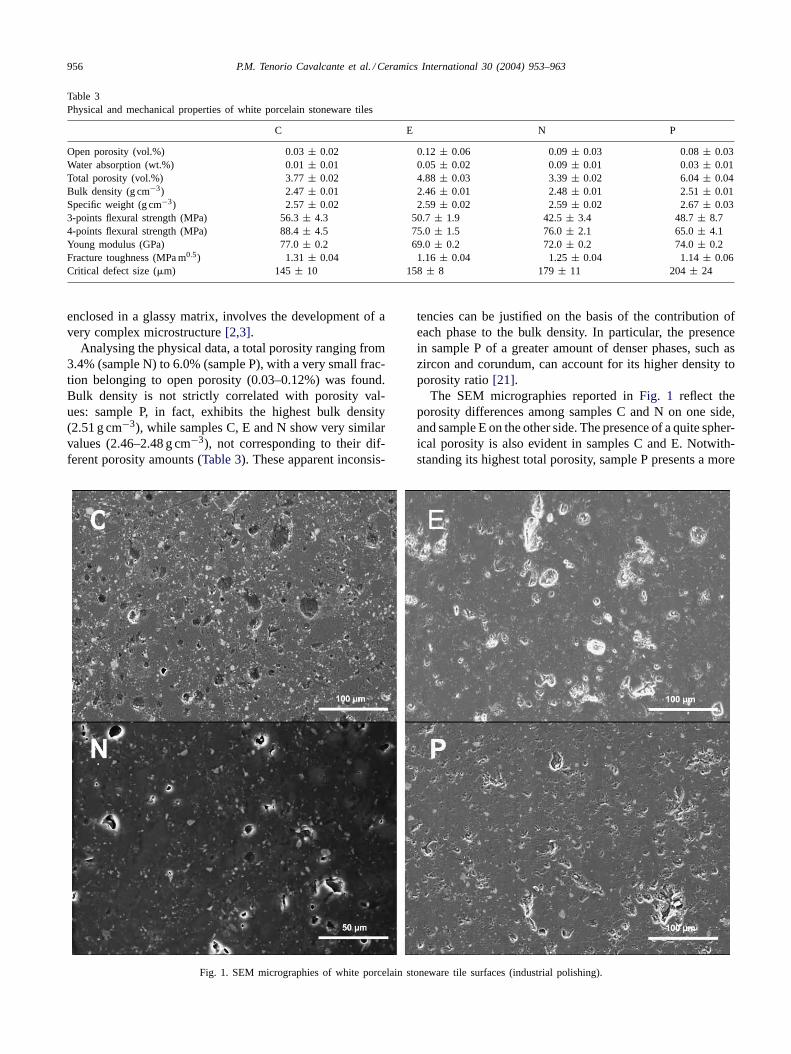
Analysing the physical data, a total porosity ranging from3.4% (sample N) to 6.0% (sample P), with a very small frac-tion belonging to open porosity (0.03–0.12%) was found.Bulk density is not strictly correlated with porosity val-ues: sample P, in fact, exhibits the highest bulk density(2.51 g cm−3), while samples C, E and N show very similarvalues (2.46–2.48 g cm−3), not corresponding to their dif-ferent porosity amounts (Table 3). These apparent inconsis-
Fig. 1. SEM micrographies of white porcelain stoneware tile surfaces (industrial polishing).
tencies can be justified on the basis of the contribution ofeach phase to the bulk density. In particular, the presencein sample P of a greater amount of denser phases, such aszircon and corundum, can account for its higher density toporosity ratio[21].
The SEM micrographies reported inFig. 1 reflect theporosity differences among samples C and N on one side,and sample E on the other side. The presence of a quite spher-ical porosity is also evident in samples C and E. Notwith-standing its highest total porosity, sample P presents a more
P.M. Tenorio Cavalcante et al. / Ceramics International 30 (2004) 953–963 957
Table 4Tribological and functional properties of white porcelain stoneware tiles
C E N P
Average roughness (Ra) (�m) 0.25± 0.07 0.23± 0.08 0.32± 0.08 0.26± 0.06Maximum depression (Rt) (�m) 6.28± 2.86 6.09± 2.70 8.75± 2.80 5.96± 1.77Vickers hardness (GPa) 6.8± 0.8 6.8± 0.6 6.2± 0.6 6.4± 0.7Volume removed by deep abrasion (mm3) 116 ± 1 131± 3 139± 3 139± 3Volume removed by superficial abrasion (mm3) 67 ± 1 71 ± 2 60 ± 1 73 ± 2Wear rate per unit sliding distance (mm3 m−1) 1.229± 0.016 1.347± 0.030 1.510± 0.008 1.465± 0.037Apparent contact area (mm2) 120.0± 1.6 125.0± 2.8 127.5± 0.7 127.5± 3.2
Resistance to stains�E (warm water) (adim.) 0.47± 0.05 1.16± 0.10 3.74± 0.50 0.66± 0.07�E (neutral detergent) (adim.) 0.46± 0.05 0.73± 0.06 3.20± 0.45 0.55± 0.04�E (alkaline detergent) (adim.) 0.09± 0.01 0.27± 0.03 1.40± 0.08 0.15± 0.01
compact microstructure, with pores having a smaller sizeand more irregular shape.
3.3. Mechanical properties
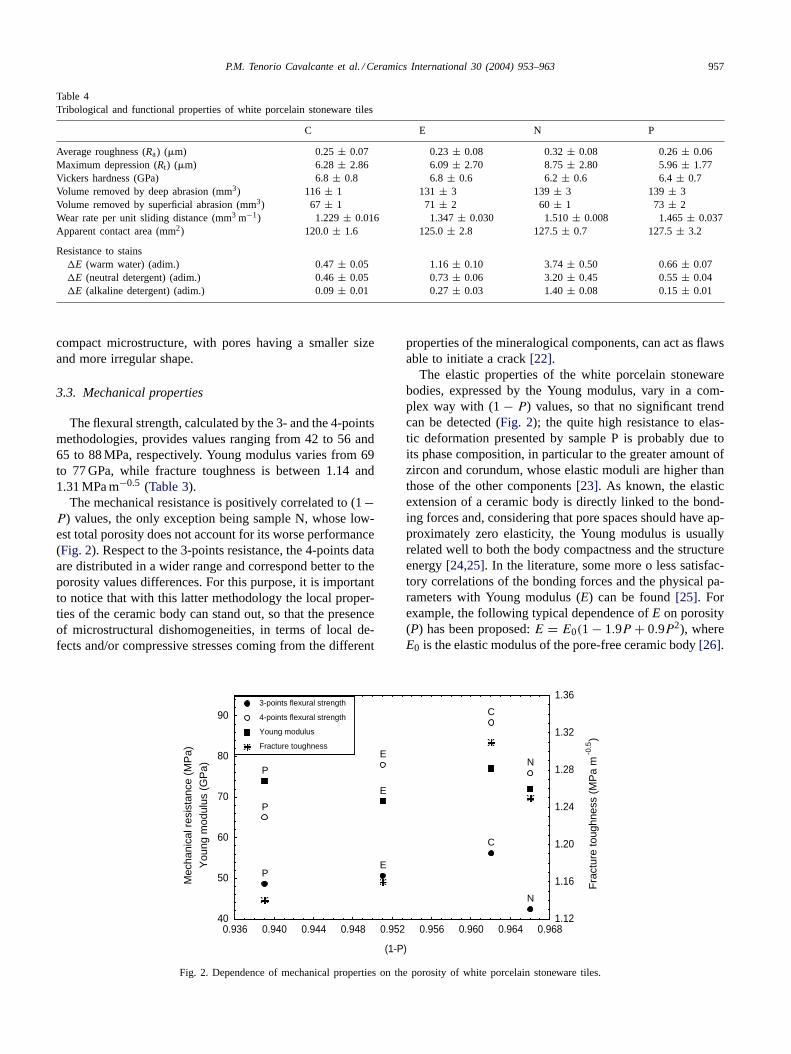
The flexural strength, calculated by the 3- and the 4-pointsmethodologies, provides values ranging from 42 to 56 and65 to 88 MPa, respectively. Young modulus varies from 69to 77 GPa, while fracture toughness is between 1.14 and1.31 MPa m−0.5 (Table 3).
The mechanical resistance is positively correlated to (1−P) values, the only exception being sample N, whose low-est total porosity does not account for its worse performance(Fig. 2). Respect to the 3-points resistance, the 4-points dataare distributed in a wider range and correspond better to theporosity values differences. For this purpose, it is importantto notice that with this latter methodology the local proper-ties of the ceramic body can stand out, so that the presenceof microstructural dishomogeneities, in terms of local de-fects and/or compressive stresses coming from the different
(1-P)
Mec
hani
cal r
esis
tanc
e (M
Pa)
You
ng m
odul
us (
GP
a)
Fra
ctur
e to
ughn
ess
(MP
a m
-0.5
)
C
E
N
P
C
EN
P
E
P
1.12
1.16
1.20
1.24
1.28
1.32
1.36
40
50
60
70
80
90
0.936 0.940 0.944 0.948 0.952 0.956 0.960 0.964 0.968
3-points flexural strength
4-points flexural strength
Young modulus
Fracture toughness
Fig. 2. Dependence of mechanical properties on the porosity of white porcelain stoneware tiles.
properties of the mineralogical components, can act as flawsable to initiate a crack[22].
The elastic properties of the white porcelain stonewarebodies, expressed by the Young modulus, vary in a com-plex way with (1− P) values, so that no significant trendcan be detected (Fig. 2); the quite high resistance to elas-tic deformation presented by sample P is probably due toits phase composition, in particular to the greater amount ofzircon and corundum, whose elastic moduli are higher thanthose of the other components[23]. As known, the elasticextension of a ceramic body is directly linked to the bond-ing forces and, considering that pore spaces should have ap-proximately zero elasticity, the Young modulus is usuallyrelated well to both the body compactness and the structureenergy[24,25]. In the literature, some more o less satisfac-tory correlations of the bonding forces and the physical pa-rameters with Young modulus (E) can be found[25]. Forexample, the following typical dependence ofE on porosity(P) has been proposed:E = E0(1 − 1.9P + 0.9P2), whereE0 is the elastic modulus of the pore-free ceramic body[26].

958 P.M. Tenorio Cavalcante et al. / Ceramics International 30 (2004) 953–963
Mullite (%)
Mec
hani
cal r
esis
tanc
e (M
Pa)
Fra
ctur
e to
ughn
ess
(MP
a m
-0.5
)
C
E
N
P
C
EN
P
C
E
N
P
1.12
1.16
1.20
1.24
1.28
1.32
1.36
40
50
60
70
80
90
8 9 10 11 12 13 14 15
3-points flexural strength
4-points flexural strength
Fracture toughness
Fig. 3. Relationship between mullite content and mechanical properties of white porcelain stoneware tiles.
Nevertheless, these correlations work well for materials withthe same structure (having, e.g. an uniformly distributedporosity) and bond type. In a complex multi-phase system,such as porcelain stoneware, Young modulus depends dra-matically on the phase distribution and geometry, so that thecorrespondence with the proposed theoretical models is verydifficult to find out[23]. The Young modulus of pore-free ce-ramics here considered, calculated from the contribution ofeach mineralogical component according to its weight frac-tion [21], confirms these difficulties: theE0 value of sampleP (83.3 GPa) can be explained by its high content of zirconand corundum; on the other hand, samples C and E exhibit aclearly differentE0 values (82.8 and 75.9 GPa, respectively)notwithstanding their similar phase composition.
As far as the fracture toughness, there is a significant pos-itive correlation with (1−P) so that the higher the porosity,the lower the fracture toughness (Fig. 2). According to theenhanced mechanical properties already mentioned, sampleC exhibits the highest resistance to the fracture propagationas a consequence of a mechanical stress.
In the literature, the strength of porcelain ware is ex-plained through three major theories[27–29]:
(i) the mullite hypothesis (the interlocking of mulliteneedles is responsible for the enhanced strength)[30];
(ii) the matrix reinforcement hypothesis (the differencesin the thermal expansion coefficient between theglassy matrix and the dispersed crystalline particlesproduce strong compressive stresses with a conse-quent ceramic structure reinforcement)[31];
(iii) the dispersion-strengthening hypothesis (the dis-persed particles limit the size of Griffith flaws)[32,33].
The mullite content of the samples here considered is gen-erally related well to their mechanical resistance, calculated
by both 3- and 4-points methodologies: the higher the mul-lite percentage, the higher the flexural strength, so that the“mullite hypothesis” seems to be effective (Fig. 3).
The difference in thermal expansion coefficients betweenthe glassy matrix (m) and the dispersed crystalline phases(p), as well as the Young modulus (E) and the Poisson’sratio (�) values, were utilised to calculate the total stress (σ)on the particle, according to the following equation[27]:
σ = �α�T(1+vm
2Em+ 1−2νp
Ep
)where�α is the difference in thermal expansion coefficientsbetween the glassy matrix and the particle and�T the cool-ing range of the system. The occurrence and nature of cracksin porcelain bodies depend on the expansion coefficients dif-ferences: if the particle contracts more than the matrix, thenσ is negative and cracks around the particle can be found.On the contrary, if the matrix contracts more respect to theparticle, thenσ is positive resulting in radial cracks emanat-ing from the crystalline particle.
An attempt to apply this model to white porcelainstoneware was done taking the thermal expansion coeffi-cients α in the 25–500◦C range,�T = 500◦C and theelastic moduli of each mineralogical component, as reportedin Table 5. For each sample, the thermal expansion coeffi-cient of the amorphous phase was calculated following theAppen’s mathematical model, though it was proposed inthe 20–400◦C range[34].
The σ values obtained highlight that mullite and zirconundergo compressive stresses during cooling that, conse-quently, promote a material strengthening. In fact, whena crack front passes through a compressive stressed re-gion, its propagation is contrasted if no additional externalforces are applied. The calculated stress on the border ofmullite particles is as high as 40–90 MPa approximately,while theσ values for zircon particles are much lower and
P.M. Tenorio Cavalcante et al. / Ceramics International 30 (2004) 953–963 959
Table 5Elastic moduli and thermal expansion coefficients of the mineralogical phases (Shackelford and Alexander[21])
Sample Glass Quartz Mullite Corundum Zircon
Young modulus (GPa) 64.4 94.5 143.1 376.9 165.5Poisson’s ratio (adim.) 0.183 0.078 0.238 0.240 0.2a
Thermal expansion coefficient (MK−1) C 6.0b
E 6.7b 19.3 5.0 7.5 3.8N 7.4b
P 7.3b
a Estimated value.b A.A. Appen, Dokl. Akad. Nauk. SSSR 69 (1949) 841–844.
Table 6Particle stress (MPa) which crystalline phases undergo during cooling ascalculated on the basis of data inTable 5
Phase C E N P
Mullite 41 66 93 89Quartz −370 −350 −330 −330Corundum −0.14 −38 −4.7 −9.4Zircon 0.2 0.2 0.3 0.3
practically negligible (0.2–0.3 MPa) (Table 6). On the otherhand, strong tensile stresses, in the order of 330–370 MPa,are developed around quartz particles, leading to a struc-tural weakening and presumably a particle debonding fromthe matrix. According to these results, the toughening roleplayed by mullite content is evident in samples C, E and
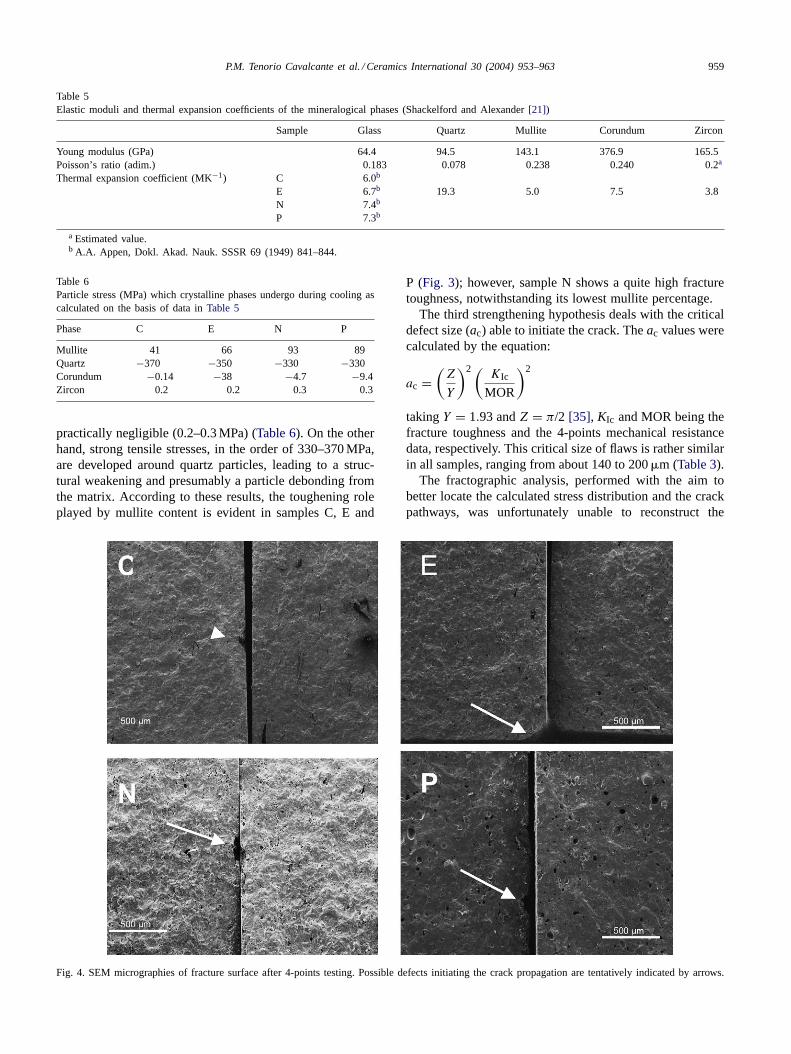
Fig. 4. SEM micrographies of fracture surface after 4-points testing. Possible defects initiating the crack propagation are tentatively indicatedby arrows.
P (Fig. 3); however, sample N shows a quite high fracturetoughness, notwithstanding its lowest mullite percentage.
The third strengthening hypothesis deals with the criticaldefect size (ac) able to initiate the crack. Theac values werecalculated by the equation:
ac =(
Z
Y
)2(KIc
MOR
)2
takingY = 1.93 andZ = π/2 [35], KIc and MOR being thefracture toughness and the 4-points mechanical resistancedata, respectively. This critical size of flaws is rather similarin all samples, ranging from about 140 to 200�m (Table 3).
The fractographic analysis, performed with the aim tobetter locate the calculated stress distribution and the crackpathways, was unfortunately unable to reconstruct the

960 P.M. Tenorio Cavalcante et al. / Ceramics International 30 (2004) 953–963
(1-P)
Sup
erfic
ial a
brad
ed v
olum
e (m
m3)
Dee
p ab
rade
d vo
lum
e (m
m3)
C
E
N
P
C
E
N
110
115
120
125
130
135
140
145
55
60
65
70
75
0.94 0.95 0.96 0.97 0.98 0.99 1.00
Superficial abrasion
Deep abrasion
Fig. 5. Dependence of the volume of material removed by superficial and deep abrasion on the porosity of white porcelain stoneware tiles.
sequence and cause of the fracture[36]. As a matter offact, the typical fracture features were extremely difficultto be detected through the conventional SEM observations(Fig. 4). Nevertheless, in some cases it was possible to pointout the origin of the fracture, that seems attributable to su-perficial flaws (e.g. C, E and P inFig. 4) or edge defects(i.e. sample E).
No flaw of a dimension analogous to the critical defectsize was observed. Probably, the crack is caused by a co-alescence of several dishomogeneities (pores, grains, etc.)smaller than 140–200�m [37]. This phenomenon dependsto a large extent on the particular microstructure of porce-lain stoneware, which can be considered as a composite mi-crostressed material, where the presence of porosity, as wellas of mineralogical components having a different reactiveinterface with the glassy matrix, determines a low energyfracture[29,32,37].
Mullite (%)
Vol
ume
of a
brad
ed m
ater
ial (
mm
3 )
Vic
kers
har
dnes
s (G
Pa)
C
E
N P
CE
N
P
6.1
6.2
6.3
6.4
6.5
6.6
6.7
6.8
6.9
116
120
124
128
132
136
140
144
8 9 10 11 12 13 14 15
Deep abrasion
Vickers hardness
Fig. 6. Dependence of the volume of material removed by deep abrasion and Vickers hardness on mullite content of white porcelain stoneware tiles.
3.4. Tribological properties
The surface wear resistance was evaluated in terms ofvolume of material removed after superficial (60–73 mm3)and deep abrasion (116–139 mm3). Both these methodolo-gies provide perfectly correlated data for samples C, E andP, while sample N shows a contradictory behaviour result-ing as the most and the less resistant to superficial and deepabrasion, respectively (Table 4). A significant negative rela-tionship comes out when the volume of abraded material iscorrelated with (1− P), with the anomalous data of sampleN whose porosity does not account for its wear resistance(Fig. 5). The Vickers microhardness of the other samplesvaries from 6.4 GPa of P to 6.8 GPa of E and C, roughly cor-responding to the porosity scale; however, the surface hard-ness is clearly enhanced by mullite (Fig. 6). In this case,the behaviour of sample N is completely consistent with its
P.M. Tenorio Cavalcante et al. / Ceramics International 30 (2004) 953–963 961
Observed wear rate (mm 3 m-1 )
Cal
cula
ted
wea
r ra
te (
mm
3 m-1
)
C
E
N
P
1.20
1.26
1.32
1.38
1.44
1.50
1.56
1.20 1.26 1.32 1.38 1.44 1.50
y = 1.058x – 0.087
R2 = 0.9383
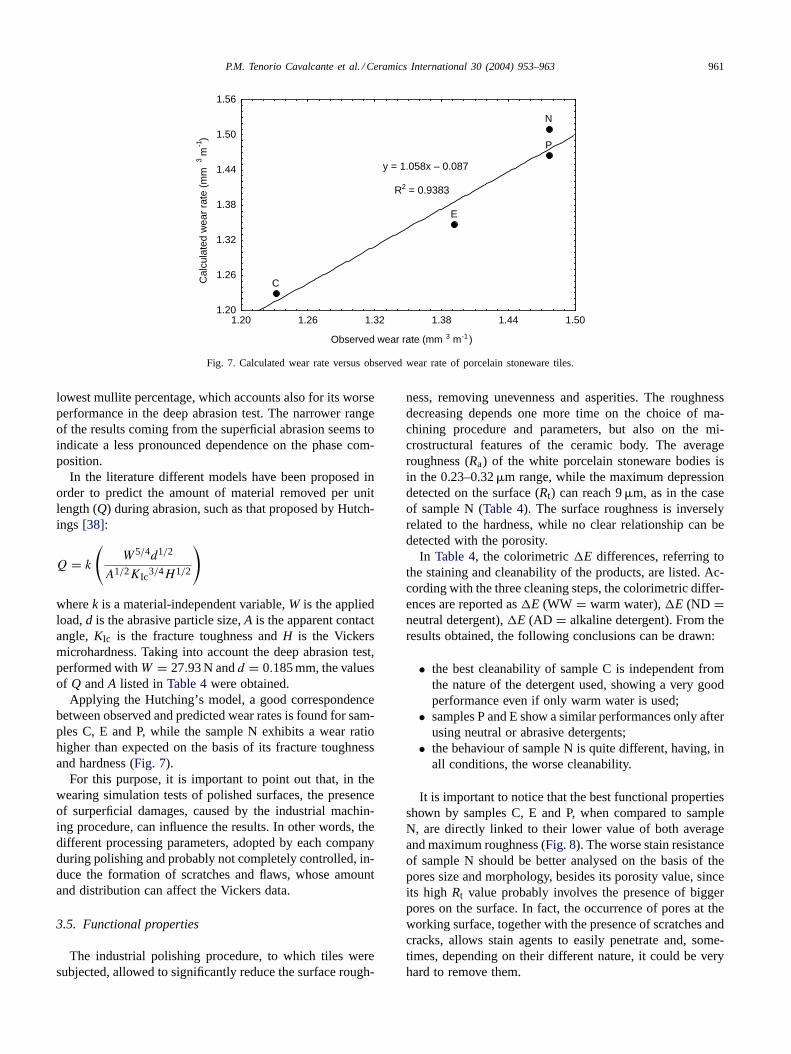
Fig. 7. Calculated wear rate versus observed wear rate of porcelain stoneware tiles.
lowest mullite percentage, which accounts also for its worseperformance in the deep abrasion test. The narrower rangeof the results coming from the superficial abrasion seems toindicate a less pronounced dependence on the phase com-position.
In the literature different models have been proposed inorder to predict the amount of material removed per unitlength (Q) during abrasion, such as that proposed by Hutch-ings [38]:
Q = k
(W5/4d1/2
A1/2KIc3/4H1/2
)
wherek is a material-independent variable,W is the appliedload,d is the abrasive particle size,A is the apparent contactangle,KIc is the fracture toughness andH is the Vickersmicrohardness. Taking into account the deep abrasion test,performed withW = 27.93 N andd = 0.185 mm, the valuesof Q andA listed inTable 4were obtained.
Applying the Hutching’s model, a good correspondencebetween observed and predicted wear rates is found for sam-ples C, E and P, while the sample N exhibits a wear ratiohigher than expected on the basis of its fracture toughnessand hardness (Fig. 7).
For this purpose, it is important to point out that, in thewearing simulation tests of polished surfaces, the presenceof surperficial damages, caused by the industrial machin-ing procedure, can influence the results. In other words, thedifferent processing parameters, adopted by each companyduring polishing and probably not completely controlled, in-duce the formation of scratches and flaws, whose amountand distribution can affect the Vickers data.
3.5. Functional properties
The industrial polishing procedure, to which tiles weresubjected, allowed to significantly reduce the surface rough-
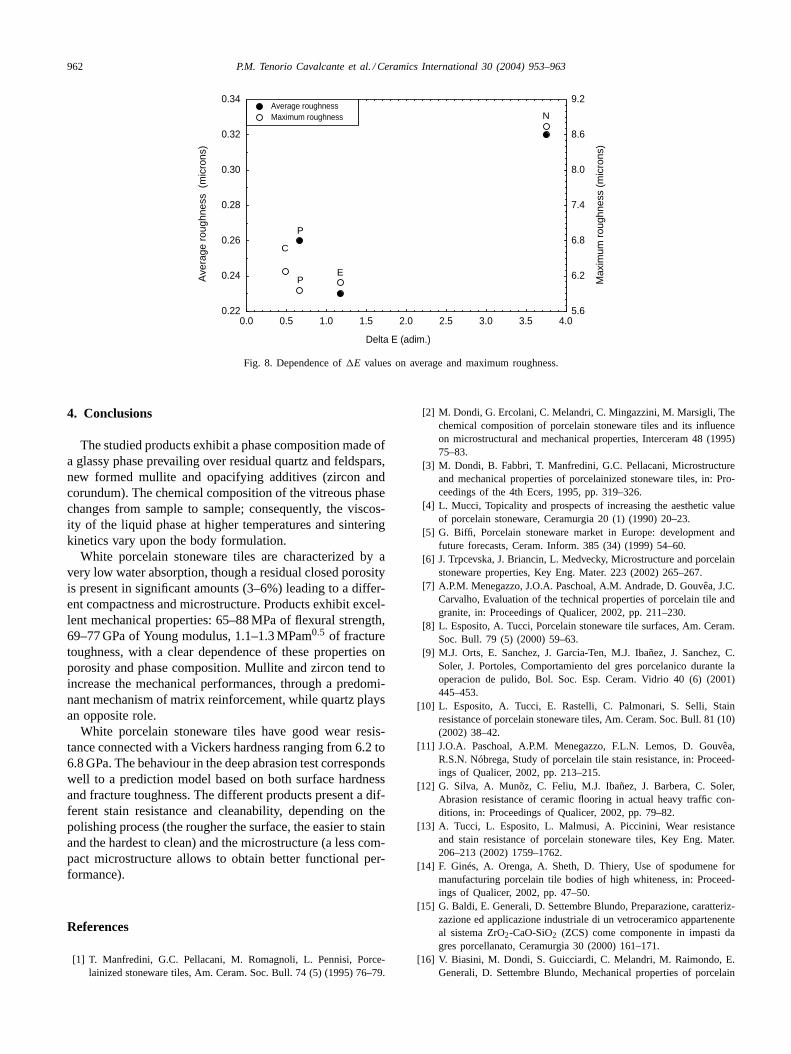
ness, removing unevenness and asperities. The roughnessdecreasing depends one more time on the choice of ma-chining procedure and parameters, but also on the mi-crostructural features of the ceramic body. The averageroughness (Ra) of the white porcelain stoneware bodies isin the 0.23–0.32�m range, while the maximum depressiondetected on the surface (Rt) can reach 9�m, as in the caseof sample N (Table 4). The surface roughness is inverselyrelated to the hardness, while no clear relationship can bedetected with the porosity.
In Table 4, the colorimetric�E differences, referring tothe staining and cleanability of the products, are listed. Ac-cording with the three cleaning steps, the colorimetric differ-ences are reported as�E (WW = warm water),�E (ND =neutral detergent),�E (AD = alkaline detergent). From theresults obtained, the following conclusions can be drawn:
• the best cleanability of sample C is independent fromthe nature of the detergent used, showing a very goodperformance even if only warm water is used;
• samples P and E show a similar performances only afterusing neutral or abrasive detergents;
• the behaviour of sample N is quite different, having, inall conditions, the worse cleanability.
It is important to notice that the best functional propertiesshown by samples C, E and P, when compared to sampleN, are directly linked to their lower value of both averageand maximum roughness (Fig. 8). The worse stain resistanceof sample N should be better analysed on the basis of thepores size and morphology, besides its porosity value, sinceits high Rt value probably involves the presence of biggerpores on the surface. In fact, the occurrence of pores at theworking surface, together with the presence of scratches andcracks, allows stain agents to easily penetrate and, some-times, depending on their different nature, it could be veryhard to remove them.
962 P.M. Tenorio Cavalcante et al. / Ceramics International 30 (2004) 953–963
Delta E (adim.)
Ave
rage
rou
ghne
ss (
mic
rons
)
Max
imum
rou
ghne
ss (
mic
rons
)
C
P
E
N
P
5.6
6.2
6.8
7.4
8.0
8.6
9.2
0.22
0.24
0.26
0.28
0.30
0.32
0.34
0.0 0.5 1.0 1.5 2.0 2.5 3.0 3.5 4.0
Average roughnessMaximum roughness
Fig. 8. Dependence of�E values on average and maximum roughness.
4. Conclusions
The studied products exhibit a phase composition made ofa glassy phase prevailing over residual quartz and feldspars,new formed mullite and opacifying additives (zircon andcorundum). The chemical composition of the vitreous phasechanges from sample to sample; consequently, the viscos-ity of the liquid phase at higher temperatures and sinteringkinetics vary upon the body formulation.
White porcelain stoneware tiles are characterized by avery low water absorption, though a residual closed porosityis present in significant amounts (3–6%) leading to a differ-ent compactness and microstructure. Products exhibit excel-lent mechanical properties: 65–88 MPa of flexural strength,69–77 GPa of Young modulus, 1.1–1.3 MPam0.5 of fracturetoughness, with a clear dependence of these properties onporosity and phase composition. Mullite and zircon tend toincrease the mechanical performances, through a predomi-nant mechanism of matrix reinforcement, while quartz playsan opposite role.
White porcelain stoneware tiles have good wear resis-tance connected with a Vickers hardness ranging from 6.2 to6.8 GPa. The behaviour in the deep abrasion test correspondswell to a prediction model based on both surface hardnessand fracture toughness. The different products present a dif-ferent stain resistance and cleanability, depending on thepolishing process (the rougher the surface, the easier to stainand the hardest to clean) and the microstructure (a less com-pact microstructure allows to obtain better functional per-formance).
References
[1] T. Manfredini, G.C. Pellacani, M. Romagnoli, L. Pennisi, Porce-lainized stoneware tiles, Am. Ceram. Soc. Bull. 74 (5) (1995) 76–79.
[2] M. Dondi, G. Ercolani, C. Melandri, C. Mingazzini, M. Marsigli, Thechemical composition of porcelain stoneware tiles and its influenceon microstructural and mechanical properties, Interceram 48 (1995)75–83.
[3] M. Dondi, B. Fabbri, T. Manfredini, G.C. Pellacani, Microstructureand mechanical properties of porcelainized stoneware tiles, in: Pro-ceedings of the 4th Ecers, 1995, pp. 319–326.
[4] L. Mucci, Topicality and prospects of increasing the aesthetic valueof porcelain stoneware, Ceramurgia 20 (1) (1990) 20–23.
[5] G. Biffi, Porcelain stoneware market in Europe: development andfuture forecasts, Ceram. Inform. 385 (34) (1999) 54–60.
[6] J. Trpcevska, J. Briancin, L. Medvecky, Microstructure and porcelainstoneware properties, Key Eng. Mater. 223 (2002) 265–267.
[7] A.P.M. Menegazzo, J.O.A. Paschoal, A.M. Andrade, D. Gouvea, J.C.Carvalho, Evaluation of the technical properties of porcelain tile andgranite, in: Proceedings of Qualicer, 2002, pp. 211–230.
[8] L. Esposito, A. Tucci, Porcelain stoneware tile surfaces, Am. Ceram.Soc. Bull. 79 (5) (2000) 59–63.
[9] M.J. Orts, E. Sanchez, J. Garcia-Ten, M.J. Ibañez, J. Sanchez, C.Soler, J. Portoles, Comportamiento del gres porcelanico durante laoperacion de pulido, Bol. Soc. Esp. Ceram. Vidrio 40 (6) (2001)445–453.
[10] L. Esposito, A. Tucci, E. Rastelli, C. Palmonari, S. Selli, Stainresistance of porcelain stoneware tiles, Am. Ceram. Soc. Bull. 81 (10)(2002) 38–42.
[11] J.O.A. Paschoal, A.P.M. Menegazzo, F.L.N. Lemos, D. Gouvea,R.S.N. Nóbrega, Study of porcelain tile stain resistance, in: Proceed-ings of Qualicer, 2002, pp. 213–215.
[12] G. Silva, A. Munõz, C. Feliu, M.J. Ibañez, J. Barbera, C. Soler,Abrasion resistance of ceramic flooring in actual heavy traffic con-ditions, in: Proceedings of Qualicer, 2002, pp. 79–82.
[13] A. Tucci, L. Esposito, L. Malmusi, A. Piccinini, Wear resistanceand stain resistance of porcelain stoneware tiles, Key Eng. Mater.206–213 (2002) 1759–1762.
[14] F. Ginés, A. Orenga, A. Sheth, D. Thiery, Use of spodumene formanufacturing porcelain tile bodies of high whiteness, in: Proceed-ings of Qualicer, 2002, pp. 47–50.
[15] G. Baldi, E. Generali, D. Settembre Blundo, Preparazione, caratteriz-zazione ed applicazione industriale di un vetroceramico appartenenteal sistema ZrO2-CaO-SiO2 (ZCS) come componente in impasti dagres porcellanato, Ceramurgia 30 (2000) 161–171.
[16] V. Biasini, M. Dondi, S. Guicciardi, C. Melandri, M. Raimondo, E.Generali, D. Settembre Blundo, Mechanical properties of porcelain
P.M. Tenorio Cavalcante et al. / Ceramics International 30 (2004) 953–963 963
stoneware tiles: the effect of glass ceramic system, Key Eng. Mater.206–213 (2002) 1799–1802.
[17] T. Lakatos, L.-G. Johansson, B. Simmingsköld, Viscosity temperaturerelations in the glass system SiO2–Al2O3–Na2O–K2O–CaO–MgOin the composition range of technical glasses, Glass Technol. 13 (3)(1972) 88–95.
[18] F. Cambier, A. Leriche, Vitrification, Materials Science andTechnology—A Comprehensive Treatment, vol. 17B, Processing ofCeramics, Part II, VCH, 1996.
[19] G. Bonetti, Impostazioni matematiche per calcolare le proprietà deivetri in funzione della composizione chimica. III parte: viscosità,Rivista della Stazione Sperimentale del Vetro (4) (1998) 175–190.
[20] G. Bonetti, Impostazioni matematiche per calcolare le proprietà deivetri in funzione della composizione chimica. IV parte: viscosità,Rivista della Stazione Sperimentale del Vetro (6) (1998) 271–286.
[21] J.F. Shackelford, W. Alexander, Material Science and EngineeringHandbook, 3rd ed., CRC Press, 2001.
[22] N.E. Dowling, Mechanical Behavior of Materials, Prentice-Hall Int.Ed., 1993.
[23] W.D. Kingery, H.K. Bowen, D.R. Uhlmann, Introduction to Ceramics,2nd ed., Wiley, New York, 1976.
[24] A.R. Boccaccini, G. Ondracek, O. Postel, Module de Young deCéramiques Poreuses, Silicates Ind. 9, 10 (1994) 295–299.
[25] A.S. Wagh, R.B. Poeppel, J.P. Singh, Open pore description of mec-hanical properties of ceramics, J. Mater. Sci. 26 (1991) 3862–3868.
[26] J.K. MacKenzie, Proc. Phys. Soc. (Lond.) B63 (1950) 2.[27] W.M. Carty, U. Senapati, Porcelain-raw materials, processing, phase
evolution, and mechanical behavior, J. Am. Ceram. Soc. 81 (1)(1998) 3–20.
[28] S. Maity, B.K. Sarkar, Phase analysis and role of microstructure inthe development of high strength porcelains, Ceram. Int. 24 (1998)259–264.
[29] C. Leonelli, P. Veronesi, V. Cannillo, G.C. Pellicani, A.R. Boccaccini,Porcelainized stoneware as a composite material: identification ofstrengthening and toughening mechanisms, Tile Brick Int. 17 (4)(2001) 238–244.
[30] L. Mattyasovszky-Zsolnay, Mechanical strength of porcelain, J. Am.Ceram. Soc. 40 (1957) 299–306.
[31] D. Weyl, Influence of internal strains on the texture and mechanicalstrength of porcelains, Ber. Deut. Keram. Ges. 36 (1959) 319–324.
[32] L. Esposito, E. Rastelli, A. Tucci, A. Albertazzi, Porcelain stonewarematrix composite: aspects and perspectives, Silicates Ind. 65 (1/2)(2000) 3–7.
[33] S. Maity, B.K. Sarkar, Development of high-strength whiteware bod-ies, J. Eur. Ceram. Soc. 16 (1996) 1083–1088.
[34] G. Bonetti, Impostazioni matematiche per calcolare le proprietà deivetri in funzione della composizione chimica. I: Massa volumica,dilatazione termica, Rivista della Stazione Sperimentale del Vetro(3) (1997) 111–125.
[35] A.D. Papargyris, R.D. Cooke, Structure and mechanical propertiesof kaolin based ceramics, Br. Ceram. Trans. 95 (3) (1996) 107–120.
[36] ASTM C 1322, Fractography and Characterization of Fracture Ori-gins in Advanced Ceramics, 1996.
[37] G.D. Quinn, J.J. Swab, Fractography and estimates of fracture originsize from fracture mechanics, Ceram. Eng. Sci. Proc. 17 (3) (1996)51–58.
[38] I.M. Hutchings, Tribology: Friction and Wear of Engineering Mate-rials, Edward Arnold, London, 1992.
Rio de Janeiro, 29 de Julho de 2004.
Salvador de Almeida
Chefe Substituto do Serviço de Processamento Mineral - SEPM
Adão Benvindo da Luz
Chefe Substituto da Coordenação de Inovação Tecnológica - CTEC
Fernando A. Freitas Lins
Diretor em Exercício
Related Documents