sustainability Article The Influence of Liberalization on Innovation, Performance, and Competition Level of Insurance Industry in Indonesia Tulus Suryanto 1, * , Darul Dimasqy 2 , Reza Ronaldo 3 , Mahjus Ekananda 4 , Teuku Heru Dinata 2 and Indra Tumbelaka 2 1 Faculty of Economics and Islamic Business, Raden Intan State Islamic University of Lampung, Bandar Lampung 35131, Indonesia 2 Departement of Research in Financial Service, Sector Financial Service Authority (OJK), Jakarta Pusat 10710, Indonesia; [email protected] (D.D.); [email protected] (T.H.D.); [email protected] (I.T.) 3 College of Islamic Economics and Business (STEBI) Lampung, Pesawaran 35371, Indonesia; [email protected] 4 Department of Economics, Faculty of Economics & Business, University of Indonesia, Depok 16424, Indonesia; [email protected] * Correspondence: [email protected] Received: 16 October 2020; Accepted: 15 December 2020; Published: 18 December 2020 Abstract: This study aims to reveal the impact of liberalization on innovation, performance, and the level of competition for insurance industry players in Indonesia based on insurance data from 2006 to 2018. The research method used is quantitative with the support of panel data. The analysis technique to explain the findings uses an aggregate model and Threshold Regression analysis. Descriptive and econometric research types were chosen to make it easier to explain the findings. From the results of data analysis using three experimental models, it shows three findings. First, in the aggregate, there is a significant negative relationship between liberalization and innovation. In the Threshold Regression model, a negative impact occurs on companies with low premium income, whereas in high premium income companies, the result is positive. This is due to the availability of resources to large companies to optimize the adaptation of liberalization in terms of innovation. Second, higher liberalization can encourage insurance companies to perform more efficiently and increase net premium income. Third, the negative impact of liberalization on competition shows that the higher the deregulation, the lower the game. These findings indicate that in the aggregate, global insurance financial liberalization has had a significant impact on the development of the insurance industry sector in Indonesia. However, liberalization can be different for groups of small companies and groups of large companies. The expected implication is that the government needs to adopt a long-term policy strategy that can encourage the sustainability of insurance companies: both high-income companies and low-premium-income companies. Besides this, it is hoped that insurance companies pay more attention to innovation, significantly improving the quality of human resources as a competitive advantage in facing global competition. Keywords: competition; innovation; insurance; liberalization; performance 1. Introduction In terms of capital provisions, the Indonesian insurance industry is quite open to foreign investors. Based on the requirements of Government Regulation Number 14 of 2018 concerning Foreign Ownership in Insurance Companies, which was later amended by Government Regulation Number 3 of 2020 Sustainability 2020, 12, 10620; doi:10.3390/su122410620 www.mdpi.com/journal/sustainability

Welcome message from author
This document is posted to help you gain knowledge. Please leave a comment to let me know what you think about it! Share it to your friends and learn new things together.
Transcript
sustainability
Article
The Influence of Liberalization on Innovation,Performance, and Competition Level of InsuranceIndustry in Indonesia
Tulus Suryanto 1,* , Darul Dimasqy 2, Reza Ronaldo 3, Mahjus Ekananda 4, Teuku Heru Dinata 2
and Indra Tumbelaka 2
1 Faculty of Economics and Islamic Business, Raden Intan State Islamic University of Lampung,Bandar Lampung 35131, Indonesia
2 Departement of Research in Financial Service, Sector Financial Service Authority (OJK),Jakarta Pusat 10710, Indonesia; [email protected] (D.D.); [email protected] (T.H.D.);[email protected] (I.T.)
3 College of Islamic Economics and Business (STEBI) Lampung, Pesawaran 35371, Indonesia;[email protected]
4 Department of Economics, Faculty of Economics & Business, University of Indonesia,Depok 16424, Indonesia; [email protected]
* Correspondence: [email protected]
Received: 16 October 2020; Accepted: 15 December 2020; Published: 18 December 2020�����������������
Abstract: This study aims to reveal the impact of liberalization on innovation, performance, and the levelof competition for insurance industry players in Indonesia based on insurance data from 2006 to2018. The research method used is quantitative with the support of panel data. The analysis techniqueto explain the findings uses an aggregate model and Threshold Regression analysis. Descriptive andeconometric research types were chosen to make it easier to explain the findings. From the resultsof data analysis using three experimental models, it shows three findings. First, in the aggregate,there is a significant negative relationship between liberalization and innovation. In the ThresholdRegression model, a negative impact occurs on companies with low premium income, whereas inhigh premium income companies, the result is positive. This is due to the availability of resourcesto large companies to optimize the adaptation of liberalization in terms of innovation. Second,higher liberalization can encourage insurance companies to perform more efficiently and increase netpremium income. Third, the negative impact of liberalization on competition shows that the higherthe deregulation, the lower the game. These findings indicate that in the aggregate, global insurancefinancial liberalization has had a significant impact on the development of the insurance industrysector in Indonesia. However, liberalization can be different for groups of small companies and groupsof large companies. The expected implication is that the government needs to adopt a long-term policystrategy that can encourage the sustainability of insurance companies: both high-income companiesand low-premium-income companies. Besides this, it is hoped that insurance companies pay moreattention to innovation, significantly improving the quality of human resources as a competitiveadvantage in facing global competition.
Keywords: competition; innovation; insurance; liberalization; performance
1. Introduction
In terms of capital provisions, the Indonesian insurance industry is quite open to foreign investors.Based on the requirements of Government Regulation Number 14 of 2018 concerning Foreign Ownershipin Insurance Companies, which was later amended by Government Regulation Number 3 of 2020
Sustainability 2020, 12, 10620; doi:10.3390/su122410620 www.mdpi.com/journal/sustainability
Sustainability 2020, 12, 10620 2 of 25
regarding Amendments to Government Regulation Number 14 of 2018 relating to Foreign Ownershipin Insurance Companies, the maximum limit of ownership of insurance companies by foreign partiesis up to 80% of the paid-up capital. Also, this provision is exempt for public companies and insurancecompanies, which, at the time of stipulation, are owned by foreign parties with an ownership percentageof more than 80%. These provisions are still more lenient than similar conditions in other ASEANcountries such as Thailand and Malaysia. In this case, the two countries set the maximum foreignownership requirement of 25% and 70%, respectively [1].
Insurance services have a central role in modern society. The empirical evaluation of competitionamong insurance companies also improved after deregulation [2]. After liberalization, the amount ofinsurance in the market began to increase, which led to a significant decrease in market concentration [3].At the ideal level, liberalization adaptation can have a positive impact on the development ofthe insurance industry in a country [4–8]. The impact of liberalization is initially U-shaped duringcontraction and is linear, but in the second period, it seems that liberalization is superior to before itimplemented [9].
Liberalization can provide benefits in supporting the special skills needed to encourage competencyimprovement of the insurance industry players whose development is still at an early stage [2].The findings differ from previous studies, which revealed that financial liberalization has an inverseimpact on the performance of insurance companies. The existence of liberalization has encouraged mostinsurance companies, consisting of 1324 companies registered with The Organization for EconomicCo-operation and Development (OECD), to take more risks to survive [10]. The negative impact ofliberalization is due to ineffective and inefficient ways of developing and government policies inthe insurance sector [11]. The liberalization of policies in the insurance industry has increased the riskof using funds, and this is a significant difficulty facing the insurance industry [12].
In the insurance industry, board composition has a positive relationship with the overall risk-takingof a company [13]. Besides this, specific expertise support can obtain through the assignment of foreignworkers with qualifications in actuarial and insurance management, which is possible due to foreigncompany owners who are more experienced in managing insurance companies in a relatively maturemarket [14]. Also, foreign participation can provide much-needed capital support for industry playersto explore market potentials that have not optimal exploited.
Through technical support and capital capacity, liberalization expects to have a positive impactin the form of opportunities for innovation in the use of information technology aimed at increasingthe effectiveness and efficiency of the insurance company’s business processes [7]. One example ofinnovation in information technology includes online marketing of insurance products, for example,by utilizing e-commerce platforms. Also, information technology can be used by insurance companiesto provide convenience for consumers in the underwriting process and increase the speed ofthe claim process.
Meanwhile, from a customer perspective, liberalization can also provide benefits in developinga more competitive insurance market. The increase in the intensity of competition among insuranceindustry players expects a stimulus to increase the availability of quality insurance services to customersat affordable premium rates. Society wants an insurance liberalization that leads to continuousinnovation and improvement [15].
However, the positive impact of liberalization on the development of the insurance industry inIndonesia is still not optimal. Insurance is currently not considered an essential indicator of a marketeconomy, a source of investment, and economic stability required for its development [11]. There areindications that the level of liberalization of the insurance industry in Indonesia is not directlyproportional to the performance of the sector, especially when compared to other countries, especiallyin the ASEAN region. As an illustration, the estimated value of Indonesia’s insurance premiums in2018, amounting to USD 20,383 million, is still behind when compared to the estimated premiumvalue of Thailand in the same period, which is USD 26,622 million (Swiss Re Institute, 2019) [16].
Sustainability 2020, 12, 10620 3 of 25
If the stakeholders do not respond wisely and with the right strategy, liberalization becomes a challengefor stakeholders [6].
The main challenge for the insurance industry is increasing market competition [17]. Apart fromthat, Indonesia is still lagging behind the two countries regarding density and insurance penetration.Based on Swiss Re data, Indonesia’s insurance density is ranked 72 (seventy-two) globally with a valueof USD 76 per capita, while Malaysia and Thailand were respectively ranked 39 (thirty-nine) and 47(forty-seven), with a much higher density value of USD 518 and USD 385. When viewed based oninsurance penetration indicators, Indonesia also lags behind the two countries and even ranks lowerthan Vietnam [16].
This is related to the Generalized System Preferences Review (GSP Review) process, the impactof the negotiation process with the United States and the United Kingdom. Indonesia is faced witha difficult choice to implement a broader liberalization of international trade by imposing relaxation onmandatory arrangements. The minimum limit of self-retention and placement of domestic reinsurancehas been enacted for domestic insurance companies. Thus, the future policy direction will open upmore expansive space for domestic insurance companies in terms of managing their risks and in termsof organizing reinsurance transactions with reinsurance partners abroad.
Indonesia needs to continue to liberalize the insurance industry sector. Financial Services Authority(OJK) and the insurance industry players in Indonesia need to formulate a regulatory framework andbusiness management strategy that can optimize the benefits of this liberalization trend. At the sametime, it is important to anticipate potential negative impacts due to the liberalization of the insuranceindustry on domestic industry players and the national economy.
Previous research analyzed the impact of liberalization through indicators of the marketing mix,service quality, and insurance awareness [8]. Other findings were made to see the development ofthe insurance market and the liberalization of the financial system on bank performance [18–20].Financial liberalization has resulted in the fragility of the banking sector with a strong institutionalenvironment [21]. Most of the research on insurance liberalization has been carried out in India [22–24],for example, in the analysis of the performance of insurance companies during the liberalization periodin India [25]. Research on the impact of liberalization has also been conducted in Korea, Bangladesh,Nepal, the Philippines, Taiwan, Malaysia, and Thailand [26,27]. Liberalization and capacity building forinsurance services in Africa, excluding South Africa, was found to have the lowest regional insurancepenetration in the world [28]. Few literature reviews examine the impact of insurance liberalizationin Indonesia. Unlike previous studies, the main objective of this study is to determine the effect ofliberalization using a research model consisting of innovation, performance, and competition thatfocuses on the following: (1) innovation in the use of information technology in the fields of sales,staffing, and education carried out by insurance companies; (2) performance of insurance companies;(3) the intensity of the performance of the insurance company, and (4) produce recommendations and/orbusiness management strategies that can optimize the use of liberalization to encourage industrialgrowth in Indonesia.
2. Materials and Methods
Quantitative Method: This research was conducted using quantitative research methods.The analysis strategy used to answer the problem formulation is descriptive and econometric analysis.Threshold Autoregressive (TAR) analysis uses time-series data with the support of panel data fromall insurance companies in Indonesia. TAR aims to deepen the study for various regimes for certaineconomic variables using the dummy method [29]. In conducting the panel data estimation method,the rule of thumb method was used [30]. Regression analysis was used to identify the relationshipbetween insurance liberalization and innovation, in the form of technology use in the insurance companyprocess, insurance company performance, and the level of competition in the insurance industry sectoron liberalization. The proposed econometric model is an innovation model influenced by liberalization,and the internal variables of Insurance (IntInsVar) and macroeconomic variables (MacVar) were used
Sustainability 2020, 12, 10620 4 of 25
as control variables. The insurance financial liberalization index represents the liberalization variable.The methods and experiments in modeling are as follows:
Model I: Innovation
Innovationjt = f (liberalizationjt, IntInsVar1t, MacVar1it)
Model II: Competition
Compit = f (liberalizationit, IntInsVar2it, MacVar2it)
Model III: Performance
Performanceit = f (liberalizationit, IntInsVar3it, MacVar3it)
* Variable IntInsVart consists of sales innovation, worker innovation, and educational innovation.
a. Variable MacVart consists of:
(1) Variable INFt, the price of goods is measured by changes in the consumer index that canreflect changes in the prices of goods and services from people’s needs, which uses asparameters for changes in economic activity.
(2) Variable gPDBt (Gross Domestic Product growth) is the increase in the amount of addedvalue generated by all business units in a particular country, or is the total value of finalgoods and services produced by all economic companies used as a parameter of changesin economic activity.
(3) Variable Credit interest rates (SBt) are policy interest rates that reflect the monetary policystance or stance set by Bank Indonesia, which is used as a parameter that leads to volatilityin money market interest rates, which then leads to changes in premiums, especiallyfor tips.
b. Variable Libt is the Liberalization Insurance index measuring liberalization (ILI).
Model 1 explains the impact of liberalization on innovation assuming the internal variables ofinsurance companies and the impact of macro variables as control variables. Increased liberalizationshows that companies are increasingly intensively using resources from a variety of domestic or foreignfactors. The resources and business field of the business are not dependent on national factors butalso international factors. Liberalization will increase efficiency for insurance companies to competeglobally. Then, it is necessary to increase innovation in order to process business more efficiently.Model I is expected to explain the positive effect of insurance company liberalization on innovationthat has been implemented. On the other hand, liberalization is also aimed at increasing the power ofcompetition in the insurance industry.
It is hoped that increased liberalization in insurance companies will increase the efficiency ofthe company, and will increase the competition power of insurance companies. Model II is expectedto explain the positive effect of insurance company liberalization on competition in the insuranceindustry. Increased efficiency will also lower costs and increase the company’s profits. Performanceimprovements are analyzed in Model III. It is hoped that increased liberalization in insurancecompanies will increase the efficiency of the company and will further improve the performance ofinsurance companies.
Innovation, competition, and performance are three measures of the company’s success. However,these three variables indicate a different scope of business issues. Innovation is a corporate strategy tocreate business creativity but requires regular development of large technologies. For small companies,low innovation costs can increase the scale of the economy, but large company innovations have loweconomies of scale. The competition shows a measure of the company’s ability to compete among
Sustainability 2020, 12, 10620 5 of 25
fellow companies in the same industry. The cost of innovation and the strength of the company’scompetition are expected to still improve performance through Return on Equity (ROE).
Literature Search: This research is supported by survey activities that aim to obtain an overviewof the extent to which insurance companies use technology to support their business processes.
Research data: Secondary data is the primary data obtained from insurance data from 2006to 2018. Types of data include (a) data on marketing and other operating expenses obtained fromthe income statement; (b) computer hardware investment data obtained from the financial position;(c) technology use data (insurance company individual data) obtain from non-investment recapitulationdata. Insurance group consolidation data select according to its type, consisting of (1) reinsurance;(2) life insurance; and (3) general insurance. Data can be panel data where i = insurance company,t = 2006–2018, and j = insurance group.
Data analysis technique: In an empirical study, researchers separate different impacts for specificfinancial criteria without using dummy variables. The aim is to see the difference in the effect ofinsurance companies according to the level of profit, the amount of net premium income, and the netpremium using Threshold Fegression analysis techniques. Threshold Fegression is used to selectwhether, at the high-profit level of the insurance company, the impact of LIB still shows the samedirection as the company at a low-profit level; likewise, whether a company with a high amount ofnet premium income will have the same impact as an insurance company with a low amount of netpremium income.
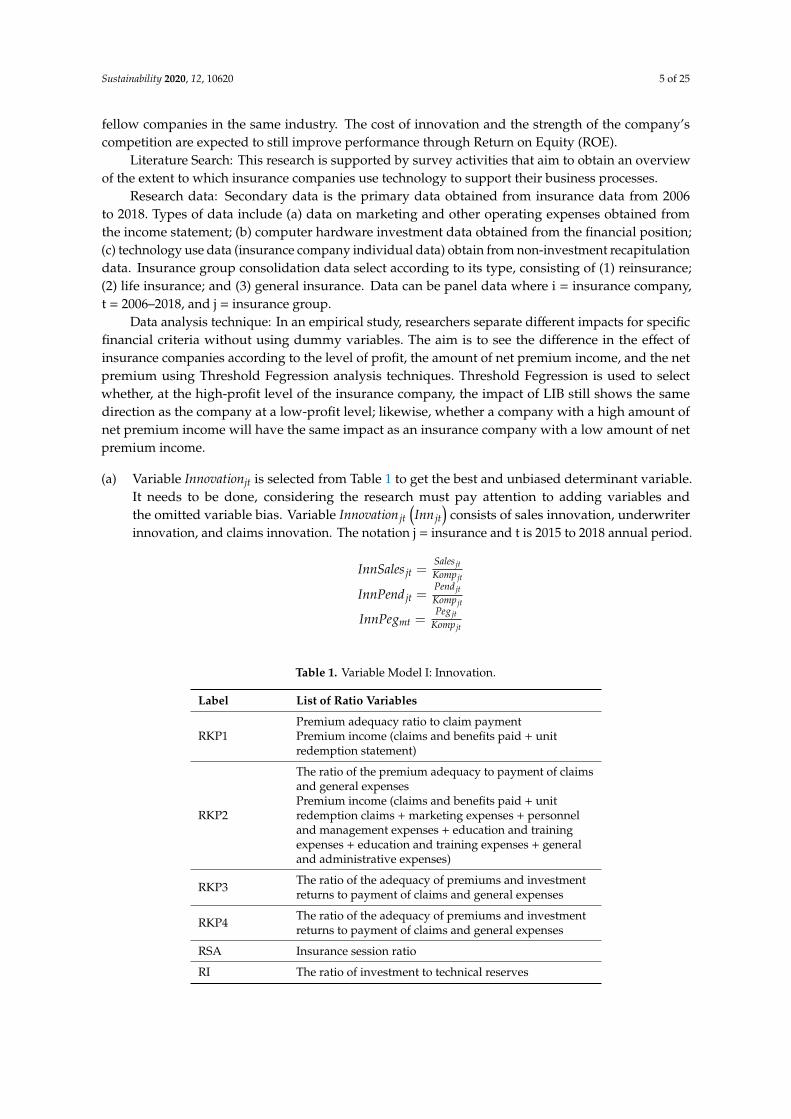
(a) Variable Innovationjt is selected from Table 1 to get the best and unbiased determinant variable.It needs to be done, considering the research must pay attention to adding variables andthe omitted variable bias. Variable Innovation jt
(Inn jt
)consists of sales innovation, underwriter
innovation, and claims innovation. The notation j = insurance and t is 2015 to 2018 annual period.
InnSales jt =Sales jtKomp jt
InnPend jt =Pend jtKomp jt
InnPegmt =Peg jt
Komp jt
Table 1. Variable Model I: Innovation.
Label List of Ratio Variables
RKP1Premium adequacy ratio to claim paymentPremium income (claims and benefits paid + unitredemption statement)
RKP2
The ratio of the premium adequacy to payment of claimsand general expensesPremium income (claims and benefits paid + unitredemption claims + marketing expenses + personneland management expenses + education and trainingexpenses + education and training expenses + generaland administrative expenses)
RKP3 The ratio of the adequacy of premiums and investmentreturns to payment of claims and general expenses
RKP4 The ratio of the adequacy of premiums and investmentreturns to payment of claims and general expenses
RSA Insurance session ratio
RI The ratio of investment to technical reserves
Sustainability 2020, 12, 10620 6 of 25
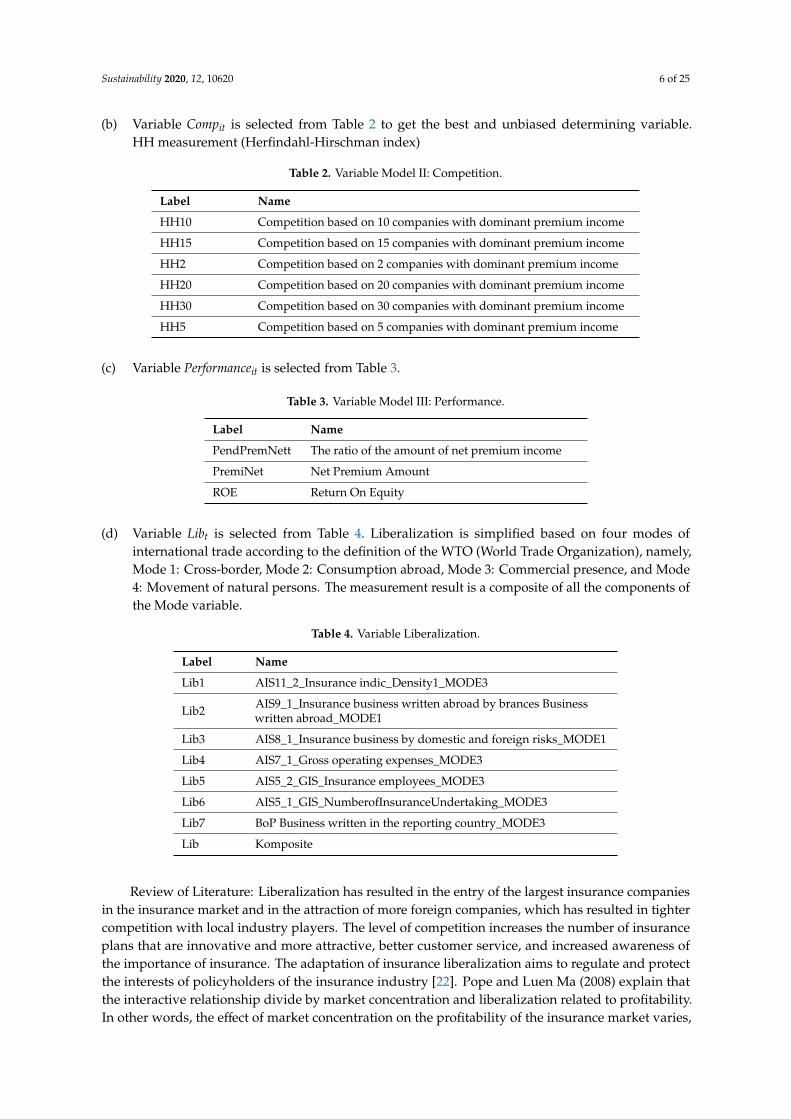
(b) Variable Compit is selected from Table 2 to get the best and unbiased determining variable.HH measurement (Herfindahl-Hirschman index)
Table 2. Variable Model II: Competition.
Label Name
HH10 Competition based on 10 companies with dominant premium income
HH15 Competition based on 15 companies with dominant premium income
HH2 Competition based on 2 companies with dominant premium income
HH20 Competition based on 20 companies with dominant premium income
HH30 Competition based on 30 companies with dominant premium income
HH5 Competition based on 5 companies with dominant premium income
(c) Variable Performanceit is selected from Table 3.
Table 3. Variable Model III: Performance.
Label Name
PendPremNett The ratio of the amount of net premium income
PremiNet Net Premium Amount
ROE Return On Equity
(d) Variable Libt is selected from Table 4. Liberalization is simplified based on four modes ofinternational trade according to the definition of the WTO (World Trade Organization), namely,Mode 1: Cross-border, Mode 2: Consumption abroad, Mode 3: Commercial presence, and Mode4: Movement of natural persons. The measurement result is a composite of all the components ofthe Mode variable.
Table 4. Variable Liberalization.
Label Name
Lib1 AIS11_2_Insurance indic_Density1_MODE3
Lib2 AIS9_1_Insurance business written abroad by brances Businesswritten abroad_MODE1
Lib3 AIS8_1_Insurance business by domestic and foreign risks_MODE1
Lib4 AIS7_1_Gross operating expenses_MODE3
Lib5 AIS5_2_GIS_Insurance employees_MODE3
Lib6 AIS5_1_GIS_NumberofInsuranceUndertaking_MODE3
Lib7 BoP Business written in the reporting country_MODE3
Lib Komposite
Review of Literature: Liberalization has resulted in the entry of the largest insurance companiesin the insurance market and in the attraction of more foreign companies, which has resulted in tightercompetition with local industry players. The level of competition increases the number of insuranceplans that are innovative and more attractive, better customer service, and increased awareness ofthe importance of insurance. The adaptation of insurance liberalization aims to regulate and protectthe interests of policyholders of the insurance industry [22]. Pope and Luen Ma (2008) explain thatthe interactive relationship divide by market concentration and liberalization related to profitability.In other words, the effect of market concentration on the profitability of the insurance market varies,
Sustainability 2020, 12, 10620 7 of 25
and this depends on the degree of market liberalization. The high entry barrier for competitors facilitatesthe market’s ability to concentrate on collusive behavior [31].
Innovation capability consists of four types of innovation: organizational innovation, processinnovation, product and service innovation, and marketing innovation. By increasing innovation inthe company, it can influence the innovation performance of the company itself [32]. Organizationalinnovation is implementing new organizational methods in company business practices, workplaceorganizations, or external relations. Corporate design can lead to improving business performanceby reducing organizational management and transaction costs. Organizational innovation isrelated to administrative efforts, including efforts to update systems, procedures, and routines toencourage team cohesiveness, coordination, collaboration, information, and knowledge sharingpractices [33]. The innovation process can reduce the productivity, business growth, and profitabilityof an organization [34]. Product or service innovation activities are ways of adapting to policies andchanges in consumer culture. Work and service innovation activities take into account changes in linestructure, legacy systems, and business processes aimed at boosting revenue growth, financial stability,and improving customer experience and facing business competition [35]. Marketing innovation isa form of applying new marketing methods that involve significant changes in design or packaging,product placement, and promotions and prices [32].
The impact of liberalization varies considerably in each organization or company, especiallyin company performance [36]. Large companies were initially more productive to gain more fromfinancial liberalization [37]. Profits earn through the encouragement it provides to improve servicequality [38]. In China, most had little impact on increasing and improving the productivity of enterprises,but still significant on improving social welfare after the liberalization of the insurance market [39].Liberalization is promoted with competition [26].
The organization will seek to improve its annual performance and its ability to survive in the face ofbusiness competition. Also, the game creates organizational efforts to improve customer service. One ofthem is with effective advertising and relationship management. The existence of opportunities andpotential is one of the driving factors for improving organizational performance and competition [22],whereas in the sales sector, company behavior leads to three levels of decisions that pursued, namely,reinsurance, sales efforts, and price [2].
3. Results
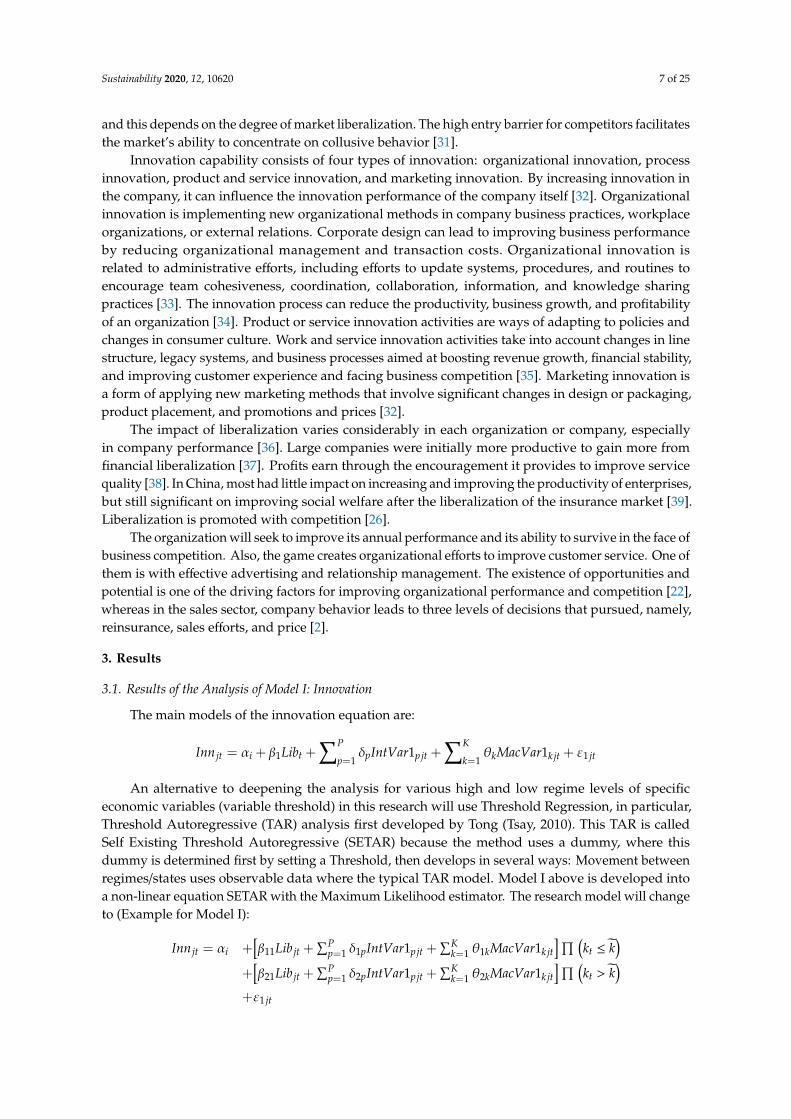
3.1. Results of the Analysis of Model I: Innovation
The main models of the innovation equation are:
Inn jt = αi + β1Libt +∑P
p=1δpIntVar1pjt +
∑K
k=1θkMacVar1kjt + ε1 jt
An alternative to deepening the analysis for various high and low regime levels of specificeconomic variables (variable threshold) in this research will use Threshold Regression, in particular,Threshold Autoregressive (TAR) analysis first developed by Tong (Tsay, 2010). This TAR is calledSelf Existing Threshold Autoregressive (SETAR) because the method uses a dummy, where thisdummy is determined first by setting a Threshold, then develops in several ways: Movement betweenregimes/states uses observable data where the typical TAR model. Model I above is developed intoa non-linear equation SETAR with the Maximum Likelihood estimator. The research model will changeto (Example for Model I):
Inn jt = αi +[β11Lib jt +
∑Pp=1 δ1pIntVar1pjt +
∑Kk=1 θ1kMacVar1kjt
]∏ (kt ≤ k̃
)+
[β21Lib jt +
∑Pp=1 δ2pIntVar1pjt +
∑Kk=1 θ2kMacVar1kjt
]∏ (kt > k̃
)+ε1 jt
Sustainability 2020, 12, 10620 8 of 25
where, through this regression, we can get the threshold value (̃k) and there is a change in the parametervalues β11, δ1p, θ1k, β21, δ2p, θ2k for each equation. Models II and III follow the same way of analysis.
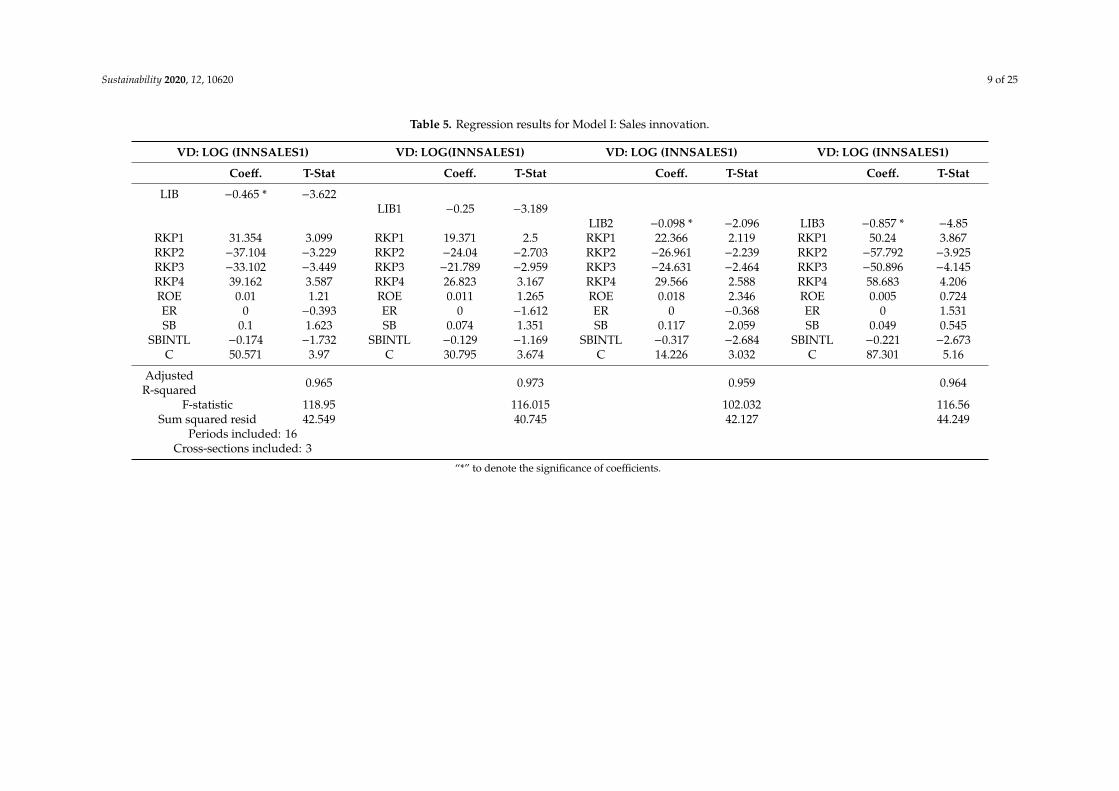
3.1.1. Sales Innovation
The regression results of the equation below are arranged based on Model I, where the dependentvariable is innovation. The formation of innovation variables with employee innovation indicatorsis carried out through a measure consisting of the ratio of the amount of net premium income tomarketing costs. Sales innovation measures the achievement of the amount of Net Premium Incomemade by marketing. The use of applications and technology will increase the amount of net premiumincome. This ratio, if it gets smaller, indicates that there is an innovation made by marketing so thatmarketing costs are cheaper. Designs can be in the form of using supporting applications, implementingcommunication through applications, and implementing candidate surveys through applications.
Table 5 is the observational data for the period Q1 2015 to Q4 2018. The top row shows the dependentvariable Model I, namely, innovation. At the same time, the second column is a list of the independentvariables of each equation. This section lists several equations with variations in the dependent variableto reveal the impact of each of the World Insurance Liberation Index (ILI) variables. The LIB variable isthe ILI composite index, while the other LIB is explained in the LIB Table. The bottom is the modelidentification row consisting of R2-Adj, F-stat, Sum square residual, and the amount of data available.A high LIB value indicates (*) that the level of insurance liberalization is getting higher. The negativeimpact of liberalization on sales innovation shows that a higher level of liberalization will encouragethe use of sales innovations. It thus reduces the insurance company’s marketing costs.
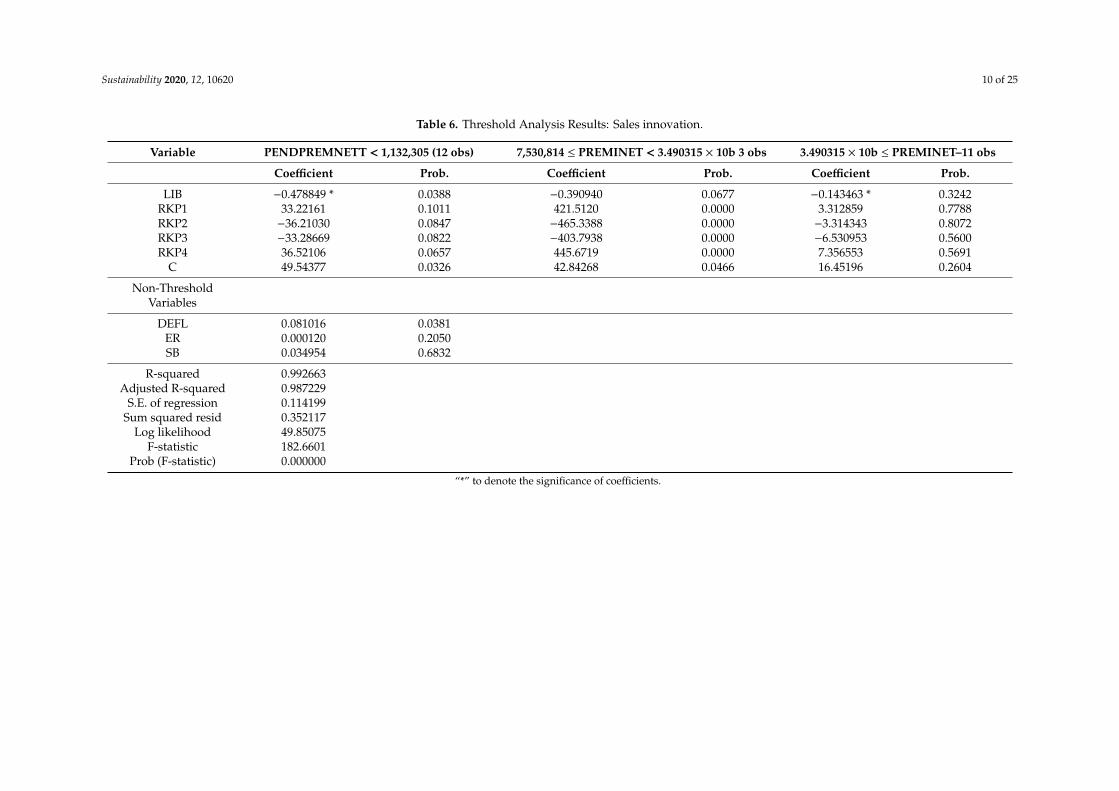
Threshold Analysis: Sales Innovations. Following are the results of processing sales innovationdata using Threshold analysis, which is divided into three, namely, high, medium, and low netpremium income with a threshold value of 2. The dependent variable is LOG (INNSALES1) withthe Discrete Threshold Regression method. With the candidate Threshold variables—PENDPREMNETT,PREMINET, and PROFIT—PENDPREMNETT (net premium income) variable is selected, which isthe most efficient. Selection is made to determine the most appropriate variable as a threshold valuefor changes to occur.
From Table 6, it can be summarized as follows:Table 7 shows that companies with low and moderate net premium income have a threshold
value lower than 722,492. While high net premium income has a threshold value greater than 7,224,292,a sales innovation threshold value that is lower than 722,492 indicates that the premium income is lowand moderate. Requires sales innovation to improve work efficiency and insurance services.
The LIB coefficient (*) in Table 6 is analyzed as follows. Analysis of the Threshold RegressionModel I show a difference in the impact of liberalization (LIB) on various levels of net premium income.At low and medium high net premium income, negative and significant liberalization coefficientsare recorded. Empirical evidence suggests that increased liberalization is driving down the cost ofsales innovation. However, at high net premium income, increased liberalization has not been able tolower the cost of innovation. Companies with high net premium income still need the development ofinnovation at high cost. Companies with high net premium income have not operated efficiently.
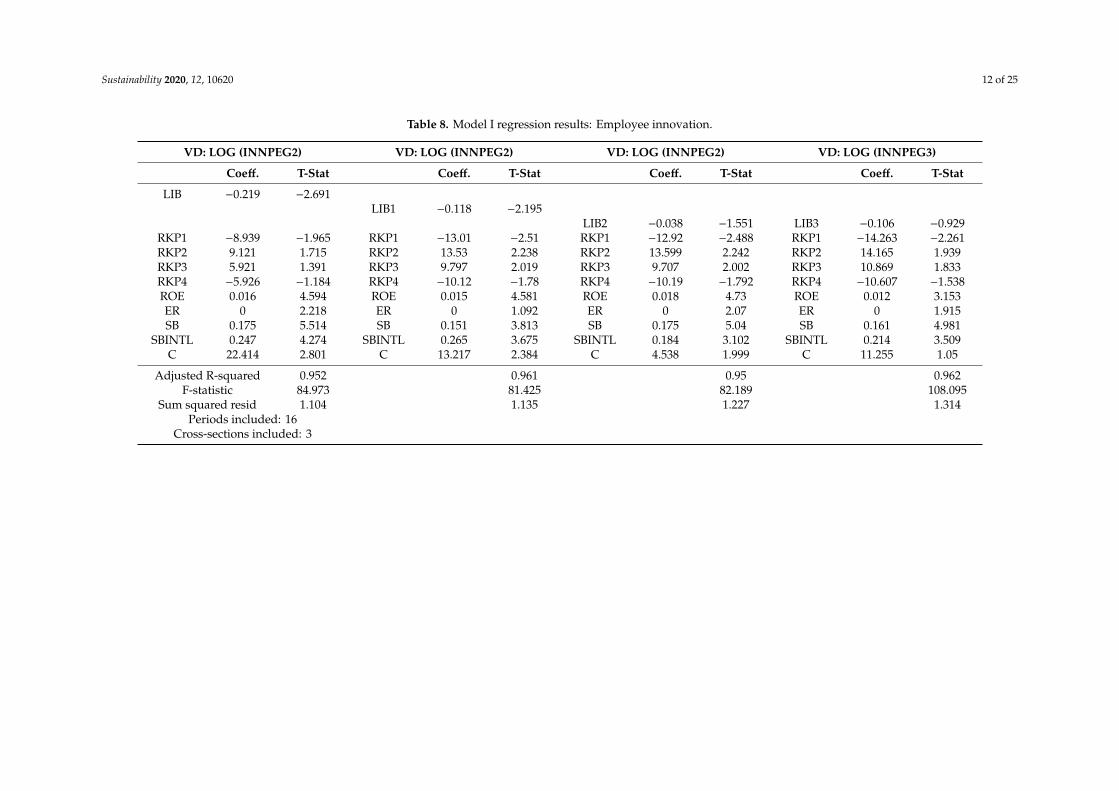
3.1.2. Employee Innovation
In Model I, the employee innovation indicator uses a measure consisting of the ratio of netpremiums and employee costs. Employee innovation aims to measure the achievement of the netpremium made by supporting or operational employees.
Sustainability 2020, 12, 10620 9 of 25
Table 5. Regression results for Model I: Sales innovation.
VD: LOG (INNSALES1) VD: LOG(INNSALES1) VD: LOG (INNSALES1) VD: LOG (INNSALES1)
Coeff. T-Stat Coeff. T-Stat Coeff. T-Stat Coeff. T-Stat
LIB −0.465 * −3.622LIB1 −0.25 −3.189
LIB2 −0.098 * −2.096 LIB3 −0.857 * −4.85RKP1 31.354 3.099 RKP1 19.371 2.5 RKP1 22.366 2.119 RKP1 50.24 3.867RKP2 −37.104 −3.229 RKP2 −24.04 −2.703 RKP2 −26.961 −2.239 RKP2 −57.792 −3.925RKP3 −33.102 −3.449 RKP3 −21.789 −2.959 RKP3 −24.631 −2.464 RKP3 −50.896 −4.145RKP4 39.162 3.587 RKP4 26.823 3.167 RKP4 29.566 2.588 RKP4 58.683 4.206ROE 0.01 1.21 ROE 0.011 1.265 ROE 0.018 2.346 ROE 0.005 0.724ER 0 −0.393 ER 0 −1.612 ER 0 −0.368 ER 0 1.531SB 0.1 1.623 SB 0.074 1.351 SB 0.117 2.059 SB 0.049 0.545
SBINTL −0.174 −1.732 SBINTL −0.129 −1.169 SBINTL −0.317 −2.684 SBINTL −0.221 −2.673C 50.571 3.97 C 30.795 3.674 C 14.226 3.032 C 87.301 5.16
AdjustedR-squared 0.965 0.973 0.959 0.964
F-statistic 118.95 116.015 102.032 116.56Sum squared resid 42.549 40.745 42.127 44.249
Periods included: 16Cross-sections included: 3
“*” to denote the significance of coefficients.
Sustainability 2020, 12, 10620 10 of 25
Table 6. Threshold Analysis Results: Sales innovation.
Variable PENDPREMNETT < 1,132,305 (12 obs) 7,530,814 ≤ PREMINET < 3.490315 × 10b 3 obs 3.490315 × 10b ≤ PREMINET–11 obs
Coefficient Prob. Coefficient Prob. Coefficient Prob.
LIB −0.478849 * 0.0388 −0.390940 0.0677 −0.143463 * 0.3242RKP1 33.22161 0.1011 421.5120 0.0000 3.312859 0.7788RKP2 −36.21030 0.0847 −465.3388 0.0000 −3.314343 0.8072RKP3 −33.28669 0.0822 −403.7938 0.0000 −6.530953 0.5600RKP4 36.52106 0.0657 445.6719 0.0000 7.356553 0.5691
C 49.54377 0.0326 42.84268 0.0466 16.45196 0.2604
Non-ThresholdVariables
DEFL 0.081016 0.0381ER 0.000120 0.2050SB 0.034954 0.6832
R-squared 0.992663Adjusted R-squared 0.987229
S.E. of regression 0.114199Sum squared resid 0.352117
Log likelihood 49.85075F-statistic 182.6601
Prob (F-statistic) 0.000000
“*” to denote the significance of coefficients.
Sustainability 2020, 12, 10620 11 of 25
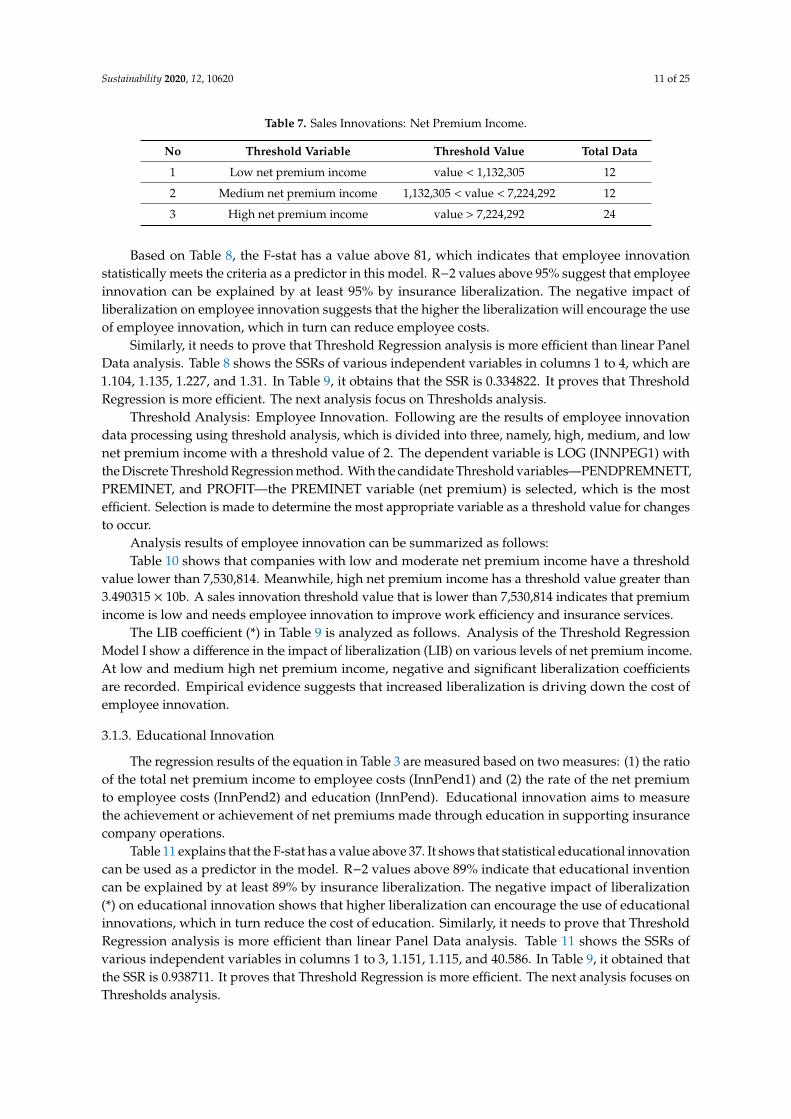
Table 7. Sales Innovations: Net Premium Income.
No Threshold Variable Threshold Value Total Data
1 Low net premium income value < 1,132,305 12
2 Medium net premium income 1,132,305 < value < 7,224,292 12
3 High net premium income value > 7,224,292 24
Based on Table 8, the F-stat has a value above 81, which indicates that employee innovationstatistically meets the criteria as a predictor in this model. R−2 values above 95% suggest that employeeinnovation can be explained by at least 95% by insurance liberalization. The negative impact ofliberalization on employee innovation suggests that the higher the liberalization will encourage the useof employee innovation, which in turn can reduce employee costs.
Similarly, it needs to prove that Threshold Regression analysis is more efficient than linear PanelData analysis. Table 8 shows the SSRs of various independent variables in columns 1 to 4, which are1.104, 1.135, 1.227, and 1.31. In Table 9, it obtains that the SSR is 0.334822. It proves that ThresholdRegression is more efficient. The next analysis focus on Thresholds analysis.
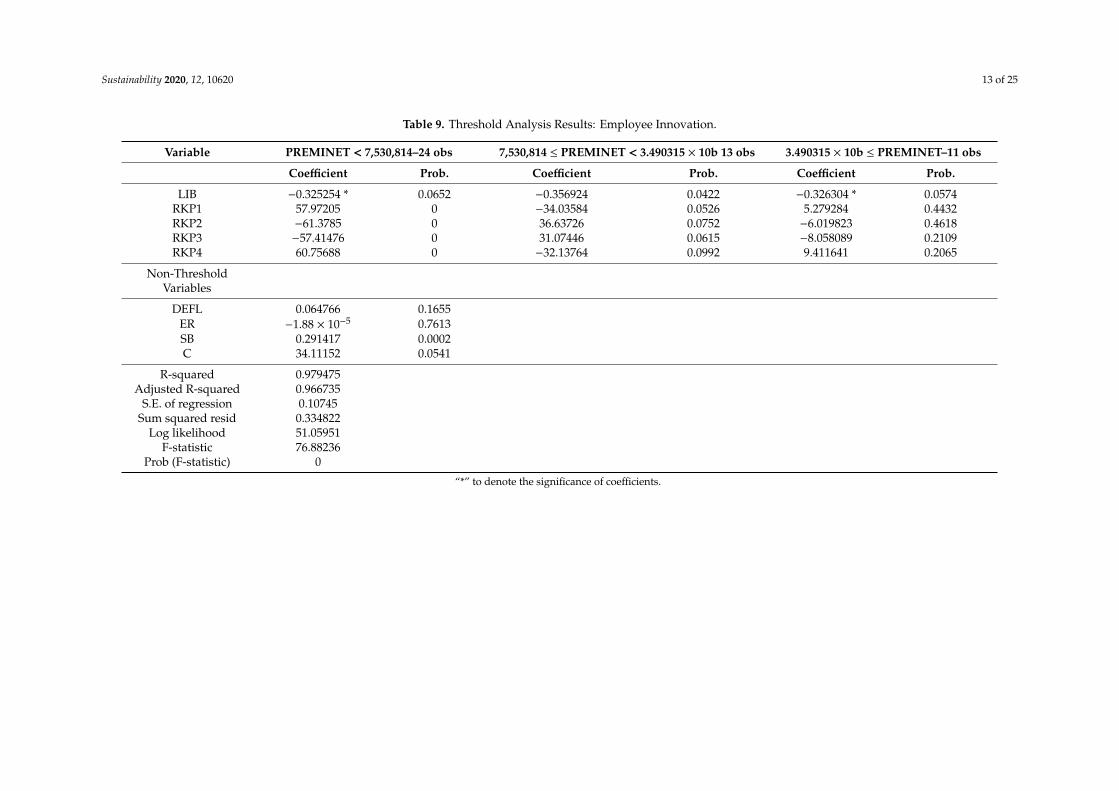
Threshold Analysis: Employee Innovation. Following are the results of employee innovationdata processing using threshold analysis, which is divided into three, namely, high, medium, and lownet premium income with a threshold value of 2. The dependent variable is LOG (INNPEG1) withthe Discrete Threshold Regression method. With the candidate Threshold variables—PENDPREMNETT,PREMINET, and PROFIT—the PREMINET variable (net premium) is selected, which is the mostefficient. Selection is made to determine the most appropriate variable as a threshold value for changesto occur.
Analysis results of employee innovation can be summarized as follows:Table 10 shows that companies with low and moderate net premium income have a threshold
value lower than 7,530,814. Meanwhile, high net premium income has a threshold value greater than3.490315 × 10b. A sales innovation threshold value that is lower than 7,530,814 indicates that premiumincome is low and needs employee innovation to improve work efficiency and insurance services.
The LIB coefficient (*) in Table 9 is analyzed as follows. Analysis of the Threshold RegressionModel I show a difference in the impact of liberalization (LIB) on various levels of net premium income.At low and medium high net premium income, negative and significant liberalization coefficientsare recorded. Empirical evidence suggests that increased liberalization is driving down the cost ofemployee innovation.
3.1.3. Educational Innovation
The regression results of the equation in Table 3 are measured based on two measures: (1) the ratioof the total net premium income to employee costs (InnPend1) and (2) the rate of the net premiumto employee costs (InnPend2) and education (InnPend). Educational innovation aims to measurethe achievement or achievement of net premiums made through education in supporting insurancecompany operations.
Table 11 explains that the F-stat has a value above 37. It shows that statistical educational innovationcan be used as a predictor in the model. R−2 values above 89% indicate that educational inventioncan be explained by at least 89% by insurance liberalization. The negative impact of liberalization(*) on educational innovation shows that higher liberalization can encourage the use of educationalinnovations, which in turn reduce the cost of education. Similarly, it needs to prove that ThresholdRegression analysis is more efficient than linear Panel Data analysis. Table 11 shows the SSRs ofvarious independent variables in columns 1 to 3, 1.151, 1.115, and 40.586. In Table 9, it obtained thatthe SSR is 0.938711. It proves that Threshold Regression is more efficient. The next analysis focuses onThresholds analysis.
Sustainability 2020, 12, 10620 12 of 25
Table 8. Model I regression results: Employee innovation.
VD: LOG (INNPEG2) VD: LOG (INNPEG2) VD: LOG (INNPEG2) VD: LOG (INNPEG3)
Coeff. T-Stat Coeff. T-Stat Coeff. T-Stat Coeff. T-Stat
LIB −0.219 −2.691LIB1 −0.118 −2.195
LIB2 −0.038 −1.551 LIB3 −0.106 −0.929RKP1 −8.939 −1.965 RKP1 −13.01 −2.51 RKP1 −12.92 −2.488 RKP1 −14.263 −2.261RKP2 9.121 1.715 RKP2 13.53 2.238 RKP2 13.599 2.242 RKP2 14.165 1.939RKP3 5.921 1.391 RKP3 9.797 2.019 RKP3 9.707 2.002 RKP3 10.869 1.833RKP4 −5.926 −1.184 RKP4 −10.12 −1.78 RKP4 −10.19 −1.792 RKP4 −10.607 −1.538ROE 0.016 4.594 ROE 0.015 4.581 ROE 0.018 4.73 ROE 0.012 3.153ER 0 2.218 ER 0 1.092 ER 0 2.07 ER 0 1.915SB 0.175 5.514 SB 0.151 3.813 SB 0.175 5.04 SB 0.161 4.981
SBINTL 0.247 4.274 SBINTL 0.265 3.675 SBINTL 0.184 3.102 SBINTL 0.214 3.509C 22.414 2.801 C 13.217 2.384 C 4.538 1.999 C 11.255 1.05
Adjusted R-squared 0.952 0.961 0.95 0.962F-statistic 84.973 81.425 82.189 108.095
Sum squared resid 1.104 1.135 1.227 1.314Periods included: 16
Cross-sections included: 3
Sustainability 2020, 12, 10620 13 of 25
Table 9. Threshold Analysis Results: Employee Innovation.
Variable PREMINET < 7,530,814–24 obs 7,530,814 ≤ PREMINET < 3.490315 × 10b 13 obs 3.490315 × 10b ≤ PREMINET–11 obs
Coefficient Prob. Coefficient Prob. Coefficient Prob.
LIB −0.325254 * 0.0652 −0.356924 0.0422 −0.326304 * 0.0574RKP1 57.97205 0 −34.03584 0.0526 5.279284 0.4432RKP2 −61.3785 0 36.63726 0.0752 −6.019823 0.4618RKP3 −57.41476 0 31.07446 0.0615 −8.058089 0.2109RKP4 60.75688 0 −32.13764 0.0992 9.411641 0.2065
Non-ThresholdVariables
DEFL 0.064766 0.1655ER −1.88 × 10⁻⁵ 0.7613SB 0.291417 0.0002C 34.11152 0.0541
R-squared 0.979475Adjusted R-squared 0.966735
S.E. of regression 0.10745Sum squared resid 0.334822
Log likelihood 51.05951F-statistic 76.88236
Prob (F-statistic) 0
“*” to denote the significance of coefficients.
Sustainability 2020, 12, 10620 14 of 25
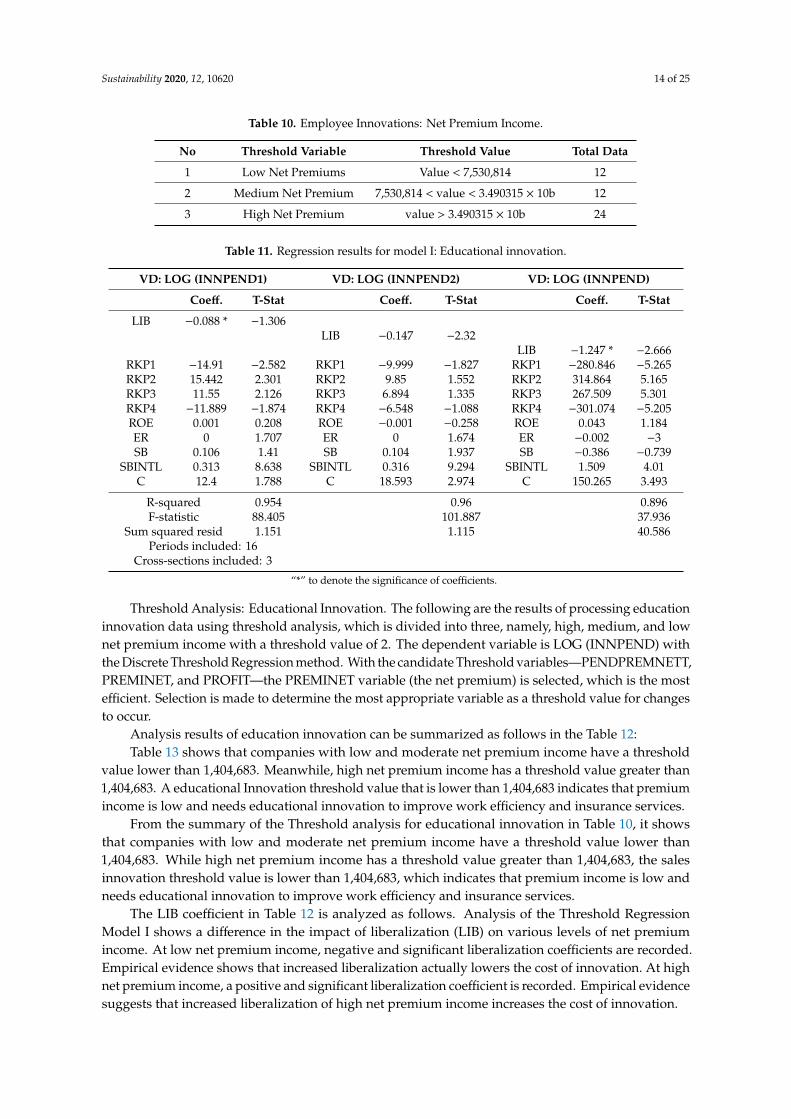
Table 10. Employee Innovations: Net Premium Income.
No Threshold Variable Threshold Value Total Data
1 Low Net Premiums Value < 7,530,814 12
2 Medium Net Premium 7,530,814 < value < 3.490315 × 10b 12
3 High Net Premium value > 3.490315 × 10b 24
Table 11. Regression results for model I: Educational innovation.
VD: LOG (INNPEND1) VD: LOG (INNPEND2) VD: LOG (INNPEND)
Coeff. T-Stat Coeff. T-Stat Coeff. T-Stat
LIB −0.088 * −1.306LIB −0.147 −2.32
LIB −1.247 * −2.666RKP1 −14.91 −2.582 RKP1 −9.999 −1.827 RKP1 −280.846 −5.265RKP2 15.442 2.301 RKP2 9.85 1.552 RKP2 314.864 5.165RKP3 11.55 2.126 RKP3 6.894 1.335 RKP3 267.509 5.301RKP4 −11.889 −1.874 RKP4 −6.548 −1.088 RKP4 −301.074 −5.205ROE 0.001 0.208 ROE −0.001 −0.258 ROE 0.043 1.184ER 0 1.707 ER 0 1.674 ER −0.002 −3SB 0.106 1.41 SB 0.104 1.937 SB −0.386 −0.739
SBINTL 0.313 8.638 SBINTL 0.316 9.294 SBINTL 1.509 4.01C 12.4 1.788 C 18.593 2.974 C 150.265 3.493
R-squared 0.954 0.96 0.896F-statistic 88.405 101.887 37.936
Sum squared resid 1.151 1.115 40.586Periods included: 16
Cross-sections included: 3
“*” to denote the significance of coefficients.
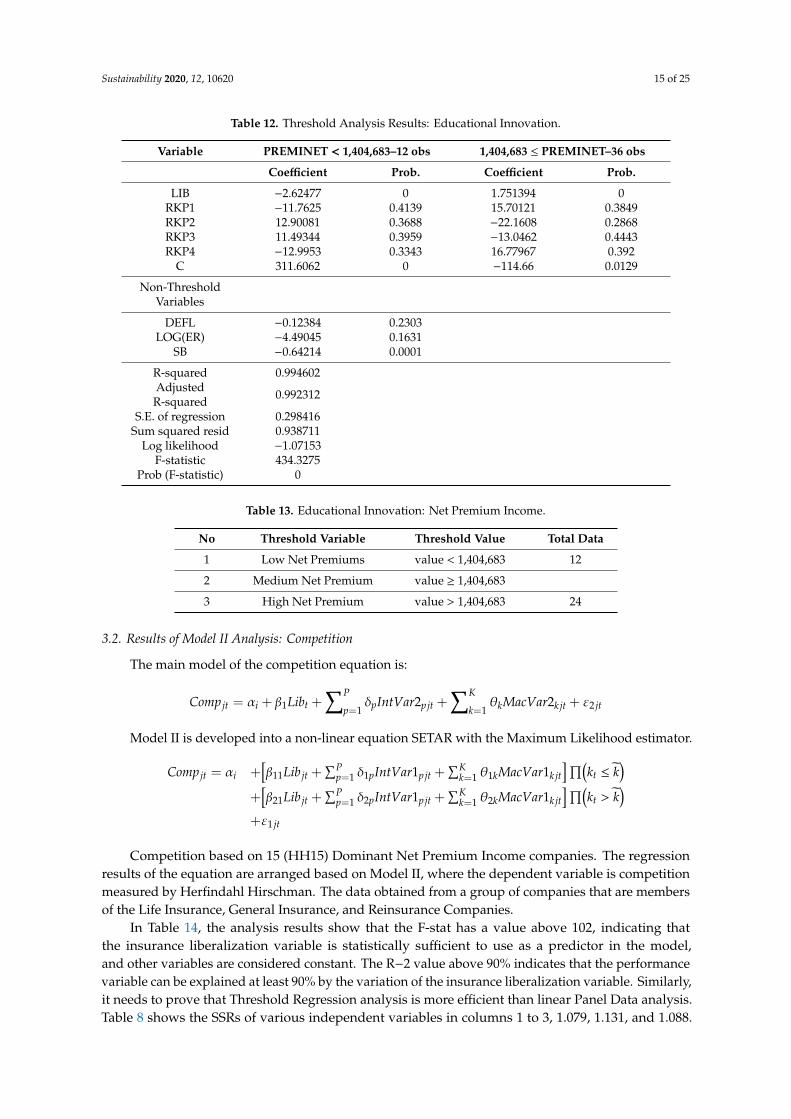
Threshold Analysis: Educational Innovation. The following are the results of processing educationinnovation data using threshold analysis, which is divided into three, namely, high, medium, and lownet premium income with a threshold value of 2. The dependent variable is LOG (INNPEND) withthe Discrete Threshold Regression method. With the candidate Threshold variables—PENDPREMNETT,PREMINET, and PROFIT—the PREMINET variable (the net premium) is selected, which is the mostefficient. Selection is made to determine the most appropriate variable as a threshold value for changesto occur.
Analysis results of education innovation can be summarized as follows in the Table 12:Table 13 shows that companies with low and moderate net premium income have a threshold
value lower than 1,404,683. Meanwhile, high net premium income has a threshold value greater than1,404,683. A educational Innovation threshold value that is lower than 1,404,683 indicates that premiumincome is low and needs educational innovation to improve work efficiency and insurance services.
From the summary of the Threshold analysis for educational innovation in Table 10, it showsthat companies with low and moderate net premium income have a threshold value lower than1,404,683. While high net premium income has a threshold value greater than 1,404,683, the salesinnovation threshold value is lower than 1,404,683, which indicates that premium income is low andneeds educational innovation to improve work efficiency and insurance services.
The LIB coefficient in Table 12 is analyzed as follows. Analysis of the Threshold RegressionModel I shows a difference in the impact of liberalization (LIB) on various levels of net premiumincome. At low net premium income, negative and significant liberalization coefficients are recorded.Empirical evidence shows that increased liberalization actually lowers the cost of innovation. At highnet premium income, a positive and significant liberalization coefficient is recorded. Empirical evidencesuggests that increased liberalization of high net premium income increases the cost of innovation.
Sustainability 2020, 12, 10620 15 of 25
Table 12. Threshold Analysis Results: Educational Innovation.
Variable PREMINET < 1,404,683–12 obs 1,404,683 ≤ PREMINET–36 obs
Coefficient Prob. Coefficient Prob.
LIB −2.62477 0 1.751394 0RKP1 −11.7625 0.4139 15.70121 0.3849RKP2 12.90081 0.3688 −22.1608 0.2868RKP3 11.49344 0.3959 −13.0462 0.4443RKP4 −12.9953 0.3343 16.77967 0.392
C 311.6062 0 −114.66 0.0129
Non-ThresholdVariables
DEFL −0.12384 0.2303LOG(ER) −4.49045 0.1631
SB −0.64214 0.0001
R-squared 0.994602AdjustedR-squared 0.992312
S.E. of regression 0.298416Sum squared resid 0.938711
Log likelihood −1.07153F-statistic 434.3275
Prob (F-statistic) 0
Table 13. Educational Innovation: Net Premium Income.
No Threshold Variable Threshold Value Total Data
1 Low Net Premiums value < 1,404,683 12
2 Medium Net Premium value ≥ 1,404,683
3 High Net Premium value > 1,404,683 24
3.2. Results of Model II Analysis: Competition
The main model of the competition equation is:
Comp jt = αi + β1Libt +∑P
p=1δpIntVar2pjt +
∑K
k=1θkMacVar2kjt + ε2 jt
Model II is developed into a non-linear equation SETAR with the Maximum Likelihood estimator.
Comp jt = αi +[β11Lib jt +
∑Pp=1 δ1pIntVar1pjt +
∑Kk=1 θ1kMacVar1kjt
]∏(kt ≤ k̃
)+
[β21Lib jt +
∑Pp=1 δ2pIntVar1pjt +
∑Kk=1 θ2kMacVar1kjt
]∏(kt > k̃
)+ε1 jt
Competition based on 15 (HH15) Dominant Net Premium Income companies. The regressionresults of the equation are arranged based on Model II, where the dependent variable is competitionmeasured by Herfindahl Hirschman. The data obtained from a group of companies that are membersof the Life Insurance, General Insurance, and Reinsurance Companies.
In Table 14, the analysis results show that the F-stat has a value above 102, indicating thatthe insurance liberalization variable is statistically sufficient to use as a predictor in the model,and other variables are considered constant. The R−2 value above 90% indicates that the performancevariable can be explained at least 90% by the variation of the insurance liberalization variable. Similarly,it needs to prove that Threshold Regression analysis is more efficient than linear Panel Data analysis.Table 8 shows the SSRs of various independent variables in columns 1 to 3, 1.079, 1.131, and 1.088.
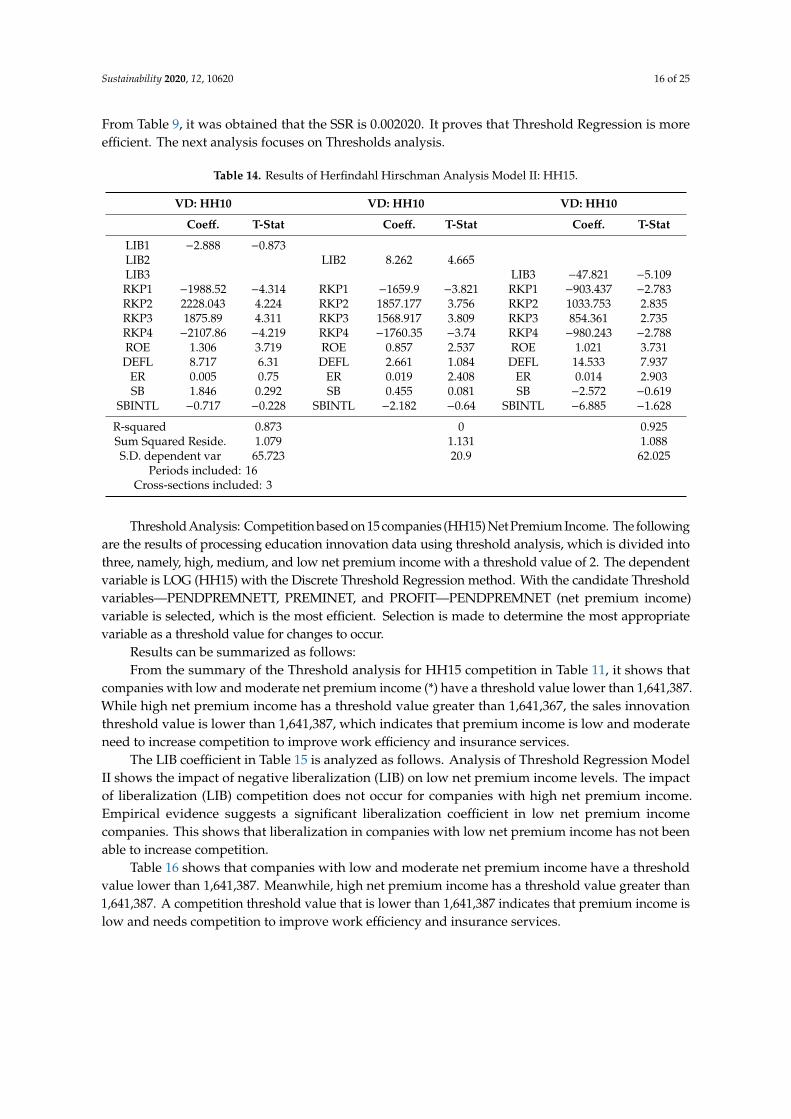
Sustainability 2020, 12, 10620 16 of 25
From Table 9, it was obtained that the SSR is 0.002020. It proves that Threshold Regression is moreefficient. The next analysis focuses on Thresholds analysis.
Table 14. Results of Herfindahl Hirschman Analysis Model II: HH15.
VD: HH10 VD: HH10 VD: HH10
Coeff. T-Stat Coeff. T-Stat Coeff. T-Stat
LIB1 −2.888 −0.873LIB2 LIB2 8.262 4.665LIB3 LIB3 −47.821 −5.109RKP1 −1988.52 −4.314 RKP1 −1659.9 −3.821 RKP1 −903.437 −2.783RKP2 2228.043 4.224 RKP2 1857.177 3.756 RKP2 1033.753 2.835RKP3 1875.89 4.311 RKP3 1568.917 3.809 RKP3 854.361 2.735RKP4 −2107.86 −4.219 RKP4 −1760.35 −3.74 RKP4 −980.243 −2.788ROE 1.306 3.719 ROE 0.857 2.537 ROE 1.021 3.731DEFL 8.717 6.31 DEFL 2.661 1.084 DEFL 14.533 7.937
ER 0.005 0.75 ER 0.019 2.408 ER 0.014 2.903SB 1.846 0.292 SB 0.455 0.081 SB −2.572 −0.619
SBINTL −0.717 −0.228 SBINTL −2.182 −0.64 SBINTL −6.885 −1.628
R-squared 0.873 0 0.925Sum Squared Reside. 1.079 1.131 1.088S.D. dependent var 65.723 20.9 62.025
Periods included: 16Cross-sections included: 3
Threshold Analysis: Competition based on 15 companies (HH15) Net Premium Income. The followingare the results of processing education innovation data using threshold analysis, which is divided intothree, namely, high, medium, and low net premium income with a threshold value of 2. The dependentvariable is LOG (HH15) with the Discrete Threshold Regression method. With the candidate Thresholdvariables—PENDPREMNETT, PREMINET, and PROFIT—PENDPREMNET (net premium income)variable is selected, which is the most efficient. Selection is made to determine the most appropriatevariable as a threshold value for changes to occur.
Results can be summarized as follows:From the summary of the Threshold analysis for HH15 competition in Table 11, it shows that
companies with low and moderate net premium income (*) have a threshold value lower than 1,641,387.While high net premium income has a threshold value greater than 1,641,367, the sales innovationthreshold value is lower than 1,641,387, which indicates that premium income is low and moderateneed to increase competition to improve work efficiency and insurance services.
The LIB coefficient in Table 15 is analyzed as follows. Analysis of Threshold Regression ModelII shows the impact of negative liberalization (LIB) on low net premium income levels. The impactof liberalization (LIB) competition does not occur for companies with high net premium income.Empirical evidence suggests a significant liberalization coefficient in low net premium incomecompanies. This shows that liberalization in companies with low net premium income has not beenable to increase competition.
Table 16 shows that companies with low and moderate net premium income have a thresholdvalue lower than 1,641,387. Meanwhile, high net premium income has a threshold value greater than1,641,387. A competition threshold value that is lower than 1,641,387 indicates that premium income islow and needs competition to improve work efficiency and insurance services.
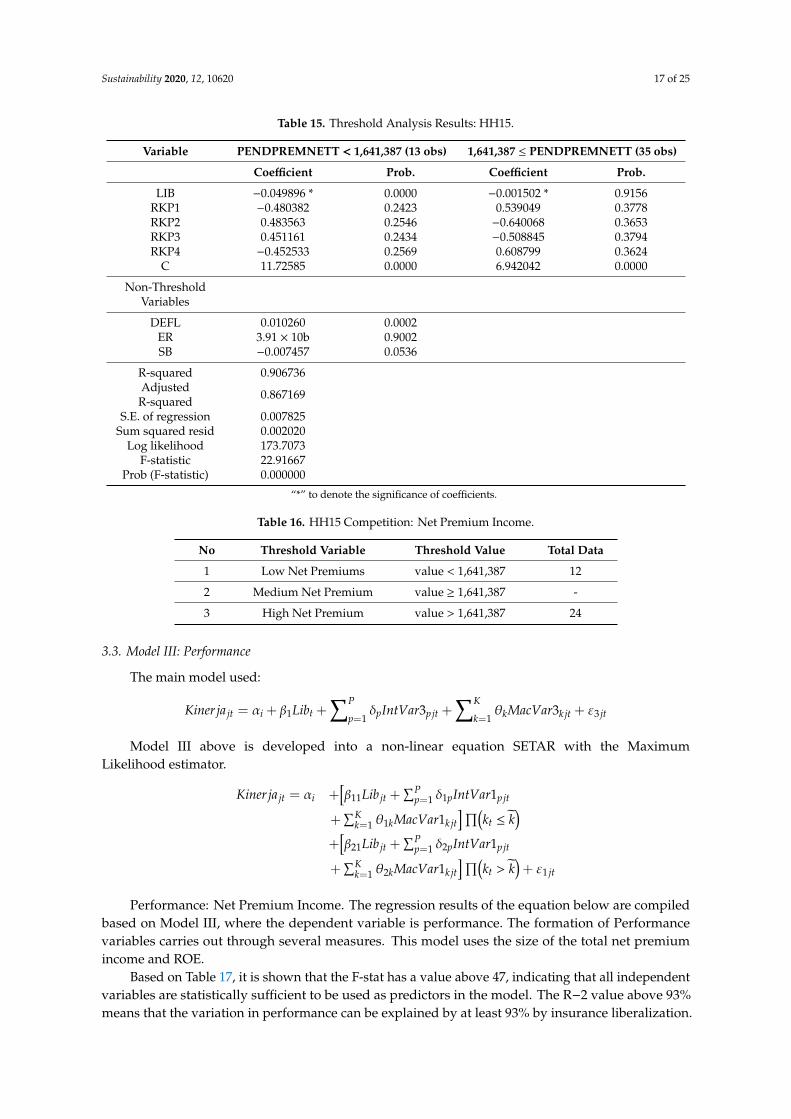
Sustainability 2020, 12, 10620 17 of 25
Table 15. Threshold Analysis Results: HH15.
Variable PENDPREMNETT < 1,641,387 (13 obs) 1,641,387 ≤ PENDPREMNETT (35 obs)
Coefficient Prob. Coefficient Prob.
LIB −0.049896 * 0.0000 −0.001502 * 0.9156RKP1 −0.480382 0.2423 0.539049 0.3778RKP2 0.483563 0.2546 −0.640068 0.3653RKP3 0.451161 0.2434 −0.508845 0.3794RKP4 −0.452533 0.2569 0.608799 0.3624
C 11.72585 0.0000 6.942042 0.0000
Non-ThresholdVariables
DEFL 0.010260 0.0002ER 3.91 × 10b 0.9002SB −0.007457 0.0536
R-squared 0.906736AdjustedR-squared 0.867169
S.E. of regression 0.007825Sum squared resid 0.002020
Log likelihood 173.7073F-statistic 22.91667
Prob (F-statistic) 0.000000
“*” to denote the significance of coefficients.
Table 16. HH15 Competition: Net Premium Income.
No Threshold Variable Threshold Value Total Data
1 Low Net Premiums value < 1,641,387 12
2 Medium Net Premium value ≥ 1,641,387 -
3 High Net Premium value > 1,641,387 24
3.3. Model III: Performance
The main model used:
Kinerja jt = αi + β1Libt +∑P
p=1δpIntVar3pjt +
∑K
k=1θkMacVar3kjt + ε3 jt
Model III above is developed into a non-linear equation SETAR with the MaximumLikelihood estimator.
Kinerja jt = αi +[β11Lib jt +
∑Pp=1 δ1pIntVar1pjt
+∑K
k=1 θ1kMacVar1kjt]∏(
kt ≤ k̃)
+[β21Lib jt +
∑Pp=1 δ2pIntVar1pjt
+∑K
k=1 θ2kMacVar1kjt]∏(
kt > k̃)+ ε1 jt
Performance: Net Premium Income. The regression results of the equation below are compiledbased on Model III, where the dependent variable is performance. The formation of Performancevariables carries out through several measures. This model uses the size of the total net premiumincome and ROE.
Based on Table 17, it is shown that the F-stat has a value above 47, indicating that all independentvariables are statistically sufficient to be used as predictors in the model. The R−2 value above 93%means that the variation in performance can be explained by at least 93% by insurance liberalization.
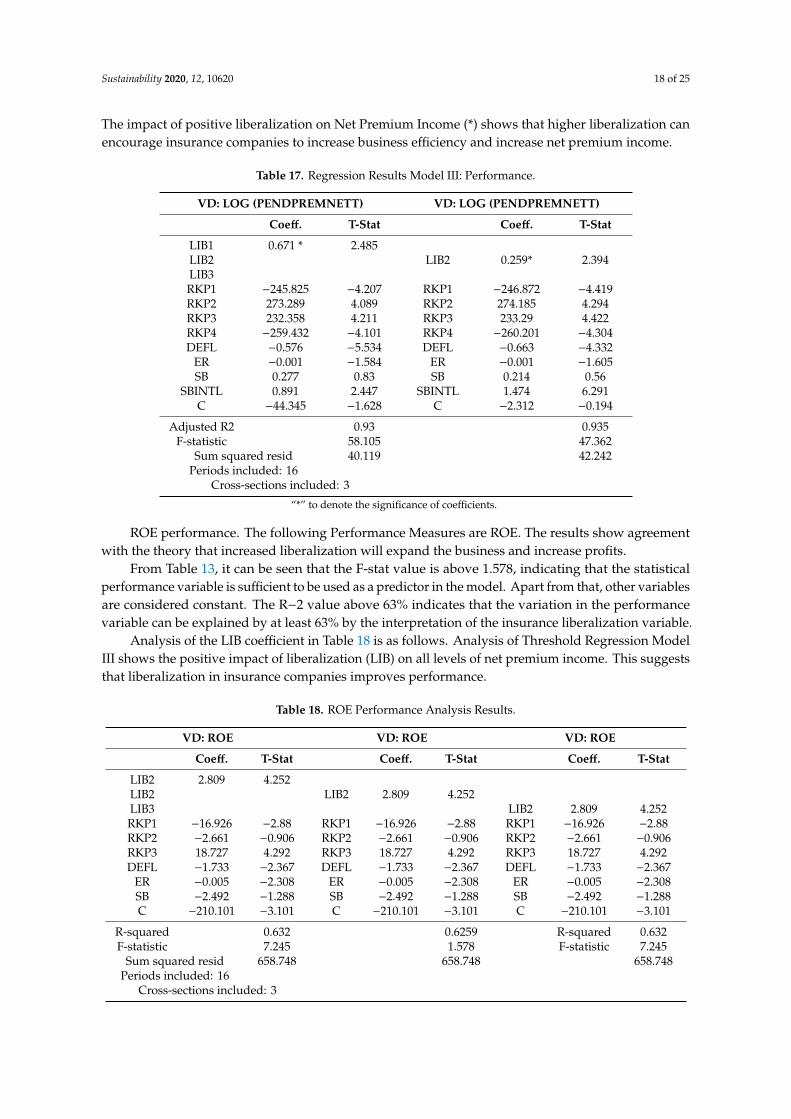
Sustainability 2020, 12, 10620 18 of 25
The impact of positive liberalization on Net Premium Income (*) shows that higher liberalization canencourage insurance companies to increase business efficiency and increase net premium income.
Table 17. Regression Results Model III: Performance.
VD: LOG (PENDPREMNETT) VD: LOG (PENDPREMNETT)
Coeff. T-Stat Coeff. T-Stat
LIB1 0.671 * 2.485LIB2 LIB2 0.259* 2.394LIB3RKP1 −245.825 −4.207 RKP1 −246.872 −4.419RKP2 273.289 4.089 RKP2 274.185 4.294RKP3 232.358 4.211 RKP3 233.29 4.422RKP4 −259.432 −4.101 RKP4 −260.201 −4.304DEFL −0.576 −5.534 DEFL −0.663 −4.332
ER −0.001 −1.584 ER −0.001 −1.605SB 0.277 0.83 SB 0.214 0.56
SBINTL 0.891 2.447 SBINTL 1.474 6.291C −44.345 −1.628 C −2.312 −0.194
Adjusted R2 0.93 0.935F-statistic 58.105 47.362
Sum squared resid 40.119 42.242Periods included: 16
Cross-sections included: 3
“*” to denote the significance of coefficients.
ROE performance. The following Performance Measures are ROE. The results show agreementwith the theory that increased liberalization will expand the business and increase profits.
From Table 13, it can be seen that the F-stat value is above 1.578, indicating that the statisticalperformance variable is sufficient to be used as a predictor in the model. Apart from that, other variablesare considered constant. The R−2 value above 63% indicates that the variation in the performancevariable can be explained by at least 63% by the interpretation of the insurance liberalization variable.
Analysis of the LIB coefficient in Table 18 is as follows. Analysis of Threshold Regression ModelIII shows the positive impact of liberalization (LIB) on all levels of net premium income. This suggeststhat liberalization in insurance companies improves performance.
Table 18. ROE Performance Analysis Results.
VD: ROE VD: ROE VD: ROE
Coeff. T-Stat Coeff. T-Stat Coeff. T-Stat
LIB2 2.809 4.252LIB2 LIB2 2.809 4.252LIB3 LIB2 2.809 4.252RKP1 −16.926 −2.88 RKP1 −16.926 −2.88 RKP1 −16.926 −2.88RKP2 −2.661 −0.906 RKP2 −2.661 −0.906 RKP2 −2.661 −0.906RKP3 18.727 4.292 RKP3 18.727 4.292 RKP3 18.727 4.292DEFL −1.733 −2.367 DEFL −1.733 −2.367 DEFL −1.733 −2.367
ER −0.005 −2.308 ER −0.005 −2.308 ER −0.005 −2.308SB −2.492 −1.288 SB −2.492 −1.288 SB −2.492 −1.288C −210.101 −3.101 C −210.101 −3.101 C −210.101 −3.101
R-squared 0.632 0.6259 R-squared 0.632F-statistic 7.245 1.578 F-statistic 7.245
Sum squared resid 658.748 658.748 658.748Periods included: 16
Cross-sections included: 3
Sustainability 2020, 12, 10620 19 of 25
Statistical analysis to compare three models cannot be done because variables are dependentdifferently and have different units. Analysis between equations is carried out by comparing coefficientsand conformity with theoretical studies.
4. Discussion
Based on the results of the Model I analysis, it revealed that liberalization had brought changes tothe innovation strategy in the insurance industry in Indonesia. Unfortunately, in the Thresholdmodel, the impact of liberalization has a negative and significant effect on the developmentof innovation in low-premium companies. Market liberalization encourages innovation in sales,employees, and education. Similar findings were stated by Lee and Lin (2016) that liberalization hurtsinsurance companies. Furthermore, this creates more risks that must be faced by insurance companies,especially in facing business competition and the global economy [10]. One reasonable strategy is todesign contract agreements, determine fair pricing, and expand the market for insurance companies andthe trend of changes in the insurance industry to be more efficient after liberalization so that industryplayers increase innovation, especially substantially positive technological changes. With marketconsolidation, increasing the scale of results coming from the ability to innovate can increase companyefficiency [4].
These findings complement the previous results that state that liberalization affects financialinnovation [40]. In other words, not only is financial innovation affected by liberalization, but alsosales innovation, employee innovation, and educational innovation.
It is essential to create innovative capabilities in insurance companies. With the right businessstrategy, companies can improve their innovation capabilities, be it sales innovation, employeeinnovation, or educational innovation. Design can carry out through influence in business [41]. It is dueto the transformation of knowledge, employee ideas into practical innovation depending on the levelof delegation, willingness to provide resources and support from the leadership. Liberalization hasan impact on innovation capabilities. Therefore, there is a need for encouragement to change stuff
and resources into competitive advantages through the influence and practice of types of innovationin the company. Previous studies that support these findings reveal that business intelligence hasa positive effect on knowledge sharing, innovation, and gaining competitive advantage [7].
The challenge for implementing innovation lies in training staff, integrating insurance products,and ensuring the best quality of service for customers. Apart from that, an insurance agent isalso essential to achieve success and gain a competitive advantage [42]. Qualified and professionalindividuals are needed but, interestingly, retaining an agent is a challenge in today’s competitiveinsurance business. Furthermore, previous researchers stated that a market-oriented culture shouldlead to superior performance [43]. By strengthening liberalization, it hopes that a market-orientedculture will increase innovation and success for insurance companies, especially domestic insurance.
The future of insurance determines by the improved performance of protection products,a refreshing display of innovation, the launch of packages tailored to competition and marketneeds, and maximum service levels [42]. In facing various challenges of liberalization, a long-termpolicy strategy is needed to develop markets. Pope and Luen Ma (2008) explain that after a shift inmarket structure due to the impact of liberalization, the market is institutionalized and is short-termdue to the disruption of costs absorbed by the market [31]. What is clear is that liberalization has mademarket changes where the market is difficult to predict but can still anticipate the future by developingappropriate strategic plans.
On the other hand, the findings reveal that liberalization has a positive impact on performance andcompetition, as shown in the aggregate models II and III. It indicates that liberalization is an essentialindicator of the sustainability of the insurance industry. Insurance companies in the broad categoryhave a positive and significant impact. Meanwhile, insurance companies in the small group categoryhave a negative effect. This finding is in line with the research conducted by Almajali, Alamto,and Al-Soub (2012), which suggests that size has a significant impact on the financial performance
Sustainability 2020, 12, 10620 20 of 25
of insurance companies. The giant company gets more profit. Therefore, large companies have moreresources, more professional accounting staff, and have more sophisticated information systemscapable of producing high performance [14].
If the liberalization is significant, then performance and competition will increase [44], and viceversa; if the adaptation of liberalization does poorly, then the performance and competence willdecrease. Further, it can be exacerbated if companies in developing countries have limited accessto international capital markets [45]. Not only liberalization but also the opportunity to improveperformance and obtain healthier competition is needed in the competitive behavior in the growinginsurance market [46].
The results of the study are consistent with the view that regulations to promote welfareimprovement will be minimal if not followed by increased significant liberalization [47]. Liberalizationincreases economic activity in all sectors and increases the real returns to both capital and labor [48].Although the impact will be different for each company with high, low, and medium premiumincome, globally, liberalization can encourage increased productivity [26,49]. Taylor (2000) argues that,in the future, the liberalization strategy needs to seriously rethought [50]. Itis did consider that externalliberalization, economic performance, and distribution are still not optimal. We Ge (1999) explains thatthe establishment of special economic zones can support economic liberalization. The designation ofspecial economic zones, as carried out by the Chinese economy, serves to provide trade facilities andfinancial liberalization, increase resources, and promote economic growth and structural change [51].
The risks and benefits of liberalization are issues that continue to debated today [52]. Liberalizationmust be approached with care where an organization is needed to ensure law and enforcementof contracts as well as effective regulation and prudential oversight [21]. An adaptation effort toliberalization, innovation, performance, and competition in the development of the insurance sectorhas been made one of the priorities in Indonesia.
It is essential to design policy changes that can have a positive impact, namely: (1) creatingthe same market conditions for both private and state-owned insurance companies that lead toexpanding market competition, growth in performance efficiency, and growth in the insurance marketas a whole; (2) removing restrictions on state organizations to purchase state insurance products;(3) the choice of the insurance company must be made based on economic factors, not the type ofownership; expansion of the list of the kinds of voluntary insurance can include in the company’sproduction costs; (4) creating a stimulus for capitalization growth in the insurance sector; (5) removingregulatory restrictions that delay the entry of foreign capital into the industry; (6) the integration ofthe insurance industry into the international market; and (7) democracy in the national reinsurancesystem and giving local insurance companies the right to choose reinsurance freely based on marketfactors [11]. What needs to be agreed upon is that the liberalization policy should lead to fair businesscompetition, social justice, and protect local insurance companies from prospering the community asthe values of Pancasila and the 1945 Constitution.
Based on the findings, the researcher conducted a deeper study to determine the differences andimplications of these three models. First, in Model I, liberalization has a negative effect on low-incomecompanies, while for companies with high opinions, it has a positive effect. This finding focuses onefforts to increase insurance growth by increasing innovation. The findings indicate that the positiveimplications only apply to large companies and not in small companies. Liberalization has not beenable to maximize the growth of innovation in small insurance. Liberalization has more influence oninnovation in large companies because it is driven by the large availability of resources. This mayexplain why it is quite difficult for small firms to compete with much larger firms on innovation, becauselarge companies have a lot of available resources. Therefore, examining from previous research, variousstrategic efforts that focus on small companies must be carried out, especially by the government thatholds liberalization policies.
Model II reveals that the existence of stronger liberalization encourages insurance companiesto work more efficiently and increases net premium income. The results of the study of Model II
Sustainability 2020, 12, 10620 21 of 25
focus on efforts to improve company performance. In contrast to Model I, which focuses on achievinginnovation, in Model II, liberalization has positive implications for large and small companies in termsof company performance. Both big companies and small companies need the strength of liberalizationto increase their income and work more efficiently.
The research results in Model III show the negative impact of liberalization on competition.In contrast to Model I and Model II, which focus on efforts to increase insurance growth inlarge and small companies, Model III emphasizes the effect of liberalization on competition ininsurance companies. Strong liberalization has actually been able to make most companies reducetheir competition. This is because liberalization can affect the reduction of market power due tothe large number of companies in the insurance industry. Thus, implications may arise because strongliberalization is able to bring about fair competition.
In the end, this study succeeded in revealing that liberalization has an effect on innovation,performance, and the level of competition among insurance industry players in Indonesia based oninsurance data from 2006 to 2018. Research on efforts to increase the growth of insurance companiesby examining the effect of liberalization on three variables that focus on two categories of companies(large insurance companies and small insurance companies) have not been widely used by previousresearchers. Previous research that examined the theme of liberalization using normative studiesfocused on a sustainable insurance industry strategy based on insurance and sustainability principles inthe Financial Services Authority Regulation Number 76/PJOK.07/2016 concerning Increasing FinancialLiteracy and Inclusion in the field of financial services and/or society [53]. Another study examinesthe liberalization of the insurance sector, which has a positive effect on the sector by comparingthe liberalization approach taken by BRIC countries (an acronym for Brazil, Russia, India, China,and South Africa) and India [54]. Other findings suggest that financial liberalization creates increasinglyfierce competition and has a negative impact on financial stability [55].
Several previous findings highlight the growth efforts of insurance companies by examiningthe relationship between firm performance and insurance company governance [56] and internationalcompetition with the growth of the insurance market. Previous research by examining 25 insurancecompanies focused more on improving the financial performance of insurance companies by increasingthe company’s assets with liquids indicators, size, and competency index [14]. Previous researchconducted on Life Insurance Companies of India (LIC) found that having only one life insurancecompany in India led to a complete monopoly. Following liberalization, private sector insurancecompanies were allowed to enter following the creation of the Insurance Regulatory and DevelopmentAuthority (IRDA) and increased competition for insurance companies.
This research is more exclusively able to show more in-depth findings related to insurancecompanies’ growth efforts. At the same time, it turns out that the impact of liberalization can bedifferent for groups of small companies and large companies by using secondary data up to the last12 years. Previous research used secondary data for the period 2000−20001 and 2014−2015 and showeddifferent results, the market concentration of life insurance companies was low compared to otherindices after liberalization [57]. It is clear that this research has a novelty from previous research andcan provide broader implications in supporting the growth of insurance in Indonesia, which aims toencourage healthy competition and create social welfare.
5. Conclusions
Based on the results of data analysis and discussion, it the follow conclusions can be made.First, that the aggregate model has a negative and significant relationship between liberalization andinnovation. However, in the Threshold Regression model, the impact of liberalization on design differsbetween low-premium firms and high-premium firms. In this case, the positive effects of adaptationliberalization are influenced by the availability of resources to large companies that are higher inoptimizing innovation. Second, in the aggregate model, there is a negative and significant relationshipbetween liberalization and competition.
Sustainability 2020, 12, 10620 22 of 25
Meanwhile, in the Threshold model, the relationship between the two is significant. It indicates thatliberalization can create healthy business competition between domestic and global companies. Third,insurance liberalization has a positive impact on company performance. It means that liberalizationcontributes to the effectiveness of better company performance.
In general, these findings reveal that the liberalization of global insurance finance can havea positive and significant impact on the development of the industrial sector in Indonesia. However,liberalization can be different for groups of small companies and groups of large companies.
From the findings, the expected implication is that the Indonesian government can consider takingpolicies that focus on building a more effective and efficient adaptation of liberalization by prioritizingthree indicators of the insurance industry, namely: innovation, competition, and the performanceof insurance companies. Not only encouraging progress for large companies but also low-incomeinsurance companies. By knowing that these three variables can boost the company’s survival andcompetitive advantage, insurance companies can pay more attention to innovation by improvingthe quality of human resources. In the future, further research can be carried out by addingother variables and with a broader scope so that the weaknesses of liberalization can identifyand solutions found.
Author Contributions: Conceptualization, T.S., D.D., M.E., and R.R.; methodology, T.S. and M.E.; software,M.E.; validation, T.S., D.D., and M.E.; formal analysis, M.E., D.D., and T.H.D.; investigation, D.D., T.S., R.R.,and T.H.D.; resources, T.H.D. and M.E.; data curation, T.S. and I.T.; writing—original draft preparation, T.S.and D.D.; writing—review and editing, T.S.; visualization, T.S. and M.E.; supervision, T.S.; project administration,T.S., D.D., and R.R.; funding acquisition, D.D. and R.R. All authors have read and agreed to the published versionof the manuscript.
Funding: The Indonesia Financial Service Authority supported this work (grant no SP−2/MS.4210/PENG/2020).
Acknowledgments: The authors thank and extend their appreciation to the management department ofthe Research in Financial Service Sector, Indonesia Financial Service Authority for support project, and toSekolah Tinggi Ekonomi dan Bisnis Islam (STEBI) Lampung University for helping explore this subject by invitingexperts from related fields, providing map data, and support funding for this work of research.
Conflicts of Interest: The authors declare no conflict of interest.
References
1. Global Counsel LLP. The role of insurance in ASEAN markets. Prudent. Plc Website 2015. Available online: https://www.prudentialplc.com/~/media/Files/P/Prudential-V3/content-pdf/analysis/asean-insurance.PDF (accessed on10 August 2020).
2. Barros, P.P. Competition Effects of Price Liberalization in Insurance. J. Ind. Econ. 1996, 44, 267–287. [CrossRef]3. Skuflic, L.; Galetic, F.; Greguric, B.A. Liberalization and Market Concentration in the Insurance Industry:
Case of Croatia. Econ. Rev. J. Econ. Bus. 2011, 9, 61–75.4. Gamarra, T. The effects of liberalization and deregulation on the performance of financial institutions: The case of
the German life insurance market. Thünen-Series of Applied Economic Theory-Working Paper, No. 93; Institute ofEconomics, University of Rostock: Rostock, Germany, 2008; pp. 1–45.
5. Rajendran, R.; Natarajan, B. The impact of liberalization, privatization, and globalization (LPG) on lifeinsurance corporation of India (LIC). Afr. J. Bus. Manag. 2010, 4, 1457–1463.
6. Chandrapal, J.D. Impact of liberalisation on Indian life insurance industry: A truly multivariate approach.IIMB Manag. Rev. 2019, 31, 283–297. [CrossRef]
7. Eidizadeh, R.; Salehzadeh, R.; Chitsaz Esfahani, A. Analysing the role of business intelligence, knowledgesharing and organisational innovation on gaining competitive advantage. J. Work. Learn. 2017, 29, 250–267.[CrossRef]
8. Goel, V.K. Impact of Liberalization on the Indian Insurance Industry. Int. J. Res. in Eng. Sci. Manag. 2020,3, 195–198.
9. Fidrmuc, J. Liberalization, democracy and economic performance during transition. ZEI Work. Pap. 2000,12. Available online: https://www.econstor.eu/bitstream/10419/39651/1/311939848.pdf (accessed on 10August 2020).
https://www.prudentialplc.com/~/media/Files/P/Prudential-V3/content-pdf/analysis/asean-insurance.PDF
Sustainability 2020, 12, 10620 23 of 25
10. Lee, C.C.; Lin, C.W. Globalization, political institutions, financial liberalization, and performance ofthe insurance industry. N. Am. J. Econ. Financ. 2016, 36, 244–266. [CrossRef]
11. Glambotskaya, A. The Belarusian Insurance Market Characteristics in the Context of Economic Liberalization:Analysis and Policy Recommendations. Policy Pap. 2009, 1, 1–12. Available online: http://www.get-belarus.de/download/Beraterpapiere/2009/pp2009e01.pdf (accessed on 10 August 2020).
12. Hu, Y. Risk Management of Insurance Fund Use in the Large Asset Management Era. In Proceedings ofthe 3rd International Conference on Management, Education, Information and Control (MEICI 2015) Risk,Shenyang, China, 29–31 May 2015; Atlantis Press: Paris, France, 2015; pp. 757–762.
13. Connelly, J.T.; Limphayom, P. Board Characteristics and Firm Performance: Evidence from the Life InsuranceIndustry in Thailand Board Characteristics and Firm Performance. Chulalongkorn J. Econ. 2004, 16, 101–124.
14. Almajali, A.Y.; Alamro, S.A.; Al-Soub, Y.Z. Factors Affecting the Financial Performance of Jordanian InsuranceCompanies Listed at Amman Stock Exchange. J. Manag. Res. 2012, 4, 266–289. [CrossRef]
15. Shepotylo, O.; Vakhitov, V. Impact of Services Liberalization on rm Performance: Evidence from the Ukrainianrm-Level Data; Discussion Papers 45; Kyiv School of Economics: Kyiv, Ukraine, 2010; pp. 1–21.
16. EU-ASEAN Business Council. The Insurance Industry in ASEAN: Engine for Growth & Social Cohesiveness. 2015.Available online: https://www.eurochamvn.org/sites/default/files/uploads/pdf/InsuranceAdvocacyPaper.pdf(accessed on 10 August 2020).
17. Bao, N.J.; Ramlan, R.; Mohamad, F.; Yassin, A.M. Performance of Malaysian insurance companies using dataenvelopment analysis. Indones. J. Electr. Eng. Comput. Sci. 2018, 11, 1147–1151. [CrossRef]
18. Huang, C.J.; Lin, J.R. Financial liberalization and banking performance: An analysis of Taiwan’s former“Top 10 Banks”. Appl. Econ. Lett. 2011, 18, 1111–1120. [CrossRef]
19. Reddy, A.A. Banking Sector Performance During Liberalization in India-A Review. SSRN Electron. J. 2011,1–14. [CrossRef]
20. Ang, J.B. Savings mobilization, financial development and liberalization: The case of Malaysia. Rev. IncomeWealth 2011, 57, 449–470. [CrossRef]
21. Detragiache, E.; Demirgüç-Kunt, A. Financial Liberalization and Financial Fragility. IMF Work. Pap. 1998, 98,1. [CrossRef]
22. Gairola, V. A Comparative Study of Public and Private Life Insurance Companies in Post Liberalization Era.IJMBS Print Int. J. Manag. Bus. Stud. 2016, 6, 39–43.
23. Uddin, F.; Ali, M.A. New Business of LIC of India under Individual Assurance in the 21st Century:An Appraisa. Saudi J. Bus. Manag. Stud. 2017, 2, 584–590.
24. Kaushal, S.; Ghosh, A. Economic growth and the development of banking and insurance sector inthe post-liberalized India: An empirical analysis. Int. J. Soc. Econ. 2010, 44, 2187–2207. [CrossRef]
25. Bargal, H.; Dashmishra, M.; Sharma, A. Performance Analysis of Small Scale Industries-a Study ofPre-Liberalization and Post-Liberalization Period. Int. J. Bus. Manag. Stud. 2009, 1, 17–26.
26. Boonyasai, T.; Grace, M.; Skipper, H., Jr. The Effect of Liberalization and Deregulation on Life InsurerEfficiency. Ph.D. Thesis, Georgia State Universit, Atlanta, GA, USA, 1999; pp. 1–35.
27. Khanal, D.R. Banking and insurance services liberalization and development in Bangladesh, Nepal,and Malaysia: A comparative analysis. In Proceedings of the Asia-Pacific Research and Training Networkon Trade (ARTNeT); EconStor: Bangkok, Thailand, 2007; Volume 41.
28. Aseffa, Y., XI. Insurance services liberalization and capacity-building: The case of Africa. In Trade andDevelopment Aspects of Insurance Services and Regulatory Frameworks; United Nations: New York, NY, USA;Geneva, Switerland, 2007; pp. 199–242.
29. Tsay, R.S. Testing and Modeling Threshold Autoregressive Processes. J. Am. Stat. Assoc. 1989, 84, 231–240.[CrossRef]
30. Wooldridge, J.M. Applications of generalized method of moments estimation. J. Econ. Perspect. 2001, 15,87–100. [CrossRef]
31. Pope, N.; Ma, Y.L. The market structure–performance relationship in the international insurance sector.J. Risk Insur. 2008, 75, 947–966. [CrossRef]
32. OECD. Annual Report 2005; OECD Publishing: Paris, France, 2005; ISBN 9264007822.
Sustainability 2020, 12, 10620 24 of 25
33. Van Der Aa, W.; Elfring, T. Realizing innovation in services. Scand. J. Manag. 2002, 18, 155–171. [CrossRef]34. Veugelers, R. The role of SMEs in innovation in the EU: A case for policy intervention? Rev. Bus. Econ. 2008,
53, 239–262.35. Deloitte 2019 Insurance Outlook. Deloutte Cent. Financ. Serv. 2018. Available online: https://www2.deloitte.
com/content/dam/Deloitte/us/Documents/financial-services/us-fsi-dcfs-2019-insurance-industry-outlook.pdf(accessed on 10 August 2020).
36. Paudel, R.C.; Jayanthakumaran, K. Financial liberalization and performance in Sri Lanka: The ARDLapproach. South Asia Econ. J. 2009, 10, 127–156. [CrossRef]
37. Bas, M. Does services liberalization affect manufacturing firms’ export performance? Evidence from India.J. Comp. Econ. 2014, 42, 569–589. [CrossRef]
38. Mumuni, A.G.; Luqmani, M.; Quraeshi, Z.A. Telecom market liberalization and service performance outcomesof an incumbent monopoly. Int. Bus. Rev. 2017, 26, 214–224. [CrossRef]
39. Leverty, T.; Lin, Y.; Zhou, H. Firm Performance in the Chinese Insurance Industry; Wharton Working Paper;Georgia State University: Atlanta, GA, USA, 2004.
40. Effiom, L.; Edet, S.E. Financial innovation and the performance of small and medium scale enterprises inNigeria. J. Small Bus. Entrep. 2020, 1–34. [CrossRef]
41. Oanh, N.T. The Relationship between Innovation Capability, Innovation Type and Innovation Performancein FDI Enterprises in Vietnam. Int. J. Econ. Financ. 2019, 11, 28. [CrossRef]
42. Krishnamurthy, S.; Mony, S.V.; Jhaveri, N.; Bakhshi, S.; Bhat, R.; Dixit, M.R.; Maheshwari, S. Insuranceindustry in India: Structure, performance, and future challenges. Vikalpa 2005, 30, 93–119. [CrossRef]
43. Langerak, F.; Hultink, E.J.; Robben, H.S.J. The Impact of Market Orientation, Product Advantage, and LaunchProficiency...: EBSCOhost. J. Prod. Innov. Manag. 2004, 21, 79–94. [CrossRef]
44. Kaur Bawa, S.; Chattha, S. Financial Performance of Life Insurers in Indian Insurance Industry. Pac. Bus.Rev. Int. 2013, 6, 44–52.
45. Arestis, P.; de Paula, L.F. Financial Liberalization and Economic Performance in Emerging Countries; Springer:Berlin/Heidelberg, Germany, 2008; pp. 1–221.
46. Market, E.I. Chapter Four Liberalization, Consolidation and Competitive Behaviour in an Emerging InsuranceMarket. In Efficiency, Competition and Risk-Taking Behaviour in the Short-Term Insurance Market in South Africa;2016; p. 73. ISBN 978-979-9474-57-5. Available online: https://open.uct.ac.za/bitstream/item/27718/thesis_com_2016_alhassan_abdul_latif.pdf?sequ#page=91 (accessed on 10 August 2020).
47. Gupta, N.; Anand, A.; Rana, S. Impact of Liberalization on the Insurance Sector in India. J. Serv. Res. 2015,16, 1–37.
48. Konan, D.E.; Maskus, K.E. Quantifying the impact of services liberalization in a developing country. J. Dev.Econ. 2006, 81, 142–162. [CrossRef]
49. Arnold, J.; Javorcik, B.S.; Mattoo, A. The productivity effects of services liberalization: Evidence fromthe Czech Republic. J. Int. Econ. 2011, 85, 136–146. [CrossRef]
50. Taylor, L. External Liberalization, Economic Performance, and Distribution in Latin America and Elsewhere.World Inst. Dev. Econ. Res. 2000, 215, 1–47.
51. Ge, W. Special Economic Zones and the Opening of the Chinese Economy: Some Lessons for EconomicLiberalization. Acta Ophthalmol. 1999, 27, 1267–1285. [CrossRef]
52. Demir, F. A failure story: Politics and financial liberalization in Turkey, revisiting the revolving doorhypothesis. World Dev. 2004, 32, 851–869. [CrossRef]
53. Wikantari, M.A. Sustainable Strategy in Life Insurance Industry in Indonesia. In Proceedings of the UIProceedings on Social Science and Humanities, Yogyakarta, Indonesia, 25–27 June 2019; Volume 3.
54. Ray, S.; Bandyopadhy, K.; Thakur, V. Liberalisation of Insurance Sector: An Analysis of India and Brics.Indian Counc. Res. Int. Econ. Relat. 2020. Available online: https://www.think-asia.org/bitstream/handle/
11540/12580/Working_Paper_396.pdf?sequence=1 (accessed on 10 August 2020).55. Muhamad Arifin, N.A.; Mohd Arifin, N.; Zulkufly Ramly, Z.; Hashim, M.J. The Role of Competition as
a Mediator Between Financial Liberalization and Financial Stability. Adv. Bus. Res. Int. J. 2019, 5, 51.[CrossRef]

Sustainability 2020, 12, 10620 25 of 25
56. Markonah, M.; Sudiro, A.; Rahayu, M. The Effect of Corporate Governance and Premium Growth onthe Performance of Insurance Companies in Indonesia. Eur. Res. Stud. J. 2019, XXII, 367–383. [CrossRef]
57. Parida, T.K.; Acharya, D. Competition in Indian life insurance industry: Post liberalisation evidence. Int. J.Bus. Compet. Growth 2016, 5, 110. [CrossRef]
Publisher’s Note: MDPI stays neutral with regard to jurisdictional claims in published maps and institutionalaffiliations.
© 2020 by the authors. Licensee MDPI, Basel, Switzerland. This article is an open accessarticle distributed under the terms and conditions of the Creative Commons Attribution(CC BY) license (http://creativecommons.org/licenses/by/4.0/).
Related Documents