Cleveland State University Cleveland State University EngagedScholarship@CSU EngagedScholarship@CSU ETD Archive 2008 The Influence of Customer Relationship Management to The Influence of Customer Relationship Management to Customer Satisfaction and Retention in Propery and Casualty Customer Satisfaction and Retention in Propery and Casualty Insurance Insurance Brooke Ellen Lyttle Cleveland State University Follow this and additional works at: https://engagedscholarship.csuohio.edu/etdarchive Part of the Psychology Commons How does access to this work benefit you? Let us know! How does access to this work benefit you? Let us know! Recommended Citation Recommended Citation Lyttle, Brooke Ellen, "The Influence of Customer Relationship Management to Customer Satisfaction and Retention in Propery and Casualty Insurance" (2008). ETD Archive. 701. https://engagedscholarship.csuohio.edu/etdarchive/701 This Thesis is brought to you for free and open access by EngagedScholarship@CSU. It has been accepted for inclusion in ETD Archive by an authorized administrator of EngagedScholarship@CSU. For more information, please contact [email protected].

Welcome message from author
This document is posted to help you gain knowledge. Please leave a comment to let me know what you think about it! Share it to your friends and learn new things together.
Transcript
Cleveland State University Cleveland State University
EngagedScholarship@CSU EngagedScholarship@CSU
ETD Archive
2008
The Influence of Customer Relationship Management to The Influence of Customer Relationship Management to
Customer Satisfaction and Retention in Propery and Casualty Customer Satisfaction and Retention in Propery and Casualty
Insurance Insurance
Brooke Ellen Lyttle Cleveland State University
Follow this and additional works at: https://engagedscholarship.csuohio.edu/etdarchive
Part of the Psychology Commons
How does access to this work benefit you? Let us know! How does access to this work benefit you? Let us know!
Recommended Citation Recommended Citation Lyttle, Brooke Ellen, "The Influence of Customer Relationship Management to Customer Satisfaction and Retention in Propery and Casualty Insurance" (2008). ETD Archive. 701. https://engagedscholarship.csuohio.edu/etdarchive/701
This Thesis is brought to you for free and open access by EngagedScholarship@CSU. It has been accepted for inclusion in ETD Archive by an authorized administrator of EngagedScholarship@CSU. For more information, please contact [email protected].

THE INFLUENCE OF CUSTOMER RELATIONSHIP MANAGEMENT TO
CUSTOMER SATISFACTION AND RETENTION IN PROPERTY AND CASUALTY
INSURANCE
BROOKE ELLEN LYTTLE
Bachelor of Arts in Psychology and Criminal Justice
Kent State University
May, 2003
Submitted in partial fulfillment of requirements for the degree
MASTER OF ARTS IN PSYCHOLOGY
at the
CLEVELAND STATE UNIVERSITY
May, 2008

This thesis has been approved
for the Department of Psychology
and the College of Graduate Studies
Thesis Chairperson, Steven D. Slane, PhD
Department & Date
Brian F. Blake, PhD
Department & Date
Leslie E. Fisher, PhD
Department & Date
THE INFLUENCE OF CUSTOMER RELATIONSHIP MANAGEMENT TO
CUSTOMER SATISFACTION AND RETENTION IN PROPERTY AND CASUALTY
INSURANCE
BROOKE ELLEN LYTTLE
ABSTRACT
Customer relationship management (CRM) emerged in the 1990’s, promising to
revolutionize the business and customer dynamic. At present, CRM has yet to live up to
its promise of individualized customer relationships with carefully targeted customers.
In property and casualty insurance, customer and insurer relationships are
important. It is more cost effective to retain current customers than to acquire new ones.
This thesis explores the history of CRM and how its proper implementation can help
identify areas of customer satisfaction and retention in the property and casualty
insurance industry.
Data were collected from a regional property and casualty insurer and analyzed to
determine customer satisfaction standards. A factor analysis and several multiple
regressions were conducted to determine whether satisfaction on identified standards was
a predictor of stated likelihood to renew the policy.
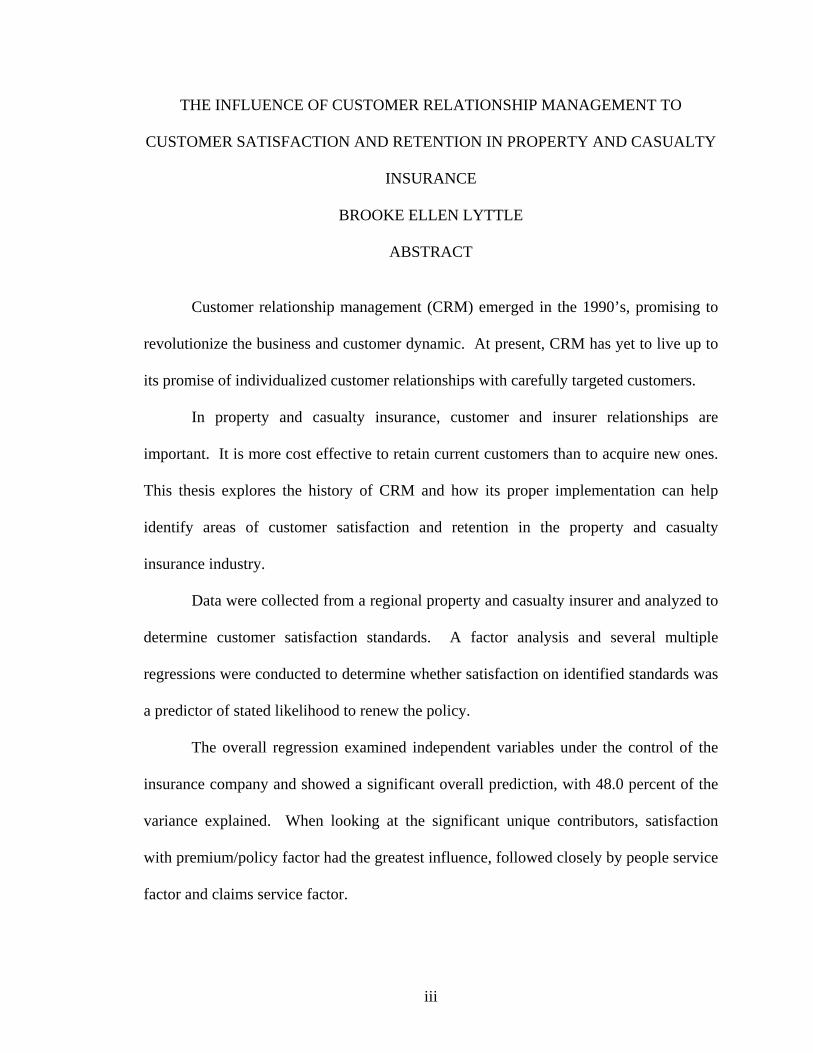
The overall regression examined independent variables under the control of the
insurance company and showed a significant overall prediction, with 48.0 percent of the
variance explained. When looking at the significant unique contributors, satisfaction
with premium/policy factor had the greatest influence, followed closely by people service
factor and claims service factor.
iii

The second regression was conducted with customers of high-value agencies and
explored variables under control of the agent. The model explained 33.8 percent of the
variance, and found satisfaction with the agent had the greatest influence, followed by
ease of billing, and satisfaction with explanations of premium costs.
The third regression looked at the same variables but with customers of low-value
agents. The model explained 47.4 percent of the variance, and found ease of the claims
process had the most influence, followed by satisfaction with explanations of premium
costs, and ease of billing.
The goal was to investigate how variables identified through previous research
would predict likelihood to renew with the insurer. The results of all the regressions
support the importance of CRM “moments of truth.” In addition, the results from the
analyses if customers of low- and high-value agents provided support for the impact of
the company’s internal program, FOCUS.
iv

TABLE OF CONTENTS
Page ABSTRACT…………………………………………………………………………… iii
LIST OF TABLES…………………………………………………………………….. vi
LIST OF FIGURES…………………………………………………………………… vii
CHAPTER
I. INTRODUCTION…………………………………………….…………….... 1
Database marketing………….…………………………………. 2
Building a database……………………………………….…….. 3
Types of databases……………………………………….…....... 4
Theoretical stages of CRM………………………………….….. 5
CRM process…………………………………………….…...… 8
Key Moments of truth………...................................................... 8
Customer Lifetime Value…………………………………........ 10
Hypothesis development………………….…………………… 14
II. METHOD………………………………………………………………....... 16
Company history…………………………………..................... 16
Survey procedure…………………………………………........ 17
Participants……………………………………………............. 18
III. RESULTS…………………………………………………………............ 19
IV. DISCUSSION………………………………………………….................. 29
REFERENCES…………………………………………………………………........... 33
APPENDIX……………………………………………………………………............ 36
v

LIST OF TABLES
Table Page
I. Results from likelihood to renew regression of satisfaction variables……. 20
II. Results from factor analysis of independent variables……………………. 22
III. Results from likelihood to renew regression with factor scores………....... 24
IV. Results from likelihood to renew regression of satisfaction variables
(customers of high-value agents)…………………………………………... 26
V. Results from likelihood to renew regression of satisfaction variables
(customers of low-value agents)…………………………………………... 27
vi

vii
LIST OF FIGURES
Figure Page
1. Model to calculate LTV……………..…………………………………… 12
2. Examples of question wording for variables……………………………... 18

CHAPTER I.
INTRODUCTION
One-on-one marketing is not new to American business. In colonial times it was
common for a merchant to have direct contact with the customer. This interaction led to
trusted bonds between merchants and their customers. The trusted bond between a
business and a customer are the foundations of customer relationship management
(CRM). CRM is concerned with the creation, development, and enhancement of
individualized customer relationships with carefully targeted customers, resulting in
maximizing their total customer lifetime value (LTV) (Reinartz, Krafft, & Hoyer, 2004).
Companies want to avoid the mistake of not identifying a good customer, and
subsequently, not rewarding the customer accordingly. Companies also want to avoid
wrongful classification of a low-value customer as a high-value customer and subsequent
overspending of resources. The development of a reliable CRM approach aids in the
measurement of customer value and therefore reduces the chance of these errors
(Reinartz, Krafft, & Hoyer, 2004).
The concept of CRM entered the business world in the 1990’s with a promise to
change the way businesses interacted with their customers. However, there are some
obstacles. CRM is a cumbersome process. It is expensive and difficult to track and
1

2
maintain the large database needed to run CRM effectively. However, recent
technological advances have greatly improved CRM capabilities.
Despite CRM’s popularity, there is still confusion about what it is, what it can do,
and the best situations in which to use it. When used properly, CRM can allow a
company to better understand its valuable customers’ needs and wants, allowing
measurable customer service standards to be created. It identifies the service components
important to customers such as an acceptable wait time or time of transaction. The
company can then implement customer service standards. Once the standards are in
place, analysis can then be conducted to see if, by meeting the standards, customer
satisfaction improves. Further research could also explore the relationship between
customer satisfaction and customer retention.
Database marketing
CRM is often confused with database marketing. Although both use databases to
guide marketing strategies, the difference is the focus of the marketing. CRM is aimed at
determining and influencing the behavior of individuals through one-on-one marketing.
Database marketing is aimed at identifying customer segments and markets to them.
Customer relationship management evolved in the 1980’s from database
marketing and was made popular with mass mailers such as American Express and State
Farm Insurance. Both companies used their customer lists to build relationships with their
customers after the initial sale, leading to retention and cross sales (Hughes, 2003).
Database marketing assumes that through the collection and organization of information
about a business, marketing costs can be reduced and profit can increase. Typically, the
information is consumer focused: the date of the last purchase, what was purchased, and
3
other demographic information. However, an integrated approach would include
information about products, suppliers, competitors, and other business areas. As
technology became more sophisticated and economical, database marketing became more
accessible and practical to businesses. It became possible to store and use information to
build lasting relationships. As a result, it became possible to increase sales and profits by
promoting cross sales, repeat sales, and upgrades, by computing customer LTV and using
it strategically, and by creating customer loyalty programs (Ragusa, 2001).
One of the greatest benefits of database marketing is improved customer service.
When there is accurate information about the customer, the customer service
representative (CSR) is better able to address questions and concerns, since they are
provided with the customer’s past purchase behaviors (Bean, 1999). Information such as
past purchases, times of purchases, amounts of purchases, along with any relevant
demographic information about the customer, are available. The unique customer service
also allows a special, individualized relationship to develop between the company and the
customer.
Building a database
CRM’s success is dependant on an accurate database. The integrity of the data is
important. Not taking care to make sure the data are accurate is a major reason why
marketing databases fail (Bean, 1999; English, 1998). Business costs of poor data can be
significant, and the investment in data quality generates a payback greater than the initial
investment. The true challenge of database marketing is the organization and
transformation of numerous scattered data into meaningful customer information (Bean,
1999). Building begins with identifying the sources of data, which include transactional

4
information, order entry systems, accounting systems, operational manufacturing
systems, sales tracking systems, and outside lists.
Customer Data Integration (CDI) is an area within data management that can
organize various siloed systems into single customer view (McCormick, 2007). One
method is through a hub and spoke customer integration model where a central
integration point is created into which all source systems will link. Master customer data
is stored within the hub such as name, address, date of birth, e-mail address, telephone
number, etc. A unique customer identifier is given to link the customer to different
spokes of data sources.
Next, the data must be organized and maintained in a meaningful way. Customer
data can change, and it can be difficult to keep the information current and correct. One
way this can be done is through the establishment of consistency keys, which make it
possible to detect changes in various data sources. This is part of the function of the
unique customer identifier. Anytime data from the spokes of the model conflicts with the
master customer data in the main hub algorithms are used to create the best match or
determine if a new customer record should be created (McCormick, 2007). Consistency
key management ensures recognition of the same customer over time (Bean, 1999).
Types of databases
There are three main types of databases: operational, marketing, and warehouse.
Each database is quality controlled by a different department (Hughes, 2003). An
operational database is used to process transaction information and general business
information, such as sales, shipments, and payments. The IT department often maintains
the operational database since it is based on accounting principles. It is balanced to the

5
dollar and is externally audited. The operational database contains information only on
current customers, and old data is archived. There are no data on prospective customers
until they make a purchase. The IT department also oversees the larger database
warehouse.
The marketing database receives information from the operational database and is
managed by the marketing department. It includes information on current, lost, and
prospective customers and the company’s communication with them. It also contains
data from preferences and profiles provided by the customer, a response history from
marketing campaigns, and a customer lifetime value. A customer’s lifetime value is
defined as a measure of the net profitability received from a given customer during their
future lifetime as a customer (Hughes, 2003).
The warehouse database combines the two databases into one centralized location
and is the truly integrated database. CRM evolved from these integrated databases to
create an even more individualized relationship for the customer than the non-integrated,
multi-database systems that many companies had been using.
Theoretical foundation of CRM
The key theoretical basis for CRM research is the relationship-marketing
literature. It is believed that building and managing ongoing customer relationships
delivers the main marketing message (Morgan & Hunt, 1994; Webster, 1992). CRM
allows a single view of the customer across all contact channels. Meaning a CSR can
pull up a customer in the database and see the entire relationship the customer has with
the company. It is important that information coordinates across time and contact
channels to manage the entire relationship systematically. When CRM is conceptualized
6
at this level, literature suggests four distinct issues must be recognized: (1) building and
managing ongoing customer relationships is the essence of the marketing concept
(Morgan & Hunt, 1994; Webster, 1992); (2) relationships evolve through distinct phases
(Dwyer, Schurr, & Oh, 1987); (3) it is necessary to interact with customers and manage
relationships at each stage (Shivastava, Shervani, & Fahey, 1998); and (4) the distribution
of relationship value to the company is not homogenous (Mulhern, 1999; Niraj, Gupta, &
Narasimhan, 2001).
The first assumption in the theoretical approach of relationship management is
that managing relationships is beneficial to business (Reichheld & Teal, 1996). For
example in the medical industry, a patient’s relationship with their doctor is the
foundation of the business relationship. The doctor could be an excellent diagnostician
but if the patient does not perceive a meaningful relationship with the doctor then they
may take their business elsewhere. Therefore managing customer relationships has a
direct impact on the business. However, these observations have been qualified by
empirical evidence that stresses the importance of moderating effects (Niraj, Gupta, &
Narsimhan, 2001; Reinartz & Kumar, 2000). Enablers such as organizational design,
appropriate incentives, IT resources, as well as industry, company, or customer
structures, may affect the effectiveness of relationship marketing campaigns. For
example, in a medical practice it would be difficult to measure the effectiveness of any
relationship marketing campaign because the customer-business relationship is heavily
weighted by the patient’s relationship with their doctor as well as other external factors
like the patient’s insurance company or the convenience of the office hours. It is

7
essential to keep these mitigating factors in mind when evaluating the effectiveness of
CRM.
The second assumption of CRM is that relationships evolve with distinct phases
(Dwyer, Schurr, & Oh, 1987). Relationships cannot be viewed as multiple separate
transactions; rather, the interdependency of the transactions creates a dynamic over time
(Reinartz, Krafft, & Hoyer, 2004). The first stage of the relationship is the customer
acquisition, followed by retention, and finally relationship termination. The customer or
company can terminate the relationship at anytime, either intentionally or unintentionally.
CRM is a longitudinal process, and the customer relationship must be able to evolve over
time.
The third assumption in the CRM process is that the recognition of relationship
evolution has implications for the company. Companies should interact with customers
and manage relationships differently at each stage (Shivastava, Shervani, & Fahey,
1998). A goal of CRM is to manage the different stages of the relationship systematically
and proactively. These touch points or key moments of truth are the specific times the
company and the customer make contact (Ragusa, 2001). These moments are important
and will be addressed in depth later.
The final assumption is that the distribution of relationship value to the company
is not homogenous (Mulhern, 1999; Niraj, Gupta, & Narasimhan, 2001). An advantage
of CRM is that companies are able to measure profitability based on customers, not just
product lines, allowing companies to re-examine resource allocations. The most valuable
customers frequently do not receive the company’s share of attention and resources while
the company overspends on marginal customers. CRM proposes that companies define
8
different allocations for different tiers of customers, where the customer’s value depends
on their economic value to the company (Zeithaml, Rust, & Lemon, 2001).
CRM process
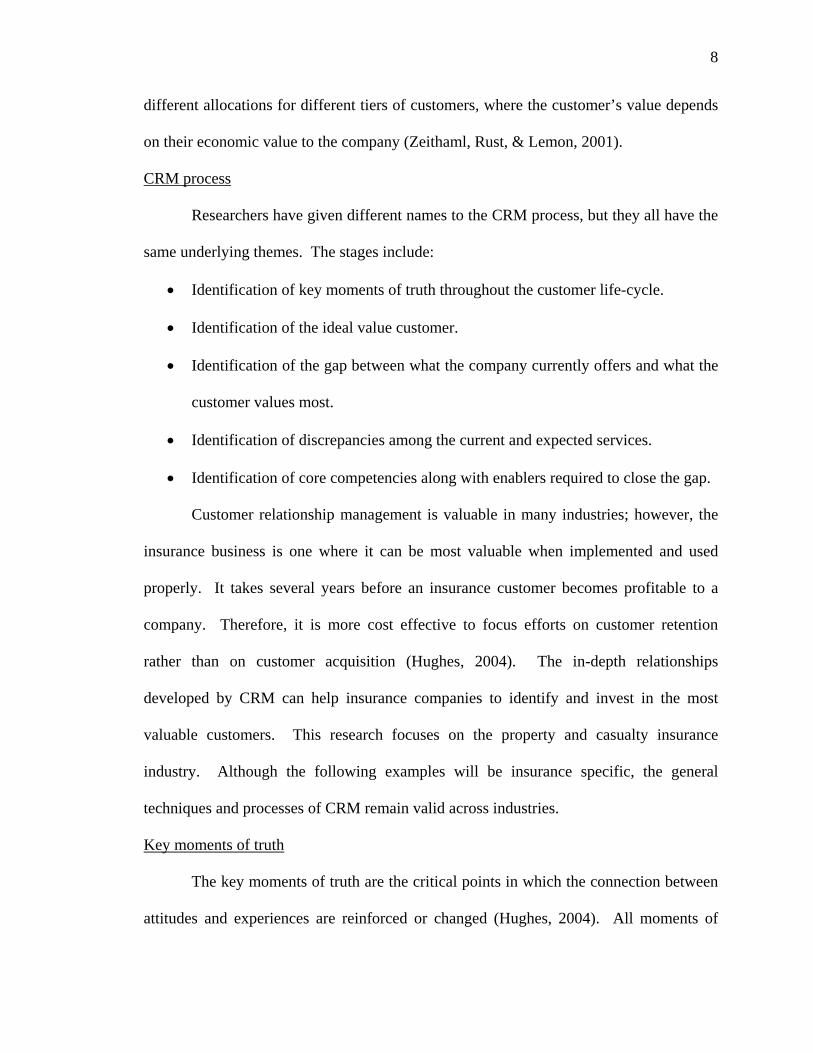
Researchers have given different names to the CRM process, but they all have the
same underlying themes. The stages include:
• Identification of key moments of truth throughout the customer life-cycle.
• Identification of the ideal value customer.
• Identification of the gap between what the company currently offers and what the
customer values most.
• Identification of discrepancies among the current and expected services.
• Identification of core competencies along with enablers required to close the gap.
Customer relationship management is valuable in many industries; however, the
insurance business is one where it can be most valuable when implemented and used
properly. It takes several years before an insurance customer becomes profitable to a
company. Therefore, it is more cost effective to focus efforts on customer retention
rather than on customer acquisition (Hughes, 2004). The in-depth relationships
developed by CRM can help insurance companies to identify and invest in the most
valuable customers. This research focuses on the property and casualty insurance
industry. Although the following examples will be insurance specific, the general
techniques and processes of CRM remain valid across industries.
Key moments of truth
The key moments of truth are the critical points in which the connection between
attitudes and experiences are reinforced or changed (Hughes, 2004). All moments of

9
truth must be identified in each phase of the relationship between the customer and the
business. These touch points are interactions between the supplier and customer, and
many times these are the points where the customer’s expectations and preferences may
shift under the influence of an event. For example, when a claim is processed and
generates minimal disturbance to the customer, the customer’s perception of the company
may increase. Each essential area of customer satisfaction, such as billing or claims, will
reveal a moment of truth (Foss & Stone, 2002). The information can be gained from
research or by using brainstorming with groups from all aspects of customer interaction
to understand what moments are most critical to the customer.
. There are several obvious moments of truth that are important to the customer-
company relationship including when the customer receives a bill, when a customer calls
the sales line, when a customer goes to the company web site, when a customer calls the
company call center with a question or complaint, or when the company contacts the
customer in hopes of renewal, upgrade, or cross-sell. Some less obvious moments of
truth could include a customer’s birthday, a new birth in the customer’s family, when a
customer moves to a new city, or any time the customer’s insurance needs change. The
company’s performance in moments of truth will determine whether the customer will
stay or defect (Foss & Stone, 2002).
St. Paul Travelers provides an example of communicating with customers through
moments of truth. St. Paul Travelers, based out of St. Paul, Minnesota, supplies
commercial and personal property-casualty insurance along with asset management
services. Travelers understood the need to develop a touch point program to increase the
customers’ positive moments of truth. The program focused on five annual touch points
10
from the agent that varied with the type of insurance the customer had and the length of
time the customer had been with Travelers. Agent touch points included: within 60 days
of renewal an annual review of the policy would be sent, within the first quarter a thank
you card for renewal is sent, in the second quarter a cross-sell postcard is sent, in the third
quarter a newsletter is sent, and in the fourth quarter a seasonal greetings card is sent
(Hughes, 2004).
The Travelers’ program showed that for each customer, they had to continually
determine the appropriate message, the frequency of the messages that the customer
wanted, the desired channel, the timing of the message, and the likelihood of defection.
Travelers revealed that 65 percent of customers who defected, never talked to an agent
before they left, but 80 percent of the customers that talked to an agent during the year
did not leave. The importance of having touch points for their customers is revealed in
the fact that without the communication with the agent they were losing customers
(Hughes, 2004).
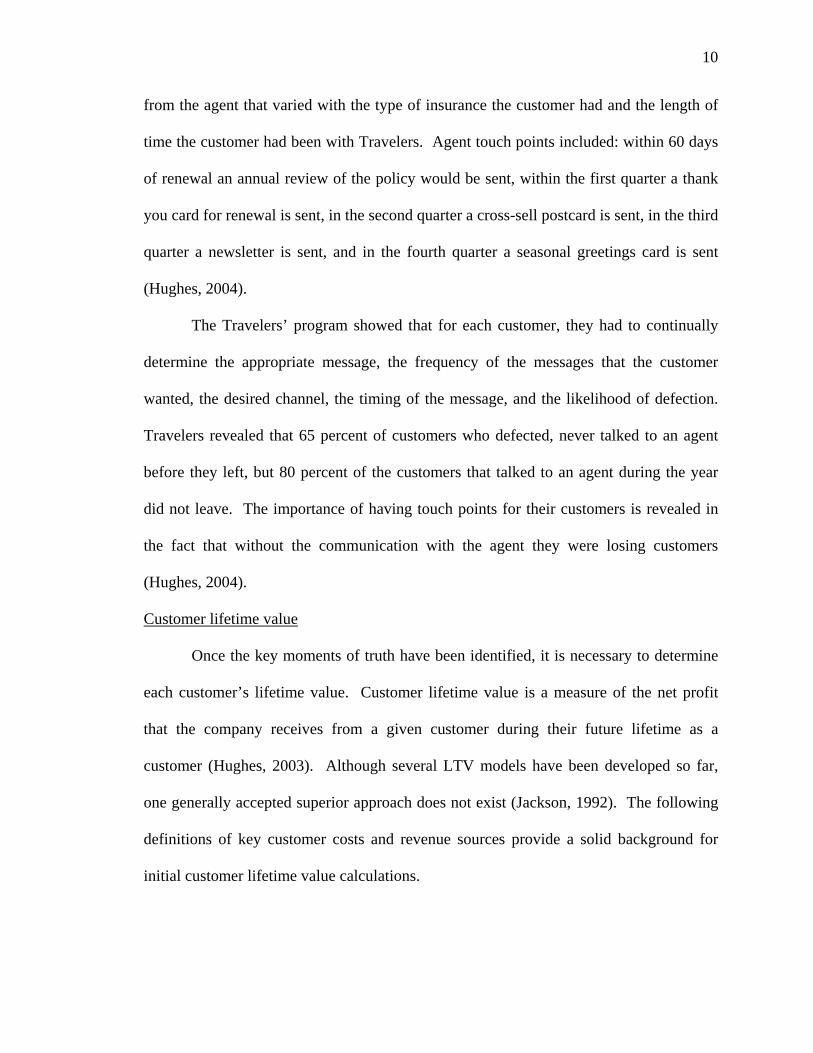
Customer lifetime value
Once the key moments of truth have been identified, it is necessary to determine
each customer’s lifetime value. Customer lifetime value is a measure of the net profit
that the company receives from a given customer during their future lifetime as a
customer (Hughes, 2003). Although several LTV models have been developed so far,
one generally accepted superior approach does not exist (Jackson, 1992). The following
definitions of key customer costs and revenue sources provide a solid background for
initial customer lifetime value calculations.

11
It is suggested that large and heterogeneous customer groups be separated into
homogenous segments that possess different LTV’s. In order to create detailed
individual LTV’s and to ease calculation efforts, each value component should be
calculated separately for each customer segment. Then the specific value figures of each
group will serve as a basis for the calculation of the individual LTV’s. An examination
of basic LTV models reveals that the incorporated variables can generally be classified
into three categories: retention rate, revenue, and costs (Reinartz & Kumar, 2000).
The retention rate refers to the probability that an individual customer will remain
loyal to a company, yielding expected revenue and costs within a fixed period of time
(Bauer, Hammerschmidt, & Braehler, 2003). The retention rate can be estimated with the
help of empirically validated determinants of loyalty, such as customer satisfaction,
switching barriers, and the attractiveness of the alternatives.
The second category, revenue, can be classified into four sub-categories:
autonomous revenue, up-selling revenue, cross-selling revenue, and contribution margins
resulting from referral activities of existing customers. These components play a major
role in compiling a complete record of the customer’s history over the life cycle and are
essential to the identification of operative touch points of contact. Autonomous revenue
accounts for factors not directly influenced by the company or that are only affected by
standard marketing measures like TV advertising. Essentially, it is basic revenue not
including targeted measures to increase up-selling and cross-selling. It is usually
calculated by means of traditional procedures of demand forecast, e.g., analyses of time
sequences. Up-selling revenue is generated by the additional selling of the same product
resulting from increased purchase frequency and intensity in long-life relationships

12
(quantity effect, i.e., higher purchase amount per transaction and more transactions per
period). It also emerges from a price effect, where selling of higher-priced substitutes of
the same category to loyal, long-term customers that are less price sensitive (Reinartz &
Kumar, 2000). Cross-selling is defined as the selling of complementary products or
product categories respectively which might not otherwise have been bought from the
company (Reichheld & Sasser, 1990); for example selling homeowners insurance to an
automobile insurance customer. The reference value measures margins from new
customers acquired through a referral by existing customers.
The basic methods for predicting costs, the third category, are those that are
commonly used in product-related accounting. The traditional forecast methods have
been supplemented by findings about cost reducing effects of long-term customer
relationships (Reichheld & Teal, 1996). Acquisition, marketing, recovery, and sales costs
must also be included.
There are many LTV equations and models, and, as of yet, there is no single
calculation that encompasses all the relevant parts of LTV. The following equation (see
Figure 1) from Bauer, Hammerschmidt, and Braehler (2003) summarizes many of the
essential facets of LTV, including aspects of revenue, costs, and retention rates. Indirect-
monetary contributions such as information, cooperation, and innovation value are also
included.

13
Figure I. Model to calculate LTV. CLVi Lifetime value of customer i (net present lifetime profit) ACi Acquisition costs of customer i rti Retention rate of customer i in period t ARti Autonomous revenue of customer i in period t URti Up selling revenue of customer i in period t (retention value) CRti Cross selling revenue of customer i in period t (cross selling value) RVti Gross contributions from reference activities of customer i in period t (reference value) MCti Marketing costs for retaining customer i in period t SC Costs for serving the customer i in period t (cost of sales) TCi Termination costs for the relationship with customer i InfoVti Information value of customer i in period t CoopVti Cooperation value of customer i in period t InnoVti Innovation value of customer i in period t d Discount rate appropriate for marketing investments T Length (in years) of the projection period
Once the LTV has been established for the customers, it is possible to develop a
profile containing characteristics of the most valuable customers. Insurance market
research has revealed that ideal customers value clear routes of access, quick responses,
prior customer information available at any point of contact, clear documentation and
explanations, a feeling of trust, and competitiveness (Foss & Stone, 2002).
Valuable customers can give insight into services and standards that they feel are
imperative to the insurance experience. Once standards have been established, the gap
between what the insurance company currently offers and what the customer wants can
be evaluated. If the gap is small, the company is on target with customer expectations.
However, if the gap is substantial, the company is not meeting customer expectations and
runs the risk of having a customer defect.
United Services Automobile Association (USAA) is an insurance company that
understands the importance of evaluating the gap between customer service with the
current company standards and the customer’s expectations. They regularly gauge the
discord between current and expected standards. The insurer has maintained an

14
extremely low customer defection rate compared to the industry average. Currently
USAA has a retention rate of 97 percent (Chordas, 2002). Their high retention rate has
been attributed to their superb customer service. When customers defect, USAA surveys
them to understand their reasons for leaving. The feedback is then used when re-
evaluating customer service improvements.
Hypothesis development
In the insurance industry, knowing a customer’s value is especially important.
Customer retention is more cost effective than customer acquisition (Hughes, 2004). It
takes several years before a customer becomes profitable to an insurance company;
therefore, it is imperative customers do not leave the company prematurely. By having
an in-depth relationship with its customers through CRM, insurance companies can
determine which customers have a high LTV and are worth investment. A targeted and
specific marketing approach to its most valuable customers can lead to decreased costs to
the company. Taking into account the cost of acquisition and long-term return from the
customer, a 10 percent improvement in customer retention can produce a 30 percent
increase in pre-tax profitability. In comparison, 10 percent improvement in acquisition
only results in a three percent improvement (Benn, 2004).
Customers stay with an insurance company when they are satisfied. By meeting
service standards, standards the customers themselves set, satisfaction will increase.
When there is a discrepancy between the current and expected experiences, it is in the
company’s best interest to invest resources to eliminate the gap. In this research, I will
explore the relationship between meeting customer derived service standards, customer
satisfaction, and retention or their stated likelihood to renew.
15
Hypothesis 1: Customer identified satisfaction variables under the control of the
insurance company will be positively related to the likelihood to renew with the
insurer. As customer satisfaction on the identified variables increases, the
likelihood to renew will also increase.
In addition, insurance companies often reward their most productive
agents/agencies with benefits like bonus advertising funds and preferential treatment for
their customers. The additional efforts by the insurance company for their high valued
agents, keeps them happy and helps them continue to produce quality customers. In this
research, I also plan to explore the relationship between customers of high and low value
agencies and the differences in agent satisfaction and likelihood to renew.
Hypothesis 2: Customers identified as having a Platinum or Gold agent (referred
to as “customers of high-value agencies”) through the insurance company’s
FOCUS program will be more influenced by agent satisfaction when choosing to
renew than will customers identified as having a non-Platinum or Gold agent
(referred to as “customers of low-value agencies”).
CHAPTER II.
METHOD
Company history
In 2004, a regional property and casualty insurer announced the start of an annual
customer satisfaction and retention research project. The stated purpose of the research
was to achieve the following objectives:
• explore issues related to performance standards;
• identify factors that most affect customer satisfaction and retention and the relative
importance of each;
• understand the relative importance of factors influencing selection of an insurance
provider;
• and, profile retention factors and attitudes of personal line customers.
The information from this research was to serve as a benchmark for the
company’s future waves of customer satisfaction and retention.
In addition, warehouse information was also included on the agent FOCUS status
of each customer interviewed. The FOCUS benefit program was created in 2001. The
primary purpose of the program is to segment the agency force by performance
determined by retention, growth and loss ratio. From which, a rating or focus score is
16

17
assigned. A better performance results in a higher rating. Ratings translate to levels:
Platinum, Gold, Level 3 and Level 4. The program used to encourage and reward desired
agent behavior. Targets adjust every two years to increase the minimum amount of
growth per level, decrease the acceptable loss ratio etc. Platinum and Gold agencies are
eligible for additional bonus compensation and get more subsidy for reimbursement for
marketing and agent training. Internally, services and additional resources are given to
Platinum and Gold agencies to help them provide the best service to their customers.
Survey procedure
The primary objective was to examine and prioritize the current customer service
standards and to determine which standards should be retained, which needed to be
dropped or modified, and what new standards may be needed to increase customer
satisfaction. To achieve this goal, data were collected through in-depth telephone
interviews with the company’s current personal line (property and casualty insurance
products designed for and bought by individuals, including homeowners and automobile
policies) customers. The questionnaire was created in conjunction with the insurance
company’s internal marketing research department and an outside marketing research
firm and was defined by past qualitative research and the insurer’s predefined needs. The
data were collected between October 15 and November 18, 2004. The survey was
originally timed at 25 minutes; however, demographic questions were dropped to cut the
time to 20 minutes. The changes did not interfere with the core standards measures. The
final survey contained 18 questions that centered on the company’s current customer
service standards in the area of billing, claims, and personal lines services. Standards
were separated into areas of claims, billing, and personal lines services (e.g.,
18
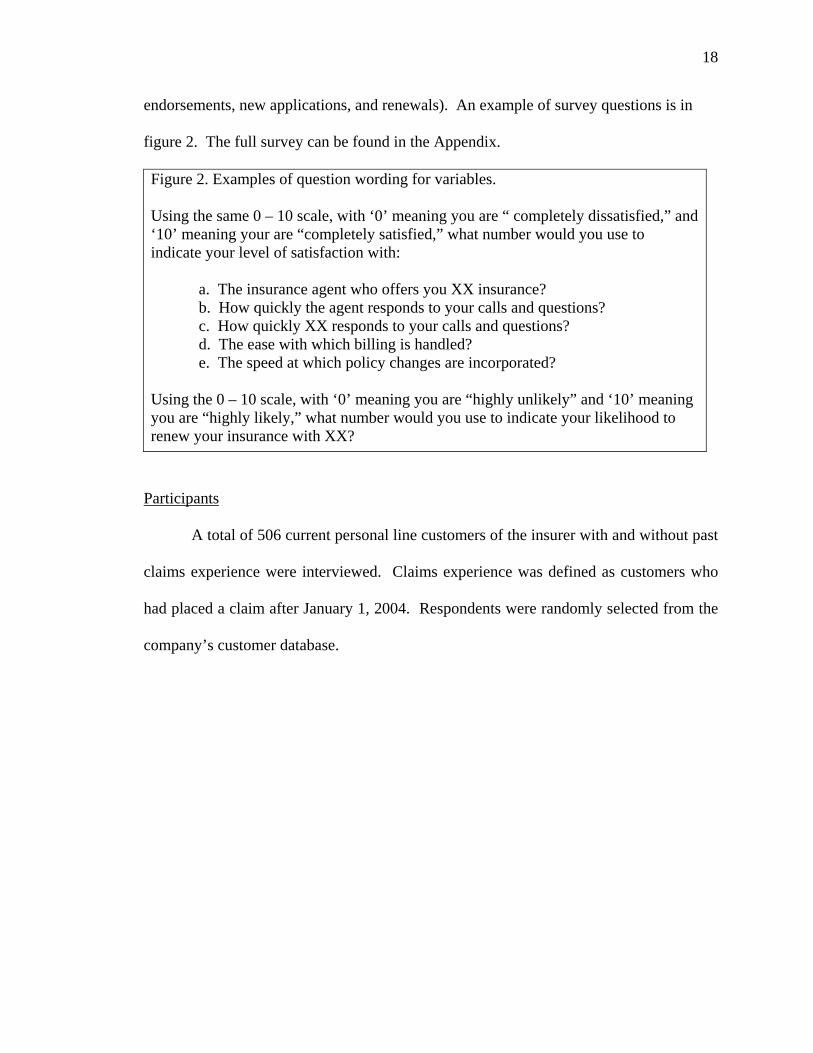
endorsements, new applications, and renewals). An example of survey questions is in
figure 2. The full survey can be found in the Appendix.
Figure 2. Examples of question wording for variables.
Using the same 0 – 10 scale, with ‘0’ meaning you are “ completely dissatisfied,” and ‘10’ meaning your are “completely satisfied,” what number would you use to indicate your level of satisfaction with: a. The insurance agent who offers you XX insurance? b. How quickly the agent responds to your calls and questions?
c. How quickly XX responds to your calls and questions? d. The ease with which billing is handled? e. The speed at which policy changes are incorporated?
Using the 0 – 10 scale, with ‘0’ meaning you are “highly unlikely” and ‘10’ meaning you are “highly likely,” what number would you use to indicate your likelihood to renew your insurance with XX?
Participants
A total of 506 current personal line customers of the insurer with and without past
claims experience were interviewed. Claims experience was defined as customers who
had placed a claim after January 1, 2004. Respondents were randomly selected from the
company’s customer database.

19
CHAPTER III.
RESULTS
In order to test the proposed positive relationship between satisfaction with
service standards and the likelihood to renew with the insurer, a multiple regression was
conducted. The independent variables consisted of variables identified as important to
customer satisfaction through the insurer’s previous qualitative research. Only variables
that were under the control of the insurer were examined (i.e., variables controlled by the
agent were left out). The variables included:
• Satisfaction with the contacts at the insurance company.
• Satisfaction with how quickly the insurance company responded to calls and
questions.
• Satisfaction with the ease in which billing was handled.
• Satisfaction with the speed at which policy changes were incorporated.
• Satisfaction with how quickly claims were settled.
• Satisfaction with the ease of the claims process.
• Satisfaction with the fairness of claim settlements from the insurer.
• Satisfaction with the advice received from the insurer on ways to reduce problems
that might lead to claims.
20
• Satisfaction with the courtesy of people they may have dealt with at the insurance
company.
• Satisfaction with the ease of doing business with the insurance company.
• Satisfaction with the options you had for how often to pay for your premium.
• Satisfaction with explanations of premium costs.
• Confidence that the insurer would take care of you to your satisfaction if you had
a claim.
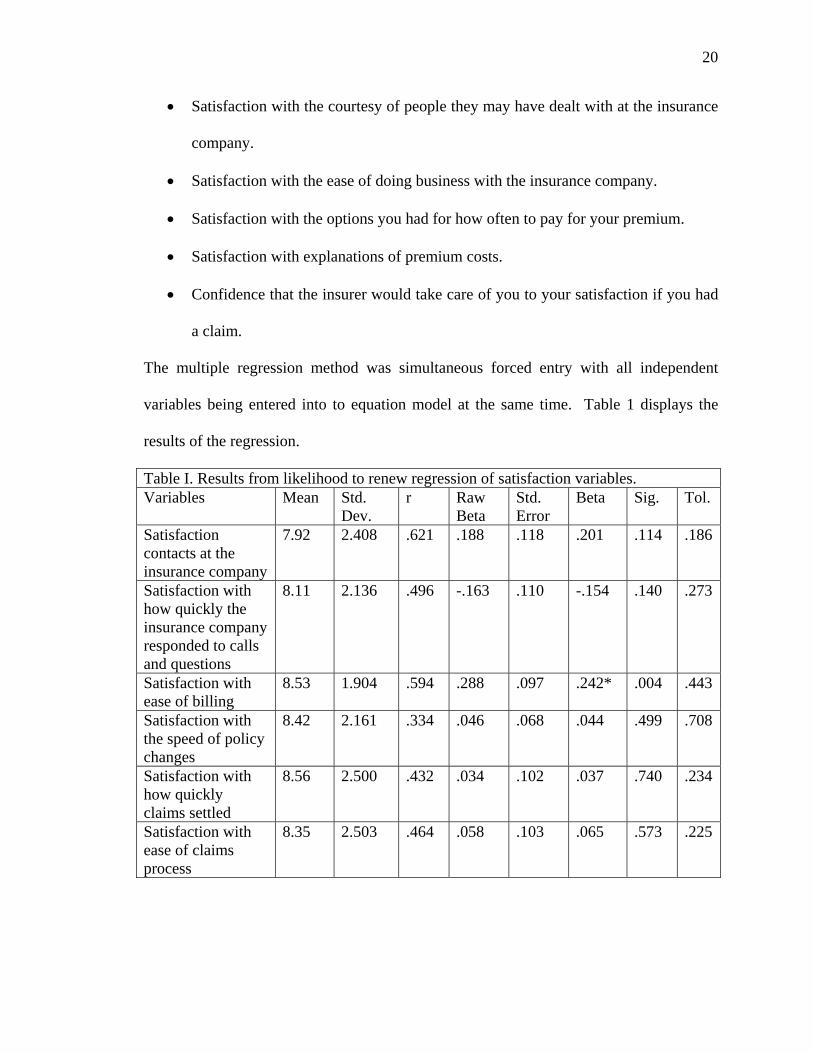
The multiple regression method was simultaneous forced entry with all independent
variables being entered into to equation model at the same time. Table 1 displays the
results of the regression.
Table I. Results from likelihood to renew regression of satisfaction variables. Variables Mean Std.
Dev. r Raw
Beta Std. Error
Beta Sig. Tol.
Satisfaction contacts at the insurance company
7.92 2.408 .621 .188 .118 .201 .114 .186
Satisfaction with how quickly the insurance company responded to calls and questions
8.11 2.136 .496 -.163 .110 -.154 .140 .273
Satisfaction with ease of billing
8.53 1.904 .594 .288 .097 .242* .004 .443
Satisfaction with the speed of policy changes
8.42 2.161 .334 .046 .068 .044 .499 .708
Satisfaction with how quickly claims settled
8.56 2.500 .432 .034 .102 .037 .740 .234
Satisfaction with ease of claims process
8.35 2.503 .464 .058 .103 .065 .573 .225

21
Satisfaction with the fairness of claim settlements from the insurer
8.82 2.242 .374 -.125 .080 -.124 .118 .474
Satisfaction with the advice received from the insurer to reduce problems that might lead to claims
8.77 3.130 .271 -.022 .048 -.031 .649 .661
Satisfaction with the courtesy of people they may have dealt with at the insurance company
8.60 1.914 .512 .077 .124 .065 .535 .268
Satisfaction with the ease of doing business with the insurance company
8.38 1.967 .657 .262 .153 .229 .089 .166
Satisfaction with the premium payment options
8.78 1.541 .416 .020 .113 .014 .860 .502
Satisfaction with explanations of premium costs
7.47 2.406 .485 .136 .067 .145* .043 .585
Confidence that the insurer would take care of you to your satisfaction if you had a claim
8.17 2.165 .619 .136 .109 .130 .212 .273
R2 Adjusted R2 F-Value Sig.
.538
.500 13.977 .000
The multiple regression results show a significant overall prediction of the likelihood of
the respondents to renew their policy with the insurer, with 53.8 percent of the variance
explained by the predictors. All the predictors are correlated with the dependent variable
at the .05 level. However, only two variables had significant beta values (satisfaction
with the ease in which billing was handled β = .242 and satisfaction with explanations of
premium costs β = .145).

22
Substantively, the model is shown to be significant. Therefore, satisfaction in the
identified service standards can be used to predict a current customer’s likelihood to
renew with the insurer. When looking at the significant unique contributors influencing
their likelihood to renew with the insurer, satisfaction with the ease in which the billing
was handled had the greatest influence, and satisfaction with explanations of premium
costs the next greatest influence.
To address the issues of the multicollinearity in the regression and to reduce the
number of variables in the analysis, a factor analysis was conducted. The independent
variables from the regression were factor analyzed using principal component analysis
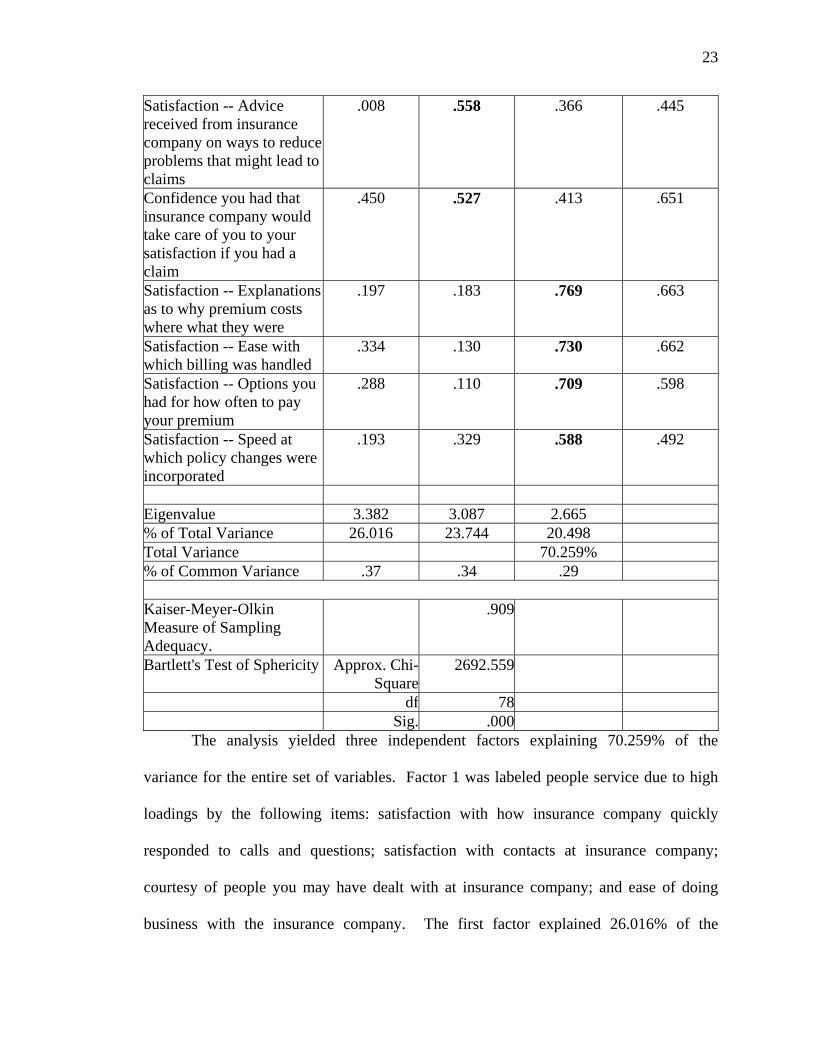
with Varimax (orthogonal) rotation. Table 2 displays the results.
Table II. Results from factor analysis of independent variables. Factor 1
People serviceFactor 2
Claims serviceFactor 3
Premium/policy Communality
Satisfaction -- How quickly insurance company responded to calls and questions
.840 .187 .262 .810
Satisfaction with contacts at insurance company
.819 .237 .321 .830
Satisfaction -- Courtesy of people you may have dealt with at insurance company
.797 .287 .272 .792
Satisfaction -- Ease of doing business with insurance company
.764 .371 .281 .801
Satisfaction -- How quickly claims were settled
.335 .840 .120 .831
Satisfaction -- Fairness of claim settlements from insurance company
.235 .812 .166 .742
Satisfaction -- Ease of going through claim process
.380 .808 .140 .817
23
Satisfaction -- Advice received from insurance company on ways to reduce problems that might lead to claims
.008 .558 .366 .445
Confidence you had that insurance company would take care of you to your satisfaction if you had a claim
.450 .527 .413 .651
Satisfaction -- Explanations as to why premium costs where what they were
.197 .183 .769 .663
Satisfaction -- Ease with which billing was handled
.334 .130 .730 .662
Satisfaction -- Options you had for how often to pay your premium
.288 .110 .709 .598
Satisfaction -- Speed at which policy changes were incorporated
.193 .329 .588 .492
Eigenvalue 3.382 3.087 2.665 % of Total Variance 26.016 23.744 20.498 Total Variance 70.259% % of Common Variance .37 .34 .29
Kaiser-Meyer-Olkin Measure of Sampling Adequacy.
.909
Bartlett's Test of Sphericity Approx. Chi-Square
2692.559
df 78 Sig. .000
The analysis yielded three independent factors explaining 70.259% of the
variance for the entire set of variables. Factor 1 was labeled people service due to high
loadings by the following items: satisfaction with how insurance company quickly
responded to calls and questions; satisfaction with contacts at insurance company;
courtesy of people you may have dealt with at insurance company; and ease of doing
business with the insurance company. The first factor explained 26.016% of the

24
variance. Factor 2 was labeled claims service due to high loadings on the following
items: satisfaction with how quickly claims were settled; satisfaction with fairness of
claim settlements from insurance company; satisfaction with ease of going through claim
process; satisfaction that advice received from insurance company on ways to reduce
problems that might lead to claims; and satisfaction; and confidence that the insurer
would take care of you to your satisfaction if you had a claim. The second factor
explained 23.744% of the variance. Factor 3 was labeled premium/policy due to high
loadings on the following items: satisfaction with explanations to premium costs;
satisfaction with ease of billing; satisfaction with premium payment options; and
satisfaction with speed of policy changes. The third factor explained 20.498% of the
variance.
Another simultaneous forced entry multiple regression was conducted using the
factor scores as the independent variables. Results are shown in table 3.
Table III. Results from likelihood to renew regression with factor scores. Variables Mean Std.
Dev. r Raw
Beta Std. Error
Beta Sig. Tol.
Factor 1 – People service
.1872 .7812 .451 1.303 .162 .451 .000* .995
Factor 2 – Claims service
.0647 .8572 .290 .706 .148 .268 .000* .996
Factor 3 – Premium/policy
.1346 .8257 .437 1.246 .153 .456 .000* .999
R2 Adjusted R2 F-Value Sig.
.480
.471 51.102 .000
With the factor scores, the multiple regression results show a significant overall
prediction of the likelihood of the respondents to renew their policy with the insurer, with
48.0 percent of the variance explained by the predictors. All the predictors are correlated
with the dependent variable at the .05 level and have significant beta values.

25
Substantively, the model is shown to be significant. Therefore, satisfaction in the
identified service standards can be used to predict a current customer’s likelihood to
renew with the insurer. When looking at the significant unique contributors influencing
their likelihood to renew with the insurer, factor 3 (premium/policy) had the greatest
influence, followed closely by factor 1 (people service) and factor 1 (claims service).
In order to investigate the impact of the FOCUS program model on the likelihood
to renew, additional regressions were conducted with respondents divided as customers
of high value agents (FOCUS levels Platinum and Gold; n = 114) and customers of low
value agents (FOCUS levels 3 and 4; n = 43). Respondents not assigned to a FOCUS
agent were removed from the analysis. Different from the previous regression, the
independent variables consisted of variables under control of the agent were examined
(i.e., variables controlled by the insurer were left out). The variables measured included:
• Satisfaction with the insurance agent.
• Satisfaction with how quickly the agent responded to calls and questions.
• Satisfaction with the ease in which billing was handled.
• Satisfaction with the speed at which policy changes were incorporated.
• Satisfaction with the way agent helped with claims
• Satisfaction with how quickly claims were settled.
• Satisfaction with the ease of the claims process.
• Satisfaction with the courtesy of people at agent’s place of business.
• Satisfaction with the ease of doing business with agent.
• Satisfaction with explanations of premium costs

26
The multiple regression method was simultaneous forced entry with all independent
variables being entered into to equation model at the same time. Table 4 displays the
results of the regression with customers of high value agents.
Table IV. Results from likelihood to renew regression of satisfaction variables (customers of high-value agents). Variables Mean Std.
Dev. r Raw
Beta Std. Error
Beta Sig. Tol.
Satisfaction with insurance agent
8.79 1.743 .399 .244 .093 .209* .009 .315
Satisfaction with how quickly agent responded to calls and questions
8.73 1.779 .325 -.098 .097 -.086 .314 .277
Satisfaction with ease of billing
8.70 1.619 .434 .259 .070 .207* .000 .640
Satisfaction with the speed policy changes
8.61 1.943 .303 .073 .057 .070 .200 .666
Satisfaction with way agent helped with claims
9.21 1.795 .329 -.111 .083 -.098 .182 .369
Satisfaction with how quickly claims settled
9.09 2.179 .372 .097 .080 .104 .226 .270
Satisfaction the ease of claims process
9.01 2.151 .393 .132 .086 .140 .126 .240
Satisfaction with the courtesy of people at agent’s place of business
9.08 1.528 .325 .090 .109 .068 .411 .297
Satisfaction with ease of doing business with agent
9.06 1.536 .378 .042 .130 .031 .749 .207
Satisfaction with explanations of premium costs
7.80 2.267 .445 .154 .051 .172* .003 .616
R2 Adjusted R2 F-Value Sig.
.338
.319 16.937 .000
The multiple regression results show a significant overall prediction of the likelihood of
the customers of high value agents to renew their policy with the insurer, with 33.8
percent of the variance explained by the predictors. All the predictors are correlated with
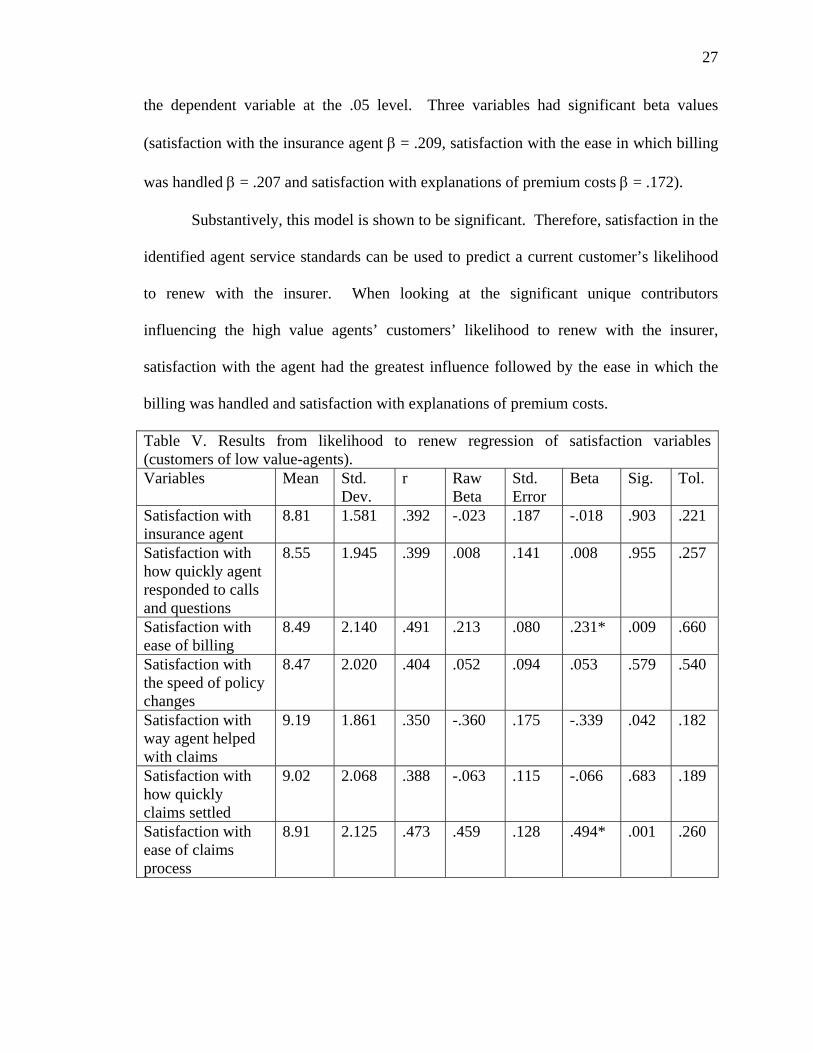
27
the dependent variable at the .05 level. Three variables had significant beta values
(satisfaction with the insurance agent β = .209, satisfaction with the ease in which billing
was handled β = .207 and satisfaction with explanations of premium costs β = .172).
Substantively, this model is shown to be significant. Therefore, satisfaction in the
identified agent service standards can be used to predict a current customer’s likelihood
to renew with the insurer. When looking at the significant unique contributors
influencing the high value agents’ customers’ likelihood to renew with the insurer,
satisfaction with the agent had the greatest influence followed by the ease in which the
billing was handled and satisfaction with explanations of premium costs.
Table V. Results from likelihood to renew regression of satisfaction variables (customers of low value-agents). Variables Mean Std.
Dev. r Raw
Beta Std. Error
Beta Sig. Tol.
Satisfaction with insurance agent
8.81 1.581 .392 -.023 .187 -.018 .903 .221
Satisfaction with how quickly agent responded to calls and questions
8.55 1.945 .399 .008 .141 .008 .955 .257
Satisfaction with ease of billing
8.49 2.140 .491 .213 .080 .231* .009 .660
Satisfaction with the speed of policy changes
8.47 2.020 .404 .052 .094 .053 .579 .540
Satisfaction with way agent helped with claims
9.19 1.861 .350 -.360 .175 -.339 .042 .182
Satisfaction with how quickly claims settled
9.02 2.068 .388 -.063 .115 -.066 .683 .189
Satisfaction with ease of claims process
8.91 2.125 .473 .459 .128 .494* .001 .260

28
Satisfaction with the courtesy of people at agent’s place of business
9.09 1.387 .520 .378 .244 .265 .125 .169
Satisfaction with ease of doing business with agent
8.97 1.551 .427 -.073 .230 -.057 .752 .152
Satisfaction with explanations of premium costs
7.68 2.071 .534 .251 .088 .263* .005 .578
R2 Adjusted R2 F-Value Sig.
.474
.425 9.561 .000
The multiple regression results show a significant overall prediction of the likelihood of
the customers of low value agents to renew their policy with the insurer, with 47.4
percent of the variance explained by the predictors. All the predictors are correlated with
the dependent variable at the .05 level. As in the previous model three variables had
significant beta values (satisfaction with the ease of the claims process β = .494,
satisfaction with explanations of premium costs β = .263 and satisfaction with the ease in
which billing was handled β = .231).
Substantively, this model is shown to be significant. When looking at the
significant unique contributors influencing the low value agents’ customers’ likelihood to
renew with the insurer, satisfaction with the claims process had the most influence
followed by satisfaction with explanations of premium costs and ease in which billing
was handled.

CHAPTER IV.
DISCUSSION
The central aim of this study was to investigate the extent to which variables
identified through previous qualitative research would predict likelihood to renew with
the insurer. While causality is limited in the models, the company’s previous qualitative
research supports the inclusion of the variables as predictors. The results from the
likelihood to renew regression with insurer controlled variables provided evidence for a
positive relationship between satisfaction with the ease in which the billing was handled
and satisfaction with explanations of premiums costs. The observed relationship is
supported by past studies (Morgan & Hunt, 1994; Webster, 1992).
In addition, the results from the analysis on customers of low- and high-value
agents support the impact of the FOCUS program on customers’ likelihood to renew with
the insurer. While ease of billing and explanation of premium costs influenced customers
of both high- and low-value agencies, satisfaction with the agent was a significant
contributor to their likelihood to renew for customers of high-value agencies. These
29
30
findings suggest the customer facing benefits from the FOCUS program positively
influences the customer’s likelihood to renew. It seems that although the customer is
unaware of the high-value agency’s benefits, the customer has a more positive
experience, and in turn, is more satisfied with their agent, leading them to renew.
At the time of research, CRM was not implemented at the company due to past
failed attempts with database marketing. This study gives adequate support to the
usefulness of individualized focus to customers and agents. In the past the company had
attempted database marketing, but had difficulty maintaining an accurate customer
database. Each area of business and independent agencies had its own database of
customer information, but this information was not easily shared with other business
units or with the parent insurance company. One customer could be in several databases
depending on their policies, and there was not one complete customer database with
unique identifiers for each policyholder with all of their demographic and policy
information. Customers would call the insurance company with questions and could be
transferred several times to different areas before having their question resolved. As a
result, customer service satisfaction decreased, and the relationship between the company
and the customer was never developed. Since the company was unable to succeed with
database marketing, it was unable to explore CRM.
Although at the time of this research the company had not implemented CRM,
there are definite stages of the process that can be identified. Key moments of truth have
been identified through the company’s previous qualitative research. All three
regressions analyzed showed the importance of touch point opportunities such as the
explanation of premiums and billing statements. The satisfaction with these moments of
31
truth determines whether the customer will renew or cancel their policy. Additional
moments of truth could also include policy declaration and other times throughout the
year such as the customer’s birthday or during the holiday season.
At the time of research, LTV was not used in the company, so it was not
addressed in this study. However, the company is in the process of compiling a database
to allow the implementation of CRM containing the elements of LTV. In the future, LTV
may be calculated and compiled for customers. Valuable customers will be identified
and profiled and more effort should be directed at these customers. High-value
customers can give insight and feedback, allowing the company to improve its customer
service.
A form of LTV was calculated for the insurer’s independent agencies by the
FOCUS score. As stated earlier, the primary purpose of the FOCUS program is to
segment the agency force by performance determined by retention, growth and loss ratio.
The program’s intent is to encourage positive agent behavior by rewarding high-value
agencies (Platinum and Gold) with additional bonus compensation and more subsidies for
reimbursement for marketing and agent training. Internally within the insurance
company, services and additional resources are given to high-value agencies to help them
provide the best service to their customers. Investing in the high-value agencies
encourages a better customer experience and increased satisfaction with the agent,
resulting in renewals.
Despite the insight of this research there are some limitations. First, since the
insurer did not have an accurate, up-to-date customer database. Phone numbers had to be

32
appended and for some it was impossible to find telephone numbers. Therefore it was
impossible to pull a truly random sample of current policyholders.
Another similar limitation involved the removal of missing data by the research
supplier prior to delivery of the data set to the company. Upon further investigation, it
was determined the missing data was excluded listwise from the analysis. In FOCUS
analysis, customers within the data set lacked a FOCUS level, and as a result, were also
excluded listwise from analysis. This illustrates the necessity of the single customer view
where all information is housed and accessible.
The second limitation was that this is the insurance company’s first wave of
research on customer satisfaction and retention. In a follow up study, it would be
interesting to examine the extent to which respondents with high satisfaction with the
significant variables renewed their policies with the insurer. This could be assessed from
exploring the customer database a year later to see if the respondent did actually renew
their policy. It would also be interesting to examine this research as a benchmark on
service standards. Future waves of this research could identify areas needing
improvement along with areas of high satisfaction.
At the time of this research, the company did not utilize CRM due to
technological limitations. However, this research supports the need for individualized
customer relationships, and the company is currently building an accurate customer
database with the hopes of implementing CRM. The in-depth relationships developed as
a result of CRM will help the company identify and invest in its most valuable customers.
Once implemented, further research will be needed to see if CRM has a positive effect on
customer satisfaction and retention for the company.

33
REFERENCES
Bauer, H. H., Hammerschmidt, M., & Braehler, M. (2003). The customer lifetime value
concept and its contribution to corporate valuation. Yearbook of Marketing and
Consumer Research, 1, 47-67.
Bean, R. (1999, January). Building a foundation for database marketing success.
DM Review, 3, 24-32.
Benn, T. (2004, September 2). Customer relationship management: Take aim. Post
Magazine. 22-26.
Chordas, L. (2002, November 1). The ultimate niche: USAA’s commitment to serving
only people connected to the military. Best’s Review
Dwyer, R., Schurr, P., & Oh, S. (1987). Developing buyer-seller relations. Journal of
Marketing, 51, 11-28.
English, L. (1998, January). The high costs of low quality data. DM Review, 2, 15-18.
Foss, B., & Stone, M. (2002). CRM in financial services: A practical guide to making
customer relationship management work. London, UK: Kogan Page Limited.
Hughes, A. M. (2004). Increasing insurance customer database. Retrieved on November
19, 2004, from Database Marketing Institute web site:
http://www.dbmarketing.com/articles/Art232.htm
Hughes, A. M. (2003). The customer loyalty solution: What works (and what doesn’t) in
customer loyalty programs. New York: McGraw-Hill.
Jackson, D. R. (1992). In quest of the grail: Breaking the barriers to customer valuation.
Direct Marketing, 55, 44-47.

34
McCormick, J.R. (2007). Customer data integration: Overcoming the challenge of
establishing customer identity. Retrieved on September 10, 2007, from Search
Data Management web site:
http://searchdatamanagement.techtarget.com/originalContent/0,289142,sid91_gci
1248336,00.html
Morgan, R. M., & Hunt, S. D., (1994). The commitment-trust theory of relationship
marketing. Journal of Marketing, 58, 20-38.
Mulhern, F. (1999). Customer profitability analysis: Measurement, concentration, and
research directions. Journal of Interactive Marketing, 13, 25-40.
Niraj, R., Gupta, M., & Narasimhan, C. (2001). Customer profitability in a supply chain.
Journal of Marketing, 65, 1-16.
Ragusa, D. (2001). Database marketing overview. Retrieved September 25, 2004, from
American Marketing Association web site:
http://www.marketingpower.com/content1484.php
Reichheld, F. F., & Sasser, E. W., Jr. (1990). Zero defection: Quality comes to service.
Harvard Business Review, 68, 2-8.
Reichheld, F. F., & Teal, T. (1996). The loyalty effect. Boston, MA: Harvard Business
School Press.
Reinartz, W. J., Krafft, M., & Hoyer, W. (2004) The customer relationship management
process: Its Measurement and impact on performance. Journal of Marketing
Research, 41, 293-305.
Reinartz, W. J., & Kumar, V. (2000). On the profitability of long-life customers in a
noncontractual setting: An empirical investigation and implications for marketing.
35
Journal of Marketing, 64, 17-35.
Srivasrava, R., Shervani, T., & Fahey, L. (1998). Marketing-based assets and shareholder
value: A framework for analysis. Journal of Marketing, 62, 2-18.
Webster, F. (1992). The changing role of marketing in the corporation. Journal of
Marketing, 56, 1-17.
Zeithaml, V., Rust, R., & Lemon, K. (2001). The customer pyramid: Creating and serving
Profitable customers. California Management Review, 43, 118-142.

36
APPENDIX

37
PERSONAL CURRENT CUSTOMER QUESTIONNAIRE
Hello. My name is __________ and I’m calling from XX on behalf of XX Insurance. Our records indicate you have insurance with XX. A. Is that correct? a. ___ Yes, have personal b. ___ No (THANK AND TERMINATE) I’m calling to ask a few questions that will insure XX evolves in a way to best meet your needs. I have a short set of research questions to ask. This is NOT a sales call, and I will not be trying to sell you anything. Is this a good time to talk? B. Are you your household’s primary decision maker for insurance related
determinations?
a. Yes b. No (Ask to speak with the primary decision maker or schedule a time to speak
with this individual. Record this individuals name for future contact). C. Do you or any of your immediate family work in marketing research, public relations, advertising, or insurance?
a. ___ Yes (Thank the respondent and terminate interview) b. ___ No
38
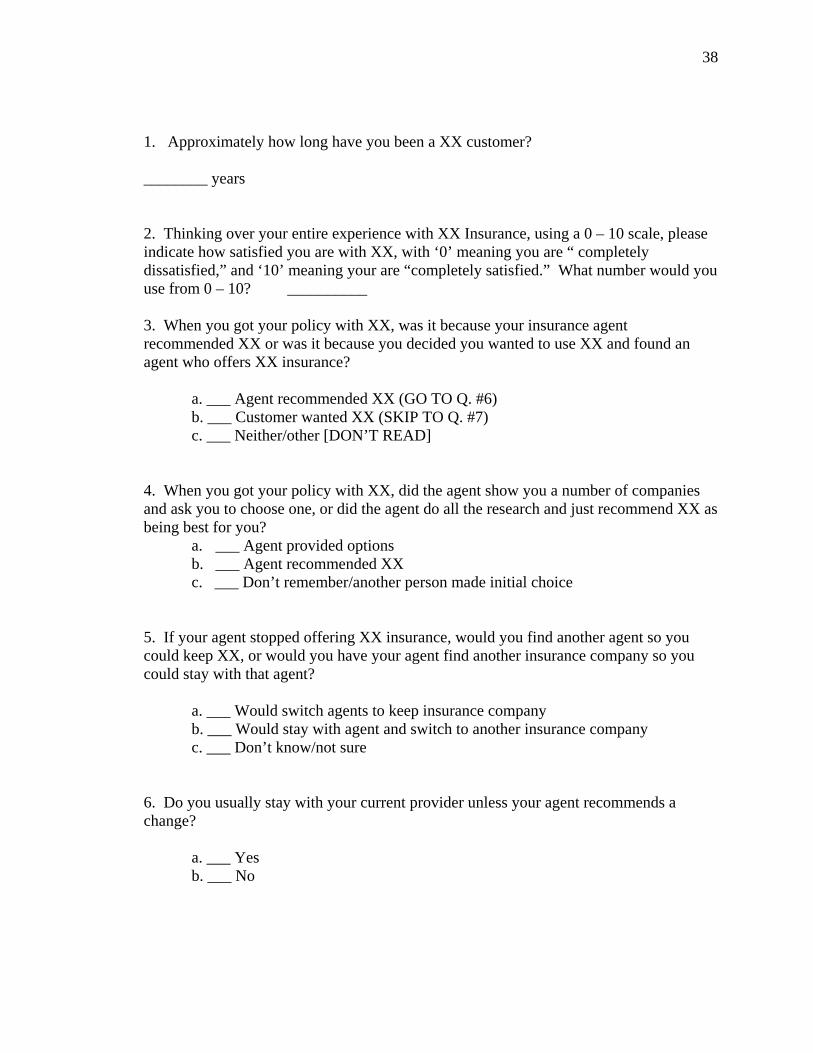
1. Approximately how long have you been a XX customer? ________ years
2. Thinking over your entire experience with XX Insurance, using a 0 – 10 scale, please indicate how satisfied you are with XX, with ‘0’ meaning you are “ completely dissatisfied,” and ‘10’ meaning your are “completely satisfied.” What number would you use from 0 – 10? __________ 3. When you got your policy with XX, was it because your insurance agent recommended XX or was it because you decided you wanted to use XX and found an agent who offers XX insurance? a. ___ Agent recommended XX (GO TO Q. #6) b. ___ Customer wanted XX (SKIP TO Q. #7) c. ___ Neither/other [DON’T READ] 4. When you got your policy with XX, did the agent show you a number of companies and ask you to choose one, or did the agent do all the research and just recommend XX as being best for you?
a. ___ Agent provided options b. ___ Agent recommended XX c. ___ Don’t remember/another person made initial choice 5. If your agent stopped offering XX insurance, would you find another agent so you could keep XX, or would you have your agent find another insurance company so you could stay with that agent? a. ___ Would switch agents to keep insurance company b. ___ Would stay with agent and switch to another insurance company c. ___ Don’t know/not sure 6. Do you usually stay with your current provider unless your agent recommends a change? a. ___ Yes b. ___ No
39
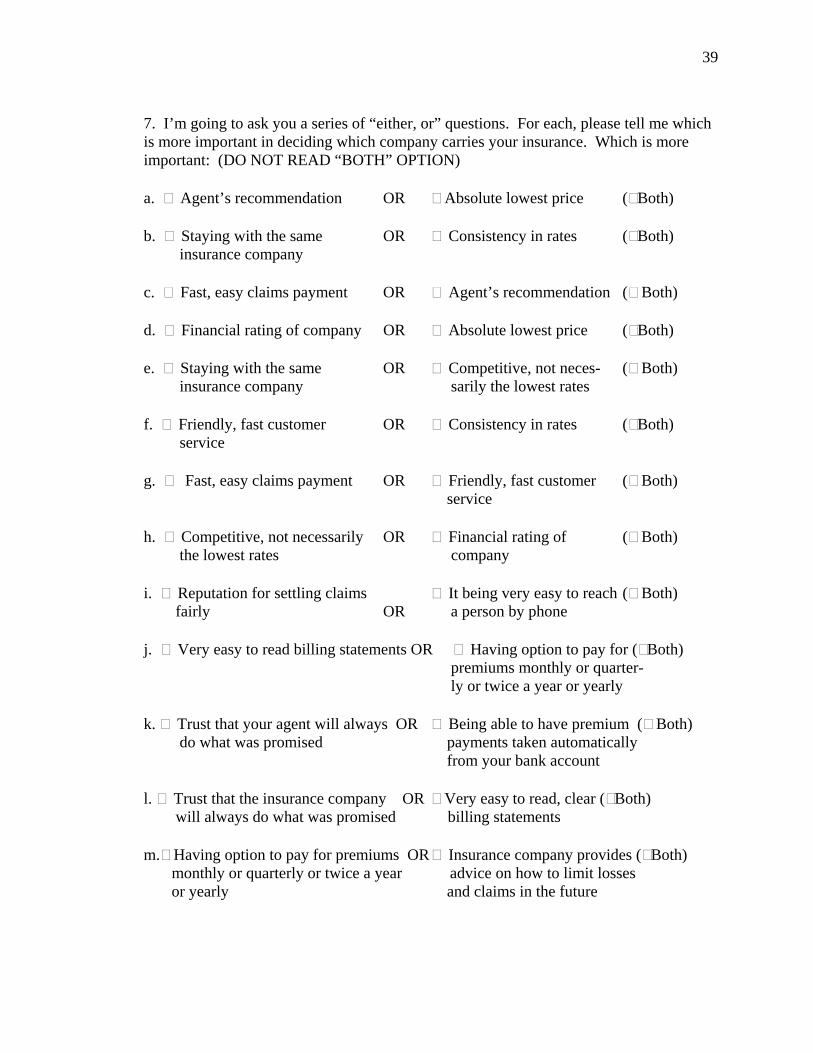
7. I’m going to ask you a series of “either, or” questions. For each, please tell me which is more important in deciding which company carries your insurance. Which is more important: (DO NOT READ “BOTH” OPTION) a. Agent’s recommendation OR Absolute lowest price ( Both) b. Staying with the same OR Consistency in rates ( Both) insurance company c. Fast, easy claims payment OR Agent’s recommendation ( Both) d. Financial rating of company OR Absolute lowest price ( Both) e. Staying with the same OR Competitive, not neces- ( Both)
insurance company sarily the lowest rates
f. Friendly, fast customer OR Consistency in rates ( Both) service g. Fast, easy claims payment OR Friendly, fast customer ( Both) service h. Competitive, not necessarily OR Financial rating of ( Both) the lowest rates company i. Reputation for settling claims It being very easy to reach ( Both) fairly OR a person by phone j. Very easy to read billing statements OR Having option to pay for ( Both)
premiums monthly or quarter- ly or twice a year or yearly
k. Trust that your agent will always OR Being able to have premium ( Both) do what was promised payments taken automatically from your bank account l. Trust that the insurance company OR Very easy to read, clear ( Both) will always do what was promised billing statements m. Having option to pay for premiums OR Insurance company provides ( Both) monthly or quarterly or twice a year advice on how to limit losses or yearly and claims in the future
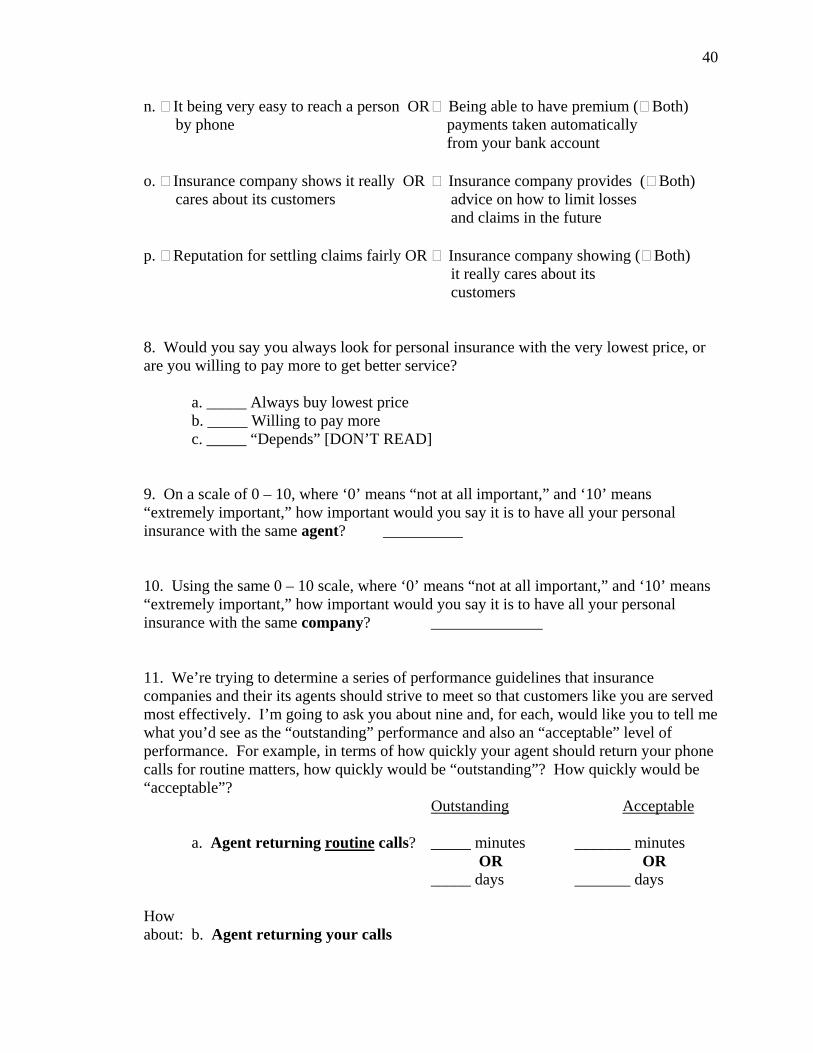
40
n. It being very easy to reach a person OR Being able to have premium ( Both) by phone payments taken automatically from your bank account o. Insurance company shows it really OR Insurance company provides ( Both) cares about its customers advice on how to limit losses and claims in the future p. Reputation for settling claims fairly OR Insurance company showing ( Both) it really cares about its
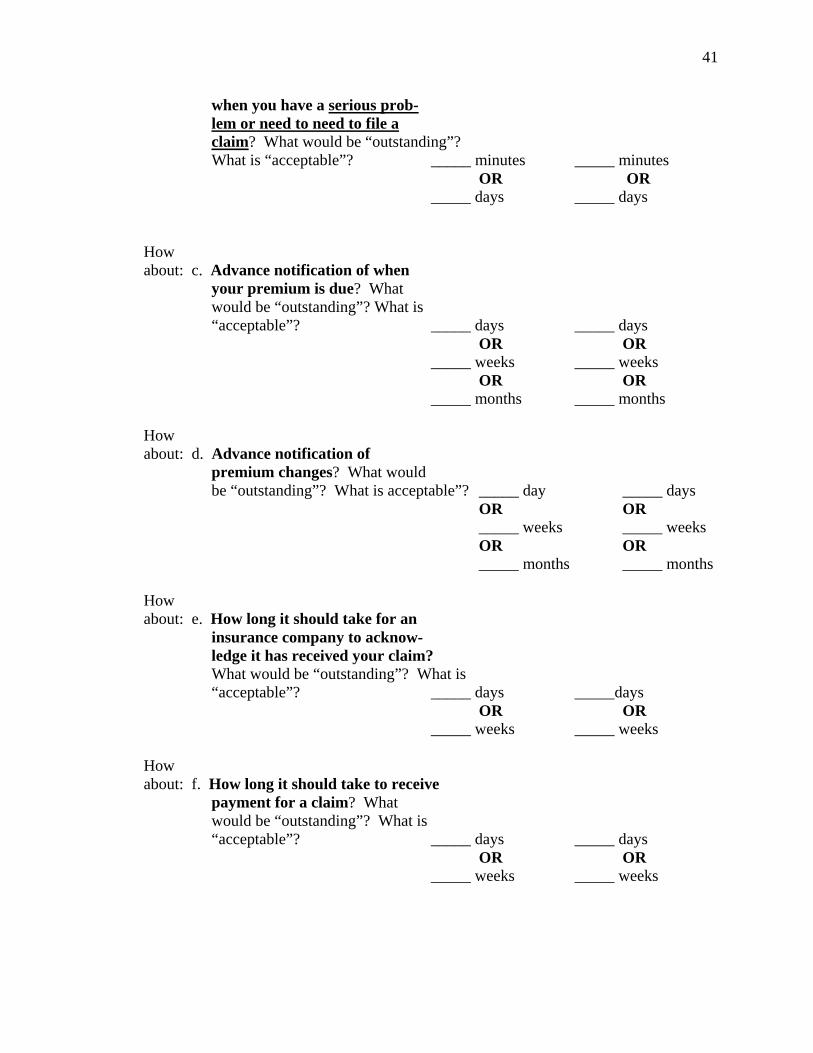
customers 8. Would you say you always look for personal insurance with the very lowest price, or are you willing to pay more to get better service? a. _____ Always buy lowest price b. _____ Willing to pay more c. _____ “Depends” [DON’T READ] 9. On a scale of 0 – 10, where ‘0’ means “not at all important,” and ‘10’ means “extremely important,” how important would you say it is to have all your personal insurance with the same agent? __________ 10. Using the same 0 – 10 scale, where ‘0’ means “not at all important,” and ‘10’ means “extremely important,” how important would you say it is to have all your personal insurance with the same company? ______________ 11. We’re trying to determine a series of performance guidelines that insurance companies and their its agents should strive to meet so that customers like you are served most effectively. I’m going to ask you about nine and, for each, would like you to tell me what you’d see as the “outstanding” performance and also an “acceptable” level of performance. For example, in terms of how quickly your agent should return your phone calls for routine matters, how quickly would be “outstanding”? How quickly would be “acceptable”? Outstanding Acceptable a. Agent returning routine calls? _____ minutes _______ minutes OR OR _____ days _______ days How about: b. Agent returning your calls
41
when you have a serious prob- lem or need to need to file a
claim? What would be “outstanding”? What is “acceptable”? _____ minutes _____ minutes
OR OR _____ days _____ days How about: c. Advance notification of when your premium is due? What would be “outstanding”? What is “acceptable”? _____ days _____ days OR OR _____ weeks _____ weeks OR OR _____ months _____ months How about: d. Advance notification of premium changes? What would be “outstanding”? What is acceptable”? _____ day _____ days OR OR _____ weeks _____ weeks OR OR _____ months _____ months How about: e. How long it should take for an insurance company to acknow- ledge it has received your claim?
What would be “outstanding”? What is “acceptable”? _____ days _____days OR OR _____ weeks _____ weeks
How about: f. How long it should take to receive payment for a claim? What would be “outstanding”? What is “acceptable”? _____ days _____ days OR OR _____ weeks _____ weeks

42
How about: g. How long it should take to reach a person at the insurance company when you call? What would be “outstanding”? What is “acceptable”? _____ rings ____ rings OR OR _____ seconds _____ seconds OR OR _____ minutes _____ minutes How about: h. How long it should take for changes you request in coverage to take effect? What would be
“outstanding”? What is “acceptable?” _____ days _____ days OR OR _____ weeks _____ weeks OR OR _____ immediately _____ immediately 12. Have you ever contacted XX Insurance directly, or have you only dealt with your agent? a. _____ Have contacted XX Insurance (GO TO Q. #17)
b. _____ Only dealt with agent (SKIP TO Q. #18) 13. Using the 0 – 10 scale, with ‘0’ meaning you are “ completely dissatisfied,” and ‘10’ meaning your are “completely satisfied,” what number would you use to indicate your level of satisfaction with the contacts you have had with XX? _________ 14. Using the same 0 – 10 scale, with ‘0’ meaning you are “ completely dissatisfied,” and ‘10’ meaning your are “completely satisfied,” what number would you use to indicate your level of satisfaction with: a. The insurance agent who offers you XX insurance? ______ b. How quickly the agent responds to your calls and questions? ______
c. How quickly XX responds to your calls and questions? ______ d. The ease with which billing is handled? ______ e. The speed at which policy changes are incorporated? ______
43
f. The way your agent has helped with claims—if you’ve had
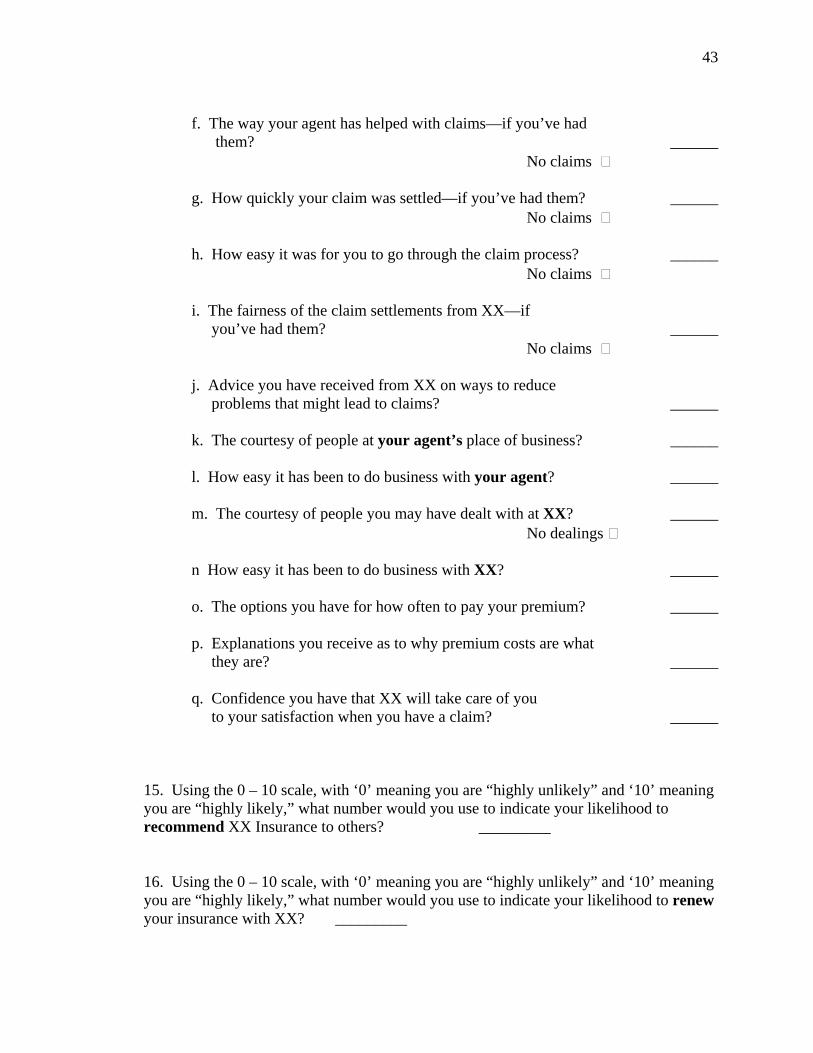
them? ______ No claims g. How quickly your claim was settled—if you’ve had them? ______ No claims h. How easy it was for you to go through the claim process? ______ No claims i. The fairness of the claim settlements from XX—if you’ve had them? ______ No claims j. Advice you have received from XX on ways to reduce problems that might lead to claims? ______ k. The courtesy of people at your agent’s place of business? ______ l. How easy it has been to do business with your agent? ______ m. The courtesy of people you may have dealt with at XX? ______ No dealings
n How easy it has been to do business with XX? ______ o. The options you have for how often to pay your premium? ______ p. Explanations you receive as to why premium costs are what they are? ______ q. Confidence you have that XX will take care of you to your satisfaction when you have a claim? ______
15. Using the 0 – 10 scale, with ‘0’ meaning you are “highly unlikely” and ‘10’ meaning you are “highly likely,” what number would you use to indicate your likelihood to recommend XX Insurance to others? _________
16. Using the 0 – 10 scale, with ‘0’ meaning you are “highly unlikely” and ‘10’ meaning you are “highly likely,” what number would you use to indicate your likelihood to renew your insurance with XX? _________

44
17. May we have your permission to release your name along with your specific responses to XX management? a. ____ Yes b. ____ No--"We will keep your identity confidential." 18. Gender (guess) a. ____ Female b. ____ Male
THANK YOU VERY MUCH FOR HELPING US LEARN HOW TO BEST SERVE YOU!!
Related Documents