This article appeared in a journal published by Elsevier. The attached copy is furnished to the author for internal non-commercial research and education use, including for instruction at the authors institution and sharing with colleagues. Other uses, including reproduction and distribution, or selling or licensing copies, or posting to personal, institutional or third party websites are prohibited. In most cases authors are permitted to post their version of the article (e.g. in Word or Tex form) to their personal website or institutional repository. Authors requiring further information regarding Elsevier’s archiving and manuscript policies are encouraged to visit: http://www.elsevier.com/copyright

Welcome message from author
This document is posted to help you gain knowledge. Please leave a comment to let me know what you think about it! Share it to your friends and learn new things together.
Transcript
This article appeared in a journal published by Elsevier. The attachedcopy is furnished to the author for internal non-commercial researchand education use, including for instruction at the authors institution
and sharing with colleagues.
Other uses, including reproduction and distribution, or selling orlicensing copies, or posting to personal, institutional or third party
websites are prohibited.
In most cases authors are permitted to post their version of thearticle (e.g. in Word or Tex form) to their personal website orinstitutional repository. Authors requiring further information
regarding Elsevier’s archiving and manuscript policies areencouraged to visit:
http://www.elsevier.com/copyright
Author's personal copy
Urban Forestry & Urban Greening 8 (2009) 117–128
The influence of bird information, attitudes, and demographics on public
preferences toward urban green spaces: The case of Montpellier, France
S. Caulaa,�, G.T. Hvenegaarda,b, P. Martya,c
aCentre d’Ecologie Fonctionnelle et Evolutive UMR 5175 – CNRS, 1919 Route de Mende, 34293 Montpellier Cedex, FrancebUniversity of Alberta, Augustana Campus, 4901-46 Avenue, Camrose, Alberta, Canada T4V 2R3cCentre Francais de Recherche en Sciences Sociales, USR 3138 CNRS-MAEE, Prague, Czech Republic
Abstract
Urban sprawl is a major driving force of land use change. To develop strategies for sustainable urban development,planners need suitable indicators, one of which is the quality and quantity of green spaces in a city. To implementconservation strategies for urban areas, an assessment of how people perceive green spaces is required. The aim of thispaper is to analyze: (1) willingness to contribute financially to two types of urban green spaces, (2) how people’sattitudinal and socio-economic characteristics affect this willingness, and (3) to what extent this willingness is affectedby the information that green spaces are important for avifauna conservation. We found that 72% of the respondentsin Montpellier, France preferred natural (versus ornamental) green spaces and wanted them to be increased in the city.To achieve this, 52% of the respondents were willing to pay a percentage of their monthly household income. Givinginformation about birds to residents increased their preferences (especially for those having a ‘‘favourable’’ attitude forurban fauna) for ‘‘natural’’ green spaces and increased willingness to pay for green spaces among people using greenspaces at least monthly. For people less concerned about nature, there was no such effect of providing bird informationon preferences for green spaces.r 2008 Elsevier GmbH. All rights reserved.
Keywords: Avifauna; Public evaluation; Resident preferences; Urban green spaces
Introduction
By 2030, more than 60% (4.98 billion) of theestimated world population (8.27 billion) will live incities (United Nations Population Division, 2001). InEurope, urban areas account for 25% of land cover and70% of the human population (European EnvironmentAgency, 2006). Given that urban areas have extraordi-narily large and complex ecological footprints, withconsiderable direct and indirect effects on surrounding
natural ecosystems (Alberti et al., 2003), local strategiesfor sustainable urban development have become im-portant for global sustainability. Huang et al. (1998,p. 23) define a sustainable city as an ‘‘ecopolis rich innatural resources and biodiversity, safe, healthy andliveable, and with high economic vitality and efficiencyof energy use’’. These concepts correspond to threedimensions – social, economic, and ecological – whichmust be combined to ensure a sustainable future.
To manage progress towards sustainable urbandevelopment, it is essential to develop suitable indica-tors, one of which is the quality and quantity of greenspaces and related elements in the city (Huang et al.,1998; Schauman and Salisburry, 1998; Chiesura, 2004).
ARTICLE IN PRESS
www.elsevier.de/ufug
1618-8667/$ - see front matter r 2008 Elsevier GmbH. All rights reserved.
doi:10.1016/j.ufug.2008.12.004
�Corresponding author.
E-mail addresses: [email protected],
[email protected] (S. Caula).
Author's personal copy
We define green spaces as pieces of vegetated landwithin or adjoining an urban area, including parks,gardens, natural or semi-natural areas, green corridors,and other functional green areas (Scottish Greenspace,2008). Green spaces provide numerous physical, psy-chological, and recreational benefits (Attwell, 2000;Eliasson, 2000; Millard, 2000; Gomez et al., 2001).Residents appreciate their existence in a neighbourhood,and this is reflected in higher property prices (Tyrvainen,1997; Tyrvainen and Miettinen, 2000). Urban greenspaces have intrinsic ecological value; they often have avariety of habitat types, which allows for high speciesdiversity, including rare and threatened species (Caulaet al., 2003; Caula, 2007; Chace and Walsh, 2006).However, high human density in cities and theconsequent social needs for spaces for recreation,building and transportation, for example, make urbannature conservation difficult.
Fernandez-Juricic and Jokimaki (2001) point out thatthe public’s involvement in environmental issues shouldbe used as a great resource to tackle conservationproblems. Urban landscape problems could be viewedas a considerable opportunity to increase the public’sparticipation in the conservation of urban wildlife andnatural habitats (Savard et al., 2000). For example,seeking to improve and integrate existing urbanenvironmental policies, the European Union (Europa,2008), in consultation with experts and citizens, aims toincrease quality of life in cities and to implementsustainable urban development through its 6th Environ-ment Action Programme.
The European Union’s Thematic Urban Strategy(Europa, 2008) encourages an integrative approach tolandscape planning that considers social, economic, andenvironmental issues. Regarding urban green spaces,this strategy focuses on reducing urban sprawl and lossof natural habitats as well as raising citizens’ awarenessof these issues. This urban policy can be strengthened bylocal stakeholders’ initiatives. Although still not ratifiedby all the European Union member states, the LisbonTreaty (Europa, 2007), through its Citizens’ Initiative,allows citizens to bring forward policy proposals to theEuropean Commission. One could imagine that citizensor civil society organisations could promote initiativesfor the management of urban green spaces.
The main purpose of a conservation strategy forurban green spaces should be to restore the link betweenpeople and nature which would offer urban people morepossibilities to learn about their immediate naturalenvironment. Such endeavours would certainly benefithuman well-being and wildlife conservation (Fernandez-Juricic and Jokimaki, 2001). It would involve assessinghow people perceive those urban natural green spacesand the surrounding wildlife.
Regarding the ecological value of urban green, moststudies on urban wildlife have focused on birds
(Marzluff, 2001; Chace and Walsh, 2006), as birds havecharacteristics that make them good biodiversity in-dicators; they have a stable taxonomy, are subject tostandardized techniques for survey and sampling, andhave high popularity among the public (Clergeau et al.,2001; Vuorisalo et al., 2001). Since studies on birdcommunities are available for more and more cities (seeKelcey and Rheinwald, 2000; Marzluff, 2001; Chace andWalsh, 2006), we used baseline ecological informationon birds to find out whether people’s opinions onnatural urban green spaces changed when we gave theminformation about the importance of these areas forwildlife conservation (Caula et al., 2008).
Thus, this paper aims to explore people’s preferencestoward natural urban green spaces and to determinehow those preferences are influenced by attitudes, socio-economic factors, and knowledge about the capacity ofgreen spaces to sustain urban avifauna. In this paper wewant to address the following questions: (1) What isresidents’ willingness to contribute financially to twotypes of projects for urban green spaces? (2) How dopeople’s attitudes and socio-economic characteristicsaffect this willingness? (3) Is this willingness affected bythe knowledge that natural green spaces are importantfor bird conservation?
Method
Study area
Our study site is the city of Montpellier (population244,500) in southern France (431400N, 31500E). Thischoice is relevant for our objectives because it is locatedin the Mediterranean basin which is one of the 25 globalbiodiversity hotspots (Myers et al., 2000). Furthermore,Montpellier has one of the fastest urban growth rates inFrance, at 1.88%/year between 1990 and 1999 (Groupe-ment de la Statistique Publique, 2003). Montpelliercovers about 5700 ha, of which 741 ha are public greenspaces. Montpellier has an average of 33m2 of urbangreen space/inhabitant, compared to 20m2 for all ofFrance, 17m2 for Spain, and 15m2 for Italy (Stannersand Bordeaux, 1995). The combination of high biodi-versity value and rapid urban development makesMontpellier an appropriate study area for a socio-ecological evaluation of public green spaces. In Mon-tpellier, green spaces consist of natural habitats, publicparks and squares, public and private gardens, woodedareas, tree-lined streets and tramways, cultivated areas,and green areas surrounding public or industrialbuildings, shopping malls, sports facilities, and ceme-teries. The following ten species represent 82% of thetree cover in the city: Platanus hybrida Brot. (36%),Pinus pinea L. (10%), Celtis australis L. (9%), Arecaceae
ARTICLE IN PRESSS. Caula et al. / Urban Forestry & Urban Greening 8 (2009) 117–128118
Author's personal copy
(Palmacea) (7%), Sophora japonica L. (6%), Melia
azedarach L. (4%), Robinia pseudoacacia L. (3%),Quercus ilex ilex L. (2%), Acer negundo L. (2%), andMorus kagayamae Koidz. (2%) (Bourgery, 1996). Mostof these species are exotic ornamentals.
There is a growing knowledge of communities in theurban Montpellier landscape (Caula, 2007; Caula et al.,2008). Sixty-one bird species have been recorded inMontpellier and can be clustered into three groups: (1)species characteristic of areas with a high proportion ofbuildings, such as Columba livia Gmelin, Passer
domesticus L., Larus cachinnans Pallas, and Phoenicurus
ochruros Gmelin; (2) species associated with a mixture ofbuildings and gardens, such as Sylvia melanocephala
Gmelin, Sylvia atricapilla L., Parus major L., Parus aterL., Carduelis carduelis L., Phoenicurus phoenicurus L.,and Phylloscopus trochilus L.; and (3) species typical ofgreen spaces embedded in the urban matrix: Alectoris
rufa L., Falco tinnunculus L., and Corvus monedula L.were closely associated with urban farmland areas, andErithacus rubecula L., Fringilla coelebs L., Turdus merula
L., Garrulus glandarius L., and Luscinia megarhynchos
Brehm were abundant in woodlands.
Questionnaire design
Our aim was to explore the contribution of attitudes,socio-economic factors, and information on urban birdconservation toward preferences and willingness tofinancially contribute to green spaces in Montpellier.Researchers have examined the link between publicattitudes, the provision of information, and valuationmeasures (Blamey, 1998); environmental attitudes arecorrelated with willingness to pay (Kotchen and Reiling,2000). On the other hand, public attitudes and will-ingness to pay measured with the contingent valuationmethod (CVM) could be affected by informationprovided in the questionnaire (Raybould, 2005). Whilewe used the CVM (Carson, 2000), and suggesteddifferent amounts of money in order to assess people’swillingness to contribute financially, we did not try toestimate the economic value of this environmental good.In terms of advantages, the CVM is simple, flexible,widely used, and easy to analyze (Venkatachalam,2004). In terms of disadvantages, critics are concernedabout the validity and reliability of CVM results, alongwith impacts of several potential biases and errors(Venkatachalam, 2004).
Our questionnaire included information on the typeand amount of green spaces in Montpellier and allowedrespondents to fill in answers themselves. We draftedtwo versions. In the first, the ‘‘experimental question-naire’’, we provided information on the possiblenegative effects of the loss of urban green spaces on
avifauna; in the second, the ‘‘control questionnaire’’,this information was not included.
The questionnaire comprised three parts. First, weasked attitudinal questions about the importance ofgreen spaces and fauna in Montpellier. Variables of thistype have proven to be as strong as socio-economicvariables in explaining the variability of willingness tocontribute financially (Spash et al., 2006). Second, weasked several standard demographic and socio-econom-ic questions. Third, we elicited valuation of two differentscenarios for increasing green spaces in Montpellier. Wegave clear information about the types and percentageof green spaces in Montpellier, followed by twoquestions on whether or not the amount of green spacesin Montpellier should be increased. If the person wishedto increase green spaces in Montpellier, we presentedtwo hypothetical scenarios for increasing: (1) the naturalscenario, with green spaces for leisure, where the naturallandscape is conserved and most of the naturalvegetation remains intact, and (2) the ornamentalscenario, where natural landscape is replaced by a newlandscape that resembles an urban square with bigornamental trees and decorative exotic plant species. Weexplained that financial support was required for 1 year,due to the scarcity of local council funding. Then weasked respondents what they preferred in terms ofproportion of each green space type (five categoriesfrom 100% natural to 100% ornamental, with 25%increments); their willingness to contribute financially(WTCF; dichotomous variable: yes or no); and, in thecase of a positive answer, how many Euros they wouldcontribute for each. We use a multiple-choice format byproviding 10 options, ranging from 1 to 430 EUR/month. We used WTCF to determine a respondents’level of interest in helping to increase green spaces, asopposed to willingness to pay which is more often usedto estimate economic value.
Sampling and survey method
The Montpellier municipality has a network of 27local cultural centers (23 of which were active). These‘‘common houses’’ (locally known as ‘‘Maison pourtous’’) are spatially distributed according to populationdensity. These municipal structures host socio-culturalactivities (e.g., sports, music, and games), which areoften managed by local associations. Since people ofdiverse age, social, and educational backgrounds go tothese centers, they were suitable to obtain a randomsample. A pilot test was conducted in four centers.
From 4 May to 19 June 2006, we left 30 ques-tionnaires (15 control and 15 experimental), in each ofthe 23 active cultural centers and asked the respondentsto leave the completed questionnaire at the receptiondesk. We verified the effectiveness of the randomization
ARTICLE IN PRESSS. Caula et al. / Urban Forestry & Urban Greening 8 (2009) 117–128 119
Author's personal copy
process and the equivalence between the control and theexperimental groups by means of tests on the homo-geneity of categorical data. We used self-responsequestionnaires because they are cheaper and quickerthan conducting in-person interviews. We acknowledgethat a self-response survey has several disadvantages: ittends to include only those individuals who are mostbiased or most interested in replying, the response ratecannot be controlled, and the potential for non-sampling error can be high (e.g., replies forgotten,incomplete questionnaires). Still, they are consideredrelevant for surveying people’s attitudes (Carson, 2000).In addition, this method is convenient for the respon-dent and there are fewer interviewer effects (Azqueta,1994).
Questionnaire returns
We distributed 690 questionnaires, of which 212(30.7%) questionnaires were returned. Of these, 53.3%belonged to the experimental group and 46.7%belonged to the control group. We had 100 fullycompleted questionnaires (44.6%), which was slightlyless than completion percentages in other studies (Pateand Loomis, 1997; Loomis and Ekstrand, 1998;Tyrvainen and Vaananen, 1998).
Most respondents (70%) were female and 45% weresingle. The average household size was 2.5 people and65% of respondents had children in the household. Themean of number of children in the household was 2.06.The mean age of the respondents was 43 years (rangingfrom 18 to 80). When asked about their highest level ofeducation, 24% had a 5-year degree, 12% had aBachelor’s degree, and 20% had a high school diploma.Regarding employment, 46% were employees andworkers, 19% were managers and teachers, and 8%were students. Regarding occupation, 30% were privatesector salaried employees, 20% were public sectoremployees and 23% were retired. The monthly house-hold income for 80% of the respondents was 600–2300EUR and the average income bracket was 1500 EUR/month/household.
For comparison, the 1999 French demographic censusindicates that 54% of Montpellier residents werewomen, 52.3% had children, and the average numberof people/household was 1.9 (INSEE, 2002). Theproportions of residents with various levels of highereducation correspond to the sample. However, thepercentage of residents with little education (certificateof primary studies or no diploma) is higher than in thesample (census 28.0%, sample 9.4%). The age distribu-tion of our sample corresponds to that of Montpellierresidents over 20. The average monthly householdincome for the population of Montpellier is 1136 EUR.
Data analysis
Using multiple logistical regression methods, weanalyzed the possible dependence of WTCF (as adichotomous variable) on (1) the provision of birdinformation and (2) the independent socio-economicand attitudinal variables. We used multiple linearregression methods for other variables, including ‘‘typeof project’’ (PROJECT; consisting of percentages ofnatural or ornamental vegetation and coded as acontinuous variable: 1 (0% natural–100% ornamental),2 (25% natural–75% ornamental), 3 (50% natural–50%ornamental), 4 (75% natural–25% ornamental), 5(100% natural–0% ornamental)), and ‘‘quantity topay’’ (QTP) for the project (regardless of project type).In all cases, we used backward elimination procedures(Zar, 1999). Before running the regressions, we exam-ined the multicollinearity among independent variablesusing the Cramer coefficient. Multicollinearity betweendependent variables was low and the effects on theregression were negligible.
The regression analyses were used only with the aimof detecting the influence of the independent variables(i.e., provision of bird information and socio-economicand attitudinal variables) on the dependent variables(i.e., type of PROJECT preferred, WTCF, and QTP).We developed a contingent matrix showing the relation-ships between the dependent variables and the variablesselected in the regression. We analyzed data using theStatisticas software package (StarSoft, version 7).
Results
Attitudes toward urban nature
Respondents had a favorable attitude towards theexistence of urban green spaces; 96% said that greenspaces are ‘‘important’’ or ‘‘very important’’ forimproving the quality of life in the city and 83% saidthat they use green spaces. The most frequently usedgreen spaces were two natural urban forests: Bois deMontmaur (26% of respondents) and Lac des Garrigues(18%). When asked about perceptions of the quantity ofgreen spaces in Montpellier, 12.2% of respondentsanswered that there were few, 40.5% said that therewas a moderate amount, and 40.5% considered thatthere was a large amount. Air purification wasconsidered the most important benefit provided by thegreen spaces in the city, followed by the possibility ofgoing out for a walk, running, or doing outdoorexercise. Most respondents (68%) said that having thechance to enjoy wild animals in the city was ‘‘impor-tant’’ or ‘‘very important’’. Ninety-three percent of
ARTICLE IN PRESSS. Caula et al. / Urban Forestry & Urban Greening 8 (2009) 117–128120
Author's personal copy
respondents agreed with increasing the amount of greenspaces in Montpellier.
Variables influencing types of green spaces preferred
Of the 208 respondents who expressed an opinionabout the composition of urban green spaces, 30%preferred 100% natural areas, 43% preferred 75%natural–25% ornamental areas, and 25% preferred a50/50 split. Only two respondents preferred 100%ornamental, and only two respondents preferred 25%natural–75% ornamental areas.
The multiple linear regression analysis (Table 1)indicates that ‘‘the perceived quantity of urban greenareas in the city’’ (QGA), ‘‘the possibility of enjoyingwild animals (WFAU)’’, gender (SEX), and the presenceof children at home (CHILDREN) influenced thepreference for either the natural or ornamental project(PROJECT). As far as the attitudinal variables areconcerned, the preferences for a natural project were
higher among respondents who answered that therewere few or moderate amount of green spaces inMontpellier and among respondents who gave moreimportance to wildlife conservation in the city. A higherpercentage of women and people with children preferredthe natural project.
Variables influencing willingness to contribute
financially
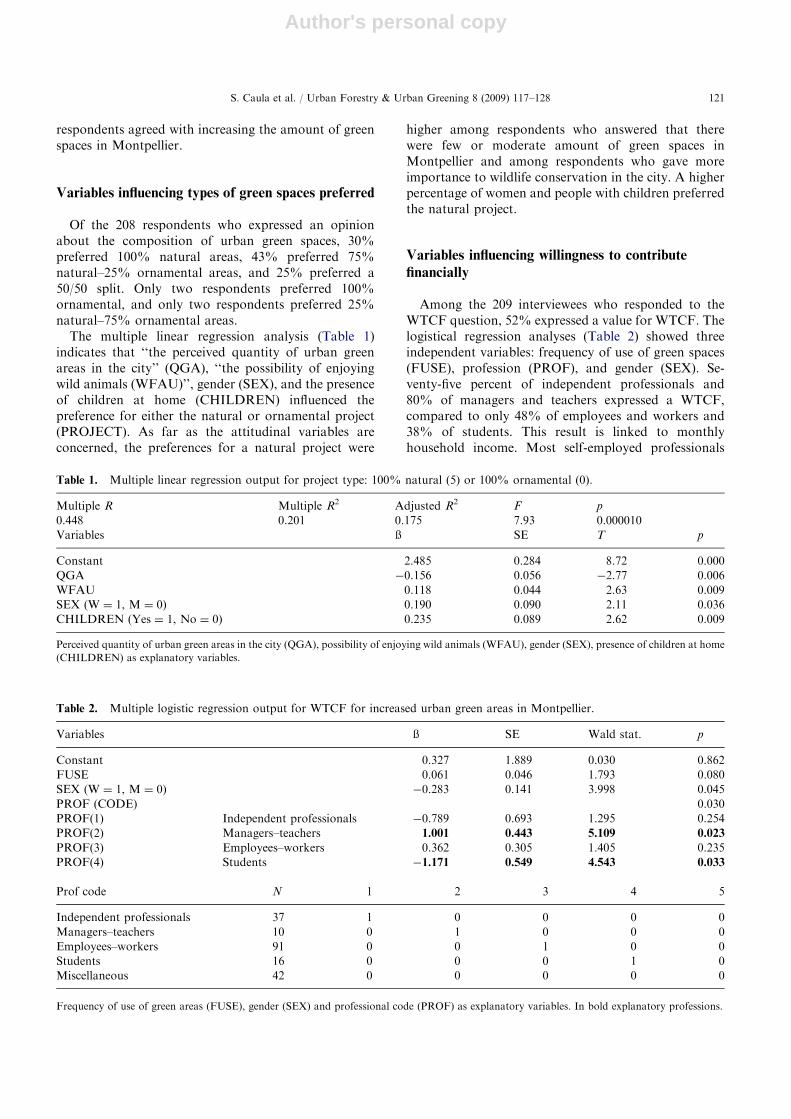
Among the 209 interviewees who responded to theWTCF question, 52% expressed a value for WTCF. Thelogistical regression analyses (Table 2) showed threeindependent variables: frequency of use of green spaces(FUSE), profession (PROF), and gender (SEX). Se-venty-five percent of independent professionals and80% of managers and teachers expressed a WTCF,compared to only 48% of employees and workers and38% of students. This result is linked to monthlyhousehold income. Most self-employed professionals
ARTICLE IN PRESS
Table 1. Multiple linear regression output for project type: 100% natural (5) or 100% ornamental (0).
Multiple R Multiple R2 Adjusted R2 F p
0.448 0.201 0.175 7.93 0.000010
Variables ß SE T p
Constant 2.485 0.284 8.72 0.000
QGA �0.156 0.056 �2.77 0.006
WFAU 0.118 0.044 2.63 0.009
SEX (W ¼ 1, M ¼ 0) 0.190 0.090 2.11 0.036
CHILDREN (Yes ¼ 1, No ¼ 0) 0.235 0.089 2.62 0.009
Perceived quantity of urban green areas in the city (QGA), possibility of enjoying wild animals (WFAU), gender (SEX), presence of children at home
(CHILDREN) as explanatory variables.
Table 2. Multiple logistic regression output for WTCF for increased urban green areas in Montpellier.
Variables ß SE Wald stat. p
Constant 0.327 1.889 0.030 0.862
FUSE 0.061 0.046 1.793 0.080
SEX (W ¼ 1, M ¼ 0) �0.283 0.141 3.998 0.045
PROF (CODE) 0.030
PROF(1) Independent professionals �0.789 0.693 1.295 0.254
PROF(2) Managers–teachers 1.001 0.443 5.109 0.023
PROF(3) Employees–workers 0.362 0.305 1.405 0.235
PROF(4) Students �1.171 0.549 4.543 0.033
Prof code N 1 2 3 4 5
Independent professionals 37 1 0 0 0 0
Managers–teachers 10 0 1 0 0 0
Employees–workers 91 0 0 1 0 0
Students 16 0 0 0 1 0
Miscellaneous 42 0 0 0 0 0
Frequency of use of green areas (FUSE), gender (SEX) and professional code (PROF) as explanatory variables. In bold explanatory professions.
S. Caula et al. / Urban Forestry & Urban Greening 8 (2009) 117–128 121
Author's personal copy
(55%), managers and teachers (86%) have a highermonthly household income (1500–4600 EUR), whereasmost students (86%) and employees and workers (67%)have a lower monthly income (600–1500 EUR).
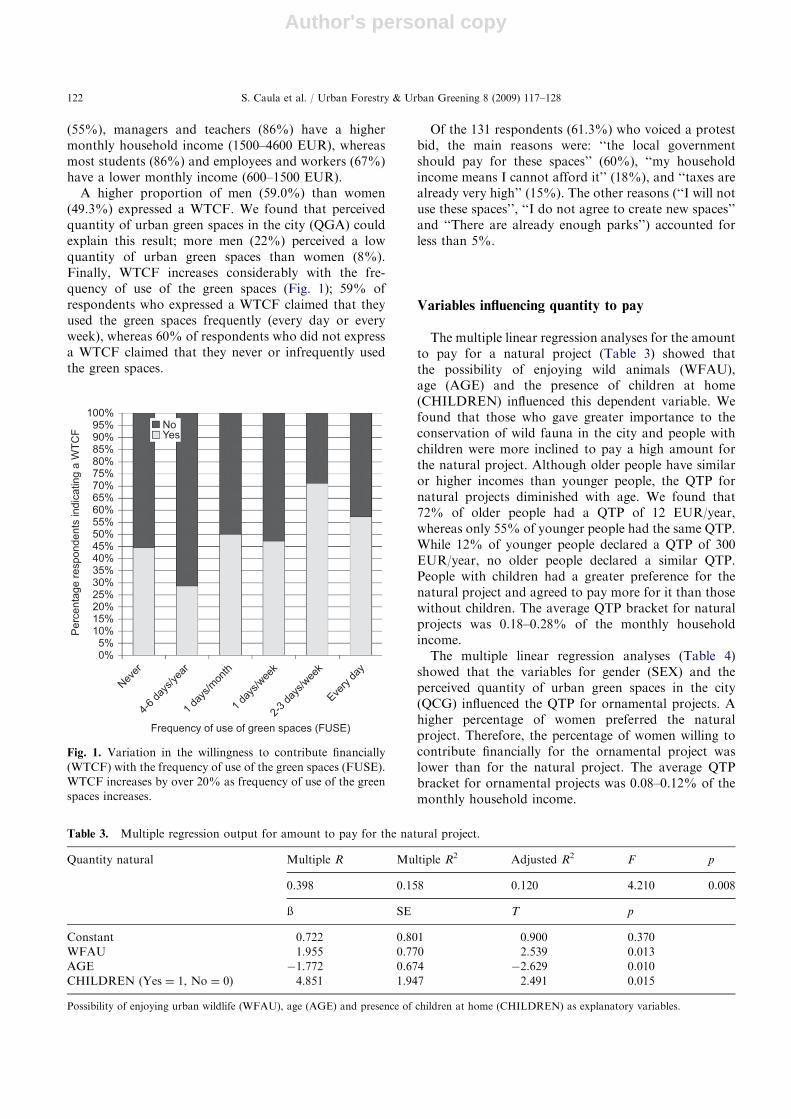
A higher proportion of men (59.0%) than women(49.3%) expressed a WTCF. We found that perceivedquantity of urban green spaces in the city (QGA) couldexplain this result; more men (22%) perceived a lowquantity of urban green spaces than women (8%).Finally, WTCF increases considerably with the fre-quency of use of the green spaces (Fig. 1); 59% ofrespondents who expressed a WTCF claimed that theyused the green spaces frequently (every day or everyweek), whereas 60% of respondents who did not expressa WTCF claimed that they never or infrequently usedthe green spaces.
Of the 131 respondents (61.3%) who voiced a protestbid, the main reasons were: ‘‘the local governmentshould pay for these spaces’’ (60%), ‘‘my householdincome means I cannot afford it’’ (18%), and ‘‘taxes arealready very high’’ (15%). The other reasons (‘‘I will notuse these spaces’’, ‘‘I do not agree to create new spaces’’and ‘‘There are already enough parks’’) accounted forless than 5%.
Variables influencing quantity to pay
The multiple linear regression analyses for the amountto pay for a natural project (Table 3) showed thatthe possibility of enjoying wild animals (WFAU),age (AGE) and the presence of children at home(CHILDREN) influenced this dependent variable. Wefound that those who gave greater importance to theconservation of wild fauna in the city and people withchildren were more inclined to pay a high amount forthe natural project. Although older people have similaror higher incomes than younger people, the QTP fornatural projects diminished with age. We found that72% of older people had a QTP of 12 EUR/year,whereas only 55% of younger people had the same QTP.While 12% of younger people declared a QTP of 300EUR/year, no older people declared a similar QTP.People with children had a greater preference for thenatural project and agreed to pay more for it than thosewithout children. The average QTP bracket for naturalprojects was 0.18–0.28% of the monthly householdincome.
The multiple linear regression analyses (Table 4)showed that the variables for gender (SEX) and theperceived quantity of urban green spaces in the city(QCG) influenced the QTP for ornamental projects. Ahigher percentage of women preferred the naturalproject. Therefore, the percentage of women willing tocontribute financially for the ornamental project waslower than for the natural project. The average QTPbracket for ornamental projects was 0.08–0.12% of themonthly household income.
ARTICLE IN PRESS
100%95%90%85%80%75%70%65%60%55%50%45%40%35%30%25%20%15%10%5%0%
Never
4-6 da
ys/ye
ar
1 day
s/mon
th
1 day
s/wee
k
2-3 da
ys/w
eek
Every
day
Frequency of use of green spaces (FUSE)
Per
cent
age
resp
onde
nts
indi
catin
g a
WTC
F
NoYes
Fig. 1. Variation in the willingness to contribute financially
(WTCF) with the frequency of use of the green spaces (FUSE).
WTCF increases by over 20% as frequency of use of the green
spaces increases.
Table 3. Multiple regression output for amount to pay for the natural project.
Quantity natural Multiple R Multiple R2 Adjusted R2 F p
0.398 0.158 0.120 4.210 0.008
ß SE T p
Constant 0.722 0.801 0.900 0.370
WFAU 1.955 0.770 2.539 0.013
AGE �1.772 0.674 �2.629 0.010
CHILDREN (Yes ¼ 1, No ¼ 0) 4.851 1.947 2.491 0.015
Possibility of enjoying urban wildlife (WFAU), age (AGE) and presence of children at home (CHILDREN) as explanatory variables.
S. Caula et al. / Urban Forestry & Urban Greening 8 (2009) 117–128122
Author's personal copy
The influence of bird information
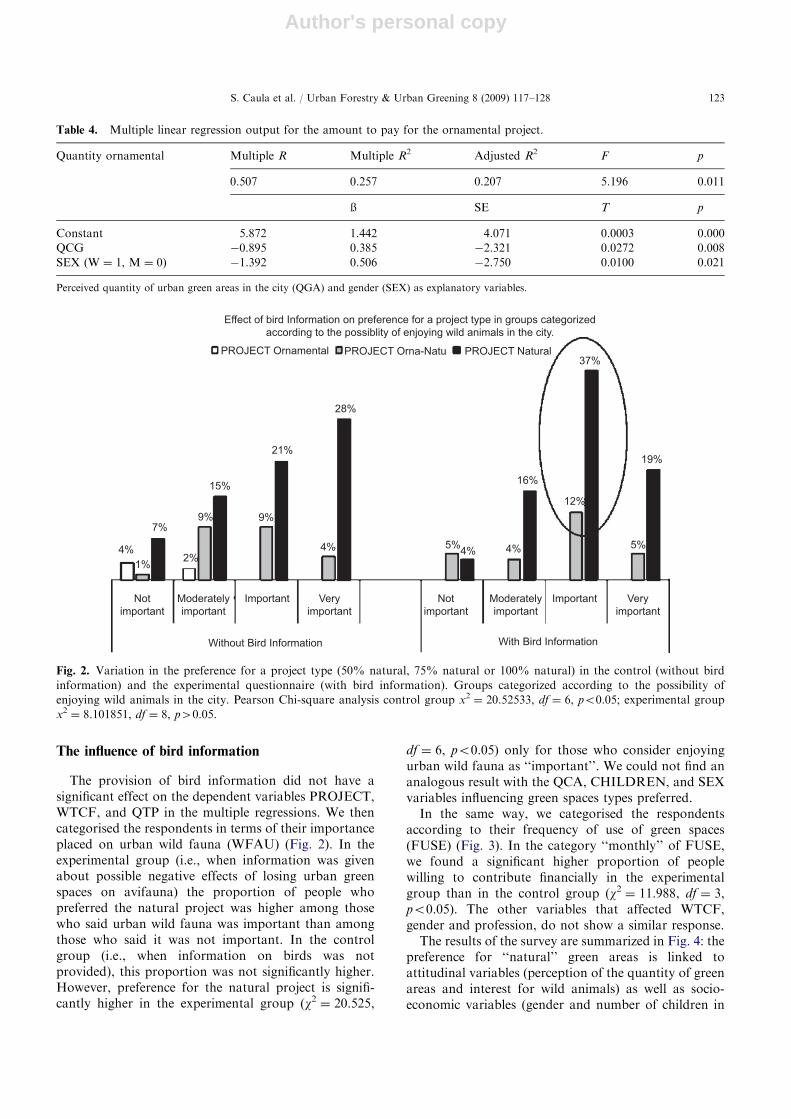
The provision of bird information did not have asignificant effect on the dependent variables PROJECT,WTCF, and QTP in the multiple regressions. We thencategorised the respondents in terms of their importanceplaced on urban wild fauna (WFAU) (Fig. 2). In theexperimental group (i.e., when information was givenabout possible negative effects of losing urban greenspaces on avifauna) the proportion of people whopreferred the natural project was higher among thosewho said urban wild fauna was important than amongthose who said it was not important. In the controlgroup (i.e., when information on birds was notprovided), this proportion was not significantly higher.However, preference for the natural project is signifi-cantly higher in the experimental group (w2 ¼ 20.525,
df ¼ 6, po0.05) only for those who consider enjoyingurban wild fauna as ‘‘important’’. We could not find ananalogous result with the QCA, CHILDREN, and SEXvariables influencing green spaces types preferred.
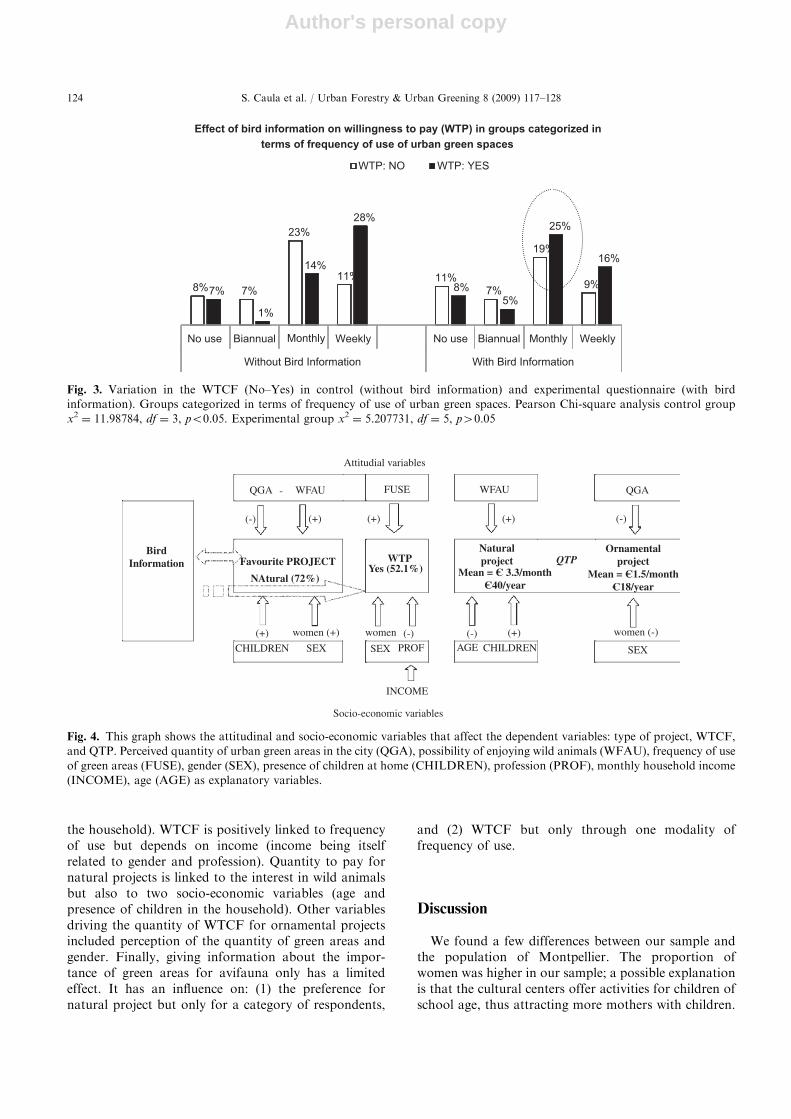
In the same way, we categorised the respondentsaccording to their frequency of use of green spaces(FUSE) (Fig. 3). In the category ‘‘monthly’’ of FUSE,we found a significant higher proportion of peoplewilling to contribute financially in the experimentalgroup than in the control group (w2 ¼ 11.988, df ¼ 3,po0.05). The other variables that affected WTCF,gender and profession, do not show a similar response.
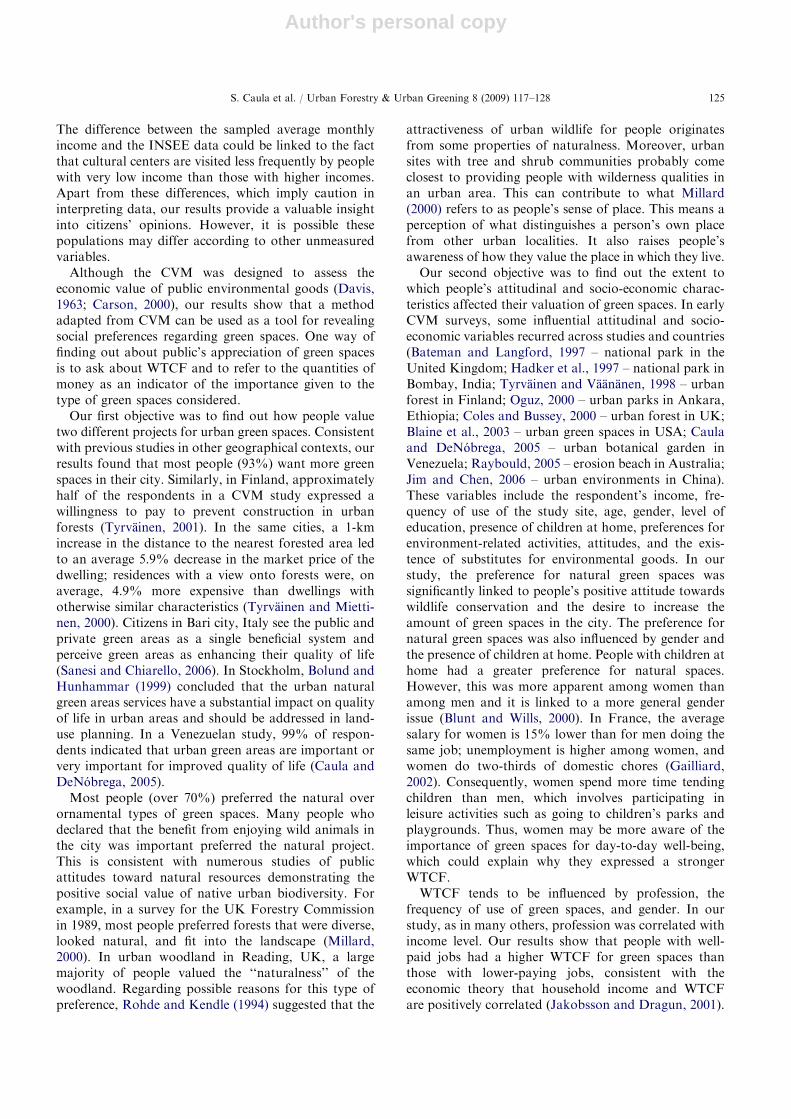
The results of the survey are summarized in Fig. 4: thepreference for ‘‘natural’’ green areas is linked toattitudinal variables (perception of the quantity of greenareas and interest for wild animals) as well as socio-economic variables (gender and number of children in
ARTICLE IN PRESS
Table 4. Multiple linear regression output for the amount to pay for the ornamental project.
Quantity ornamental Multiple R Multiple R2 Adjusted R2 F p
0.507 0.257 0.207 5.196 0.011
ß SE T p
Constant 5.872 1.442 4.071 0.0003 0.000
QCG �0.895 0.385 �2.321 0.0272 0.008
SEX (W ¼ 1, M ¼ 0) �1.392 0.506 �2.750 0.0100 0.021
Perceived quantity of urban green areas in the city (QGA) and gender (SEX) as explanatory variables.
Notimportant
Moderatelyimportant
Important Veryimportant
Notimportant
Moderatelyimportant
Important Veryimportant
With Bird InformationWithout Bird Information
4%1%
7%
2%
9%
15%
9%
21%
4%
28%
5%4% 4%
16%
12%
5%
19%
37%PROJECT Ornamental PROJECT Orna-Natu PROJECT Natural
Effect of bird Information on preference for a project type in groups categorizedaccording to the possiblity of enjoying wild animals in the city.
Fig. 2. Variation in the preference for a project type (50% natural, 75% natural or 100% natural) in the control (without bird
information) and the experimental questionnaire (with bird information). Groups categorized according to the possibility of
enjoying wild animals in the city. Pearson Chi-square analysis control group x2¼ 20.52533, df ¼ 6, po0.05; experimental group
x2¼ 8.101851, df ¼ 8, p40.05.
S. Caula et al. / Urban Forestry & Urban Greening 8 (2009) 117–128 123
Author's personal copy
the household). WTCF is positively linked to frequencyof use but depends on income (income being itselfrelated to gender and profession). Quantity to pay fornatural projects is linked to the interest in wild animalsbut also to two socio-economic variables (age andpresence of children in the household). Other variablesdriving the quantity of WTCF for ornamental projectsincluded perception of the quantity of green areas andgender. Finally, giving information about the impor-tance of green areas for avifauna only has a limitedeffect. It has an influence on: (1) the preference fornatural project but only for a category of respondents,
and (2) WTCF but only through one modality offrequency of use.
Discussion
We found a few differences between our sample andthe population of Montpellier. The proportion ofwomen was higher in our sample; a possible explanationis that the cultural centers offer activities for children ofschool age, thus attracting more mothers with children.
ARTICLE IN PRESS
8% 7%
23%
11% 11%7%
19%
9%7%
1%
14%
28%
8%5%
25%
16%
No use Biannual Monthly Weekly No use Biannual Monthly Weekly
Without Bird Information With Bird Information
Effect of bird information on willingness to pay (WTP) in groups categorized in terms of frequency of use of urban green spaces
WTP: NO WTP: YES
Fig. 3. Variation in the WTCF (No–Yes) in control (without bird information) and experimental questionnaire (with bird
information). Groups categorized in terms of frequency of use of urban green spaces. Pearson Chi-square analysis control group
x2¼ 11.98784, df ¼ 3, po0.05. Experimental group x2
¼ 5.207731, df ¼ 5, p40.05
Attitudial variables
BirdInformation
QGA - WFAU FUSE WFAU QGA
Favourite PROJECT
NAtural (72%)
WTPYes (52.1%)
Naturalproject
Mean = C 3.3/monthC40/year
QTPOrnamental
projectMean = C1.5/month
C18/year
CHILDREN SEX SEX PROF AGE CHILDREN
INCOME
Socio-economic variables
(+) women (+) women (-) (-) (+) women (-)
SEX
(+) (-)(+)(+)(-)
Fig. 4. This graph shows the attitudinal and socio-economic variables that affect the dependent variables: type of project, WTCF,
and QTP. Perceived quantity of urban green areas in the city (QGA), possibility of enjoying wild animals (WFAU), frequency of use
of green areas (FUSE), gender (SEX), presence of children at home (CHILDREN), profession (PROF), monthly household income
(INCOME), age (AGE) as explanatory variables.
S. Caula et al. / Urban Forestry & Urban Greening 8 (2009) 117–128124
Author's personal copy
The difference between the sampled average monthlyincome and the INSEE data could be linked to the factthat cultural centers are visited less frequently by peoplewith very low income than those with higher incomes.Apart from these differences, which imply caution ininterpreting data, our results provide a valuable insightinto citizens’ opinions. However, it is possible thesepopulations may differ according to other unmeasuredvariables.
Although the CVM was designed to assess theeconomic value of public environmental goods (Davis,1963; Carson, 2000), our results show that a methodadapted from CVM can be used as a tool for revealingsocial preferences regarding green spaces. One way offinding out about public’s appreciation of green spacesis to ask about WTCF and to refer to the quantities ofmoney as an indicator of the importance given to thetype of green spaces considered.
Our first objective was to find out how people valuetwo different projects for urban green spaces. Consistentwith previous studies in other geographical contexts, ourresults found that most people (93%) want more greenspaces in their city. Similarly, in Finland, approximatelyhalf of the respondents in a CVM study expressed awillingness to pay to prevent construction in urbanforests (Tyrvainen, 2001). In the same cities, a 1-kmincrease in the distance to the nearest forested area ledto an average 5.9% decrease in the market price of thedwelling; residences with a view onto forests were, onaverage, 4.9% more expensive than dwellings withotherwise similar characteristics (Tyrvainen and Mietti-nen, 2000). Citizens in Bari city, Italy see the public andprivate green areas as a single beneficial system andperceive green areas as enhancing their quality of life(Sanesi and Chiarello, 2006). In Stockholm, Bolund andHunhammar (1999) concluded that the urban naturalgreen areas services have a substantial impact on qualityof life in urban areas and should be addressed in land-use planning. In a Venezuelan study, 99% of respon-dents indicated that urban green areas are important orvery important for improved quality of life (Caula andDeNobrega, 2005).
Most people (over 70%) preferred the natural overornamental types of green spaces. Many people whodeclared that the benefit from enjoying wild animals inthe city was important preferred the natural project.This is consistent with numerous studies of publicattitudes toward natural resources demonstrating thepositive social value of native urban biodiversity. Forexample, in a survey for the UK Forestry Commissionin 1989, most people preferred forests that were diverse,looked natural, and fit into the landscape (Millard,2000). In urban woodland in Reading, UK, a largemajority of people valued the ‘‘naturalness’’ of thewoodland. Regarding possible reasons for this type ofpreference, Rohde and Kendle (1994) suggested that the
attractiveness of urban wildlife for people originatesfrom some properties of naturalness. Moreover, urbansites with tree and shrub communities probably comeclosest to providing people with wilderness qualities inan urban area. This can contribute to what Millard(2000) refers to as people’s sense of place. This means aperception of what distinguishes a person’s own placefrom other urban localities. It also raises people’sawareness of how they value the place in which they live.
Our second objective was to find out the extent towhich people’s attitudinal and socio-economic charac-teristics affected their valuation of green spaces. In earlyCVM surveys, some influential attitudinal and socio-economic variables recurred across studies and countries(Bateman and Langford, 1997 – national park in theUnited Kingdom; Hadker et al., 1997 – national park inBombay, India; Tyrvainen and Vaananen, 1998 – urbanforest in Finland; Oguz, 2000 – urban parks in Ankara,Ethiopia; Coles and Bussey, 2000 – urban forest in UK;Blaine et al., 2003 – urban green spaces in USA; Caulaand DeNobrega, 2005 – urban botanical garden inVenezuela; Raybould, 2005 – erosion beach in Australia;Jim and Chen, 2006 – urban environments in China).These variables include the respondent’s income, fre-quency of use of the study site, age, gender, level ofeducation, presence of children at home, preferences forenvironment-related activities, attitudes, and the exis-tence of substitutes for environmental goods. In ourstudy, the preference for natural green spaces wassignificantly linked to people’s positive attitude towardswildlife conservation and the desire to increase theamount of green spaces in the city. The preference fornatural green spaces was also influenced by gender andthe presence of children at home. People with children athome had a greater preference for natural spaces.However, this was more apparent among women thanamong men and it is linked to a more general genderissue (Blunt and Wills, 2000). In France, the averagesalary for women is 15% lower than for men doing thesame job; unemployment is higher among women, andwomen do two-thirds of domestic chores (Gailliard,2002). Consequently, women spend more time tendingchildren than men, which involves participating inleisure activities such as going to children’s parks andplaygrounds. Thus, women may be more aware of theimportance of green spaces for day-to-day well-being,which could explain why they expressed a strongerWTCF.
WTCF tends to be influenced by profession, thefrequency of use of green spaces, and gender. In ourstudy, as in many others, profession was correlated withincome level. Our results show that people with well-paid jobs had a higher WTCF for green spaces thanthose with lower-paying jobs, consistent with theeconomic theory that household income and WTCFare positively correlated (Jakobsson and Dragun, 2001).
ARTICLE IN PRESSS. Caula et al. / Urban Forestry & Urban Greening 8 (2009) 117–128 125
Author's personal copy
The WTCF was affected by the same variables thatcharacterize the acquisition of a market good (i.e.,demand and available budget). We did not find acorrelation between gender and monthly householdincome.
People’s attitudes toward wildlife conservation andthe presence of children at home influenced thepreference for the natural project, and thus had apositive and significant correlation with the QTP for thenatural project. As in other studies (Pate and Loomis,1997; Loomis and Ekstrand, 1998), we found asignificant negative correlation between age and QTP.
The percentage of people expressing a WTCF wassmaller and the percentage of protest bids was greaterthan was found in other studies (Mitchell and Carlson,1989; Hadker et al., 1997; Tyrvainen and Vaananen,1998; Oguz, 2000; Caula and DeNobrega, 2005).Additionally, the average QTP in proportion to themonthly household income (0.165%) was lower than thevalue found by Hadker et al. (1997; 0.24–0.27% inIndia) and Caula and DeNobrega (2005; 0.46% inVenezuela). Two points may provide some explanation.First, Montpellier, like many other French Mediterra-nean cities, has a landscape pattern with a dense ancientdowntown district and a large area of new low-densityareas with individual houses and gardens. As a result,local inhabitants may be under the impression that theylive in a very green city compared to other cities. Second,despite the fact that Montpellier has one of the mostrapid annual urban growth rates (8–11%; INSEE,2002), it has very few new boroughs with many highbuildings. Its urban growth is largely due to thedevelopment of new sectors with individual houses andgardens, which immediately surround the urban core ofthe old villages on the town’s periphery. This couldexplain why local people do not feel that urban growthmakes the environment too artificial.
Our last objective was to determine whether theinformation on the importance of green spaces for birdconservation could change the WTCF for green spaces.The information about birds increased preference forthe natural project and WTCF only for a certaincategory of people (people with a ‘‘favourable’’ attitudefor urban fauna and people who use green spacesmonthly). Similarly, Jensen (2000) found that providinginformation and explanations (especially those thatemphasize the positive aspects) to forest recreationistsabout management practices increased support for thosepractices. We did not find a correlation between theprovision of bird information and QTP.
Even though giving information on the importance ofbirds in urban habitats can be perceived as a key factorto increase citizens’ environmental awareness, ourresults show that people yet aware of environment arepositively influenced by this information and show ahigher willingness to contribute financially. This sug-
gests that giving information on wildlife and naturalhabitats in the city is not enough for increasing theinterest for natural green spaces for the public. Thechallenge for public bodies and nongovernmentalorganizations dealing with urban nature conservationis to convince those citizens unaware of environmentalissues. Sustainable management of urban areas musttake into account both the necessity to maintain andenhance ecosystem services in the city and citizens’ well-being. Urban green spaces can play an important rolefrom that point of view. As a network of ecologicalhabitats, they can provide resources for urban wildlifeand can provide a variety of desired services to urbanresidents. Our results confirm the interest of citizens formaintaining urban ecosystem services, particularlythrough the existence of natural green spaces in the city.
Decision makers and managers should take advan-tage of this positive attitude. In terms of sustainableurban management, our results show that municipalitiescould, in their green spaces policies, put more emphasison natural urban habitats in a very broad sense. Insteadof designing ornamental new landscaped parks, oneoption could be to take advantage of the remnants ofthe previous non-urban landscape (e.g., vineyards,orchards, overgrown fields or gardens) and their existingvegetation. Those green spaces would provide recrea-tional and biodiversity services and could be managed atlower costs if compared to ornamental parks whereflowering, watering, weeding (sometimes with chemi-cals), pruning, and trimming are time, money andenergy consuming.
Designing new green spaces following those principlescould also be part of municipalities’ strategies toincrease environmental awareness. Our results showedthat only giving basic information on the relationshipsbetween green spaces and bird habitats requirements didnot change attitudes toward public green spaces for allcitizens. Public campaigns that explain, based on actualexamples, the advantages of maintaining a network ofgreen spaces in the city could help increase the public’senvironmental awareness and in doing so, could leadpeople to think as sustainable urban development, notas a top-down injunction, but as a real way to increasequality of life in the city.
Acknowledgements
We thank FUNDAYACUCHO, Venezuela (Contractno. E-211-87-2001-1) for funding this study. Weappreciate the logistical support from the Centred’Ecologie Fonctionnelle et Evolutive in Montpellier,France and the University of Alberta’s AugustanaCampus. We also thank two anonymous reviewers fortheir helpful comments.
ARTICLE IN PRESSS. Caula et al. / Urban Forestry & Urban Greening 8 (2009) 117–128126
Author's personal copy
References
Alberti, M., Marzluff, J.M., Shulenberger, E., Bradley, G.,
Ryan, C., Zumbrunnen, C., 2003. Integrating humans into
ecology: opportunities, challenges for studying urban
ecosystems. Bioscience 53, 1169–1179.
Attwell, K., 2000. Urban land resources and urban planting –
case studies from Denmark. Landscape and Urban Plan-
ning 52, 145–163.
Azqueta, D., 1994. Valoracion Economica de la Calidad
Ambiental. McGraw-Hill, Mexico City, p. 229.
Bateman, I.J., Langford, I.H., 1997. Non-users’ willingness to
pay for a national park: an application and critique of the
contingent valuation method. Regional Studies 31,
571–582.
Blaine, T.W., Lichtkoppler, F.R., Stanbro, R., 2003. An
assessment of residents’ willingness to pay for green space
and farmland preservation conservation easements using
the contingent valuation method (CVM). Journal of
Extension 41 (4) (Retrieved on 1 November 2008 from:
/http://www.joe.org/joe/2003august/a3.shtmlS).
Blamey, R.K., 1998. Decisiveness, attitude expression and
symbolic responses in contingent valuation surveys. Journal
of Economic Behavior & Organization 34, 577–601.
Blunt, A., Wills, J., 2000. Dissident Geographies: An
Introduction to Radical Ideas and Practice. Pearson
Education, Harlow, pp. 90–127.
Bolund, P., Hunhammar, S., 1999. Ecosystem services in
urban areas. Ecological Economics 29, 293–301.
Bourgery, C., 1996. La charte de l’arbre pour Montpellier.
Direction Paysage et Nature, Ville de Montpellier et le
centre de formation professionnelle forestiere de Chateau-
neuf du Rhone, Montpellier.
Carson, R.T., 2000. Contingent valuation: a user’s guide.
Environmental Science and Technology 34, 1413–1418.
Caula, S., 2007. L’usage de l’avifaune comme indicateur
ecologique et socio-economique dans l’espace urbain. Thesede doctorat, Universite de Montpellier II, France. Re-
trieved on 1 November, 2008 from: /http://www.
cefe.cnrs.fr/ecopop/anciens/Sabina_Caula.htmS.
Caula, S., DeNobrega, R., 2005. The contingent valuation of
two projects for the development of the botanical garden of
Valencia: effects of bird diversity and of socioeconomic and
behavioral factors. Revista Faces de la Facultad de
Ciencias economicas y Sociales 16 (27). Retrieved on 12
December, 2008 from: /http://servicio.cid.uc.edu.ve/faces/
revista/a16n27/16-27-3.pdfS.
Caula, S., DeNobrega, R., Giner, S., 2003. Bird diversity as an
element of a conservation strategy for the botanical garden
of the city of Valencia, Venezuela. Acta BiologicaVenezuelica 23 (1).
Caula, S., Marty, P., Martin, J.L., 2008. Seasonal variation in
species composition of an urban bird community in
Mediterranean France. Landscape and Urban Planning
87, 1–9.
Chace, J.F., Walsh, J.J., 2006. Urban effects on native
avifauna: a review. Landscape and Urban Planning 74,
46–69.
Chiesura, A., 2004. The role of urban parks for the sustainable
city. Landscape and Urban Planning 68, 129–138.
Clergeau, P., Mennechez, G., Sauvage, A., Lemoine, A., 2001.
Human perception and appreciation of birds: a motivation
for wildlife conservation in urban environments of France.
In: Marzluff, J.M., Bowman, R., Donnelly, R. (Eds.),
Avian Ecology and Conservation in an Urbanizing World.
Kluwer Academic Publishers, Boston, MA, pp. 69–88.
Coles, R.W., Bussey, S.C., 2000. Urban forest landscape in the
UK. Landscape and Urban Planning 52, 181–188.
Davis, R.K., 1963. The value of outdoor recreation: an
economic study of the Maine Woods. Ph.D. Thesis,
Harvard University, Boston.
Eliasson, I., 2000. The use of climate knowledge in urban
planning. Landscape and Urban Planning 48, 31–44.
European Environment Agency, 2006. Urban sprawl in
Europe – The ignored challenge. EEA Report no. 10/
2006, European Environment Agency, Copenhagen.
Europa, 2007. Treaty of Lisbon: The treaty at a glance.
Retrieved on 1 November, 2008 from: /http://europa.eu/
lisbon_treaty/glance/index_en.htmS.
Europa, 2008. Thematic strategy on the urban environment.
Retrieved on 1 November, 2008 from: /http://ec.europa.
eu/environment/urban/thematic_strategy.htmS.
Fernandez-Juricic, E., Jokimaki, J., 2001. A habitat island
approach to conserving birds in urban landscape: case
studies from southern and northern Europe. Biodiversity
and Conservation 10, 2023–2043.
Gailliard, F., 2002. Egalite hommes–femmes en France: ou en-
est on? France Diplomatie. Ministere des affaires etran-geres. Retrieved on 15 November, 2008 from: /http://
www.diplomatie.gouv.fr/fr/article-imprim.php3?id_article=
21388S.Gomez, F., Tamarit, N., Jabaloyes, J., 2001. Green zones,
bioclimatic studies and human comfort in the future
development of urban planning. Landscape and Urban
Planning 55, 151–161.
Groupement de la Statistique Publique, 2003. Prospective
demographique et economique en Languedoc-Roussillon.
Prefecture de Region Languedoc-Roussillon, Groupement
de la Statistique Publique. Retrieved on 15 November,
2008 from: /http://www.languedoc-roussillon.pref.gouv.fr/
grandsdossiers/prospective/pdf/prospective_1.pdfS.
Hadker, N., Sharma, S., David, A., Muraleedharan, T.R.,
1997. Willingness-to-pay for Borivli national park: evidence
from a contingent valuation. Ecological Economics 21,
105–122.
Huang, S.-L., Wong, J-H., Chen, T.-Ch., 1998. A framework
for an indicator system for measuring Taipei’s urban
sustainability. Landscape and Urban Planning 42, 15–27.
Institut National de la Statistique et des Etudes Economiques
(INSEE), 2002. Editeur, Paris Cedex 14.
Jakobsson, K.M., Dragun, A.K., 2001. The worth of a
possum: valuing species with the contingent valuation
method. Environmental and Resource Economics 19,
211–227.
Jensen, F.S., 2000. The effects of information on Danish forest
visitors’ acceptance of various management actions. For-
estry 73, 165–172l.
Jim, C.Y., Chen, W.Y., 2006. Impacts of urban environmental
elements on residential housing prices in Guangzhou
(China). Landscape and Urban Planning 78, 422–434.
ARTICLE IN PRESSS. Caula et al. / Urban Forestry & Urban Greening 8 (2009) 117–128 127
Author's personal copy
Kelcey, J.G., Rheinwald, G., 2000. Birds in European cities.
Ginster Verlag, St. Katharinen.
Kotchen, M.J., Reiling, S.D., 2000. Environmental attitudes,
motivations, and contingent valuation of non-use values: a
case study involving endangered species. Ecological Eco-
nomics 32, 93–107.
Loomis, J., Ekstrand, E., 1998. Alternative approaches for
incorporating respondent’s uncertainty when estimating
willingness to pay: the case of the Mexican spotted owl.
Ecological Economics 27, 29–41.
Marzluff, J.M., 2001. World wide urbanization and its effects
on birds. In: Marzluff, J.M., Bowman, R., Donnelly, R.
(Eds.), Avian Ecology and Conservation in an Urbanizing
World. Kluwer Academic Publishers, Boston, pp. 19–38.
Millard, A., 2000. The potential role of natural colonisation as
a design tool for urban forestry – a pilot study. Landscape
and Urban Planning 52, 173–179.
Mitchell, R.C., Carlson, R.T., 1989. Using surveys to value
public goods: the contingent valuation method. Resources
for the Future, Washington, DC.
Myers, N., Mittermeier, R.A., Mittermeier, C.G., da Fonseca,
G.A.B., Kent, J., 2000. Biodiversity hotspots for conserva-
tion priorities. Nature 403, 853–858.
Oguz, D., 2000. User surveys of Ankara’s urban parks.
Landscape and Urban Planning 52, 165–171.
Pate, J., Loomis, J., 1997. The effect of distance on willingness
to pay values: a case of study of wetlands and salmon in
California. Ecological Economics 20, 199–207.
Raybould, M., 2005. Attitudes and information effects in
contingent valuation of natural resources. Ph.D. Thesis.
Griffith University, Brisbane.
Rohde, C.L.E., Kendle, A.D., 1994. Human well-being,
natural landscapes and wildlife in urban areas: a review.
Research Report No. 22. University of Reading, Depart-
ment of Horticulture and Landscape and the Research
Institute for the Care of the Elderly, Bath.
Sanesi, G., Chiarello, F., 2006. Residents and urban green
spaces: the case of Bari. Urban Forestry and Urban
Greening 4 (3–4), 125–134.
Savard, J.P.L., Clergeau, P., Mennechez, G., 2000. Biodiver-
sity concepts and urban ecosystems. Landscape and Urban
Planning 48, 131–142.
Schauman, S., Salisburry, S., 1998. Restoring nature in the
city: Puget Sound experiences. Landscape and Urban
Planning 42, 287–295.
Scottish Greenspace, 2008. What is greenspace? Retrieved on 1
November, 2008 from: /http://www.greenspacescotland.
org.ukS.
Spash, C.L., Urama, K., Burton, R., Kenyon, W., Shannon,
P., Hill, G., 2006. Motives behind willingness to pay for
improving biodiversity in a water ecosystem: economics,
ethics and social psychology. Ecological Economics.
Stanners, D., Bordeaux, P. (Eds.), 1995. Europe’s Environ-
ment – The Dobris assessment. European Environment
Agency, Copenhagen.
Tyrvainen, L., 1997. The amenity value of the urban forest: an
application of hedonic pricing method. Landscape and
Urban Planning 37, 211–222.
Tyrvainen, L., 2001. Economic valuation of urban forest
benefits in Finland. Journal of Environmental Management
62, 75–92.
Tyrvainen, L., Miettinen, A., 2000. Property prices and urban
forest amenities. Journal of Environmental Economics and
Management 39, 205–223.
Tyrvainen, L., Vaananen, H., 1998. The economic value of urban
forest amenities: an application of the contingent valuation
method. Landscape and Urban Planning 43, 105–118.
United Nations Population Division, 2001. World Urbaniza-
tion Prospects: The 2001 Revision. Retrieved on 15
November, 2008 from: /http://www.un.org/esa/population/
publications/wup2001/WUP2001_CH1.pdfS.Venkatachalam, L., 2004. The contingent valuation method: a
review. Environmental Impact Assessment Review 24, 89–124.
Vuorisalo, T., Latineen, R., Laaksonen, H., 2001. Urban
biodiversity in local newspapers: a historical perspective.
Biodiversity and Conservation 10, 1739–1756.
Zar, J., 1999. Bio-Statistical Analysis, fourth ed. Prentice-Hall,
Upper Saddle River, p. 123.
ARTICLE IN PRESSS. Caula et al. / Urban Forestry & Urban Greening 8 (2009) 117–128128
Related Documents


![P8.pptx [Read-Only]...Physician relationships/Comp models Value Based purchasing ACA requirements Shift in customer preferences or demographics Organizational culture (1) Uncertainty](https://static.cupdf.com/doc/110x72/5f0dafab7e708231d43b94f2/p8pptx-read-only-physician-relationshipscomp-models-value-based-purchasing.jpg)


