The influence of auditory feedback on The influence of auditory feedback on speed choice, violations and comfort in speed choice, violations and comfort in a driving simulation game a driving simulation game E. Hellier, A. Naweed, G. Walker, P. Husband, J. Edworthy Transportation Research Part F 14 (2011) 591– for Brain, Cognition and Behaviour, School of Psychology, University of Plymouth, Plym ment of Psychology, University of Sheffield, Sheffield, UK Drivers Centre, Devon County Council, Exeter, UK 報報

The influence of auditory feedback on speed choice, violations and comfort in a driving simulation game E. Hellier, A. Naweed, G. Walker, P. Husband, J.
Dec 27, 2015
Welcome message from author
This document is posted to help you gain knowledge. Please leave a comment to let me know what you think about it! Share it to your friends and learn new things together.
Transcript

The influence of auditory feedback on speed choice, The influence of auditory feedback on speed choice, violations and comfort in a driving simulation gameviolations and comfort in a driving simulation game
E. Hellier, A. Naweed, G. Walker, P. Husband, J. Edworthy
Transportation Research Part F 14 (2011) 591–599
Centre for Brain, Cognition and Behaviour, School of Psychology, University of Plymouth, Plymouth, UKDepartment of Psychology, University of Sheffield, Sheffield, UKDevon Drivers Centre, Devon County Council, Exeter, UK
報告者:楊子群

Introduction
1. 政府的目標是有效降低死忙及傷害,其中下列為每年度致命死亡人數:
2. 駕駛者速度的變換與意外發生有關係 (e.g. Baum, Lund, & Wells, 1989;Evans,2004)3.Horswill & McKenna(1999) 利用駕駛模擬測試速度變換,結果為當低分等級的 feedback chose 車速會比較快。
年份 人數2002 3431
2003 3508
2005 3221

Purpose
運用駕駛模擬遊戲,探討下列四項之間關係:1) 提供不同的分貝等級的聽覺反應 (auditory feedback)2) 舒適 (comfort)3) 駕駛速度 (Driving speed)4) 違反行為 (violations)

Experiment1-Design
Four different levels of engine noise feedback (no engine, 65dB(A), 75dB(A), 85dB(A))Measured by recorded: Top speed Average speed Total time Subjective measures(7 point Likerttype scales)

Experiment1-Stimuli and materials
3x2 m sound attenuated laboratory.simulation software (Test Drive 5 2000, Infogames Entertainment).Computer with a 1.8 Ghz Pentium 4 processor.120 x 170 cm image onto a white wall.Logitech Wingman Formula Force USB steering wheel and pedals.Altec Lansing Speakers (model 221).
*noise levels maximum :simulator at 40 mph. no feedback : only ambient noise

Experiment1-Participants
48 participants 27 males (aged 18–27 years, M = 23.5 years) 21 females (aged 18–35 years, M = 25.1 years)
normal or corrected to normal vision and hearing
All had a full driving licence (Average driving experience : 5.25 years)

Experiment1-Procedure
[Step1] 每位受測者跑一次熟習操作及環境 (5 分鐘 ) 。[Step2] 教導每位受測者假使如一般駕駛。[Step3] 正式實驗與練習的一樣路線。[Step4] 填寫問卷[ 蒐集 : 舒適度 (comfort) 、響度 (loundness) 、模擬真實性 (simulator realism)]
=> 李克特 7 點尺度評估( 1 分代表非常不滿意, 7 分代表非常滿意)
總實驗時間: 20 分鐘

Experiment1-Results and discussion
-Average driving speed-Average driving speed
Significant effect of noise level on average speed (F(3, 44) = 9.02, p < .01). Sidak pair-wise comparisons revealed significant differences (p < .01)
Average speed Sidak pair-wise comparisons
No engine noise 68.5 A
65 dB(A) 59.83 A B
75 dB(A) 41.5 B
85 dB(A) 41.08 B

Experiment1-Results and discussion
-Age and gender as covariates-Age and gender as covariatesAge vs. Average speedSignificant (F(1, 43) = 7.09, p < .05)
Age vs. engine feedback levelSignificant (F(3, 43) = 9.62, p < .01).
Age & Average vs. engine feedback levelsignificant negative correlation (r(49) = .334, p < .05).
Gender vs. Average speed Significant(F(1, 39) = 5.67, p < .05).
-Male (M = 57.76 mph) driving faster than female (M = 46.68 mph).
Gender vs. engine feedback levelSignificant(F(3, 43) = 7.64, p < .01)

Experiment1-Results and discussion
-Subjective measures-Subjective measuresComfort vs. loudnesspositive correlation (r(48) = .49, p < .01)Realism ratingsno relationships with any subjective or objective measures (M = 3.2, ‘somewhat realistic’).
engine feedback level vs. comfort ratingssignificant effect (F(3, 44) = 10.71, p < .01).- Sidak post hoc tests revealed significant differences.
Sidak pair-wise comparisons
85 dB(A) A
75 dB(A) A
65 dB(A) A
No feedback B

Experiment1-Results and discussion
-Subjective measures-Subjective measuresComfort vs. loudnessSignificant positive correlation (r(48) = .49, p < .01)
Realism ratings showed no relationships with any subjective or objective measures (M = 3.2, ‘somewhat realistic’).
Engine feedback level vs. comfort ratingsSignificant (F(3, 44) = 10.71, p < .01).- Sidak post hoc tests revealed significant differences between the no feedback condition.
Sidak pair-wise comparisons
No feedback A
65 dB(A) B
75 dB(A) B
85 dB(A) B

Experiment1-Results and discussion
-Subjective measures-Subjective measuresEngine feedback noise level vs. loudness Significant (F(3, 44) = 64.35, p < .01).-Sidak post hoc analysis significant differences
Sidak pair-wise comparisons
No feedback A
65 dB(A) B
75 dB(A) B
85 dB(A) B

Experiment1-Results and discussion
-Subjective measures-Summarises-Subjective measures-Summarises

Experiment2-Design
Four different levels of engine noise feedback (no engine, 70dB(A), 75dB(A), 80dB(A))Measured by recorded:Average speedViolationsSubjective measures(7 point Likert-type scales)

Experiment2-Participants
24 participantsMale:12, aged:29-42 year, M=29.5 yearsFemales :12, aged:19-31 years, M=26.1 years
normal or corrected to normal vision and hearing
All had a full driving licence (Average driving experience : 9.88 years)

Experiment2-Proceduce
The realism of the simulation was assessed in pilot work.7 participants(mean age: 29 years).Drive the course and were stopped at 5 points and asked to estimate the speed limit and rate the realism and level of external disturbance on a 10-pint scale.
There was a 5 min break between successive trials.

Experiment2-Results and discussion
-Realism of the simulation-Realism of the simulationMean realism score was 7 (st.dev. = 1.71) =>high degree of realism.
Mean score for disturbance was 4.94 (st.dev. = 1.82)=>medium level
Average estimated speed limit was 50 mph (st.dev. = 7.9).
Actual speed limit of the road used for the trials.

Experiment2-Results and discussion
-Average driving speed-Average driving speed
Significant effect of noise level on average speed (F(3, 69) = 3.15, MSe = 43.73, p < .05).-Sidak pair-wise comparisons revealed significant differences.
Average speed Sidak pair-wise comparisons
No engine noise 70.88 mph A
75 - A B 70 - B C 80 65.23 mph C

Experiment2-Results and discussion
-The effect of age and gender on speed-The effect of age and gender on speedSex vs. average speed Significant (F(1, 22) = 856, MSe = 515.20, p < .01).Average speed : Male(25 mph) > femaleSex vs. noise level(F(3, 66) = .02, p > .05).Age vs. driving experienceHighly correlated (r = 0.76, p < .01)
Experiment2-Results and discussion
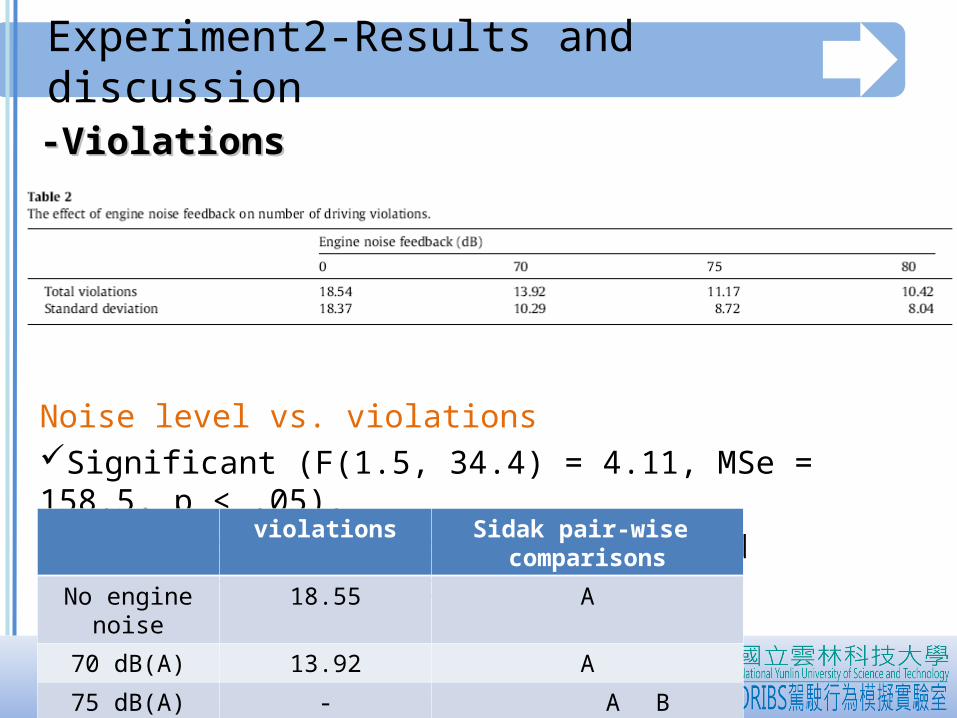
-Violations-Violations
Noise level vs. violationsSignificant (F(1.5, 34.4) = 4.11, MSe = 158.5, p < .05).--Sidak pair wise comparisons revealed significant differences.
violations Sidak pair-wise comparisons
No engine noise 18.55 A
70 dB(A) 13.92 A
75 dB(A) - A B
80 dB(A) 10.42 A B
Related Documents