THE INFLATION EXPECTATIONS OF U.S. FIRMS: EVIDENCE FROM A NEW SURVEY Bernardo Candia UC Berkeley Olivier Coibion UT Austin and NBER Yuriy Gorodnichenko UC Berkeley and NBER First draft: August 8 th , 2020 This draft: September 10 h , 2021 Abstract: Introducing a new survey of U.S. firms’ inflation expectations, we document key stylized facts involving what U.S. firms know and expect about inflation and monetary policy. The resulting time series of firms’ inflation expectations displays unique dynamics, distinct from those of households and professional forecasters. By any typical definition of “anchored” expectations, the inflation expectations of U.S. managers appear far from anchored, much like those of households. And like households, U.S. managers are largely uninformed about recent aggregate inflation dynamics or monetary policy. These results complement existing evidence on firms’ inflation expectations from other countries and confirm that inattention to inflation and monetary policy is pervasive among U.S. firms as well. JEL: E3, E4, E5 Keywords: Expectations, surveys, anchoring, rational inattention. Acknowledgement: We are grateful to Zhaosheng Li, Jake Lyons and Yizhong Zhang for excellent research assistance. This research was funded in part by National Science Foundation grant 1530467.

Welcome message from author
This document is posted to help you gain knowledge. Please leave a comment to let me know what you think about it! Share it to your friends and learn new things together.
Transcript

THE INFLATION EXPECTATIONS OF U.S. FIRMS: EVIDENCE FROM A NEW SURVEY
Bernardo Candia UC Berkeley
Olivier Coibion UT Austin and NBER
Yuriy Gorodnichenko UC Berkeley and NBER
First draft: August 8th, 2020 This draft: September 10h, 2021
Abstract: Introducing a new survey of U.S. firms’ inflation expectations, we document key stylized facts involving what U.S. firms know and expect about inflation and monetary policy. The resulting time series of firms’ inflation expectations displays unique dynamics, distinct from those of households and professional forecasters. By any typical definition of “anchored” expectations, the inflation expectations of U.S. managers appear far from anchored, much like those of households. And like households, U.S. managers are largely uninformed about recent aggregate inflation dynamics or monetary policy. These results complement existing evidence on firms’ inflation expectations from other countries and confirm that inattention to inflation and monetary policy is pervasive among U.S. firms as well.
JEL: E3, E4, E5 Keywords: Expectations, surveys, anchoring, rational inattention.
Acknowledgement: We are grateful to Zhaosheng Li, Jake Lyons and Yizhong Zhang for excellent research assistance. This research was funded in part by National Science Foundation grant 1530467.

1
“Do we need new measures of expectations or new surveys? Information on the price expectations of businesses--who are, after all, the price setters in the first instance--as well as information on nominal wage expectations is particularly scarce.” Ben Bernanke, July 10, 2007
I Introduction
Firms’ inflation expectations affect their economic decisions, and therefore broader macroeconomic
outcomes, both in theory (e.g., Afrouzi and Yang 2020 for a recent example) and in practice (e.g.,
Coibion, Gorodnichenko and Kumar 2018 and Coibion, Gorodnichenko and Ropele 2020). But the
absence of systematic survey data on the macroeconomic expectations of U.S. firms, and their
inflation expectations in particular, has limited our understanding of how these expectations are
formed as well as their use for policymaking. In this paper, we begin to fill this gap by introducing
the new Survey of Firms’ Inflation Expectations (“SoFIE”) that has been running since 2018.1 We
show that these new data provide striking evidence on just how uninformed U.S. firms are with
respect to both inflation and monetary policy, a finding which complements earlier evidence from
other advanced economies with long histories of low and stable inflation.
The potential importance of measuring the inflation expectations of firms is grounded in
macroeconomic theory, which commonly ascribes a central role to firms’ expectations of inflation
in accounting for macroeconomic dynamics of both nominal and real variables. Initially formalized
in Friedman (1968) and Phelps (1968), the role of firms’ inflation expectations is typically
summarized by an expectations-augmented Phillips curve, a predicted relationship linking inflation
and the real side of the economy conditional on firms’ expectations of inflation. Such a relationship
famously arises in sticky price models as the New Keynesian Phillips Curve (see e.g. Woodford
2003, Gali and Gertler 1999) but is also a feature of a much wider class of models ranging from the
1 Detailed information about the survey as well as updated survey results can be found at http://firm-expectations.org/index.html.

2
seminal island model of Lucas (1972) to modern imperfect information variants such as sticky
information (Mankiw and Reis 2002, Reis 2006), noisy information (Woodford 2002), dispersed
information (Nimark 2014), rational inattention (Afrouzi and Yang 2020) or behavioral models like
Gabaix (2020). While the specific timing of the inflation expectations in the Phillips curve depends
upon the underlying model, all these models make the common prediction that firms’ inflation
expectations are central to understanding the link between the nominal and real sides of the economy
and therefore play a fundamental role in determining the nature of optimal monetary policy. Indeed,
policymakers themselves have long emphasized the importance of firms’ inflation expectations in
how they think about optimal policy, as illustrated in the initial quote.
Despite the fact that both economic theory and policymaking point toward the importance of
measuring and understanding firms’ inflation expectations, the ability to do so in the world’s largest
economy has been severely limited by data constraints. Few surveys of U.S. firms exist, and those
that do tend to focus either on expectations about firm-specific outcomes (e.g., firm level uncertainty
in Altig et al. (2020) or firm level costs in the Atlanta Fed’s Business Inflation Expectations survey).
The few surveys that extract firm-level expectations about aggregate conditions are either very
small/non-representative (e.g., Livingstone Survey) or qualitative (Duke CFO Survey). As discussed
in detail in Coibion et al. (2020), the same is true in most other advanced economies. The few
countries that have been successful in creating systematic and quantitative surveys of firms’
macroeconomic expectations have mostly been in developing economies with high and/or volatile
inflation (e.g., Ukraine, Uruguay).
SoFIE therefore makes progress in measurement for the U.S. It does so by providing the first
time series of firms’ quantitative inflation expectations from a broad survey of U.S. firms. This survey
meets the characteristics of a well-designed survey of firms’ inflation expectations highlighted in
Coibion et al. (2020). It does so by building upon a pre-existing privately-run survey of chief

3
executive officers (CEOs) that provides a broadly representative panel of U.S. firms of different sizes
and industries. Each quarter, this panel of respondents is asked two quantitative questions about
inflation and monetary policy. One consistently measures their quantitative expectations about U.S.
inflation over the next twelve months. The second rotates across different formulations investigating
long-run inflation expectations, perceived recent levels of inflation, uncertainty about future inflation
risk, as well as knowledge of the Federal Reserve’s inflation target. SoFIE also utilizes a panel
dimension of the survey, which allows us to observe the evolution of expectations for a given firm.
While this time series is still short, beginning in 2018, the survey provides a starting point for the
more systematic long-term measurement of firms’ inflation expectations in the U.S. As such, we hope
that it will serve to stimulate further research into firms’ expectations and how they affect their
decisions as well as being of immediate practical use to policymakers.
This survey provides a number of new facts about the inflation expectations of U.S. firms.
The available time series for firms’ inflation expectations deviates significantly from those of both
households and professional forecasters, indicating that neither is a perfect substitute for a survey of
firms’ inflation expectations. In terms of their general characteristics, however, firms’ inflation
expectations exhibit many of the characteristics of households’ inflation expectations and depart
dramatically from the inflation expectations of professional forecasters. This is true for mean
forecasts, which were higher than inflation on average during the sample, as well as the amount of
disagreement across firms in their expectations about future inflation, a characteristic which again has
long been identified with households relative to professionals (e.g., Mankiw, Reis and Wolfers 2003).
While some of the cross-sectional disagreement is systematically related to observable characteristics,
such as industry (e.g., financial services have significantly lower inflation expectations than firms in
telecommunications), much of it is uncorrelated with observable firm characteristics.

4
This widespread disagreement extends into forecasts of the distant future. Firms disagree
not just about price movements over short horizons like the next year, but also about inflation over
much longer horizons like five years. This profound disagreement about the long-run dynamics of
future inflation, as well as the fact that most firms predict long-run levels of inflation significantly
different from the Federal Reserve’s inflation target of 2 percent indicates that the inflation
expectations of U.S. CEOs are anything but anchored. We also document that firms are generally
uncertain in their inflation forecasts, they regularly revise both their short- and long-run forecasts
by large amounts despite the general stability of U.S. inflation, and the revisions between their
short-run and long-run forecasts are strongly positively correlated. All these features are at odds
with anchored expectations but closely mirror those documented elsewhere for U.S. households,
which are in sharp contrast to those observed for U.S. professional forecasters.
What lies behind this lack of anchoring in firms’ inflation expectations? One factor at work
seems to be systematic inattention to monetary policy: we find that most CEOs are unaware of the
Federal Reserve’s inflation target. The fraction of CEOs that correctly identifies 2 percent as the
inflation target is less than 20 percent. Nearly two thirds of CEOs are unwilling to even guess what
the target is. Of those who dare, less than 50 percent think it is between 1.5 and 2.5 percent.
Another factor is the systematic inattention on the part of firms to recent inflation dynamics:
managers disagree just as much about what inflation has been over the last twelve months as they
do about what it will be in the future, even though the former is publicly and freely available.
While both forms of inattention are correlated with firms’ inflation expectations, we document that
firms’ long-run expectations are more closely related to their beliefs about the inflation target while
their short-run expectations are better explained by their perceptions of recent inflation. We
interpret these results as indicating that both forms of inattention, i.e., inattention to monetary
policy as well as to recent inflation dynamics, shape the inflation expectations of firms.
5
Inattention on the part of firms to both recent inflation and monetary policy objectives is not
unique to the U.S. but rather seems to be characteristic of advanced economies with a history of low
and stable inflation. Kumar et al. (2015), for example, investigate whether inflation expectations of
firm managers in New Zealand are well anchored. They find that the inflation expectations of firms
in New Zealand display little anchoring under any of the definitions of anchored expectations
considered: their inflation expectations have been higher, more dispersed, and more volatile than
those of professional forecasters, at both short-run horizons and long(er)-run horizons. Moreover,
managers display large forecasts revisions, high correlation between short-run and long-run inflations
expectations, and high uncertainty about the inflation outlook. Consistent with Kumar et al. (2015),
we also find that many U.S. CEOs devote little attention to both inflation and monetary policy:
managers are uninformed about recent inflation dynamics and they are unaware of the central bank’s
inflation target, despite the fact that the Federal Reserve set its inflation target at 2 percent in 2012.
Inattention to inflation and monetary policy need not imply, however, that inflation
expectations play no role in firms’ decisions. Coibion, Gorodnichenko and Kumar (2018) and
Coibion, Gorodnichenko and Ropele (2020) show in New Zealand and Italy respectively that
randomized information treatments in which publicly available information about inflation is
provided to some firms have significant effects on those firms’ inflation expectations and
subsequently on their investment and employment decisions. These papers therefore provide direct
causal evidence that even inattentive firms respond to changes in their expectations of inflation.
Inattention also has implications for how central banks should communicate with firms. An
early literature on central bank communications (see Blinder et al. 2008 for a survey) focused almost
exclusively on central banks’ interactions with financial markets, primarily due to data limitations.
Since Blinder (2009), the effect of central bank communications on the expectations of the general
public has been an active area of research. Using existing survey and polling data, Binder (2017b),

6
for example, shows that central bank communications are not received and understood by a
significant part of U.S. households, who lack basic knowledge about monetary policy and central
bank objectives. Accordingly, Lamla and Vinogradov (2019) find that central bank announcements
(FOMC press conferences) have no measurable direct effect on households’ expectations. While this
inattention by the general public may reflect the past success of monetary policy (the public does not
pay attention to inflation because inflation is not a problem), it poses additional challenges for central
banks when they seek to stabilize the economy through expectations channels (Coibion et al. 2020).
This is not to say that the central bank is powerless in reaching the public or affecting their
beliefs. Available evidence shows that households and firms revise their inflation expectations
once they are exposed to information about inflation or monetary policy (past inflation, inflation
target, FOMC projection, etc.) which implies that central banks can affect inflation expectations
and that economic agents then react to changes in inflation, updating their consumption,
employment, pricing and investment decisions.2 Furthermore, Haldane and McMahon (2018),
Bholat et al. (2019), Haldane, Macaulay and McMahon (2020) emphasize that more
straightforward communication boosts the chances of aligning the expectations of the “general
public” with the central bank’s forecasts. Pedemonte (2020) shows that President Franklin D.
Roosevelt’s radio chat announcing important social policies in 1935 had a stronger expansionary
effect in areas with larger penetration of radio. This paper contributes new evidence on the degree
of attention that U.S. firms pay to actions and objectives of the central bank.
Finally, this paper also relates to the literature on the expectation formation process among
different agents and their impact on macroeconomic dynamics. To ensure internal consistency, the
assumption of full information rational expectations (FIRE) under which economic agents know
2 See Kamdar (2018), Coibion, Georgarakos, Gorodnichenko, and van Rooij (2019), Coibion, Gorodnichenko and Weber (2020) for evidence that changes in inflation expectations affect consumption decisions of households.

7
all the information about the state of the economy has been widely used in modern macroeconomic
models. Theoretical and empirical work has however repeatedly questioned this assumption,
advocating the need for departures from full information or rationality. Mankiw and Reis (2002),
Woodford (2002), Sims (2003), Gorodnichenko (2008), Mackowiack and Wiederholt (2009),
Alvarez, Lippi, and Paciello (2011), Gabaix (2014, 2020), Matějka (2016), Bordalo, Gennaioli and
Shleifer (2018), Angeletos and Lian (2018) and Farhi and Werning (2019) all develop theories that
explore the macroeconomic implications of different ways of modelling deviations from full
information rational expectations. Using survey forecast data, Andrade and Le Bihan (2013),
Coibion and Gorodnichenko (2012, 2015b) and Fuhrer (2018) provide empirical support for
deviations from full-information rational expectations. More recently, empirical work has focused
on distinguishing what type of deviation from FIRE seems to be most relevant to explain business
cycles (see Coibion et al. 2021, Bordalo, Gennaioli, and Shleifer 2018, Angeletos, Huo, and Sastry
2020, Reis 2020). The low level of knowledge that U.S. firm managers have about the Federal
Reserve’s inflation target or inflation dynamics documented in this work supports the criticism
that full information is a poor approximation for price-setters.
II Description of the survey
Surveying firms is challenging, particularly when it requires contacting CEOs of major
corporations. There is typically an army of people between the surveyor and the desired
respondent. Achieving reasonable response rates therefore requires appealing to the authority of a
government institution or central bank in the background or engaging in a time-consuming process
of developing a panel of willing respondents. In this case, our survey questions were added to a
pre-existing private survey of firms that has a long history of collecting CEO’s and top executives’
perceptions and expectations for various firm-specific outcomes. Based on the quality of its

8
surveys, this firm provides consulting services to multinational corporations, financial institutions,
businesses, technical professionals, and governments around the world.
In 2018, this survey firm agreed to add two inflation-related questions to its quarterly survey.
By expanding on this pre-existing survey, we can benefit from the extensive panel of firms that have
been participating in prior waves without reconstructing such a panel from scratch. However, one
limitation is that we only have access to the inflation responses from the survey. Another limitation
is that we are only provided with basic demographic information for firms, including industry and
company size, to ensure that their anonymity is preserved. Firms are classified into small, medium,
and large. Small companies have between 1 and 19 employees, medium companies have between
20 and 249 employees while large companies have over 250 employees. Firms were randomly
chosen from manufacturing and services industries to represent the underlying structure of each
sector in the economy according to its contribution to the gross value added.3
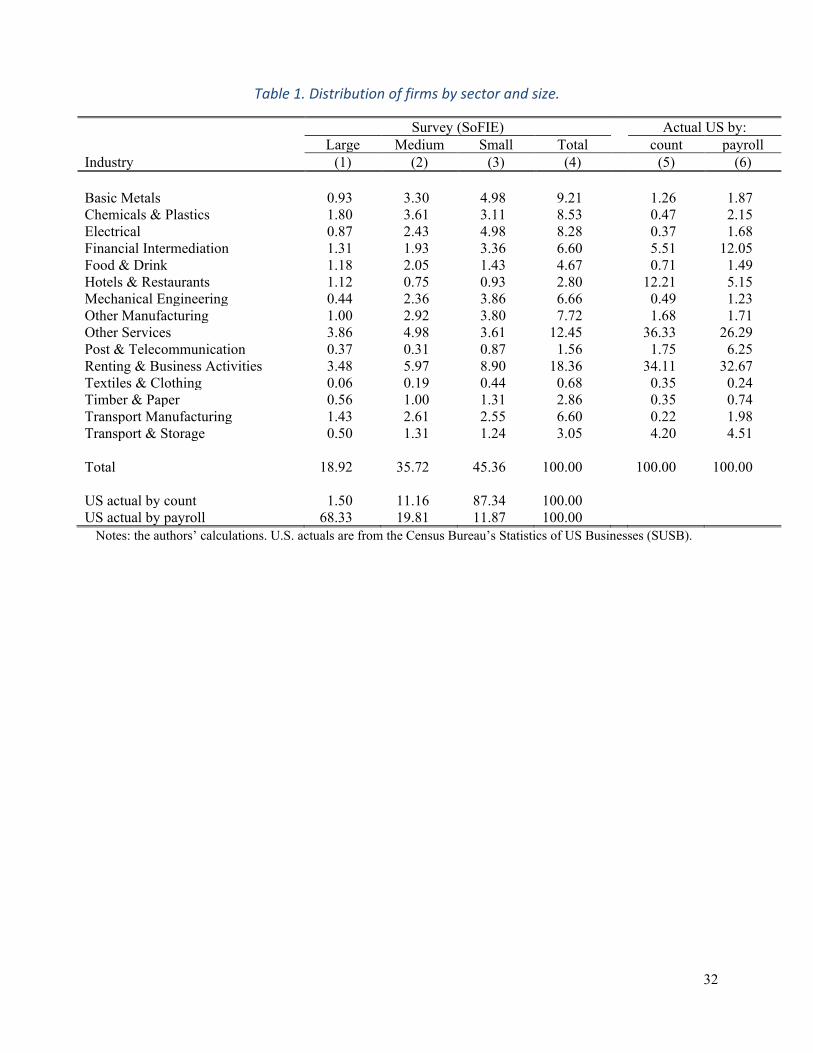
Table 1 provides a breakdown of respondents to the survey by size and sector. Relative to
their share of national payroll, there is a disproportionate share of manufacturing firms which
reflects the historical background of the pre-existing survey. Despite this limitation, the panel is
heterogeneous across sectors and firm sizes, thus providing a good coverage of the U.S. economy.
As a result, the relative importance of different sectors and sizes can be adjusted by constructing
weights to replicate the distribution of payroll across industries/size in the U.S. We do so for
subsequent results but in practice using weights has little effect.
We executed fourteen waves of the survey over the period running from April 2018 through
July 2021. Between 300 and 600 firms participated in each wave on average, a sizeable sample for
3 Within the manufacturing sector, companies are classified into Food and Drink; Textiles and Clothing; Electrical; Chemicals and Plastics; Transport; Timber and Paper; Basic Metals; Mechanical Engineering; and Other Manufacturing. Within the services sector, the companies are classified into Hotels and Restaurants; Transport and Storage; Post and Telecommunication; Financial Intermediation; Renting and Business Activities; and Other Services.
9
a firm survey. From its first launch, 1,329 firms have participated in the survey. About thirty-five
percent of firms participate only once. Firms, on average, participate in 2.8 waves (standard
deviation 2.2), so a panel dimension is reasonably large.
In each survey wave, we are able to ask two inflation-related questions to participants. The
first question is common across all waves and focuses on 12-month-ahead inflation expectations.
Specifically, respondents are asked:
Q1: “What do you think will be the inflation rate (for the Consumer Price Index) over the next 12 months? Please provide an answer in an annual percentage rate.”
There are three important elements of the question to note. First, respondents are asked to provide
a point estimate rather than assign probabilities to different possible outcomes. One advantage of
asking for point estimates is that it avoids possible priming effects that come from seeing the
specific bins that are presented. However, point estimates can lead to bunching of answers around
specific numbers when respondents are uncertain about their forecasts (Binder 2017a). Second, we
ask about the inflation rate rather than the general level of prices. The latter is used in some
household surveys (e.g., the Michigan Survey of Consumers) in case respondents are not familiar
with the notion of inflation. Kumar et al. (2015) however document that managers and CEOs
generally understand what inflation means. Third, we refer to a specific price index (CPI) to avoid
any confusion about which inflation rate respondents should refer to in their forecasts.
The second question posed to respondents rotates across four different possible questions,
each asked once a year:
Q2A (April wave). “What annual inflation rate do you think the U.S. Federal Reserve is trying to achieve on average?”
Q2B (July wave). “What do you think has been the annual inflation rate (for the Consumer Price Index) over the last twelve months? Please provide an answer in annual percentage rate.”

10
Q2C (October wave). “What do you think will be the average inflation rate (for the Consumer Price Index) over the next 5 years? Please provide an average annual percentage rate.”
Q2D (January wave). “What do you think is the probability that the annual inflation rate (for the Consumer Price Index) over the next 12 months will exceed 5%?”
Question Q2A is asked every year in the April wave and aims to measure perceptions of the Fed’s
inflation target. This provides a simple metric for measuring the extent to which CEOs are familiar
with the objectives of policy-makers and is therefore useful for gauging the credibility of the Fed
as well as its ability to influence inflation dynamics. Question Q2B (asked in every July wave)
elicits perceptions of recent inflation, which are often a strong predictor of inflation expectations.
Because inflation statistics are publicly available, this question also provides a simple measure of
the degree of inattention to inflation on the part of participants. Question Q2C (asked in every
October wave) measures longer-run inflation expectations. As discussed in section IV, these can
be used to assess how anchored inflation expectations are. Finally, question Q2D (asked in every
January wave) provides a measure of uncertainty in inflation expectations. Notice that in contrast
to survey questions eliciting distributions of future inflation by asking respondents to assign
probabilities to various ranges (“bins”) of inflation, we effectively ask respondents to assign a
probability to only one bin (inflation of greater than 5 percent). This question provides a simple
and tractable way to quantify the inflation uncertainty perceived by respondents while also limiting
the time required of them to participate in the survey.
Jointly, this survey has several attributes that should be emphasized. First, it covers a wide
range of firms of different sizes and industries, which allows us to create a time series of firms’
inflation expectations representative of the U.S. economy. Second, we provide a quantitative,
rather than just qualitative, measure of inflation expectations. Third, we focus specifically on
measuring the expectations of firms with respect to aggregate inflation, not just their own prices
11
or costs. Fourth, we complement the time series of inflation expectations with additional measures
of perceived inflation, inflation uncertainty, long-run expectations, and knowledge of the Fed’s
inflation target. Jointly, these provide the most comprehensive view of what U.S. firms know and
expect about inflation and monetary policy.
For comparison, existing surveys of firms fall short along some of these dimensions. Many
existing surveys do not measure expectations of aggregate inflation at all, often by design (e.g., the
Survey of Business Uncertainty4 focuses on the uncertainty firms perceive about their own
conditions). Some do focus on inflation expectations but measure only expectations about firm-
specific outcomes (e.g., the Atlanta Fed’s Business Inflation Expectations survey asks respondents
about what will happen to their firm’s unit costs, the Conference Board’s Survey of CEOs asks about
firms’ prices). The few surveys that do focus on expectations about aggregate inflation are either not
representative (e.g., the Livingston Survey uses only about 50 very large firms) or ask only qualitative
questions. Thus, our new survey of firms’ inflation expectations fills an important gap in the literature.
III The Inflation Expectations of U.S. Firms
With this new survey, we can now measure the inflation expectations of firms in the U.S. since
2018. We plot the time series of the mean 1-year-ahead inflation expectations of firms in Panel A
of Figure 1, along with corresponding measures of expectations for households, professionals, and
financial markets.5 Household expectations are measured using the mean 1-year-ahead inflation
forecast from the Michigan Survey of Consumers (MSC). Professional forecasts are mean 1-year-
ahead forecasts of CPI inflation. Financial market inflation forecasts are extracted from asset prices
by the Federal Reserve Bank of Cleveland following Haubrich, Pennachi and Ritchken (2012).
4 See https://www.atlantafed.org/research/surveys/business-uncertainty for a description of this survey. 5 Underlying values are presented in Table 2. Results using SoFIE data for 2018Q2 were first reported in Coibion, Gorodnichenko, Kumar and Pedemonte (2020).
12
Inflation expectations of professional forecasters and financial markets participants are
highly correlated over time. In the late 2000s they stabilize at 2 percent, close to the Federal
Reserve’s long-run objective. However, household inflation expectations follow a different pattern.
In the early part of the sample the correlation between inflation expectations of households and
professional forecasters was very high, but since the early 1990s household inflation expectations
have been consistently higher than those of professional forecasters, with the wedge between the two
exceeding 2 percentage points on several occasions. Since the early 2000s household expectations
have averaged around 3.5 percent while those of professional forecasters averaged around 2.1
percent. One key question that we address in this paper is where firms lie along this spectrum.
At the beginning of our sample in 2018, firm managers in the United States reported inflation
forecasts similar to those of households, around 3-3.6 percent, while professionals were predicting
inflation of just over 2 percent. In 2018Q2, firm managers’ forecasts exceeded the inflation forecasts
of all other agents. Their inflation forecasts then experienced a precipitous decline, falling to 2.1
percent by 2019Q2, a decline that significantly exceeds the slight fall in inflation expectations of
professionals over the same period (of 0.3 percentage points) while household inflation forecast
remained relatively stable. Firm inflation forecasts then remained stable for several quarters, close
to those of professionals and significantly below those of households.
During the pandemic, firm inflation forecasts again behaved somewhat differently from
others. Professional forecasters initially interpreted the pandemic as a demand-side shock and
significantly reduced their inflation expectations in the first months of the pandemic. Households, in
contrast, immediately raised their inflation expectations from 2.9 percent in 2020Q1 to 4.0 percent
in 2020Q2, and these have remained high through 2021Q1. This suggests that households viewed
the pandemic as much more of a supply-side shock (see Candia, Coibion, and Gorodnichenko 2020
for more discussion). Firms initially displayed little change in their inflation expectations but

13
ultimately raised them to 2.9 percent by 2021Q1 and 4.7 percent in 2021Q3, thereby displaying a
response closer to that of households than to professional forecasters.
What can explain the instability in firms’ forecasts? One explanation may be the changing
composition of firms’ willingness or ability to respond to the question. Between 2018Q2 and
2019Q1, for example, firm expectations averaged around 0.9 percentage point higher than those
of professional forecasters and only 39.7 percent of firm managers reported a point forecast for
CPI inflation over the next twelve months (around 45.7 percent reported that they did not know).6
In contrast, between 2019Q2 and 2020Q1 when firm expectations averaged only 0.075 percentage
points more than those of professional forecasters, 66.5 percent of top executives reported a point
forecast (10.2 percent did not know). In 2020Q2, the difference between firms’ and the
professionals’ forecasts increased slightly to 0.2 percentage points and the fraction of firm
managers that reported a point forecast dropped to 33.1 percent (25.7 percent did not know),
probably due to the uncertainty generated by the COVID-19 pandemic. In 2020Q4, the difference
between firms ‘and the professionals’ forecasts stayed on 0.2 percentage points, during which a
striking 80.4 percent of firm managers reported a point forecast and only 7.9 percent answered that
they did not know. In short, there is a negative correlation between the willingness of managers to
provide an inflation forecast and the size of the gap between firm forecasts and professional
forecasts. It seems that when firm managers pay more attention to inflation dynamics, they make
predictions more similar to those of professional forecasters, but what explains the difference in
the level of attention between the periods 2018Q2-2019Q1 and 2019Q2-2020Q1 (before the
COVID-19 pandemic) remains an open question. Regardless of its source, one clear implication
of the time series of firms’ expectations documented in Figure 1 is that the dynamics of their
6 The remaining forecasters provide a range of values, of which we take the midpoint as their point forecast.
14
expectations cannot be fully proxied by professional forecasters’ or households’ expectations:
measuring the expectations of firms via specifically-designed surveys is therefore the only way to
properly characterize these beliefs.
The uniqueness of firm inflation expectations is not limited to their mean forecasts. Panel B
of Figure 1 and Table 2 present the cross-sectional standard deviation in firm forecasts, along with
comparable measures of dispersion for households and professionals.7 Professional forecasters
display very little disagreement in their inflation forecasts, with cross-sectional standard deviations
of 0.3 or 0.4 percentage points prior to the pandemic. During the pandemic, disagreement increased
among professionals, rising to 1.1 percentage points in 2020Q3 before falling back to 0.3 percentage
points by 2021Q1. Disagreement among households, in contrast, is notoriously high: the cross-
sectional standard deviation is around 3.5 percentage points on average during our sample. It also
increases discernably during the pandemic. When it comes to firms, the amount of disagreement
lies squarely between professional forecasters and households. The average level of disagreement
is around 1.4 percentage points on average during our sample, about midway between the two. It
increases during the pandemic, with a particularly pronounced increase in 2021Q1 that is consistent
with a K-shaped recovery in which some firms do very well while others continue to struggle. Thus,
the dispersion in forecasts also suggests that firms are distinct from both households and firms in
their beliefs about inflation.
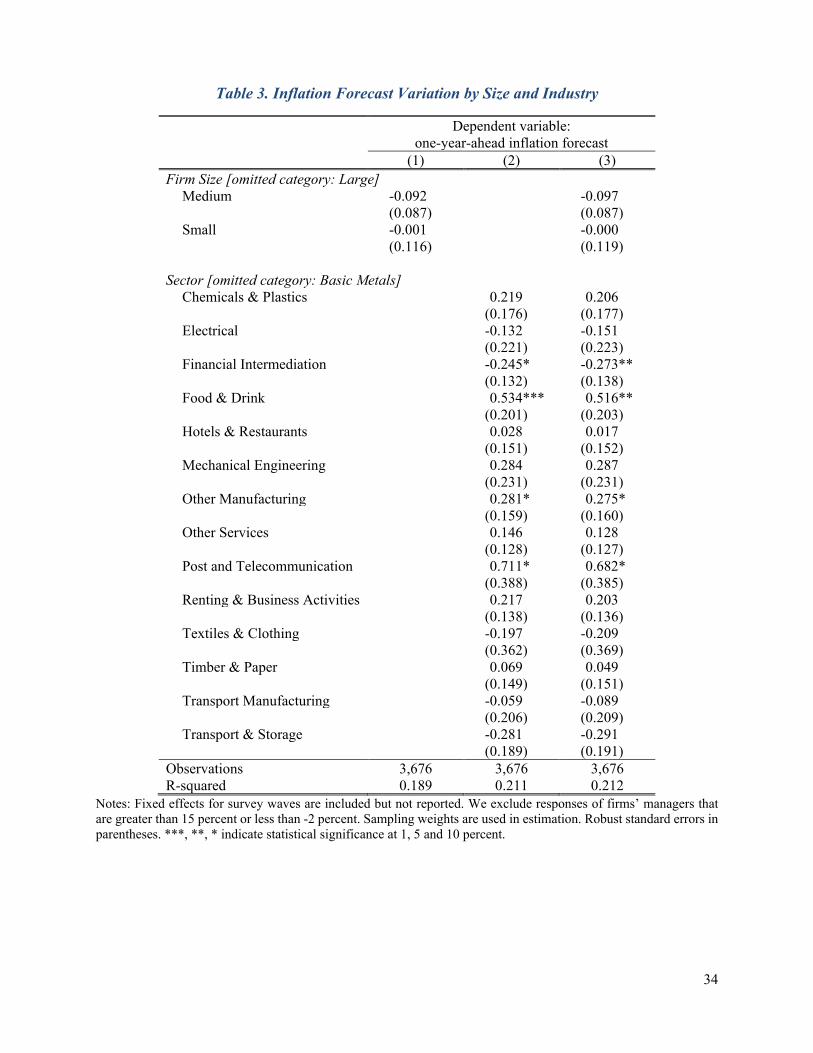
We can consider whether some of the cross-sectional differences in firms’ forecasts are
related to observable characteristics, such as size and industry. We do so by regressing firms’
inflation forecasts on a time fixed effect and indicator variables for size and industries, with results
of these regressions in Table 3. There is little evidence that size is systematically related to firms’
7 Appendix Figure A3 presents histograms for inflation forecasts by wave.
15
inflation expectations in the U.S.: small (less than 20 employees) and medium (20-249 employees)
firms do not report inflation expectations that are statistically significantly different from those of
larger firms. However, there are some notable differences across industries. For example, firms in
the Telecommunications industry and in the Food and Drinks industry report higher inflation
expectations. Firms themselves are therefore not interchangeable when it comes to their inflation
expectations, so measuring the average inflation expectations of firms requires a representative
sample of firms across industries.
The results of our survey of firms can be compared to other recent attempts to survey U.S.
firms’ inflation expectations. For example, the Atlanta Fed’s Business Inflation Expectations (BIE)
survey tracks the expectations of firms in the 6th Federal Reserve’s district about their own unit
cost growth. Using additional questions in select surveys (September 2014, July 2015, January
2019, and April 2019) focusing on the expectations of these firms about aggregate inflation (rather
than firm-specific unit costs as typically measured by the BIE), they provide occasional measures
of firms’ aggregate inflation expectations (see Meyer, Parker and Sheng 2020). Table 4 presents
values from these occasional surveys, as well as comparable values from our survey of firms. The
two surveys reach similar conclusions about inflation expectations of firms in overlapping
samples, both in terms of mean forecasts and forecast dispersion.
Another comparison that can be made is to a survey of middle- and low-ranking managers
from the Nielsen Homescan Panel (as in Coibion, Gorodnichenko, and Weber 2020). This is based
on a quarterly survey of U.S. households in which respondents are asked about their professional
responsibilities. We classify individuals who participated in this large household survey as managers
if they perform at least one of the following activities: set prices or wages, fire/hire personnel,
supervise personnel (1-10 people, 11-50 people, more than 50 people), make decisions about capital
expenditures, or make decisions about marketing/sales. Results from this alternative survey are also

16
included in Table 4. Mean forecasts and dispersion are much closer to those of all households (see
Table 2), indicating that the inflation expectations of middle and low-ranking managers are not
directly comparable to those of CEOs and other top executives. This is in line with other evidence
on how job positions affect reported inflation expectations (Savignac et al. 2021).
In summary, our new survey provides the beginnings of a time series of the inflation
expectations of firms in the U.S. We find that these expectations exhibit some of the features of
households’ inflation expectations, such as displaying significantly more disagreement than what
is seen among professional forecasters, yet are distinct from them. In particular, their dynamics
over time range from higher values seen in household expectations to the 2 percent level typical
of professionals. We view this variation as providing an important justification for surveying
firms’ expectations: corresponding surveys of households and professional forecasters are no
substitute for a representative survey of firms’ beliefs.
IV Are managers’ inflation expectations anchored in the United States?
As illustrated in Figure 1, the inflation expectations of firms look volatile. They range from the
high levels observed for households to values almost identical to the Federal Reserve’s long-run
objective. Should we consider these expectations “anchored?” In this section, we consider the five
distinct definitions of “anchored” expectations discussed in Kumar et al. (2015) and assess the
extent to which they apply to the inflation expectations of firms in our survey. These definitions
of anchored expectations include: (1) average beliefs should be close to the inflation target of the
central bank, (2) beliefs should not be too dispersed across agents, (3) agents should be confident
in their forecasts, (4) agents should display small forecast revisions, especially at longer horizons
and (5) there should be little comovement between revisions in long-run inflation expectations

17
(which should be pinned down by the inflation target) and in short-run inflation expectations
(which should move with transitory shocks).
Prediction 1: Average beliefs should be close to the inflation target.
Figure 1 already illustrated periods in which the inflation expectations of firms deviated
significantly from the Federal Reserve’s inflation target, both early in the sample (2018) as well
as again at the very end of the sample (2021). But there were also periods during which those same
inflation forecasts were very close to the inflation target. Because inflation is subject to many
transient shocks, short-run expectations can be volatile even when they are ultimately anchored to
the inflation target. Long-run expectations can therefore speak to the question more directly since
they should be less sensitive to the effects of transitory inflation shocks. We report the long-run
inflation expectations from our survey in Table 5. In 2018Q4, the average long-run forecast among
firms was 3.7 percent. It fell to 2.3 percent in 2019Q4, closer to the inflation target, but rose again
to 3.3 percent in 2020Q4. These are therefore broadly similar to those of households, whose long-
run forecasts were consistently just under 3 percent over this time period. In contrast, the average
long-run inflation expectation across FOMC members was reassuringly 2.0 percent while the
average forecast of professionals remained very close to 2 percent. Unlike those agents, firms
therefore do not seem to have well-anchored inflation expectations by this metric and are much
more closely aligned with households.
Prediction 2: Beliefs should not be too dispersed across agents.
A limitation of the first definition of anchored inflation expectations is that it is possible for the
average expectation to be exactly equal to the target because half of agents expect high long-run
inflation while half of agents expect very low/negative long-run inflation, with very few actually
18
expecting the target to be achieved. Intuitively, one would not interpret this as inflation
expectations being well anchored. An additional restriction of anchored expectations is therefore
that the cross-sectional dispersion of forecasts be quite low. For example, Table 5 shows that the
dispersion of long-run forecasts among FOMC members is zero: they all agree that inflation will
be 2 percent in the long-run. Professional forecasters similarly display very little disagreement in
their long-run forecasts: the cross-sectional standard deviation in forecasts is around 0.2-0.3
percentage points. Households, in contrast, display pervasive disagreement about long-run
inflation: the dispersion in their forecasts is around 2.5 percentage points. Firms are again closer
to households in displaying significant disagreement about long-run inflation: the dispersion in
their forecasts ranges from about 1 to 2 percentage points, close to that of households and far more
than what is observed for professionals. By this second definition, it is again difficult to argue that
firms’ inflation expectations appear well-anchored.
Prediction 3: Agents show confidence in their forecasts
Suppose that all agents believe that inflation could be 4 percent with probability 0.5 or 0 percent
with probability 0.5. In this setting, the first two conditions describing anchored inflation
expectations would be satisfied, yet no specific individual would actually expect the target to be
achieved with much confidence, hardly a sign of anchored inflation expectations. One might
therefore impose an additional restriction for anchored expectations to be that agents are confident
in their forecasts. We can measure this in our survey through the question asking what probability
managers assign to inflation exceeding 5 percent over the next 12 months. Figure 2 plots the
resulting distribution of answers across the three waves when this question was asked (2019Q1,
2020Q1 and 2021Q1). Managers in 2019Q1 (Panel A of Figure 2) assigned a 25.2 percent
probability on average to the possibility that inflation would exceed five percent over the next

19
twelve months. Around 40 percent of respondents assigned very low probability (ten percent or
less) to this outcome, but the majority of respondents instead placed a positive probability to this
outcome. For comparison, the figure also plots the corresponding probability distributions for
households and professional forecasters respectively. The former are based on distributional
inflation questions asked of households participating in the New York Federal Reserve’s Survey of
Consumer Expectations (SCE) while the latter are from distributional questions asked of
participants in the Survey of Professional Forecasters. In both cases, the possible bins presented to
respondents only allow us to measure the probability that inflation would exceed 4 percent.
Professional forecasters essentially dismiss the possibility that inflation could exceed 4 percent over
the next twelve months. Households, on the other hand, view this as a realistic outcome: less than
30 percent are willing to dismiss this possibility out of hand and about half of households give this
outcome a probability of 30 percent or more. Again, the contrast between households and
professionals is striking, and firms present forecasts that are qualitatively much closer to those of
households along this metric as well.
Prediction 4: Agents should display small forecast revisions.
Kumar et al. (2015) propose another, related, characteristic of well-anchored expectations:
revisions in individuals’ inflation forecasts should tend to be small, since agents expect the central
bank to be able to keep inflation stable over long enough horizons. In Panel A of Figure 3, we plot
the distribution of revisions of managers’ 1-year-ahead and 5-year-ahead inflation forecasts from
our survey. Panels B and C plot corresponding distributions for households (from the MSC) and
professional forecasters (from the SPF) respectively for comparison. Professional forecasters
display very small revisions in their forecasts, at either long or short horizons, consistent with the
notion of anchored expectations. In contrast, households display very large revisions, both upward

20
and downward for both short and long horizons. The distributions of firms’ revisions in inflation
expectations again look broadly similar to that of households’ albeit somewhat less dispersed. The
average absolute size of the revisions in firms’ expectations (1.1 percent at the 12-month horizon
and 1.4 percent at the 5-year horizon) are smaller than those of households on average (2.5 percent
and 1.6 percent at the 1-year and 5-year horizons respectively) but are roughly an order of
magnitude larger than those observed for professional forecasters (0.4 percent and 0.2 percent at
the 1-year and 5-year horizons respectively). These numbers are again difficult to reconcile with
the notion that firms’ inflation expectations are anchored.
Prediction 5: There should be little comovement between revisions in long-run and short-run inflation expectations.
A final commonly used approach to assess whether expectations are anchored is to examine the
comovement of changes in short-run and long-run inflation expectations. The idea is that transitory
economic shocks can affect short-run expectations but not long-run inflation expectations when
expectations are anchored. The correlation between changes in the two sets of expectations should
therefore be very low. Panel A of Figure 4 shows a binscatter plot for the revisions to visualize
that this prediction does not hold for firms’ inflation expectations: there is a strong positive
relationship between managers’ long-run and short-run inflation expectations. The slope for the
relationship between changes in 1-year-ahead and 5-year-ahead inflation forecast is 0.71.8 Even
though one might expect to find a positive slope between revisions at the two horizons if shocks
to inflation are sufficiently persistent, this degree of pass-through from 1-year to 5-year
expectations is far too large to be reconcilable with empirical evidence on U.S. inflation persistence
(e.g., Stock and Watson 2007).
8 To maximize the sample size, we compute revisions for 1-year-ahead and 5-year-ahead inflation forecasts for each firm and then compute averages for each calendar year. We use the same approach for households and professional forecasters.

21
For comparison, Panels B and C in Figure 4 plot the corresponding correlations between
changes in one- and five-year-ahead inflation forecasts of households in the MSC and professional
forecasters in the SPF respectively. Even with the latter, there is a positive correlation between the
two sets of expectations, indicating that even professional forecasters believe that some shocks to
inflation have very long-lasting effects, a feature that is difficult to square with anchoring of
expectations. Households display a lower slope coefficient of 0.34 but the relationship between
short-run and long-run revisions is weaker (R2 is 0.11 while it is 0.62 for firms and 0.68 for
professional forecasters).
In summary, consistent with what was found by Kumar et al. (2015) for the managers of
firms in New Zealand, the inflation expectations of U.S. firms’ managers display little anchoring:
high and dispersed inflation expectations, high levels of uncertainty in their inflation forecasts,
large revisions in both short-run and long-run expectations, and a strong correlation between the
changes in short-run and long-run inflation expectations.
V What Determines Long-Run Expectations?
In typical monetary models used by central banks for policy analysis, agents’ long-run inflation
expectations are equal to the central bank’s target, which determines the steady-state rate of
inflation. But as documented in the previous section, this anchoring of inflation expectations is the
case neither for households nor firms in the U.S. If long-run inflation expectations are not pinned
down by the central bank’s inflation target, which forces then determine what firms believe about
longer-run inflation dynamics? One possibility is that firms have misconceptions about what level
of inflation the central bank is targeting but believe that the central bank will achieve its target.
This would be an environment in which the central bank has high credibility (agents believe it will
hit its target) but has failed to communicate its target (agents may have incorrect beliefs about the

22
target). Another possibility could be that firms do not perceive the central bank as credible, and
instead view long-run inflation as dependent on recent inflation shocks. Differences in beliefs
about long-run inflation would therefore stem from differences in beliefs about recent inflation. In
this environment, agents’ beliefs about the inflation target would be uncorrelated with their beliefs
about longer-run inflation and instead would be closer linked to their views about recent inflation.
In this section, we provide some tentative evidence on what lies behind the lack of
anchoring in firms’ inflation expectations. We do so by characterizing both their knowledge about
the Fed’s inflation target (and its perceived link to longer-run inflation) as well as their perceptions
of recent inflation and the extent to which those translate into longer-run inflation movements.
Both are ultimately explanations built on inattention by firms: inattention to the central bank’s
inflation target in one explanation and inattention to recent inflation in the other.
In the April waves, managers were asked about what inflation rate they thought the Federal
Reserve was trying to achieve on average. We report the resulting distribution of responses to that
question in Table 6 for each wave. The response rate to this question is generally low. For example,
in the first wave (2018Q2), 65 percent of survey respondents answered that they did not know. Of
those who answered, the average response was 2.9 percent, much higher than the correct answer
of 2 percent. Only 15.8 percent of managers responded with an answer between 1.5 and 2.5
percent. Similar results obtained in the 2019Q2, 2020Q2, and 2021Q2 waves that included this
question, with relatively few respondents able to provide an answer or one close to the correct
value. This mirrors results for U.S. households: less than 20 percent of surveyed participants in the
Nielsen Homescan Panel gave answers in the correct range of 1.5-2.5 percent. Comparable results
for professional forecasters are not available since this question is not asked them, putatively
because they are all expected to be fully aware of the Federal Reserve’s inflation target.
Interestingly, the share of firms reporting a usable numeric inflation target increased from 31
23
percent in 2018Q2 to 65 percent in 2021Q2, when concerns about future inflation were extensively
covered by the media (see Appendix Figure 2). As we discuss below, this pattern is consistent with
state-dependence in how much attention managers allocate to tracking aggregate inflation rate.
Although Table 6 makes clear that most firms do not know the specific inflation rate that
the Federal Reserve is targeting, can these differences in views about the inflation target explain
the dispersion in opinions about long-run inflation among U.S. firms? Figure 5 plots a binscatter
of the relationship between firms’ beliefs about the inflation target against their beliefs about
longer-run inflation. There is a clear positive relationship, indicating that managers who believe
the Fed is targeting higher levels of inflation also tend to think inflation will be higher in the future,
consistent with some perceived credibility of the central bank. While the slope coefficient is much
less than one (approximately 0.29), the explanatory power of the perceived inflation target is quite
high, with an R2 of 0.60. The correlation between perceived inflation targets and firms’ one-year-
ahead inflation forecasts is similar. Differential beliefs about the inflation target therefore seem
like one likely source behind the disparities in firms’ longer-run inflation forecasts.
A second potential explanation stems from inattention to recent inflation dynamics: if firms
have different perceptions about what has happened to inflation recently and believe inflation is
subsequently persistent, this could potentially account for differential beliefs about long-run
inflation. Figure 6 plots the distribution of firm beliefs about inflation over the previous 12 months
in each of the four waves when this question was asked, along with the actual inflation rate at the
time. We can immediately observe significant dispersion in perceptions about recent inflation,
even though this information is publicly and freely available. This indicates that inattention to
recent inflation is pervasive among firms, as proposed in rational inattention models such as Sims
(2003), Mackowiak and Wiederholt (2009), Afrouzi (2019), and Yang (2020). Figure 7 then plots
a binscatter of the relationship between firms’ perceptions about recent inflation versus their
24
beliefs about long-run future inflation. The explanatory power of perceived inflation is quite high,
with an R2 of 0.46 and a statistically significant positive relationship between the two measures.
One might imagine that firms’ beliefs about recent inflation and their beliefs about the
inflation target are themselves not uncorrelated: managers who believe the Fed targets a high rate
of inflation may be more likely to think that inflation has recently been high and vice-versa. As a
result, we want to consider the joint effect of these beliefs in accounting for firms’ inflation
expectations. We do so by regressing firms’ 5-year-ahead and 1-year-ahead inflation expectations
respectively on their perceived level of inflation and their beliefs about the inflation target
aggregated to the annual frequency. We report results from OLS and Huber-robust regressions for
each in Table 7. With short-run (12-month-ahead) expectations, Huber-robust estimates suggest a
somewhat stronger role for the perceived Fed target than the perceived inflation. With longer-run
expectations, the differences are even crisper: the perceived Fed target seems to have the strongest
predictive power. We find little additional role for the inflation rate in the firm’s sector in driving
firms’ aggregate inflation expectations. In a quantitative sense, differences in firms’ beliefs about
longer-run inflation are therefore more strongly tied to differences in firms’ perceptions of the
long-run inflation target of the Federal Reserve. At the same time, the broader picture that emerges
from Table 7 is one in which firms recognize that recent changes in inflation may be persistent—
and therefore still present within 12 months—but view these as relatively transitory, such that their
long-run inflation expectations are primarily a reflection of their perceived inflation target of the
Federal Reserve. As a result, firms’ inflation expectations are shaped by both their inattention to
recent inflation dynamics as well as their inattention to the longer-run objectives of the central
bank, with the relative importance of the two potentially changing over the forecasting horizon.
How should we interpret the systematic inattention that firms pay to inflation and monetary
policy, as well as the resulting unanchored inflation expectations that they report? First, it is worth

25
emphasizing that U.S. firms are not alone in this respect. Surveys of firms in other advanced
economies have similarly found firms’ aggregate inflation forecasts to appear disconnected from
recent inflation dynamics and actual monetary policy objectives, e.g., in New Zealand (Coibion,
Gorodnichenko and Kumar 2018), Switzerland (Hunziker et al. 2018), France (Andrade et al.
2020), etc. Second, this characteristic does not extend to all countries. Evidence from developing
economies with a history of high and volatile inflation indicates that firms there are much more
attentive to inflation and monetary policy, as illustrated in Uruguay (Frache and Lluberas 2019,
Borraz, Mello, and Zacheo 2020), Ukraine (Coibion and Gorodnichenko 2015a), or Iran (Afrouzi
et al. 2021). This suggests that the now-long history of low and stable inflation in most advanced
economies has removed much of the incentive that firms may have had to pay much attention to
monetary policy and inflation.
Indeed, other recent survey evidence confirms this point. In October 2015, the Atlanta Fed
BIE survey asked firms to indicate what level of influence the inflation rate and other factors such
as labor costs or sales levels have on their pricing decisions. 38 percent of the firms responded that
the aggregate inflation rate had a significant level of influence. For comparison, the fraction of
firms that assigned the same (significant) level of influence to other factors was: industry trends
(52 percent), labor costs (51 percent), non-labor costs (48 percent), sales levels (48 percent),
margin adjustments (36 percent) and productivity (25 percent). In another wave of the BIE
implemented in November 2015, approximately 55 percent of the firms responded that forecasts
of future aggregate inflation occasionally affect the prices that they set while approximately 15
percent of the firms responded that these forecasts often affect their pricing decisions. In the long
list of factors that managers must pay attention to in guiding their firms, aggregate inflation is not
a top priority in advanced economies like the U.S. This relegation in priority is then reflected in
firms’ knowledge about aggregate inflation and the resulting inflation forecasts that they report.

26
But the fact that inflation is not a priority in managers’ eyes does not mean that it is
irrelevant to their decisions. In fact, a growing body of work documents how changes in the
inflation expectations of firms do in fact alter their economic decisions. Two examples include
Coibion, Gorodnichenko and Kumar (2018) for firms in New Zealand and Coibion,
Gorodnichenko and Ropele (2020) for firms in Italy. In each case, exogenously provided
information about inflation to a subset of firms leads them to alter their inflation expectations
relative to a control group, and this variation in inflation expectations is then found to have
persistent effects on, at a minimum, the employment and investment decisions of firms.
Reconciling the fact that firms do not find it worthwhile to keep track of inflation with the fact that
it still enters their decision-making process requires the profit function of firms to be quite (but not
perfectly) flat with respect to information about inflation.
VI Conclusion
We present results from a new Survey of Firms’ Inflation Expectations (SoFIE) in the U.S. This
survey is representative, quantitative in nature, and available over an increasingly long sample. We
document that U.S. firms’ inflation expectations deviate from those of households and professional
forecasters over time, although they exhibit many of the qualitative features of household
expectations. Like the latter, the inflation expectations of U.S. firms are anything but anchored.
These results can be useful along several dimensions. Most practically, it provides the first
consistent real-time measure of firms’ inflation expectations in the U.S. This can be an invaluable
input into the central bank decision-making process, which has long emphasized the importance of
measuring firms’ inflation expectations. For example, firms’ inflation expectations stand at nearly 5
percent currently (2021Q3), potentially a red flag for the Fed and a reason for monetary tightening.
In addition, having a measure of firms’ inflation expectations can be used to study the expectations

27
formation process of firms, an important component of any macroeconomic model. By
complementing surveys of other types of agents available, SoFIE therefore fills an important gap.
More generally, this survey contributes to a growing list of surveys of firms around the
world which will provide researchers with new insight on how the expectations of CEOs, managers
and executives affect their decision-making. The inherent forward-looking nature of most firm
decisions, such as price-setting, employment, and capital expenditures, implies a key role for
expectations about the future. These new surveys of firms’ expectations will therefore enable
economists to better understand how these expectations are formed as well as the extent and
manner in which they affect decisions.
References
Afrouzi, Hassan, Saeed Bayat, Omid Ghaderi and Ali Madanizadeh, 2021. “Inflation Expectations
under High Inflation: Evidence from Iran,” Manuscript.
Afrouzi, Hassan and Choongryul Yang, 2020. “Dynamic Inattention, the Phillips Curve, and
Forward Guidance” Working Paper.
Afrouzi, Hassan, 2019. “Strategic Inattention, Inflation Dynamics, and the Non-Neutrality of
Money,” CESifo Working Paper #8218.
Altig, David, Jose Maria Barrero, Nicholas Bloom, Steven J. Davis, Brent Meyer, and Nicholas
Parker, 2019. “Surveying Business Uncertainty.” Federal Reserve Bank of Atlanta
Working Paper 2019-13b.
Alvarez, Fernando E., Francesco Lippi, and Luigi Paciello, 2011. “Optimal Price Setting with
Observation and Menu Costs.” Quarterly Journal of Economics 126(4): 1909-60.
Andrade, Philippe, and Hervé Le Bihan, 2013. “Inattentive professional forecasters,” Journal of
Monetary Economics 60(8): 967-982.
Andrade, Philippe, Olivier Coibion, Erwan Gautier, and Yuriy Gorodnichenko, 2020. “No Firm is
an Island? How Industry Conditions Shape Firms’ Aggregate Expectations,” forthcoming
in Journal of Monetary Economics.

28
Angeletos, George-Marios, and Chen Lian, 2018. “Forward Guidance without Common
Knowledge.” American Economic Review 108 (9): 2477-2512.
Angeletos, George-Marios, Zhen Huo, and Karthik Sastry, 2020. “Imperfect Macroeconomic
Expectations: Evidence and Theory,” NBER Macroeconomics Annual 2020 (35), Martin
Eichenbaum and Erik Hurst, editors.
Bholat, David, Nida Broughton, Janna Meer Ter, and Eryk Walczak, 2019. “Enhancing central
bank communications using simple and relatable information,” Journal of Monetary
Economics 108(C), 1-15.
Binder, Carola, 2017a. “Measuring uncertainty based on rounding: New method and application
to inflation expectations,” Journal of Monetary Economics 90(C): 1-12.
Binder, Carola, 2017b. “Fed Speak on Main Street: Central Bank Communication and Household
Expectations,” Journal of Macroeconomics 52: 238-251.
Blinder, Alan S., 2009. “Talking about Monetary Policy: The Virtues (and Vices?) of Central Bank
Communication,” in BIS 7th Annual Conference volume, 2009.
Blinder, Alan S., Michael Ehrmann, Marcel Fratzscher, Jakob De Haan, and David-Jan Jansen,
2008. “Central Bank Communication and Monetary Policy: A Survey of Theory and
Evidence.” Journal of Economic Literature 46(4): 910-45.
Bordalo Pedro, Nicola Gennaioli, and Andrei Shleifer, 2018. “Diagnostic Expectations and Credit
Cycles,” Journal of Finance 73(1): 199-227.
Borraz, Fernando, Miguel Mello, and Laura Zacheo, 2020. “Communication, Information and
Inflation Expectations.” BIS CCA Research Network.
Candia, Bernardo, Olivier Coibion, and Yuriy Gorodnichenko, 2020. “Communication and the
Beliefs of Economic Agents,” NBER Working Papers 27800.
Coibion, Olivier, and Yuriy Gorodnichenko, 2012. “What can survey forecasts tell us about
informational rigidities?” Journal of Political Economy 120: 116-159.
Coibion, Olivier, and Yuriy Gorodnichenko, 2015a. “Inflation Expectations in Ukraine: A Long
Path to Anchoring?,” Visnyk of the National Bank of Ukraine, National Bank of Ukraine,
issue 233, pages 6-23.
Coibion, Olivier, and Yuriy Gorodnichenko, 2015b. “Information Rigidity and the Expectations
Formation Process: A Simple Framework and New Facts,” American Economic Review
105: 2644–2678.

29
Coibion, Olivier, Dimitris Georgarakos, Yuriy Gorodnichenko, and Maarten van Rooij, 2019.
“How Does Consumption Respond to News about Inflation? Field Evidence from a
Randomized Control Trial,” NBER Working Paper 26106.
Coibion, Olivier, Yuriy Gorodnichenko and Michael Weber, 2019. “Monetary Policy
Communications and their Effects on Household Inflation Expectations,” NBER Working
Paper 25482.
Coibion, Olivier, Yuriy Gorodnichenko, and Michael Weber, 2020. “Macroeconomic expectations
of U.S. managers: Evidence from a household survey,” work in progress.
Coibion, Olivier, Yuriy Gorodnichenko, and Saten Kumar, 2018. “How Do Firms Form Their
Expectations? New Survey Evidence,” American Economic Review 108: 2671-2713.
Coibion, Olivier, Yuriy Gorodnichenko, and Tiziano Ropele, 2020. “Inflation Expectations and Firm
Decisions: New Causal Evidence,” Quarterly Journal of Economics 135(1): 165–219.
Coibion, Olivier, Yuriy Gorodnichenko, Saten Kumar and Mathieu Pedemonte, 2020. “Inflation
Expectations as a Policy Tool?” Journal of International Economics 124: 103297.
Coibion, Olivier, Yuriy Gorodnichenko, Saten Kumar, and Jane Ryngaert, 2021. “Do You Know
That I Know That You Know...? Higher-Order Beliefs in Survey Data,” Quarterly Journal
of Economics 136(3): 1387–1446.
Farhi, Emmanuel, and Iván Werning, 2019. “Monetary Policy, Bounded Rationality, and
Incomplete Markets.” American Economic Review 109(11): 3887-3928.
Friedman, Milton. 1968. “The Role of Monetary Policy.” American Economic Review 58(1): 1–17.
Frache, Serafin and Rodrigo Lluberas, 2019. “New Information and Inflation Expectations among
Firms,” BIS Working Papers 781.
Fuhrer, Jeffrey C., 2018. “Intrinsic Expectations Persistence: Evidence from Professional and
Household Survey Expectations.” Working Papers 18-9, Federal Reserve Bank of Boston.
Gabaix, Xavier, 2020. “A Behavioral New Keynesian Model.” American Economic Review
110(8): 2271-2327.
Gabaix, Xavier, 2014. “A Sparsity-Based Model of Bounded Rationality.” Quarterly Journal of
Economics 129(4): 1661-1710.
Galí, Jordi, and Mark Gertler, 1999. “Inflation Dynamics: A Structural Econometric
Analysis.” Journal of Monetary Economics 44 (2): 195-222.
Gorodnichenko, Yuriy, 2008. “Endogenous Information, Menu Costs and Inflation Persistence.”
Working Paper no. 14184. Cambridge, Mass.: National Bureau of Economic Research.

30
Haldane, Andrew, Alistair Macaulay, and Michael McMahon, 2020. “The 3 E’s of Central Bank
Communication with the Public,” Bank of England Working Paper No. 847.
Haldane, Andrew, and Michael McMahon, 2018. “Central Bank Communications and the General
Public,” American Economic Association Papers and Proceedings 108: 578-583.
Haubrich, Pennacchi, and Ritchken, 2012. “Inflation Expectations, Real Rates, and Risk Premia:
Evidence from Inflation Swaps.” Review of Financial Studies 25(5): 1588–1629.
Hunziker, Hans-Ueli, Christian Raggi, Rina Rosenblatt-Wisch, and Attilio Zanetti, 2018. “The
impact of guidance, short-term dynamics and individual characteristics on firms’ long-term
inflation expectations,” SNB Working Papers 18/2018.
Kamdar, Rupal, 2018. “The Inattentive Consumer: Sentiment and Expectations” Manuscript.
Kumar, Saten, Hassan Afrouzi, Olivier Coibion, and Yuriy Gorodnichenko, 2015. “Inflation
Targeting Does Not Anchor Inflation Expectations: Evidence from Firms in New Zealand,”
Brookings Papers on Economic Activity 2015 (Fall): 151-225.
Lamla, Michael J., and Dmitri V. Vinogradov, 2019. “Central bank announcements: Big news for
little people?” Journal of Monetary Economics 108(C): 21-38.
Lucas, Robert E., 1972. “Expectations and the Neutrality of Money.” Journal of Economic
Theory 4 (2): 103-124.
Maćkowiak, Bartosz, and Mirko Wiederholt, 2009. “Optimal Sticky Prices under Rational
Inattention.” American Economic Review 99(3): 769-803.
Mankiw, N. Gregory, and Ricardo Reis, 2002. “Sticky Information versus Sticky Prices: A
Proposal to Replace the New Keynesian Phillips Curve.” Quarterly Journal of
Economics 117 (4): 1295-1328.
Mankiw, N. Gregory, Ricardo Reis, and Justin Wolfers, 2003. “Disagreement about Inflation
Expectations.” In NBER Macroeconomics Annual 2003(18): 209-248.
Matějka, Filip, 2016. “Rationally Inattentive Seller: Sales and Discrete Pricing.” The Review of
Economic Studies 83(3): 1125–1155.
Meyer, Brent, Nicholas Parker, and Xuguang Sheng, 2021. “Unit Cost Expectations and Uncertainty:
Firms’ Perspectives on Inflation.” Federal Reserve Bank of Atlanta Working Paper.
Meyer, Brent, Brian Prescott and Xuguang Simon Sheng, 2020. “The Impact of the COVID-19
Pandemic on Business Expectation,” Available at SSRN:
https://ssrn.com/abstract=3690489 or http://dx.doi.org/10.2139/ssrn.3690489.

31
Nimark, Kristoffer P., 2014. “Man-Bites-Dog Business Cycles,” American Economic Review
104(8): 2320-2367.
Pedemonte, Mathieu, 2020. “Fireside Chats: Communication and Consumers’ Expectations in the
Great Depression,” UC Berkeley, manuscript.
Phelps, Edmund S., 1968. “Money-wage dynamics and labor-market equilibrium.” Journal of
Political Economy 76(4, Part 2): 678-711.
Reis, Ricardo, 2020. “Imperfect Macroeconomic Expectations: Yes, But, We Disagree,”
manuscript.
Reis, Ricardo, 2006. “Inattentive Producers,” Review of Economic Studies 73(3): 793-821.
Savignac, Frédérique, Erwan Gautier, Yuriy Gorodnichenko and Olivier Coibion, 2021. “Firms’
Inflation Expectations: New Evidence from France.” Manuscript.
Sims, Christoper A., 2003. “Implications of Rational Inattention.” Journal of Monetary
Economics 50 (3): 665-690.
Stock, James H., and Mark W. Watson, 2007. “Why Has U.S. Inflation Become Harder to
Forecast?” Journal of Money, Credit and Banking 39(s1): 3-33.
Woodford, Michael, 2002. “Imperfect Common Knowledge and the Effects of Monetary Policy.” In
Knowledge, Information, and Expectations in Modern Macroeconomics: In Honor of Edmund
S. Phelps, editors P. Aghion, R. Frydman, J. Stiglitz, and M. Woodford, Princeton: Princeton
University Press.
Woodford, Michael, 2003. Interest and Prices: Foundations of a Theory of Monetary Policy.
Princeton University Press.
Yang, Choongryul, 2020. “Multiproduct pricing.” Manuscript.
32
Table 1. Distribution of firms by sector and size.
Survey (SoFIE) Actual US by: Large Medium Small Total count payroll Industry (1) (2) (3) (4) (5) (6) Basic Metals 0.93 3.30 4.98 9.21 1.26 1.87 Chemicals & Plastics 1.80 3.61 3.11 8.53 0.47 2.15 Electrical 0.87 2.43 4.98 8.28 0.37 1.68 Financial Intermediation 1.31 1.93 3.36 6.60 5.51 12.05 Food & Drink 1.18 2.05 1.43 4.67 0.71 1.49 Hotels & Restaurants 1.12 0.75 0.93 2.80 12.21 5.15 Mechanical Engineering 0.44 2.36 3.86 6.66 0.49 1.23 Other Manufacturing 1.00 2.92 3.80 7.72 1.68 1.71 Other Services 3.86 4.98 3.61 12.45 36.33 26.29 Post & Telecommunication 0.37 0.31 0.87 1.56 1.75 6.25 Renting & Business Activities 3.48 5.97 8.90 18.36 34.11 32.67 Textiles & Clothing 0.06 0.19 0.44 0.68 0.35 0.24 Timber & Paper 0.56 1.00 1.31 2.86 0.35 0.74 Transport Manufacturing 1.43 2.61 2.55 6.60 0.22 1.98 Transport & Storage 0.50 1.31 1.24 3.05 4.20 4.51 Total 18.92 35.72 45.36 100.00 100.00 100.00 US actual by count 1.50 11.16 87.34 100.00 US actual by payroll 68.33 19.81 11.87 100.00
Notes: the authors’ calculations. U.S. actuals are from the Census Bureau’s Statistics of US Businesses (SUSB).

33
Table 2. Inflation Forecasts of Firm Managers and Other Agents for the United States.
Survey wave Survey Date
Recent data
1-Year-Ahead Inflation Forecasts
Central Bank Professional forecasters Households Firms (SoFIE)
Mean SD Mean SD Mean SD Mean SD N (1) (2) (3) (4) (5) (6) (7) (8) (9) (10)
1 2018Q2 2.5 2.1 0.15 2.4 0.4 3.4 3.0 3.6 1.9 189 2 2018Q3 2.9 2.0 0.10 2.3 0.4 3.6 3.3 2.9 1.5 191 3 2018Q4 2.5 1.9 0.30 2.3 0.3 3.5 3.2 3.4 1.6 234 4 2019Q1 1.5 1.9 0.10 2.3 0.3 3.1 2.9 3.0 1.0 292 5 2019Q2 2.0 1.7 0.10 2.1 0.3 3.3 3.1 2.1 1.1 301 6 2019Q3 1.8 1.8 0.18 2.1 0.3 3.4 3.2 2.3 0.5 192 7 2019Q4 1.8 1.9 0.10 2.1 0.3 3.1 3.0 2.1 1.3 207 8 2020Q1 2.5 - - 2.1 0.4 2.9 2.9 2.2 0.9 231 9 2020Q2 0.0 1.2 0.35 1.8 0.7 4.0 4.0 2.0 1.5 127
10 2020Q3 1.0 1.6 0.28 1.6 1.1 3.8 3.7 2.0 1.2 328 11 2020Q4 1.2 1.8 0.20 2.1 0.5 3.4 3.5 2.3 1.0 330 12 2021Q1 1.4 2.3 0.23 2.2 0.3 4.1 3.8 2.9 2.2 408 13 2021Q2 4.2 2.8 0.40 2.5 0.5 4.7 3.8 3.2 1.3 416 14 2021Q3 5.3 - - 2.5 0.8 5.0 3.8 4.7 2.1 230
Notes: The table reports mean and standard deviation (SD) for 12-month-ahead inflation expectations (point predictions) as well as actual inflation rate. Data are for the first month of each quarter. Recent data (column 1) shows CPI inflation rate over the last 12 months. Central Bank forecasts (columns 2 and 3) are from the Summary of Economic Projections of Federal Reserve Board Members and Federal Reserve Bank Presidents. Inflation expectations are reported for PCE inflation. SD in column (3) is the upper end of the central tendency (excludes the three highest projections) minus the lower end of the central tendency (excludes the three lowest projections). 12-month-ahead forecast is constructed as a weighted average of current and next-year projects where weights are the number of quarters from each year one needs to take to cover the next 12 months. Professional forecasters’ expectations (columns 4 and 5) are from the Survey of Professional Forecasters. Households’ expectations (columns 6 and 7) are from the Michigan Survey of Consumers (MSC). We exclude responses of consumers that are greater than 15 percent or less than -2 percent. Firms’ inflation expectations (columns 8 and 9) are from the authors’ survey. We exclude responses of firms’ managers that are greater than 15 percent or less than -2 percent. All moments are computed using survey weights. Results for nontruncated data and without sampling weights are reported in Appendix Table Al.
34
Table 3. Inflation Forecast Variation by Size and Industry
Dependent variable: one-year-ahead inflation forecast
(1) (2) (3) Firm Size [omitted category: Large]
Medium -0.092 -0.097 (0.087) (0.087) Small -0.001 -0.000
(0.116) (0.119) Sector [omitted category: Basic Metals]
Chemicals & Plastics 0.219 0.206 (0.176) (0.177) Electrical -0.132 -0.151 (0.221) (0.223) Financial Intermediation -0.245* -0.273** (0.132) (0.138) Food & Drink 0.534*** 0.516** (0.201) (0.203) Hotels & Restaurants 0.028 0.017 (0.151) (0.152) Mechanical Engineering 0.284 0.287 (0.231) (0.231) Other Manufacturing 0.281* 0.275* (0.159) (0.160) Other Services 0.146 0.128 (0.128) (0.127) Post and Telecommunication 0.711* 0.682* (0.388) (0.385) Renting & Business Activities 0.217 0.203 (0.138) (0.136) Textiles & Clothing -0.197 -0.209 (0.362) (0.369) Timber & Paper 0.069 0.049 (0.149) (0.151) Transport Manufacturing -0.059 -0.089 (0.206) (0.209) Transport & Storage -0.281 -0.291
(0.189) (0.191) Observations 3,676 3,676 3,676 R-squared 0.189 0.211 0.212
Notes: Fixed effects for survey waves are included but not reported. We exclude responses of firms’ managers that are greater than 15 percent or less than -2 percent. Sampling weights are used in estimation. Robust standard errors in parentheses. ***, **, * indicate statistical significance at 1, 5 and 10 percent.
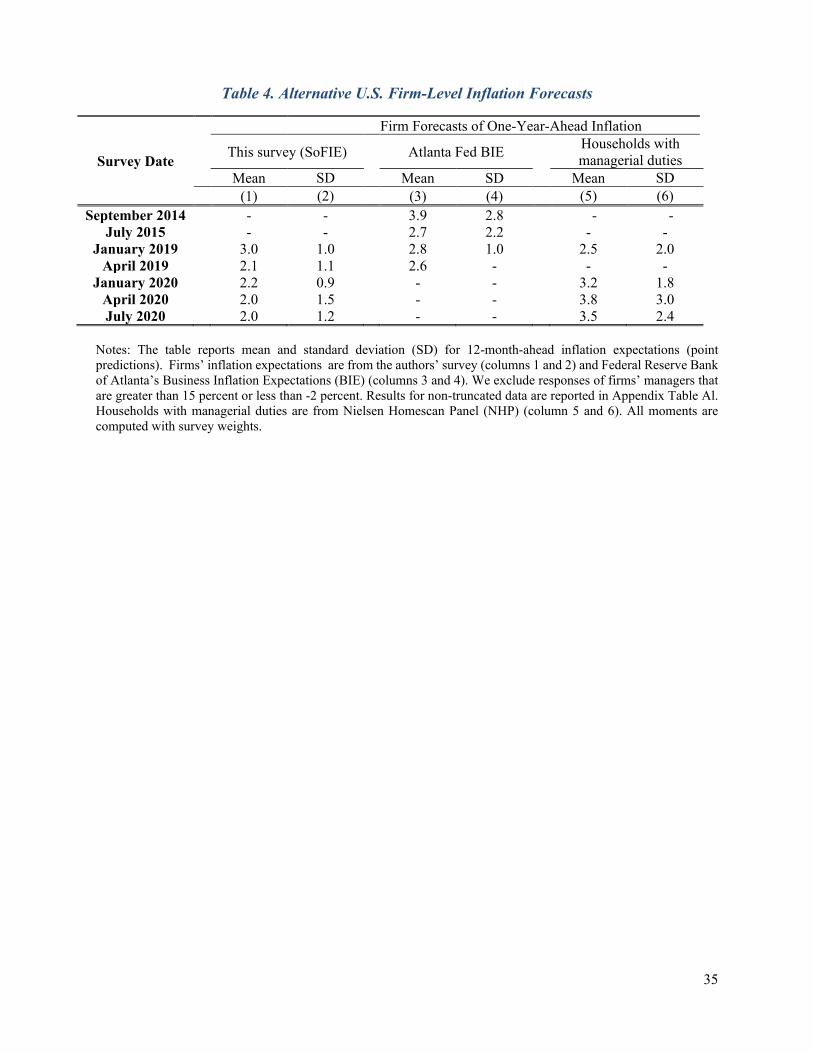
35
Table 4. Alternative U.S. Firm-Level Inflation Forecasts
Survey Date
Firm Forecasts of One-Year-Ahead Inflation
This survey (SoFIE) Atlanta Fed BIE Households with managerial duties
Mean SD Mean SD Mean SD (1) (2) (3) (4) (5) (6)
September 2014 - - 3.9 2.8 - - July 2015 - - 2.7 2.2 - -
January 2019 3.0 1.0 2.8 1.0 2.5 2.0 April 2019 2.1 1.1 2.6 - - -
January 2020 2.2 0.9 - - 3.2 1.8 April 2020 2.0 1.5 - - 3.8 3.0 July 2020 2.0 1.2 - - 3.5 2.4
Notes: The table reports mean and standard deviation (SD) for 12-month-ahead inflation expectations (point predictions). Firms’ inflation expectations are from the authors’ survey (columns 1 and 2) and Federal Reserve Bank of Atlanta’s Business Inflation Expectations (BIE) (columns 3 and 4). We exclude responses of firms’ managers that are greater than 15 percent or less than -2 percent. Results for non-truncated data are reported in Appendix Table Al. Households with managerial duties are from Nielsen Homescan Panel (NHP) (column 5 and 6). All moments are computed with survey weights.
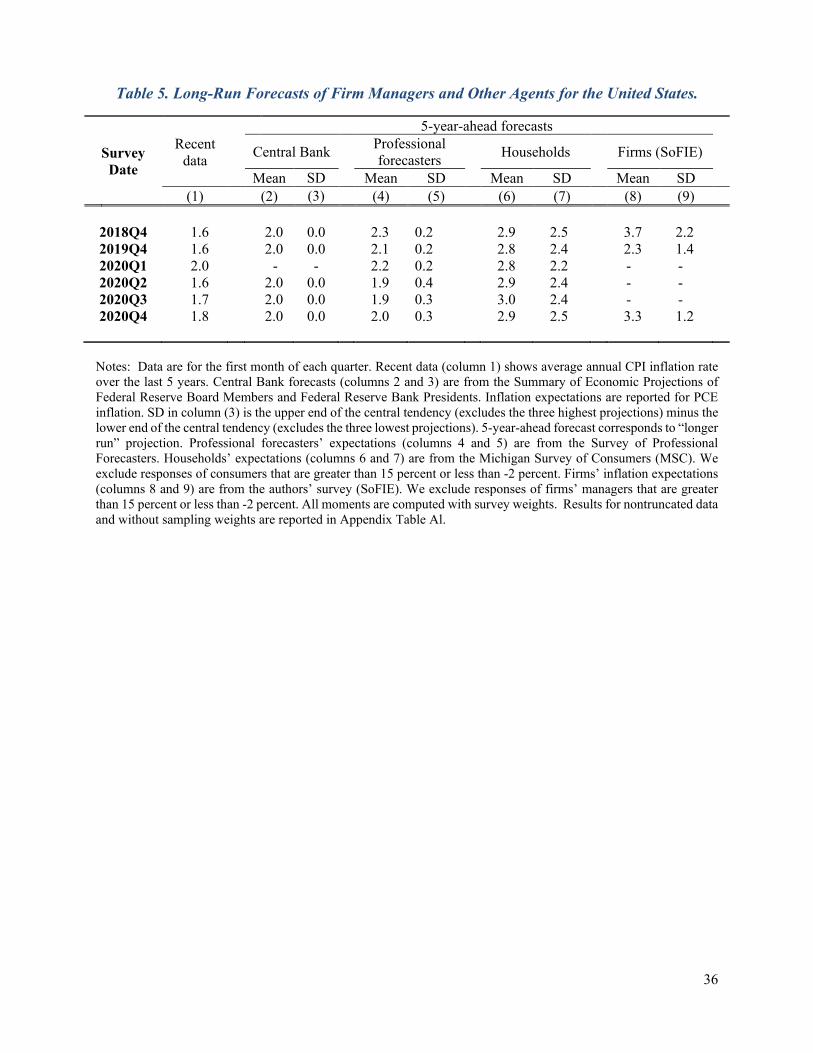
36
Table 5. Long-Run Forecasts of Firm Managers and Other Agents for the United States.
Survey Date
Recent data
5-year-ahead forecasts
Central Bank Professional forecasters Households Firms (SoFIE)
Mean SD Mean SD Mean SD Mean SD (1) (2) (3) (4) (5) (6) (7) (8) (9)
2018Q4 1.6 2.0 0.0 2.3 0.2 2.9 2.5 3.7 2.2 2019Q4 1.6 2.0 0.0 2.1 0.2 2.8 2.4 2.3 1.4 2020Q1 2.0 - - 2.2 0.2 2.8 2.2 - - 2020Q2 1.6 2.0 0.0 1.9 0.4 2.9 2.4 - - 2020Q3 1.7 2.0 0.0 1.9 0.3 3.0 2.4 - - 2020Q4 1.8 2.0 0.0 2.0 0.3 2.9 2.5 3.3 1.2
Notes: Data are for the first month of each quarter. Recent data (column 1) shows average annual CPI inflation rate over the last 5 years. Central Bank forecasts (columns 2 and 3) are from the Summary of Economic Projections of Federal Reserve Board Members and Federal Reserve Bank Presidents. Inflation expectations are reported for PCE inflation. SD in column (3) is the upper end of the central tendency (excludes the three highest projections) minus the lower end of the central tendency (excludes the three lowest projections). 5-year-ahead forecast corresponds to “longer run” projection. Professional forecasters’ expectations (columns 4 and 5) are from the Survey of Professional Forecasters. Households’ expectations (columns 6 and 7) are from the Michigan Survey of Consumers (MSC). We exclude responses of consumers that are greater than 15 percent or less than -2 percent. Firms’ inflation expectations (columns 8 and 9) are from the authors’ survey (SoFIE). We exclude responses of firms’ managers that are greater than 15 percent or less than -2 percent. All moments are computed with survey weights. Results for nontruncated data and without sampling weights are reported in Appendix Table Al.

37
Table 6. Perceived Fed Inflation Target and Managers’ Inflation Forecasts.
Perceived Inflation target of the Fed
Firms (SoFIE) Households (Nielsen Homescan Panel)
2018Q2 2019Q2 2020Q2 2021Q2 2018Q2 2018Q3 2018Q4 (1) (2) (3) (4) (5) (6) (7)
Average 2.9 2.2 1.8 2.8 3.7 3.9 4.2 St. Dev. 1.4 0.9 0.8 1.1 2.6 3.3 3.2
Distribution, share (%)
(-∞, 0.5] 0.04 1.25 1.06 0.26 1.45 12.14 8.25 (0.5, 1.5] 1.57 13.06 11.20 1.79 3.35 3.65 3.12 (1.5, 2.5] 15.77 33.23 17.00 27.51 16.33 15.29 15.00 (2.5, 3.5] 8.48 10.61 2.99 24.94 11.30 11.05 11.24 (3.5, 4.5] 0.77 5.05 0.02 5.44 3.39 5.64 4.97 (4.5, 5.5] 1.66 0.65 0.04 5.05 6.48 9.01 9.92 (5.5, 6.5] 1.95 0.02 0.00 0.06 0.70 1.95 1.35 (6.5, 7.5] 0.00 0.00 0.21 0.09 0.67 0.88 1.04 (7.5, 8.5] 0.35 0.00 0.00 0.00 0.47 1.86 1.69 (8.5, 9.5] 0.00 0.00 0.00 0.00 0.19 0.21 0.16 (9.5, +∞) 0.45 0.01 0.00 0.20 15.28 38.33 43.26
DNK 64.83 12.63 27.70 17.00 40.37 - - NA 4.12 23.49 39.79 17.65 - - -
Notes: Results in columns (1)-(4) are from the authors’ survey. The survey question is “What annual inflation rate do you think the U.S. Federal Reserve is trying to achieve on average?”. Results in columns (5)-(7) are for households participating in the Nielsen Homescan Panel. The survey question is “What is your best guess about the annual inflation rate that the Federal Reserve tries to achieve on average over long periods of time? Please use a percent between -100 and 100)”. In the 2018Q2 wave (column 5), households were allowed to choose “do not know” option. In other waves, this option was not available. When computing averages and standard deviations, we exclude responses that are less than 2 percent or greater than 15 percent. DNK stands for “do not know” or “prefer not to answer.” NA stands for “not available” or “unusable response,” i.e., a respondent did not provide an estimate or a usable numeric estimate for the inflation target.
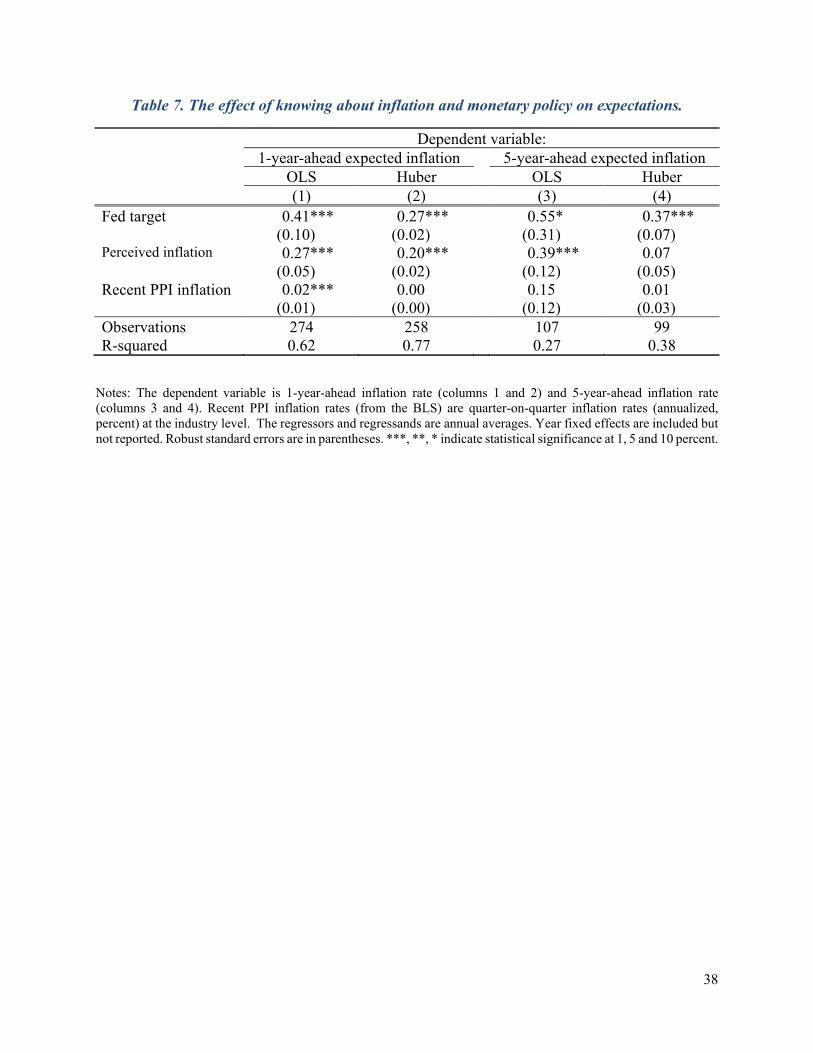
38
Table 7. The effect of knowing about inflation and monetary policy on expectations.
Dependent variable: 1-year-ahead expected inflation 5-year-ahead expected inflation OLS Huber OLS Huber (1) (2) (3) (4) Fed target 0.41*** 0.27*** 0.55* 0.37*** (0.10) (0.02) (0.31) (0.07) Perceived inflation 0.27*** 0.20*** 0.39*** 0.07 (0.05) (0.02) (0.12) (0.05) Recent PPI inflation 0.02*** 0.00 0.15 0.01 (0.01) (0.00) (0.12) (0.03) Observations 274 258 107 99 R-squared 0.62 0.77 0.27 0.38
Notes: The dependent variable is 1-year-ahead inflation rate (columns 1 and 2) and 5-year-ahead inflation rate (columns 3 and 4). Recent PPI inflation rates (from the BLS) are quarter-on-quarter inflation rates (annualized, percent) at the industry level. The regressors and regressands are annual averages. Year fixed effects are included but not reported. Robust standard errors are in parentheses. ***, **, * indicate statistical significance at 1, 5 and 10 percent.

39
Figure 1. One-Year-Ahead Inflation Expectations for Different Agents.
Notes: Financial markets’ expectations are from the Federal Reserve Bank of Cleveland, households’ expectations are from the Michigan Survey of Consumers (MSC) and professional forecasters’ expectations are from the Survey of Professional Forecasters run by the Federal Reserve Bank of Philadelphia. We exclude responses of households that are greater than 15 percent or less than -2 percent. Firms’ expectations are from our new survey of CEOs. We exclude responses that are greater than 15 percentage points or less than -2 percentage points. All moments are computed using survey weights.
02
46
8pe
rcen
t per
yea
r
1980 1985 1990 1995 2000 2005 2010 2015 2020
Asset Prices (Cleveland Fed)Households (MSC)Professional Forecasters (SPF)Firms (SoFIE)
Panel A: Mean forecast0
12
34
5st
anda
rd d
evia
tion
1980 1985 1990 1995 2000 2005 2010 2015 2020
Panel B: Disagreement (standard deviation)

40
Figure 2. Uncertainty in Inflation Forecasts.
Notes: SoFIE reports the distribution of the probability that inflation over the next 12 months will exceed 5% while SCE and SPF report the distribution of the probability that inflation over the next 12 months will exceed 4%. Panel A shows results for 2019Q1, panel B shows results for 2020Q1, while panel C shows results for 2021Q1. The distributions are computed using survey weights. Sources: Authors’ survey of United States firms (SoFIE), Federal Reserve Bank of New York’s Survey of Consumer Expectations (SCE) and Federal Reserve Bank of Philadelphia’s Survey of Professional Forecasters (SPF).
0.2
.4.6
.81
Frac
tion,
SPF
0.1
.2.3
.4.5
.6Fr
actio
n, S
CE a
nd S
oFIE
0 10 20 30 40 50 60 70 80 90 100Probability of high inflation
Panel A: 2019Q1
0.2
.4.6
.81
Frac
tion,
SPF
0.1
.2.3
.4.5
.6Fr
actio
n, S
CE a
nd S
oFIE
0 10 20 30 40 50 60 70 80 90 100Probability of high inflation
Panel B: 2020Q1
0.2
.4.6
.81
Frac
tion,
SPF
0.1
.2.3
.4.5
.6Fr
actio
n, S
CE a
nd S
oFIE
0 10 20 30 40 50 60 70 80 90 100Probability of high inflation
Panel C: 2021Q1
-11
SoFIE (firms), >5%SCE (households), >4%SPF (professional forecasters), >4%

41
Figure 3. Forecast Revisions by U.S. Firms, Households and Professional Forecasters.
Notes: The figure reports the distribution of revisions in long-term (5-years-ahead) inflation forecasts (empty bars) and the distribution of revisions in short-term (1-year-ahead) inflation forecasts (filled bars). Panel A: shows results for firms (SoFIE), 6-month revision for 1-year-ahead and 1-year revision for 5-year-ahead inflation forecasts. Panel B: shows results for households (MSC), 6-month revision for 1-year-ahead and 5-year-ahead inflation forecasts. Panel C: shows results for professional forecasters (SPF), 6-month revision for 1-year-ahead and 5-year-ahead inflation forecasts. The distributions are computed using survey weights. The sample period covers 2018Q2-2021Q3.
0.1
.2.3
Den
sity
-15 -10 -5 0 5 10 15Forecast revision, %
Panel A. Firms (SoFIE)
0.2
.4.6
.81
Den
sity
-15 -10 -5 0 5 10 15Forecast revision, %
Panel C. Professional Forecasters (SPF)
0.1
.2.3
Den
sity
-15 -10 -5 0 5 10 15Forecast revision, %
Panel B. Households (MSC)
-11
1-year ahead expected inflation5-year ahead expected inflation

42
Figure 4. Correlation of Changes in Short-Run and Long-Run Inflation Expectations.
Source: The binscatters show the relationship between 1-year-ahead and 5-year-ahead inflation forecasts. The sample period covers waves 2018Q4, 2019Q4 and 2020Q4 for SoFIE, 2017Q1-2020Q4 for SCE, and 2018Q1-2021Q3 for SPF. Huber robust regression is used to downweight the importance of outliers and influential observations. Robust standard errors are in parentheses.
b = 0.71 (0.06)R2 = 0.62
-10
12
35-
year
fore
cast
revi
sion
-2 -1 0 1 2 31-year forecast revision
Panel A. Firms (SoFIE)
b = 0.34 (0.05)R2 = 0.11
-20
-10
010
205-
year
fore
cast
revi
sion
-30 -20 -10 0 10 201-year forecast revision
Panel B. Household (SCE)
b = 0.54 (0.04)R2 = 0.68
-.50
.51
5-ye
ar fo
reca
st re
visi
on
-1.5 -1 -.5 0 .5 11-year forecast revision
Panel C. Professional forecasters (SPF)
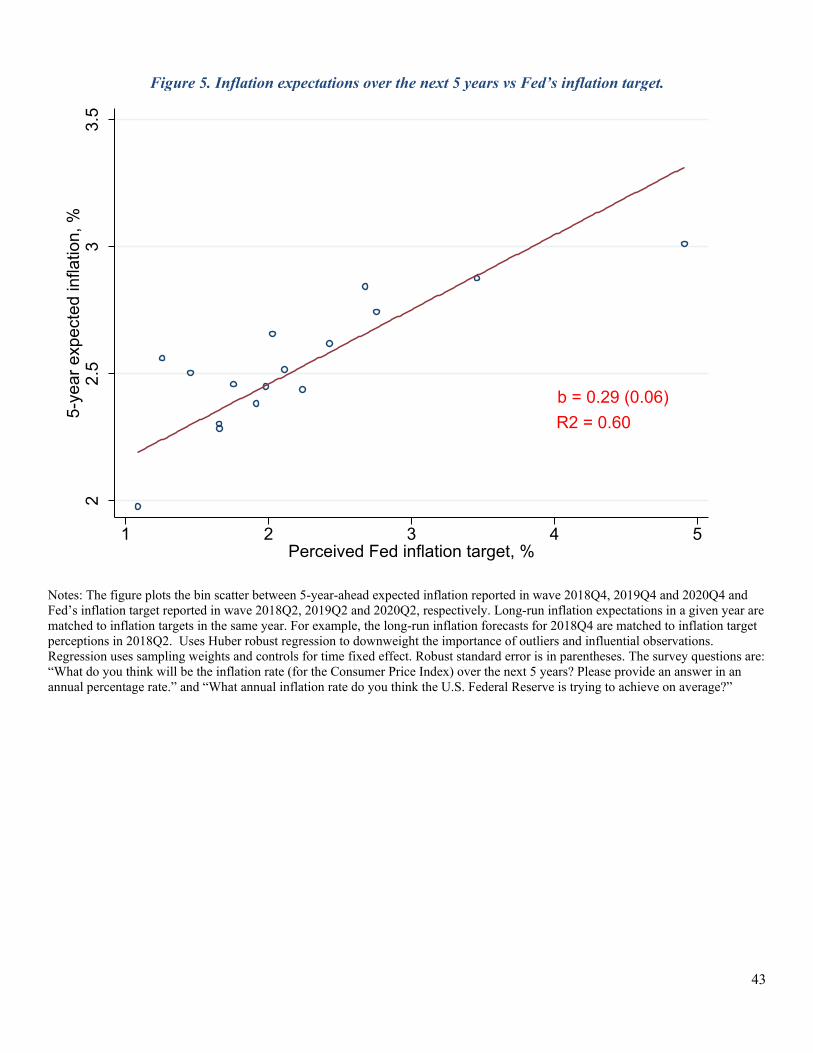
43
Figure 5. Inflation expectations over the next 5 years vs Fed’s inflation target.
Notes: The figure plots the bin scatter between 5-year-ahead expected inflation reported in wave 2018Q4, 2019Q4 and 2020Q4 and Fed’s inflation target reported in wave 2018Q2, 2019Q2 and 2020Q2, respectively. Long-run inflation expectations in a given year are matched to inflation targets in the same year. For example, the long-run inflation forecasts for 2018Q4 are matched to inflation target perceptions in 2018Q2. Uses Huber robust regression to downweight the importance of outliers and influential observations. Regression uses sampling weights and controls for time fixed effect. Robust standard error is in parentheses. The survey questions are: “What do you think will be the inflation rate (for the Consumer Price Index) over the next 5 years? Please provide an answer in an annual percentage rate.” and “What annual inflation rate do you think the U.S. Federal Reserve is trying to achieve on average?”
b = 0.29 (0.06)R2 = 0.60
22.
53
3.5
5-ye
ar e
xpec
ted
infla
tion,
%
1 2 3 4 5Perceived Fed inflation target, %

44
Figure 6. Distribution of Firms’ Perceived Inflation Rate over the Last 12 Months.
Notes: Reports the distribution of perceived inflation rate over the last 12 months in the second (panel A: 2018Q3), sixth (panel B: 2019Q3), tenth (panel C:2020Q3) and fourteenth (panel D: 2021Q3) waves of the survey. The vertical bold line indicates the most recent available value of annual inflation. The distributions are computed using survey weights. The survey question is: “What do you think has been the annual inflation rate (for the Consumer Price Index) over the last twelve months? Please provide an answer in annual percentage rate.”
actual inflation0
.2.4
.6Fr
actio
n
-1 0 1 2 3 4 5 6 7 8 9 10 11 12 13 14 15perceived inflation rate over the last 12 months, %
Panel A: 2018Q3
0.2
.4.6
Frac
tion
-1 0 1 2 3 4 5 6 7 8 9 10 11 12 13 14 15perceived inflation rate over the last 12 months, %
Panel B: 2019Q3
0.2
.4.6
Frac
tion
-1 0 1 2 3 4 5 6 7 8 9 10 11 12 13 14 15perceived inflation rate over the last 12 months, %
Panel C: 2020Q3
0.2
.4.6
Frac
tion
-1 0 1 2 3 4 5 6 7 8 9 10 11 12 13 14 15perceived inflation rate over the last 12 months, %
Panel D: 2021Q3

45
Figure 7. Inflation expectations over the next 5 years vs perceived inflation over the last 12 months.
Notes: The figure plots the bin scatter between 5-year-ahead expected inflation reported in wave 2018Q4, 2019Q4 and 2020Q4 and perceived inflation over the last 12 months reported in wave 2018Q3, 2019Q3 and 2020Q3, respectively. Long-run inflation expectations in a given year are matched to inflation perceptions in the same year. For example, the long-run inflation forecasts for 2018Q4 are matched to inflation perceptions in 2018Q3. Uses Huber robust regression to downweight the importance of outliers and influential observations. Regression uses sampling weight and controls for time fixed effect. Robust standard error is in parentheses. The survey questions are: “What do you think will be the inflation rate (for the Consumer Price Index) over the next 5 years? Please provide an answer in an annual percentage rate.” and “What do you think has been the annual inflation rate (for the Consumer Price Index) over the last twelve months? Please provide an answer in annual percentage rate.”
b = 0.17 (0.05)R2 = 0.46
2.4
2.6
2.8
33.
23.
45-
year
exp
ecte
d in
flatio
n, %
0 1 2 3 4 5Perceived inflation over the last 12 months, %

46
ONLINE APPENDIX
ADDITIONAL FIGURES AND TABLES

47
Appendix Table A1. Effect of using weights and truncation of the sample on basic moments for inflation forecasts and perceived inflation in United States.
Survey Date
Sample and weights Full sample without
sample weights Truncated sample without sample weights Full sample with sample
weights Mean SD Mean SD Mean SD
(1) (2) (3) (4) (5) (6) Panel A: 1-year-ahead inflation forecasts, percent
2018Q2 4.0 4.1 3.4 1.7 4.4 5.3 2018Q3 3.6 3.2 3.3 2.0 2.9 1.7 2018Q4 3.6 3.6 3.3 1.7 3.8 4.1 2019Q1 3.1 2.0 3.0 1.4 3.1 1.7 2019Q2 2.2 1.1 2.2 1.1 2.1 1.1 2019Q3 2.4 1.0 2.4 1.0 2.3 0.5 2019Q4 2.1 1.2 2.1 1.2 2.1 1.3 2020Q1 2.3 0.9 2.3 0.9 2.2 0.9 2020Q2 2.9 3.8 2.7 2.5 2.4 4.0 2020Q3 1.9 1.2 2.0 1.2 2.0 1.2 2020Q4 2.3 0.9 2.3 0.9 2.3 1.0 2021Q1 2.6 1.8 2.5 1.4 3.0 2.4 2021Q2 3.1 1.3 3.1 1.3 3.2 1.3 2021Q3 6.8 9.2 4.9 2.4 6.0 6.2
Panel B: 5-year-ahead inflation forecast, percent
2018Q4 4.1 3.3 3.7 2.2 3.8 2.2 2019Q4 2.5 1.7 2.5 1.7 2.3 1.5 2020Q4 3.1 1.5 3.0 1.1 3.3 1.2
Panel C: 1-year inflation nowcasts and backcasts, percent
2018Q3 3.4 3.6 2.9 2.0 2.8 1.8 2019Q3 2.3 1.0 2.3 1.0 2.1 0.5 2020Q3 2.1 1.0 2.2 0.9 2.3 0.9 2021Q3 6.5 8.9 4.2 2.5 6.2 8.3
Notes: The table presents inflation forecasts/nowcasts/backcasts of firms’ managers. Truncated sample refers to when we exclude responses that are greater than 15 percentage points or less than -2 percentage points. Full sample includes all observations. Moments in columns (5)-(6) are constructed using sample weights. See the text and note to Table 1 for more details.
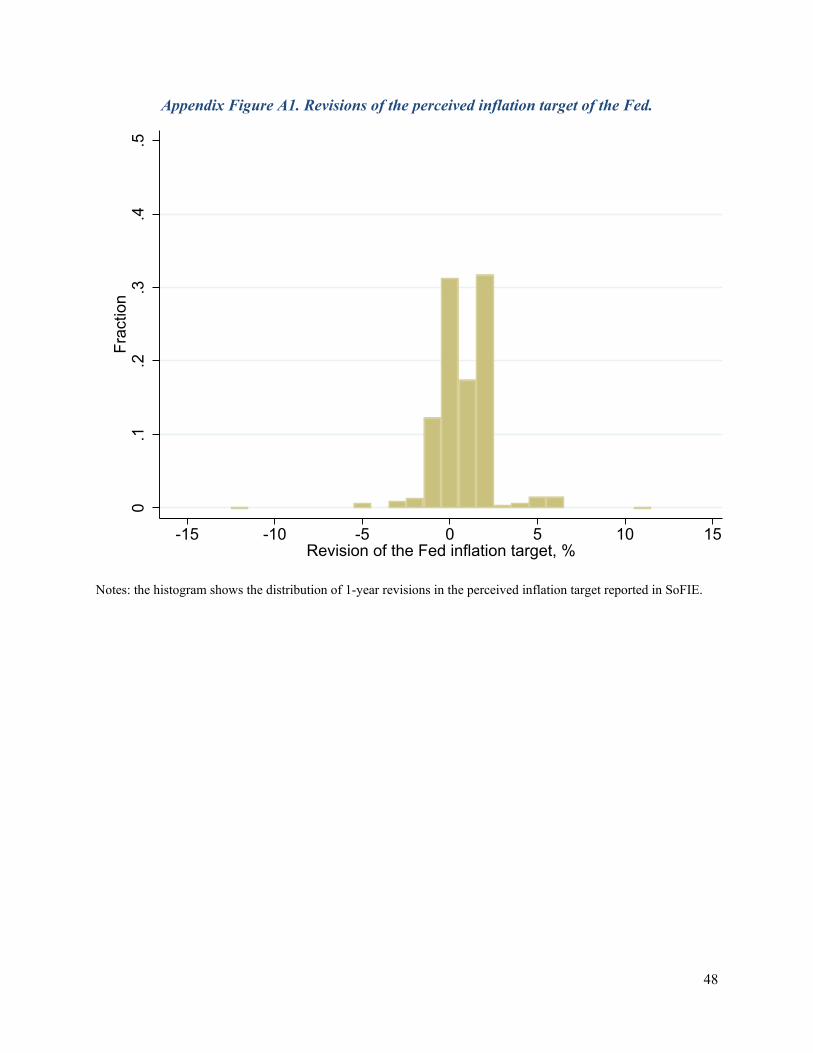
48
Appendix Figure A1. Revisions of the perceived inflation target of the Fed.
Notes: the histogram shows the distribution of 1-year revisions in the perceived inflation target reported in SoFIE.
0.1
.2.3
.4.5
Frac
tion
-15 -10 -5 0 5 10 15Revision of the Fed inflation target, %
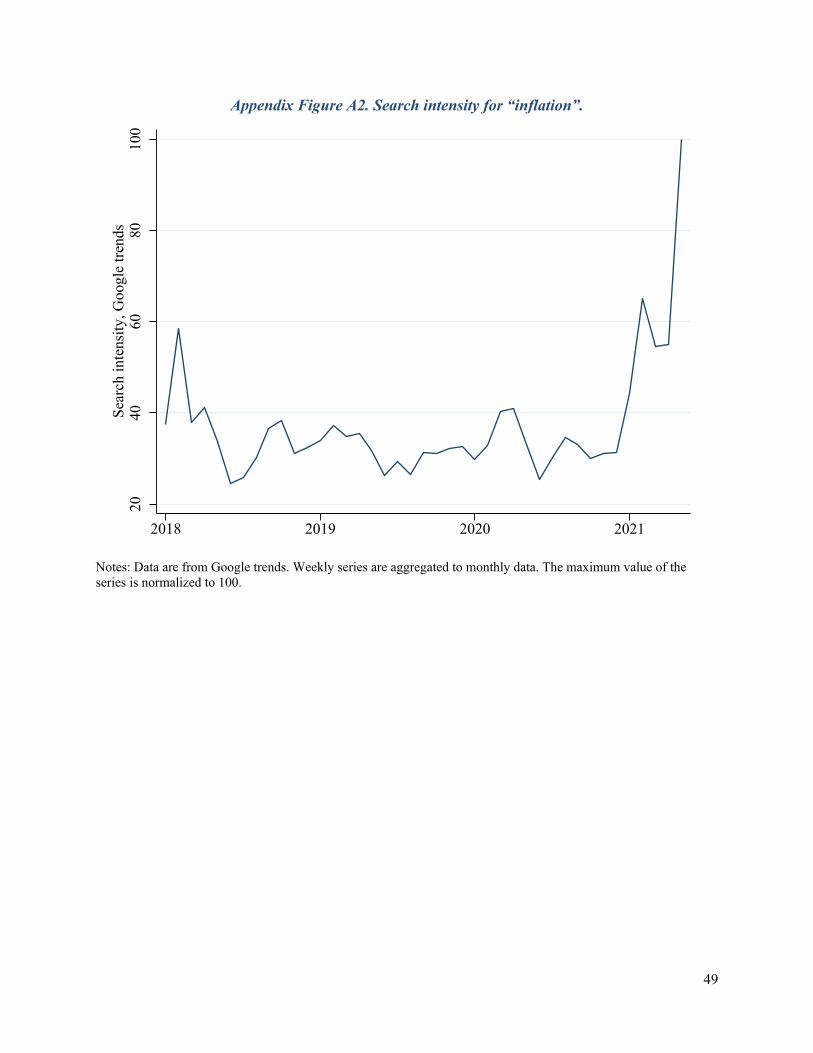
49
Appendix Figure A2. Search intensity for “inflation”.
Notes: Data are from Google trends. Weekly series are aggregated to monthly data. The maximum value of the series is normalized to 100.
2040
6080
100
Sear
ch in
tens
ity, G
oogl
e tre
nds
2018 2019 2020 2021

50
Appendix Figure A3. Cross-sectional distribution of one-year-ahead inflation forecasts by survey wave.
Notes: survey weights are used for each histogram. Responses greater than 15 percent and smaller than 2 percent are excluded.
0.1
.2.3
.4.5
Frac
tion
-2 0 2 4 6 8 10 12 14Expected inflation, %
2018Q2
0.1
.2.3
.4.5
Frac
tion
-2 0 2 4 6 8 10 12 14Expected inflation, %
2018Q3
0.1
.2.3
.4.5
Frac
tion
-2 0 2 4 6 8 10 12 14Expected inflation, %
2018Q4
0.1
.2.3
.4.5
Frac
tion
-2 0 2 4 6 8 10 12 14Expected inflation, %
2019Q1
0.1
.2.3
.4.5
Frac
tion
-2 0 2 4 6 8 10 12 14Expected inflation, %
2019Q20
.1.2
.3.4
.5Fr
actio
n
-2 0 2 4 6 8 10 12 14Expected inflation, %
2019Q30
.1.2
.3.4
.5Fr
actio
n
-2 0 2 4 6 8 10 12 14Expected inflation, %
2019Q4
0.1
.2.3
.4.5
Frac
tion
-2 0 2 4 6 8 10 12 14Expected inflation, %
2020Q1
0.1
.2.3
.4.5
Frac
tion
-2 0 2 4 6 8 10 12 14Expected inflation, %
2020Q2
0.1
.2.3
.4.5
Frac
tion
-2 0 2 4 6 8 10 12 14Expected inflation, %
2020Q3
0.1
.2.3
.4.5
Frac
tion
-2 0 2 4 6 8 10 12 14Expected inflation, %
2020Q4
0.1
.2.3
.4.5
Frac
tion
-2 0 2 4 6 8 10 12 14Expected inflation, %
2021Q10
.1.2
.3.4
.5Fr
actio
n
-2 0 2 4 6 8 10 12 14Expected inflation, %
2021Q2
0.1
.2.3
.4.5
Frac
tion
-2 0 2 4 6 8 10 12 14Expected inflation, %
2021Q3
Related Documents