The Industrial Competitiveness of Korea’s IT Industry Joonghae Suh (Korea Development Institute) - Preliminary Draft - 1. Introduction 2. Growth of Korea’s IT industry 2.1 Overview 2.2 Production Structure 2.3 Sources of Growth - Case Study: Display Industry 3. Characteristics of Korea’s IT industry 3.1 Industrial Organization 3.2 R&D Activities - Case Study: Display Technology 3.3 Sub-sectors 4. Assessment of Competitiveness 4.1 Trade Performance 4.2 Sub-sectors - Case Study: Secondary Battery Industry 5. Summary and Discussion References <Appendix> (1) Korea’s Computer and Home-appliances Industries (2) Factors Affecting Industrial Competitiveness – Summary of Interviews

Welcome message from author
This document is posted to help you gain knowledge. Please leave a comment to let me know what you think about it! Share it to your friends and learn new things together.
Transcript
The Industrial Competitiveness of Korea’s IT
Industry Joonghae Suh (Korea Development Institute)
- Preliminary Draft -
1. Introduction 2. Growth of Korea’s IT industry
2.1 Overview 2.2 Production Structure 2.3 Sources of Growth - Case Study: Display Industry
3. Characteristics of Korea’s IT industry 3.1 Industrial Organization 3.2 R&D Activities
- Case Study: Display Technology 3.3 Sub-sectors 4. Assessment of Competitiveness
4.1 Trade Performance 4.2 Sub-sectors - Case Study: Secondary Battery Industry
5. Summary and Discussion References <Appendix> (1) Korea’s Computer and Home-appliances Industries (2) Factors Affecting Industrial Competitiveness – Summary of Interviews
1
1. Introduction
The interplay between technology and the market is pervasive in the information technology (IT) industry. New products embodying new technologies are rapidly expelling old ones. Entry into IT markets require substantial efforts in catching up, not to mention leading, technological innovation. IT is not only rapidly expanding its realm in the conventional electronics sector but is also being widely applied in electrical and other industrial sectors. The convergence of diverse IT products into a small number of products is a recent phenomenon, but it is predicted that it will be the basis for another growth momentum for the IT industry in the coming years.
The year of 1959, when GoldStar (LG Electronics now) produced the first radio-set under its own brand in Korea, marked the beginning of Korea’s electronics industry. (EIAK, 1999) Named as A-501, the GoldStar radio-set was based on the Sanyo model, the Japanese electronics producer, with core components imported from West Germany. Though telecommunications services and the electrical industry had been existing even in early years of the 20th century; the production activities of Korean indigenous companies had been almost negligent. The case of the Model A-501 is symbolic in that it epitomizes the development path of Korea’s electronics industry in, at least, two respects. First, most of the electronics production originated from imitating foreign products while depending on foreign technologies; and, second, large companies, mostly known as chaebols, played a leading role in creating new industrial activities. Today’s Korean electronics industry boasts a few number of products that account for the lion’s share in the world market and a small number of companies that can vie for world market leadership with foreign multinationals. Underlying the top layer, however, are myriad of smaller companies that strive to survive in rapidly changing technology and market environments.
The paper reviews the industrial competitiveness of Korea’s IT (information technology) industry with a special focus on the electronics components sector. Korea’s electronics components industry has evolved in close relation with the development process of the final electronics producers. In particular, the strategy and the production scope of the large electronics producers, mostly chaebols, have greatly influenced the structural configuration of the components industry, which is comprised of mostly smaller companies. Electronic components in general are much widely diverse than final products and, except for a few products, not well standardized. Hence, scale of production of component producers is not comparable to that of final product producers.
2
Limited scale of economies is one of the reasons why the electronic components industry is underdeveloped compared to the final goods segment in Korea. Further, large companies with greater capability to mobilize capital investment are better positioned to seize upon new business opportunities in mass-producible products. At the beginning, components are usually procured overseas; and as the market grows, domestic production ensues, where smaller companies settle in niche markets. The contrast between large producers and smaller component suppliers is the main characteristic of Korea’s electronics industry. And the contrast is also applicable between the electronic components industry and the final electronic product industry.
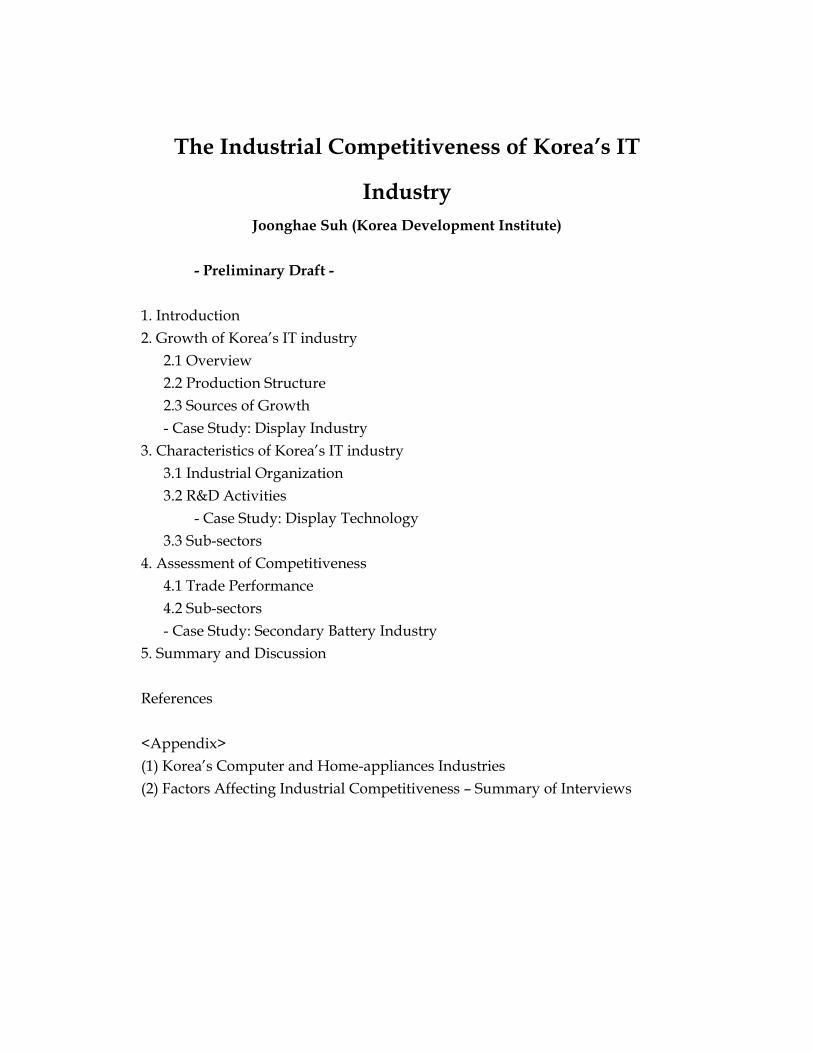
<Scope and Classification of IT Industry> IT products are composed of three basic components - chips, screens and
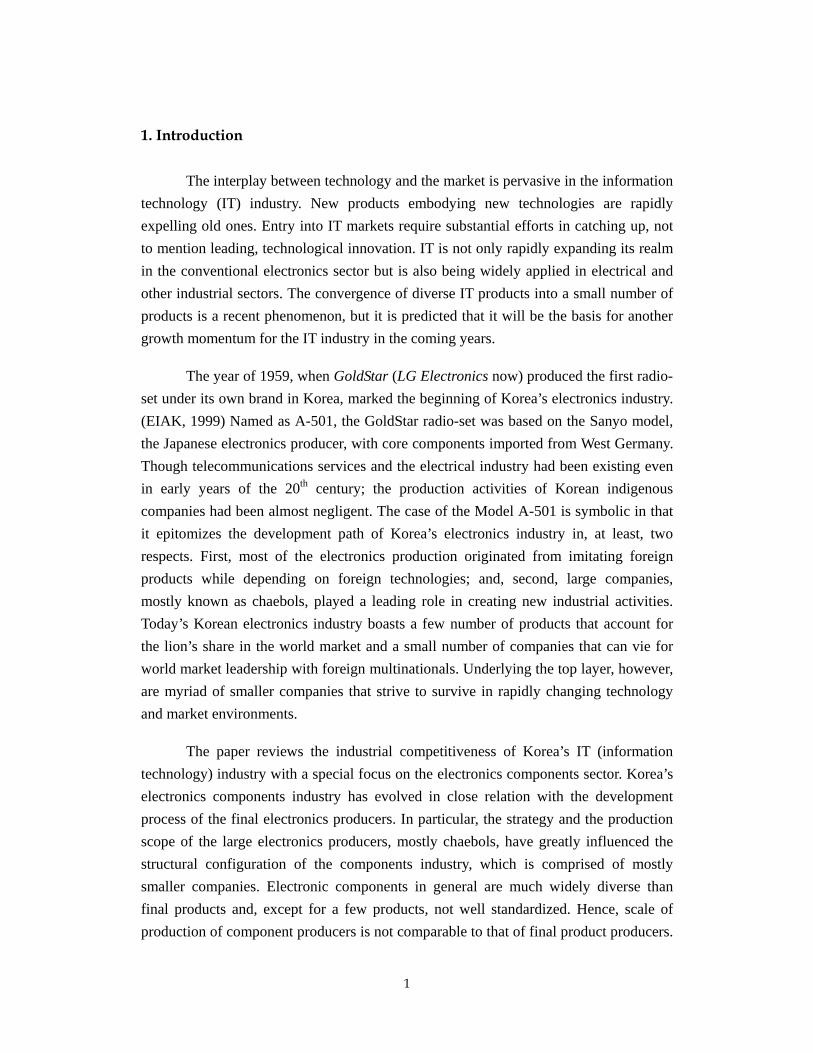
software; and various combinations of the three basic components yield a multitude variety of products. The supply chain of electronic products can be described as shown in <Figure 1>. Industrial classification frequently lags behind development of products incorporating new technologies, and the borders between industrial sectors based on conventional industry classification standard tend to be more blurred. The IT industry in this paper is broken down into nine sectors that can be rather easily constructed from the existing KSIC. These nine sectors can be re-grouped into three categories: i) electronic components including semiconductor, display and other electronic parts; ii) electronic final products including communications equipment, computer, office equipment and IT home appliances; and, iii) electrical products including electrical parts and electrical home appliances. The inclusion of computer-related products such as disk drives and other computer-peripherals into the computer sector (and electronic final products) might be problematic, which results in under-valuation of the electronic components sector. But its share is minor (in Korea), so the industry will not be distorted as a whole. The electronics components industry in this paper mainly concerns three sectors: semiconductor, display and IT parts. But other sectors such as computer and electrical products will also be referred, since, benefiting from the technological innovations, conventional electrical sectors are more and more “converging” to the electronic realm.
3
Figure 1: Supply Chain of Electronic Products
Table 1: IT Industry classification
9 Sectors Examples
Semiconductor IC, DRAM, MPU, ASIC
Display CRT, LCD, PDP Electronic components
IT parts PCB, magnetic card, other electronic components, secondary battery
Communications equipment
Telephone, mobile phone, broadcasting equipment, fax machine
Computer Computer, computer disk, computer peripherals including printer
Office equipment Copy machine
Electronic final products
IT home appliances TV, VTR, Audio-set
Electrical parts Generator, motor, transformer, controller, cable, battery, lamp, resister, battery Electrical
products Electrical home appliances
Refrigerator, laundry machine, cooking machine, air-conditioner
Electronic components
Materials Machinery
S/W
Electronicequipment
Consumer electronics
Otherindustries
4
2. Growth of Korea’s IT industry 2.1 Overview
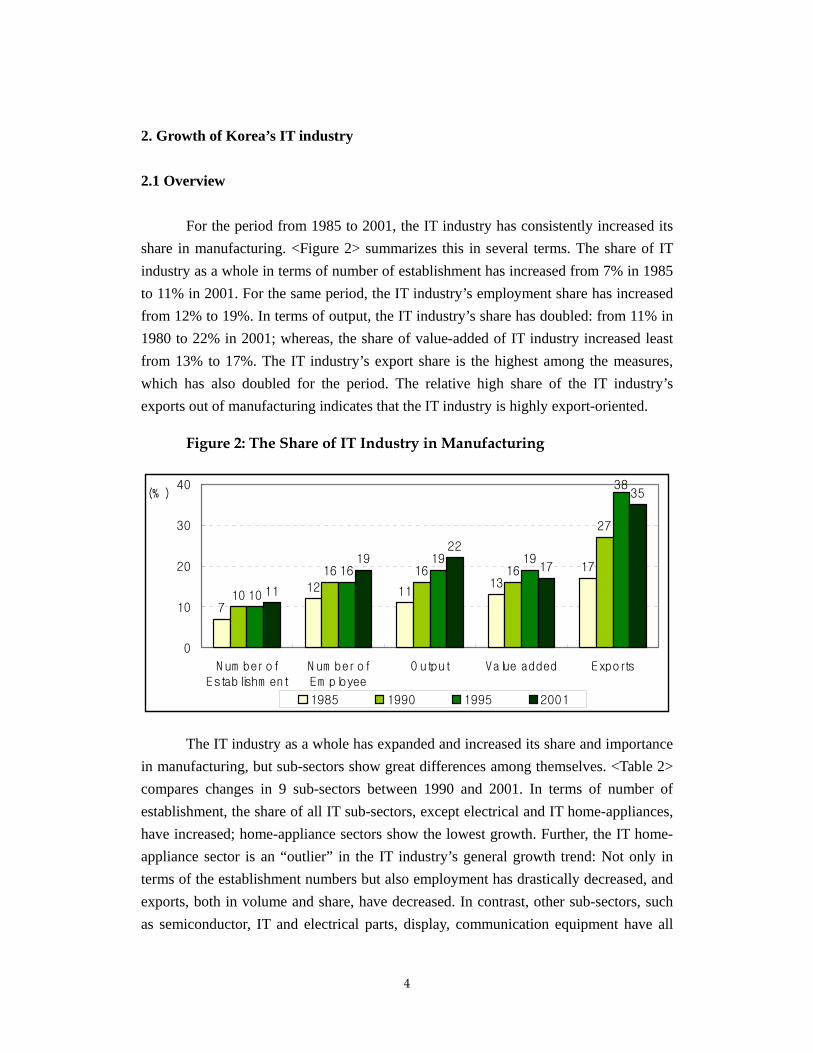
For the period from 1985 to 2001, the IT industry has consistently increased its share in manufacturing. <Figure 2> summarizes this in several terms. The share of IT industry as a whole in terms of number of establishment has increased from 7% in 1985 to 11% in 2001. For the same period, the IT industry’s employment share has increased from 12% to 19%. In terms of output, the IT industry’s share has doubled: from 11% in 1980 to 22% in 2001; whereas, the share of value-added of IT industry increased least from 13% to 17%. The IT industry’s export share is the highest among the measures, which has also doubled for the period. The relative high share of the IT industry’s exports out of manufacturing indicates that the IT industry is highly export-oriented.
Figure 2: The Share of IT Industry in Manufacturing
7
12 1113
17
10
16 16 16
27
10
1619 19
38
11
1922
17
35
0
10
20
30
40
N um ber ofEstablishm ent
N um ber ofEm ployee
O utput Value added Exports
(% )
1985 1990 1995 2001
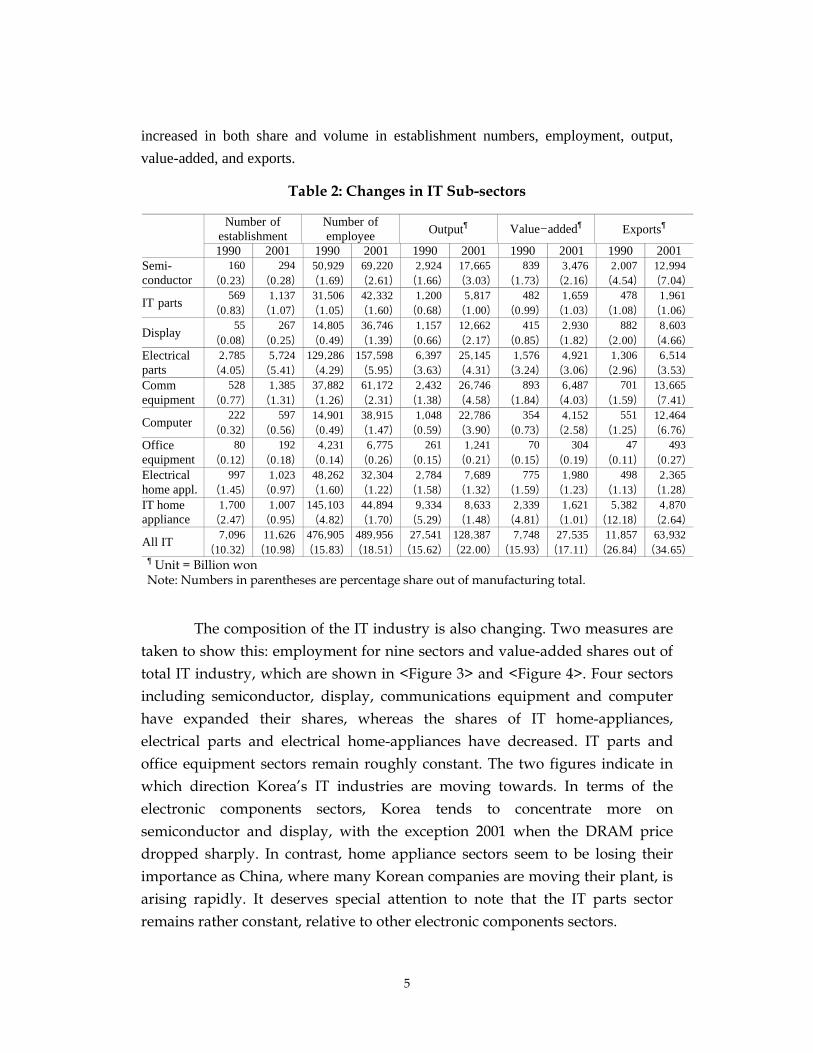
The IT industry as a whole has expanded and increased its share and importance in manufacturing, but sub-sectors show great differences among themselves. <Table 2> compares changes in 9 sub-sectors between 1990 and 2001. In terms of number of establishment, the share of all IT sub-sectors, except electrical and IT home-appliances, have increased; home-appliance sectors show the lowest growth. Further, the IT home-appliance sector is an “outlier” in the IT industry’s general growth trend: Not only in terms of the establishment numbers but also employment has drastically decreased, and exports, both in volume and share, have decreased. In contrast, other sub-sectors, such as semiconductor, IT and electrical parts, display, communication equipment have all
5
increased in both share and volume in establishment numbers, employment, output, value-added, and exports.
Table 2: Changes in IT Sub-sectors
Number of establishment
Number of employee Output¶ Value-added¶ Exports
1990 2001 1990 2001 1990 2001 1990 2001 1990 2001
160 294 50,929 69,220 2,924 17,665 839 3,476 2,007 12,994 Semi-conductor (0.23) (0.28) (1.69) (2.61) (1.66) (3.03) (1.73) (2.16) (4.54) (7.04)
569 1,137 31,506 42,332 1,200 5,817 482 1,659 478 1,961 IT parts (0.83) (1.07) (1.05) (1.60) (0.68) (1.00) (0.99) (1.03) (1.08) (1.06)
55 267 14,805 36,746 1,157 12,662 415 2,930 882 8,603 Display (0.08) (0.25) (0.49) (1.39) (0.66) (2.17) (0.85) (1.82) (2.00) (4.66)
2,785 5,724 129,286 157,598 6,397 25,145 1,576 4,921 1,306 6,514 Electrical parts (4.05) (5.41) (4.29) (5.95) (3.63) (4.31) (3.24) (3.06) (2.96) (3.53)
528 1,385 37,882 61,172 2,432 26,746 893 6,487 701 13,665 Comm equipment (0.77) (1.31) (1.26) (2.31) (1.38) (4.58) (1.84) (4.03) (1.59) (7.41)
222 597 14,901 38,915 1,048 22,786 354 4,152 551 12,464 Computer (0.32) (0.56) (0.49) (1.47) (0.59) (3.90) (0.73) (2.58) (1.25) (6.76)
80 192 4,231 6,775 261 1,241 70 304 47 493 Office equipment (0.12) (0.18) (0.14) (0.26) (0.15) (0.21) (0.15) (0.19) (0.11) (0.27)
997 1,023 48,262 32,304 2,784 7,689 775 1,980 498 2,365 Electrical home appl. (1.45) (0.97) (1.60) (1.22) (1.58) (1.32) (1.59) (1.23) (1.13) (1.28)
1,700 1,007 145,103 44,894 9,334 8,633 2,339 1,621 5,382 4,870 IT home appliance (2.47) (0.95) (4.82) (1.70) (5.29) (1.48) (4.81) (1.01) (12.18) (2.64)
7,096 11,626 476,905 489,956 27,541 128,387 7,748 27,535 11,857 63,932 All IT (10.32) (10.98) (15.83) (18.51) (15.62) (22.00) (15.93) (17.11) (26.84) (34.65)
¶ Unit = Billion won Note: Numbers in parentheses are percentage share out of manufacturing total. The composition of the IT industry is also changing. Two measures are taken to show this: employment for nine sectors and value-added shares out of total IT industry, which are shown in <Figure 3> and <Figure 4>. Four sectors including semiconductor, display, communications equipment and computer have expanded their shares, whereas the shares of IT home-appliances, electrical parts and electrical home-appliances have decreased. IT parts and office equipment sectors remain roughly constant. The two figures indicate in which direction Korea’s IT industries are moving towards. In terms of the electronic components sectors, Korea tends to concentrate more on semiconductor and display, with the exception 2001 when the DRAM price dropped sharply. In contrast, home appliance sectors seem to be losing their importance as China, where many Korean companies are moving their plant, is arising rapidly. It deserves special attention to note that the IT parts sector remains rather constant, relative to other electronic components sectors.

6
Figure 3: Share of Employees in IT Sectors
Figure 4: Share of Value-added in IT Sectors
0
10
20
30
40
Semi Conductor
Display IT Parts Comm.Equip.
Computer Office Equip.
IT Home Appl.
Electri.Parts
Electri.Home Appl.
(%)
1985 1990 1995 2001
0
10
20
30
40
Semi Conductor
Display IT Parts Comm.Equip.
Computer Office Equip.
IT Home Appl.
Electri.Parts
Electri.Home Appl.
(%)
1985 1990 1995 2001
7
2.2 Production structure
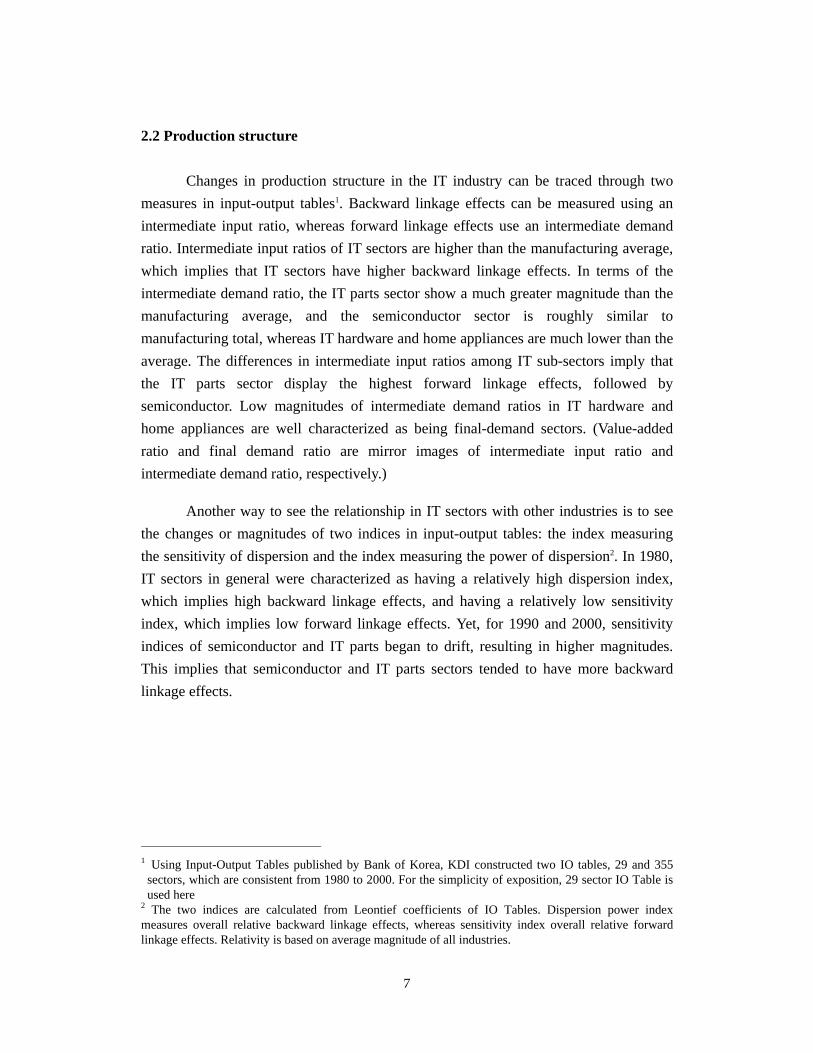
Changes in production structure in the IT industry can be traced through two measures in input-output tables1. Backward linkage effects can be measured using an intermediate input ratio, whereas forward linkage effects use an intermediate demand ratio. Intermediate input ratios of IT sectors are higher than the manufacturing average, which implies that IT sectors have higher backward linkage effects. In terms of the intermediate demand ratio, the IT parts sector show a much greater magnitude than the manufacturing average, and the semiconductor sector is roughly similar to manufacturing total, whereas IT hardware and home appliances are much lower than the average. The differences in intermediate input ratios among IT sub-sectors imply that the IT parts sector display the highest forward linkage effects, followed by semiconductor. Low magnitudes of intermediate demand ratios in IT hardware and home appliances are well characterized as being final-demand sectors. (Value-added ratio and final demand ratio are mirror images of intermediate input ratio and intermediate demand ratio, respectively.)
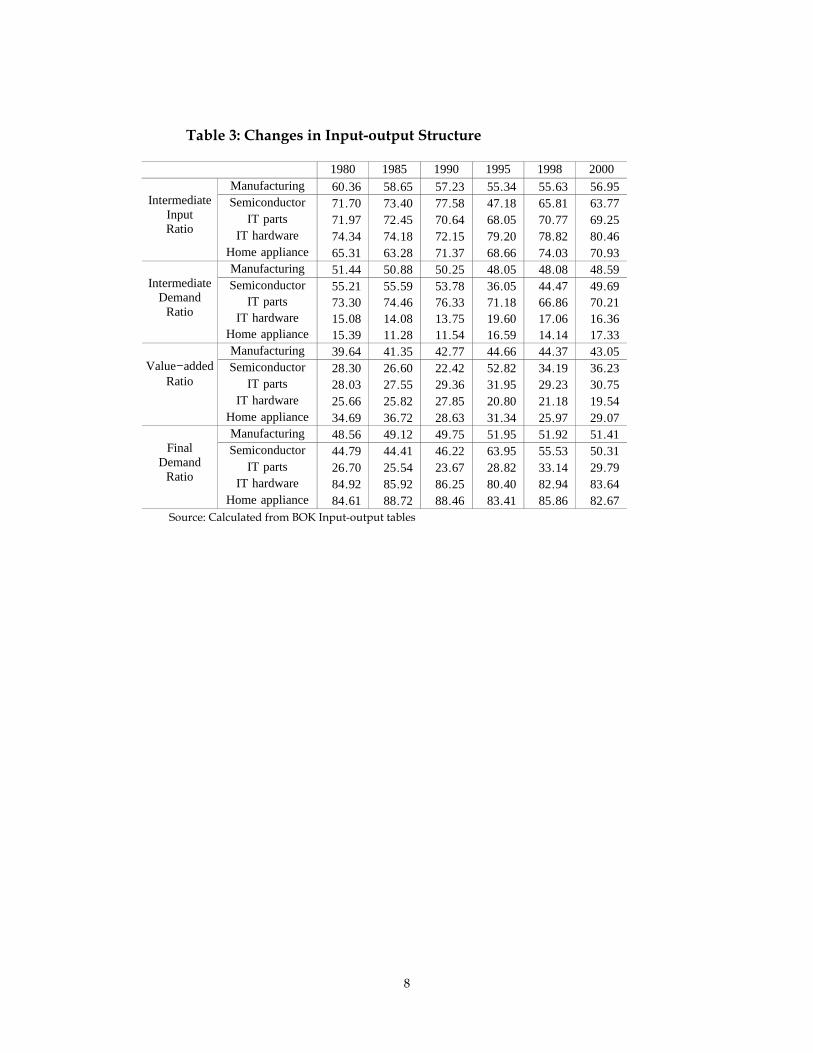
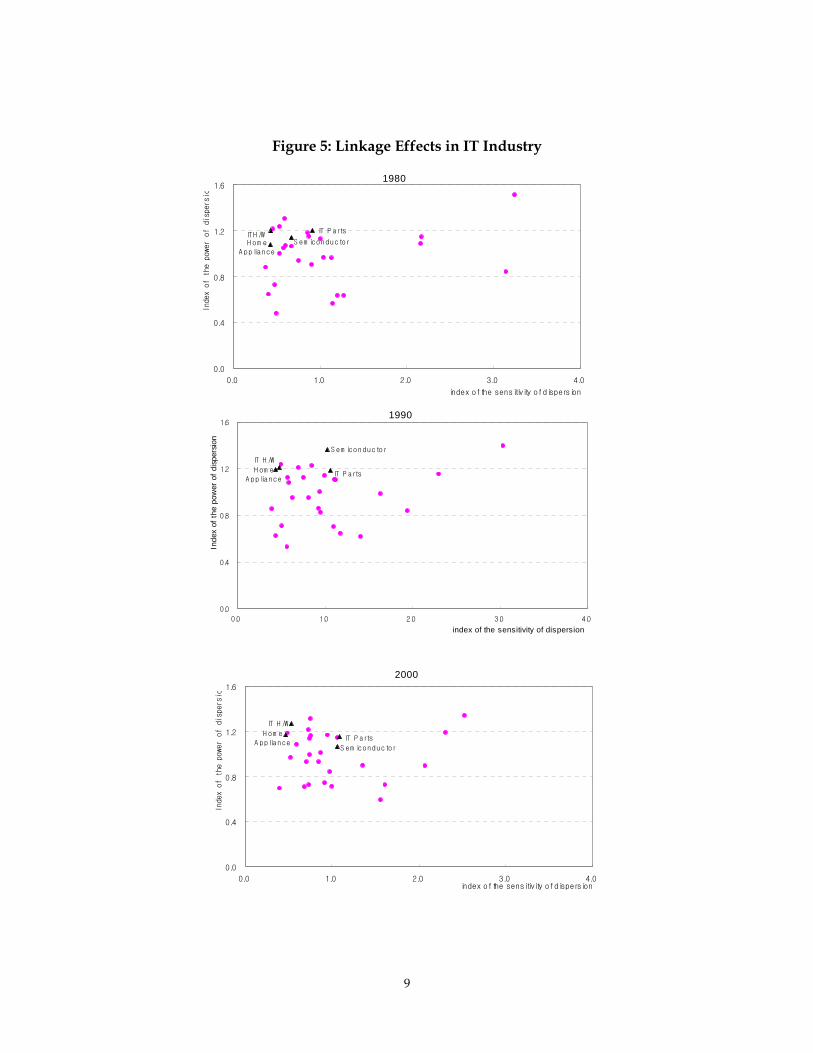
Another way to see the relationship in IT sectors with other industries is to see the changes or magnitudes of two indices in input-output tables: the index measuring the sensitivity of dispersion and the index measuring the power of dispersion2. In 1980, IT sectors in general were characterized as having a relatively high dispersion index, which implies high backward linkage effects, and having a relatively low sensitivity index, which implies low forward linkage effects. Yet, for 1990 and 2000, sensitivity indices of semiconductor and IT parts began to drift, resulting in higher magnitudes. This implies that semiconductor and IT parts sectors tended to have more backward linkage effects.
1 Using Input-Output Tables published by Bank of Korea, KDI constructed two IO tables, 29 and 355 sectors, which are consistent from 1980 to 2000. For the simplicity of exposition, 29 sector IO Table is used here
2 The two indices are calculated from Leontief coefficients of IO Tables. Dispersion power index measures overall relative backward linkage effects, whereas sensitivity index overall relative forward linkage effects. Relativity is based on average magnitude of all industries.
8
Table 3: Changes in Input-output Structure
1980 1985 1990 1995 1998 2000
Manufacturing 60.36 58.65 57.23 55.34 55.63 56.95 Semiconductor 71.70 73.40 77.58 47.18 65.81 63.77
IT parts 71.97 72.45 70.64 68.05 70.77 69.25 IT hardware 74.34 74.18 72.15 79.20 78.82 80.46
Intermediate
Input Ratio
Home appliance 65.31 63.28 71.37 68.66 74.03 70.93 Manufacturing 51.44 50.88 50.25 48.05 48.08 48.59 Semiconductor 55.21 55.59 53.78 36.05 44.47 49.69
IT parts 73.30 74.46 76.33 71.18 66.86 70.21 IT hardware 15.08 14.08 13.75 19.60 17.06 16.36
Intermediate
Demand Ratio
Home appliance 15.39 11.28 11.54 16.59 14.14 17.33 Manufacturing 39.64 41.35 42.77 44.66 44.37 43.05 Semiconductor 28.30 26.60 22.42 52.82 34.19 36.23
IT parts 28.03 27.55 29.36 31.95 29.23 30.75 IT hardware 25.66 25.82 27.85 20.80 21.18 19.54
Value-added
Ratio
Home appliance 34.69 36.72 28.63 31.34 25.97 29.07 Manufacturing 48.56 49.12 49.75 51.95 51.92 51.41 Semiconductor 44.79 44.41 46.22 63.95 55.53 50.31
IT parts 26.70 25.54 23.67 28.82 33.14 29.79 IT hardware 84.92 85.92 86.25 80.40 82.94 83.64
Final
Demand Ratio
Home appliance 84.61 88.72 88.46 83.41 85.86 82.67
Source: Calculated from BOK Input-output tables
9
Figure 5: Linkage Effects in IT Industry
1980
ITH /WH om e
A ppliance
IT P arts
S em iconductor
0.0
0.4
0.8
1.2
1.6
0.0 1.0 2.0 3.0 4.0
index of the sensitivity of dispersion
Index of the power of dispersio
1990
IT H /W
H om e
A pplianceIT P arts
S em iconductor
0.0
0.4
0.8
1.2
1.6
0.0 1.0 2.0 3.0 4.0
index of the sens itivity of dispers ion
Inde
x of
the
pow
er o
f di
sper
sion
2000
S em iconductor
IT P artsH om e
A ppliance
IT H /W
0.0
0.4
0.8
1.2
1.6
0.0 1.0 2.0 3.0 4.0index of the sensitivity of dispersion
Index of the power of dispersio
10
2.3 Sources of Growth
As noted in section 2.1, the IT industry overall has higher growth rates compared to other industries. While each sector of the electronic industry has a higher growth rate compared to the average growth rate of manufacturing, to be sure, the sectoral differences are substantial. Both display and computer sectors have the highest growth rates, as they are influenced by demand, which replaces existing products with new products. Semiconductor had relatively lower growth rates from 1997 to 2001, due to stagnant demand. Not to mention, Korea’s semiconductor industry is sensitive to business cycles. A remarkably low growth rate in the home appliances sector indicates saturation of demand, as home appliances themselves have already reach maturity. Meanwhile, surging growth rates for the last five years are influenced by new market openings due to the application of digital technology to home appliances.
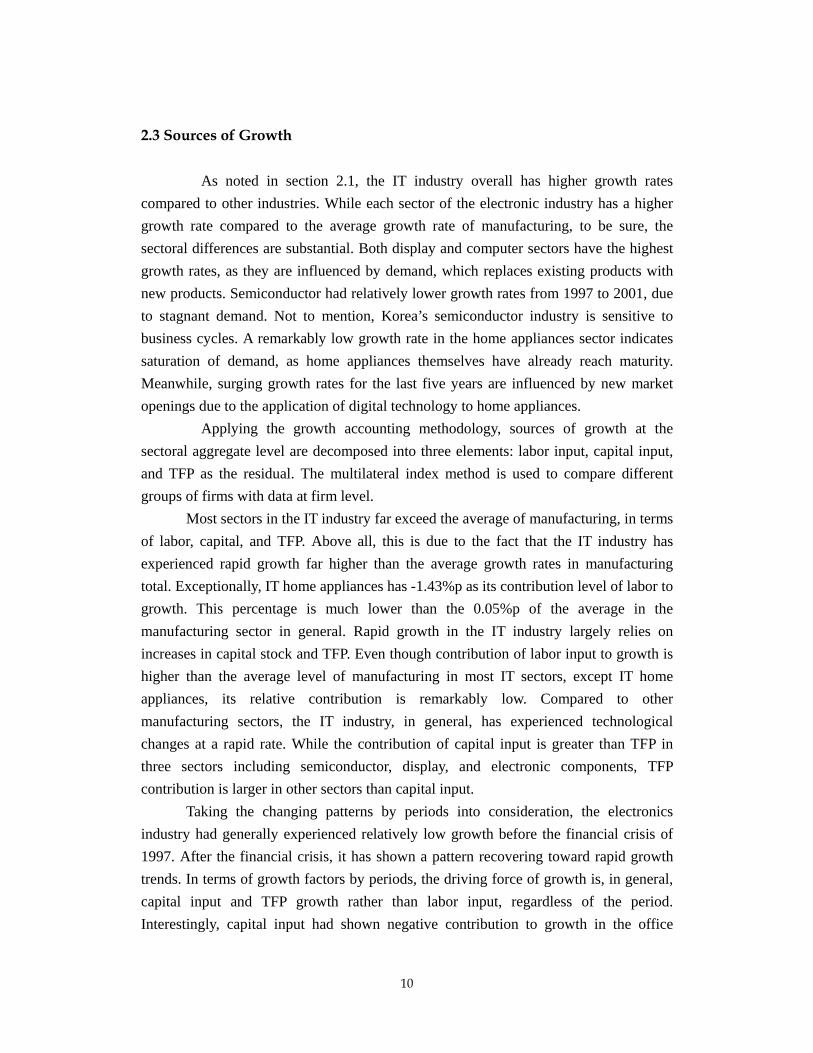
Applying the growth accounting methodology, sources of growth at the sectoral aggregate level are decomposed into three elements: labor input, capital input, and TFP as the residual. The multilateral index method is used to compare different groups of firms with data at firm level.
Most sectors in the IT industry far exceed the average of manufacturing, in terms of labor, capital, and TFP. Above all, this is due to the fact that the IT industry has experienced rapid growth far higher than the average growth rates in manufacturing total. Exceptionally, IT home appliances has -1.43%p as its contribution level of labor to growth. This percentage is much lower than the 0.05%p of the average in the manufacturing sector in general. Rapid growth in the IT industry largely relies on increases in capital stock and TFP. Even though contribution of labor input to growth is higher than the average level of manufacturing in most IT sectors, except IT home appliances, its relative contribution is remarkably low. Compared to other manufacturing sectors, the IT industry, in general, has experienced technological changes at a rapid rate. While the contribution of capital input is greater than TFP in three sectors including semiconductor, display, and electronic components, TFP contribution is larger in other sectors than capital input.
Taking the changing patterns by periods into consideration, the electronics industry had generally experienced relatively low growth before the financial crisis of 1997. After the financial crisis, it has shown a pattern recovering toward rapid growth trends. In terms of growth factors by periods, the driving force of growth is, in general, capital input and TFP growth rather than labor input, regardless of the period. Interestingly, capital input had shown negative contribution to growth in the office
11
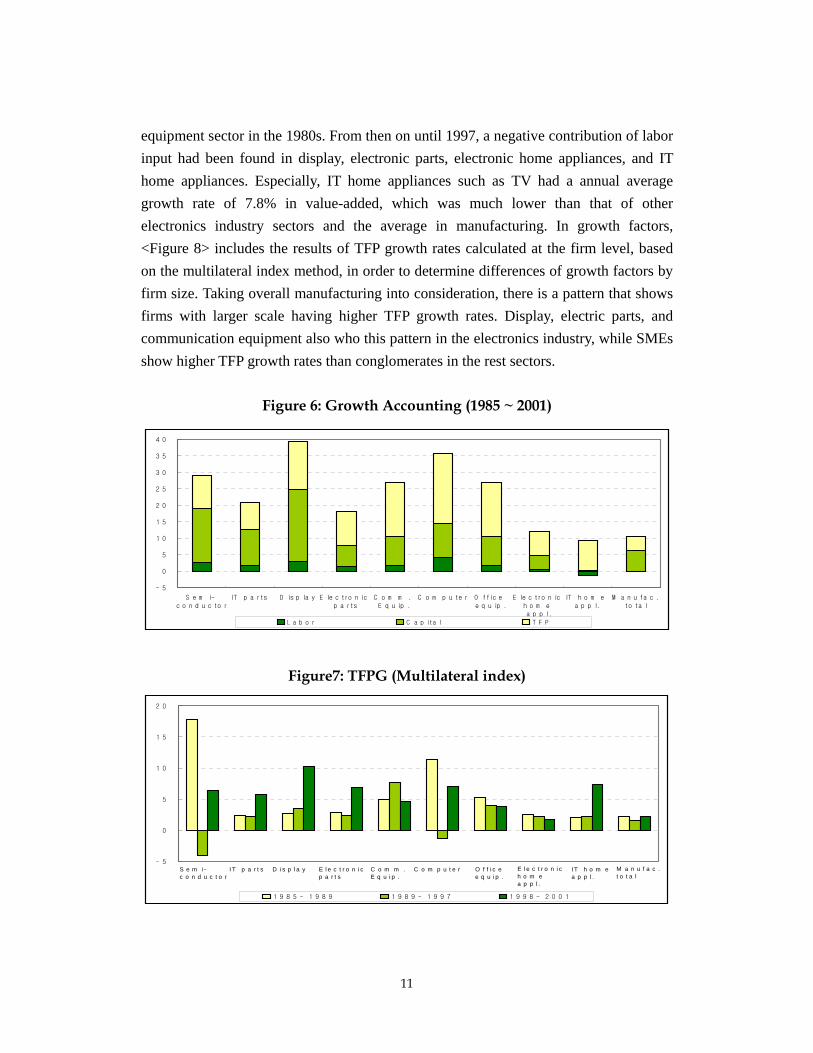
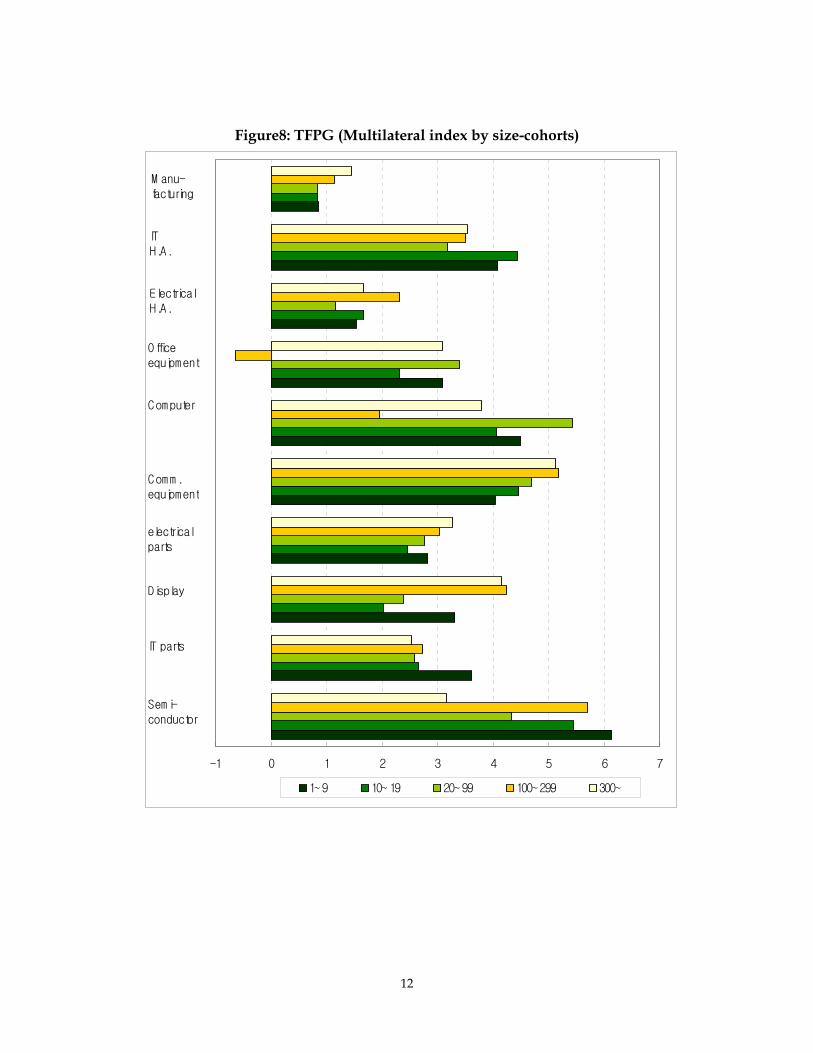
equipment sector in the 1980s. From then on until 1997, a negative contribution of labor input had been found in display, electronic parts, electronic home appliances, and IT home appliances. Especially, IT home appliances such as TV had a annual average growth rate of 7.8% in value-added, which was much lower than that of other electronics industry sectors and the average in manufacturing. In growth factors, <Figure 8> includes the results of TFP growth rates calculated at the firm level, based on the multilateral index method, in order to determine differences of growth factors by firm size. Taking overall manufacturing into consideration, there is a pattern that shows firms with larger scale having higher TFP growth rates. Display, electric parts, and communication equipment also who this pattern in the electronics industry, while SMEs show higher TFP growth rates than conglomerates in the rest sectors.
Figure 6: Growth Accounting (1985 ~ 2001)
- 5
0
5
1 0
1 5
2 0
2 5
3 0
3 5
4 0
S e m i-c o n d u c to r
IT p a rts D is p la y E le c tro n ic p a rts
C o m m . E q u ip .
C o m p u te r O ffic e e q u ip .
E le c tro n ic h o m e a p p l.
IT h o m e a p p l.
M a n u fa c .to ta l
L a b o r C a p ita l T F P
Figure7: TFPG (Multilateral index)
- 5
0
5
1 0
1 5
2 0
1 9 8 5 ~ 1 9 8 9 1 9 8 9 ~ 1 9 9 7 1 9 9 8 ~ 2 0 0 1
S e m i -c o n d u c t o r
IT p a r t s D i s p l a y E l e c t r o n i cp a r t s
C o m m .E q u i p .
C o m p u t e r O f f i c ee q u i p .
E l e c t r o n i ch o m ea p p l .
IT h o m ea p p l .
M a n u f a c .t o t a l
12
Figure8: TFPG (Multilateral index by size-cohorts)
-1 0 1 2 3 4 5 6 7
1~9 10~19 20~99 100~299 300~
M anu-facturing
ITH.A.
ElectricalH.A.
Officeequipment
Computer
Comm.equipment
electricalparts
Display
IT parts
Semi-conductor
13
<Case Study: Display Industry>
The emergence of Korea’s display industry is traced to the licensing-contract for CRT (cathode ray tube) manufacturing technology between Orion Electric and Toshiba in 1968. One year later, Samsung established a joint venture with NEC, and in 1974, Goldstar and Hitachi commenced technical cooperation. At that time, Japanese companies changed their strategy toward moving up the ladder of value chain and transferring existing products of losing competitiveness to Korean joint venture partners. Due to weak technical competence, Korean companies required foreign technology sources and cooperation for constructing CRT production lines, which demanded huge financial investment. The partnership between Korean and Japanese firms had been maintained until the end of the 1980s. Three Korean companies in CRT production improved the technology for black and white CRT. They also started to enhance their own competitiveness in international markets based on localization of three core components of CRT such as the glass tube, phosphor and shadow mask, initiating direct competition with their Japanese counterparts. Since the mid-1980s, domestic enterprises began to establish research laboratories and made huge investment in production lines. Based on these efforts, Samsung SDI (former Samsung Electro-tube) has taken the lead, surpassing Phillips. In doing so, Korea has become the country with the largest amount of CRT production in the world. Undoubtedly, the achievement of becoming the leader in the world was not meaningful in terms of value-added, as it was based on an aggressive "market expansion strategy", centering on low-end market segments. In the development of big screen products and perfectly flat CRT, Korean firms began to produce comparable products to that of Japanese counterparts at the same time. In doing so, they have earned the reputation of being the best manufacturer in the world in terms of both quantity and quality. In retrospect, it took about twenty years for the Korean CRT industry to become the world leader after the technology was introduced via a licensing contract with Japanese partners. However, rising as a major player in TFT-LCD (thin film transistor liquid crystal display) market took less than ten years. Noticing the industry’s new trend of replacing CRTs with flat panel displays (FPD), Korean companies began technology research and pilot production since the mid-1980s. TFT-LCD is the first kind of FDP that Korean companies strategically focused on. LG and Samsung completed construction of LCD plants in 1995, which allowed mass production. Subseqently,
14
massive investments on plants in order to pre-empt a new generation of LCDs have ensued. In the second quarter of 2001, Korea became the industry leader by seizing a world market share of 41.5%, which outpaced Japan and Taiwan that accounted for 39.5 and 18.9%, respectively. It is impressive that Korea is the world leader in terms of total amount of product, when considering Samsung and LG Philips LCD are the only two firms in the top ten. This achievement resulted from a pre-emptive and risk-taking investment. Korean manufacturers are able to earn incomparable productivity, as a result of getting bigger of glass-plate in 3.5 G based on outstanding processing technology. However, the joy of closing the gap with Japan was short lived. Taiwan has risen to become a strong competitor to Korean firms in the TFT LCD industry with the aim of becoming "the best of TFT LCD in 2005" on the wave of radical development based on a nation-wide huge investment since 1999. Taiwan’s achievement has also been a result of vigorous technical cooperation and investment with Japan that was intended to check Korea, threatening competitor to Japan. On the contrary, Japan’s strategy has led to a situation where Taiwanese manufacturers could threaten Japan’s position without having a restraining effect on Korea. Furthermore, this has brought about an industrial problem, that is, oversupply of TFT LCD. In fact, Taiwan’s entry has resulted in an oversupply problem in the TFT LCD market, which underwent absolutely insufficient supply. Every enterprise is currently struggling with deterioration in profitability, being faced with restructuring. In the beginning, Japan led the TFT LCD industry; however, they are still trying to recover from the shock caused by falling prices. Sharp and Mitsubishi were forced to make drastic cuts. NEC, which recorded 7% of global market share, made the determination to withdraw from LCD production for monitor. Even in the midst of trouble, Taiwanese firms still maintain an aggressive position. Acer and Unipack continue to explore ways to strengthen competitiveness through M & A. Now the industrial landscape is changing as China is entering the marketplace: BOE (Beijing Orient Electronics Group) acquired Hydis, a spin-off of Hynix (formerly Hyundai Electronics) in 2003.
15
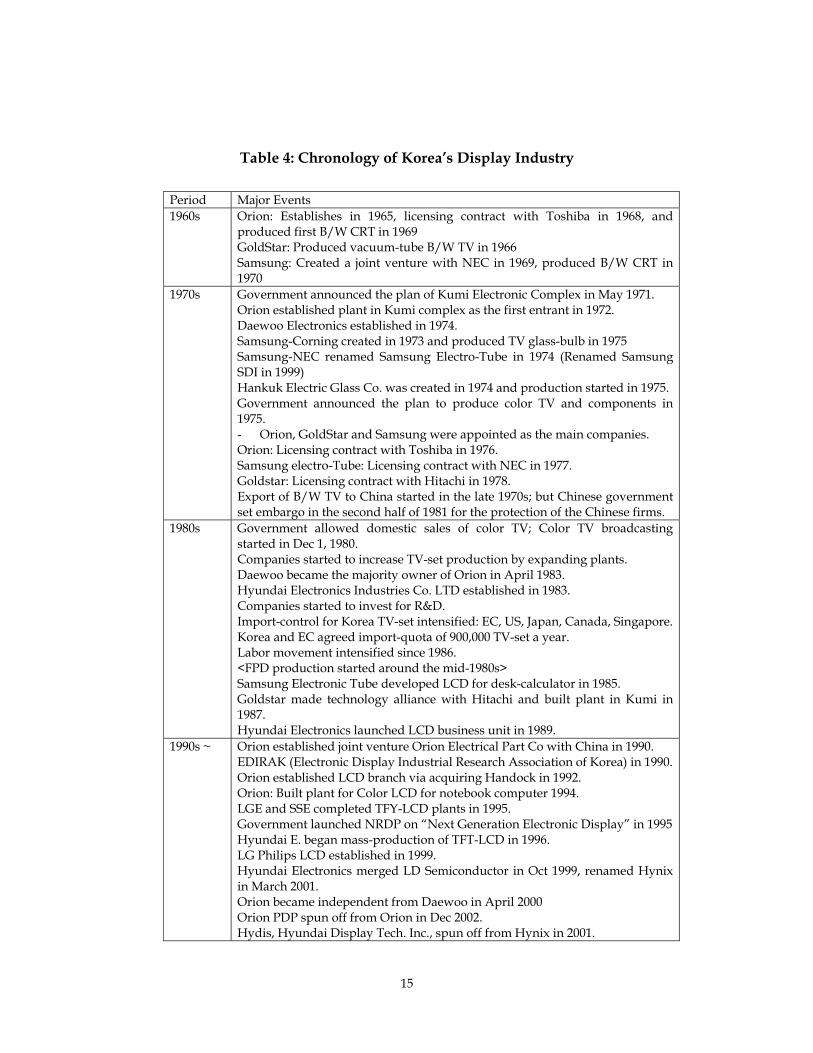
Table 4: Chronology of Korea’s Display Industry
Period Major Events 1960s Orion: Establishes in 1965, licensing contract with Toshiba in 1968, and
produced first B/W CRT in 1969 GoldStar: Produced vacuum-tube B/W TV in 1966 Samsung: Created a joint venture with NEC in 1969, produced B/W CRT in 1970
1970s Government announced the plan of Kumi Electronic Complex in May 1971. Orion established plant in Kumi complex as the first entrant in 1972. Daewoo Electronics established in 1974. Samsung-Corning created in 1973 and produced TV glass-bulb in 1975 Samsung-NEC renamed Samsung Electro-Tube in 1974 (Renamed Samsung SDI in 1999) Hankuk Electric Glass Co. was created in 1974 and production started in 1975. Government announced the plan to produce color TV and components in 1975. - Orion, GoldStar and Samsung were appointed as the main companies. Orion: Licensing contract with Toshiba in 1976. Samsung electro-Tube: Licensing contract with NEC in 1977. Goldstar: Licensing contract with Hitachi in 1978. Export of B/W TV to China started in the late 1970s; but Chinese government set embargo in the second half of 1981 for the protection of the Chinese firms.
1980s Government allowed domestic sales of color TV; Color TV broadcasting started in Dec 1, 1980. Companies started to increase TV-set production by expanding plants. Daewoo became the majority owner of Orion in April 1983. Hyundai Electronics Industries Co. LTD established in 1983. Companies started to invest for R&D. Import-control for Korea TV-set intensified: EC, US, Japan, Canada, Singapore. Korea and EC agreed import-quota of 900,000 TV-set a year. Labor movement intensified since 1986. <FPD production started around the mid-1980s> Samsung Electronic Tube developed LCD for desk-calculator in 1985. Goldstar made technology alliance with Hitachi and built plant in Kumi in 1987. Hyundai Electronics launched LCD business unit in 1989.
1990s ~ Orion established joint venture Orion Electrical Part Co with China in 1990. EDIRAK (Electronic Display Industrial Research Association of Korea) in 1990. Orion established LCD branch via acquiring Handock in 1992. Orion: Built plant for Color LCD for notebook computer 1994. LGE and SSE completed TFY-LCD plants in 1995. Government launched NRDP on “Next Generation Electronic Display” in 1995 Hyundai E. began mass-production of TFT-LCD in 1996. LG Philips LCD established in 1999. Hyundai Electronics merged LD Semiconductor in Oct 1999, renamed Hynix in March 2001. Orion became independent from Daewoo in April 2000 Orion PDP spun off from Orion in Dec 2002. Hydis, Hyundai Display Tech. Inc., spun off from Hynix in 2001.
16
Hydis sold to BOE, Chinese company, in Nov. 2002. Source: Eletronic Times, The Footprint of the Growth of the Electronic Components Industry, 1995. (In Korean) Orion Electronics Co, The 25 Year History of Orion Electronics, 1991. (In Korean) Samsung Electronics, The 30 Year History of Samsung Electronics, 1999. (In Korean) Newspaper articles, and WWW pages of companies.
17
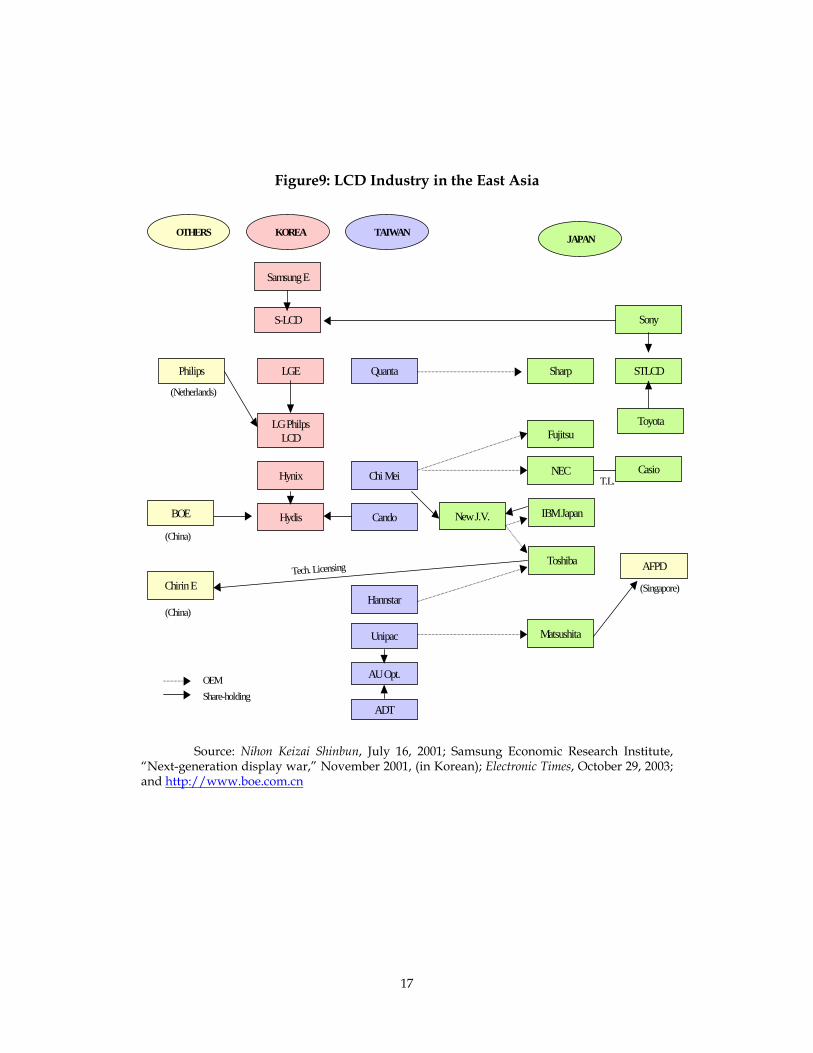
Figure9: LCD Industry in the East Asia
Source: Nihon Keizai Shinbun, July 16, 2001; Samsung Economic Research Institute,
“Next-generation display war,” November 2001, (in Korean); Electronic Times, October 29, 2003; and http://www.boe.com.cn
Samsung E
S-LCD Sony
Philips LGE
LG PhilpsLCD
(Netherlands)
Quanta Sharp STLCD
Toyota
Hynix Chi Mei
Fujitsu
NEC
New J.V. IBM Japan
Toshiba
Hydis Cando
Hannstar
Unipac
AU Opt.
ADT
Matsushita
Chirin E
Casio
(Singapore)Tech. Licensing
OEMShare-holding
BOE
(China)
(China)
AFPD
KOREA TAIWANJAPAN
OTHERS
T.L.
18
3. Characteristics of Korea’s IT industry 3.1 Industrial Organization
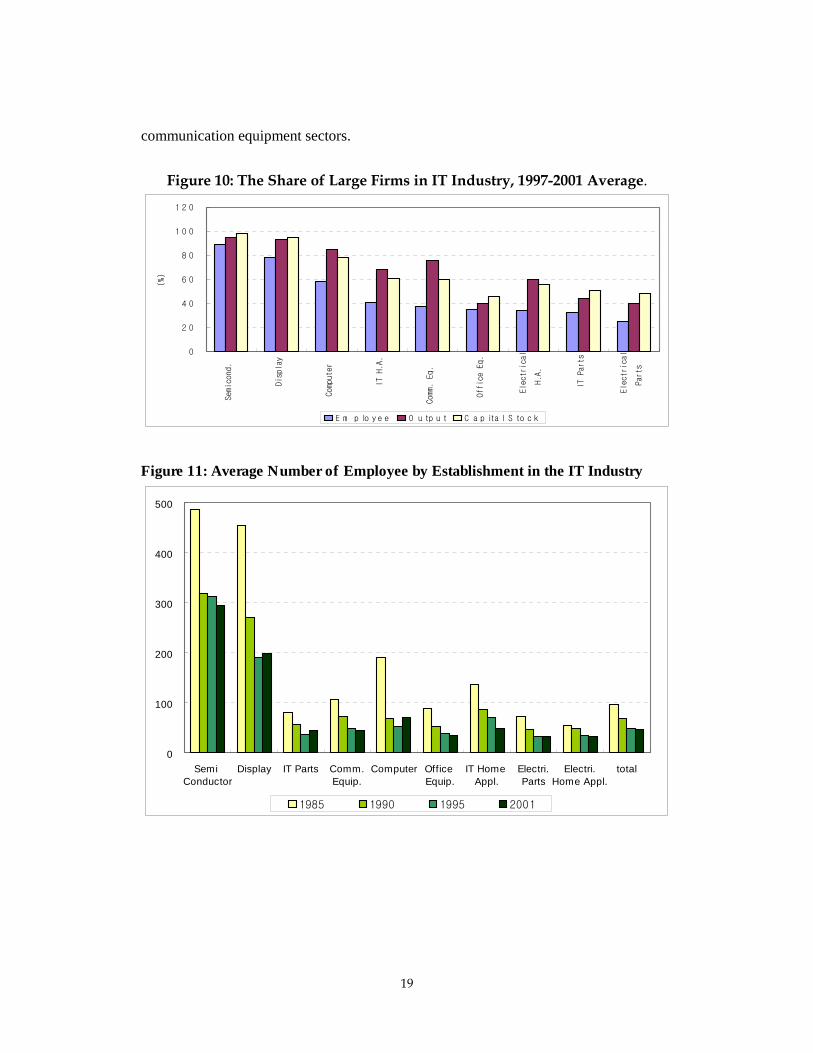
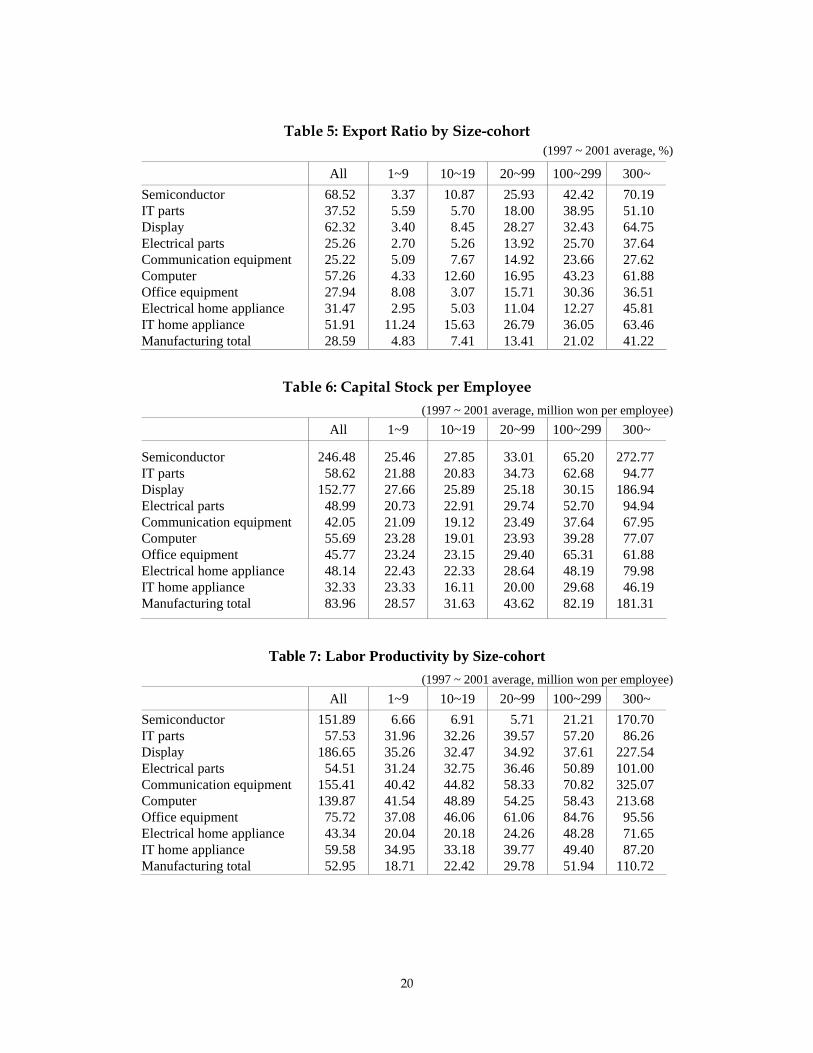
Large companies, defined as those that employ more than 300 people, take a larger share than SMEs in Korean manufacturing, in terms of the number of employees, the volume of production, the amount of value-added, and capital stock. The IT industry is phenomenal in this respect, and the sub-sectors within the IT industry show great differences. As in <Figure 10>, the share of large companies in semiconductor, display and computer industries are very high, whereas electrical home-appliances, IT parts and electrical parts sectors show lower concentrations of large firms. <Figure 11> shows that semiconductor and display are far above the average number of employees in IT sub-sectors. The concentration of large firms explains several different characteristics of industrial activities in the IT industry. Differences in export rates, which are defined as the share of exports out of production and can be referred as indicating market-orientation, are closely correlated with the differences in the concentration ratio of large firms. In general, as <Table 5> shows, the higher the share of large firms, the higher the exports share across IT sub-sectors. <Table 5> also shows that in all IT sub-sectors, large firms are more export-oriented than SMEs. Similar patterns are also found in terms of capital stock per employee in <Table 6>.
Labor productivity shows significant differences between IT sub-sectors. Display, semiconductor, communication equipment, and computer sectors have high export rates. On the contrary, labor productivity in electronic parts, electric components, and home appliances sectors are similar to that of the average level in manufacturing, showing considerable differences compared to labor productivity in upper layers. Large firms have higher labor productivity than SMEs in every sector of the IT industry. Big gaps in labor productivity between size cohorts of firms, which is conspicuous in communications equipment, display, computer, and semiconductor sectors. For semiconductor and display, conglomerates lead these sectors, also revealing their characteristics as being a capital-intensive industry. Electric & IT parts and office equipment have insignificant differences in labor productivity between large firms and SMEs. This fact indicates that leading conglomerates have a limited shares in these sectors compared to other sectors in the IT industry, due to the segmentation of products and markets and their small scales. It is interesting that the gaps in capital productivity between large firms and SMEs are not considerable except for semiconductor and
19
communication equipment sectors.
Figure 10: The Share of Large Firms in IT Industry, 1997-2001 Average.
Figure 11: Average Number of Employee by Establishment in the IT Industry
0
100
200
300
400
500
Semi Conductor
Display IT Parts Comm.Equip.
Computer Office Equip.
IT Home Appl.
Electri.Parts
Electri.Home Appl.
total
1985 1990 1995 2001
0
2 0
4 0
6 0
8 0
1 0 0
1 2 0
Semicond.
Display
Computer
IT H.A.
Comm. Eq.
Office Eq.
Electrical
H.A.
IT Parts
Electrical
Parts
(%)
E m p lo y e e O u tp u t C a p ita l S to c k
20
Table 5: Export Ratio by Size-cohort (1997 ~ 2001 average, %)
All 1~9 10~19 20~99 100~299 300~ Semiconductor IT parts Display Electrical parts Communication equipment Computer Office equipment Electrical home appliance IT home appliance Manufacturing total
68.52 37.52 62.32 25.26 25.22 57.26 27.94 31.47 51.91 28.59
3.37 5.59 3.40 2.70 5.09 4.33 8.08 2.95
11.24 4.83
10.87 5.70 8.45 5.26 7.67
12.60 3.07 5.03
15.63 7.41
25.93 18.00 28.27 13.92 14.92 16.95 15.71 11.04 26.79 13.41
42.42 38.95 32.43 25.70 23.66 43.23 30.36 12.27 36.05 21.02
70.19 51.10 64.75 37.64 27.62 61.88 36.51 45.81 63.46 41.22
Table 6: Capital Stock per Employee (1997 ~ 2001 average, million won per employee)
All 1~9 10~19 20~99 100~299 300~
Semiconductor IT parts Display Electrical parts Communication equipment Computer Office equipment Electrical home appliance IT home appliance Manufacturing total
246.48 58.62
152.77 48.99 42.05 55.69 45.77 48.14 32.33 83.96
25.46 21.88 27.66 20.73 21.09 23.28 23.24 22.43 23.33 28.57
27.85 20.83 25.89 22.91 19.12 19.01 23.15 22.33 16.11 31.63
33.01 34.73 25.18 29.74 23.49 23.93 29.40 28.64 20.00 43.62
65.20 62.68 30.15 52.70 37.64 39.28 65.31 48.19 29.68 82.19
272.77 94.77
186.94 94.94 67.95 77.07 61.88 79.98 46.19
181.31
Table 7: Labor Productivity by Size-cohort (1997 ~ 2001 average, million won per employee)
All 1~9 10~19 20~99 100~299 300~ Semiconductor IT parts Display Electrical parts Communication equipment Computer Office equipment Electrical home appliance IT home appliance Manufacturing total
151.89 57.53
186.65 54.51
155.41 139.87 75.72 43.34 59.58 52.95
6.66 31.96 35.26 31.24 40.42 41.54 37.08 20.04 34.95 18.71
6.91 32.26 32.47 32.75 44.82 48.89 46.06 20.18 33.18 22.42
5.71 39.57 34.92 36.46 58.33 54.25 61.06 24.26 39.77 29.78
21.21 57.20 37.61 50.89 70.82 58.43 84.76 48.28 49.40 51.94
170.70 86.26
227.54 101.00 325.07 213.68 95.56 71.65 87.20
110.72
21
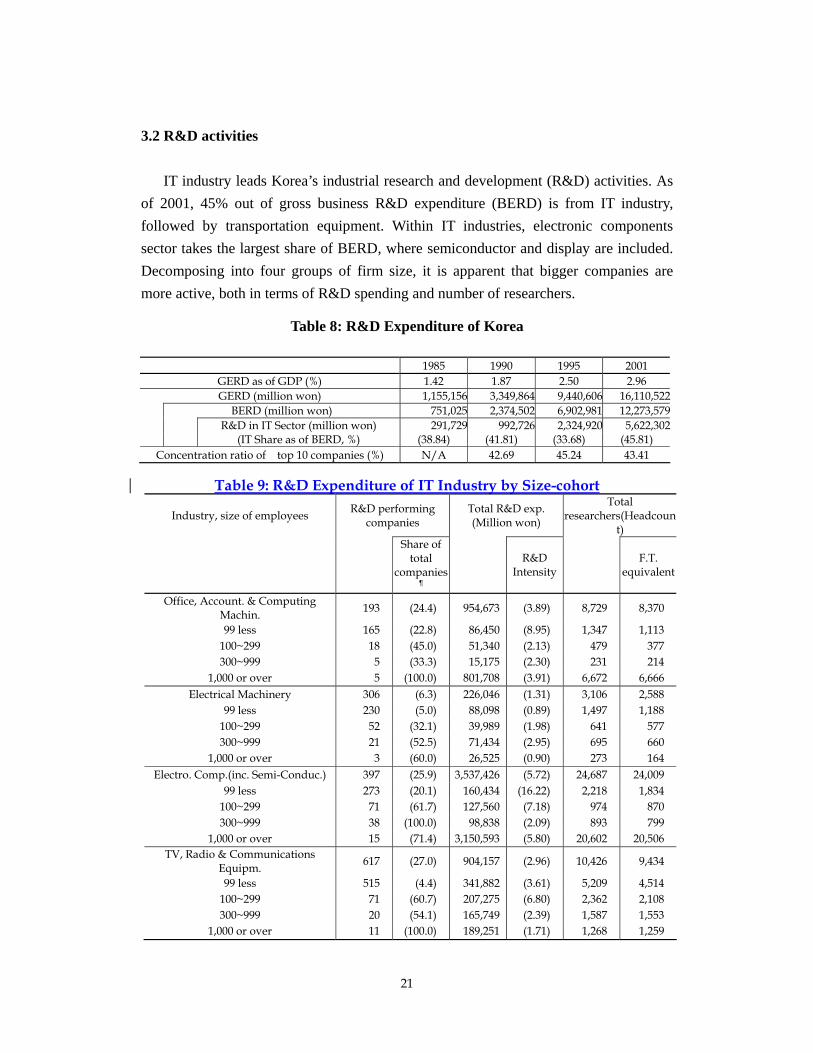
3.2 R&D activities IT industry leads Korea’s industrial research and development (R&D) activities. As of 2001, 45% out of gross business R&D expenditure (BERD) is from IT industry, followed by transportation equipment. Within IT industries, electronic components sector takes the largest share of BERD, where semiconductor and display are included. Decomposing into four groups of firm size, it is apparent that bigger companies are more active, both in terms of R&D spending and number of researchers.
Table 8: R&D Expenditure of Korea
1985 1990 1995 2001 GERD as of GDP (%) 1.42 1.87 2.50 2.96 GERD (million won) 1,155,156 3,349,864 9,440,606 16,110,522
BERD (million won) 751,025 2,374,502 6,902,981 12,273,579 R&D in IT Sector (million won) 291,729 992,726 2,324,920 5,622,302 (IT Share as of BERD, %) (38.84) (41.81) (33.68) (45.81) Concentration ratio of top 10 companies (%) N/A 42.69 45.24 43.41
Table 9: R&D Expenditure of IT Industry by Size-cohort
Industry, size of employees R&D performing companies
Total R&D exp. (Million won)
Total researchers(Headcoun
t)
Share of total
companies
R&D Intensity F.T.
equivalent
Office, Account. & Computing Machin. 193 (24.4) 954,673 (3.89) 8,729 8,370
99 less 165 (22.8) 86,450 (8.95) 1,347 1,113 100~299 18 (45.0) 51,340 (2.13) 479 377 300~999 5 (33.3) 15,175 (2.30) 231 214
1,000 or over 5 (100.0) 801,708 (3.91) 6,672 6,666 Electrical Machinery 306 (6.3) 226,046 (1.31) 3,106 2,588
99 less 230 (5.0) 88,098 (0.89) 1,497 1,188 100~299 52 (32.1) 39,989 (1.98) 641 577 300~999 21 (52.5) 71,434 (2.95) 695 660
1,000 or over 3 (60.0) 26,525 (0.90) 273 164 Electro. Comp.(inc. Semi-Conduc.) 397 (25.9) 3,537,426 (5.72) 24,687 24,009
99 less 273 (20.1) 160,434 (16.22) 2,218 1,834 100~299 71 (61.7) 127,560 (7.18) 974 870 300~999 38 (100.0) 98,838 (2.09) 893 799
1,000 or over 15 (71.4) 3,150,593 (5.80) 20,602 20,506 TV, Radio & Communications
Equipm. 617 (27.0) 904,157 (2.96) 10,426 9,434
99 less 515 (4.4) 341,882 (3.61) 5,209 4,514 100~299 71 (60.7) 207,275 (6.80) 2,362 2,108 300~999 20 (54.1) 165,749 (2.39) 1,587 1,553
1,000 or over 11 (100.0) 189,251 (1.71) 1,268 1,259
22
¶ Percentage share of R&D performing companies out of total number of companies Source: MOST and National Statistical Office.
23
According to IITA (Institute of Information Technology Agency), government spent 13% of total R&D expenditure of IT industry and the remaining 87% came from business enterprises in 2002. Although the government’s share of IT R&D spending is small, government has put highest priority on IT in its own R&D budget.
Table 10: Government R&D Expenditure on Prospective Technologies (Unit: billion won)
ICT Bio-tech Nano-tech Environment Aero-space USA(2002) 2,367.6 32,425.2 836.4 4,531.2 11,156.4
Japan(2001) 1,729.0 3,477.0 477.1 2,236.0 2,902.3
Germany(2002) 1,095.9 1,637.3 141.8 929.5 1,134.9
UK(2001) 205.6 1,527.8 403.2 681.9 247.4
Korea(2002) 464.7 432.9 174.0 231.1 179.9 Note: 1 dollar =1,200 won; 100 yen = 1,000 won; 1 pound = 1,900 won; 1 Euro = 1,300 won.
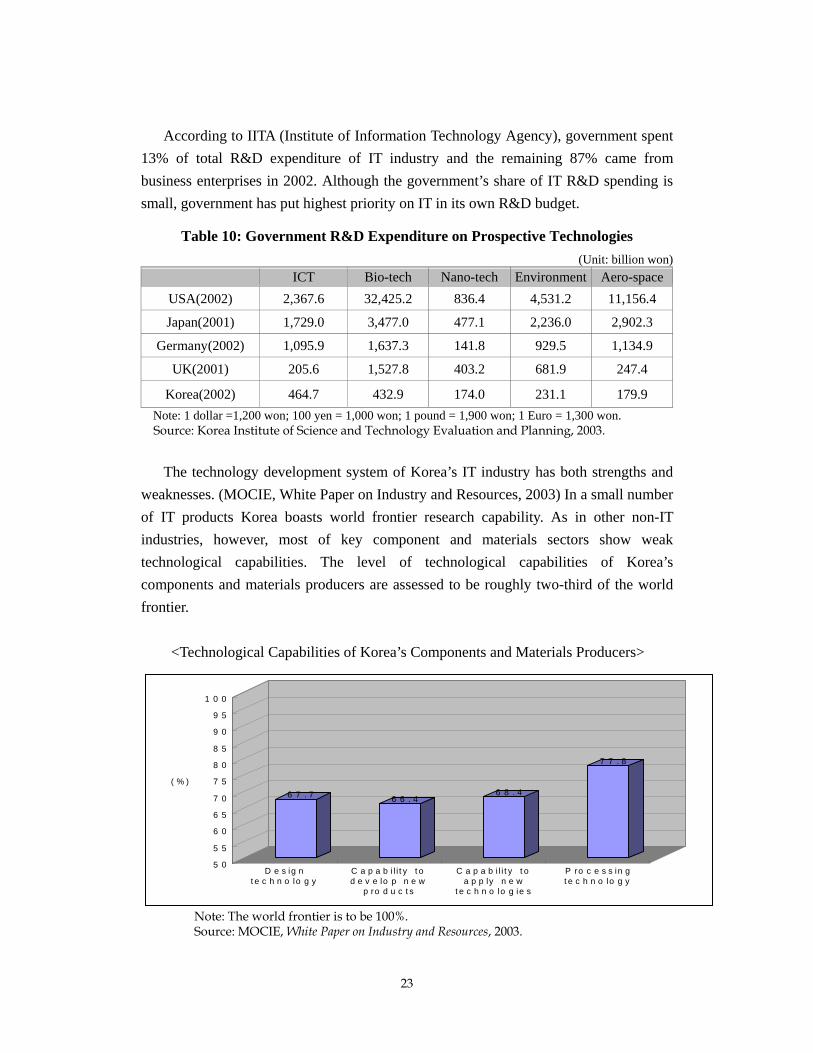
Source: Korea Institute of Science and Technology Evaluation and Planning, 2003. The technology development system of Korea’s IT industry has both strengths and weaknesses. (MOCIE, White Paper on Industry and Resources, 2003) In a small number of IT products Korea boasts world frontier research capability. As in other non-IT industries, however, most of key component and materials sectors show weak technological capabilities. The level of technological capabilities of Korea’s components and materials producers are assessed to be roughly two-third of the world frontier. <Technological Capabilities of Korea’s Components and Materials Producers>
Note: The world frontier is to be 100%. Source: MOCIE, White Paper on Industry and Resources, 2003.
6 7 . 7 6 6 . 46 8 . 4
7 7 . 8
5 0
5 5
6 0
6 5
7 0
7 5
8 0
8 5
9 0
9 5
1 0 0
( %)
D e s ig nte c h n o lo g y
C a p a b i l i ty tod e v e lo p n e w
p ro d u c ts
C a p a b i l i ty toa p p ly n e w
te c h n o lo g ie s
P ro c e s s in gte c h n o lo g y
24
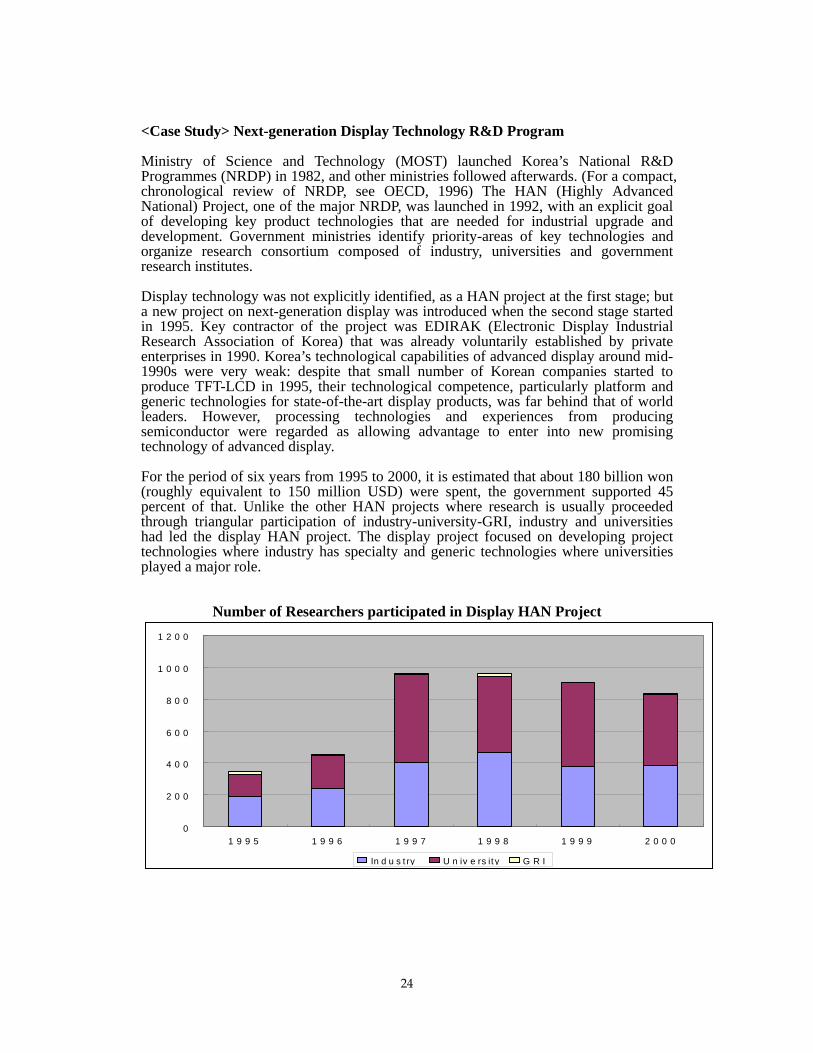
<Case Study> Next-generation Display Technology R&D Program Ministry of Science and Technology (MOST) launched Korea’s National R&D Programmes (NRDP) in 1982, and other ministries followed afterwards. (For a compact, chronological review of NRDP, see OECD, 1996) The HAN (Highly Advanced National) Project, one of the major NRDP, was launched in 1992, with an explicit goal of developing key product technologies that are needed for industrial upgrade and development. Government ministries identify priority-areas of key technologies and organize research consortium composed of industry, universities and government research institutes. Display technology was not explicitly identified, as a HAN project at the first stage; but a new project on next-generation display was introduced when the second stage started in 1995. Key contractor of the project was EDIRAK (Electronic Display Industrial Research Association of Korea) that was already voluntarily established by private enterprises in 1990. Korea’s technological capabilities of advanced display around mid-1990s were very weak: despite that small number of Korean companies started to produce TFT-LCD in 1995, their technological competence, particularly platform and generic technologies for state-of-the-art display products, was far behind that of world leaders. However, processing technologies and experiences from producing semiconductor were regarded as allowing advantage to enter into new promising technology of advanced display. For the period of six years from 1995 to 2000, it is estimated that about 180 billion won (roughly equivalent to 150 million USD) were spent, the government supported 45 percent of that. Unlike the other HAN projects where research is usually proceeded through triangular participation of industry-university-GRI, industry and universities had led the display HAN project. The display project focused on developing project technologies where industry has specialty and generic technologies where universities played a major role.
Number of Researchers participated in Display HAN Project
0
2 0 0
4 0 0
6 0 0
8 0 0
1 0 0 0
1 2 0 0
1 9 9 5 1 9 9 6 1 9 9 7 1 9 9 8 1 9 9 9 2 0 0 0
In d u s try U n iv e rs ity G R I
25
3.3 Sub-sectors Electronic Components Benefiting from booming exports of semiconductors since the latter half of the 1980s
and LCDs in recent years, the electronic components industry has been the leading sector in the electronics industry. Korea has been the third largest producer of electronic components in the world since the 1990s, following Japan and the United States. Comprised of a wide variety of products, electronic component producers are predominantly composed of small and medium-
size companies. The companies in this industry are divided into three categories; subsidiaries of conglomerates, specialized mid-size companies, and small companies. While subsidiaries of conglomerates develop active components that need huge facility investments, medium-size companies specialize in specific items and small companies produce general-use products. The
development of the electronic components industry in Korea has been hindered by decreasing domestic demand due to overseas investments in consumer electronics and fierce competition from developing countries in low and medium-grade products. However, owing to continuing technological research and development activities, Korean companies engaged in the electronic
components industry are making breakthroughs in the rapidly growing industrial electronics market. <Semiconductor and Display>
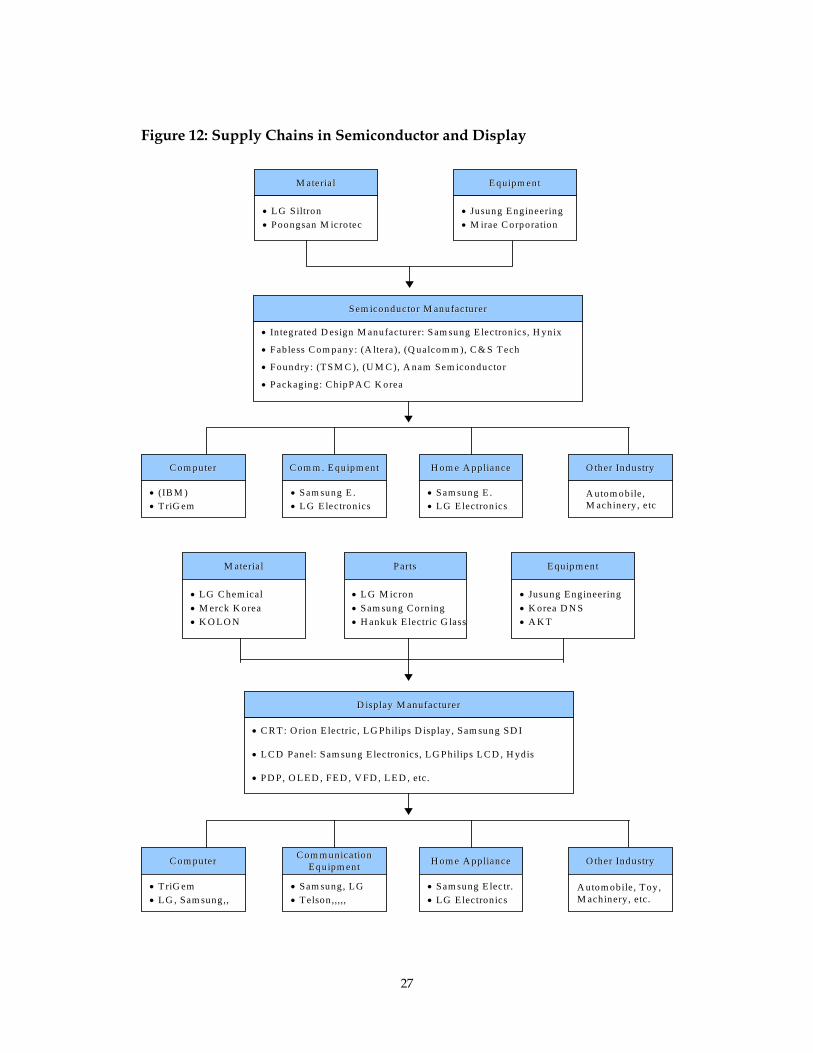
Korea’s semiconductor and display industries, where conglomerates with the capabilities to make large-scale investment play leading roles, have centered on DRAM and TFT-LCD. And a small number of specialized material and equipment suppliers have grown closely tied to the conglomerates and/or DRAM and TFT-LCD. Therefore SMEs are playing a marginal role in that most of them are dependent upon the mother companies or final demanders. Most of the SMEs connected to conglomerates lag behind conglomerates in their technological capabilities. Except for a few key technologies, the basic technological competence of these sectors is not so comparable to world players. In particular, most of the core components and materials are being procured from foreign suppliers or their subsidiaries in Korea. Therefore, local contents of the products are generally low. In terms of the structure of industrial linkage, semiconductor and display industries are related to such upstream industries as components & material and machinery and downstream industries such as computer, communication equipment,
26
electronics equipment, and automobiles. And the industrial structures of the semiconductor and display sectors are very similar; and major players in both sectors are the same. One of the crucial factors in the development of state-of-the-art display products is regarded as the accumulation of technology and experience in the production of such preceding products as CRT and semiconductor. Take the photo-mask of LG Micron as an example. The technological principle of photo-mask is photolithography. And this item is produced for semiconductor and FPD, with considerable support of technological accumulation and learning in the production process of shadow mask for CRT. Due to the relevance and the similarity of technologies in semiconductor and advanced display, there are many cases, where identical firms are placed in the supply chain of these sectors. For example, Jusung engineering and Soltron provide machinery in both sectors. Careful consideration should be given on the essential roles of conglomerates such as Samsung Electronics Co., Ltd. (SEC) and LG Electronics Inc. (LGE). These conglomerates participate in the semiconductor and display sectors, as well as in other electronics sectors. These business activities of conglomerates are evidently contrasted with other global firms with strategies of specialization in specific sectors of core competence.
In comparison with the structure of the world semiconductor industry, a large share of memory semiconductor is the distinctive feature of Korea’s semiconductor industry. In 2000, memory ships accounted for about 85% of domestic semiconductor production, while non-memory chips accounted for 76% in the global semiconductor industry. These features are ascribable to the fact that there are no leading firms in non-memory chips to drive the industry and the technological capabilities of incumbent firms are comparable to world leaders. While the demand of CRT is stagnant, new-technology based display products are rising rapidly, as is evidenced from surging demand for TFT-LCD. Korea’s advanced display industry is composed of about 200 (30,000 employees) specialized production companies such as module, machinery, components & material. Taking the composition of the firms into consideration, there are about 10 firms in module, 45 in machinery, 50 in parts & material, and 100 in other applied products. (Interview with EDIRAK) <Case Study > “To be added”
The rapid growth of Korea’s IT industry offers new business opportunity to non-IT companies.
The case of two non-IT firms will be included.
27
Figure 12: Supply Chains in Semiconductor and Display
M ateria lM ateria l
• L G S iltron• Poongsan M icro tec
S em iconductor M anufacturerS em iconductor M anufacturer
• In teg rated D esign M anufacturer: S am sung E lectron ics, H ynix
• F ab less C om pany: (A ltera), (Q ualcom m ), C & S T ech
• F oundry : (T S M C ), (U M C ), A nam Sem iconductor
• P ackaging: C hipP A C K orea
C om puterC om puter
• (IB M )• T riG em
C om m . E quipm entC om m . E quipm ent
• Sam sung E .• L G E lectron ics
H om e A pplianceH om e A ppliance
• S am sung E .• L G E lectron ics
O ther IndustryO ther Industry
A utom obile, M achinery , e tc
E quipm entE quipm ent
• Jusung E ngineering• M irae C orporation
D isplay M anufacturerD isplay M anufacturer
• C R T : O rion E lectric, L G Philips D isplay, Sam sung SD I
• L C D Panel: Sam sung E lectronics, L G Philips L C D , H ydis
• PD P, O L E D , FE D , V FD , L E D , etc.
C om puterC om puter
• T riG em• L G , Sam sung,,
C om m unicationC om m unicationE quipm entE quipm ent
• Sam sung, L G• T elson ,,,,,
H om e A pplianceH om e A ppliance
• Sam sung E lectr.• L G E lectronics
O ther IndustryO ther Industry
A utom obile, T oy,M achinery, etc.
PartsParts
• L G M icron• Sam sung C orning• H ankuk E lectric G lass
M aterialM aterial
• L G C hem ical• M erck K orea• K O L O N
E quipm entE quipm ent
• Jusung E ngineering• K orea D N S• A K T
28
Communications Equipment
The industry is concentrated with relatively low value-added products, mostly mobile phone sets, whereas high value-added products such as network equipment are dependent upon imports. Mobile phone sets account for over 70% of production of domestic wireless communication equipment, a significant market concentration for a single product. The export market is diversified from North America and Europe to such newly rising markets such as China. The industry’s growth is fueled by exports, despite stagnant domestic demand where LAN subscription is approaching the ceiling
Korea’s communications equipment industry is composed of three sorts of companies: 1) indigenous large firms that usually have a wide scope of products, 2) multinationals with specialized products from their own core competence, and 3) smaller companies that mostly produce based on OEM and/or ODM. As of 2000, the number of domestic communication equipment manufacturers is about 1,360, which includes 29 big firms and 1,331 SMEs. For the domestic communication equipment market, large firms that account for only 5% of the total number of firms take the lion’s share in terms of production volume or value-added. SEC and LGE have considerable influence which is evident by there grip of more than half of the domestic production volume, showing an oligopoly structure. Indigenous large firms are better positioned in the domestic mobile-phone market: they have strength in sales networks that can also offer more convenient after-services, acquiring most of the domestic market share. Only Motorola accounts for about 6% of the market share as a foreign company, while Nokia and Ericcson have negligible market penetration in Korea. (Their products are mostly exported – Interview with Nokia tmc.) Squeezed in the domestic market from the pressure of large firms, smaller firms find exit in foreign markets. The export share of SMEs in communications equipment industry is about half of the total exports.
29
4. ASSESSMENT OF INTERNATIONAL COMPETITIVENESS 4.1. Trade Performance
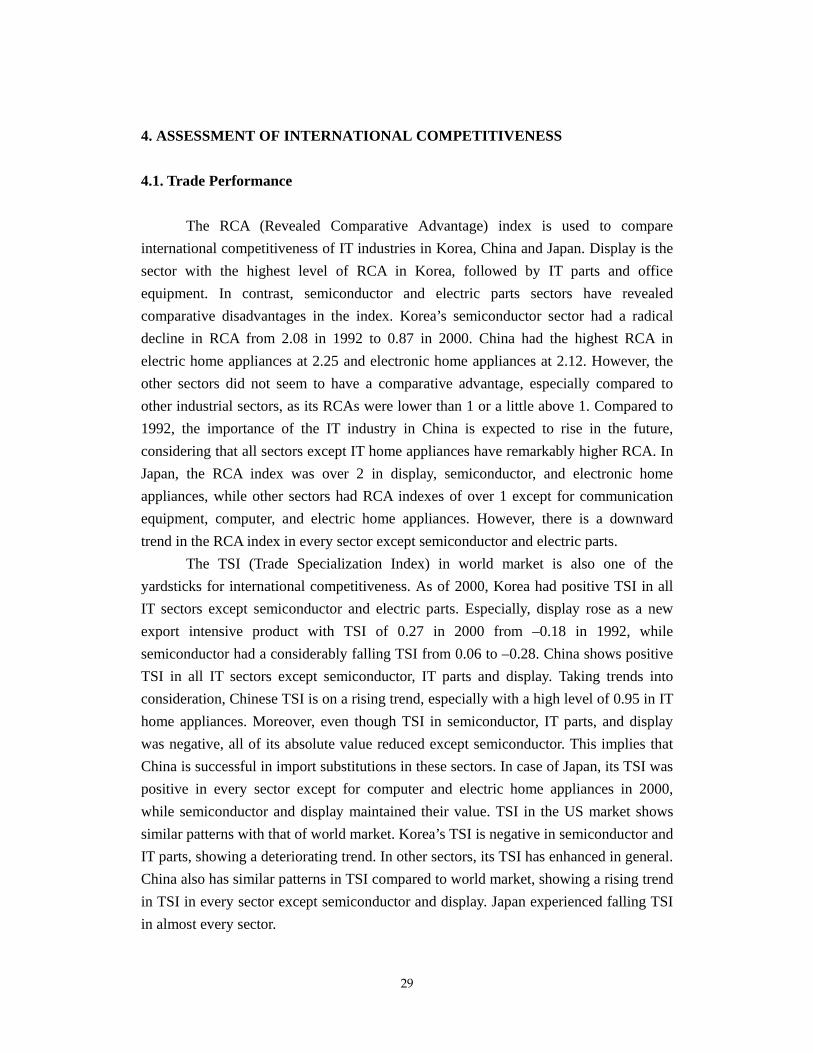
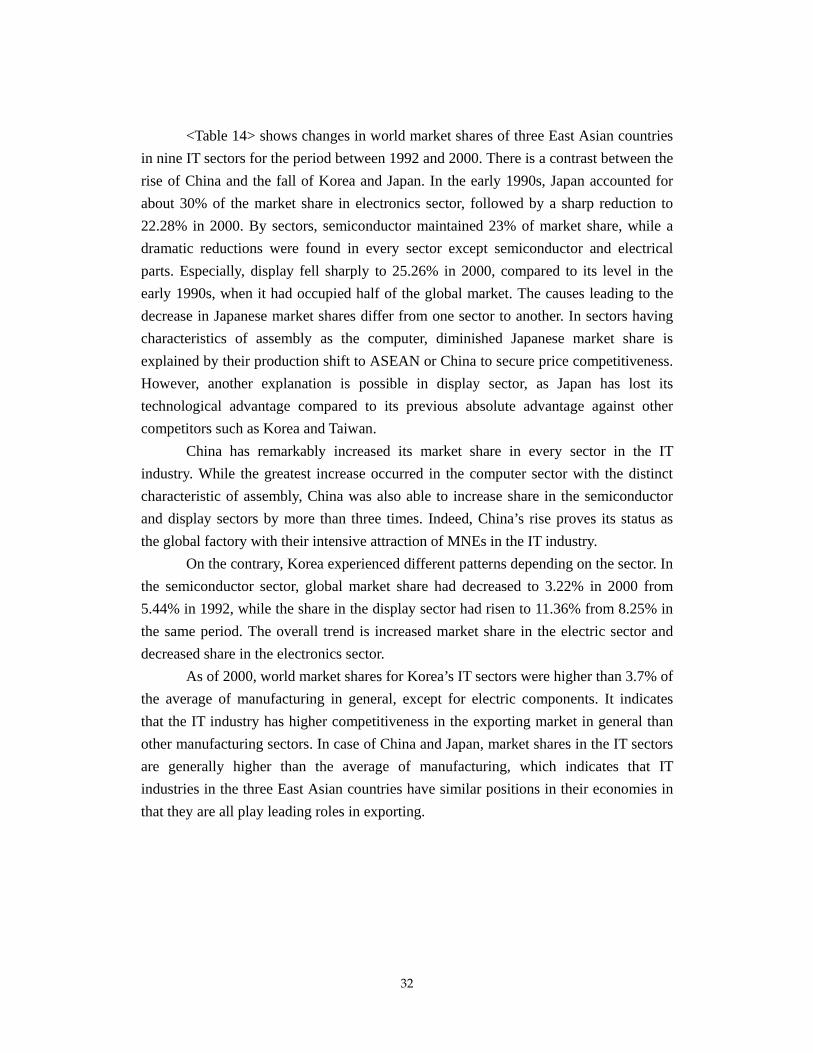
The RCA (Revealed Comparative Advantage) index is used to compare international competitiveness of IT industries in Korea, China and Japan. Display is the sector with the highest level of RCA in Korea, followed by IT parts and office equipment. In contrast, semiconductor and electric parts sectors have revealed comparative disadvantages in the index. Korea’s semiconductor sector had a radical decline in RCA from 2.08 in 1992 to 0.87 in 2000. China had the highest RCA in electric home appliances at 2.25 and electronic home appliances at 2.12. However, the other sectors did not seem to have a comparative advantage, especially compared to other industrial sectors, as its RCAs were lower than 1 or a little above 1. Compared to 1992, the importance of the IT industry in China is expected to rise in the future, considering that all sectors except IT home appliances have remarkably higher RCA. In Japan, the RCA index was over 2 in display, semiconductor, and electronic home appliances, while other sectors had RCA indexes of over 1 except for communication equipment, computer, and electric home appliances. However, there is a downward trend in the RCA index in every sector except semiconductor and electric parts.
The TSI (Trade Specialization Index) in world market is also one of the yardsticks for international competitiveness. As of 2000, Korea had positive TSI in all IT sectors except semiconductor and electric parts. Especially, display rose as a new export intensive product with TSI of 0.27 in 2000 from –0.18 in 1992, while semiconductor had a considerably falling TSI from 0.06 to –0.28. China shows positive TSI in all IT sectors except semiconductor, IT parts and display. Taking trends into consideration, Chinese TSI is on a rising trend, especially with a high level of 0.95 in IT home appliances. Moreover, even though TSI in semiconductor, IT parts, and display was negative, all of its absolute value reduced except semiconductor. This implies that China is successful in import substitutions in these sectors. In case of Japan, its TSI was positive in every sector except for computer and electric home appliances in 2000, while semiconductor and display maintained their value. TSI in the US market shows similar patterns with that of world market. Korea’s TSI is negative in semiconductor and IT parts, showing a deteriorating trend. In other sectors, its TSI has enhanced in general. China also has similar patterns in TSI compared to world market, showing a rising trend in TSI in every sector except semiconductor and display. Japan experienced falling TSI in almost every sector.
30
Table 11: Revealed Comparative Advantage
Korea China Japan
1992 2000 1992 2000 1992 2000 Semiconductor IT parts Display Electrical parts Comm. Equipment Computer Office equipment Electrical home appliances IT home appliances
2.08 4.41 3.15 0.58 1.37 1.11 0.55 1.76 3.57
0.87 2.56 3.06 0.48 1.44 1.48 1.88 1.83 1.61
0.49 0.14 0.45 0.91 0.79 0.16 0.48 1.17 2.13
0.82 0.37 0.82 1.24 1.21 1.25 0.99 2.25 2.12
2.05 1.67 3.64 1.44 2.35 1.88 1.92 0.54 2.54
2.33 1.39 2.54 1.53 0.82 0.87 1.36 0.23 2.22
All manufacturing 1 1 1 1 1 1 Source: Calculated from UN Trade data.
Table 12: Trade Specialization Index in World Market
Korea China Japan 1992 2000 1992 2000 1992 2000
Semiconductor IT parts Display Electrical parts Comm. Equipment Computer Office equipment Electrical homeappliances IT home appliances
0.06 0.21 -0.18 -0.18 0.26 0.34 0.16 0.77 0.89
-0.28 0.09 0.27 -0.23 0.35 0.42 0.46 0.78 0.69
-0.23 -0.67 -0.64 -0.10 -0.39 -0.22 0.03 0.59 0.78
-0.43 -0.56 -0.55 0.08 0.01 0.42 0.09 0.88 0.95
0.63 0.54 0.84 0.66 0.77 0.66 0.67 0.50 0.85
0.65 0.24 0.84 0.48 0.29 -0.08 0.34 -0.31 0.52
All manufacturing 0.08 0.17 0.02 0.10 0.36 0.24 Source: Calculated from UN Trade data.
Table 13: Trade Specialization Index in US Market
Korea China Japan 1992 2000 1992 2000 1992 2000
Semiconductor IT parts Display Electrical parts Comm. Equipment Computer Office equipment Electrical home appliances IT home appliances
0.58 0.25 -0.64 -0.19 0.24 0.43 0.32 0.74 0.98
-0.63 -0.10 -0.03 -0.05 0.27 0.62 0.70 0.83 0.87
-0.30 -0.72 -0.07 -0.36 -0.68 -0.58 0.00 0.84 0.90
-0.35 -0.33 -0.46 0.52 0.05 0.50 0.44 0.98 0.99
0.49 0.25 0.86 0.58 0.69 0.59 0.62 0.70 0.96
0.46 0.03 0.86 0.45 0.28 0.36 0.53 0.51 0.96
All manufacturing 0.04 0.15 -0.01 0.43 0.38 0.37

31
32
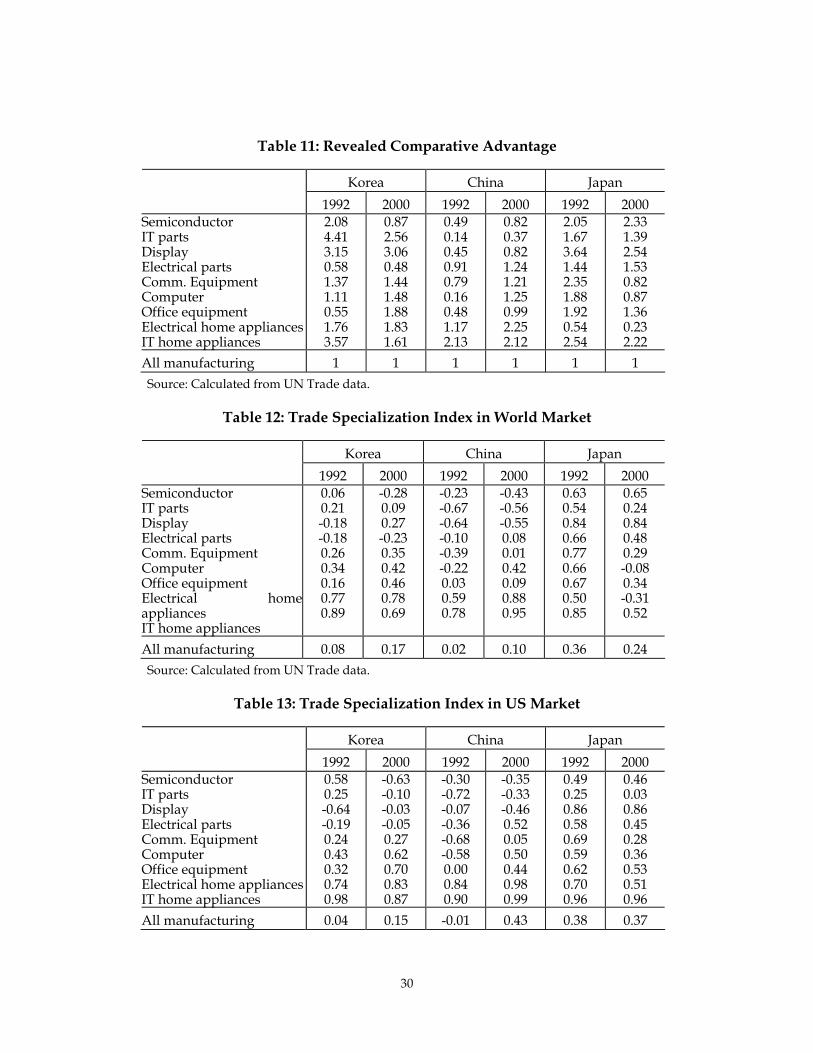
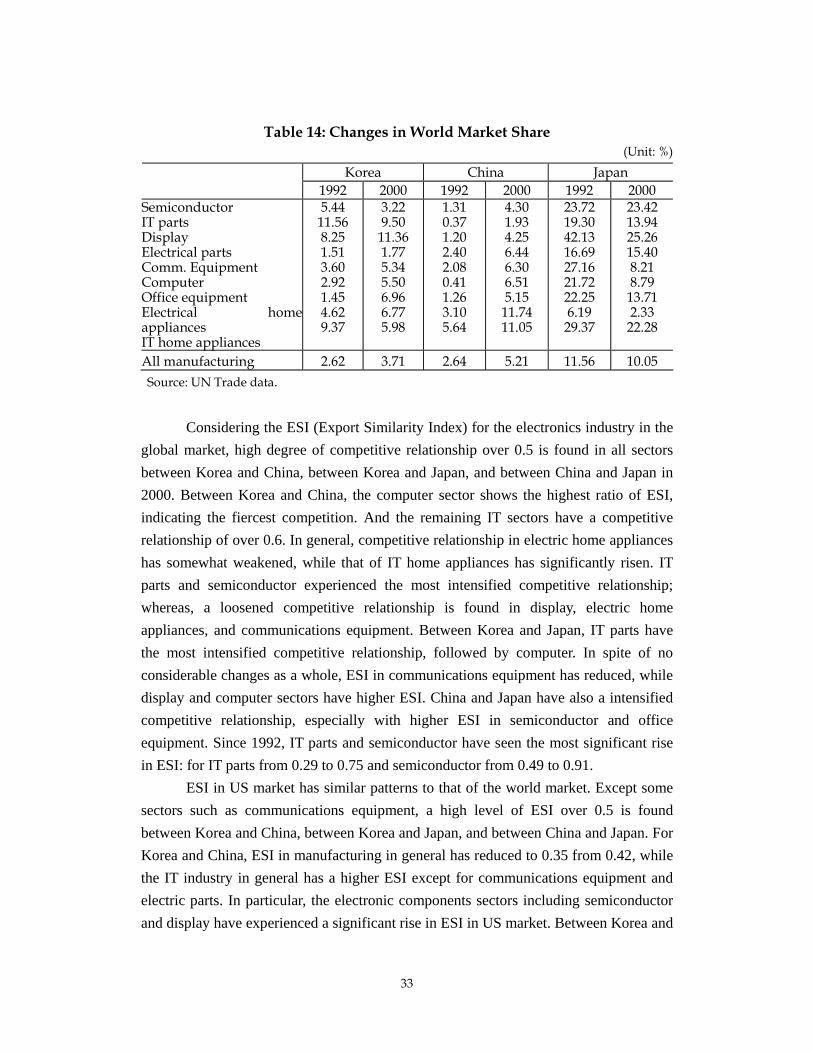
<Table 14> shows changes in world market shares of three East Asian countries in nine IT sectors for the period between 1992 and 2000. There is a contrast between the rise of China and the fall of Korea and Japan. In the early 1990s, Japan accounted for about 30% of the market share in electronics sector, followed by a sharp reduction to 22.28% in 2000. By sectors, semiconductor maintained 23% of market share, while a dramatic reductions were found in every sector except semiconductor and electrical parts. Especially, display fell sharply to 25.26% in 2000, compared to its level in the early 1990s, when it had occupied half of the global market. The causes leading to the decrease in Japanese market shares differ from one sector to another. In sectors having characteristics of assembly as the computer, diminished Japanese market share is explained by their production shift to ASEAN or China to secure price competitiveness. However, another explanation is possible in display sector, as Japan has lost its technological advantage compared to its previous absolute advantage against other competitors such as Korea and Taiwan.
China has remarkably increased its market share in every sector in the IT industry. While the greatest increase occurred in the computer sector with the distinct characteristic of assembly, China was also able to increase share in the semiconductor and display sectors by more than three times. Indeed, China’s rise proves its status as the global factory with their intensive attraction of MNEs in the IT industry.
On the contrary, Korea experienced different patterns depending on the sector. In the semiconductor sector, global market share had decreased to 3.22% in 2000 from 5.44% in 1992, while the share in the display sector had risen to 11.36% from 8.25% in the same period. The overall trend is increased market share in the electric sector and decreased share in the electronics sector.
As of 2000, world market shares for Korea’s IT sectors were higher than 3.7% of the average of manufacturing in general, except for electric components. It indicates that the IT industry has higher competitiveness in the exporting market in general than other manufacturing sectors. In case of China and Japan, market shares in the IT sectors are generally higher than the average of manufacturing, which indicates that IT industries in the three East Asian countries have similar positions in their economies in that they are all play leading roles in exporting.
33
Table 14: Changes in World Market Share (Unit: %)
Korea China Japan 1992 2000 1992 2000 1992 2000
Semiconductor IT parts Display Electrical parts Comm. Equipment Computer Office equipment Electrical homeappliances IT home appliances
5.44 11.56 8.25 1.51 3.60 2.92 1.45 4.62 9.37
3.22 9.50 11.36 1.77 5.34 5.50 6.96 6.77 5.98
1.31 0.37 1.20 2.40 2.08 0.41 1.26 3.10 5.64
4.30 1.93 4.25 6.44 6.30 6.51 5.15 11.74 11.05
23.72 19.30 42.13 16.69 27.16 21.72 22.25 6.19 29.37
23.42 13.94 25.26 15.40 8.21 8.79 13.71 2.33 22.28
All manufacturing 2.62 3.71 2.64 5.21 11.56 10.05 Source: UN Trade data.
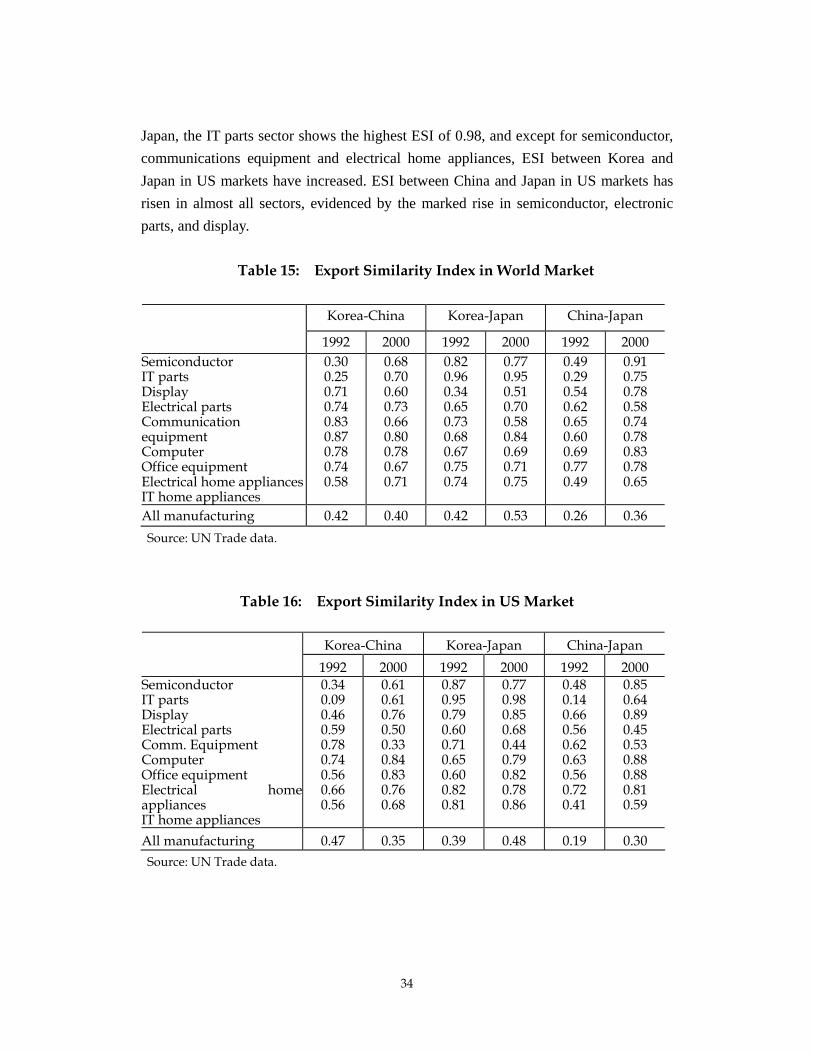
Considering the ESI (Export Similarity Index) for the electronics industry in the global market, high degree of competitive relationship over 0.5 is found in all sectors between Korea and China, between Korea and Japan, and between China and Japan in 2000. Between Korea and China, the computer sector shows the highest ratio of ESI, indicating the fiercest competition. And the remaining IT sectors have a competitive relationship of over 0.6. In general, competitive relationship in electric home appliances has somewhat weakened, while that of IT home appliances has significantly risen. IT parts and semiconductor experienced the most intensified competitive relationship; whereas, a loosened competitive relationship is found in display, electric home appliances, and communications equipment. Between Korea and Japan, IT parts have the most intensified competitive relationship, followed by computer. In spite of no considerable changes as a whole, ESI in communications equipment has reduced, while display and computer sectors have higher ESI. China and Japan have also a intensified competitive relationship, especially with higher ESI in semiconductor and office equipment. Since 1992, IT parts and semiconductor have seen the most significant rise in ESI: for IT parts from 0.29 to 0.75 and semiconductor from 0.49 to 0.91.
ESI in US market has similar patterns to that of the world market. Except some sectors such as communications equipment, a high level of ESI over 0.5 is found between Korea and China, between Korea and Japan, and between China and Japan. For Korea and China, ESI in manufacturing in general has reduced to 0.35 from 0.42, while the IT industry in general has a higher ESI except for communications equipment and electric parts. In particular, the electronic components sectors including semiconductor and display have experienced a significant rise in ESI in US market. Between Korea and
34
Japan, the IT parts sector shows the highest ESI of 0.98, and except for semiconductor, communications equipment and electrical home appliances, ESI between Korea and Japan in US markets have increased. ESI between China and Japan in US markets has risen in almost all sectors, evidenced by the marked rise in semiconductor, electronic parts, and display.
Table 15: Export Similarity Index in World Market
Korea-China Korea-Japan China-Japan
1992 2000 1992 2000 1992 2000 Semiconductor IT parts Display Electrical parts Communication equipment Computer Office equipment Electrical home appliances IT home appliances
0.30 0.25 0.71 0.74 0.83 0.87 0.78 0.74 0.58
0.68 0.70 0.60 0.73 0.66 0.80 0.78 0.67 0.71
0.82 0.96 0.34 0.65 0.73 0.68 0.67 0.75 0.74
0.77 0.95 0.51 0.70 0.58 0.84 0.69 0.71 0.75
0.49 0.29 0.54 0.62 0.65 0.60 0.69 0.77 0.49
0.91 0.75 0.78 0.58 0.74 0.78 0.83 0.78 0.65
All manufacturing 0.42 0.40 0.42 0.53 0.26 0.36 Source: UN Trade data.
Table 16: Export Similarity Index in US Market
Korea-China Korea-Japan China-Japan 1992 2000 1992 2000 1992 2000
Semiconductor IT parts Display Electrical parts Comm. Equipment Computer Office equipment Electrical homeappliances IT home appliances
0.34 0.09 0.46 0.59 0.78 0.74 0.56 0.66 0.56
0.61 0.61 0.76 0.50 0.33 0.84 0.83 0.76 0.68
0.87 0.95 0.79 0.60 0.71 0.65 0.60 0.82 0.81
0.77 0.98 0.85 0.68 0.44 0.79 0.82 0.78 0.86
0.48 0.14 0.66 0.56 0.62 0.63 0.56 0.72 0.41
0.85 0.64 0.89 0.45 0.53 0.88 0.88 0.81 0.59
All manufacturing 0.47 0.35 0.39 0.48 0.19 0.30 Source: UN Trade data.
35
4.2 Sub-sectors Semiconductor
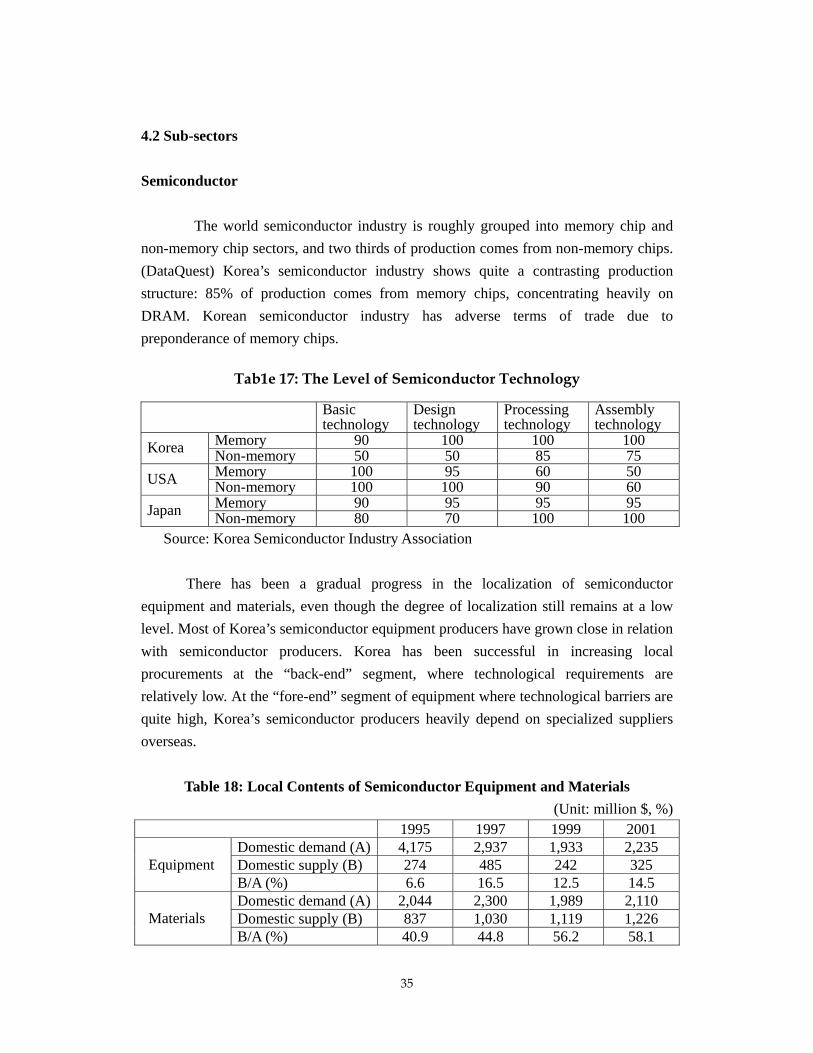
The world semiconductor industry is roughly grouped into memory chip and non-memory chip sectors, and two thirds of production comes from non-memory chips. (DataQuest) Korea’s semiconductor industry shows quite a contrasting production structure: 85% of production comes from memory chips, concentrating heavily on DRAM. Korean semiconductor industry has adverse terms of trade due to preponderance of memory chips.
Tab1e 17: The Level of Semiconductor Technology
Basic
technology Design technology
Processing technology
Assembly technology
Memory 90 100 100 100 Korea Non-memory 50 50 85 75 Memory 100 95 60 50 USA Non-memory 100 100 90 60 Memory 90 95 95 95 Japan Non-memory 80 70 100 100
Source: Korea Semiconductor Industry Association
There has been a gradual progress in the localization of semiconductor equipment and materials, even though the degree of localization still remains at a low level. Most of Korea’s semiconductor equipment producers have grown close in relation with semiconductor producers. Korea has been successful in increasing local procurements at the “back-end” segment, where technological requirements are relatively low. At the “fore-end” segment of equipment where technological barriers are quite high, Korea’s semiconductor producers heavily depend on specialized suppliers overseas.
Table 18: Local Contents of Semiconductor Equipment and Materials (Unit: million $, %)
1995 1997 1999 2001 Domestic demand (A) 4,175 2,937 1,933 2,235 Domestic supply (B) 274 485 242 325 Equipment B/A (%) 6.6 16.5 12.5 14.5 Domestic demand (A) 2,044 2,300 1,989 2,110 Domestic supply (B) 837 1,030 1,119 1,226 Materials B/A (%) 40.9 44.8 56.2 58.1
36
Source: Korea Semiconductor Industry Association Display
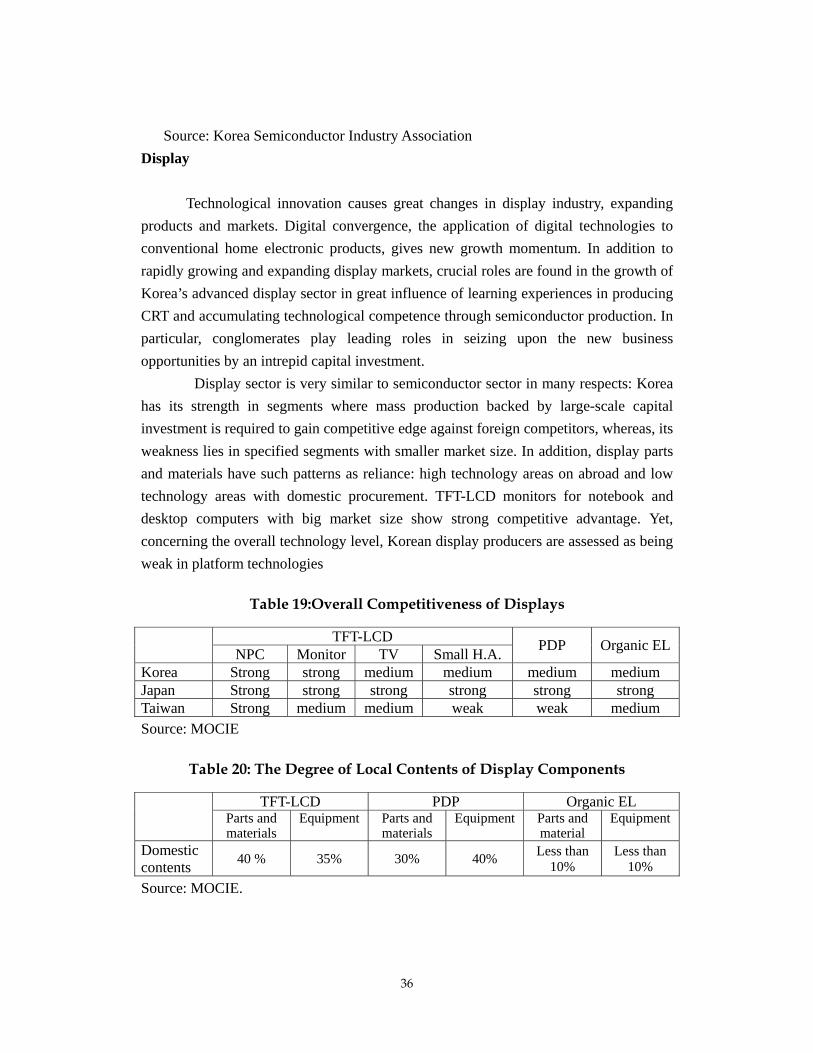
Technological innovation causes great changes in display industry, expanding products and markets. Digital convergence, the application of digital technologies to conventional home electronic products, gives new growth momentum. In addition to rapidly growing and expanding display markets, crucial roles are found in the growth of Korea’s advanced display sector in great influence of learning experiences in producing CRT and accumulating technological competence through semiconductor production. In particular, conglomerates play leading roles in seizing upon the new business opportunities by an intrepid capital investment. Display sector is very similar to semiconductor sector in many respects: Korea has its strength in segments where mass production backed by large-scale capital investment is required to gain competitive edge against foreign competitors, whereas, its weakness lies in specified segments with smaller market size. In addition, display parts and materials have such patterns as reliance: high technology areas on abroad and low technology areas with domestic procurement. TFT-LCD monitors for notebook and desktop computers with big market size show strong competitive advantage. Yet, concerning the overall technology level, Korean display producers are assessed as being weak in platform technologies
Table 19:Overall Competitiveness of Displays
TFT-LCD NPC Monitor TV Small H.A. PDP Organic EL
Korea Strong strong medium medium medium medium Japan Strong strong strong strong strong strong Taiwan Strong medium medium weak weak medium Source: MOCIE
Table 20: The Degree of Local Contents of Display Components
TFT-LCD PDP Organic EL Parts and materials
Equipment Parts and materials
Equipment Parts and material
Equipment
Domestic contents 40 % 35% 30% 40% Less than
10% Less than
10% Source: MOCIE.
37
Communications Equipment
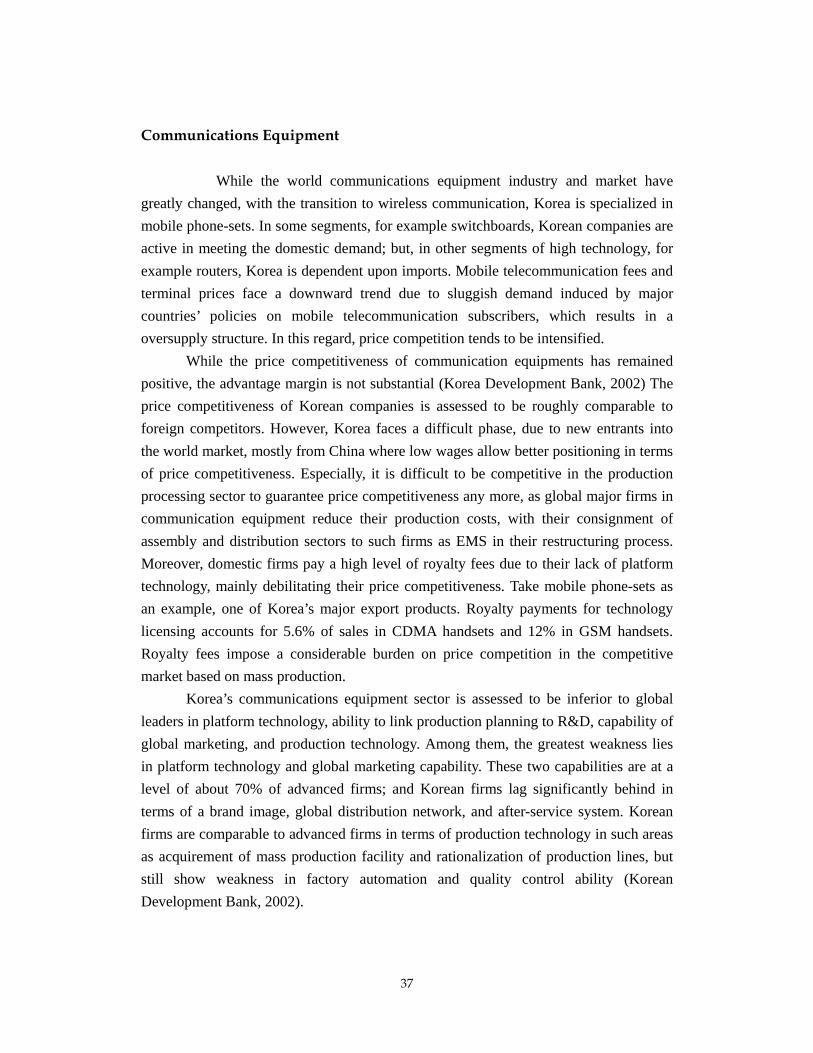
While the world communications equipment industry and market have greatly changed, with the transition to wireless communication, Korea is specialized in mobile phone-sets. In some segments, for example switchboards, Korean companies are active in meeting the domestic demand; but, in other segments of high technology, for example routers, Korea is dependent upon imports. Mobile telecommunication fees and terminal prices face a downward trend due to sluggish demand induced by major countries’ policies on mobile telecommunication subscribers, which results in a oversupply structure. In this regard, price competition tends to be intensified.
While the price competitiveness of communication equipments has remained positive, the advantage margin is not substantial (Korea Development Bank, 2002) The price competitiveness of Korean companies is assessed to be roughly comparable to foreign competitors. However, Korea faces a difficult phase, due to new entrants into the world market, mostly from China where low wages allow better positioning in terms of price competitiveness. Especially, it is difficult to be competitive in the production processing sector to guarantee price competitiveness any more, as global major firms in communication equipment reduce their production costs, with their consignment of assembly and distribution sectors to such firms as EMS in their restructuring process. Moreover, domestic firms pay a high level of royalty fees due to their lack of platform technology, mainly debilitating their price competitiveness. Take mobile phone-sets as an example, one of Korea’s major export products. Royalty payments for technology licensing accounts for 5.6% of sales in CDMA handsets and 12% in GSM handsets. Royalty fees impose a considerable burden on price competition in the competitive market based on mass production.
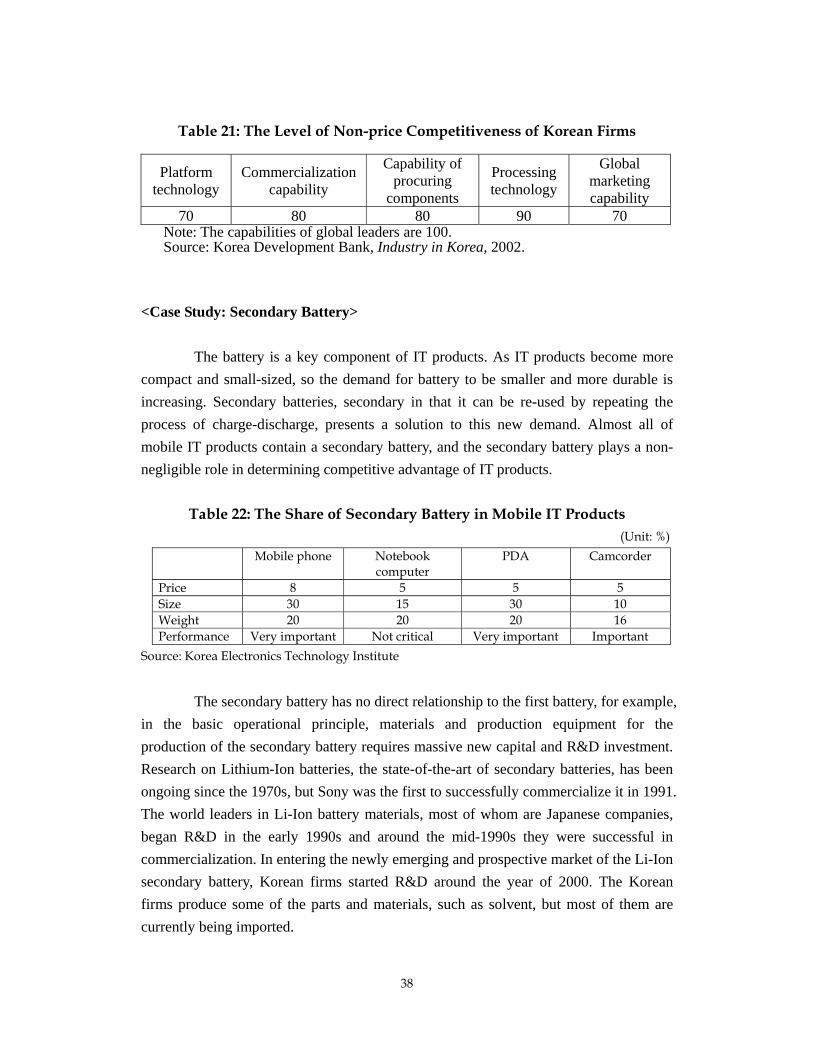
Korea’s communications equipment sector is assessed to be inferior to global leaders in platform technology, ability to link production planning to R&D, capability of global marketing, and production technology. Among them, the greatest weakness lies in platform technology and global marketing capability. These two capabilities are at a level of about 70% of advanced firms; and Korean firms lag significantly behind in terms of a brand image, global distribution network, and after-service system. Korean firms are comparable to advanced firms in terms of production technology in such areas as acquirement of mass production facility and rationalization of production lines, but still show weakness in factory automation and quality control ability (Korean Development Bank, 2002).
38
Table 21: The Level of Non-price Competitiveness of Korean Firms
Platform technology
Commercialization capability
Capability of procuring
components
Processing technology
Global marketing capability
70 80 80 90 70 Note: The capabilities of global leaders are 100. Source: Korea Development Bank, Industry in Korea, 2002.
<Case Study: Secondary Battery>
The battery is a key component of IT products. As IT products become more compact and small-sized, so the demand for battery to be smaller and more durable is increasing. Secondary batteries, secondary in that it can be re-used by repeating the process of charge-discharge, presents a solution to this new demand. Almost all of mobile IT products contain a secondary battery, and the secondary battery plays a non-negligible role in determining competitive advantage of IT products.
Table 22: The Share of Secondary Battery in Mobile IT Products (Unit: %)
Mobile phone Notebook computer
PDA Camcorder
Price 8 5 5 5 Size 30 15 30 10 Weight 20 20 20 16 Performance Very important Not critical Very important Important
Source: Korea Electronics Technology Institute
The secondary battery has no direct relationship to the first battery, for example, in the basic operational principle, materials and production equipment for the production of the secondary battery requires massive new capital and R&D investment. Research on Lithium-Ion batteries, the state-of-the-art of secondary batteries, has been ongoing since the 1970s, but Sony was the first to successfully commercialize it in 1991. The world leaders in Li-Ion battery materials, most of whom are Japanese companies, began R&D in the early 1990s and around the mid-1990s they were successful in commercialization. In entering the newly emerging and prospective market of the Li-Ion secondary battery, Korean firms started R&D around the year of 2000. The Korean firms produce some of the parts and materials, such as solvent, but most of them are currently being imported.
39
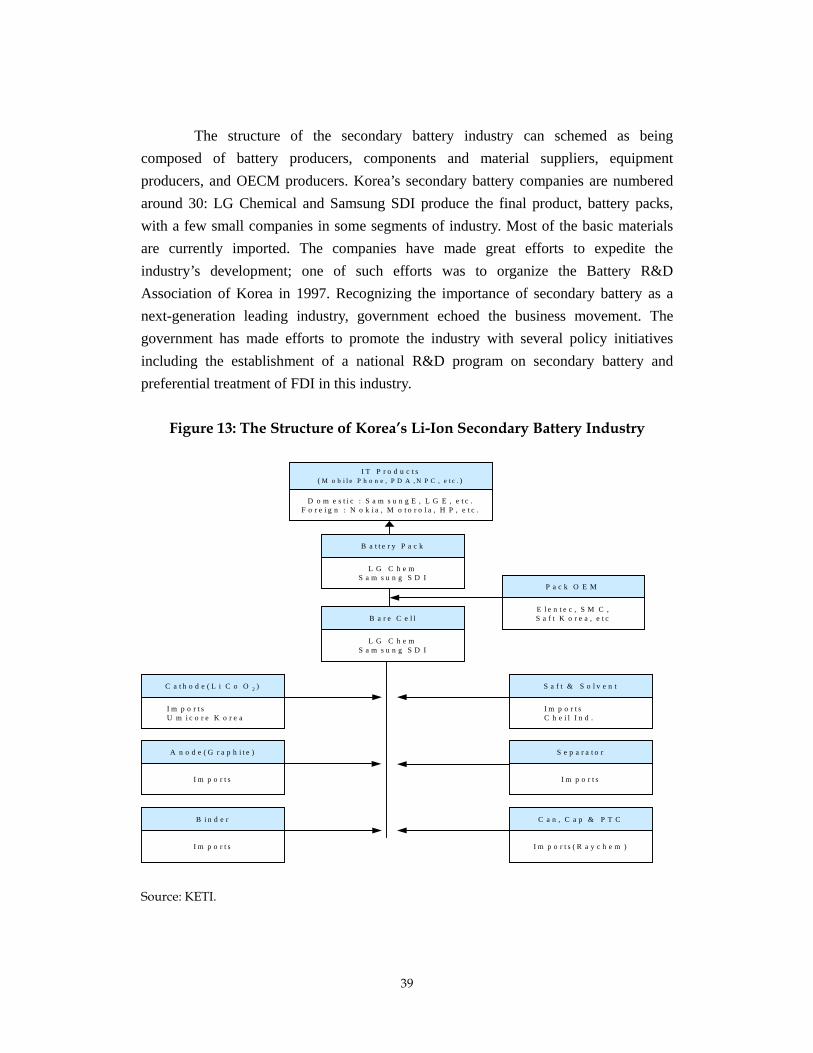
The structure of the secondary battery industry can schemed as being composed of battery producers, components and material suppliers, equipment producers, and OECM producers. Korea’s secondary battery companies are numbered around 30: LG Chemical and Samsung SDI produce the final product, battery packs, with a few small companies in some segments of industry. Most of the basic materials are currently imported. The companies have made great efforts to expedite the industry’s development; one of such efforts was to organize the Battery R&D Association of Korea in 1997. Recognizing the importance of secondary battery as a next-generation leading industry, government echoed the business movement. The government has made efforts to promote the industry with several policy initiatives including the establishment of a national R&D program on secondary battery and preferential treatment of FDI in this industry.
Figure 13: The Structure of Korea’s Li-Ion Secondary Battery Industry
Source: KETI.
I T P r o d u c t s( M o b i l e P h o n e , P D A , N P C , e t c . )
D o m e s t i c : S a m s u n g E , L G E , e t c .F o r e i g n : N o k i a , M o t o r o l a , H P , e t c .
B a t t e r y P a c k
L G C h e mS a m s u n g S D I
P a c k O E M
E l e n t e c , S M C ,S a f t K o r e a , e t cB a r e C e l l
L G C h e mS a m s u n g S D I
C a t h o d e ( L i C o O 2 )
I m p o r t s U m i c o r e K o r e a
S a f t & S o l v e n t
I m p o r t s C h e i l I n d .
A n o d e ( G r a p h i t e )
I m p o r t s
S e p a r a t o r
I m p o r t s
B i n d e r
I m p o r t s
C a n , C a p & P T C
I m p o r t s ( R a y c h e m )
40
5. DISCUSSION
Korea’s IT industry has made great advances from the stage of imitation to the stage of own design and technological leadership in a few products. Conglomerates have played a leading role in this condensed development process. Their crucial role is especially found in the process of overcoming disadvantages as latecomers, building mass production systems where government support was also important and achieving maximum efficiency in the production process. From the perspective of technology and product life cycle, this experience is a case of the so-called reverse path strategy, where products and technology enter first at a mature stage and then are switched to new emerging products and technology (Kim and Dahlman, 1992).
Is reverse strategy still applicable to Korea’s IT industry today? Answering this question requires paying close attention to the changes in the IT industry in general: changes in the global players’ business strategies and global production system, which are prominently happening in the Asian economies. According to Ernst and Ravenhill (2000), Asian production networks of global firms underwent two transitions. When multinational firms had started to expand their production bases since 1960s, they had targeted mainly Korea, Taiwan and Hong Kong. Since mid-1980s, production bases of multinationals were moved to ASEAN (mainly Singapore, Malaysia and Taiwan). Since 1992, China replaced these bases. The expansion and transition of international production networks has intensified linkages among the electronics industry of Asian nations, bringing about fiercer competitions among these countries in the world market. In this process, global firms have undergone breakdown in vertically integrated production system. While shifting production into Asian economies, global enterprises have specialized in such sectors with higher value added. The changes arising from strengthened linkages in the global IT industry by global firms implicate that Asian latecomers are not at a disadvantage competing with Korean firms, in particular through the network of global firms. In other words, Asian nations that play a role as production bases for high tech products are not disadvantageously positioned, compared with Korea’s production system that is led by conglomerates. Furthermore, China, with a huge domestic market that enables the establishment of mass production systems, is being transformed to be the workshop of the world. What requires close attention is the fact that China’s IT industry is currently experiencing the development of indigenous firms.
Considering these changes, the reverse path strategy of Korea’s IT industry will not be effective any longer. How can Korea’s electronics industry cope with these
41
changes? The answer to this question will be revealed through more detailed review of the status of Korean firms in light of its main elements of competitiveness.
Business interviews reveal that efforts for strengthening competitiveness in non-price sectors such as design and technology-development have been made in sectors led by conglomerates. However, there were insignificant improvements in non-price elements of competitiveness where mid-size companies and SMEs take relatively large shares. In the IT industry in general, China rapidly rises in computer and home appliances in which price elements play a more important role. In contrast, Chinese competition is relatively low in memory semiconductor and advanced display sectors in which non-price factors of technology and huge investment are crucial elements of competitiveness.
Korea has shown superior performance in such sectors that apply digital technology to existing products in home appliances. In general, Korean technological capability in the electronics industry is strong in business sectors comprised of conglomerates, which can implement a global business strategy. However, SMEs have substantially weak technological capability except for a few specialized products from mid-sized companies.
Korea’s IT industry has undergone a bifurcation between leading conglomerates and the remaining smaller firms. Leading conglomerates can command their own brand and marketing strategies in the global market, while most of the SMEs still rely on OEM. This bifurcation is also evident in the domestic supply chains. For instance, SMEs as suppliers to conglomerates lack bargaining power, due to either their lagging technological competence or less diversified customers. Rarely, they target overseas markets. Business services do not play a significant role in the value-chain of the electronics industry in general, as differentiation of value chain is not actively implemented compared to the US, Japan and Europe, partly due to a vertically integrated business structure of dominant conglomerates.
The current status of the Korean electronics industry is summarized as follows: 1) There are high levels of industrial competitiveness in sub-sectors, led by vertically integrated conglomerates in a wide range of products. 2) In those sectors where leading conglomerates’ roles are minor, firms have weak linkages with global production networks and the competitiveness of SMEs in these sectors is assessed to be weak. 3) In various IT sub-sectors, there are widening gaps or bifurcation between leading conglomerates and SMEs.
What is the answer to the question – How can the Korean electronics industry cope with changes in technology and global production system? As production bases of
42
multinational enterprises, Korea seems not to have a substantial locational advantage. Asian latecomers, especially China, have a greater advantage in this regard. On the other hand, Korea is positioned differently compared to other Asian countries in that it has few domestic companies implementing a global business strategy. In spite of rapid growth until now, obstacles to further development of Korea’s IT industry lie in its own industrial structure – inter-sectoral and intra-sectoral bifurcation. Therefore, the government should focus on rectifying the dual structure, placing emphasis on fostering specialized companies, especially SMEs.
43
References
< Data > Bank of Korea, Input-Output Tables, 1980-2000 Ministry of Science and Technology and Korea Institute of S&T Evaluation and Planning,
Report on the Survey of Research and Development in Science and Technology, 1990-2003
Korea Electronics Technology Institute Korea National Statitical Office, Report on Mining and Manufacturing Survey, 1984-2001
Korea Semiconductor Industry Association Ministry of Commerce, Industry and Energy UN Trade Data
< Korean Literature > Electronics Industries Association of Korea, The 40 Year History of the Electronics Industry,
Seoul: EIAK, 1999. Electronic Times, The Footprint of the Growth of the Electronic Components Industry, 1995
Lee, Eon-Oh., “Technology outsourcing for high-tech industries in Korean firms : the patterns and success factors”, KAIST Doctoral Dissertation, 1994.
Lee, K. et al., Technological Competency and Competitiveness of Korean Industry, Seoul: Kyongmunsa, 1997
Orion Electrics, The 25 Year History of Orion Electrics, 1991 Park, J., D. Seo and S. Lee, IT Industry of Korea and China, KIET, 2002 Samsung Electornics Co., Ltd., The 30 Year History of Samsung Electronics, 1999 Samsung Economic Research Institute, “Next-generation Display War”, November, 2001
Korea Development Bank, Industry in Korea, Seoul: The Korea Development Bank, 2002
< Foreign Literature> Bradley, S. P., Jerry A. Hausman, and Richard L. Nolan, Globalization, Technology, and
Competition: The Fusion of Computers and Telecommunications in the 1990s, Boston, MA: Harvard Business School Press, 1993.
Borrus, M., “The Resurgence of US Electronics: Asian Production Networks and the Rise of Wintelism,” in M. Borrus, D. Ernst and S. Haggard(2000).
Borrus, M., D. Ernst, and S. Haggard, eds., International Production Networks in Asia: Rivalry or Riches?, London and New York: Routledge, 2000.
BusinessWeek, “The Samsung way,” June 16, 2003.
44
Choi, Y., Dynamic Techno-Management Capability: The Case of Samsung Semiconductor
Sector in Korea, Ph.D. Thesis, Roskilde University, 1994. Dedrick, J. and K. L. Kraemer, Asia's Computer Challenge: Threat or Opportunity for the
United States and the World?, New York and Oxford: Oxford University Press, 1998.
Dedrick, J. and K. L. Kraemer, “Globalization of the Personal Computer Industry: Trends and Implications, ” Center for Research on Information Technology and Organizations (CRITO), University of California, Irvine, 2002a..
Dedrick, J. and K. L. Kraemer, “Enter the Dragon: China's Computer Industry,” Center for
Research on Information Technology and Organizations (CRITO), University of California, Irvine, 2002b.
Ernst, D. and J. Ravenhill, “Convergence and Diversity: How Globalization Reshapes Asian Production Networks,” in M. Borrus, D. Ernst and S. Haggard(2000).
Gerschenkron, A., Economic Backwardness in Historical Perspective, Cambridge, MA: Harvard University Press, 1962.
Kim, Linsu, Imitation to Innovation: The Dynamics of Korea's Technological Learning, Boston, MA: Harvard Business School Press, 1997.
Kim, Lisu and Carl Dahlman, “Technology Policy and Industrialization: An Integrated Framework and Korea's Experience,” Research Policy, Vol. 21, 1992, pp.437~452.
Krugman, P. R., Rethinking International Trade, Cambridge, MA: The MIT Press, 1990.
Langlois, R. N., “Computers and Semiconductors,” in Benn Steil, David G. Victor and Richard R. Nelson, eds., Technological Innovation and Economic Performance, Princeton and Oxford: Princeton University Press, 2002.
Olivera M., “Market Structure, Trade and Industry Wages,” OECD Economic Studies, No
22, Spring 1994, pp.131~154. OECD, Technology and Industrial Performance: Technology Diffusion, Productivity,
Employment and Skills, International Competitiveness, Paris: OECD, 1996. Richardson, G. B., “The Organization of Industry," Economic Journal, Vol. 82, No. 327,
September,1972, pp.883~896. Shin, J.-S., The Economics of the Latecomers: Catching-up, Technology Transfer and
Institutions in Germany, Japan and South Korea, London and New York: Routledge, 1996.
Suh, J., "Emerging Patterns of Innovation Networks in Korea," mimeo, Korea Development Institute, 2002.
http://www.boe.com.cn
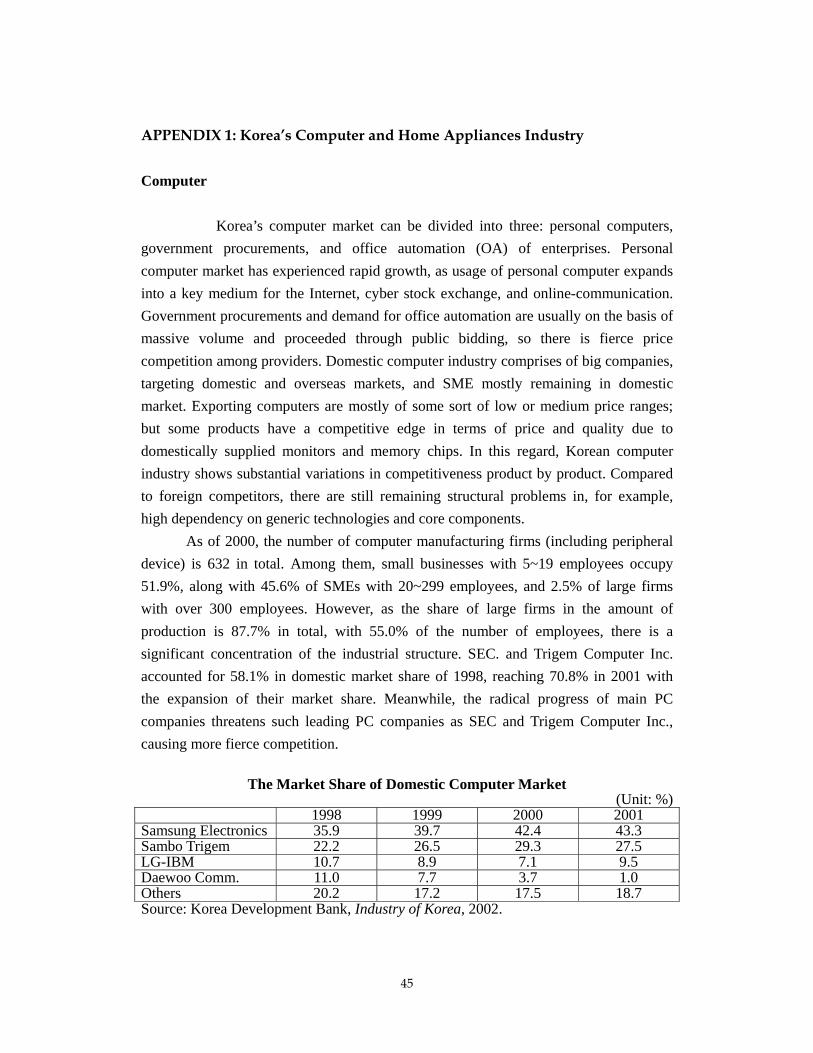
45
APPENDIX 1: Korea’s Computer and Home Appliances Industry Computer
Korea’s computer market can be divided into three: personal computers, government procurements, and office automation (OA) of enterprises. Personal computer market has experienced rapid growth, as usage of personal computer expands into a key medium for the Internet, cyber stock exchange, and online-communication. Government procurements and demand for office automation are usually on the basis of massive volume and proceeded through public bidding, so there is fierce price competition among providers. Domestic computer industry comprises of big companies, targeting domestic and overseas markets, and SME mostly remaining in domestic market. Exporting computers are mostly of some sort of low or medium price ranges; but some products have a competitive edge in terms of price and quality due to domestically supplied monitors and memory chips. In this regard, Korean computer industry shows substantial variations in competitiveness product by product. Compared to foreign competitors, there are still remaining structural problems in, for example, high dependency on generic technologies and core components.
As of 2000, the number of computer manufacturing firms (including peripheral device) is 632 in total. Among them, small businesses with 5~19 employees occupy 51.9%, along with 45.6% of SMEs with 20~299 employees, and 2.5% of large firms with over 300 employees. However, as the share of large firms in the amount of production is 87.7% in total, with 55.0% of the number of employees, there is a significant concentration of the industrial structure. SEC. and Trigem Computer Inc. accounted for 58.1% in domestic market share of 1998, reaching 70.8% in 2001 with the expansion of their market share. Meanwhile, the radical progress of main PC companies threatens such leading PC companies as SEC and Trigem Computer Inc., causing more fierce competition.
The Market Share of Domestic Computer Market (Unit: %)
1998 1999 2000 2001 Samsung Electronics 35.9 39.7 42.4 43.3 Sambo Trigem 22.2 26.5 29.3 27.5 LG-IBM 10.7 8.9 7.1 9.5 Daewoo Comm. 11.0 7.7 3.7 1.0 Others 20.2 17.2 17.5 18.7 Source: Korea Development Bank, Industry of Korea, 2002.
46
Home appliances Home appliances producers could be grouped into the following three: 1) Conglomerates that produce consumer products such as TV, audio, refrigerator, and washing machine. 2) Large firms that manufacture specialized items such as air conditioner and gas range. 3) SME that produce small scale home appliances and supply OEM products for conglomerates. SME take larger share in the number of firms and employees, while conglomerates’ share is large in the amount of production. The number of businesses with 5~99 employees is 1,842, which is 94% of total number of firms. Their shares of employees and production value are 45.9% and 21.8%, respectively. On the contrary, large firms with over 300 employees account for 1.9%, with 37.3% and 63.8% in the number of employees and production value. Domestic home appliances industry has been developed toward export-led mass production, indicating conglomerate-led industrial structure. In domestic home appliances, 85% (against sales in 2001) is for the big three companies, which lead exports and domestic demand with the production of wide range of home appliances.
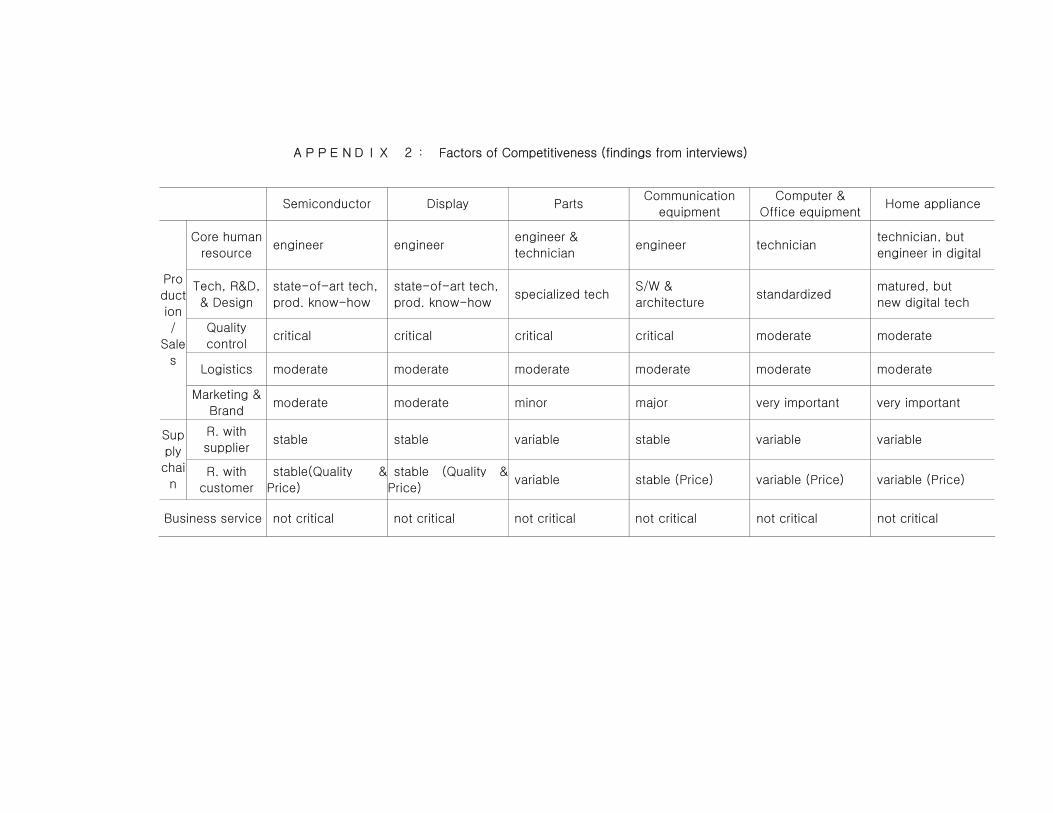
APPENDIX 2: Factors of Competitiveness (findings from interviews)
Semiconductor Display Parts Communication
equipment
Computer &
Office equipment Home appliance
Core human
resource engineer engineer
engineer &
technician engineer technician
technician, but
engineer in digital
Tech, R&D,
& Design
state-of-art tech,
prod. know-how
state-of-art tech,
prod. know-how specialized tech
S/W &
architecture standardized
matured, but
new digital tech
Quality
control critical critical critical critical moderate moderate
Logistics moderate moderate moderate moderate moderate moderate
Pro
duct
ion
/
Sale
s
Marketing &
Brand moderate moderate minor major very important very important
R. with
supplier stable stable variable stable variable variable Sup
ply
chai
n R. with
customer
stable(Quality &
Price)
stable (Quality &
Price) variable stable (Price) variable (Price) variable (Price)
Business service not critical not critical not critical not critical not critical not critical
Related Documents