Water International Vol. 35, No. 5, September 2010, 493–521 The Indus and the Ganges: river basins under extreme pressure Bharat Sharma a* , Upali Amarasinghe a , Cai Xueliang b , Devaraj de Condappa c , Tushaar Shah d , Aditi Mukherji b , Luna Bharati e , G. Ambili a , Asad Qureshi f , Dhruba Pant e , Stefanos Xenarios a , R. Singh g and Vladimir Smakhtin b a International Water Management Institute, New Delhi Office, NASC Complex, Pusa, New Delhi, India; b International Water Management Institute, Colombo, Sri Lanka; c Stockholm Environment Institute, US Centre, Puducherry, India; d International Water Management Institute, Anand Office, India; e International Water Management Institute, Kathmandu Office, Nepal; f International Water Management Institute, Lahore Office, Pakistan; g Indian Institute of Technology, Kharagpur, India The basins of the Indus and Ganges rivers cover 2.20 million km 2 and are inhabited by more than a billion people. The region is under extreme pressures of population and poverty, unregulated utilization of the resources and low levels of productiv- ity. The needs are: (1) development policies that are regionally differentiated to ensure resource sustainability and high productivity; (2) immediate development and implementation of policies for sound groundwater management and energy use; (3) improvement of the fragile food security and to broaden its base; and (4) policy changes to address land fragmentation and improved infrastructure. Meeting these needs will help to improve productivity, reduce rural poverty and improve overall human development. Keywords: Indus-Ganges basins; water resources; water productivity; water poverty; water–energy nexus; potential interventions; water governance and policies Introduction Although the basins of the Indus and Ganges rivers are separate entities, they are con- tiguous. We shall therefore consider them together as the IGBs to enable comparisons and contrasts. The IGBs cover 2.2 million km 2 and have a population of about one bil- lion, one of the world’s densest. The IGBs’ diverse agro-climatic, social and economic conditions in four countries, India, Pakistan, Nepal and Bangladesh, make them very com- plex. The IGBs have been cultivated and irrigated since 5000 B.C. Cultivation in the Indus Basin has intensified with massive resource development, especially recently. The Indus Basin irrigation system (IBIS) in Pakistan and the Bhakra irrigation system in India are the world’s largest, generating surplus food that provides regional food security outside the IGBs (Amarasinghe et al. 2005). The IGBs were the seat of green revolution in Asia. However, the performance of the large publicly funded irrigation infrastructure of the Indus has started to decline. Anarchic development of groundwater currently drives the rural economy (Mukherji et al. 2009a, Shah 2009) and meets the large domestic and indus- trial water needs. The groundwater is being exploited unsustainably, but is still expanding, creating large regional negative water balances. Falling water tables (Rodell et al. 2009) ∗ Corresponding author. Email: [email protected] ISSN 0250-8060 print/ISSN 1941-1707 online © 2010 International Water Resources Association DOI: 10.1080/02508060.2010.512996 http://www.informaworld.com

Welcome message from author
This document is posted to help you gain knowledge. Please leave a comment to let me know what you think about it! Share it to your friends and learn new things together.
Transcript
Water InternationalVol. 35, No. 5, September 2010, 493–521
The Indus and the Ganges: river basins under extreme pressure
Bharat Sharmaa* , Upali Amarasinghea , Cai Xueliangb , Devaraj de Condappac ,Tushaar Shahd , Aditi Mukherjib , Luna Bharatie , G. Ambilia , Asad Qureshif ,Dhruba Pante , Stefanos Xenariosa , R. Singhg and Vladimir Smakhtinb
aInternational Water Management Institute, New Delhi Office, NASC Complex, Pusa, New Delhi,India; bInternational Water Management Institute, Colombo, Sri Lanka; cStockholm EnvironmentInstitute, US Centre, Puducherry, India; dInternational Water Management Institute, Anand Office,India; eInternational Water Management Institute, Kathmandu Office, Nepal; fInternational WaterManagement Institute, Lahore Office, Pakistan; gIndian Institute of Technology, Kharagpur, India
The basins of the Indus and Ganges rivers cover 2.20 million km2 and are inhabitedby more than a billion people. The region is under extreme pressures of populationand poverty, unregulated utilization of the resources and low levels of productiv-ity. The needs are: (1) development policies that are regionally differentiated toensure resource sustainability and high productivity; (2) immediate development andimplementation of policies for sound groundwater management and energy use; (3)improvement of the fragile food security and to broaden its base; and (4) policychanges to address land fragmentation and improved infrastructure. Meeting theseneeds will help to improve productivity, reduce rural poverty and improve overall humandevelopment.
Keywords: Indus-Ganges basins; water resources; water productivity; water poverty;water–energy nexus; potential interventions; water governance and policies
Introduction
Although the basins of the Indus and Ganges rivers are separate entities, they are con-tiguous. We shall therefore consider them together as the IGBs to enable comparisonsand contrasts. The IGBs cover 2.2 million km2 and have a population of about one bil-lion, one of the world’s densest. The IGBs’ diverse agro-climatic, social and economicconditions in four countries, India, Pakistan, Nepal and Bangladesh, make them very com-plex. The IGBs have been cultivated and irrigated since 5000 B.C. Cultivation in the IndusBasin has intensified with massive resource development, especially recently. The IndusBasin irrigation system (IBIS) in Pakistan and the Bhakra irrigation system in India arethe world’s largest, generating surplus food that provides regional food security outside theIGBs (Amarasinghe et al. 2005). The IGBs were the seat of green revolution in Asia.
However, the performance of the large publicly funded irrigation infrastructure of theIndus has started to decline. Anarchic development of groundwater currently drives therural economy (Mukherji et al. 2009a, Shah 2009) and meets the large domestic and indus-trial water needs. The groundwater is being exploited unsustainably, but is still expanding,creating large regional negative water balances. Falling water tables (Rodell et al. 2009)
∗Corresponding author. Email: [email protected]
ISSN 0250-8060 print/ISSN 1941-1707 online
© 2010 International Water Resources Association
DOI: 10.1080/02508060.2010.512996
http://www.informaworld.com
494 B. Sharma et al.
have also created an unviable nexus between water and energy (Scott and Sharma 2009).The Indus Basin is now practically closed with near zero environmental flows in mostyears.
The Ganges Basin has large supplies of both surface and groundwater but faces wideeconomic water scarcity (Molden et al. 2003), especially in Nepal, Bangladesh and easternIndia. Land and water productivity for most crops and fisheries are low and the populationdependent on agriculture (>85%) is very poor. There is prolific shallow groundwater,but it is poorly developed due to low rural electrification, high prices for diesel fuel,and tiny and scattered land holdings (Shah et al. 2009). The Ganges often floods duringthe monsoon season, and coastal Bangladesh is subject to cyclones, but there are dryspells and even droughts. Groundwater downstream is widely contaminated with arsenic(Chakraborti 2004).
There are complex transnational boundary issues in the IGBs. These, coupled with theweak water institutions, governance and policies at the local, national and regional level,seriously constrain implementation of basin-wide strategies and policies. Furthermore,climate change will alter the patterns of snow and glacier melt, and increase the frequencyand intensity of floods and droughts. Its potential impact on agricultural yields, waterresources, production systems and livelihoods in the IGBs calls for large-scale, multi-sectoral adaptation (Sharma 2009, Sharma and McCornick 2006, Hosterman et al. 2009).Fortunately, there are vast areas under rainfed mono-crops and more than 45% of theavailable water resources are un-appropriated, which presents opportunities to intensifyfarming systems and alleviate poverty.
This paper summarizes two years’ research (2007–2009) supported by the Basin FocalProjects of the CGIAR Challenge Program on Water and Food. We shall review the chal-lenges and opportunities in the IGBs in terms of hydrology, water resources and thevariations in water and land productivity at the regional and local levels. We report onthe prevalence of poverty at national, sub-national and household level, and its nexus withpoverty for land and water and the opportunities to alleviate it. We further examine the stateand effectiveness of existing water laws, policies and institutions in the region. Finally, werecommend interventions to improve productivity, reduce poverty and ensure sustainableuse of resources.
Regional perspective
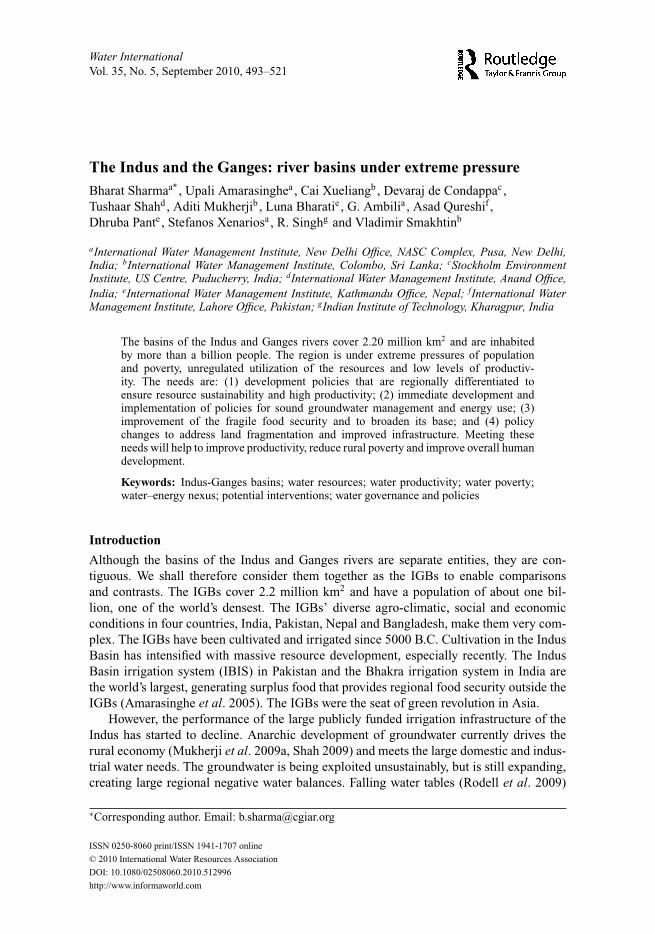
The IGBs (Figure 1) have a mosaic of interactions of poverty and prosperity, and problemsand possibilities. Population growth reduced cultivable land per capita from 0.35 ha in 1880to 0.19 ha in 1970. It halved to again to 0.10 ha in 2000. Agricultural water use increasedrapidly, so access to water is central for livelihoods of the rural poor.
The Indus Basin covers an area of about 1.10 million km2 distributed between Pakistan(63%), India (29%), and China and Afghanistan (8%) (Jain et al. 2009). The Indus has twomain tributaries, Panjnad from the east formed by the five rivers Jhelum, Chenab, Ravi,Beas and Sutlej, and the Kabul River on the west. The Indus Water Treaty (1960) sharesthe Indus’ waters between Pakistan and India.
The Ganges rises at Gangotri glacier in India. Its basin is about 1.09 million km2,distributed between India (79%), Nepal (13%), Bangladesh (4%), and the rest in Tibet(China). The major tributary of Ganges is the Yamuna, which joins it at Allahabad.The Ganges then flows east joined by the further tributaries Ramganga, Gomti, Ghaghra,Gandak, Bagmati, Kosi, Sone and Damodar.
The upper reaches of both the Indus and the Ganges are in the high Karakoram andHimalayan mountains with many peaks over 7000 masl. The intensively cultivated area
Water International 495
Figure 1. Map of the basins of the Indus and Ganges rivers.
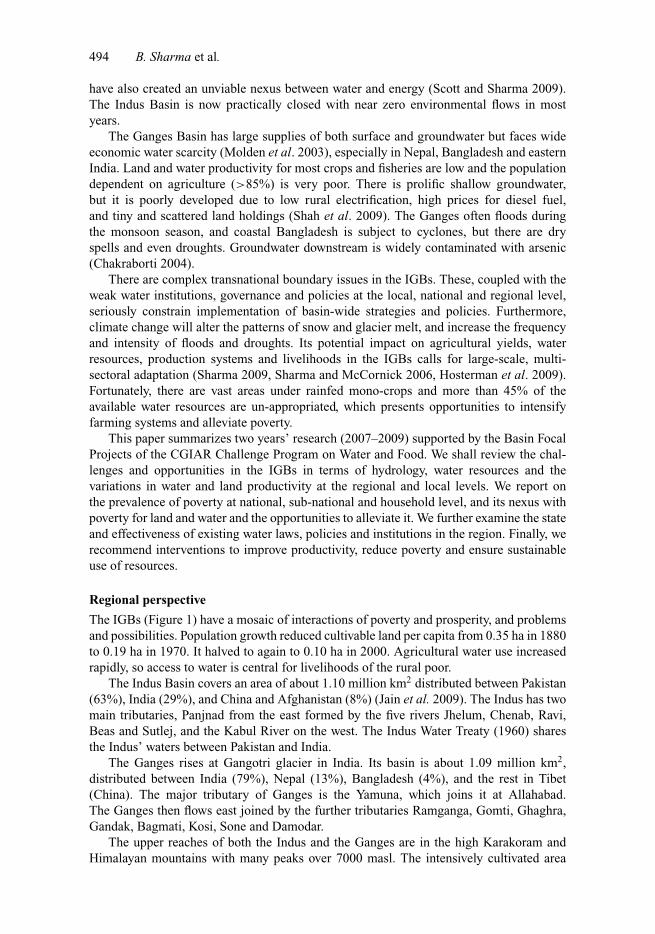
Table 1. Socio-economic indicators of the countries of the Indus and Ganges basins.
Parameters Bangladesh India Nepal Pakistan
Access to improved water resources, % 74 86 90 91Access to improved sanitation, % 39 33 35 59Per capita electricity consumption, kWh 145 594 91 493Population below national poverty line, % 49.8 28.6 30.9 32.6Agriculture, % of gross domestic product (GDP) 20.1 18.3 38.2 21.6Per capita GDP (USD) 406 640 252 632IRWR (m3/capita/yr) 688 1149 7539 325
Note: IRWR = Internally renewable water resources.Source: Adapted from Babel and Wahid (2008).
of the contiguous Indus-Gangetic plains (IGP) is on fertile soils formed from alluvium.The Ganges delta lies downstream of Farakka barrage on the India–Bangladesh border.
The IGBs, with about one seventh of the world’s population, are characterized by socialand economic heterogeneity. In Nepal, 86% of the total population is rural, in Bangladesh80%, in India 75%, and in Pakistan 68%. Poverty amongst the rural population is about31% (2000) or more than 220 million, over half the total rural poor of South Asia. Table 1shows indicators of the socio-economic conditions of the IGBs.
The net cropped area of the IGP is 1.14 million km2, mainly to wheat, rice, cottonand sugarcane. The IGP produces 93% of the wheat and 58% of the rice produced in theIGBs’ countries. Inland fisheries are important producers of food in the lower parts ofthe Ganges in India and Bangladesh. The economy and income levels are rising in theIGBs as a whole and in India in particular, which has implications for future water andfood requirements (Amarasinghe et al. 2008). The eastern part of the Ganges Basin, where
496 B. Sharma et al.
population densities are highest, was bypassed by the green revolution. It is still weak inrural infrastructure, market development, institutions, energy, credit for agricultural oper-ations, location-specific technologies, surface-storage irrigation systems and developmentof groundwater resources. In contrast, the western region was the seat of green revolu-tion and has high productivity, good irrigation (now dominated by groundwater), ruralinfrastructure and markets.
Water resources: use, abuse and non-use
Overall, the IGP has passed from common welfare irrigation systems in the ancient past,to imperialism and strict governance during the British colonialism, to the recent private-venture groundwater irrigation. There are important regional differences from the dynamicand progressive Indus Basin compared to the under-developed, introspective eastern partof the Ganges Basin. In the west, the overarching issue is sustainable management of waterand land resources; in the east, it is access to resources and institutions, livelihoods, povertyand food security.
Annual flow in the Indus is 120–230 km3 (1957–97) with only about 10% net dis-charge, with glacier melt providing stream flow in the upper basin. Average annual flowin the Ganges varies from 5.9 km3 upstream at Tons River to 459 km3 at Farakka bar-rage. Northern tributaries, especially in Nepal, contribute substantially (Jain et al. 2007).The mean annual input from rainfall to the Ganges Basin is 1170 km3. Net discharge of theGanges is about 429 km3 (37% of the input). It is the largest water use, followed by rain-fed agriculture. Groundwater is not uniformly available across the IGP; recharge in someparts of the Indus is < 2 mm/yr, while in Nepal and Bangladesh groundwater rechargeis medium to high. In addition to the dynamic groundwater resource, which is commonlypumped, there is a massive static (unused) groundwater resource of about 9170 km3, 85%of which is in the Ganges Basin.
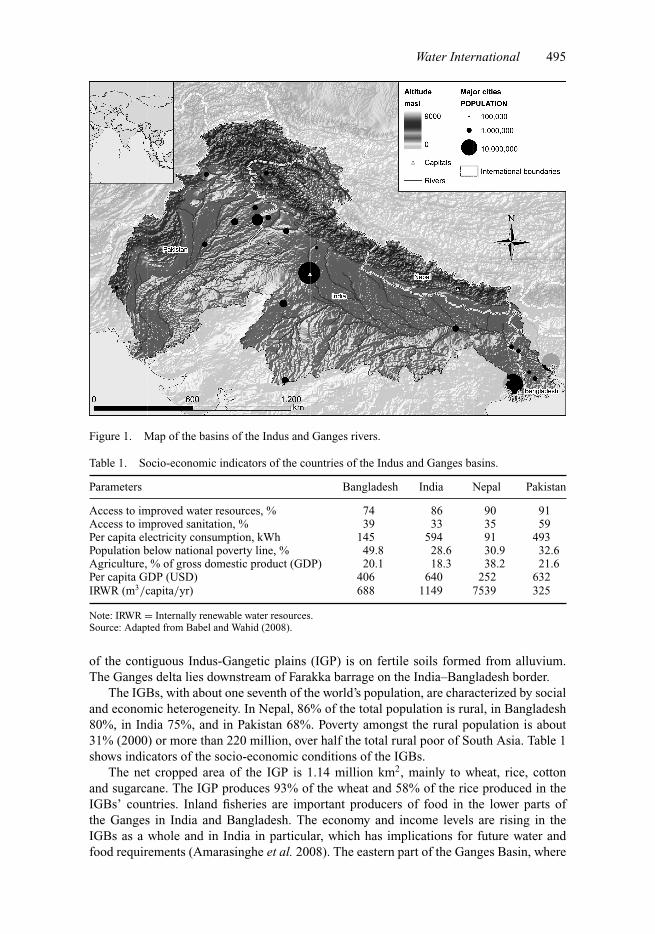
Water use in the IGBs is dominated by agriculture, which uses 91% followed by 7.8%for domestic use (Eastham et al. 2010). Irrigated agriculture uses about 286 km3, 23%of the total water use. IBIS in Pakistan is the world’s largest irrigation network, with anarea of 17 Mha and an intake of almost 75% of the water in the Indus River. A largeproportion of the groundwater in the Indus Basin is pumped by irrigators; in contrast, theypump only 54% of the groundwater available in the Ganges Basin. Demographic pressuresand industrial development influence the distribution of water between sectors (Table 2).Amarasinghe et al. (2007) forecast demand for domestic and industrial water to increasein the near future.
Floods and droughts kill people and seriously damage crops, livestock and infras-tructure. With climate change they are predicted to increase in frequency and severity
Table 2. Water demands in the Indus (down to Kotri), and the Ganges (down to Farakka).
Demands
Basin Irrigation Domestic Industries Total
km3/yr (%) km3/yr (%) km3/yr (%) km3/yrGanges 93.9 (82.1) 10.7 (9.4) 9.8 (8.6) 114.4Indus 168.7 (95.5) 4.4 (2.5) 3.4 (2.0) 176.5
Adapted from Amarasinghe et al. (2007), Habib (2004), and the Bhakra Beas Management Board (http://bbmb.gov.in/english).
Water International 497
(Aggarwal et al. 2004). The Indus Basin ranked in the top ten of the world’s most vulnerablewith inflows predicted to fall by 27% by 2050 (IPCC 2001). Glacier melt is the majorwater source for the IGBs and hence of water for irrigation so that reduced glacier meltwill therefore impact food production in the IGP. There was an overall deglaciation of 21%since 1962 in 466 glaciers in the Chenab, Parbati and Bapsa basins. The Gangotri glacierretreated an alarming 100 m between 1994 and 1998 (Tangri 2000).
The combination of glacial retreat, decreasing ice mass, early snowmelt and increasedwinter stream flow suggest that climate change is already affecting the Himalayancryosphere (Kulkarni et al. 2007). Reduced surface runoff will reduce groundwaterrecharge and affect the groundwater dynamics in the region, which will be criticalin the western region, where most irrigation is from groundwater. Strength-weakness-opportunity-threat (SWOT) analysis showed an overall reduction in runoff in both riversunder all greenhouse gas emission scenarios (Gosain and Rao 2007).
Floods are common in the Ganges Basin, with the Ganges itself and its tributariesYamuna, Sone, Ghagra, Gandak, Koshi and Mahananda all flooding annually. Bangladeshis flooded almost every year by the Ganges, Brahmaputra and Meghna rivers. These aretransnational rivers, so it is difficult for the individual government to implement appropriateand timely measures for forecasting and moderating floods.
Water control and land use
We did soil water assessment tool (SWAT) modelling of three sub-basins, Gorai(Bangladesh), Upper Ganga (India) and Koshi (Nepal). Completion of the upstreamFarakka barrage in 1974 changed the inflow to Gorai, which is critical for growing ricein the dry season. The 1965–75 inflows in February and March averaged 17 MCM, butonly averaged 2 MCM in 1990–9. The annual downstream runoff from Gorai averaged188 mm in 1990–9, 26% less than in 1965–75. Additionally, abstraction between Farakkaand Gorai further lessens inflow. Farmers in Gorai had to abandon rice for less demandingcrops and develop groundwater to make up the shortfall.
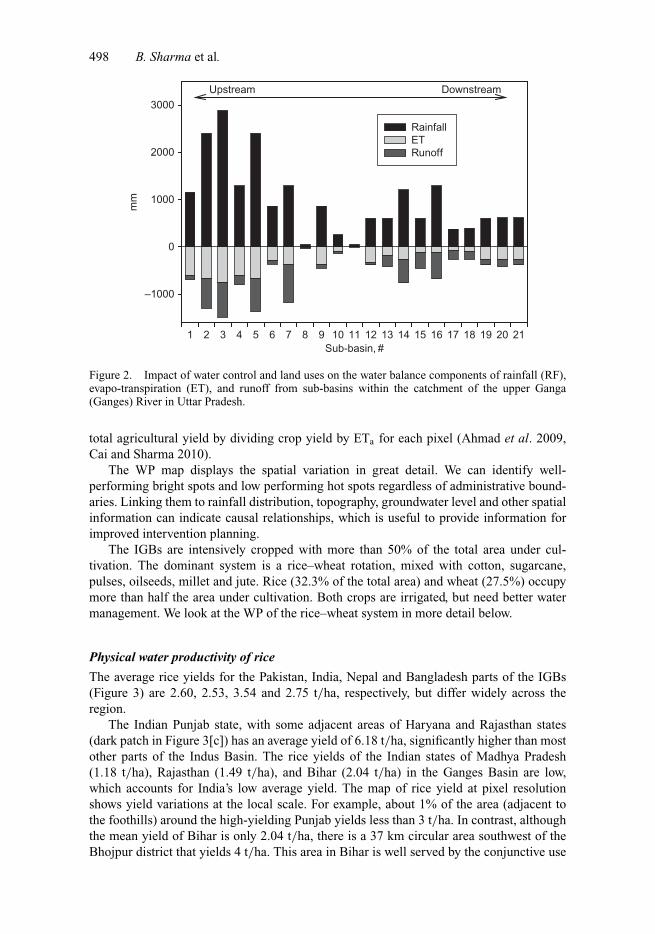
Dams, barrages, and canals regulate flow in the upper Ganges River (Figure 2). Rainfalland/are evapotranspiration less and water yield is higher in the upper catchments, espe-cially where structures control runoff. Evapotranspiration was highest for the forested areasfollowed by irrigated areas.
The southern part of the Koshi sub-basin is wetter than the trans-Himalayan north-ern part. Evapotranspiration is higher in the south than in the north but runoff exceedsevapotranspiration in the south because of higher rainfall. Optimal resource planning atthe regional level requires detailed modelling of the existing and future scenarios at thesub-basin level.
Water productivity: assessment and improvement
Crop water productivity (WP) indicates food security at a basin scale and can guide policiesto adapt to climate change. We mapped WP in the whole IGB by integrating crop censusdata with remote sensing and GIS. First we mapped dominant crops using census dataand existing maps of land use and land cover. We calculated yields from national statis-tics and interpolated them to pixel level (250 m × 250 m) using the normalized differencevegetation index (NDVI) satellite data. We mapped crop evapotranspiration (ETa) using asimplified surface energy balance (SEBAL) model based on satellite data of land surfacetemperature and data from 56 weather stations. We mapped WP for rice and wheat and
Dell
Cross-Out
Dell
Inserted Text
or
Dell
Inserted Text
is
498 B. Sharma et al.
Sub-basin, #1 2 3 4 5 6 7 8 9 10 11 12 13 14 15 16 17 18 19 20 21
mm
–1000
0
1000
2000
3000
Rainfall ET Runoff
Upstream Downstream
Figure 2. Impact of water control and land uses on the water balance components of rainfall (RF),evapo-transpiration (ET), and runoff from sub-basins within the catchment of the upper Ganga(Ganges) River in Uttar Pradesh.
total agricultural yield by dividing crop yield by ETa for each pixel (Ahmad et al. 2009,Cai and Sharma 2010).
The WP map displays the spatial variation in great detail. We can identify well-performing bright spots and low performing hot spots regardless of administrative bound-aries. Linking them to rainfall distribution, topography, groundwater level and other spatialinformation can indicate causal relationships, which is useful to provide information forimproved intervention planning.
The IGBs are intensively cropped with more than 50% of the total area under cul-tivation. The dominant system is a rice–wheat rotation, mixed with cotton, sugarcane,pulses, oilseeds, millet and jute. Rice (32.3% of the total area) and wheat (27.5%) occupymore than half the area under cultivation. Both crops are irrigated, but need better watermanagement. We look at the WP of the rice–wheat system in more detail below.
Physical water productivity of rice
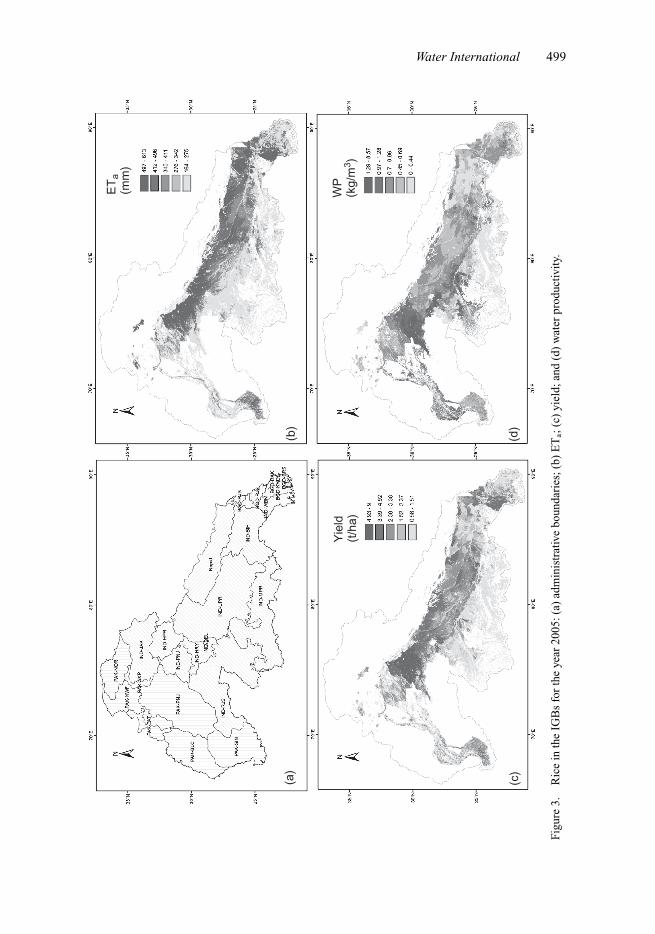
The average rice yields for the Pakistan, India, Nepal and Bangladesh parts of the IGBs(Figure 3) are 2.60, 2.53, 3.54 and 2.75 t/ha, respectively, but differ widely across theregion.
The Indian Punjab state, with some adjacent areas of Haryana and Rajasthan states(dark patch in Figure 3[c]) has an average yield of 6.18 t/ha, significantly higher than mostother parts of the Indus Basin. The rice yields of the Indian states of Madhya Pradesh(1.18 t/ha), Rajasthan (1.49 t/ha), and Bihar (2.04 t/ha) in the Ganges Basin are low,which accounts for India’s low average yield. The map of rice yield at pixel resolutionshows yield variations at the local scale. For example, about 1% of the area (adjacent tothe foothills) around the high-yielding Punjab yields less than 3 t/ha. In contrast, althoughthe mean yield of Bihar is only 2.04 t/ha, there is a 37 km circular area southwest of theBhojpur district that yields 4 t/ha. This area in Bihar is well served by the conjunctive use
Water International 499
(b)
ET
a(m
m)
(c)
(d)
(a)
WP
(kg/
m3 )
Yie
ld(t
/ha)
Figu
re3.
Ric
ein
the
IGB
sfo
rth
eye
ar20
05:(
a)ad
min
istr
ativ
ebo
unda
ries
;(b)
ET
a;(c
)yi
eld;
and
(d)
wat
erpr
oduc
tivit
y.
500 B. Sharma et al.
of Sone canal system and tubewells, as well as widespread adoption of improved agronomicpractices.
ETa is a measure of how much water a particular ground cover uses. A crop’s poten-tial ETa is its evapotranspiration without water or nutrient limitation. ETa data indicatethe water-use efficiency of irrigation, and low ETa values indicate stressed rice or mixedcropping.
The ETa of paddy rice in the IGBs for the growing season 10 June–15 October 2005averaged 416 mm (range 167–608 mm, standard deviation (SD) 104.6 mm), which is sig-nificantly less than the rice potential evapotranspiration (ETp, 610 mm). There is significantvariation of ETa across the region (Figure 3[b]). The adjoining areas of the Indus andGanges basins in Punjab, Haryana and west Uttar Pradesh, covering 8% of the total ricearea, have ETas averaging 551 mm. ETa is also high in north West Bengal (528 mm), andin a belt from the Khulna division of Bangladesh to the Indian states of West Bengal, north-ern Bihar, central Uttar Pradesh, Haryana and Punjab (Figure 3[b]). ETa is low in MadhyaPradesh and Rajasthan states in India, which are distant from the Ganges River, and insouth Punjab and north Sind provinces in Pakistan, where there is more mixed cropping.Overall, ETa follows yield, although in Bihar ETa is high but yields are low, indicating lowirrigation efficiency.
Average WP of rice in the IGBs is 0.74 kg/m3 (0.18–1.8 kg/m3, SD 0.329), with thepattern of WP generally following that of yield. WP of the Indian Punjab and adjoin-ing areas that cover 6% of the IGBs’ rice area averages 1.32 kg/m3. About 23% of theIGBs’ rice areas, mainly in Madhya Pradesh and Bihar in India and the Dhaka division ofBangladesh, all in the Ganges Basin, have WP less than 0.5 kg/m3. These areas are notadequately served by surface or groundwater resources and could benefit from improvedaccess to irrigation.
Physical water productivity of wheat
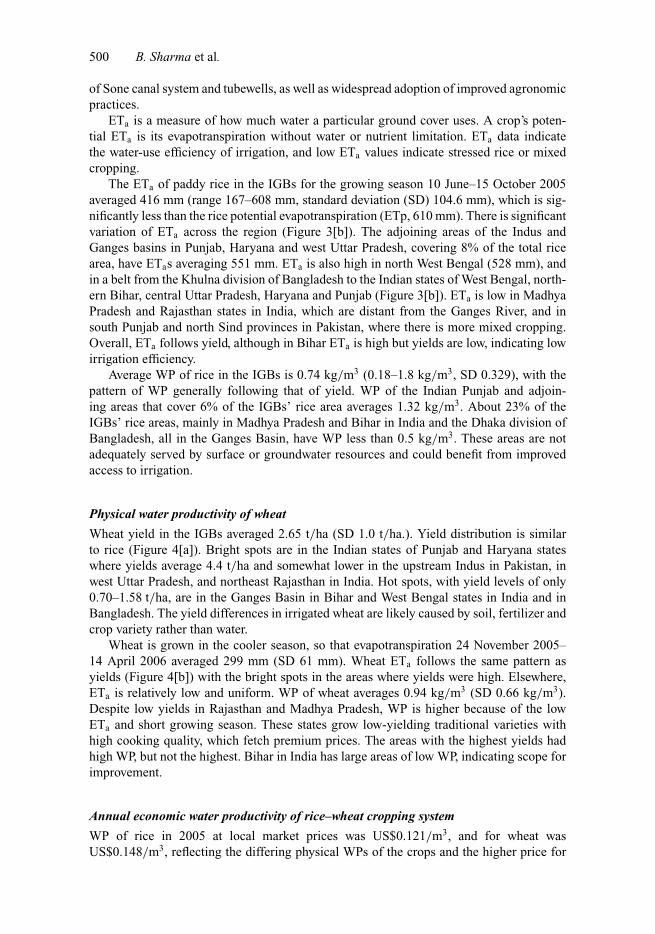
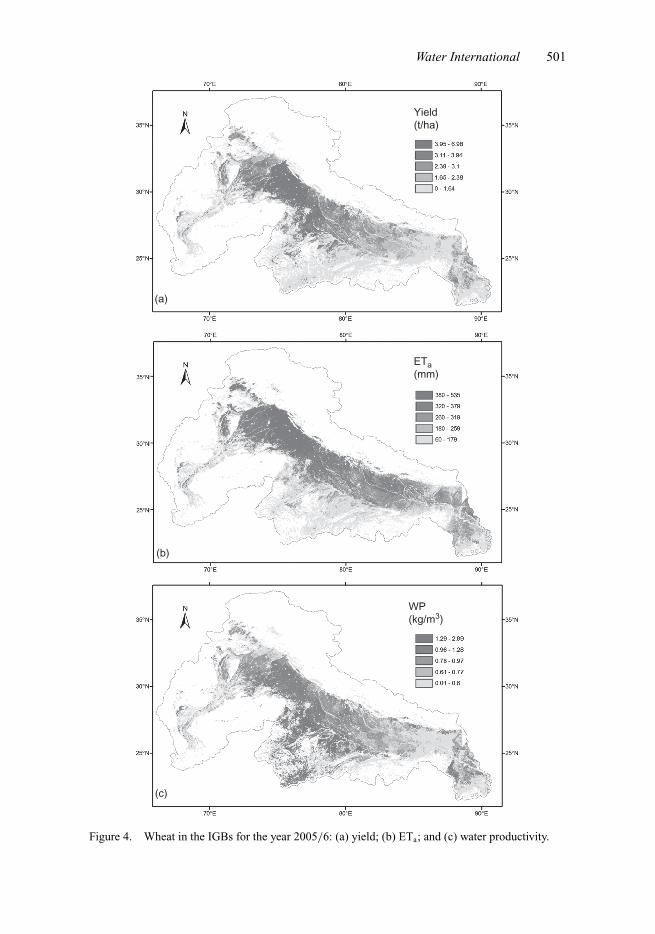
Wheat yield in the IGBs averaged 2.65 t/ha (SD 1.0 t/ha.). Yield distribution is similarto rice (Figure 4[a]). Bright spots are in the Indian states of Punjab and Haryana stateswhere yields average 4.4 t/ha and somewhat lower in the upstream Indus in Pakistan, inwest Uttar Pradesh, and northeast Rajasthan in India. Hot spots, with yield levels of only0.70–1.58 t/ha, are in the Ganges Basin in Bihar and West Bengal states in India and inBangladesh. The yield differences in irrigated wheat are likely caused by soil, fertilizer andcrop variety rather than water.
Wheat is grown in the cooler season, so that evapotranspiration 24 November 2005–14 April 2006 averaged 299 mm (SD 61 mm). Wheat ETa follows the same pattern asyields (Figure 4[b]) with the bright spots in the areas where yields were high. Elsewhere,ETa is relatively low and uniform. WP of wheat averages 0.94 kg/m3 (SD 0.66 kg/m3).Despite low yields in Rajasthan and Madhya Pradesh, WP is higher because of the lowETa and short growing season. These states grow low-yielding traditional varieties withhigh cooking quality, which fetch premium prices. The areas with the highest yields hadhigh WP, but not the highest. Bihar in India has large areas of low WP, indicating scope forimprovement.
Annual economic water productivity of rice–wheat cropping system
WP of rice in 2005 at local market prices was US$0.121/m3, and for wheat wasUS$0.148/m3, reflecting the differing physical WPs of the crops and the higher price for
Water International 501
Yield(t/ha)
ETa(mm)
WP(kg/m3)
(a)
(b)
(c)
Figure 4. Wheat in the IGBs for the year 2005/6: (a) yield; (b) ETa; and (c) water productivity.
502 B. Sharma et al.
(a)
(b)
WPsum(US$/m3)
WPrice/WPsum
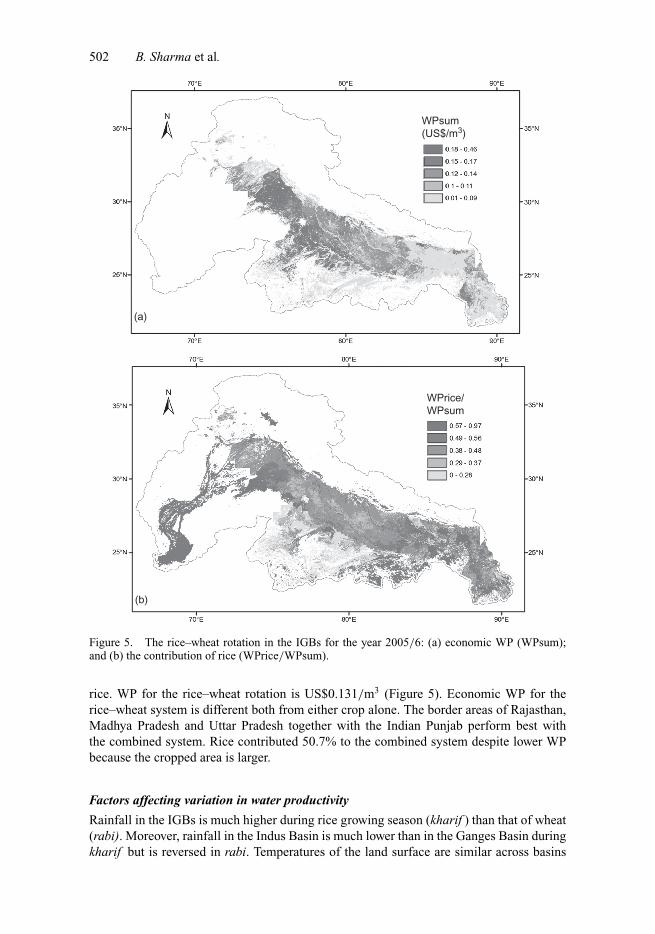
Figure 5. The rice–wheat rotation in the IGBs for the year 2005/6: (a) economic WP (WPsum);and (b) the contribution of rice (WPrice/WPsum).
rice. WP for the rice–wheat rotation is US$0.131/m3 (Figure 5). Economic WP for therice–wheat system is different both from either crop alone. The border areas of Rajasthan,Madhya Pradesh and Uttar Pradesh together with the Indian Punjab perform best withthe combined system. Rice contributed 50.7% to the combined system despite lower WPbecause the cropped area is larger.
Factors affecting variation in water productivity
Rainfall in the IGBs is much higher during rice growing season (kharif ) than that of wheat(rabi). Moreover, rainfall in the Indus Basin is much lower than in the Ganges Basin duringkharif but is reversed in rabi. Temperatures of the land surface are similar across basins
Water International 503
and seasons. Temperatures are hottest in the deserts of the downstream Indus Basin, andcoldest in the northern mountains. Topographically the IGP is flat although the southernGanges Basin is higher.
Rice ETp is lower in the Ganges Basin than the Indus, reflecting the differences inrainfall distribution. Crop stress (ETa/ETp, the lower the ratio the greater the stress) iswidespread in the Indus Basin and in the south Ganges Basin. As a closed basin, the Indusfaces severe water scarcity. In contrast, the well-performing Indian Punjab shows littlewater stress in spite of the deep groundwater table and low rainfall. High water availabilityin the eastern Ganges does not give higher yields or WP.
Rainfed crops are more vulnerable, so that rainfed paddy may have more standing waterat times but can still suffer from water stress at critical growth stages, such as grain filling,which can reduce grain yield. Rice is also vulnerable to excess water particularly soon afterestablishment. Adequate irrigation and drainage systems and appropriate management canmaximize utilization of rainfall and river flows to achieve high yield and WP. Other landand crop interventions, such as laser land levelling, furrow-irrigated raised beds (FIRBS),control of insects and diseases, optimum fertilizer and suitable varieties, are part of theagronomic package.
Yields, ETa and WP of wheat are more consistent across the IGBs. High ETa, yieldsand WP occur together. Irrigation is the main control of ETa in the dry rabi season, so thatwheat yields are more related to irrigation volume. The high wheat yields in the Haryana,and the Indian and Pakistani Punjab come from the extensive irrigation from groundwater,which is over-exploited and unsustainable.
Yield and WP vary consistently where water availability is the major constraining fac-tor, such as the downstream Indus Basin and downstream areas in the southern GangesBasin. Elsewhere in the Ganges, yields and WP are not constrained by water availability, orclimate, but the irrigation infrastructure, access to irrigation water and crop management.
The bright spot for both rice and wheat in the Indian Punjab and adjacent areas, withonly 5% of the IGBs’ area cropped to rice and wheat, has the high WP of US$0.190/m3.If the basin average of US$0.131/m3 could be increased to the same as in bright spots, thebasin could use 31% less water for the same production, or increase production by 31%with the same amount of water. There are many constraints to achieving this theoreticaloptimum, but there are clearly possibilities to increase WP, which would be important forregional food security.
Potential interventions for improving water productivity
Cropping patterns and sources of irrigation water have changed greatly in the IGBs.The area under paddy has grown exponentially, while water tables have dropped due topumping of groundwater in the Indian and Pakistani Punjab, Haryana and western UttarPradesh. Intensive production of irrigated rice and wheat with limited water resourcesis hydrologically unsustainable. In contrast, the abundant water available in the easternGanges Basin is underdeveloped and underutilized, so that land and water productivity arelow. A variety of physical, crop-related, and policy interventions have been tried in theIGBs but with varying degrees of success. We analyse some of the successful ones below.
Potential interventions for selected crops of the Indus and Ganges basin
We used the analytic hierarchy process (AHP) (Saaty 1980) to rank potential interventions.We selected eight crops from the major cropping systems in the IGBs (Biswas et al. 2006),
504 B. Sharma et al.
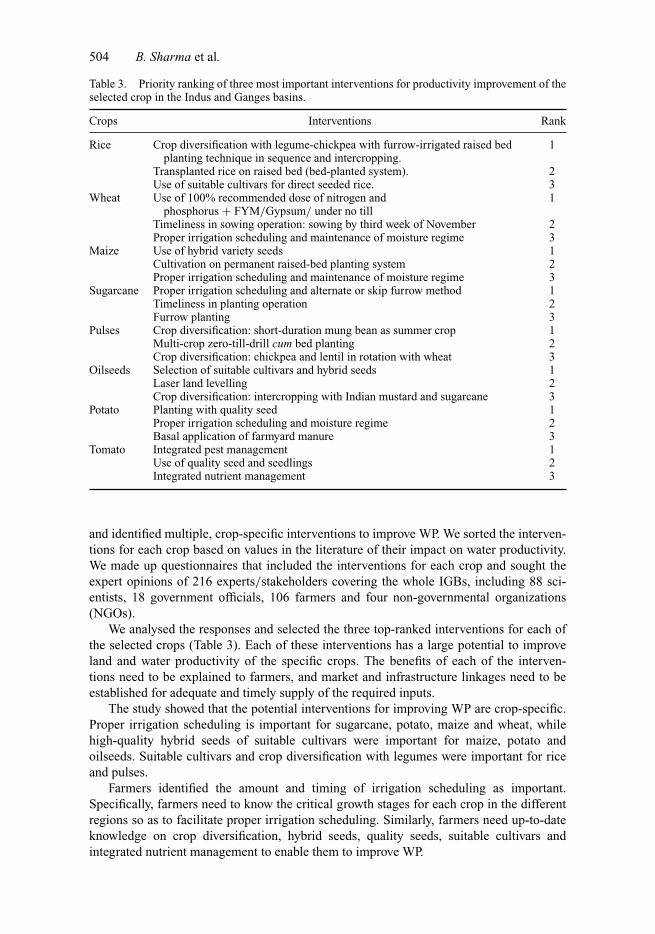
Table 3. Priority ranking of three most important interventions for productivity improvement of theselected crop in the Indus and Ganges basins.
Crops Interventions Rank
Rice Crop diversification with legume-chickpea with furrow-irrigated raised bedplanting technique in sequence and intercropping.
1
Transplanted rice on raised bed (bed-planted system). 2Use of suitable cultivars for direct seeded rice. 3
Wheat Use of 100% recommended dose of nitrogen andphosphorus + FYM/Gypsum/ under no till
1
Timeliness in sowing operation: sowing by third week of November 2Proper irrigation scheduling and maintenance of moisture regime 3
Maize Use of hybrid variety seeds 1Cultivation on permanent raised-bed planting system 2Proper irrigation scheduling and maintenance of moisture regime 3
Sugarcane Proper irrigation scheduling and alternate or skip furrow method 1Timeliness in planting operation 2Furrow planting 3
Pulses Crop diversification: short-duration mung bean as summer crop 1Multi-crop zero-till-drill cum bed planting 2Crop diversification: chickpea and lentil in rotation with wheat 3
Oilseeds Selection of suitable cultivars and hybrid seeds 1Laser land levelling 2Crop diversification: intercropping with Indian mustard and sugarcane 3
Potato Planting with quality seed 1Proper irrigation scheduling and moisture regime 2Basal application of farmyard manure 3
Tomato Integrated pest management 1Use of quality seed and seedlings 2Integrated nutrient management 3
and identified multiple, crop-specific interventions to improve WP. We sorted the interven-tions for each crop based on values in the literature of their impact on water productivity.We made up questionnaires that included the interventions for each crop and sought theexpert opinions of 216 experts/stakeholders covering the whole IGBs, including 88 sci-entists, 18 government officials, 106 farmers and four non-governmental organizations(NGOs).
We analysed the responses and selected the three top-ranked interventions for each ofthe selected crops (Table 3). Each of these interventions has a large potential to improveland and water productivity of the specific crops. The benefits of each of the interven-tions need to be explained to farmers, and market and infrastructure linkages need to beestablished for adequate and timely supply of the required inputs.
The study showed that the potential interventions for improving WP are crop-specific.Proper irrigation scheduling is important for sugarcane, potato, maize and wheat, whilehigh-quality hybrid seeds of suitable cultivars were important for maize, potato andoilseeds. Suitable cultivars and crop diversification with legumes were important for riceand pulses.
Farmers identified the amount and timing of irrigation scheduling as important.Specifically, farmers need to know the critical growth stages for each crop in the differentregions so as to facilitate proper irrigation scheduling. Similarly, farmers need up-to-dateknowledge on crop diversification, hybrid seeds, quality seeds, suitable cultivars andintegrated nutrient management to enable them to improve WP.
Water International 505
Adoption of resource conservation technologies (RCTs)
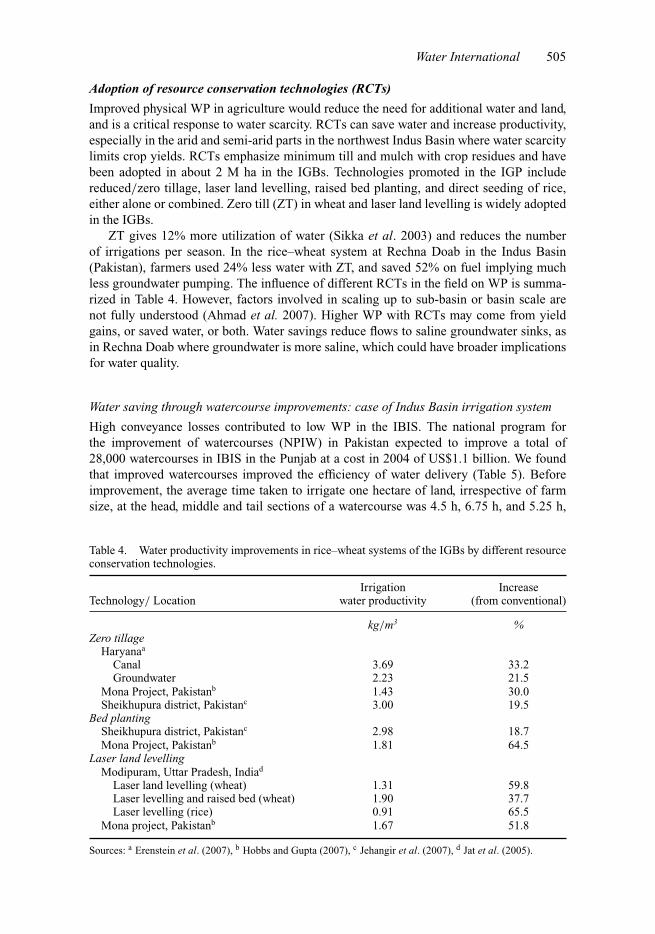
Improved physical WP in agriculture would reduce the need for additional water and land,and is a critical response to water scarcity. RCTs can save water and increase productivity,especially in the arid and semi-arid parts in the northwest Indus Basin where water scarcitylimits crop yields. RCTs emphasize minimum till and mulch with crop residues and havebeen adopted in about 2 M ha in the IGBs. Technologies promoted in the IGP includereduced/zero tillage, laser land levelling, raised bed planting, and direct seeding of rice,either alone or combined. Zero till (ZT) in wheat and laser land levelling is widely adoptedin the IGBs.
ZT gives 12% more utilization of water (Sikka et al. 2003) and reduces the numberof irrigations per season. In the rice–wheat system at Rechna Doab in the Indus Basin(Pakistan), farmers used 24% less water with ZT, and saved 52% on fuel implying muchless groundwater pumping. The influence of different RCTs in the field on WP is summa-rized in Table 4. However, factors involved in scaling up to sub-basin or basin scale arenot fully understood (Ahmad et al. 2007). Higher WP with RCTs may come from yieldgains, or saved water, or both. Water savings reduce flows to saline groundwater sinks, asin Rechna Doab where groundwater is more saline, which could have broader implicationsfor water quality.
Water saving through watercourse improvements: case of Indus Basin irrigation system
High conveyance losses contributed to low WP in the IBIS. The national program forthe improvement of watercourses (NPIW) in Pakistan expected to improve a total of28,000 watercourses in IBIS in the Punjab at a cost in 2004 of US$1.1 billion. We foundthat improved watercourses improved the efficiency of water delivery (Table 5). Beforeimprovement, the average time taken to irrigate one hectare of land, irrespective of farmsize, at the head, middle and tail sections of a watercourse was 4.5 h, 6.75 h, and 5.25 h,
Table 4. Water productivity improvements in rice–wheat systems of the IGBs by different resourceconservation technologies.
Irrigation IncreaseTechnology/ Location water productivity (from conventional)
kg/m3 %Zero tillage
Haryanaa
Canal 3.69 33.2Groundwater 2.23 21.5
Mona Project, Pakistanb 1.43 30.0Sheikhupura district, Pakistanc 3.00 19.5
Bed plantingSheikhupura district, Pakistanc 2.98 18.7Mona Project, Pakistanb 1.81 64.5
Laser land levellingModipuram, Uttar Pradesh, Indiad
Laser land levelling (wheat) 1.31 59.8Laser levelling and raised bed (wheat) 1.90 37.7Laser levelling (rice) 0.91 65.5
Mona project, Pakistanb 1.67 51.8
Sources: a Erenstein et al. (2007), b Hobbs and Gupta (2007), c Jehangir et al. (2007), d Jat et al. (2005).
506 B. Sharma et al.
Table 5. Improvement in delivery efficiency (%) as a result of watercourse improvement in theIndus Basin irrigation system.
Delivery efficiency of main watercourse1 Overall delivery efficiency2
Project Head Middle Tail Average Head Middle Tail Average
Pre-improvement 76 71 63 70 66 63 54 61Post-improvement 82 81 74 80 79 73 64 72
1 Efficiency of the section between watercourse outlet (mogha) and farm outlet (nakka)2 Efficiency of the section between watercourse outlet (mogha) and field outlet (nakka)
respectively. After improvement, irrigation time was reduced about 22%, 40% and 19%,and cropping intensities increased from 115%, 121% and 115% to 138%, 151% and 132%,respectively.
Policy intervention to save water: Punjab (Indian) Preservation of Subsoil Water Act 2009
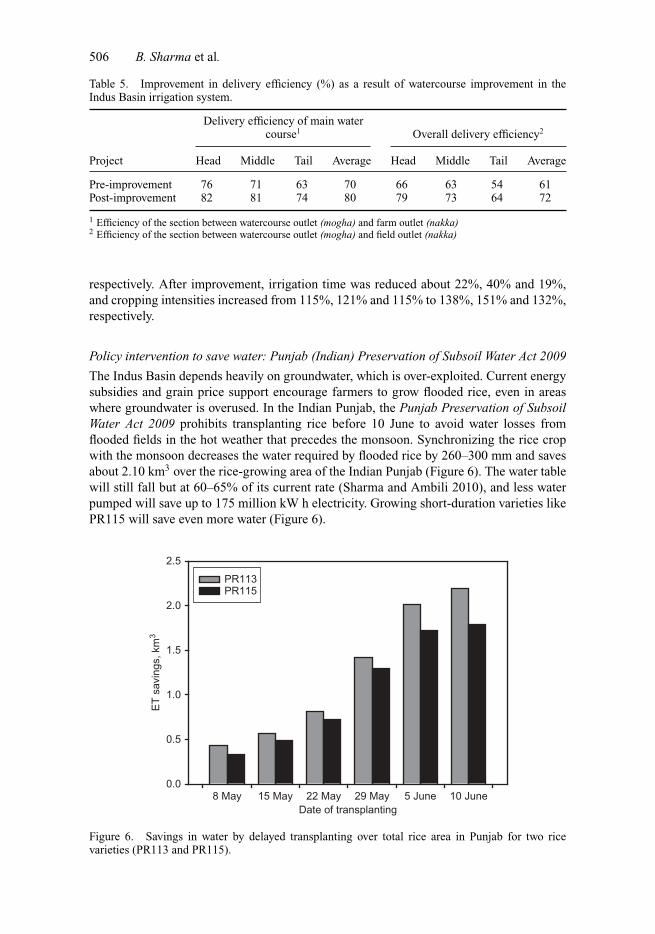
The Indus Basin depends heavily on groundwater, which is over-exploited. Current energysubsidies and grain price support encourage farmers to grow flooded rice, even in areaswhere groundwater is overused. In the Indian Punjab, the Punjab Preservation of SubsoilWater Act 2009 prohibits transplanting rice before 10 June to avoid water losses fromflooded fields in the hot weather that precedes the monsoon. Synchronizing the rice cropwith the monsoon decreases the water required by flooded rice by 260–300 mm and savesabout 2.10 km3 over the rice-growing area of the Indian Punjab (Figure 6). The water tablewill still fall but at 60–65% of its current rate (Sharma and Ambili 2010), and less waterpumped will save up to 175 million kW h electricity. Growing short-duration varieties likePR115 will save even more water (Figure 6).
Date of transplanting8 May 15 May 22 May 29 May 5 June 10 June
ET
sav
ings
, km
3
0.0
0.5
1.0
1.5
2.0
2.5
PR113 PR115
Figure 6. Savings in water by delayed transplanting over total rice area in Punjab for two ricevarieties (PR113 and PR115).
Water International 507
Multiple water-use schemes in hill areas
Short, sloping terraces in the hills of the upper Indus and Ganges Basins are unsuitable forsurface and groundwater irrigation. A multiple water-use scheme (MUS) in the Nepalesehills provides a solution by supplying household water and water for homestead gardens(Mikhail and Yoder 2009). Water is piped from upstream springs to a 3000 L ferro-cementwater tank (Thai jar), which provides household water (45 L/person/day), the first priority.Overflow is collected in a larger 10 m3 underground tank, which supplies irrigation water tohousehold vegetable gardens (400–600 L/household) where it is applied by a low-cost dripsystem (Sharma et al. 2010). The average cost is US$100/household in cash and kind. Saleof surplus vegetables (about 90% of production) meets the cost in the first year (Sharmaet al. 2010) and provides continuing cash income.
MUSs cover 10 to 40, occasionally 80, households depending on the community andthe availability of water. They provide potable water to households, reduce the incidenceof water-borne diseases, and eliminate the drudgery for women in fetching water. Whereconditions are suitable, MUSs are expanding rapidly, supported by partnerships betweengovernment agencies, local institutions, NGOs and private parties.
Agrarian change and water institutions
Although the water sector has successfully developed technical solutions to meet thegrowing water needs of the economy and society in the past, it is getting harder. All sec-tors demand more water, but development of additional water resources is difficult andexpensive, and already there are conflicts over sharing the water that is available. Hencegovernance plays a critical role in the water sector.
The water sector of the IGBs has many informal institutional arrangements, which co-exist with large formal institutions. We know or understand little about how they operateat the regional level or over different tiers of regional management. In particular, we do notknow their relative strengths, weaknesses and efficacy in response to variations in resourceavailability, economics and politics. In short, there is no comprehensive analysis of watergovernance in the IGBs. We discuss below some issues of water governance and water lawsin the IGBs.
Is irrigation water really free in the Indus-Ganges Region?
It is widely believed that pricing water according to its actual cost will prevent waste,misallocation and scarcity. But in the IGBs it does not appear to be that simple. When thecost of water rises above a low threshold, many small farmers do improve the efficiencyof water use by lining channels or using pipes, and by switching to water-saving crops.When the cost of water rises beyond some upper threshold, however, farmers are forcedto make drastic cuts in their use of irrigation water, stop growing irrigated crops, or evenquit farming. Increasing the price of water does increase the efficiency of water use butthreatens the livelihoods and food security of millions of agrarian poor (Shah et al. 2009).
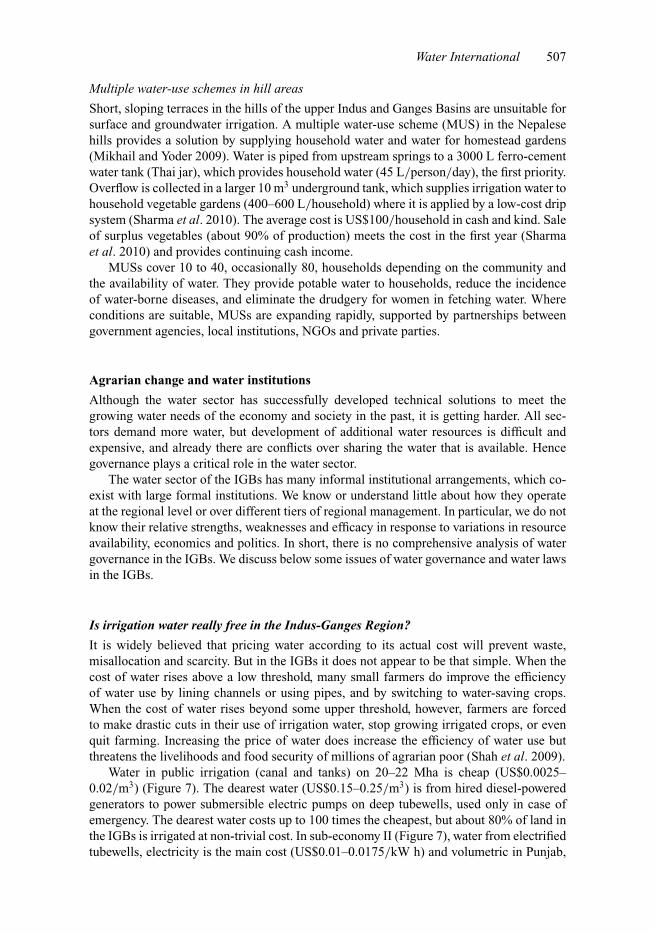
Water in public irrigation (canal and tanks) on 20–22 Mha is cheap (US$0.0025–0.02/m3) (Figure 7). The dearest water (US$0.15–0.25/m3) is from hired diesel-poweredgenerators to power submersible electric pumps on deep tubewells, used only in case ofemergency. The dearest water costs up to 100 times the cheapest, but about 80% of land inthe IGBs is irrigated at non-trivial cost. In sub-economy II (Figure 7), water from electrifiedtubewells, electricity is the main cost (US$0.01–0.0175/kW h) and volumetric in Punjab,
508 B. Sharma et al.
Can
als
and
tank
s
Ow
n el
ectr
ic p
ump
Ele
ctric
pum
ppu
rcha
se
Ow
n di
esel
pum
p
Ren
ted
dies
elpu
mp
Mha of net irrigated area
Rel
ativ
e co
st o
f ir
rigat
ion
Ow
n an
d re
nted
gene
rato
r se
t
I20–22
II30–32
III10–12
IV12–15
V7–8
VI
Figure 7. Irrigation sub-economies of South Asia.Source: Shah et al. (2009).
and Sind in Pakistan, in Nepal and in Bangladesh. In India, electric tubewell owners paya flat tariff (except in Punjab where electricity for pumping is free), but there is stringentrationing of the increasingly unreliable power supply. Farmers in sub-economies I, II andIII are increasingly using diesel-powered pumps to cope with the unreliability of surfaceirrigation (I) and electricity supplies (II and III).
The diesel-fuel price squeeze
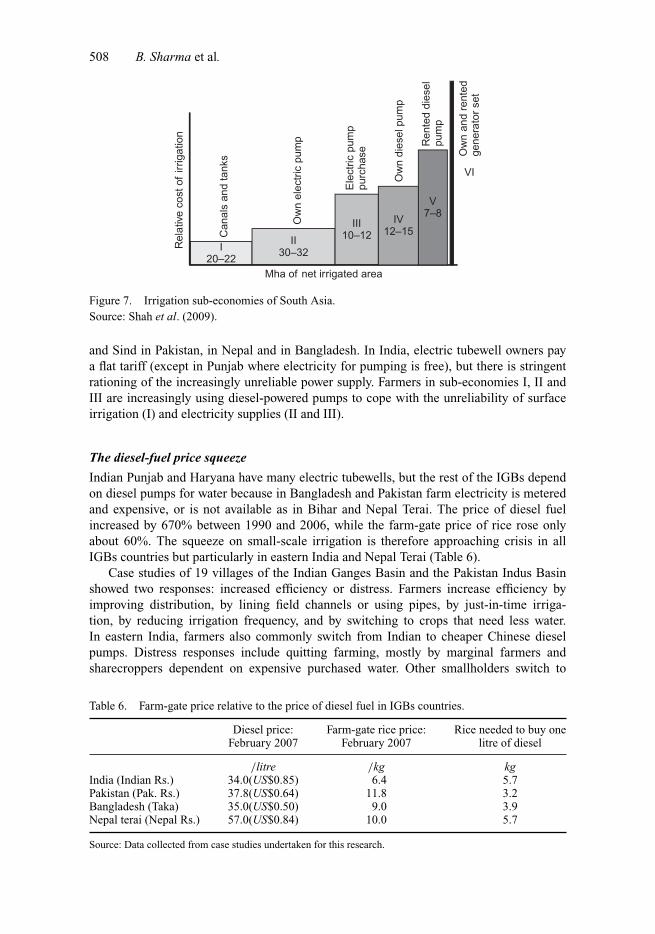
Indian Punjab and Haryana have many electric tubewells, but the rest of the IGBs dependon diesel pumps for water because in Bangladesh and Pakistan farm electricity is meteredand expensive, or is not available as in Bihar and Nepal Terai. The price of diesel fuelincreased by 670% between 1990 and 2006, while the farm-gate price of rice rose onlyabout 60%. The squeeze on small-scale irrigation is therefore approaching crisis in allIGBs countries but particularly in eastern India and Nepal Terai (Table 6).
Case studies of 19 villages of the Indian Ganges Basin and the Pakistan Indus Basinshowed two responses: increased efficiency or distress. Farmers increase efficiency byimproving distribution, by lining field channels or using pipes, by just-in-time irriga-tion, by reducing irrigation frequency, and by switching to crops that need less water.In eastern India, farmers also commonly switch from Indian to cheaper Chinese dieselpumps. Distress responses include quitting farming, mostly by marginal farmers andsharecroppers dependent on expensive purchased water. Other smallholders switch to
Table 6. Farm-gate price relative to the price of diesel fuel in IGBs countries.
Diesel price: Farm-gate rice price: Rice needed to buy oneFebruary 2007 February 2007 litre of diesel
/litre /kg kgIndia (Indian Rs.) 34.0(US$0.85) 6.4 5.7Pakistan (Pak. Rs.) 37.8(US$0.64) 11.8 3.2Bangladesh (Taka) 35.0(US$0.50) 9.0 3.9Nepal terai (Nepal Rs.) 57.0(US$0.84) 10.0 5.7
Source: Data collected from case studies undertaken for this research.
Water International 509
high-risk, high-value crops on a small plot leaving the rest of the farm fallow or underrainfed crop.
Energy and irrigation in the IGBs
Over the last 50 years, groundwater has become the main source of water for irrigationin the IGBs, with the green revolution often titled the tubewell revolution (Repetto 1994).But while the use of groundwater boomed, it did so at the cost of the energy economy. In thelate 1970s all state electricity boards (SEBs) in India changed from metered electricity to asubsidized flat-rate tariff. The cost of supply soon exceeded revenue earned and most SEBsmade huge losses.
Since the marginal cost of pumping groundwater was near zero, there was over-pumping and in places groundwater markets developed. In arid and semi-arid regions withhard-rock aquifers and low recharge, water tables fell sharply, putting the livelihoods ofmillions of poor farmers, who depended on groundwater irrigation, in jeopardy (Moench1996). In contrast, in areas with abundant rainfall and alluvial aquifers with adequaterecharge, such as Bihar and West Bengal (Mukherji 2007, 2009b) the groundwater systemis more robust and was not over-pumped, due in part to inadequate electricity infrastructure.
There are therefore two energy-irrigation stories in the IGBs. The first is the viciouscycle of low, flat electricity tariffs, leading to over-pumping of groundwater and bankruptSEBs, which is difficult to break due to the political power of the farmers with entrenchedinterests. This is true for Punjab, Haryana and western UP in India. The second is less oftentold. In water-abundant eastern India, Nepal Terai and Bangladesh, farmers mostly usediesel pumps, which have become increasingly costly to run, and with different outcomes.We examine the two scenarios below.
Electricity policy and groundwater use: evidence from Gujarat, West Bengaland Uttarakhand states in India
West Bengal, in eastern India in the lower Ganges Basin, has a groundwater potential of31 km3 at shallow depths. Only 42% of the available groundwater resource is used (WaterInvestigation and Development Department [WIDD] 2004). Agriculture uses only 6.1%of total electricity consumption (West Bengal State Electricity Board [WBSTEB] 2006).There is an active market for groundwater. The state of Uttarakhand in the upper GangesBasin has groundwater resources of 2.1 km3, of which 66% is currently used (GoI 2005).Agriculture uses only 12% of the total electricity in the state, although 70% of tubewellsare electric. Water markets are less developed than in West Bengal because landholdingsare larger so that farmers have their own tubewells, and water is also widely available fromreliable government tubewells. Gujarat, a western state of India, is outside the IGBs, butbecause it successfully resolved its agricultural energy problem, we include it. Gujarat hasa groundwater potential of 15.8 km3 of which 76% is withdrawn each year. Groundwaterin 61% of the administrative blocks is rated by the Central Ground Water Board as over-exploited, critical or semi-critical. Until recent reforms, Gujarat had one of the highestelectricity subsidies in India. The SEB made heavy losses and the quality of power supplydeteriorated, especially in rural areas. Gujarat also has an active market for groundwater.
The process of reform in three states. The government of West Bengal installed remotelysensed, tamper-proof meters, which differentiate the cost of electricity during the day.Prices discourage pumping during peak hours and encourage it during the slack hours
510 B. Sharma et al.
of the night. The government of Uttarakhand installed electronic meters, but uses conven-tional meter reading and bills a fixed low tariff of Rs 0.70/kW h, which is lower than theoff-peak rate in West Bengal. In 2003, the government of Gujarat pioneered the JyotirgramScheme (JGS) to separate agricultural and non-agricultural feeders. This involved rewiringof rural Gujarat at cost of US$255 million. The government now provides high-quality,predictable, reliable but rationed power supply to farmers who daily get eight hours’ powerat full voltage on a pre-announced schedule that alternates weekly between day and night.
Impact of electricity reforms. Soon after metering in West Bengal, the pump owners (2%of households) increased their rates by 30–50%. Water buyers have to pay for dearer waterand also receive supply at inconvenient hours. In Uttarakhand, tubewell owners will payless than one third the amount for electricity than under the flat tariff, but we found thatit was usually unpaid in any case. As in West Bengal, the Uttarakhand SEB will earn lessrevenue than before, and the very low-metered tariffs are unlikely to impact the volume ofwater pumped (Mukherji et al. 2006, 2009a).
In contrast, the JGS in Gujarat has improved the quality of village life, spurred non-farm activities, halved the power subsidy to agriculture and reduced groundwater pumping.It offered a mixed bag to medium and large farmers but disadvantaged marginal and land-less farmers. Electricity use of tubewells has fallen 37% from over 15.7 billion kW h/yr in2001 to 9.9 billion kW h in 2006. Groundwater use in Gujarat agriculture has fallen andhas reduced the over-exploitation. Furthermore, JGS has created a groundwater economythat is amenable to regulation at different levels. Elsewhere in India and the rest of theworld, groundwater management has largely been ineffective and costly. In contrast JGShas shown that effective rationing of the power supply can indeed act as a powerful tool formanaging groundwater use for irrigation.
Laws and water resources governance
Water laws provide an effective basis for water governance at national, sub-national andbasin levels. An understanding of how past laws worked can provide insights into how thecurrent policy and legal frameworks will evolve in the future, and how well they addresscurrent needs in the water sector, which is a critical component of economic and socio-political development. Policy and legal frameworks have progressed from a focus on waterdevelopment up to the 1970s towards water management in which water governance hasbecome prominent. In India as a whole there was a flurry of legislation in the last decade,in which the water sector also took part. However, water resources are a state subject andany law regarding its management must be passed by the state concerned, for which thefederal government provides guidance and model frameworks.
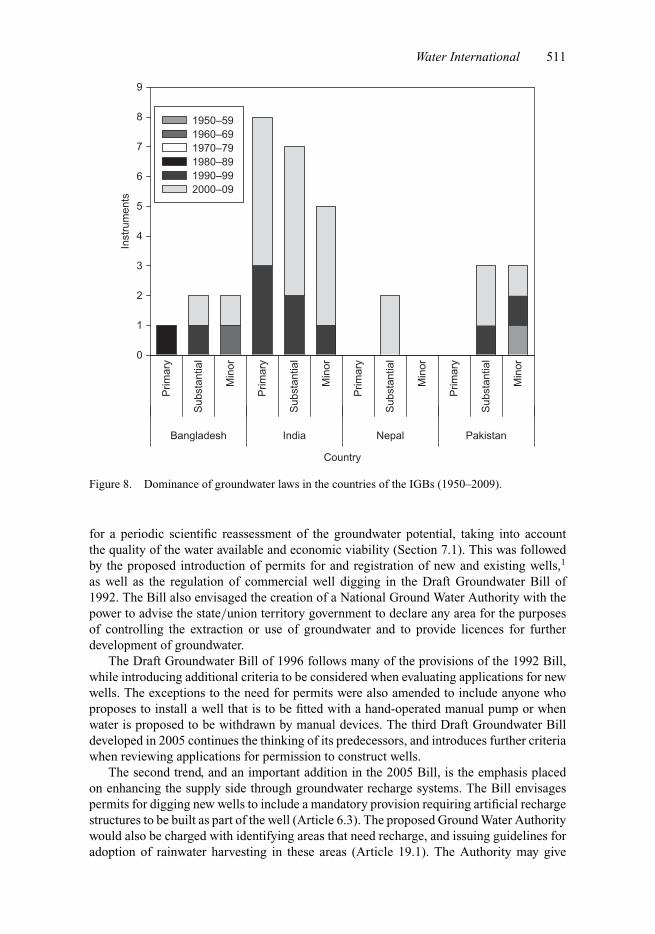
Analysis of laws applicable to groundwater shows greater attention to the topic acrossthe IGBs since the 1990s (Figure 8), and it is a key issue in India at both the federal and statelevels. Groundwater featured in 20 of the 25 instruments assessed for the Indian states in1990–2009, with 15 having it as either a primary or substantial focus. While groundwaterreceived important legislative attention, the relevant instruments adopted by different stateswere substantially similar in content and language. This was most obvious in three federaldraft Groundwater Bills (1992, 1996 and 2005) and the closely similar 2005 bills of thegroundwater legislation of West Bengal, Bihar and Himachal Pradesh.
At the federal level in India, two trends emerge. The first is the gradual move towardsregulation of groundwater use. The need for limiting extraction to the amount of rechargewas recognized by the National Water Policy of 1987 (Section 7.2), which also called
Water International 511
Country
Prim
ary
Sub
stan
tial
Min
or
Prim
ary
Sub
stan
tial
Min
or
Prim
ary
Sub
stan
tial
Min
or
Prim
ary
Sub
stan
tial
Min
or
Inst
rum
ents
0
1
2
3
4
5
6
7
8
9
1950–591960–691970–791980–891990–992000–09
Bangladesh India Nepal Pakistan
Figure 8. Dominance of groundwater laws in the countries of the IGBs (1950–2009).
for a periodic scientific reassessment of the groundwater potential, taking into accountthe quality of the water available and economic viability (Section 7.1). This was followedby the proposed introduction of permits for and registration of new and existing wells,1
as well as the regulation of commercial well digging in the Draft Groundwater Bill of1992. The Bill also envisaged the creation of a National Ground Water Authority with thepower to advise the state/union territory government to declare any area for the purposesof controlling the extraction or use of groundwater and to provide licences for furtherdevelopment of groundwater.
The Draft Groundwater Bill of 1996 follows many of the provisions of the 1992 Bill,while introducing additional criteria to be considered when evaluating applications for newwells. The exceptions to the need for permits were also amended to include anyone whoproposes to install a well that is to be fitted with a hand-operated manual pump or whenwater is proposed to be withdrawn by manual devices. The third Draft Groundwater Billdeveloped in 2005 continues the thinking of its predecessors, and introduces further criteriawhen reviewing applications for permission to construct wells.
The second trend, and an important addition in the 2005 Bill, is the emphasis placedon enhancing the supply side through groundwater recharge systems. The Bill envisagespermits for digging new wells to include a mandatory provision requiring artificial rechargestructures to be built as part of the well (Article 6.3). The proposed Ground Water Authoritywould also be charged with identifying areas that need recharge, and issuing guidelines foradoption of rainwater harvesting in these areas (Article 19.1). The Authority may give
512 B. Sharma et al.
directions to the concerned departments of the state/union territory government to include“rainwater harvesting” in all developmental schemes falling under notified areas.
In urban areas that fall within notified areas, the Authority may issue directives forconstructing appropriate rainwater harvesting structures in all residential, commercial andother premises having an area of 100 m2 or more. Community participation through water-shed management was identified as another means of facilitating ground water recharge inrural areas (Article 19.1). This is to be supported by the promotion of mass awareness andtraining programs on rainwater harvesting and artificial recharge (Article 19.3).
In Bangladesh, permits for wells were introduced by the Ground Water ManagementOrdinance of 1985 (Article 5.1). The Bangladesh National Water Policy of 1999 calls forpreserving natural depressions and water bodies, underground aquifers (Section 4.6b) andthe prohibition of filling in publicly owned water bodies and depressions in urban areas(Section 4.12e). It also encourages massive afforestation and tree coverage, specifically inareas with declining water tables (Section 4.12h), and proposes the regulation of extractionin identified scarcity zones (Section 4.3c).
The primary concern with groundwater in Nepal has been the dependence of largeindustries on groundwater extraction through deep tubewells and the need to regulatethis use through licensing and effective monitoring (Section 4.2.2.4, National Water Plan2002). The approach to groundwater management in Pakistan appears to be area-specific.The Draft National Water Policy promotes groundwater recharge wherever technically andeconomically feasible (Policy 8.4). It calls for the evaluation of the various technologiesbeing used for undisturbed extraction and skimming of fresh groundwater layers overlyingsaline water. It also calls for optimal groundwater pumping in waterlogged areas to lowerthe water table (Policy 8.7), while areas with falling water tables are to be delineated forrestricting uncontrolled abstraction (Policy 8.8).
The importance given to groundwater in water legislations shows the importance ofthis resource in the overall water resources in the IGBs.
Water, land and poverty
Poverty in the countries of the IGBs is intense and multi-faceted. Despite marked progressin the last 50 years, India still has the world’s largest number of poor people. Lack of accessto water and sanitation services and exposure to extreme events reinforce a cycle of vulner-ability. Given that 90% of the poor live in rural areas, poverty is still a rural phenomenon inthe IGBs, and agriculture is the main source of livelihood for most of the rural populationin the countries of the IGBs. Thus reducing rural poverty through improving agriculturalincome is a major pathway for poverty alleviation in the IGBs. Adequate access to reliablewater and quality land resources are crucial for an increase in agricultural productivity.With increasing pressure on limited land resources, however, enhancing the value of agri-cultural productivity per unit of water is crucial for the reduction of rural poverty. But thespatial linkages between poverty and WP are not clearly understood. We need this knowl-edge to design appropriate and geographically targeted interventions for increasing WPand reducing rural poverty.
Spatial and temporal variation of poverty
Low ranking of the human development index (HDI) of the four riparian countries – India(134), Pakistan (141), Nepal (144), Bangladesh (146) (UNDP 2008) – shows the plight ofthe progress of health, education and economic growth in the IGBs. Unfortunately, these
Water International 513
values are far below those of other Asian countries. The headcount ratio (HCR, the frac-tion of the population below the official poverty line) of the riparian countries of IGBs haslately shown some improvement, however. In India, income of more than half the popu-lation was below the poverty line before the mid 1970s. HCR has decreased since then,to about 36% by 1993, and 26% by 2000. About 21% of the Indian population still livedbelow the poverty line in 2006. In Pakistan, the HCR increased in the latter part of the1990s, but has since declined. About 22% of the population in Pakistan remained poor in2005. In Nepal and Bangladesh, about 31% and 40% of the population were poor in 2003and 2005, respectively. In spite of these gains, the poverty associated with high rural pop-ulation is a major concern in all four countries. The depth and severity of poverty in alldemographic groups in the four countries of the IGBs have declined over the last decade,however. Pakistan still has a high poverty gap index and squared poverty gap index, indicat-ing that the income of a large part of the poor population is still well below the poverty line,which is highly likely to be in chronic poverty in the near term. The severity of poverty inBangladesh and Nepal is comparatively lower, indicating smaller inequities of the incomeamongst the poor.
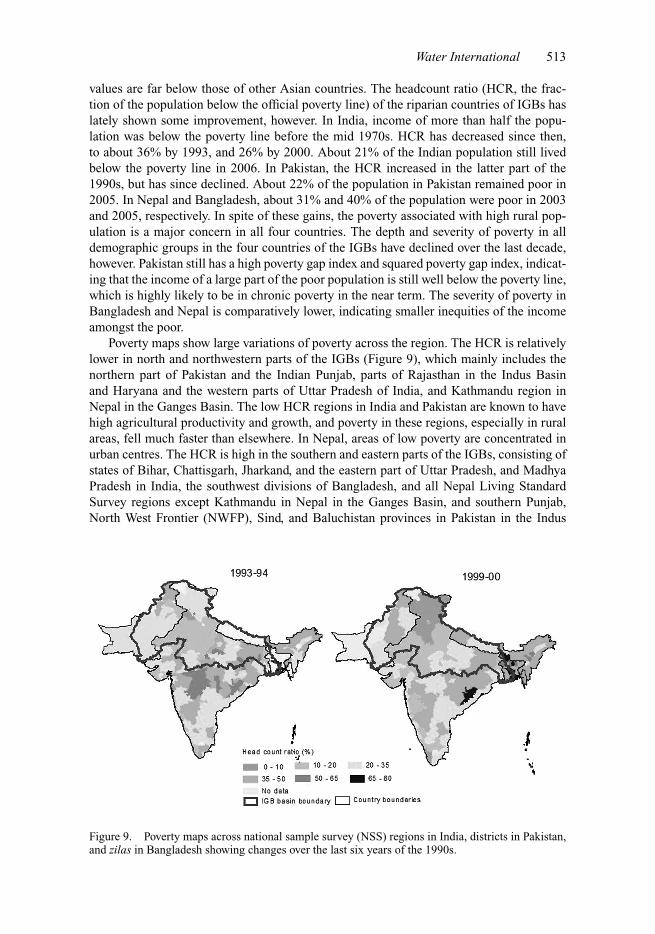
Poverty maps show large variations of poverty across the region. The HCR is relativelylower in north and northwestern parts of the IGBs (Figure 9), which mainly includes thenorthern part of Pakistan and the Indian Punjab, parts of Rajasthan in the Indus Basinand Haryana and the western parts of Uttar Pradesh of India, and Kathmandu region inNepal in the Ganges Basin. The low HCR regions in India and Pakistan are known to havehigh agricultural productivity and growth, and poverty in these regions, especially in ruralareas, fell much faster than elsewhere. In Nepal, areas of low poverty are concentrated inurban centres. The HCR is high in the southern and eastern parts of the IGBs, consisting ofstates of Bihar, Chattisgarh, Jharkand, and the eastern part of Uttar Pradesh, and MadhyaPradesh in India, the southwest divisions of Bangladesh, and all Nepal Living StandardSurvey regions except Kathmandu in Nepal in the Ganges Basin, and southern Punjab,North West Frontier (NWFP), Sind, and Baluchistan provinces in Pakistan in the Indus
Figure 9. Poverty maps across national sample survey (NSS) regions in India, districts in Pakistan,and zilas in Bangladesh showing changes over the last six years of the 1990s.
514 B. Sharma et al.
Basin. Many of the rural poverty hotspots, i.e. those on the third and fourth quartile of theHCR distribution, are clustered in the eastern Ganges Basin.
Water–land–poverty nexus (NWLP)
Poverty is both a cause and an effect involving many factors. The agriculture sector con-tributes only about 20% of GDP in India, Bangladesh and Pakistan but provides livelihoodsto more than 60% of the rural population. Our hypothesis is that growth in agriculture willreduce the incidence of rural poverty in many parts of the IGBs. Among the poorest Indianstates in the Ganges Basin, the agriculture sector in Bihar contributes to 39% of the state’sGDP: 34% in Uttar Pradesh and 28% in West Bengal. Analysis across Indian states in1990/2000 shows that, on average, a 1% increase in GDP/person can decrease total HCRby 1.4%. Analysis based on 2004/5 data shows that a 1% increase in overall GDP and inagriculture GDP should contribute to a reduction of 0.96 and a 1.19% reduction of totaland of rural poverty. This is further evidence that there is a large scope for reducing ruralpoverty through growth in agriculture, which in turn can have a large impact on reducingoverall poverty in the IGBs.
Linkages between water and poverty
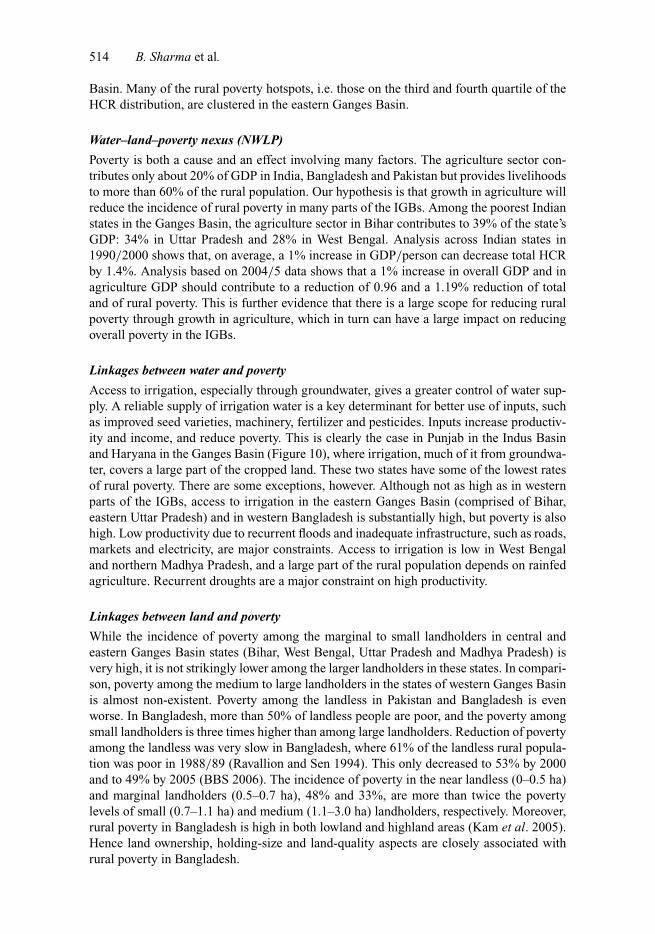
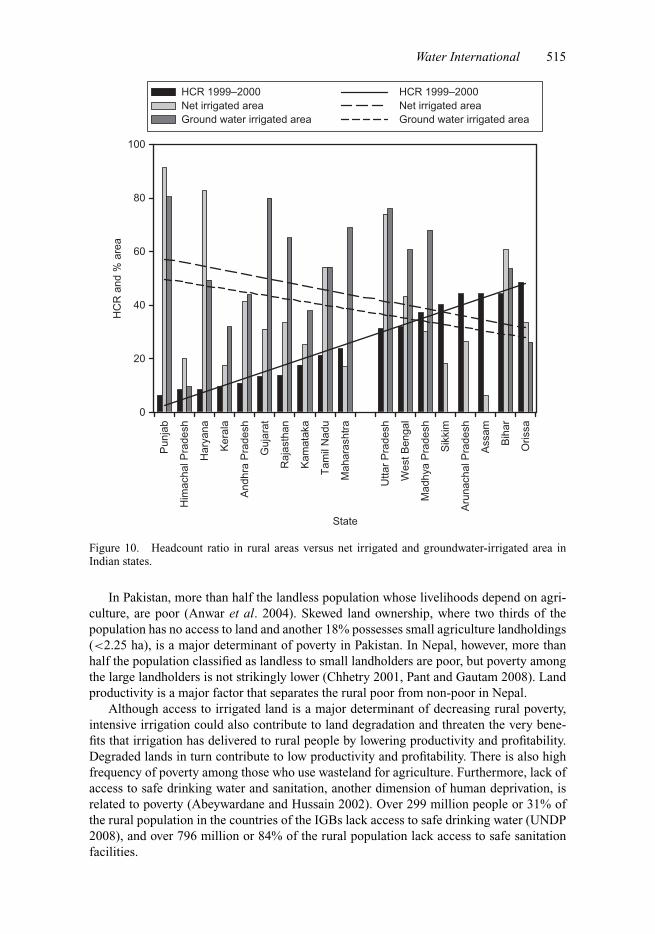
Access to irrigation, especially through groundwater, gives a greater control of water sup-ply. A reliable supply of irrigation water is a key determinant for better use of inputs, suchas improved seed varieties, machinery, fertilizer and pesticides. Inputs increase productiv-ity and income, and reduce poverty. This is clearly the case in Punjab in the Indus Basinand Haryana in the Ganges Basin (Figure 10), where irrigation, much of it from groundwa-ter, covers a large part of the cropped land. These two states have some of the lowest ratesof rural poverty. There are some exceptions, however. Although not as high as in westernparts of the IGBs, access to irrigation in the eastern Ganges Basin (comprised of Bihar,eastern Uttar Pradesh) and in western Bangladesh is substantially high, but poverty is alsohigh. Low productivity due to recurrent floods and inadequate infrastructure, such as roads,markets and electricity, are major constraints. Access to irrigation is low in West Bengaland northern Madhya Pradesh, and a large part of the rural population depends on rainfedagriculture. Recurrent droughts are a major constraint on high productivity.
Linkages between land and poverty
While the incidence of poverty among the marginal to small landholders in central andeastern Ganges Basin states (Bihar, West Bengal, Uttar Pradesh and Madhya Pradesh) isvery high, it is not strikingly lower among the larger landholders in these states. In compari-son, poverty among the medium to large landholders in the states of western Ganges Basinis almost non-existent. Poverty among the landless in Pakistan and Bangladesh is evenworse. In Bangladesh, more than 50% of landless people are poor, and the poverty amongsmall landholders is three times higher than among large landholders. Reduction of povertyamong the landless was very slow in Bangladesh, where 61% of the landless rural popula-tion was poor in 1988/89 (Ravallion and Sen 1994). This only decreased to 53% by 2000and to 49% by 2005 (BBS 2006). The incidence of poverty in the near landless (0–0.5 ha)and marginal landholders (0.5–0.7 ha), 48% and 33%, are more than twice the povertylevels of small (0.7–1.1 ha) and medium (1.1–3.0 ha) landholders, respectively. Moreover,rural poverty in Bangladesh is high in both lowland and highland areas (Kam et al. 2005).Hence land ownership, holding-size and land-quality aspects are closely associated withrural poverty in Bangladesh.
Water International 515
State
Pun
jab
Him
acha
l Pra
desh
Har
yana
Ker
ala
And
hra
Pra
desh
Guj
arat
Raj
asth
an
Kam
atak
a
Tam
il N
adu
Mah
aras
htra
Utta
r P
rade
sh
Wes
t Ben
gal
Mad
hya
Pra
desh
Sik
kim
Aru
nach
al P
rade
sh
Ass
am
Bih
ar
Oris
sa
HC
R a
nd %
are
a
0
20
40
60
80
100
HCR 1999–2000 Net irrigated area Ground water irrigated area
HCR 1999–2000 Net irrigated area Ground water irrigated area
Figure 10. Headcount ratio in rural areas versus net irrigated and groundwater-irrigated area inIndian states.
In Pakistan, more than half the landless population whose livelihoods depend on agri-culture, are poor (Anwar et al. 2004). Skewed land ownership, where two thirds of thepopulation has no access to land and another 18% possesses small agriculture landholdings(<2.25 ha), is a major determinant of poverty in Pakistan. In Nepal, however, more thanhalf the population classified as landless to small landholders are poor, but poverty amongthe large landholders is not strikingly lower (Chhetry 2001, Pant and Gautam 2008). Landproductivity is a major factor that separates the rural poor from non-poor in Nepal.
Although access to irrigated land is a major determinant of decreasing rural poverty,intensive irrigation could also contribute to land degradation and threaten the very bene-fits that irrigation has delivered to rural people by lowering productivity and profitability.Degraded lands in turn contribute to low productivity and profitability. There is also highfrequency of poverty among those who use wasteland for agriculture. Furthermore, lack ofaccess to safe drinking water and sanitation, another dimension of human deprivation, isrelated to poverty (Abeywardane and Hussain 2002). Over 299 million people or 31% ofthe rural population in the countries of the IGBs lack access to safe drinking water (UNDP2008), and over 796 million or 84% of the rural population lack access to safe sanitationfacilities.
516 B. Sharma et al.
Water–land–poverty nexus (NWLP) analysis at the household and district level
In our analysis we used a logit regression (LR) model, combining explanatory variablesextracted from secondary data on households and administrative units, to understandNWLP at the household and district level. The LR model examines the probability (P)of a person being in poverty given the socio-economic status, assets of households, andcropping patterns, crop productivity, land tenure and size of holding, water sources andirrigation patterns, and level of infrastructure development of the administrative district.We extracted the data for this analysis from the National Sample Survey Organisation(NSSO) 61st round survey in 2004/5, which contains 32,230 household records in 280districts in 16 states or union territories of India. We outline some of the importantobservations below.
Agriculture-related economic activities are still the dominant form of livelihood of therural population. Reduction of rural poverty can be accelerated in a two-track approach: thepro-poor agriculture growth interventions can still play a major role in reducing povertyin the agriculture-operator households, and improving skills and enhancing opportuni-ties for employment in the non-farm sector can reduce poverty among the agriculturallabourers.
In the IGP in India, growth in agriculture is significantly related to the growth in yieldof food grains, and crop diversification. The existing grain yields range from 0.9 t/ha inthe central region in Bihar to 4.5 t/ha in the western Punjab and provide a strong indicationof the magnitude of the scope for growth in agricultural productivity. Districts with a highpercentage of the area growing fruits and vegetables are also significantly associated withlow HCR.
Rainfall, access to irrigation, irrigation using groundwater, and WP of irrigated agri-culture are all significant in explaining the variation of HCR in the IGBs, with householdshaving large areas of irrigated crops being significantly less poor. The incidence of povertyof households without land and without irrigation are similar, but decrease with betteraccess to irrigation.
Better access to groundwater, in general indicating a reliable irrigation supply, is alsoassociated with low poverty. The positive interaction of WP and the extent of the irri-gated area also show that by increasing access to irrigation, increases in productivity canaccelerate poverty reduction in areas with low levels of water endowment.
Considering the size of the landholding shows that a large number of marginal andsmall landholdings are associated with high levels of rural poverty across districts. Amongthe poor households, 33% have no access to land and a further 54% have only marginalto small landholdings. Moreover, many of these small landholdings are highly fragmentedand therefore seem to be a major reason for low inputs and productivity. These areas arethe hotbed of rural poverty in the eastern IGBs.
Access to infrastructure such as road, markets and electricity also has a major influencein reducing poverty. Districts with higher road density are associated with low HCR. Lackof markets is also a main determinant in the regions with high rural poverty.
Water–land–poverty nexus: lessons from case studies in India, Pakistan and Nepal
We also conducted case studies in India, Pakistan and Nepal to examine the NWLP atthe household level, using questionnaire surveys. The survey was based on three separatequestionnaire instruments responding to the village and household profile and to frag-mentation of the cultivated landholding. In India, we conducted the survey in three leastprogressive districts of Bihar, Vaishali, Darbhanga and Munger. In Pakistan, the case study
Water International 517
site was Rechna Doab and in Nepal, we conducted the study in four villages of Morangand Sunsary districts. We summarize the inferences from the case studies below.
Property rights and the status of water resources
In India, more than two thirds of the respondents purchased agricultural water throughinformal trade mechanisms, with 68% buying water from local groundwater markets, while20% have their own pump and only 6% make use of public canal water. In Pakistan, how-ever, each farmer had an individual allocation of a share in the canal network. In Nepal,use of public canal water was almost universal with only minimal ownership of tubewells.
Water volume allocation in property rights schemes
In India, about two thirds of the buyers and all the water owners make exclusive use of aspecific water source without combining it with any other additional source. In the caseof canal irrigation, however, only 20% depended solely on the canal supply. In Pakistan,the majority of tubewell owners cover only a small amount of the landholdings throughthis source. In Nepal, all the farmers depend only on a single source of water, either canalwater or groundwater.
Farmers’ perspective towards agricultural water use
Indian farmers claim that lack of credit is the major reason for low productivity, closely fol-lowed by insufficient supplies of water, and unpredictable weather. In Pakistan and Nepal,insufficient water supply is by far the most important constraint for higher productivity.Farmers in all three countries identified improved water availability as a major contributingfactor contributing to increased productivity. Farmers are very willing to set up a ground-water market to meet their water needs, but are not able to make financial contributions forsuch a venture. In India, 70% of respondents agree to setting up a co-operative tubewellsystem. Most respondents also gave high priority to the introduction of new technologiesand specialized training on methods to improve production.
Conclusions and recommendations
The waterscape of the Indus and Ganges plains is like a palimpsest. It is a landmass that wasthickly populated and intensively cultivated over 2000 years ago, and carries the imprintsof countless waves of hydraulic tradition. Mastering and manipulating snow-fed perennialstreams and rivers for watering fertile soils has remained the secret of IGB’s endemicallyhigh population-carrying capacity. Unfortunately, past fortunes have turned for the worse.Today India, Pakistan, Nepal and Bangladesh, the four countries that share the contiguousIndus and Ganges basins have more poor people than any other region in the world andare amongst the worst laggards in the global human development index and human povertyindex. Its vast, fertile plains remain overwhelmingly rural and agricultural. Though agri-culture contributes only about 20–25% to the national GDPs, agriculture as a means oflivelihood provides 78% of total employment in Nepal, 63% in Bangladesh, 66% in Indiaand around half in Pakistan. With population pressures bursting at the seams and nowexceeding one billion people, the availability of cultivable land per capita, through whichpeople eke out a living, has shrunk to around 0.1 ha. With the exception of Nepal, the inter-nally renewable fresh water resources are much below the threshold limit and stand at 325,688 and 1149 m3/capita/year respectively for Pakistan, Bangladesh and the Indian parts of
518 B. Sharma et al.
the Indus-Ganges plains. It is certainly no exaggeration to say that the basins of the Indusand the Ganges basins are “under extreme pressure”.
We summarize below some of the important recommendations that arise from the workwe have presented, which will help to improve sustainability of the resources, enhanceagricultural productivity, and alleviate poverty.
(1) Regional perspective: From both the hydrological and socio-ecological perspec-tives, the opportunities, constraints, strengths and weaknesses of the Indus Basinand western Ganges Basin (“northwestern region”) are markedly different fromeastern Ganges Basin (eastern Indian states, Nepal Terai and Bangladesh, “easternregion”). Water and land resources are intensively utilized in northwestern regionand are poorly utilized in the eastern region. Development frameworks and policiesneed to be regionally differentiated to ensure long-term sustainability in the north-western region and substantially improve the productivity and economic dynamismin the eastern region.
(2) Use and abuse of water resources: Most of the available water resources are uti-lized within the Indus Basin leaving little scope for expansion; the basin is closed.The strategic options are for improving crop productivity by moving towards high-value, diversified and precision agriculture, and to release some water from theirrigation sector to meet the growing demands for domestic, industrial and envi-ronmental flows. Net discharge from the Ganges Basin (37%) accounts for morewater than any other use. Additionally, the basin also has a massive and presentlyunutilized static groundwater resource of about 7800 km3. The Ganges Basin coun-tries may immediately initiate sound groundwater development and use policiesthat will help increase productivity, reduce climatic vulnerability and also alleviatepoverty.
(3) Improving agricultural productivity: The average WP for the rice–wheat rotationsystem in the Indus-Ganges plains is low at US$0.131/m3 whereas the “brightspot” areas (about 5% of basin area) have high water productivity of US$0.190/m3.If the basin average value could be increased to the “bright spot” level, the basincould theoretically save 31% of agricultural water consumption with the same pro-duction or alternatively increase production by 31% with the same water input. Thisshows a great opportunity for improving productivity through a set of technical andpolicy interventions.
(4) Potential interventions for improving water productivity: As access to waterresources is relatively poor in large parts of the region, the critical crop waterrequirements are inadequately satisfied and crops experience different degrees ofwater stress. Farmers need to know more about these critical growth stages so thatthey can improve their management of specific crops in different regions throughproper irrigation scheduling. Adoption of resource conservation technologies suchas reduced/zero tillage, laser land levelling, raised bed planting and direct seed-ing of rice need to be promoted better to realize their benefits on a wider scale.Policy measures like regulatory delay in transplanting of paddy and breaking thewater–energy nexus on the pattern of the Jyotirgram scheme will improve ground-water governance. Multiple-use water systems in the hilly areas of the basin andthe eastern region will improve productivity and alleviate poverty of the small andmarginal farmers.
(5) Policy and institutional changes: Energy infrastructure and policies in the easternregion need to be comprehensively and immediately improved so as to empower
Water International 519
the millions of small and poor farmers operating at a very low level of agriculturalproductivity. The groundwater boards and authorities in all the four countries needto be strengthened to move further from their present role of resource estimation toplanning, development and management.
(6) Managing the water–land–poverty nexus: Reduction of pervasive rural povertyin the region can be accelerated in a two-track approach: pro-poor interventionsto increase agricultural yields will play a major role in reducing poverty in theagriculture-operator households, and improving skills and enhancing opportuni-ties for employment in the non-farm sector can reduce poverty among agriculturallabourers. Providing access to irrigation can help achieve substantial improve-ments in productivity, diversification and thus reduction in poverty. Higher accessto groundwater is associated with low poverty. Setting up of co-operative tube-wells managed by small groups of farmers may be a viable option for helping largenumber of marginal farmers with smallholdings. Areas with small and fragmentedholdings are hot spots of rural poverty in the eastern region and need immediatepolicy changes to stimulate consolidation. Access to infrastructure such as roads,markets, electricity and quality inputs can also have a major influence in reducingpoverty.
AcknowledgementsThe authors acknowledge with gratitude the financial and scientific help provided by the ConsultativeGroup on International Agricultural Research (GCGIAR) Challenge Program on Water and Food(CPWF) and the International Water Management Institute (IWMI). Dr Simon Cook, Basin FocalProject Co-ordinator and Dr Vladimir Smakhtin, Theme Leader, provided great help and guidance.We thank Dr Myles Fisher for editing and bringing the paper to its present form.
Note1. Small and marginal farmers will not have to obtain a permit if the well is proposed to be sunk
for exclusively personal purposes (Section 6.1).
ReferencesAbeywardana, S. and Hussain, I., 2002. Water, health and poverty linkages: a case study from
Sri Lanka. Asian Development Bank regional consultation workshop on water and poverty.Colombo: IWMI.
Aggarwal, P.K., et al., 2004. Adapting food systems of the Indo-Gangetic plains to global environ-ment change: key information needs to improve policy information. Environmental Science andPolicy, 7 (6), 487–498.
Ahmad, M.D., et al., 2007. Water saving technologies: myths and realities revealed in Pakistan’srice-wheat systems. Research report 108. Colombo: IWMI.
Ahmad, M.D., Turral, H., and Nazeer, A., 2009. Diagnosing irrigation performance and water pro-ductivity through satellite remote sensing and secondary data in a large irrigation system ofPakistan. Agricultural Water Management, 96 (4), 551–564.
Amarasinghe, U.A., et al., 2005. Spatial variation in water supply and demand across river basinsin India. Research report 83. Colombo: IWMI.
Amarasinghe, U.A., et al., 2007. India’s water future to 2025–2050: business as usual scenario anddeviations. Research report 123. Colombo: IWMI.
Amarasinghe, U., Shah, T., and Singh, O.P., 2008. Changing consumption patterns: Implications onfood and water demand in India. Research report 119. Colombo: IWMI.
Anwar, T., Qureshi, S.K., and Ali, H. 2004. Landlessness and rural poverty in Pakistan. The PakistanDevelopment Review, 43 (4).
520 B. Sharma et al.
Babel, M.S. and Wahid, S.M., 2008. Freshwater under threat: vulnerability assessment of freshwaterresources to environmental change [online]. Nairobi: United Nations Environment Programme.Available from: www.unep.org/pdf/southasia_report.pdf [Accessed 30 July 2010].
Biswas, B., et al., 2006. Integrated assessment of cropping systems in the eastern Indo-Gangeticplain. Field Crops Research, 99 (1), 35–47.
BBS, 2006. Sectoral need-based projections in Bangladesh 2006. Dhaka: Bangladesh Bureau ofStatistics.
Cai, X.L. and Sharma, B.R., 2010. Integrating remote sensing, census and weather data for an assess-ment of rice yield, water consumption and water productivity in the Indo-Gangetic river basin.Agricultural Water Management, 97 (2), 309–316.
Chakraborti, D., et al., 2004. Groundwater arsenic contamination and its health effects in the Ganga-Meghna-Brahmaputra plain. Journal of Environmental Monitoring, 6 (6), 75N–83N.
Chhetry, D., 2001. Understanding rural poverty in Nepal [online]. In: C. Edmonds and S. Medina,eds. Defining an agenda for poverty reduction: proceedings of the first Asia and Pacific forumon poverty (volume II). Manila: Asian Development Bank, 293–314. Available from: http://www.adb.org/Documents/Books/Defining_Agenda_Poverty_Reduction/Vol_1/chapter_26.pdf][Accessed 28 July 2010].
Eastham, J., et al., 2010. Water-use accounts in CPWF basins: simple water-use accounting of theGanges basin. BFP05. Colombo: CPWF Working Papers, Basin Focal Project Series.
Erenstein, O., Malik, R.K., and Singh, S., 2007. Adoption and impacts of zero tillage in theirrigated rice- wheat systems of Haryana, India [online]. New Delhi: Centro International deMejovamiento de Maíz y Trigo (CIMMYT) and the Rice-Wheat Consortium for the Indo-Gangetic Plains. Available from: http://www.rwc.cgiar.org/DownloadServer.asp?p=187&f=2002&n=Erenstein%20et%20al%202007%20Impact%20ZT%20Haryana.pdf [Accessed28 July 2010].
Gosain, A.K. and Rao, S., 2007. Impact assessment of climate change on water resources of two riversystems of India. Jalvigyan Sameeksha, 22 (1), 1–20.
GoI, 2005. Report on third census of minor irrigation schemes (2000–01). New Delhi: MinorIrrigation Division, Ministry of Water Resources, Government of India.
Habib, Z., 2004. Pakistan: Indus Basin water issues [online]. South Asian Journal, 6 (6). Availablefrom: www.southasianmedia.net/Magazine/Journal/6_pakistan_indus.htm [Accessed 30 July2010].
Hobbs, P.R. and Gupta, R.K., 2003. Resource conserving technologies for wheat in rice-wheat sys-tems. In J.K. Ladha, et al., eds. Improving the productivity and sustainability of rice-wheatsystems: Issues and impact. ASA Special Publication 65. Madison, WI: ASA, 149–171.
Hosterman, H.R., et al., 2009. Water, climate change, and adaptation: focus on the Ganges Riverbasin. Nicholas Institute Working Paper. Durham, N.C.: Nicholas Institute for EnvironmentPolicy Solutions, Duke University.
IPCC, 2001. Climate chang 2001. Third assessment report of the Intergovernmental Panel on ClimateChanges. Cambridge: Cambridge University Press.
Jain, S.K., Agarwal, P.K., and Singh, V.P., 2007. Hydrology and water resources of India. Dordrecht:Springer.
Jain, S.K., et al., 2009. A comparative analysis of the hydrogeology of the Indus-Gangetic and YellowRiver basins. In: A. Mukherji, et al., eds. Groundwater governance in the Indo-Gangetic andYellow River basins: Realities and challenges. London: CRC Press, 43–66.
Jat, M.L., et al., 2006. Land leveling: a precursor technology for resource conservation. Rice-Wheat Consortium Technical Bulletin Series 7. New Delhi: Rice-Wheat Consortium for theIndo-Gangetic Plains.
Jehangir, W.A., et al., 2007. Sustaining crop water productivity in rice–wheat systems of South Asia:a case study from Punjab Pakistan. IWMI Working Paper 115. Colombo: IWMI.
Kam, Suan-Pheng, et al., L.S. 2005. Spatial patterns of rural poverty and their relationship withwelfare-influencing factors in Bangladesh. Food Policy, 30 (5–6), 551–567.
Kulkarni, A.V., et al., 2007. Glacial retreat in Himalaya using Indian remote sensing satellite data.Current Science, 92 (1), 69–74.
Mikhail, M. and Yoder, R., 2009. Multiple-use water service implementation in Nepal and India:Experiences and lessons for scale-up. Colombo: International Development Enterprises, CPWF,and IWMI.
Moench, M., 1996. Groundwater policy: Issues and alternatives in India. Colombo: IWMI.
Water International 521
Molden, D., et al., 2003. A water productivity framework for understanding and action. In: J.W. Kijne,B. Randolph, and D.J. Molden, eds. Water productivity in agriculture: limits and opportunitiesfor improvement. Wallingford: CABI Publishing, 1–18.
Mukherji, A., 2006. Political ecology of groundwater: the contrasting case of water abundant WestBengal and water scarce Gujarat, India. Hydrogeology Journal, 14 (3), 392–406.
Mukherji, A., 2007. The energy-irrigation nexus and its implications for groundwater marketsin eastern Indo-Gangetic basin: evidence from West Bengal, India. Energy Policy, 35 (12),6413–6430.
Mukherji, A., et al. eds, 2009a. Groundwater governance in the Indo-Gangetic and Yellow RiverBasins: realities and challenges. London: CRC Press.
Mukherji, A., et al., 2009b. Metering of agricultural power supply in West Bengal, India: Who gainsand who loses? Energy Policy, 37 (12), 5530–5539.
Pant, D. and Gautam, K.R., 2008. Literature synthesis: water, land and poverty nexus in IGB. Caseof Nepal. Draft report prepared for the IGB-Basin Focal Project.
Ravallion, M. and Sen, B. 1994. How land-based targeting affects rural poverty. Policy ResearchWorking Paper 1270. Washington, D.C.: World Bank.
Repetto, R., 1994. The “second India” revisited: population, poverty and environmental stress overtwo decades. Washington, D.C.: World Resources Institute.
Rodell, M., Velicogna, I., and Famiglietti, J.S., 2009. Satellite-based estimates of groundwaterdepletion in India. Nature, 460 (7258), 999–1002.
Saaty, T.L., 1980. The analytic hierarchy process. New York: McGraw-Hill.Scott, C. and Sharma, B.R., 2009. Energy supply and the expansion of groundwater irrigation in the
Indus-Gangetic Basin. International Journal of River Basin Management, 7 (119), 119–124.Shah, T., 2009. Taming the anarchy: groundwater governance in South Asia. Washington, D.C.: RFF
Press.Shah, T., et al., 2009. Is irrigation water really free?: a reality check in the Indo-Gangetic Basin.
World Development, 37 (2), 422–434.Sharma, B.R., 2009. Impact of climate change on water resources and potential adaptations for
agriculture in the Indus-Gangetic basin. Abstracts 60th IEC meeting & 5th Asian regionalconference on improving in efficiency of irrigation projects through technology upgrada-tion and better operation & maintenance, 6–11 December 2009, New Delhi. New Delhi:International Commission on Irrigation and Drainage, 301. Available from: http://www.ag-groundwater.org/Materials/Ag-GW_2010_Abstract.Pdf
Sharma, B.R. and Ambili, G., 2010. Impact of state regulation on groundwater exploitation in the“hotspot” region of Punjab, India. Towards sustainable groundwater in agriculture: An inter-national conference on linking science and policy. University of California, Davis, 15–17 June2010.
Sharma, B.R. and McCornick, P.G., 2006. Domestic policy framework on adaptation to climatechange in water resources: Case study for India [online]. In: Working together to respond toclimate change: Annex I expert group seminar of OECD global forum on sustainable devel-opment, 27–28 March 2006, Paris: OECD. Available from: http://www.iwmi.cgiar.org/tmp/H039635.pdf [Accessed 28 May 2010].
Sharma, B.R., et al., 2010. Water poverty in the northeastern hill region (India): potential allevia-tion through multiple- use water systems- cross-cutting learning from Nepal hills. InternationalWater Management Institute–National Agriculture Innovation Project (IWMI-NAIP), Report 1.New Delhi: IWMI.
Sikka, A., Scott, C.A., and Sharma, B.R., 2003. Integrated basin water management in theIndo-Gangetic basin. Challenge Program on Water and Food workshop, Dhaka, Bangladesh,21–22 December 2003. Unpublished. Available from International Water Management Institute,New Delhi, India.
Tangri, A.K., 2000. Integration of remote sensing data with conventional methodologies in snow meltrunoff modeling in Bhagirathi river basin, U.P. Himalayas. Technical report. Lucknow, India:Remote Sensing Application Centre.
UNDP, 2008. Human Development Report 2007/2008. Fighting climate change. Human solidarityin a divided world. New York: United Nations Development Program.
WBSEB, 2006. Yearbook. Kolkata, India: WBSEB.WIDD, 2004. Groundwater resources of West Bengal: an estimation by GEC-1997 methodology.
Kolkata, India: WIDD, Government of West Bengal.
Dell
Cross-Out
Dell
Sticky Note
Move the deleted line from above reference to this reference.
Dell
Sticky Note
Expand the Acronym: West Bengal State Electricity Board
Dell
Sticky Note
Expand Acronym: West Bengal Irrigation & Drainage Department
Related Documents