Dynamics of Atmospheres and Oceans 50 (2010) 115–128 Contents lists available at ScienceDirect Dynamics of Atmospheres and Oceans journal homepage: www.elsevier.com/locate/dynatmoce The Indonesian throughflow during 2004–2006 as observed by the INSTANT program A.L. Gordon a,∗ , J. Sprintall b , H.M. Van Aken c , D. Susanto a , S. Wijffels d , R. Molcard e , A. Ffield f , W. Pranowo g , S. Wirasantosa g a Lamont-Doherty Earth Observatory of Columbia University, 61 Route 9W, Palisades, NY, 10964, USA b Scripps Institution of Oceanography, University of California, San Diego, La Jolla, CA, USA c Royal Netherlands, Institute for Sea Research, P.O. Box 59, 1790 AB Den Burg/Texel, The Netherlands d CSIRO Marine and Atmospheric Research, Hobart TAS, Australia e LOCEAN – IPSL, UMR 7159 CNRS/IRD/UPMC/MNHN, Université Pierre et Marie Curie aile 45-55, 4 ème étage. Case 100 - 4 Place Jussieu 75252 Paris cedex 05, France f Earth & Space Research, 290 Clausland Mountain Road, Upper Grandview, NY, 10960, USA g Agency for Marine and Fisheries Research (BRKP), Jakarta, Indonesia article info Article history: Available online 23 December 2009 Keywords: Ocean circulation Indonesian throughflow Tropical oceanography Interocean exchange abstract The Indonesian seas provide a sea link between the tropical Pacific and Indian Oceans. The connection is not simple, not a single gap in a ‘wall’, but rather composed of the intricate patterns of passages and seas of varied dimensions. The velocity and tem- perature/salinity profiles Indonesian throughflow (ITF) are altered en route from the Pacific into the Indian Ocean by sea–air buoy- ancy and momentum fluxes, as well as diapycnal mixing due to topographic boundary effects and dissipation of tidal energy. The INSTANT program measured the ITF in key channels from 2004 to 2006, providing the first simultaneous view of the main ITF pathways. The along-channel speeds vary markedly with passage; the Makassar and Timor flow is relatively steady in comparison to the seasonal and intraseasonal fluctuations observed in Lom- bok and Ombai Straits. The flow through Lifamatola Passage is strongly bottom intensified, defining the overflow into the deep Indonesian basins to the south. The 3-year mean ITF transport recorded by INSTANT into the Indian Ocean is 15 × 10 6 m 3 /s, about 30% greater than the values of non-simultaneous measurements made prior to 2000. The INSTANT 3-year mean inflow transport is nearly 13 × 10 6 m 3 /s. The 2 × 10 6 m 3 /s difference between INSTANT measured inflow and outflow is attributed to unresolved surface ∗ Corresponding author. Tel.: +1 845 365 8325; fax: +1 845 365 8157. E-mail address: [email protected] (A.L. Gordon). 0377-0265/$ – see front matter © 2009 Elsevier B.V. All rights reserved. doi:10.1016/j.dynatmoce.2009.12.002

Welcome message from author
This document is posted to help you gain knowledge. Please leave a comment to let me know what you think about it! Share it to your friends and learn new things together.
Transcript

Dynamics of Atmospheres and Oceans 50 (2010) 115–128
Contents lists available at ScienceDirect
Dynamics of Atmospheresand Oceans
journal homepage: www.elsevier.com/locate/dynatmoce
The Indonesian throughflow during 2004–2006 as observedby the INSTANT program
A.L. Gordona,∗, J. Sprintall b, H.M. Van Akenc, D. Susantoa, S. Wijffelsd,R. Molcarde, A. Ffield f, W. Pranowog, S. Wirasantosag
a Lamont-Doherty Earth Observatory of Columbia University, 61 Route 9W, Palisades, NY, 10964, USAb Scripps Institution of Oceanography, University of California, San Diego, La Jolla, CA, USAc Royal Netherlands, Institute for Sea Research, P.O. Box 59, 1790 AB Den Burg/Texel, The Netherlandsd CSIRO Marine and Atmospheric Research, Hobart TAS, Australiae LOCEAN – IPSL, UMR 7159 CNRS/IRD/UPMC/MNHN, Université Pierre et Marie Curie aile 45-55, 4 ème étage.Case 100 - 4 Place Jussieu 75252 Paris cedex 05, Francef Earth & Space Research, 290 Clausland Mountain Road, Upper Grandview, NY, 10960, USAg Agency for Marine and Fisheries Research (BRKP), Jakarta, Indonesia
a r t i c l e i n f o
Article history:Available online 23 December 2009
Keywords:Ocean circulationIndonesian throughflowTropical oceanographyInterocean exchange
a b s t r a c t
The Indonesian seas provide a sea link between the tropical Pacificand Indian Oceans. The connection is not simple, not a singlegap in a ‘wall’, but rather composed of the intricate patterns ofpassages and seas of varied dimensions. The velocity and tem-perature/salinity profiles Indonesian throughflow (ITF) are altereden route from the Pacific into the Indian Ocean by sea–air buoy-ancy and momentum fluxes, as well as diapycnal mixing due totopographic boundary effects and dissipation of tidal energy. TheINSTANT program measured the ITF in key channels from 2004to 2006, providing the first simultaneous view of the main ITFpathways. The along-channel speeds vary markedly with passage;the Makassar and Timor flow is relatively steady in comparisonto the seasonal and intraseasonal fluctuations observed in Lom-bok and Ombai Straits. The flow through Lifamatola Passage isstrongly bottom intensified, defining the overflow into the deepIndonesian basins to the south. The 3-year mean ITF transportrecorded by INSTANT into the Indian Ocean is 15 × 106 m3/s, about30% greater than the values of non-simultaneous measurementsmade prior to 2000. The INSTANT 3-year mean inflow transport isnearly 13 × 106 m3/s. The 2 × 10⁶ m3/s difference between INSTANTmeasured inflow and outflow is attributed to unresolved surface
∗ Corresponding author. Tel.: +1 845 365 8325; fax: +1 845 365 8157.E-mail address: [email protected] (A.L. Gordon).
0377-0265/$ – see front matter © 2009 Elsevier B.V. All rights reserved.doi:10.1016/j.dynatmoce.2009.12.002

116 A.L. Gordon et al. / Dynamics of Atmospheres and Oceans 50 (2010) 115–128
layer transport in Lifamatola Passage and other channels, such asKarimata Strait. Introducing inflow within the upper 200 m to zerothe water column net convergence still requires upwelling withinthe intervening seas, notably the Banda Sea. A layer of minimumupwelling near 600 m separates upwelling within the thermoclinefrom a deep water upwelling pattern driven by the deep overflowin Lifamatola Passage. For a steady state condition upwelling ther-mocline water is off-set by a 3-year mean sea to air heat flux of80 W/m2 (after taking into account the shoaling of thermoclineisotherms between the inflow and outflow portals), which agreeswith the climatic value based on bulk formulae sea–air flux calcula-tions, as well as transport weighted temperature of the inflow andoutflow water. The INSTANT data reveals interannual fluctuations,with greater upwelling and sea to air heat flux in 2006.
© 2009 Elsevier B.V. All rights reserved.
1. Introduction to the Indonesian throughflow
The Indonesian seas represent a complex array of passages linking shallow and deep seas (Fig. 1).The literature, dating to 1961 (Wyrtki, 1961), offers a wide range of annual mean transport valuesfor the ITF, from near zero to 25 Sv (Sv = 106 m3/s). Estimates based on observations obtained fromthe mid-1980s and mid-1990s suggest a mean ITF of ∼10 Sv (Gordon, 2005; Fig. 1) with interannualand seasonal fluctuations, as well as energetic intraseasonal (<90 days) variability and tides (Gordon,
Fig. 1. Transport values in 106 m3/s within the passages measured by the INSTANT program, 2004–2006. The italics numbers inblack represent transport values based on pre-INSTANT data: Makassar Strait, 1997 (Gordon et al., 1999; Susanto and Gordon,2005); Lombok Strait, 1985 (Murray and Arief, 1988; Arief and Murray, 1996); Timor Passage (south of Timor) from March 1992to April 1993 (Molcard et al., 1996); Ombai Strait (north of Timor) for 1996 (Molcard et al., 2001). The pre-INSTANT value of1.5 Sv for the Lifamatola Passage represents overflow of dense water at depths greater than 1500 m based on 3.5 months ofcurrent meter measurement in early 1985 (Van Aken et al., 1988). The red numbers are the 2004–2006 3-year mean transportsmeasured by INSTANT. In Lifamatola Passage, the green number is the INSTANT overflow transport >1250 m, representing theoverflow into the deep Seram and Banda Seas, and the red number is the total transport measured by INSTANT below 200 m.The positions of the INSTANT moorings are shown in Fig. 3. For details about the INSTANT moorings and transport values seeGordon et al. (2008); Sprintall et al. (2009); Van Aken et al. (2009).

A.L. Gordon et al. / Dynamics of Atmospheres and Oceans 50 (2010) 115–128 117
2005; Qiu et al., 1999; Wijffels and Meyers, 2004; Susanto et al., 2000; Sprintall et al., 2000; Egbertand Ray, 2001; Ray et al., 2005; Pujiana et al., in press). The ITF is a response to ocean-scale wind stressas characterized by the “Island Rule” (Godfrey, 1989), and to the phase of El Nino-Southern Oscillation(ENSO; Meyers, 1996; England and Huang, 2005; Wijffels et al., 2008) and its Indian Ocean “cousin”, theIndian Ocean Dipole, IOD (Saji et al., 1999; Wijffels et al., 2008; Potemra and Schneider, 2007) as wellas the regional monsoonal wind pattern over southeast Asia (Gordon et al., 2003; Susanto et al., 2007).
Many model studies have investigated the ITF impact on the Indian and Pacific heat and freshwa-ter budgets and on the ITF role in the climate system (Hirst and Godfrey, 1993; MacDonald, 1993;Maes, 1998; Murtugudde et al., 1998; Wajsowicz and Schneider, 2001; Wajsowicz, 2002; Schott andMcCreary, 2001; McCreary and Lu, 2001; Lee et al., 2002). The model dependent results indicatechanges in the ocean surface temperature and meridional circulation within the Indian and PacificOceans according to the characteristics of the ITF. The ITF affects atmosphere–ocean coupling withpotential impacts on the ENSO and monsoon phenomena (Webster et al., 1998).
The water within the thermocline of the Indonesian seas is derived for the most part from the NorthPacific Ocean by way of Makassar Strait, while the source water for lower thermocline is drawn fromthe South Pacific via the Halmahera Sea (Gordon and Fine, 1996; Gordon, 2005). Lifamatola Passageeast of Sulawesi, with a sill depth of ∼2000 m, funnels spillover of deep water into the depths of theBanda Sea (Van Aken et al., 1988).
The Indonesian seas do not simply provide a passive conduit for interocean exchange, as the strat-ification of the inflowing Pacific is altered before its export into the Indian Ocean. During the ∼1 yearresidence of the Makassar transport (∼10 Sv) within the Banda Sea (above the sill depth of Makas-sar Strait, ∼700 m), the inflowing Pacific stratification is modified by mixing, with energy derivedfrom dissipation of powerful tidal currents (Ffield and Gordon, 1992, 1996; Egbert and Ray, 2001;Koch-Larrouy et al., 2007), by Ekman pumping (Gordon and Susanto, 2001), as well as heat and fresh-water flux across the sea–air interface. This results in a unique Indonesian tropical stratification witha strong, although relatively isohaline, thermocline. The formation of the Indonesian stratification isfurther complicated as the inflow and outflow at the intraseasonal to seasonal time scales are notnecessarily in balance, with water accumulating and modified within the Banda Sea from February toJune and released during the rest of the year (Gordon and Susanto, 2001; Qu et al., 2008). It is the goalof this paper to discuss the annual time scales of convergence/divergence within the Banda Sea.
The Indonesian water is exported into the Indian Ocean within the three major passages along theNusa Tenggara archipelago: Timor Passage (1250 m eastern sill depth at Leti Strait, and ∼1890 m west-ern sill depth where the INSTANT moorings are located); Ombai Strait (upstream sill depth ∼1450 m ofAlor Strait, and downstream sill depth ∼1150 m in Savu Strait); and Lombok Strait (sill depth ∼300 m tosouth of INSTANT moorings) (Fig. 1). The waters of the ITF are apparent within the thermocline as a rel-atively cool, low-salinity streak across the Indian Ocean near 12◦S (Gordon, 2005) and at intermediatedepths as a band of high silicate (Talley and Sprintall, 2005).
The interocean fluxes of heat and freshwater associated with the ITF do not depend on just thenet transport, but also on the form of the velocity, temperature and salinity profiles (Potemra et al.,2003; Song and Gordon, 2004). The annual mean transport may not change, but if the transport profilevaries relative to that of temperature and salinity, the interocean heat and freshwater transports wouldchange accordingly.
2. International Nusantara Stratification and Transport (INSTANT) program
In the past, the main throughflow passages have been measured over different years and for variedlengths of time, making it impossible to assemble a reliable synoptic picture of the ITF. The transportsreported in the literature for the primary ITF passages and the time interval over which the transportis based is shown in Fig. 1. Historically, the transport through Makassar Strait is estimated as 9.2 Sv(Gordon et al., 1999; Susanto and Gordon, 2005), and the overflow in the Lifamatola Passage is 1.5 Sv(Van Aken et al., 1988). The sum of the export to the Indian Ocean as measured within Lombok Strait,Ombai Strait and Timor Passage over different time intervals is 11 Sv (Gordon, 2005). Are the pre-2000ITF transport values as shown in Fig. 1 faithful to the climatic (long-term) mean or simply reflecting“noise” due to higher frequency variability?

118 A.L. Gordon et al. / Dynamics of Atmospheres and Oceans 50 (2010) 115–128
Fig. 2. The Nino4 index (see: http://www.esrl.noaa.gov/psd/forecasts/sstlim/timeseries/README.html) and Indian OceanDipole (Dipole Mode Index, DMI, Saji et al., 1999; see: http://www.jamstec.go.jp/frsgc/research/d1/iod/) during the INSTANTperiod. Neither index moved into an extreme phase relative to the prior 50 years during the INSTANT period. Nino4 was in aweak El Nino phase, except for a brief La Nina phase in early 2006. The DMI was slightly negative during most of the INSTANTperiod, with a large positive period in the latter half of 2006.
The International Nusantara Stratification and Transport program (Sprintall et al., 2004; see:http://www.marine.csiro.au/∼cow074/index.htm) was established to directly measure the depthdependent ITF from the intake of Pacific water at Makassar Strait and Lifamatola Passage, to the NusaTenggara (Sunda archipelago) exit channels into the Indian Ocean. The collective merit of the INSTANTprogram over prior measurements of the ITF is the simultaneous, multi-year measurements in all themajor inflow and outflow passages (Fig. 1). This was only possible by the coordinated effort of an inter-national group of researchers, working in collaboration with Indonesian colleagues. Each had specificresponsibilities: United States: Makassar Strait; Lombok, Ombai Straits; The Netherlands: LifamatolaStrait; Australia and France: Timor Passage; Indonesia: CTD observations and ship support.
The flow within the primary ITF passageways measured by INSTANT are reported in the literature:Gordon et al. (2008) for Makassar Strait; Van Aken et al. (2009) for Lifamatola Passage; Sprintall etal. (2009) for the export channels of the Sunda archipelago. The reader is referred to these papersfor analysis of the flow within specific ITF passageways. Here we discuss comparative aspects of theinflow and outflow characteristics as observed by INSTANT, including an estimate of the convergenceversus depth within the seas separating the inflow and outflow corridors.
Three years cannot capture the climatic mean ITF (low frequency fluctuations of the climate sys-tem make this effectively impossible), but the simultaneous measurements within the key passagescapture the state of the ITF and its profile over a specific time period, revealing its tidal, intraseasonalto annual cycles, with a glimpse of interannual variability. INSTANT fieldwork began in December2003/January 2004 and was completed in November/December 2006. ENSO during the 3-year INSTANTperiod was in a weak El Nino state, with a La Nina phase in late 2005 into early 2006 (Fig. 2), providingsome confidence that the 3-year ITF mean might be a fairly good representation of a longer term mean.The IOD during the INSTANT period was near zero, but with a substantial positive phase in the latterhalf of 2006 (Vinayachandran et al., 2007; Horii et al., 2008). The role of IOD in influencing the ITFtransport independent of ENSO is not clearly established.
3. INSTANT along-channel speeds
A composite view of the along-channel velocity time series at various depths reveals much vari-ability (Fig. 3). Detailed analysis of the along-channel flow is presented in the INSTANT publicationsmentioned above. Here we offer a qualitative comparison of the features revealed by simple inspectionof the time series from the INSTANT passages.

A.L. Gordon et al. / Dynamics of Atmospheres and Oceans 50 (2010) 115–128 119
At all levels Makassar and Timor throughflow are relatively steady, in comparison to Lombok andOmbai, which are rich in intraseasonal oscillations. The intraseasonal features are likely related toKelvin waves that propagate from the Indian Ocean along the southern coast of Sumatra and Java(Sprintall et al., 2000; Wijffels and Meyers, 2004). The inflow and outflow pattern of the along-channelspeeds do not rise and fall in tandem, suggesting either an imbalance due to internal storage of waterwithin the stratum of the interior seas of Indonesia, most likely within the large Banda Sea, or verticaltransport between layers. Both of these processes may occur, although continuity constrains full depthimbalance to relatively short time periods. The partitioning of the speeds into the Indian Ocean amongthe three export channels varies substantially with time.
The surface layer (represented by the 50 m panel of Fig. 3) shows near zero and even flow reversalsduring the northwest monsoon (boreal winter) at all passages. Significant reversals of up 0.5 m/s atLombok and Ombai Straits are also observed in May 2004 and April 2006. Lombok and Ombai exhibitthe greatest range of speeds, from +0.7 to −1.1 m/s. Makassar and Timor have equivalent speeds at50 m of ∼0.4 m/s. However, during the southeast monsoon (boreal summer) Makassar speeds at 50 mexceed that of Timor by a factor of 2. Atmadipoera et al. (2009) using the INSTANT time series withinthe three Sunda channels find that the passages act in a sequential way from April through Septemberin the export of low salinity surface and upper thermocline water into the Indian Ocean, with theLombok Strait leading export through Ombai and Timor by one and 5 months.
Within the thermocline (the 150 m panel of Fig. 3) the intraseasonal fluctuations are somewhatsubdued relative to that in the surface layer, although Ombai continues to display the most vigorousvariability with speeds occasionally comparable to that found in Makassar. The Makassar thermoclinespeeds are about 50% larger than that of the surface layer, and are about two to three times thethermocline speeds in Timor Passage. Thermocline intensification of Makassar Strait throughflow wasalso observed in 1997 (Gordon et al., 1999) leading to a cooler then expected heat flux (Gordon et al.,2003). The lack of sustained thermocline intensification in the outflow indicates that the presence ofnet upwelling within the Banda Sea, as discussed below.
In the lower thermocline (the 350 m panel of Fig. 3) there is reduced along-channel flow. The weakflow in Lombok is to be expected as 350 m is below the sill depth, located south of the INSTANT Lombokmoorings. Lombok, Timor and Lifamatola speeds are generally less than 0.1 m/s, though at Timor thespeeds rise to 0.2 m/s towards the Indian Ocean from February to April in each of the INSTANT years,and Lifamatola displays a preference to flow towards the Pacific Ocean of ∼0.1 m/s from August 2005to June 2006. Ombai continues to display most variability with strong flows toward the Indian Oceanduring the northwest monsoon when the surface flow is reversed. The Makassar speeds at 350 m areslightly more variable than observed at 150 m.
Within the deep layers, >750 m, the ‘stand-out’ is the vigorous overflow into the Banda Sea throughLifamatola Strait, with speeds of about 0.5 m/s, and up to 0.7 m/s, at 1950 m, about 50 m above the silldepth. The speeds at the other passages are generally less than 0.2 m/s, but Ombai speeds reach 0.4 m/sin the early stages of both the northwest and southeast monsoon, with the exception of the southeastmonsoon of 2006. The 750 and 1500 m time series in Makassar, both below the 680 m topographic silldepths average near zero, with intraseasonal fluctuations distinctly out of phase.
4. INSTANT transports
The ITF transports within the passageways observed by INSTANT for 2004–2006 (Fig. 1; Table 1)are reported by Gordon et al. (2008) (Makassar Strait); Van Aken et al. (2009) (Lifamatola Passage) andSprintall et al. (2009) (Lombok Strait, Ombai Strait and Timor Passage). The reader is referred to thesepapers for specifics on the data set and methods used in determining the velocity field and associatedtransport. In the above mentioned publications, the authors present what they consider are the mostreasonable or “best” transport through each of the INSTANT measured passages (Table 1). Here webriefly discuss the mean, range and standard deviation of these “best” transport estimates that werereported in each passage over the INSTANT time period, along with an estimate of the errors associatedwith the inherent assumptions behind the transport calculations. These statistics and error estimatesthen provide some guidance for the temporal variability and uncertainty that can be expected in ourcalculation of the inflow–outflow convergences presented in Section 5.

120 A.L. Gordon et al. / Dynamics of Atmospheres and Oceans 50 (2010) 115–128
Fig. 3. Time series of along-channel currents in m/sec within the key passageways of the Indonesian Throughflow [upper panel]as measured by the INSTANT mooring array [lower panel]. The time series lines of the upper panel are color-coded to matchthe mooring color of the lower panel. Negative values denote flow to the south or west (towards the Indian Ocean, dependingon the orientation of the passage). The severe blow-over of the Lifamatola mooring prohibited measurements in the surface and

A.L. Gordon et al. / Dynamics of Atmospheres and Oceans 50 (2010) 115–128 121
Table 1Annual and 3-year net transport in 106 m3/s for the passages measured by the INSTANT program. For Lifamatola the full depthtransports is rounded to the nearest whole Sv value, as the water column above 1250 m is not well resolved. The outflow–inflowimbalance, rounded to the nearest whole Sv value to reflect the uncertainty, is compensated by unresolved transport withinthe surface layer of the Lifamatola Passage and/or other passages not observed by the INSTANT program (as discussed in thetext). The sill depths of each passage [left column] are often less than the depth to which the transport values are summed[2nd column from the left], as the moorings were not necessarily at the passage sill depth. In all passages except Lombok thetransport below the sill is <5% of the water column total (5% at Makassar; 2% at Ombai; 0% at Lifamatola and Timor); at Lombokit is nearly 15% of the water column total but this amounts to only 0.45 Sv.
Passage [sill depth] IntegrationRange (m) 3-Year 2004 2005 2006
Makassar [700 m] 0–2000 11.6 11.3 11.6 11.8Lifamatola [2050 m] 1250–2050 2.5 2.1 2.6 2.7Lifamatola [2050 m] 0–2050 1 0 1 2
Total inflow 12.7 11.6 13.0 13.4Lombok [300 m] 0–1000 2.6 2.0 2.3 3.4Ombai [1150 m] 0–3000 4.9 4.7 5.8 4.3Timor [1890 m] 0–2000 7.5 7.3 7.6 7.6
Total outflow 15.0 14.0 15.7 15.3
Outflow–inflow imbalance 2 2 3 2
The 3-year inflow transports are: 11.6 Sv for Makassar Strait, and 1 Sv for Lifamatola Passage, thelatter represents the sum of the density driven deep overflow into the Seram and Banda Seas (2.5 Svfor depths >1250 m, which is well resolved by the single mooring within the narrow deep channel)and the upper layer transport (∼1.4 Sv northward above 1250 m, which, as noted by Van Aken et al.(2009), is not well resolved by the Lifamatola mooring). The 3-year sum of the inflow transport isnearly 13 Sv. The outflow transport within the three primary passages of the Sunda archipelago is:2.6 Sv for Lombok Strait, 4.9 Sv for Ombai Strait and 7.5 Sv for Timor Passage, yielding a net outflowof 15 Sv. As expected there are fluctuations of the annual transports (Table 1), but these are small,amounting to ∼1.5 Sv, with 2004 being a year of relatively low net ITF, and 2005 and 2006 being aboutequal in magnitude.
The authors discuss the observed variability across a wide range of time scales (refer to the citedpublications for details). The observed Makassar transport variability from the annual 3-year meanof 11.6 Sv varies from 6 to 16 Sv, with a standard deviation of 3 Sv (Gordon et al., 2008). The Sundapassages 3-year mean of 15 Sv export varies from a low of 4 Sv to a high of 24 Sv, with a standarddeviation of 4 Sv (Sprintall et al., 2009). The Lifamatola mean transport below 1250 m representingthe overflow into the deep basins to the south is 2.5 Sv with a standard deviation of 1.3 Sv (Van Aken etal., 2009). The transport above 1250 m is estimated as 0.9–1.3 Sv northward by Van Aken et al. (2009),with a suggested standard deviation of at least 1 Sv.
There are varied constructs for extrapolation of the observed flow fields to the surface, the sea floorand side-walls, which introduces a level of uncertainty in the transport calculations. Here we definethe “uncertainty” as the range in transport using varied extrapolation methods, as discussed by theauthors of the cited INSTANT papers. Using the range of values representing the different extrapolationmethods as given by the authors, an uncertainty of ∼15% is likely for Makassar Strait, and 27% forthe sum of the Sunda export channels (the individual passages range from 30% for Ombai to 26% forLombok). The Lifamatola transport below 1250 m is a fairly robust number, with an uncertainty of ∼5%.However, above 1250 m the uncertainty due to a single mooring within a relatively wide channel isvery large, probably in excess of 50%.
The INSTANT ITF mean outflow transport of 15 Sv is ∼4 Sv or ∼25–30% greater than export transportvalues based on pre-2000 observations (Fig. 1). While this may not be significant in view of the differ-
upper thermocline layers. The Lifamatola time series in the >750 m panel is from ∼1750 m. The Makassar Strait is representedby two lines in the >750 m panel, the lighter blue is from a current meter set at 750 m depth, the darker blue line is from a1500 m current meter.

122 A.L. Gordon et al. / Dynamics of Atmospheres and Oceans 50 (2010) 115–128
ent mooring design and general uncertainty of determining cross-channel transport, interannual ITFfluctuations are to be expected (Tillinger and Gordon, 2009). The pre-INSTANT measurements weremade mainly in weak to strong El Nino phase when a reduced ITF transport is anticipated. The INSTANTmeasurements were made during weak El Nino conditions and La Nina phase in early 2006, with asubstantial +IOD phase in much of 2006 (Fig. 2).
There is an inflow/outflow 3-year imbalance of ∼2 Sv (Table 1). Combining the extrapolation uncer-tainty of the five INSTANT passages leads to an inflow/outflow uncertainty of 3 Sv. Assuming a Gaussiandistribution the standard deviation is 2 Sv. While the sign of the imbalance may not be robust, itappears likely that the INSTANT observed transport within the inflow passages is less than the INSTANTobserved outflow. The inflow/outflow imbalance may be solely a product of the uncertainty in theside-wall extrapolations. However, difference may also be derived from incomplete monitoring of theinflow passages, including the numerous shallow passages not observed or poorly resolved by theINSTANT mooring array, such the upper ∼1000 m within the Lifamatola Passage.
The passages not measured by the INSTANT program include the inflow through passages suchas Karimata Strait (separating the South China Sea from the Java Sea) and Torres Strait (separatingthe Indonesian seas from the western South Pacific between Australia and New Guinea). KarimataStrait with a sill depth of 50 m is considered to introduce South China Sea water into the Java Sea.Torres Strait is less than 10 m deep with the presence of numerous islands and reefs. From 5 monthsof current observations, Wolanski et al. (1988) found a strong tidal flow, but no evidence of a meanflow through Torres Strait. A more substantial ‘missing passage’ is the wide extent of shallow waternear 2◦S stretching from Sulawesi to the northwestern point of New Guinea (Fig. 1). Most of this gapis shallower than 100 m but parts, including the site of the single INSTANT Lifamatola mooring andthe Halmahera Sea, are deeper than 400 m. The extrapolation of the Lifamatola mooring data to thefull gap between Lifamatola Island and Obimayor is problematic (Van Aken et al., 2009). Additionally,there may be southward flow in the gap near 128◦E between Obimayor and New Guinea, fed from theMaluku Sea or directly from the Halmahera Sea (sill depth of 580 m, Gordon et al., 2003). Analysis ofthe Arlindo CTD data indicates inflow of relatively saline South Pacific water through the HalmaheraSea (Gordon and Fine, 1996; Ilahude and Gordon, 1996).
5. Inflow–outflow convergence
The Pacific water entering the Indonesian seas is modified within the interior seas before exportto the Indian Ocean. Using the most reasonable transport profile for the passages carefully derived bythe INSTANT program investigators (Gordon et al., 2008; Van Aken et al., 2009; Sprintall et al., 2009),here we estimate the inflow–outflow convergence profile (Tables 2a and 2b), along with the resultantvertical velocity and downward heat fluxes within the interior seas as required for an annual and3-year steady state condition. We do not extend this approach to the seasonal inflow/outflow valuesas we do not expect the net convergence to be zero; the Banda Sea thermocline shallows and sealevel falls during the southeast monsoon with the reverse occurring during the northwest monsoonin response to seasonal Ekman upwelling (Gordon and Susanto, 2001).
We present the convergence profile only as a qualitative, conceptual guide of the likely verticaltransports between the ITF inflow and outflow passages, and the associated vertical heat fluxes. Asdiscussed above, there are substantial uncertainties in the inflow/outflow transport values and hencewe caution against placing too much emphasis on the water column convergence values. Hopefully,future observational and modeling based investigations will help better quantify the water columnconvergence profile.
In order to introduce a reasonable ‘additional’ inflow profile, the 0–100 m layer is assigned to pro-vide 2/3 of the required inflow to balance with the rest coming from the 100 to 200 m layer (Table 2b).Of course, other profiles of additional inflow are possible, such as a deeper contribution from the gapbetween Lifamatola Island and New Guinea. However, the expanse of the 0–200 m cross-sectional areaand the missing upper 200 m coverage at Lifamatola Passage argues to place the bulk in the surfacelayers.
The convergence profile is balanced by vertical transport, which is converted to vertical veloc-ity by dividing by the area of the seas between the inflow and outflow portals (approximately

A.L. Gordon et al. / Dynamics of Atmospheres and Oceans 50 (2010) 115–128 123
Table 2aConvergence within depth slabs between the INSTANT inflow and outflow profiles values in 106 m3/s [Sv]; minus valuesrepresent divergence.
Depth range 3-Year 2004 2005 2006
0–100 −2.9 −2.3 −2.6 −3.8100–200 −0.7 −0.6 −0.7 −0.9200–300 0.1 0.0 0.0 0.3300–400 0.3 0.3 0.2 0.6400–500 0.3 0.2 0.1 0.4500–600 0.1 0.2 −0.1 0.2600–700 0.0 0.0 −0.2 0.0700–800 −0.2 −0.3 −0.3 −0.1800–900 −0.4 −0.4 −0.4 −0.3900–1000 −0.4 −0.6 −0.5 −0.31000–1500 −0.5 −0.9 −0.6 −0.11500–2000 2.2 2.0 2.4 2.22000–2500 0.0 0.0 0.0 −0.12500–3000 0.0 0.0 0.0 0.03000 to bottom 0.0 0.0 0.0 0.0Net convergence −2.3 −2.4 −2.7 −1.9
Table 2bProposed unresolved inflow [Sv units] within the 0–100 and 100–200 m slabs within the INSTANT observed passages and/or inadditional passages, as required to zero the net convergence.
3-Year 2004 2005 2006
0–100 −1.5 −1.6 −1.8 −1.3100–200 −0.8 −0.8 −0.9 −0.6
0.88 million km2). The vertical velocity is upward throughout the water column of the interior seas(Tables 3a and 3b; Fig. 4). The upwelling drops below 10−6 m/s in the depth interval from 400 to 700 m.We refer to this as the null layer, which separates the stronger upwelling within the thermocline layerfrom the deeper layer upwelling cell coupled to the deep water overflow within Lifamatola Passage.The upwelling within the deep water of the Banda sea is reported as 2.4 × 10⁻⁶ m/s by Van Aken etal. (1991), and we find similar values using the INSTANT data (maximum upwelling of 2.4 × 10⁻⁶ m/soccurs in the 1000–1500 m layer, Tables 3a and 3b). The 3-year mean thermocline upwelling throughthe 100–200 m layer of 1.5 × 10⁻⁶ m/s combined with the mean (climatic) thermocline stratificationof 0.083 ◦C/m yields a vertical mixing coefficient Kz/� of 2.7 × 10⁻⁴ m2/s. Using the mean thermoclinestratification with the yearly thermocline upwelling yields a Kz/� of 1.1, 1.1 and 5.8 × 10⁻⁴ m2/s for
Table 3aUpwelling in 10−6 m/s across the base of each depth layer as required to compensate for the inflow/outflow water columnconvergence profile. A minimum of vertical velocity is found near 600 m, separating a thermocline overturning cell from adeeper overturning cell associated with the Lifamatola sill overflow.
Depth range Upwelling velocity, 10−6 m/s
3-Year 2004 2005 2006
0–100 1.6 0.8 0.9 2.9100–200 1.5 0.6 0.6 3.2200–300 1.4 0.6 0.6 2.8300–400 1.0 0.3 0.4 2.1400–500 0.7 0.0 0.3 1.7500–600 0.6 −0.2 0.4 1.4600–700 0.7 −0.2 0.5 1.4700–800 0.9 0.1 0.9 1.5800–900 1.3 0.6 1.3 1.8900–1000 1.8 1.2 1.8 2.2
1000–1500 2.4 2.2 2.5 2.3
124 A.L. Gordon et al. / Dynamics of Atmospheres and Oceans 50 (2010) 115–128
Table 3bThe downward flux of heat [W/m2] across the top of each depth layer as required to maintain steady state temperaturestratification.
Depth range Heat flux (W/m2)
3-Year 2004 2005 2006
0–100 34 17 19 63100–200 29 11 11 59200–300 12 5 5 24300–400 4 1 2 7400–500 2 0 1 5500–600 1 0 1 3600–700 1 0 0 1700–800 1 0 1 2800–900 2 1 2 3900–1000 5 4 5 6
1000–1500 7 7 7 7
2004, 2005, 2006, respectively. This is more than an order of magnitude larger than the Atlantic ther-mocline value found by Ledwell et al. (1993), but only a factor of 2 greater than that deduced for theBanda Sea by Ffield and Gordon (1992) using historical data. The elevated upwelling and vertical mix-ing within the Banda Sea leads to a lower SST than would otherwise be expected, which then reducesthe convection within the atmosphere and associated precipitation patterns (Jochum and Potemra,2008).
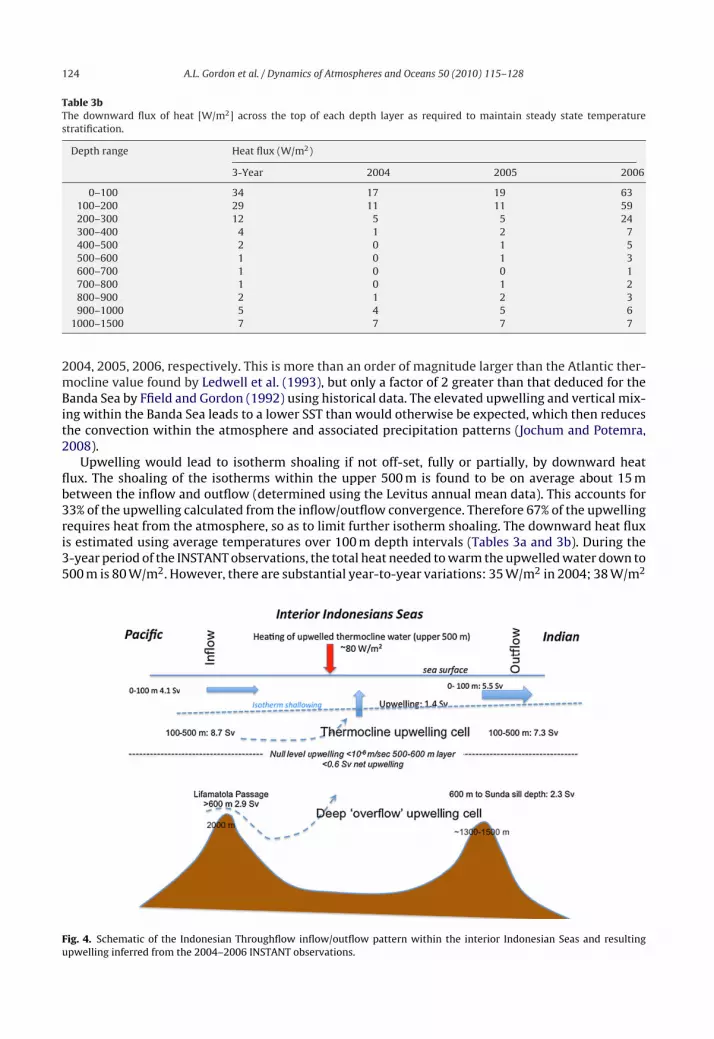
Upwelling would lead to isotherm shoaling if not off-set, fully or partially, by downward heatflux. The shoaling of the isotherms within the upper 500 m is found to be on average about 15 mbetween the inflow and outflow (determined using the Levitus annual mean data). This accounts for33% of the upwelling calculated from the inflow/outflow convergence. Therefore 67% of the upwellingrequires heat from the atmosphere, so as to limit further isotherm shoaling. The downward heat fluxis estimated using average temperatures over 100 m depth intervals (Tables 3a and 3b). During the3-year period of the INSTANT observations, the total heat needed to warm the upwelled water down to500 m is 80 W/m2. However, there are substantial year-to-year variations: 35 W/m2 in 2004; 38 W/m2
Fig. 4. Schematic of the Indonesian Throughflow inflow/outflow pattern within the interior Indonesian Seas and resultingupwelling inferred from the 2004–2006 INSTANT observations.

A.L. Gordon et al. / Dynamics of Atmospheres and Oceans 50 (2010) 115–128 125
in 2005; and 159 W/m2 in 2006. The climatic mean air to sea heat flux in the inflow/outflow area is50–60 W/m2 (Grist and Josey, 2003). Thus, while the INSTANT 3-year average is reasonably close tothe climatic heat flux, the relatively low values of 2004 and 2005 are off-set by the very high air to seaheat flux of 2006.
Gordon et al. (2008) using the Makassar Strait INSTANT time series finds a 3-year mean transportweighted temperature of 15.6 ◦C. Sprintall et al. (2009) determined a 3-year mean transport weightedtemperature for three export passages of 17.9 ◦C. The additional transport of ∼2 Sv required to achieveinflow/outflow balance for the 3-year mean INSTANT transports, as described above, is assumed to bederived from the upper 200 m, with 2/3 (1.3 Sv) coming from the upper 100 m and the rest from the100 to 200 m depth interval. Using Indonesian sea temperatures for the upper 200 m partitioned inthe same proportion as the assumed additional transport, yields a transport weighted temperature forthe additional transport of 24 ◦C. Combining this with the Makassar Strait inflow transport weightedtemperature requires a 3-year mean air to sea heat flux of the INSTANT period 73 W/m2 (again assum-ing the 0.9 million km2 areas between inflow and outflow as used above). This more-or-less agreeswith the 80 W/m2 derived from the net convergence and associated upwelling of thermocline water(and is slightly closer to the Grist and Josey, 2003 value). Below 1250 m within the Lifamatola Passagethe 2.5 Sv inflow (Table 1) has an estimated transport weighted temperature of 3.2 ◦C (Van Aken etal., 2009). However, the full water column southward transport is reduced by northward flow above1250 m, to ∼1 Sv (Table 1). As the water above 1250 m is warmer than that deeper than 1250 m, itwould lower the transport weighted temperature of the deep overflow. In view of the uncertainty ofthe net transport above 1250 m within Lifamatola Passage, we do not include the Lifamatola Passage3-year mean transport weighted temperature in the estimation of air to sea heat flux, but it is likelythat it slightly elevates the air to sea heat flux above the 73 W/m2 discussed above.
The 2006 convergence, and the associated vertical velocity and downward heat flux, representa marked deviation from the 2004 and 2005 values. This comes about by surface layer intensifica-tion of the 2006 outflow, mainly in the upper 100 m but extending into the 100–200 m interval. The2006 divergence in the upper 200 m was relatively large, being off-set by large convergence in the200–500 m depth layer. This imposes a stronger upwelling within the thermocline in 2006, by a factorof 2 over the 3-year mean, which then requires a greater downward heat flux to maintain steady stateisotherm depths. Part of the large heat flux may be a consequence of using the climatic mean to deter-mine the upward shift of the thermocline isotherms between the inflow and outflow, as describedabove. If the upward shift were larger, as might be expected from the change in the convergenceprofile in 2006, then the need for the large downward heat flux is reduced and closer to the climaticmean.
We suspect the underlying cause of the anomalous convergences in 2006 is the La Nina and +IODcondition that existed in 2006. During the 2006 IOD, the interannual transport anomalies in all threeoutflow passages were remarkably similar. Coinciding with the 2006 IOD, anomalously strong outflowinto the Indian Ocean was observed above∼150 m depth, with strong reversals below 150 m, extendingto ∼800–1000 m depth in both Ombai and Timor (Sprintall et al., 2009). It is thought that the enhancedITF in the upper layer is related to prolonged easterly wind anomalies along the south of Java (Potemraand Schneider, 2007). These winds lower the sealevel along the Nusa Tenggara coast, and increase thesurface layer divergence out of the Banda Sea as they draw the Ekman transport offshore. The reversalsin the lower layers are due to Kelvin waves forced in the equatorial Indian Ocean in response to windanomalies associated with the 2006 IOD (Horii et al., 2008).
6. Conclusions
The 3-year mean ITF transport recorded during INSTANT via the primary deep outflow passagesof the Sunda archipelago (Lombok Strait, Ombai Strait and Timor Passage) into the Indian Ocean is15 × 106 m3/s. This is about 25–30% greater than the values from non-simultaneous measurementsmade prior to 2000, a period dominated by El Nino conditions.
The form of the along-channel time series within each of the INSTANT observed passages differ. TheMakassar and Timor throughflow are relatively steady, in comparison to Lombok and Ombai, which

126 A.L. Gordon et al. / Dynamics of Atmospheres and Oceans 50 (2010) 115–128
are rich in intraseasonal oscillations and are likely related to Kelvin waves that propagate from theIndian Ocean along the southern coast of Sumatra and Java. The inflow and outflow pattern of thealong-channel speeds at seasonal and at higher frequencies do not rise and fall in tandem, suggestingan imbalance at these time scales related to internal storage of water within the stratum of the interiorseas of Indonesia, most likely within the Banda Sea.
The INSTANT 3-year mean ITF inflow transport (Makassar Strait and Lifamatola Passage) is13 × 106 m3/s. The 2 × 10⁶ m3/s difference between INSTANT measured inflow and outflow isattributed to uncertainty of the extrapolation to the side-walls within each of the INSTANT passagesand/or unresolved surface layer transport in Lifamatola Passage and other channels, such as Kari-mata Strait. Differencing inflow/outflow profiles suggest the presence of net upwelling of water in theintervening seas, notably the Banda Sea (Fig. 4). The upwelling is segmented into a thermocline celland a deep water cell, separated by a null area of very weak upwelling near 600 m. The thermoclineupwelled water requires a 3-year mean sea to air heat flux of 80 W/m2 (after taking into account theswallowing of thermocline isotherms between the inflow and outflow portals), which agrees well withindependent estimates based on bulk formulae sea-air flux calculations (Grist and Josey, 2003).
The INSTANT data reveal interannual fluctuations, with greater upwelling in 2006, which assumingsteady state isotherm depth requires relatively large sea to air heat flux. This response is likely aconsequence of the strong positive phase of the IOD during 2006, which suggests that the IOD impacton the transport through the outflow passages noted by Sprintall et al. (2009), also strongly influencesthe velocity and property profiles of the interior seas.
Acknowledgments
The professionalism and support of the R/V Baruna Jaya I and VIII officers and crew to a largemeasure led to the success of INSTANT. We thank the capable mooring teams: P. Adams, M. Bakker,P.J. Harvey, B. Huber, S. Kawamoto, A. Lourenco, C. Marec, D. McLaughlan, K. Miller, L. Pender, andJ. Schilling. Bruce Huber prepared Fig. 3. The Lifamatola mooring was funded with grants from theNetherlands Organisation for Scientific Research (NWO) and the International Research School forCooperation on Oceanic, Atmospheric and Climate Change Studies (COACh). The INSTANT program inthe US is funded by National Science Foundation grants OCE-07-25935 (LDEO), OCE-07-25561 (ESR),OCE-0725476 (SIO). Lamont-Doherty Earth Observatory contribution 7317.
References
Arief, D., Murray, S.P., 1996. Low-frequency fluctuations in the Indonesian throughflow through Lombok Strait. J. Geophys. Res.101, 12455–12464.
Atmadipoera, A., Molcard, R., Madec, G., Wijffels, S., Sprintall, J., Koch-Larrouy, A., Jaya, I., Supangat, A., 2009. Characteristics andvariability of the Indonesian throughflow water at the outflow straits. Deep Sea Res., Part I 56 (11), 1942–1954.
Egbert, G.D., Ray, R.D., 2001. Estimates of M2 tidal energy dissipation from TOPEX/Poseidon altimeter data. J. Geophys. Res. 106,22475–22502.
England, M., Huang, F., 2005. On the interannual variability of the Indonesian throughflow and its linkage with ENSO. J. Climate18, 1435–1444.
Ffield, A., Gordon, A.L., 1992. Vertical mixing in the Indonesian thermocline. J. Phys. Oceanogr. 22 (2), 184–195.Ffield, A., Gordon, A., 1996. Tidal mixing signatures in the Indonesian seas. J. Phys. Oceanogr. 26, 1924–1937.Godfrey, J.S., 1989. A Sverdrup model of the depth-integrated flow for the world ocean allowing for island circulations. Geophys.
Astrophys. Fluid Dyn. 45, 89–112.Gordon, A.L., Fine, R.A., 1996. Pathways of water between the Pacific and Indian Oceans in the Indonesian Seas. Nature 379,
146–149.Gordon, A.L., Susanto, R.D., Ffield, A., 1999. Throughflow within Makassar Strait. Geophys. Res. Lett. 26, 3325–3328.Gordon, A.L., 2005. Oceanography of the Indonesian seas and their throughflow. Oceanography 18 (4), 14–27.Gordon, A.L., Susanto, R.D., 2001. Banda sea surface layer divergence. Ocean Dyn. 52, 2–10.Gordon, A.L., Susanto, R.D., Vranes, K., 2003a. Cool Indonesian throughflow as a consequence of restricted surface layer flow.
Nature 425, 824–828.Gordon, A.L., Giulivi, C.F., Ilahude, A.G., 2003b. Deep topographic barriers within the Indonesian seas. In: Schott, F. (Ed.), Physical
Oceanography of the Indian Ocean during the WOCE Period, 50. Deep-Sea Research II, pp. 2205–2228.Gordon, A.L., Susanto, R.D., Ffield, A., Huber, B.A., Pranowo, W., Wirasantosa, S., 2008. Makassar Strait throughflow, 2004 to
2006. Geophys. Res. Lett. 35, L24605, doi:10.1029/2008GL036372.Grist, J.P., Josey, S.A., 2003. Inverse analysis adjustment of the SOC air–sea flux climatology using ocean heat transport constraints.
J. Climate 16, 3274–3295.Hirst, A.C., Godfrey, J.S., 1993. The role of Indonesian throughflow in a global ocean GCM. J. Phys. Oceanogr. 23, 1057–1086.

A.L. Gordon et al. / Dynamics of Atmospheres and Oceans 50 (2010) 115–128 127
Horii, T., Hase, H., Ueki, I., Masumoto, Y., 2008. Oceanic precondition and evolution of the 2006 Indian Ocean dipole. Geophys.Res. Lett. 35, L03607, doi:10.1029/2007GL032464.
Ilahude, A., Gordon, A., 1996. Thermocline stratification within the Indonesian Seas. J. Geophys. Res. 101 (C5), 12401–12409.Jochum, M., Potemra, J.T., 2008. Sensitivity of tropical rainfall to Banda sea diffusivity in the community climate system model.
J. Climate 21, 6445–6454.Koch-Larrouy, A., Madec, G., Bouruet-Aubertot, P., Gerkema, T., Bessieres, L., Molcard, R., 2007. On the transforma-
tion of Pacific water into Indonesian throughflow water by internal tidal mixing. Geophys. Res. Lett. 34, L04604,doi:10.1029/2006GL028405.
Ledwell, J.R., Watson, A.J., Law, C., 1993. Evidence for slow mixing across the Pycnocline from an open-ocean tracer-releaseexperiment. Nature 364 (6439), 701–706.
Lee, T., Fukumori, I., Menemenlis, D., Xing, Z., Fu, L.-L., 2002. Effects of the Indonesian throughflow on the Pacific and IndianOceans. J. Phys. Oceanogr. 32, 1404–1429.
MacDonald, A.M., 1993. Property fluxes at 30◦S and their implications for the Pacific-Indian throughflow and the global heatbudget. J. Geophys. Res. 98, 6851–6868.
Maes, C., 1998. Estimating the influence of salinity on sea level anomaly in the ocean. Geophys. Res. Lett. 25, 3551–3554.McCreary, J., Lu, P., 2001. Influence of the Indonesian throughflow on the circulation of the Pacific intermediate water. J. Phys.
Oceanogr. 31, 932–942.Meyers, G., 1996. Variation of Indonesian throughflow and the El Nino—southern oscillation. J. Geophys. Res. 101,
12255–12263.Molcard, R., Fieux, M., Ilahude, A.G., 1996. The Indo-Pacific throughflow in the Timor Passage. J. Geophys. Res. 101 (C5),
12,411–12,420.Molcard, R., Fieux, M., Syamsudin, F., 2001. The throughflow within Ombai Strait. Deep Sea Res., Part I 48, 1237–1253.Murray, S.P., Arief, D., 1988. Throughflow into the Indian Ocean through the Lombok Strait, January 1985–January 1986. Nature
333, 444–447.Murtugudde, R., Busalacchi, A.J., Beauchamp, J., 1998. Seasonal-to-interannual effects of the Indonesian throughflow on the
tropical Indo-Pacific basin. J. Geophys. Res. 103, 21425–21441.Potemra, J.T., Schneider, N., 2007. Interannual variations of the Indonesian throughflow. J. Geophys. Res. 112, C05035,
doi:10.1029/2006JC003808.Potemra, J.T., Hautala, S.L., Sprintall, J., 2003. Vertical structure of Indonesian throughflow in a large-scale model. Deep Sea Res.,
Part II: Topical Stud. Oceanogr. 50, 2143–2161.Pujiana, K., Gordon, A.L., Sprintall, J., Susanto, D., in press. Intraseasonal variability in the Makassar Strait thermocline. J. Marine
Res.Qiu, B., Mao, M., Kashino, Y., 1999. Intraseasonal variability in the Indo-Pacific throughflow and the regions surrounding the
Indonesian Seas. J. Phys. Oceanogr. 29, 1599–1618.Qu, T., Du, Y., McCreary, J.P., Meyers, J.R.G., Yamagata, T., 2008. Buffering effect and its related ocean dynamics in the Indonesian
throughflow region. J. Phys. Oceanogr. 38, 503–516.Ray, R., Egbert, G., Erofeeva, S., 2005. A brief overview of tides in the Indonesian seas oceanography 18 (4), 74–79.Saji, N.H., Goswami, B.N., Vinayachandran, P.N., Yamagata, T., 1999. A dipole mode in the tropical Indian Ocean. Nature 401,
360–363.Schott, F., McCreary, J., 2001. The monsoon circulation of the Indian Ocean. Prog. Oceanogr. 51, 1–123.Song, Q., Gordon, A., 2004. Significance of the vertical profile of Indonesian throughflow transport on the Indian Ocean. Geophys.
Res. Lett. 31, L16307, doi:10.1029/2004GL020360.Sprintall, J., Gordon, A.L., Murtugudde, R., Susanto, R.D., 2000. A semiannual Indian Ocean forced Kelvin wave observed in the
Indonesian seas in May 1997. J. Geophys. Res. 105 (C7), 17217–17230.Sprintall, J., Wijffels, S., Gordon, A.L., Ffield, A., Molcard, R., Dwi Susanto, R., Soesilo, I., Sopaheluwakan, J., Surachman, Y., Van
Aken, H., 2004. INSTANT: a new international array to measure the Indonesian throughflow. EOS 85 (39), 369.Sprintall, J., Wijffels, S.E., Molcard, R., Jaya, I., 2009. Direct estimates of the Indonesian throughflow entering the Indian Ocean:
2004–2006. J. Geophys. Res. 114, C07001, doi:10.1029/2008JC005257.Susanto, R.D., Gordon, A.L., 2005. Velocity and transport of the Makassar Strait throughflow. J. Geophys. Res. 110,
doi:10.1029/2004JC002425, January, C01005.Susanto, R.D., Gordon, A., Sprintall, J., 2007. Observations and proxies of the surface layer throughflow in Lombok Strait. J.
Geophys. Res. 112 (C3), C03S92, doi:10.1029/2006JC003790.Susanto, R.W., Gordon, A.L., Sprintall, J., Herunadi, B., 2000. Intraseasonal variability and tides in Makassar Strait. Geophys. Res.
Lett. 27 (10), 1499–1502.Talley, L.D., Sprintall, J., 2005. Deep expression of the Indonesian throughflow: Indonesian intermediate water in the South
Equatorial current. J. Geophys. Res. 110, C10009, doi:10.1029/2004JC002826.Tillinger, D., Gordon, A.L., 2009. Fifty years of the Indonesian throughflow. J. Climate 22 (23), 6342–6355,
doi:10.1175/2009JCLI2981.1.Van Aken, H.M., Punjanan, J., Saimima, S., 1988. Physical aspects of the flushing of the East Indonesian basins. Neth. J. Sea Res.
22, 315–339.Van Aken, H.M., Van Bennekom, A.J., Mook, W.G., Postma, H., 1991. Application of Munk’s abyssal recipes to tracer distributions
in the deep waters of the southern Banda basin. Oceanologic a Acta 14 (2), 151–162.Van Aken, H.M., Brodjonegoro, I.S., IndraJaya, 2009. The deep-water motion through the Lifamatola passage and its contribution
to the Indonesian throughflow. Deep Sea Res., Part I 56, 1203–1216.Vinayachandran, P.N., Kurian, J., Neema, C.P., 2007. Indian Ocean response to anomalous conditions in 2006. Geophys. Res. Lett.
34, L15602, doi:10.1029/2007GL030194.Wajsowicz, R.C., 2002. Air–sea interaction over the Indian Ocean due to variations in the Indonesian throughflow. Climate Dyn.
18, 437–453.Wajsowicz, R.C., Schneider, E.K., 2001. The Indonesian throughflow’s effect on global climate determined from the COLA coupled
climate system. J. Climate 14, 3029–3042.

128 A.L. Gordon et al. / Dynamics of Atmospheres and Oceans 50 (2010) 115–128
Webster, P., Magana, V., Palmer, T., Shukla, J., Tomas, R., Yanai, M., Yasunari, T., 1998. Monsoons: processes, predictability, andthe prospects for prediction. J. Geophys. Res. 103, 14451–14510.
Wijffels, S., Meyers, G., 2004. An intersection of oceanic wave guides: variability in the Indonesian throughflow region. J. Phys.Oceanogr. 34 (5), 1232–1253.
Wijffels, S., Meyers, G., Godfrey, J.S., 2008. A twenty year average of the regional currents and interbasin exchange in theIndonesian region. J. Phys. Oceanogr. 38 (9), 1965–1978.
Wolanski, E., Ridd, P., Inoue, M., 1988. Currents through Torres Strait. J. Phys. Oceanogr. 18 (11), 1535–1545.Wyrtki, K., 1961. Physical Oceanography of the Southeast Asian Waters, NAGA Rep. 2 Scripps Inst. Oceanography.
Related Documents