The Indonesian Economic Crisis and its Impact on Educational Enrolment and Quality Djoko Hartono and David Ehrmann

Welcome message from author
This document is posted to help you gain knowledge. Please leave a comment to let me know what you think about it! Share it to your friends and learn new things together.
Transcript

The IndonesianEconomic Crisis and itsImpact on EducationalEnrolment and QualityDjoko Hartono andDavid Ehrmann
No. 7May 2001
The IndonesianEconomic Crisis and itsImpact on EducationalEnrolment and QualityDjoko Hartono andDavid Ehrmann
Published by
Institute of Southeast Asian Studies
30 Heng Mui Keng Terrace
Pasir Panjang
Singapore 119614
E-mail: [email protected]
World Wide Web: http://www.iseas.edu.sg/pub.html
All rights reserved. No part of this publication may be reproduced, stored
in a retrieval system, or transmitted in any form or by any means,
electronic, mechanical, photocopying, recording or otherwise, without the
prior permission of the Institute of Southeast Asian Studies.
© 2001 Institute of Southeast Asian Studies, Singapore
The responsibility for facts and opinions expressed in this publication
rests exclusively with the author, and his/her interpretations do not
necessarily reflect the views or the policy of the Institute or its
supporters.
ISSN 0219-3213
The following text is based on a paper presentedby
Dr Djoko Hartono
at a Seminar organized by the
Institute of Southeast Asian Studies
in Singapore on 23 March 2001.
About the Authors
Dr Djoko Hartono received his Ph.D. in demography from the Australian National
University. He is currently working as a consultant to the Central Independent
Monitoring Unit (CIMU) of the Indonesian Scholarships and Grants Programme
(SGP) in Jakarta. He is also a researcher at the Centre of Population and Manpower
Studies of the Indonesian Institute of Sciences (LIPI), Jakarta.
Mr David Ehrmann received his B.Sc. in Anthropology at Wake Forest University in
North Carolina, and his M.Sc. in Education from Johns Hopkins University in
Maryland. He is currently working as a consultant to the Central Independent
Monitoring Unit (CIMU) of the Indonesian Scholarships and Grants Programme
(SGP) in Jakarta. David Ehrmann is also a consultant to the British Council in
Indonesia on education related issues.
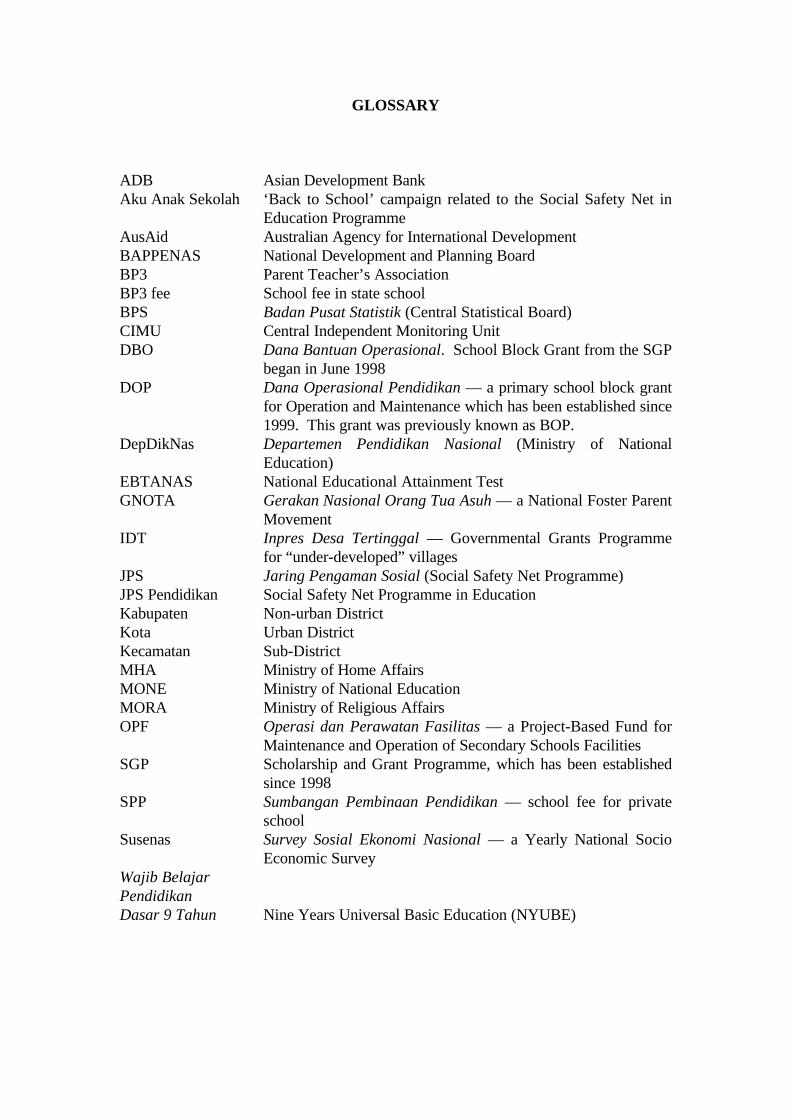
GLOSSARY
ADB Asian Development BankAku Anak Sekolah ‘Back to School’ campaign related to the Social Safety Net in
Education ProgrammeAusAid Australian Agency for International DevelopmentBAPPENAS National Development and Planning BoardBP3 Parent Teacher’s AssociationBP3 fee School fee in state schoolBPS Badan Pusat Statistik (Central Statistical Board)CIMU Central Independent Monitoring UnitDBO Dana Bantuan Operasional. School Block Grant from the SGP
began in June 1998DOP Dana Operasional Pendidikan — a primary school block grant
for Operation and Maintenance which has been established since1999. This grant was previously known as BOP.
DepDikNas Departemen Pendidikan Nasional (Ministry of NationalEducation)
EBTANAS National Educational Attainment TestGNOTA Gerakan Nasional Orang Tua Asuh — a National Foster Parent
MovementIDT Inpres Desa Tertinggal — Governmental Grants Programme
for “under-developed” villagesJPS Jaring Pengaman Sosial (Social Safety Net Programme)JPS Pendidikan Social Safety Net Programme in EducationKabupaten Non-urban DistrictKota Urban DistrictKecamatan Sub-DistrictMHA Ministry of Home AffairsMONE Ministry of National EducationMORA Ministry of Religious AffairsOPF Operasi dan Perawatan Fasilitas — a Project-Based Fund for
Maintenance and Operation of Secondary Schools FacilitiesSGP Scholarship and Grant Programme, which has been established
since 1998SPP Sumbangan Pembinaan Pendidikan — school fee for private
schoolSusenas Survey Sosial Ekonomi Nasional — a Yearly National Socio
Economic SurveyWajib BelajarPendidikanDasar 9 Tahun Nine Years Universal Basic Education (NYUBE)
THE INDONESIAN ECONOMIC CRISIS AND ITS IMPACT ONEDUCATIONAL ENROLMENT AND QUALITY
Introduction
The impact of the economic crisis in Indonesia on education enrolments and dropout
rates has not been as devastating as initially feared. School incomes however, have been
hit hard by the crisis.
This study examines how the crisis has affected key educational indicators since
the 1997/98 academic year. The findings expressed in this study reflect the authors’
analysis of several previously published sources of data from the Central Independent
Monitoring Unit (CIMU), which independently monitors and evaluates the Scholarships
and Grants Programmeme (SGP), one component of the Indonesian Social Safety Net.1
CIMU has published a number of reports on the economic crisis, education and the
Scholarships and Grants Programmeme.
The analysis begins with an overview of Indonesian economic development
preceding the current crisis and examines how the crisis has affected the Indonesian
economy. This is followed by a description of the education system with a summary of
the policy focus at the time when the crisis first struck Indonesia. Detailed findings from
CIMU national survey data are used to describe the varying effects of the crisis on
education. Other data sources are also examined to determine the consistency of
findings from CIMU data and other sources. The paper concludes with an analysis of
the impact of the Scholarships and Grants Programmeme, a major donor-supported
government intervention to mitigate the affects of the crisis on the school system.
2
The Indonesian Economy During the Crisis
The Asian financial crisis struck in mid-1997 with profound effects. As a result,
Indonesia has experienced enormous social, economic and political pressures. Although
it was the collapse of Asian currencies that initiated the crisis, the depth of the
Indonesian recession was fueled by many of the institutional weaknesses that were the
legacy of the Soeharto government.
Several factors contributed to the Indonesian economic collapse. High external
private sector debt and capital mobility were prevalent prior to the crisis. Financial
regulation was extremely poor. The banking sector was at the centre of the financial
crisis: irregular banking practices were pervasive, and state banks had bad debt ratios.
Inadequate enforcement of central bank regulations meant that rules were routinely
violated with impunity. A total of 16 banks closed in November 1997, undermining
confidence in the financial system. The total number of banks in Indonesia decreased
from 238 before the crisis to 162 by 1999. The value of the rupiah dropped
dramatically.
Problems with corruption and governance were extensive. A very small portion
of the population held a great deal of power and privilege, which was maintained
through the system of patronage. Courts could not be expected to be impartial and
authorities were averse to take decisive action whenever it threatened vested interests.
These factors combined with political instability caused increased pessimism among both
foreign and domestic investors.
At the outset, the International Monetary Fund (IMF) insisted on a fiscally
conservative stance, which many in government perceived as harsh. It initially called for
an end to subsidies on fuel and foods. It also compelled the government to cut its
efforts to maintain the value of rapidly declining civil service salaries. Neither of these
moves were popular within Indonesia.
The events that occurred from August 1997 to May 1998 had no precedent for
most Indonesians. The combination of factors painted the picture of a country in which
everything appeared to go wrong at once. Declining terms of trade (due to a 30%
decline in oil prices), soaring inflation and difficulties in getting jobs all compounded the
financial crisis. Extensive forest fires spread across parts of the country and many areas

3
were affected by prolonged drought. There was a decline in food production
accompanied by food shortages. Violence in West Kalimantan, Timor, Maluku, and
Aceh caused many to question the Government’s ability to manage these social
divisions. In May 1998 the situation peaked with bloody and uncontrolled riots and
arson in the Jakarta and several other urban centers. These scenes were marked by
ethnic violence aimed at Chinese Indonesians. These events culminated in President
Soeharto’s fall from power.
The crisis resulted in a dramatic rise in unemployment and 6.4 million workers
were laid off in 1998. This unemployment differed across economic sectors. The worst
affected sectors included manufacturing, construction, commerce, hotels and
restaurants, transportation, communication, finance, rent and company services. On the
other hand, several economic sectors accommodated more workers, including
agriculture, animal husbandry, forestry, fishery, electricity, gas, and drinking water.
Many laid off workers were able to move to the informal agricultural sector, which
served as a safety net. With regard to the regional impacts of the crisis on different
economic structures, Java was apparently hit harder by the crisis than other areas.
Urban areas were hit more severely than rural ones. These two observations suggested
that the crisis hit modernized areas (represented by both Java and urban areas) harder
than less modernized areas (agriculturally-dominated areas which are predominantly
located outside of Java and in rural areas).2
It would however, be incorrect to assume that all rural areas experienced a
continuous rise in real incomes. In some rural areas, in line with the appreciation of
rupiah and as prices of imported inputs and basic necessities rose, the income of farmers,
which was initially boosted as a result of the devaluation found their welfare not change
appreciably or actually fell.3 Decreasing income among the urban population that
resulted from formal sector layoffs and reduced income from informal sector
occupations also affected rural populations by reducing the flow of remittances. The
economies and labour markets of rural populations are closely related to those of urban
areas, and only those people who are land-rich have been able to cope with the crisis, or
gain from increased prices.4
4
Although the country has not yet recovered from the crisis, many analysts have
been surprised at the apparent flexibility in the Indonesian economy which has not
declined as far as some early predictions expected. The feared difficulties in finding jobs
in urban areas did not materialize despite numerous negative economic trends.
Although manufacturing experienced many cutbacks or closures, it appears that the
Indonesian informal sector and close family networks might have played a part in
reducing the severity of the impact. These factors, together with increased earnings
within agricultural exports might have been influential, particularly outside Java and
Bali. The World Bank estimates that, in the short run, the incidence of poverty is
unlikely to be very dramatic. The proportion of the population under the official
poverty line would certainly be higher in 1999 than in 1996, but only by a few
percentage points.5
The Indonesian Educational System and Development
The Indonesian education system consists of several levels including pre-school, primary
school, junior secondary school, senior secondary school, and a range of post-secondary
education programmes. According to Indonesian Law No. 2/1989, basic education lasts
for nine years, consisting of six years of primary school plus three years of junior
secondary school.
Several government ministries are responsible for education. The Ministry of
National Education manages general primary schools, junior secondary schools and
senior secondary schools. However, the general primary school is not only managed by
the Ministry of National Education but also by the Ministry of Home Affairs. The
Ministry of Religious Affairs administers Islamic institutions including some primary
schools known as Madrasah Ibtidaiyah (MI), some junior secondary schools known as
Madrasah Tsanawiyah (MTs), and some senior secondary schools known as Madrasah
Aliyah (MA). In addition to the distinction between general and Islamic education,
there is also a distinction between general and vocational secondary education (SMK —
Sekolah Menengah Kejuruan). Vocational secondary education emphasizes specific
occupational skills and prepares students to enter the workforce. This vocational
secondary education is also managed by the Ministry of National Education.
5
In 1984, the government of Indonesia declared six year compulsory education
for primary school age children (7-12 years). This policy has increased participation
rates in primary school from 79.3 % in 1983 to 92.2 % by 1993. In 1994, compulsory
education was extended to nine years (Wajib Belajar Pendidikan Dasar 9 Tahun)
commonly referred to as “Nine Year Universal Basic Education” (NYUBE) so that it
would encompass both six years of primary education and three years of junior
secondary education.
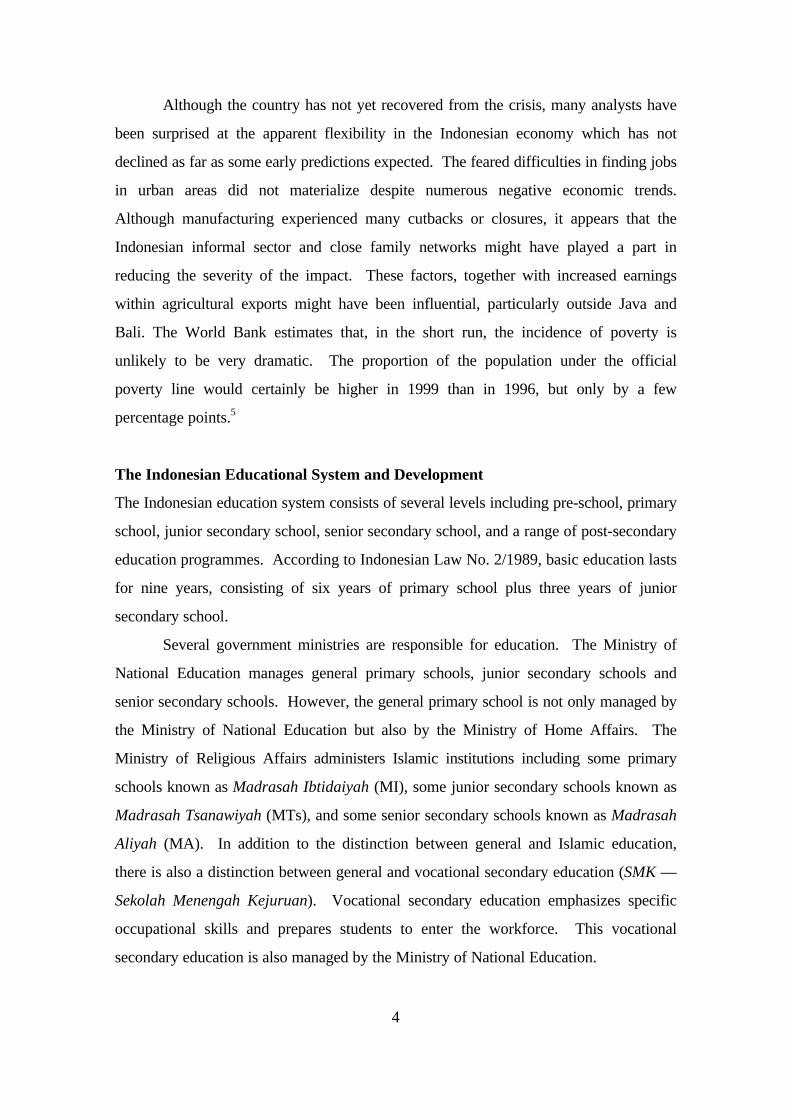
Education indicators showed improvements before the financial crisis,
particularly during the 1990s. The percentage of school-age children who had never
attended school declined, school attendance rose and there was a decline in dropouts.
These indicators varied slightly across different age groups.6
Table 1Status of School Enrolment by Age Groups (in Percentages), Indonesia 1993-1998
1993 1994 1995 1996 1997 19985-6 years:
Never attended schoolAttending schoolNo longer attending school
100,0084,814,90,3
100,082,517,30,2
100,082,517,30,2
100,080,719,10,2
100,077,322,50,2
100,077,422,30,3
7-12 years:Never attended schoolAttending schoolNo longer attending school
100,04,5
92,82,7
100,03,8
94,12,1
100,03,8
93,92,2
100,03,5
94,42,1
100,02,9
95,41,7
100,03,0
95,11,9
13-15 years:Never attended schoolAttending schoolNo longer attending school
100,01,3
68,929,8
100,01,3
72,426,3
100,01,2
73,225,6
100,01,2
75,822,9
100,01,0
77,521,5
100,01,0
77,221,9
16-18 years:Never attended schoolAttending schoolNo longer attending school
100,01,6
42,655,8
100,01,4
45,353,3
100,01,4
44,653,9
100,01,5
47,650,9
100,01,3
48,650,1
100,01,3
49,349,4
Source: BPS, special tabulations from Susenas 1993-1998. This table is taken fromOey-Gardiner (2000).
Note: A year of Susenas data pertains to one school year. The 1993 Susenas datapertains to the 1992/93 school year, and so on.
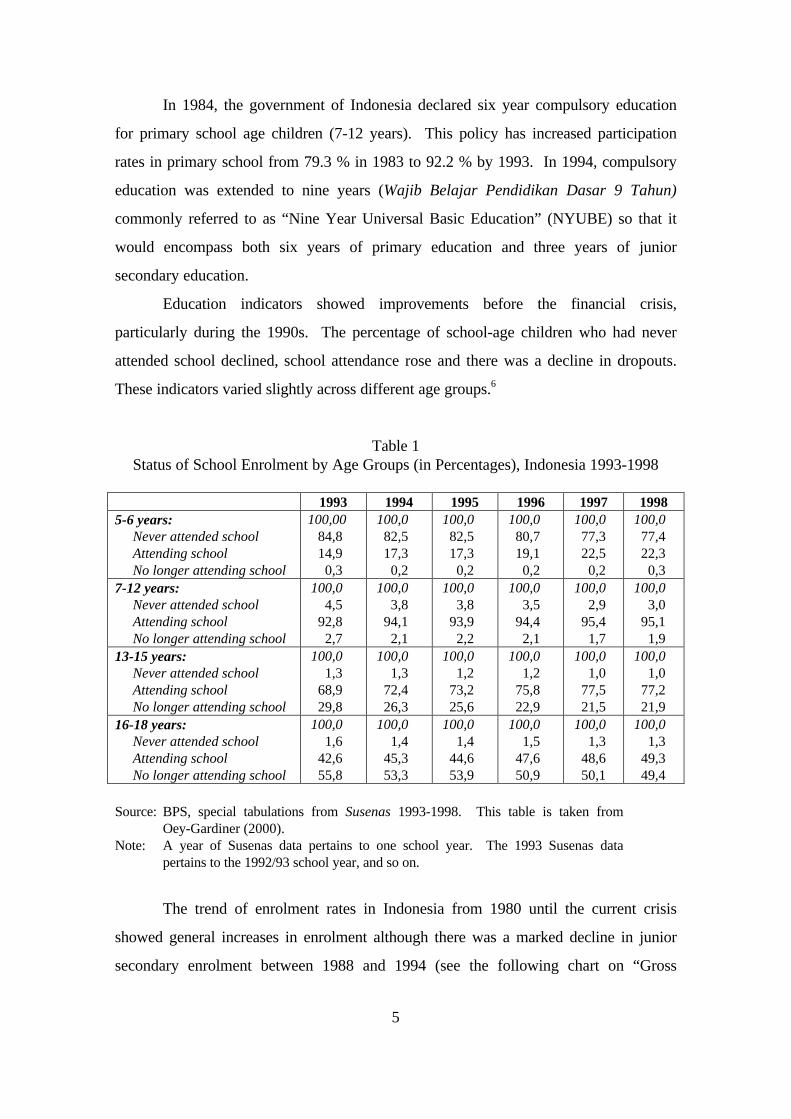
The trend of enrolment rates in Indonesia from 1980 until the current crisis
showed general increases in enrolment although there was a marked decline in junior
secondary enrolment between 1988 and 1994 (see the following chart on “Gross
6
Enrolment Rates”). At the same time, there was a significant rise in dropouts at the
junior secondary level. This figure reached 12.4% during the 1988/89 school year. It
was widely accepted that these trends resulted from the economic crisis that occurred in
1986/87.
Source: The World Bank, 1998.Notes: SD+MI (general and Islamic Primary School)
SLTP+MTs (general and Islamic Junior Secondary School)SM+MA (general and Islamic Senior Secondary School)
Enrolment rates remained at a constant level since the attainment of “universal”
primary school enrolment in the early 1980s. The most likely reason for this trend was
that the numbers of primary school aged students had not grown. This may have been
the result of a very successful national planning programme which reduced fertility. The
result is that over time, schools have had reduced numbers of new entrants, particularly
among primary school age students.
As mentioned, over the ten to fifteen years preceding the 1997 crisis, Indonesia
had achieved a high primary school participation rate. Education policy was therefore
focused on reaching nine-year universal basic education (NYUBE) by expanding
participation through junior secondary school. Efforts to achieve NYUBE focused on
the junior secondary level and on the transition from primary to junior secondary school,
G r o s s E n r o l l m e n t R a t e s ( % )
0
2 0
4 0
6 0
8 0
1 0 0
1 2 0
1 4 0
1980
1982
1984
1986
1988
1990
1992
1994
1996
1998
Y e a r
Per
cen
t
S D + M I S L T P + M T s S M + M A
7
a critical juncture that can determine further educational continuation. The government
then pledged to achieve NYUBE by 2020. The number of junior secondary students
would be increased by nearly two million students, in order to raise crude participation
rates to 87% by 2004. The move would require a major investment, which includes
around 45,000 new classrooms and tens of thousands of new teachers. Achieving
NYUBE was still the focus of educational policy when the crisis broke in 1997.
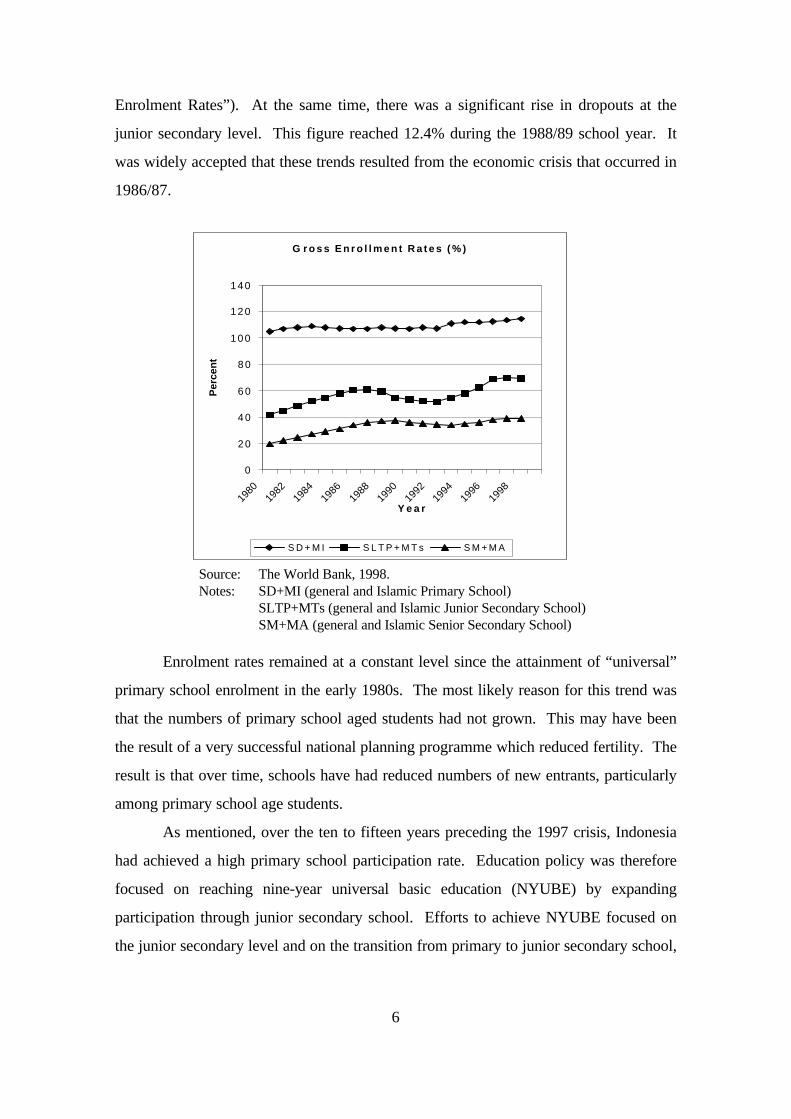
The number of school buildings also rose over this same period. Data from
Depdiknas (the Indonesian Ministry of National Education) showed an increase in
school infrastructure since 1994. The increase in school infrastructure combined with
the increased demand on schooling may be related to enrolment gains. The following
figure depicts the proportion of physical school buildings by the level and type of school
during the 1999/2000 school year.
Proportion of Physical School Buildings by the Level and Type of School During the 1999/2000 School Year
TK16%
SD+MI65%
SLTP+MTs12%
SMU+MA4%
SMK2%
PT+PTAI1%
TK SD+MI SLTP+ M Ts SM U + M A SM K PT+PTA I
Source: Departemen Pendidikan Nasional (The Ministry of National Education), 2000.Notes: SD+MI (general and Islamic Primary School)
SLTP+MTs (general and Islamic Junior Secondary School)SM+MA (general and Islamic Senior Secondary School)
During 1997/98 the World Bank conducted a review of the sector which
depicted the overall context of education policy favourably. The review described
several positive features: the system was expanding, there was a solid commitment to
universal basic education, several pro-poor policies were being implemented, there was
a narrowing in gender differentials and there were positive economic returns. The
review also recognized the progressive introduction of policies aimed at

8
decentralization. These policies hoped to address existing institutional rigidities and
fragmented responsibilities which were apparent throughout the system, particularly at
the district level.
In spite of this, several underlying deficiencies remained. The system was
inefficient, rigid and non-responsive to labour markets. Administrative arrangements
were extremely complex, particularly at the lower levels. Three major agencies were
(and remain) responsible for different aspects of education. The Education Ministry is
responsible for: curriculum and teacher training at all school levels; running public
secondary schools; and inspecting private secondary schools. The Ministry of Religion
manages Islamic (Madrasah) schools. The Ministry of Home Affairs manages financing
and human resources (including teacher employment) for public primary education.
Many of the poorest students attend private schools, particularly at the secondary level.
World Bank and Asia Development Bank (ADB) funded studies criticized
education funding as being fragmented. Routine and development budgets were drawn
up in isolation and with little regard to actual needs. According to an ADB study in
1998, the net effect was particularly stark at the primary level: 88% of government
funds supported in-school spending, mostly on teachers’ salaries. Only 70% of what
little non-salary funding there was actually trickled through the administrative
superstructure to schools. There were also significant and persistent concerns about
educational quality. Teachers tend to demand rote learning, learning materials are in
short supply, and there is need for curriculum reform.
Anticipated Consequences of the Crisis on Education
Analysts predicted that the crisis would result in rising unemployment, lower purchasing
power, and reductions in education spending. There were concerns that worsening
household economic conditions might eventually affect the ability of poor households to
pay for goods and services, including education for their children.7
Many of the predictions related to the current economic crisis were based on
experiences with the educational setbacks that occurred as a result of the 1986/87 crisis.
Three immediate risks were identified that might result from the current crisis on
education. First, enrolment in basic education might decline as needy families keep their
9
children out of school. Poor parents might withdraw older children from school so that
the children can contribute to the family income. Parents might also withdraw younger
children from school to reduce education-related costs. Secondly, the quality of
education might be affected by the crisis as government, schools, and parents struggle to
minimize educational costs during this period of economic hardship. It was also feared
that poorer communities might not have sufficient funds for the operation and
maintenance of schools. Even before the crisis, many schools needed books, supplies
and substantial maintenance. Thirdly, inefficiencies and corruption in government might
exacerbate worsening conditions and funds shortages.8
When the 1997 crisis struck, the policy makers in the Ministry of National
Education (MONE), and the lending agencies, immediately recalled the economic crisis
of the mid-1980s. That downturn was caused by a decline in oil prices and a prolonged
drought. It hit the education sector particularly hard, causing sharp declines in
enrolment, particularly among the poor. At the junior secondary level, the gross
enrolment rates fell for four years from 62 percent to 52 percent between 1988 and
1992. This decline did not recover back to its previous level until 1995. Primary
enrolment rates also saw some decline even though these were much smaller than those
at the junior secondary level.9
One characteristic of the 1986/87 crisis was that the worst effects on enrolment
did not occur until nearly two years after the crisis broke. That crisis caused a shortage
of government funds for routine and development expenditures. These reductions in
public expenditures on education, compounded by increases in the price of schooling
and a drop in family incomes, may have been responsible for the declines in enrolment.
The Indonesian government and lending agencies thought that the 1997/98 crisis
was going to be much more serious than the one that occurred in 1986/87. Various
government agencies produced differing projections of the effects that the crisis would
have on education, but all held one common belief — that the impact would be severe.
In early 1998, both the MONE and BAPPENAS (the Planning Agency) produced
estimates of the impact that the crisis would have on enrolment. The MONE predicted
that junior secondary enrolment rates would drop from 72% in 1997/98 to 57% in
2001/02 and from 40% to 23% at the senior secondary level. BAPPENAS anticipated
10
that at least 10% of primary and junior secondary students would require immediate
financial assistance to stay in school.
A variety of plans were drafted during the period preceding the May 1998
leadership transition. Each of these reflected the differing goals of government and the
lending agencies, which did always focus on the same priorities. This early planning
period lacked effective coordination, and the organizations involved frequently moved in
differing directions.
Moving each of the partners involved in the planning phase to a single shared
vision required a substantial effort. Strong leadership from BAPPENAS played a key
role in developing the kind of cooperation that was necessary between all of the partners
involved. This ultimately resulted in agreement, and in the production of a final plan for
what would eventually become the SGP (Scholarship and Grant Programme).
Early government plans called for a broad-based intervention rather than a
focused approach aimed at a single target. The government wanted to include a range
of both short-term financial support structures and longer-term “infrastructural”
assistance. Included in these early strategies were components that would counteract
the perceived threat to enrolment rates, particularly among students that came from the
poorest families. These measures would include scholarships for students in primary and
for junior secondary level education, and vouchers that would allow grade 6 students (in
their last year of primary school) to continue to junior secondary school. The plan also
included grants for schools that served poor communities and it would fund
improvements to poor primary schools. Components that were targeted for long-term
support were directed toward improving relations between communities and schools and
on supporting school based resource management. As valuable and as appropriate as
each of these priorities might have been, government funding was not sufficient to
support them. Similarly, none of the detailed planning had been developed to describe
how any improvement efforts would be implemented.
On 5 May 1998, the Indonesian government released a circular that outlined an
extensive list of measures that were created to mitigate the financial burden that parents
might bear in sending their children to school. This marked the first significant policy
shift in response to the growing crisis. The circular listed exemptions from a variety of

11
payments including BP3 (monthly fees for schools’operating costs), SPP (school fees at
private schools) and payments for national exam fees (EBTANAS). It also listed
exemptions from costs for school trips, extra-curricular activities and other extra costs.
The government lifted the requirement for students to wear uniforms or shoes, if they
were unable to afford these items. Finally, students were exempted from paying school
entry fees during the upcoming school year 1998/1999. Head teachers who continued
to require these payments or who required students to pay for supplementary school
books were to be disciplined by Provincial Education Offices. What the circular failed
to explain was how schools would compensate for the income that they would lose by
implementing its provisions.
The government of Indonesia and the international lending agencies were able to
agree on a few defining issues. Both the World Bank and the Asian Development bank
firmly requested the government to maintain basic education development budgets in
real terms. This principle later became one component of the Asian Development
Bank’s Social Protection Sector Development Programme (SPSDP). It also became a
condition of the World Bank’s Social Safety Net Adjustment Loan. The government
formally stated that its education development expenditures would remain at 1997/98
levels (in real terms) until the end of 1999/2000.
Effects of the 1997-2000 Crisis on Education
Introduction
The primary data used in the analysis derives from two national surveys conducted by
CIMU in November and December 1999 and again in late June and early July 2000 in 77
districts (kabupaten and kotamadya) and in 197 sub-districts (kecamatan) throughout
the then 26 provinces. A total of 1027 schools were surveyed, 95% of which were
included in CIMU’s first national survey of November-December 1999. Trained
independent monitors collected data for the two surveys using questionnaires.
The sample was chosen to achieve a spread of geographical locations. On
average, a total of 40 schools were surveyed from each province. These were stratified
to reflect each school level, public or private status, and general or Islamic affiliation.
Every school in the sample received a block grant (DBO) under the Scholarships and

12
Grants Programme (SGP) in the 1999/2000 school year. In effect, the survey
population includes those poorer schools that have received DBO under the SGP.
This analysis also compared data collected by CIMU to data from other sources,
the most comprehensive of which were the educational data produced by the Ministry of
National Education (Depdiknas) and the Annual Socio-Economic Survey (Susenas)
implemented by the Central Statistical Board (BPS). The Social Safety Net Survey
conducted by the BPS in 1999 was another important data source that supplemented the
1999 Susenas data.
The chronology of the economic crisis in Indonesia was an important factor to
keep in mind when assessing the utility of this data. Dating the start of the crisis is
difficult. Although the Asian financial crisis began in mid-1997, the financial and
banking crisis only began to have a severe impact for Indonesia in November 1997. This
impact rapidly worsened in the early months of 1998. On the other hand, some financial
institutions in Indonesia had been in trouble even before the fall of the Thai baht, and
some provinces had been suffering severely from prolonged drought and forest fires.
Enrolment data for the 1997/98 academic year related to the period before the
financial crisis affected enrolments or other aspects of education. This is because the
reference point for enrolment data is early in the school year — 31 August 1997.
Education data for 1998/99 and 1999/2000 reflected the impact of the crisis.
Data from Other Sources
It is worthwhile to summarize the findings from other data sources that can be used to
examine the impact of the crisis on enrolment. This allows comparison between CIMU
findings and findings from other sources. The following is the summary of findings by
individual data source.10

13
Susenas
Susenas data from 1997 through 1999 showed no significant enrolment declines. They
showed that previous gains in the proportion of 5-6 year old and the proportion of 7-12
year old children in school were halted. However, at the junior secondary ages (13-15
years old) enrolments began to rise again in 1999 after a brief stall. At the senior
secondary level (ages 16-18) enrolments continued to rise.
Susenas data also showed variation in enrolment by income group. Using trends
by expenditure quintile as a proxy for income groups, Susenas data showed that if
anything, enrolment rates reveal greater increases within poorer parts of the population.
At the primary level, Susenas data show no major differences in enrolment ratios
between members of expenditure quintiles from 1993 to 1999. At the junior secondary
level however, enrolment ratios have risen overall for the lowest three quintiles, while
they changed little for the highest two quintiles. Senior secondary enrolment ratios rose
for all quintiles except the richest, with the sharpest rises in the poorest two quintiles
(Table 2).
Depdiknas
At the primary level, Depdiknas data did not show significant change in either net
enrolment repetition or dropout rates between 1997/98 and 1998/99. The junior
secondary enrolment rates fell from 54.4% to 53.2% between 1997/98 and 1998/99 and
then recovered in 1999/2000. The junior secondary dropout rate rose from 3.2% in
1996/97 to 6.0% in 1998/99, causing the proportion of 13-15 year old children in school
(including children in primary school who were over-age) to fall from 73.4% to 72.3%
over this period. Depdiknas data indicated that there were about 255,000 fewer
children in school as a result of the crisis. Depdiknas data did not show a significant
change in the proportion of students who attended private schools at each level or in the
proportion of all schools that were private over the years of the crisis.
14
Table 2Age-Specific Enrolment Ratios in Junior and Senior Secondary Age Group
by Quintile Expenditures
1992/93 1993/94 1994/95 1995/96 1996/97 1997/98 1998/997–12 years(Primary SchoolAge Group
92,8 94,1 93,9 94,4 95,4 95,1 95,2
Poorest quintile 88,3 89,9 90,1 90,3 91,8 91,4 91,8Richest quintile 98,1 98,6 98,3 98,5 98,8 98,9 99,113–15 years(JuniorSecondary AgeGroup
68,9 72,4 73,2 75,8 77,5 77,2 79,1
Poorest quintile 51,6 55,8 57,4 60,3 62,7 63,3 66,3Richest quintile 89,3 89,3 91,0 91,9 92,3 92,9 92,816–18 years(SeniorSecondary AgeGroup
42,6 45,3 44,6 47,6 48,6 49,3 51,2
Poorest quintile 18,2 20,8 20,7 22,5 25,6 25,6 29,1Richest quintile 69,5 71,3 70,3 74,2 72,9 75,4 75,0
Source: BPS, special tabulations from Susenas 1993-1999. For the years 1993-1998, taken fromOey-Gardiner, 2000.
100 Village Survey
The 100 Village Survey showed a rise in primary school level enrolment rates. At the
junior secondary level enrolments fell in Java from 65.9% to 59.6% by August 1998, but
returned to 63.2% by December 1998. This recovery may have resulted from a new
provision allowing late enrolment. The eastern region of Indonesia also fell from 73.2%
in 1997 to 70.6% in December 1998.
Special Surveys
The Ministry of National Education conducted two special surveys in 1999 that showed
enrolment trends. The first survey showed little change in enrolments, however the
second and larger survey showed enrolment declines at all school levels. Declining rates
were largest in urban areas and were larger among students attending private schools
than those attending public schools. However, this decline appeared to have begun
15
during the year before the crisis broke and may have been related to a prolonged
drought in 1997.
Other Data Sources
SMERU (a Social Monitoring and Early Response Unit) also conducted a study in four
provinces that showed a rise in continuation rates at the primary school level over the
1999/2000 school year.
From this summary, it can be concluded that these sources of data showed no
indication of marked declines in enrolment at either the primary or junior secondary
school level during the 1999/2000 school year.
Findings from CIMU Data: Enrolment, Transition, and Dropout
The second CIMU national survey found no discernable drop in primary and junior
secondary enrolment over the first three academic years of economic crisis (academic
years 1997/98, 1998/99 and 1999/2000). It is also apparent that enrolment increased
overall in senior secondary schools.
Within the overall picture, however, some general trends are evident. During the
crisis, total enrolments in primary schools did not fall but actually rose slightly less than
1% between 1997 and 1999. Total junior secondary enrolment was unaffected in the
first year of the crisis, then rose slightly less than 1% by the 1999/2000 academic year.
Total enrolment for senior secondary schools increased substantially during the crisis.
By the 1999/2000 academic year total senior secondary enrolment rose 5.2% from its
1997/98 level (Figure 1).

16
Enrolments in the more developed areas of Java and Bali have suffered
somewhat while slight enrolment increases occurred outside that region. Within these
broad groupings, the crisis seems to have affected school attendance in urban areas more
than in rural ones. These findings seem to confirm that the effects of the economic crisis
have been uneven throughout different parts of Indonesia. More developed areas, which
include the Java and Bali region and urban areas, were hit harder by the crisis than less
developed areas (agriculture dominated areas located at outside Java and rural areas).
The impact of the crisis on enrolment in primary schools (grades 1-6) does not
differ markedly between the more developed region of Java and Bali and the rest of
Indonesia. However, within Java and Bali, despite a continuous positive trend was
found during the crisis the trend for grades 1-6 took a slight dip during the 1998/99
school year (Figure 2).
Figure 1Percentage Change of Total Enrollment
by School Level and Academic Year (N=927)
0,00% 0,00%
0,84%
5,21%
0,76%
0,72%
3,71%
0,00%
1,00%
2,00%
3,00%
4,00%
5,00%
6,00%
1997/1998 1998/1999 1999/2000
Academic Year
% c
han
ge
fro
m 1
997
Primary School Junior Secondary School Senior Secondary School

17
There is a regional difference between junior secondary enrolments within Java
and Bali and enrolments outside of Java and Bali. In Java and Bali, the enrolment
dropped substantially during the crisis, while the enrolment within the rest of Indonesia
rose significantly (Figure 3).
At the senior secondary level, enrolments within Java and Bali remained virtually
the same while they increased substantially outside the region. During the first year of
the crisis, enrolment in Java and Bali rose by almost 2.0% but in 1999, that figure fell to
0.5% above its 1997 level. By comparison, total enrolment outside of Java and Bali
Figure 2Percentage Change of Total Enrollment in Primary School Student
Grades 1 to 6 by Region and Academic Year (N=450).
0,06%
0,93%
-0,32%
0,00%
1,11%
-1,00%
-0,50%
0,00%
0,50%
1,00%
1,50%
2,00%
1997/1998 1998/1999 1999/2000
Academic Year
% c
han
ge
fro
m 1
997
Java-Bali Outside Java-Bali
F i g u r e 3P e r c e n t a g e C h a n g e o f T o t a l E n r o l l m e n t i n J u n i o r S e c o n d a r y S c h o o l S t u d e n t s
G r a d e s 1 t o 3 b y R e g i o n a n d A c a d e m i c Y e a r ( N = 2 8 6 )
0 , 0 0 %
- 2 , 1 9 % - 2 , 1 3 %
0 , 0 0 %
1 , 0 2 %
2 , 2 1 %
- 3 , 5 0 %
- 2 , 5 0 %
- 1 , 5 0 %
- 0 , 5 0 %
0 , 5 0 %
1 , 5 0 %
2 , 5 0 %
3 , 5 0 %
1 9 9 7 / 1 9 9 8 1 9 9 8 / 1 9 9 9 1 9 9 9 / 2 0 0 0
A c a d e m i c Y e a r
% c
han
ge
fro
m 1
997
J a v a - B a l i O u t s i d e J a v a - B a l i

18
continued to rise during the crisis to end 7.1% higher in 1999 than its 1997 level (Figure
4).
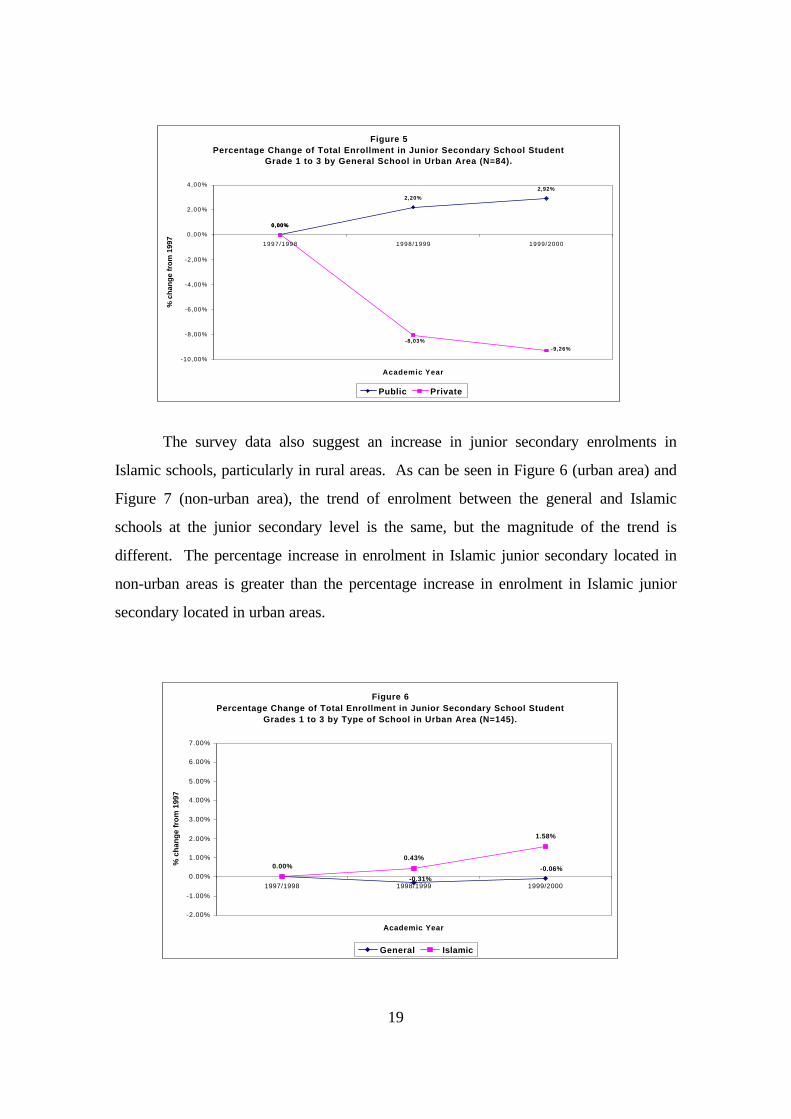
Enrolments at private schools appear to have dropped while the number of
students enroled in public schools rose. This is particularly true at the junior secondary
level in urban areas. Private junior secondary enrolment in urban areas fell each year
after the beginning of the crisis, 8.0% in 1998, then another 1.3% in 1999. Two years
after the crisis began, private junior secondary enrolments in urban areas decreased
9.3% below the level of 1997. Meanwhile, public enrolments in urban areas rose by
2.2% in 1998 and by 0.7% in 1999, finishing some 2.9% above the level of 1997 (Figure
5). Loss of income during the crisis may cause parents to withdraw their children from
expensive private schools and take them to public schools.
Figure 4Percen tage Change o f To ta l Enro l lment in Sen io r Secondary Schoo l S tudent
G r a d e s 1 t o 3 b y R e g i o n a n d A c a d e m i c Y e a r ( N = 1 9 1 ) .
0,50%
7,13%
1,98%
4,42%
0 , 0 0 %
2 , 0 0 %
4 , 0 0 %
6 , 0 0 %
8 , 0 0 %
1 0 , 0 0 %
1 2 , 0 0 %
1 4 , 0 0 %
1 6 , 0 0 %
1 9 9 7 / 1 9 9 8 1 9 9 8 / 1 9 9 9 1 9 9 9 / 2 0 0 0
Academic Year
% c
han
ge
fro
m 1
997
Java-Bal i Outs ide Java-Bal i
19
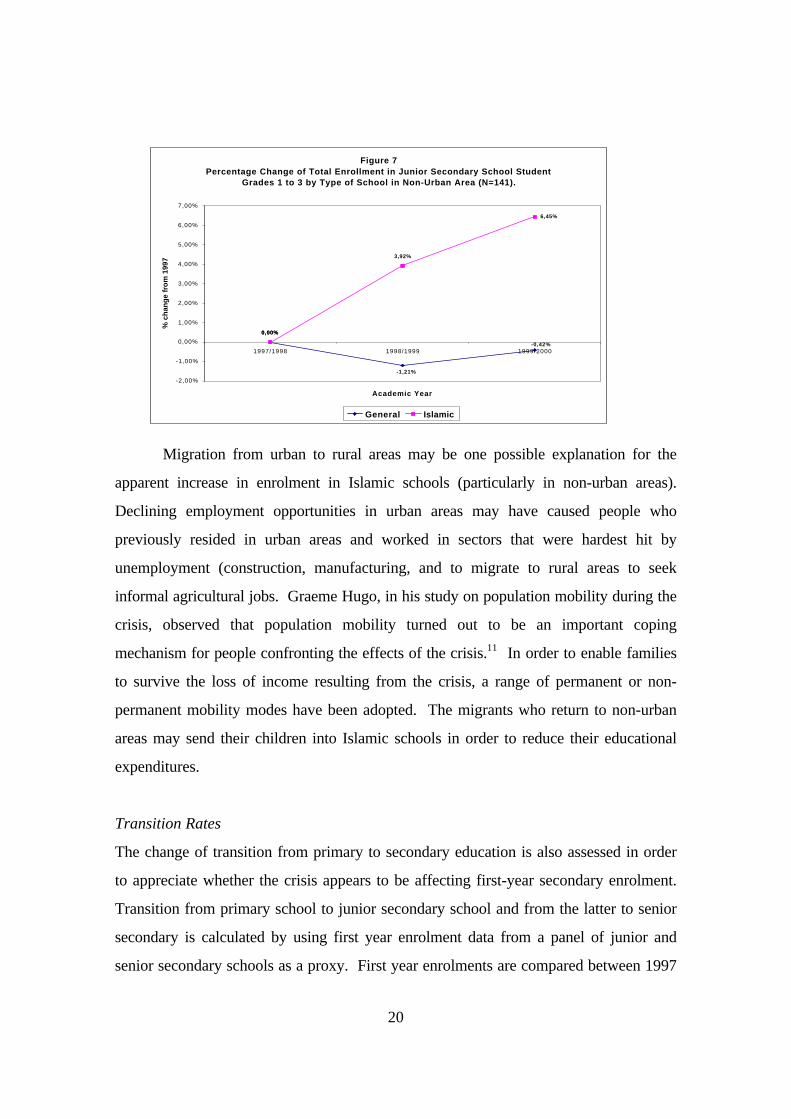
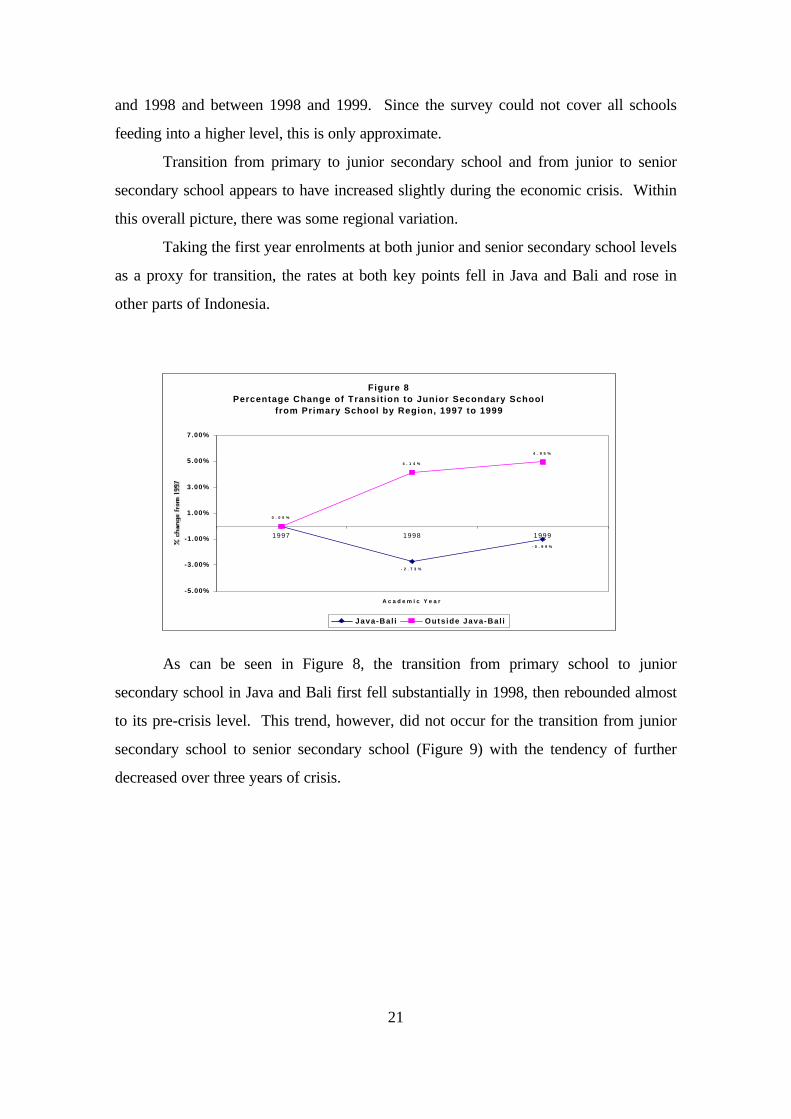
The survey data also suggest an increase in junior secondary enrolments in
Islamic schools, particularly in rural areas. As can be seen in Figure 6 (urban area) and
Figure 7 (non-urban area), the trend of enrolment between the general and Islamic
schools at the junior secondary level is the same, but the magnitude of the trend is
different. The percentage increase in enrolment in Islamic junior secondary located in
non-urban areas is greater than the percentage increase in enrolment in Islamic junior
secondary located in urban areas.
Figure 5Percentage Change of Total Enrollment in Junior Secondary School Student
Grade 1 to 3 by General School in Urban Area (N=84).
0,00%
2,20%
2,92%
0,00%
-9,26%-8,03%
-10,00%
-8,00%
-6,00%
-4,00%
-2,00%
0,00%
2,00%
4,00%
1997/1998 1998/1999 1999/2000
Academic Year
% c
han
ge
fro
m 1
997
Public Private
Figure 6Percentage Change of Total Enrollment in Junior Secondary School Student
Grades 1 to 3 by Type of School in Urban Area (N=145).
0.00%0.43%
1.58%
-0.06%
-0.31%
-2.00%
-1.00%
0.00%
1.00%
2.00%
3.00%
4.00%
5.00%
6.00%
7.00%
1997/1998 1998/1999 1999/2000
Academic Year
% c
han
ge
fro
m 1
997
General Islamic
20
Migration from urban to rural areas may be one possible explanation for the
apparent increase in enrolment in Islamic schools (particularly in non-urban areas).
Declining employment opportunities in urban areas may have caused people who
previously resided in urban areas and worked in sectors that were hardest hit by
unemployment (construction, manufacturing, and to migrate to rural areas to seek
informal agricultural jobs. Graeme Hugo, in his study on population mobility during the
crisis, observed that population mobility turned out to be an important coping
mechanism for people confronting the effects of the crisis.11 In order to enable families
to survive the loss of income resulting from the crisis, a range of permanent or non-
permanent mobility modes have been adopted. The migrants who return to non-urban
areas may send their children into Islamic schools in order to reduce their educational
expenditures.
Transition Rates
The change of transition from primary to secondary education is also assessed in order
to appreciate whether the crisis appears to be affecting first-year secondary enrolment.
Transition from primary school to junior secondary school and from the latter to senior
secondary is calculated by using first year enrolment data from a panel of junior and
senior secondary schools as a proxy. First year enrolments are compared between 1997
Figure 7Percentage Change of Total Enrollment in Junior Secondary School Student
Grades 1 to 3 by Type of School in Non-Urban Area (N=141).
0,00%0,00%
3,92%
-1,21%
-0,42%
6,45%
-2,00%
-1,00%
0,00%
1,00%
2,00%
3,00%
4,00%
5,00%
6,00%
7,00%
1997/1998 1998/1999 1999/2000
Academic Year
% c
han
ge
fro
m 1
997
General Islamic
21
and 1998 and between 1998 and 1999. Since the survey could not cover all schools
feeding into a higher level, this is only approximate.
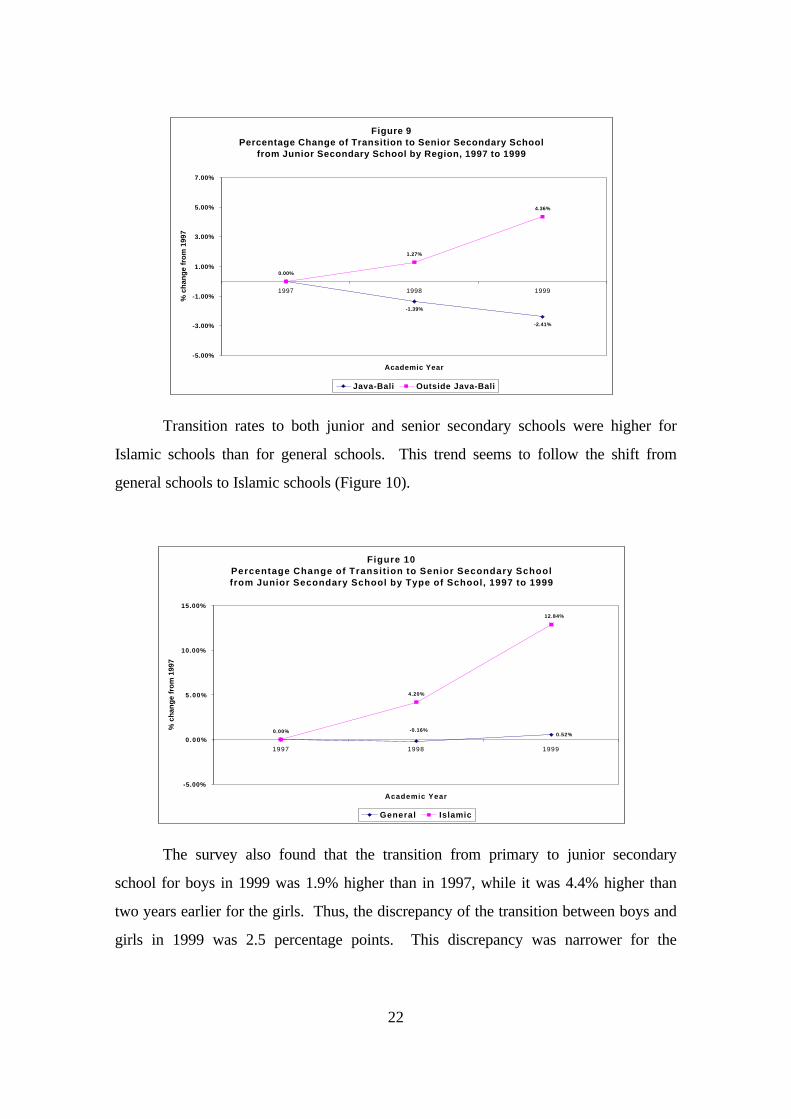
Transition from primary to junior secondary school and from junior to senior
secondary school appears to have increased slightly during the economic crisis. Within
this overall picture, there was some regional variation.
Taking the first year enrolments at both junior and senior secondary school levels
as a proxy for transition, the rates at both key points fell in Java and Bali and rose in
other parts of Indonesia.
As can be seen in Figure 8, the transition from primary school to junior
secondary school in Java and Bali first fell substantially in 1998, then rebounded almost
to its pre-crisis level. This trend, however, did not occur for the transition from junior
secondary school to senior secondary school (Figure 9) with the tendency of further
decreased over three years of crisis.
Figure 8Percentage Change of Transition to Junior Secondary School
from Primary School by Region, 1997 to 1999
- 2 . 7 3 %
- 0 . 9 9 %
0 . 0 0 %
4 . 1 4 %
4 . 9 5 %
-5.00%
-3.00%
-1.00%
1.00%
3.00%
5.00%
7.00%
1997 1998 1999
A c a d e m i c Y e a r
Java-Bal i Outs ide Java-Ba l i
22
Transition rates to both junior and senior secondary schools were higher for
Islamic schools than for general schools. This trend seems to follow the shift from
general schools to Islamic schools (Figure 10).
The survey also found that the transition from primary to junior secondary
school for boys in 1999 was 1.9% higher than in 1997, while it was 4.4% higher than
two years earlier for the girls. Thus, the discrepancy of the transition between boys and
girls in 1999 was 2.5 percentage points. This discrepancy was narrower for the
Figure 9Percentage Change of Transition to Senior Secondary School
from Junior Secondary School by Region, 1997 to 1999
-1.39%
-2.41%
0.00%
1.27%
4.36%
-5.00%
-3.00%
-1.00%
1.00%
3.00%
5.00%
7.00%
1997 1998 1999
Academic Year
% c
han
ge
fro
m 1
997
Java-Bali Outside Java-Bali
Figure 10Percentage Change of Transit ion to Senior Secondary Schoolfrom Junior Secondary School by Type of School, 1997 to 1999
0.52%0.00%
4.20%
-0.16%
12.84%
-5.00%
0.00%
5.00%
10.00%
15.00%
1997 1998 1999
Academic Year
% c
han
ge
fro
m 1
997
General Islamic
23
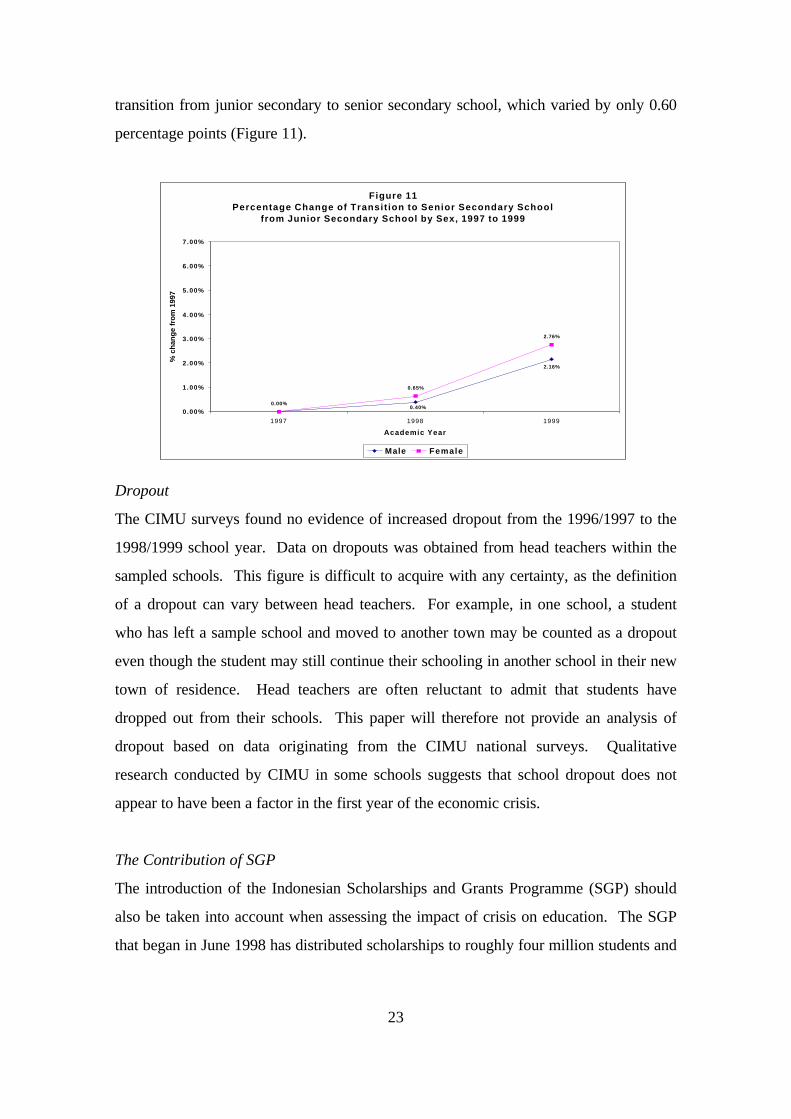
transition from junior secondary to senior secondary school, which varied by only 0.60
percentage points (Figure 11).
Dropout
The CIMU surveys found no evidence of increased dropout from the 1996/1997 to the
1998/1999 school year. Data on dropouts was obtained from head teachers within the
sampled schools. This figure is difficult to acquire with any certainty, as the definition
of a dropout can vary between head teachers. For example, in one school, a student
who has left a sample school and moved to another town may be counted as a dropout
even though the student may still continue their schooling in another school in their new
town of residence. Head teachers are often reluctant to admit that students have
dropped out from their schools. This paper will therefore not provide an analysis of
dropout based on data originating from the CIMU national surveys. Qualitative
research conducted by CIMU in some schools suggests that school dropout does not
appear to have been a factor in the first year of the economic crisis.
The Contribution of SGP
The introduction of the Indonesian Scholarships and Grants Programme (SGP) should
also be taken into account when assessing the impact of crisis on education. The SGP
that began in June 1998 has distributed scholarships to roughly four million students and
Figure 11Percentage Change of Transit ion to Senior Secondary School
from Junior Secondary School by Sex, 1997 to 1999
2.16%
0.00%
0.65%
2.76%
0.40%0.00%
1.00%
2.00%
3.00%
4.00%
5.00%
6.00%
7.00%
1997 1998 1999
Academic Year
% c
han
ge
fro
m 1
997
Male Female
24
grants (known as Dana Bantuan Operational or DBO) to approximately 132,000
schools per year. The SGP now forms the basis of the education safety net, providing
scholarships and grants to the poorest school children and schools.
Every district in Indonesia has received an allocation of both scholarships and
block grants, the amount of which varies according to the “Kabupaten [district] poverty
index”. While district committees decide allocations of SGP scholarship and grant
recipients at the kecamatan (subdistrict) levels, subdistrict committees decide allocations
of recipients at the kecamatan level. District committees select recipient junior and
senior secondary schools, while the selection of recipient primary schools is made by
subdistrict committees. Within each school, it is the school committee, lead by the head
teacher that determines individual scholarship recipients.
In addition to scholarship funds, part of the DBO can also be used to pay for the
school fees of needy students who did not receive scholarships. When the SGP was
conceived, planners intended that schools would use DBO funds to maintain educational
quality through the crisis. This would be achieved by spending funds on areas that
would benefit the teaching and learning process or by using funds to support poor
students who might otherwise dropout from school. A study on DBO usage conducted
by CIMU found that at almost all school levels, the largest proportion of DBO funds
(ranging from 31% in primary schools to 41% in junior secondary schools) was used to
purchase consumable materials (stationary). However, some of the DBO funds were
also used to waive formal and informal school charges for needy students, ranging from
12% in senior secondary school to 26% in junior secondary school.
The provision of scholarships certainly helps poor students pay for school fees,
transportation and textbooks. However, the extent to which the SGP has contributed to
sustained enrolments through the economic crisis is difficult to assess precisely, since it
is only one of several factors that may have influenced enrolments.
It is difficult to isolate the effects of the SGP as several other factors may exert an
independent influence on enrolments. These other influences should be taken into
account when assessing the impact of SGP on enrolment. Other factors that may
influence enrolments include:

25
• Students have not been forced out of school for not paying fees or for latepayment of school fees. This phenomenon may be due to the impact of teacherswho helped poor students who faced financial hardship during the crisis. It mayalso be influenced by whether the school retains the non or late-paying studentsbecause the school’s survival depends on maintaining student numbers in thehope that with economic recovery the number of students who are able to payfor school fees will improve.
• There has been a wide scale campaign throughout out the country (the “AkuAnak Sekolah” campaign) which has emphasized the importance of keepingstudents in school. This may have raised parents’ awareness of the need to keeptheir children in school.
• School fees have not increased as dramatically as other costs of living.• Traditional coping strategies, such as family networks and efforts to reduce
unnecessary expenditures, may also have helped poor parents keep their childrenin school.
• The increase in enrolment, particularly at the senior secondary level, in both1998 and 1999, may also have resulted from a loss of employment opportunities.Students who might normally have dropped out at this level in order to startworking may have postponed the move either to wait out the crisis or toimprove their marketability by continuing in school.
• The availability of scholarships from other sources such as from GNOTA,beasiswa prestasi (scholarships given on the basis of academic achievement),and from private companies or other sources, may have had some impact.
There was an indication of the occurrence of mistargeted scholarships. This
might also mean that some of the scholarships went to children who were actually at
lower risk of dropping out. There are several reasons why some scholarships were mis-
targeted. Although some mis-targeting simply resulted from bad selection by
committees, there were several structural reasons why scholarships may not have
reached many of the most needy. Students who had already dropped out of school were
not eligible to receive scholarships. Many of these were among the poorest and in need
of financial assistance. The number of scholarships allocated to the primary level
covered a smaller percentage of the needy student population than at the junior and
senior secondary levels. Few students at the senior secondary level come from poor
families. Primary schools however, tend to have a higher percentage of needy students
than junior or senior secondary schools. The poorest students at the senior secondary
level are generally better off than the poorest students at the primary and junior
secondary levels. The proportion of scholarships allocated to each school level meant
26
that some junior and senior secondary recipients were not as needy as some primary
school students who did not receive scholarships.
The SGP has made an important contribution of much needed resources at a
time of economic hardship. Without this additional support, schools might have faced
the possibility of raising fees higher than they did, enforcing payment of school fees and
possibly even closing. As will be discussed in the next section, SGP funds have certainly
played some part in mitigating the impact of the economic crisis on school incomes.
CIMU studies have also revealed that SGP funds together with other sources of
government funds have made a significant contribution to school incomes. The question
of what will happen when these funds are no longer available to the schools that now
rely on them for support in their day to day operations is very relevant. Recent visits by
independent monitors to several schools reveal that few head teachers were aware that
the SGP will end in June 2002.
School Income
Most comparisons of school income have been made for non-wage income, since
individual schools control little or none of the salaries paid to regular teachers. This
non-wage income is termed “disposable income”, meaning that the school can use it for
overall operations.
For public schools, non-wage income is derived from both government funds and
payments made by students’ parents. Student payments include students’ monthly
school fees known as BP3, fees for extracurricular activities, and entrance fees (although
entrance fees have been officially waived by the government, in practice, many schools
still charge new students entrance fees). Government sources of non-wage income
include routine operational funds and project-based funds, including DBO (the SGP
block grant), deductions from SGP scholarships, OPF and DOP (non-routine
operational funds).
For private schools the non-wage income is derived from the foundation
(yayasan) and from school fees (SPP). In some cases, private schools rely solely on
students’ monthly school fees and entrance fees. This is particularly true for smaller
27
private schools. Private schools also derive non-wage income from government sources
including DOP, DBO and deductions from SGP scholarships.
This section compares school income during the 1999/2000 school year with the
situation two years earlier in 1997/98. School income in 1999/2000 is adjusted to
compensate for high inflation during the crisis from a pre-crisis base in July 1997 to July
2000.
Data from CIMU’s Second National Survey revealed that school incomes had
fallen significantly in real terms since the start of the economic crisis. While nominal
school incomes appeared to rise during the crisis in terms of the total amount of rupiah,
this increase has not been large enough to compensate for losses caused by high inflation
that have eroded purchasing power. Overall, schools’ real incomes have declined by as
much as one third from 1997 to 2000. Adjusting for inflation in the education sector (a
figure provided by the Indonesian Central Statistical Board, BPS, which differs from
overall inflation) reveals that school incomes from both government and parental
sources have declined significantly in real terms. Income derived from BP3/SPP fees
and from routine operating funds, together constituting nearly half of school income
overall, fell in real terms by about 27% between 1997 and 2000.
The survey found that wages and fringe benefits for teachers and non-teaching
personnel in 1999-2000 constituted 55.2% of all school income for all schools
combined. In 1997-1998, wages and other benefits were a slightly smaller 52.9% of
income to schools. BP3 fees (or SPP in private schools) were the major source of school
income derived from students and were equal to 21.3% of non-wage income (or 9.6%
of all income) in 1999-2000. In the first year of the crisis (1997-1998), BP3/SPP
represented 22.9% of non-wage income (or 10.8% of income counting wages).
Although BP3/SPP fees rose in nominal terms between 1997 and 2000, their real
value fell from one-fifth to one-quarter. For example, average monthly BP3 fees in
senior secondary schools rose in nominal terms from Rp.9,001 in 1997-98, to Rp.10,055
in 1998-99, to Rp.11,242 in 1999-2000. From the 1997-1998 to the 1999-2000
academic years, this constitutes a nominal rise of 24.9%. In real terms, however, when
adjusted for inflation in the education sector, there has been a fall in the monthly BP3 fee
of 24.2% (Figure 12).
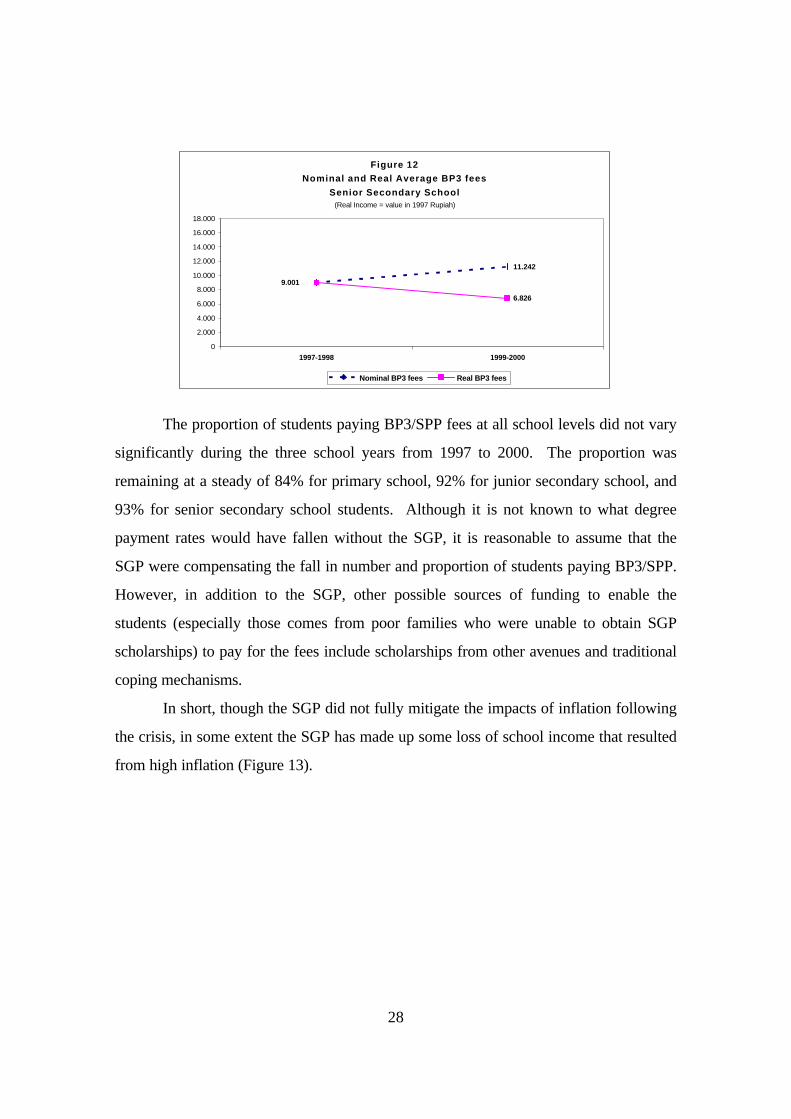
28
The proportion of students paying BP3/SPP fees at all school levels did not vary
significantly during the three school years from 1997 to 2000. The proportion was
remaining at a steady of 84% for primary school, 92% for junior secondary school, and
93% for senior secondary school students. Although it is not known to what degree
payment rates would have fallen without the SGP, it is reasonable to assume that the
SGP were compensating the fall in number and proportion of students paying BP3/SPP.
However, in addition to the SGP, other possible sources of funding to enable the
students (especially those comes from poor families who were unable to obtain SGP
scholarships) to pay for the fees include scholarships from other avenues and traditional
coping mechanisms.
In short, though the SGP did not fully mitigate the impacts of inflation following
the crisis, in some extent the SGP has made up some loss of school income that resulted
from high inflation (Figure 13).
Figure 12Nominal and Real Average BP3 fees
Senior Secondary School (Real Income = value in 1997 Rupiah)
11.242
6.826
9.001
0
2.000
4.000
6.000
8.000
10.000
12.000
14.000
16.000
18.000
1997-1998 1999-2000
Nominal BP3 fees Real BP3 fees
29
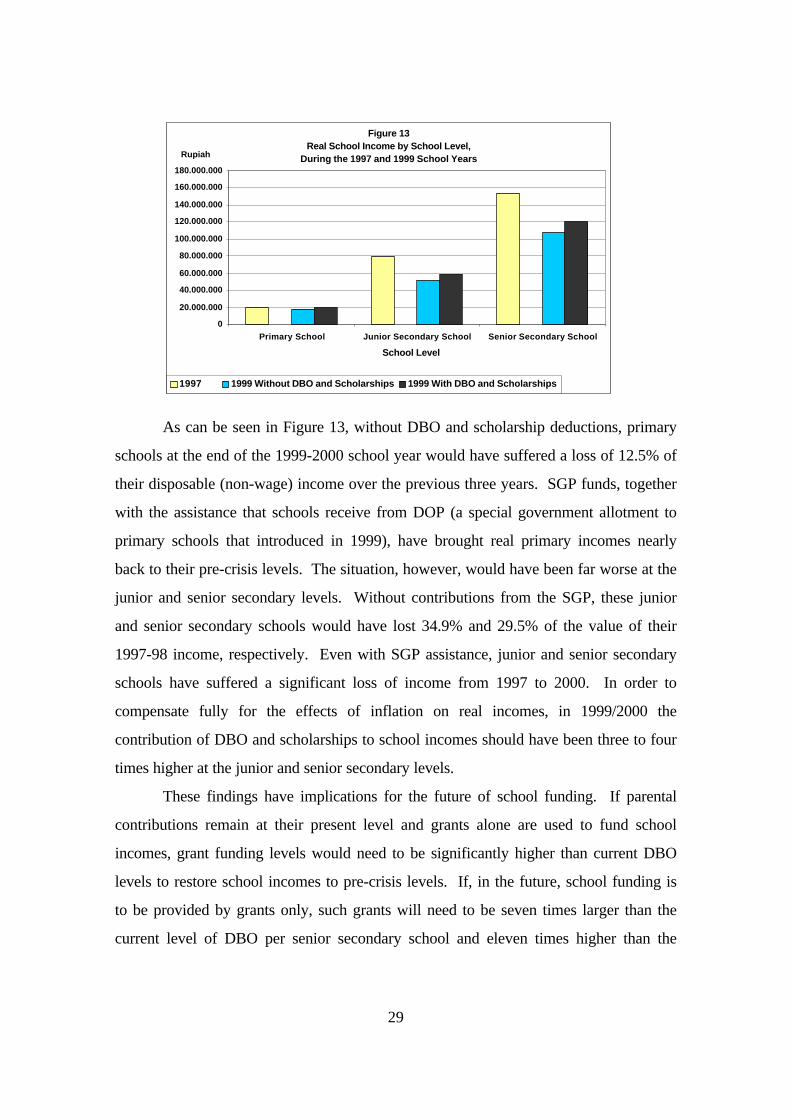
As can be seen in Figure 13, without DBO and scholarship deductions, primary
schools at the end of the 1999-2000 school year would have suffered a loss of 12.5% of
their disposable (non-wage) income over the previous three years. SGP funds, together
with the assistance that schools receive from DOP (a special government allotment to
primary schools that introduced in 1999), have brought real primary incomes nearly
back to their pre-crisis levels. The situation, however, would have been far worse at the
junior and senior secondary levels. Without contributions from the SGP, these junior
and senior secondary schools would have lost 34.9% and 29.5% of the value of their
1997-98 income, respectively. Even with SGP assistance, junior and senior secondary
schools have suffered a significant loss of income from 1997 to 2000. In order to
compensate fully for the effects of inflation on real incomes, in 1999/2000 the
contribution of DBO and scholarships to school incomes should have been three to four
times higher at the junior and senior secondary levels.
These findings have implications for the future of school funding. If parental
contributions remain at their present level and grants alone are used to fund school
incomes, grant funding levels would need to be significantly higher than current DBO
levels to restore school incomes to pre-crisis levels. If, in the future, school funding is
to be provided by grants only, such grants will need to be seven times larger than the
current level of DBO per senior secondary school and eleven times higher than the
Figure 13Real School Income by School Level,
During the 1997 and 1999 School Years
0
20.000.000
40.000.000
60.000.000
80.000.000
100.000.000
120.000.000
140.000.000
160.000.000
180.000.000
Primary School Junior Secondary School Senior Secondary School
School Level
Rupiah
1997 1999 Without DBO and Scholarships 1999 With DBO and Scholarships

30
current level of DBO per junior secondary school. An alternative solution would be to
increase parental contributions significantly. Such a move may have severe social and
political implications.
Maintaining the Quality of Education
There is a lack of useful data on educational outputs in Indonesia. Test scores (from
Cawu and EBTANAS test scores) provide unreliable indicators of student attainment,
which made it necessary to rely on input measures for research into the impact of the
crisis on educational quality. For this reason, CIMU used school income and
expenditure as a proxy for educational quality.
Since school incomes are a critical component of school quality, falling incomes
raise fears that school quality might also decline. Although there is little consensus on
the measures of educational quality, continued reductions of financial resources caused
by inflation will almost certainly have an adverse effect. The physical condition of
schools, particularly classrooms, is certainly one element of school quality. The number
and variety of extracurricular activities offered by schools can also be used as a school
quality indicator.
Spending on classroom repairs climbed in real terms between 1997 and 2000 at
the primary level, while it fell substantially at the secondary level. This parallels the
pattern of school income losses where junior and senior secondary schools suffered
most.
Reductions and cancellations of extracurricular activities between 1997 and 2000
do not appear significant at the primary level, but there are indications of the beginning
of a decline at higher levels. While it is too early to tell, this may be related to a
sustained real income loss at these levels.
Even though there have been significant and successful efforts to build new
schools and increase student enrolments, these have not always been accompanied by
improvements in educational quality. For example, despite the wide spread
implementation of the SD Inpres programme throughout the country, gaps in
educational quality persist between urban and rural areas, and also between Java and
regions outside of Java.

31
Other studies attempting to determine some measure of educational quality have
shown indications that the compulsory education programme seems to focus only on
increasing the numbers of students, and not on improving educational performance or on
raising standards. An estimated 0.23% of all public and private primary schools meet
the criteria for category A classification (the highest of five categories), while only
2.89% of junior secondary schools meet the criteria for category B.12
Other studies look at the quality of basic education as an important issue that
will influence the capacity of students to continue with further education and to enter the
labour market. Studies have revealed that graduates are leaving the basic education
system with low levels of competencies in achieving basic standards and are therefore
not adequately prepared for post-basic education and for a lifetime of learning and
employment.13
Maintaining the quality of education is a costly endeavor that requires
expenditures on good textbooks, equipment, teaching materials, and on teacher training
and compensation. Based on estimated levels of public spending on education in
Indonesia, the poor quality of education appears to be linked to inadequate spending on
education.14 A sustained improvement in quality can only be achieved with a much
greater commitment of government funding.
Conclusions
The economic crisis has had different impacts on education from those expected. On
the whole, schools have remained open and enrolments have been maintained, although
there have been regional variations reflecting the severity of the crisis in different parts
of the country. The anticipated increase in dropouts has not happened. School
incomes, however, have suffered from the cumulative effects of price inflation during the
period. This was not anticipated or at least was not in the government’s top list of
concerns when the economic crisis broke.
Attempts made to maintain spending on education, principally through the
Scholarships and Grants Programme and other interventions, such as DOP, have
contributed to the closing the funding gap. A large number of schools have benefited.
Some have been able to cover as much as 40% of their non-salary expenditure from the

32
Dana Bantuan Operasional (DBO) and money recovered from scholarships. They have
not been forced to raise school fees to levels that might result in high levels of dropout.
Operational expenditure has been subsidized. This form of funding is, however,
temporary. SGP is set to decline from 2001 and will be phased out completely in 2003.
Other sources of funding, such as DOP, will also disappear. A question may arise as to
how the schools will maintain their income once the SGP and other funds stop.
The situation is further complicated by uncertainties over the levels of future
school funding and channeling mechanisms as a consequence of the decentralization of
education governance. The true effects of the economic crisis on education may well
have been muted by the measures taken by the government. They may have simply
stored up problems for the future.
NOTES
1. The authors are consultants to the Central Independent Monitoring Unit (CIMU) of theIndonesian Scholarships and Grants Programme (SGP) in Jakarta. The SGP is onecomponent of the Indonesian Social Safety Net. The programme is funded by thegovernment of Indonesia, the World Bank and the Asian Development Bank. CIMU isfunded largely by a grant from AusAID. The findings and views expressed in thisdocument do not necessarily reflect those of the Government of Indonesia, the donorswho have contributed to this programme, or CIMU.
2. Anggito Abimanyu, “The Socio-Economic Impacts of the Crisis”. In Gus Dur and theIndonesian Economy, edited by Anthony L.Smith. Singapore: ISEAS, 2001: 102-107.
3. Anne Booth, “The Impact of the Indonesian Crisis on Welfare: What Do We KnowTwo Years On?”. In Indonesia in Transition: Social Aspects of Reformasi and Crisis,edited by Chris Manning and Peter Van Diermen. Singapore: ISEAS, 2000, p 155.
4. Graeme Hugo, “The Impact of The Crisis on Internal Population Movement inIndonesia”. Bulletin of Indonesian Economic Studies, Volume XXXVI, No. 2 (2000):136.
5. Anne Booth, “The Impact of the Indonesian Crisis on Welfare: What Do We KnowTwo Years On?”. In Indonesia in Transition: Social Aspects of Reformasi and Crisis,edited by Chris Manning and Peter Van Diermen. Singapore: ISEAS, 2000, p. 147.
6. Mayling Oey-Gardiner, “The Value of Education and the Indonesia Economic Crisis”.Ekonomi dan Keuangan Indonesia, Volume XLVIII, No.2 (2000): 145.
7. Anggito Abimanyu, “The Socio-Economic Impacts of the Crisis”. In Gus Dur and theIndonesian Economy, edited by Anthony L.Smith. Singapore: ISEAS, 2001, 101-102.
8. The World Bank, Education in Indonesia: From Crisis to Recovery, Report No.16369-IND, Education Sector Unit, East Asia and Pacific Regional Office, The World Bank,1998: 15.
9. The World Bank, Education in Indonesia: From Crisis to Recovery, Report No.16369-IND, Education Sector Unit, East Asia and Pacific Regional Office, The World Bank,
33
1998: 13.10. Jones, Gavin W, Peter Hagul and Damayanti. The Impacts of the Scholarships and
Grants Programme. Mimeographed. Jakarta: CIMU, The British Council, 2000,pp 10-20.
11. Graeme Hugo, “The Impact of The Crisis on Internal Population Movement inIndonesia”. Bulletin of Indonesian Economic Studies, Volume XXXVI, No. 2(2000): 136.
12. Prijono, Onny S. “Education: Access, Quality, and Relevance”. In Indonesia TheChallenge of Change, edited by Richard W.Baker, M.Hadi Soesastro, J.Kristiadi, andDouglas E.Ramage, p.163. Singapore: ISEAS, 1999.
13. World Bank, Education in Indonesia: From Crisis to Recovery, Report No.16369-IND, Education Sector Unit, East Asia and Pacific Regional Office, The World Bank,1998, p 23.
14. Prijono, Onny S. “Education: Access, Quality, and Relevance”. In Indonesia TheChallenge of Change, edited by Richard W.Baker, M.Hadi Soesastro, J.Kristiadi, andDouglas E.Ramage, p.164. Singapore: ISEAS, 1999.
REFERENCES
Abimanyu, Anggito. “The Socio-Economic Impacts of the Crisis”. In Gus Dur and theIndonesian Economy, edited by Anthony L.Smith, pp.101-109. Singapore: ISEAS,2001.
Booth, Anne. “The Impact of the Indonesian Crisis on Welfare: What Do We Know Two YearsOn?”. In Indonesia in Transition: Social Aspects of Reformasi and Crisis, edited byChris Manning and Peter Van Diermen, pp.145-162. Singapore: ISEAS, 2000.
Departemen Pendidikan Nasional. Badan Penelitian dan Pengembangan. Data PokokPendidikan 1999/2000 Dan Perkembangan Sejak 1994/1995 (Termasuk Madrasah).Jakarta: Balitbang Depdiknas, 2000.
Hugo, Graeme. “The Impact of The Crisis on Internal Population Movement in Indonesia”.Bulletin of Indonesian Economic Studies, Volume XXXVI, No. 2 (2000): 115-138.
Jones, Gavin W, Peter Hagul and Damayanti. The Impacts of the Scholarships and GrantsProgramme. Mimeographed. Jakarta: CIMU, The British Council, 2000.
Oey-Gardiner, Mayling. “The Value of Education and the Indonesia Economic Crisis”.Ekonomi dan Keuangan Indonesia, Volume XLVIII, No.2 (2000): 143-173.
Prijono, Onny S. “Education: Access, Quality, and Relevance”. In Indonesia The Challenge ofChange, edited by Richard W.Baker, M.Hadi Soesastro, J.Kristiadi, and DouglasE.Ramage, pp.159-178. Singapore: ISEAS, 1999.
World Bank. Education in Indonesia: From Crisis to Recovery, Report No.16369-IND,Education Sector Unit, East Asia and Pacific Regional Office, The World Bank, 1998.
TRENDS IN SOUTHEAST ASIA
1(99): Marzuki Darusman, SH, Indonesia in Transition, April 1999.
2(99): Leo Suryadinata, The Ethnic Chinese Issue and National Integration inIndonesia, June 1999.
3(99): James Cotton, Peacekeeping in East Timor: an Australian perspective, July1999.
4(99): John Funston, Malaysia/Thailand, A Mid-Year Review: Contrasting PoliticalTrajectories, September 1999.
5(99): David K. Linnan, Indonesian Bankruptcy Policy & Reform: ReconcilingEfficiency and Economic Nationalism, September 1999.
6(99): Mahani Zainal Abidin and Zakaria Haji Ahmad, The Financial Crisis inMalaysia: The Economic and Political Consequences, October 1999.
7(99): Sheng Lijun, How China is Going to Respond to Lee Teng-Hui’s “Two States”Theory, December 1999.
1(2000): Zakaria Haji Ahmad, Khoo Kay Kim, K S Nathan, Hari Singh, MeredithWeiss and John Funston, Trends in Malaysia: Election Assessment, January 2000.
2(2000): Michael Leifer, The Political and Security Outlook for Southeast Asia,January 2000.
3(2000): Agus Widjojo and Bambang Harymurti, Understanding Political Change andthe role of the military in Post Suharto Indonesia, February 2000.
4(2000): Chalongphob Sussangkarn, Thailand: Toward a Sustainable Recovery,February 2000.
5(2000): John Funston, ASEAN and the Principle of Non-Intervention – Practice andProspects, March 2000.
6(2000): C. P. F. Luhulima, Scope of ASEAN’s Security Framework for the 21stCentury, April 2000.
7(2000): Ahn Choong Yong, Korea’s Economic Outlook in 2000: Recovery andFurther Restructuring, April 2000.

8(2000): Mohamed Ariff and Azidin W. A. Kadir, The Near-Term Outlook for theMalaysian Economy, May 2000.
9(2000): John Funston, Election Fervour: Political Contest in Thailand and Malaysia,September 2000.
10(2000): Tin Maung Maung Than, Myanmar: The Dilemma of Stalled Reforms,September 2000.
11(2000): Sheng Lijun, Taiwan’s New President and Cross-Strait Relations, September2000.
12(2000): Mohammad Sadli, Restoring Investor Confidence in Indonesia, October2000.
13(2000): Mochtar Buchori and Cornelis Lay, Assessing Current PoliticalDevelopments in Indonesia, October 2000.
1(2001): José Ramos-Horta, East Timor and the Region, January 2001.
2(2001): Ali Alatas, “ASEAN Plus Three” Equals Peace Plus Prosperity, January2001.
3(2001): Abdul Aziz and Michael Leifer, Political and Governance Challenges inSoutheast Asia: Outlook 2001, January 2001.
4(2001): Hadi Soesastro, Mahani Zainal Abidin and Chalongphob Sussangkarn, TheRegional Economic Outlook in 2001: Indonesia, Malaysia and Thailand, January2001.
5(2001): M. R. Sukhumbhand Paribatra and Kitti Limskul, Thailand After TheElection: Politics and Economics, May 2001.
6(2001): Ade Komarudin, Ali Masykur Musa, Alvin Lie, Irwan Prayitno and PramonoAnung, Trends in Indonesia: Visions for Indonesia’s Future, May 2001.
7(2001): Djoko Hartono and David Ehrmann, The Indonesian Economic Crisis and itsImpact on Educational Enrolment and Quality, May 2001.

EditorAnthony Smith
Assistant EditorYap Ching Wi
Editorial CommitteeNick Freeman
Lee Hock GuanTin Maung Maung Than
Papers in this series are preliminary in nature and are intended tostimulate discussion and critical comment. The Editorial Committeeaccepts no responsibility for facts presented and views expressed,which rests exclusively with the individual author. No part of this
publication may be produced in any form without permission.Comments are welcomed and may be sent to the author at the
Institute of Southeast Asian Studies.http://www.iseas.edu.sg

The Institute of Southeast Asian Studies was established as an autonomous
organization in 1968. It is a regional research centre for scholars and other
specialists concerned with modern Southeast Asia, particularly the many-faceted
problems of stability and security, economic development, and political and
social change.
The Institute’s research programmes are the Regional Economic Studies
(RES, including ASEAN and APEC), Regional Strategic and Political Studies
(RSPS) and Regional Social and Cultural Studies (RSCS).

Related Documents