Spends 2.5 hours per day watching online media The Indian Media & Entertainment landscape

Welcome message from author
This document is posted to help you gain knowledge. Please leave a comment to let me know what you think about it! Share it to your friends and learn new things together.
Transcript

Spends 2.5 hours per day watching online media
The Indian Media & Entertainment landscape
2
Contents
1 M&E sectoral overview
2 TV industry landscape
3 Indian Film industry overview
4 Print Media landscape in India
5 Music industry in India
6 Sports industry overview
7 Gaming industry landscape

3
M&E sectoral overview

M&E sector – An overview Indian M&E sector to touch INR 2 trillion by 2020
INR bn
1473 16%
7% 9%
23%
Segment wise break up of M&E Sector
CAGR 11.3%
1658
16%
8% 11%
21%
2033 17% 9%
10% 20%
TV
CAGR (2017-20)
9.8%
6.8%
45% 45% 44% Films
7.2%
CY2017 CY2018E CY2020E
Television Print Films Digital Media Others
Digital Media
23.5%
KEY HIGHLIGHTS
• By 2020, TV still to be the biggest; digital media to grow the fastest
• Global audience adoption to drive faster growth in films, could see increase in high budget films
• Print media – Subscription revenues led to growth so far, now growth to be seen in advertising segment as well
• VFX, gaming and live events could see traction; India to be an outsourcing hub for VFX segment
4 Source: FICCI Frames, Re-imagining India’s M&E sector, March 2018

94.2
87.6
18
3.9
Digital media : Setting the context
Globally, consumption is moving to mobiles, India has large mobile-only users with factors pointing towards increasing consumption
India is leading the way – consumption on mobile over desktop
Mobile Unique Visitors as % of Desktop Unique Visitors
Markets which have a mobile audience larger than its desktop audience – truly ‘mobile first’
Markets where the mobile audience is equal to or
smaller than the desktop audience
397%
249%
134% 132% 127% 116% 114% 106% 100%
90% 90% 81% 68% 48%
India Indonesia China Mexico Spain Brazil Italy Malaysia UK USA Argentina Canada Germany France
In India, the ecosystem is favorable towards higher video and audio consumption over the 3-5 years
Rise in online video audience (in mn) Rise in online audio audience (in mn) GB consumed/ smartphone/month
500
250
2017 2020E
2017 2022 2017 2023E
5 Source: comScore MMX Multi-Platform, Dec 2017
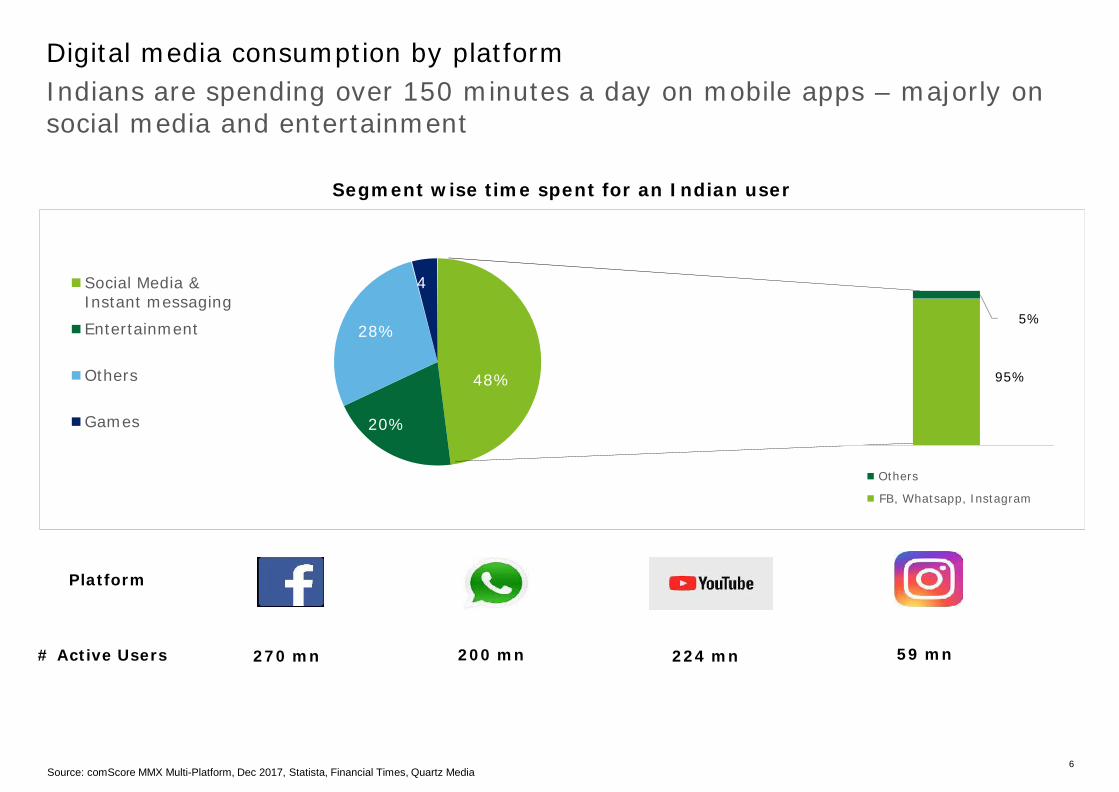
Digital media consumption by platform
Indians are spending over 150 minutes a day on mobile apps – majorly on social media and entertainment
Segment wise time spent for an Indian user
Social Media & Instant messaging
Entertainment
4
5% 28%
Others 48% 95%
Games 20%
Others
FB, Whatsapp, Instagram
Platform # Active Users 270 mn 200 mn 224 mn 59 mn
6 Source: comScore MMX Multi-Platform, Dec 2017, Statista, Financial Times, Quartz Media

7
This Story as being played out in India
Globally and in India, convergence is the new disruptor –Players in previously “defined silos” are now competing across the value chain
Indian Market
Creation of content (TV and film production houses)
Compilation of content from multiple producers
Platform/channel to distribute content (networks, affiliates)
Media used to transmit content (cable, telco, satellite)
Devices and screens used by consumers to consume content
Content Producers
Aggregators
Distributors “YouTube Originals”
Service Providers Vodafone Play
Wynk TV
Device Manufacturers iTunes
Google Play Apple TV
Chromecast
8
Sony Liv
Jio Play
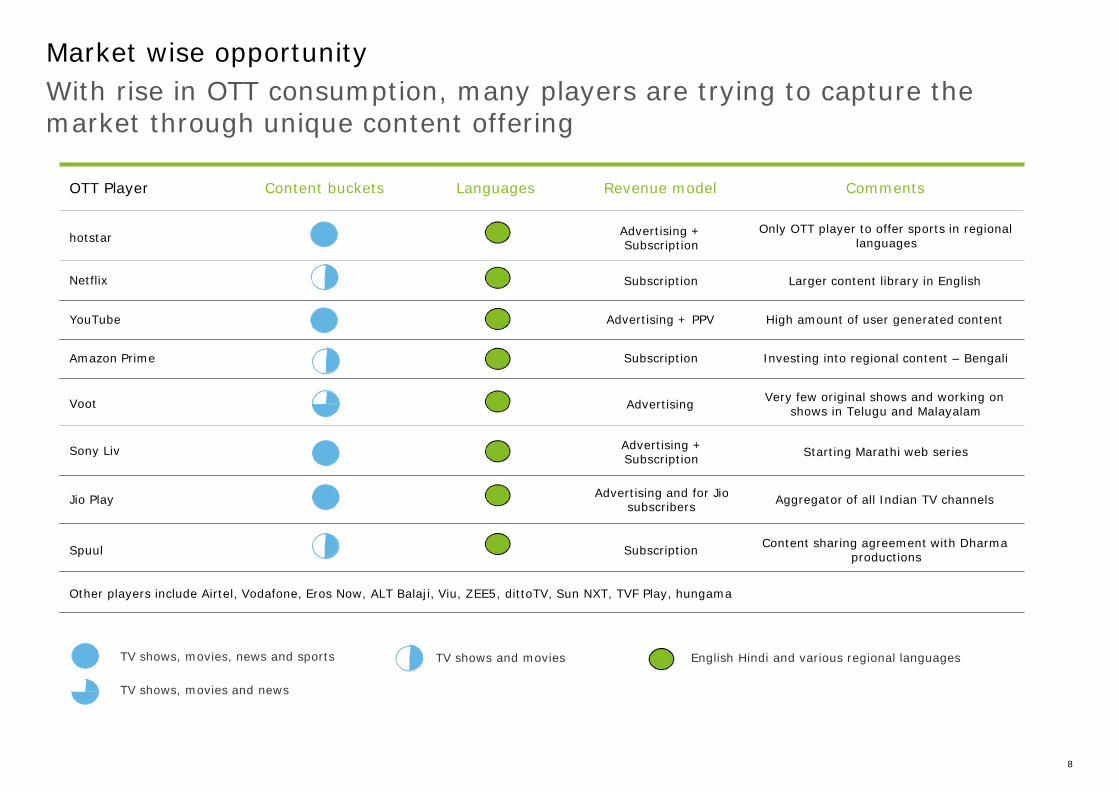
Market wise opportunity
With rise in OTT consumption, many players are trying to capture the market through unique content offering
OTT Player Content buckets Languages Revenue model Comments
hotstar Advertising + Subscription
Only OTT player to offer sports in regional languages
Netflix Subscription Larger content library in English
YouTube Advertising + PPV High amount of user generated content
Amazon Prime Subscription Investing into regional content – Bengali
Voot Advertising Very few original shows and working on
shows in Telugu and Malayalam
Advertising + Subscription
Starting Marathi web series
Advertising and for Jio subscribers
Aggregator of all Indian TV channels
Spuul Subscription Content sharing agreement with Dharma
productions
Other players include Airtel, Vodafone, Eros Now, ALT Balaji, Viu, ZEE5, dittoTV, Sun NXT, TVF Play, hungama
TV shows, movies, news and sports
TV shows, movies and news
TV shows and movies English Hindi and various regional languages
9
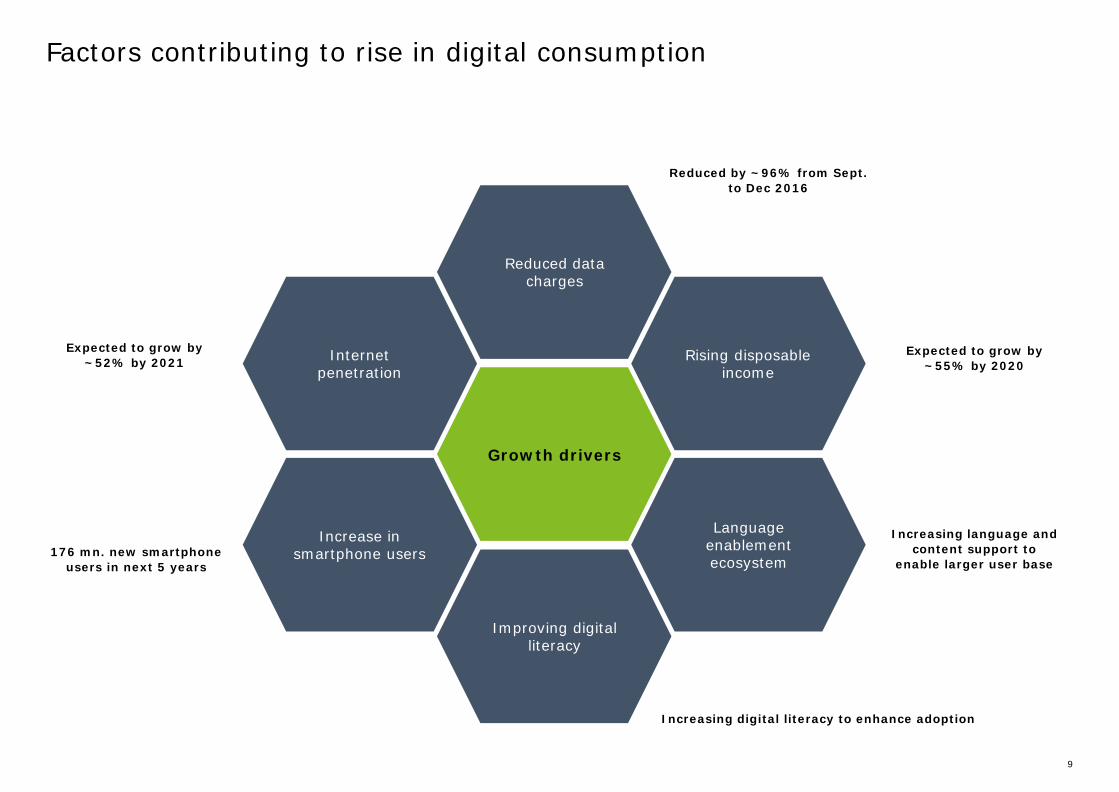
Factors contributing to rise in digital consumption
Reduced by ~96% from Sept. to Dec 2016
Reduced data charges
Expected to grow by ~52% by 2021
Internet penetration
Rising disposable income
Expected to grow by ~55% by 2020
Growth drivers
176 mn. new smartphone users in next 5 years
Increase in smartphone users
Language enablement ecosystem
Increasing language and content support to
enable larger user base
Improving digital literacy
Increasing digital literacy to enhance adoption

10
TV industry landscape
Overview
TV Industry
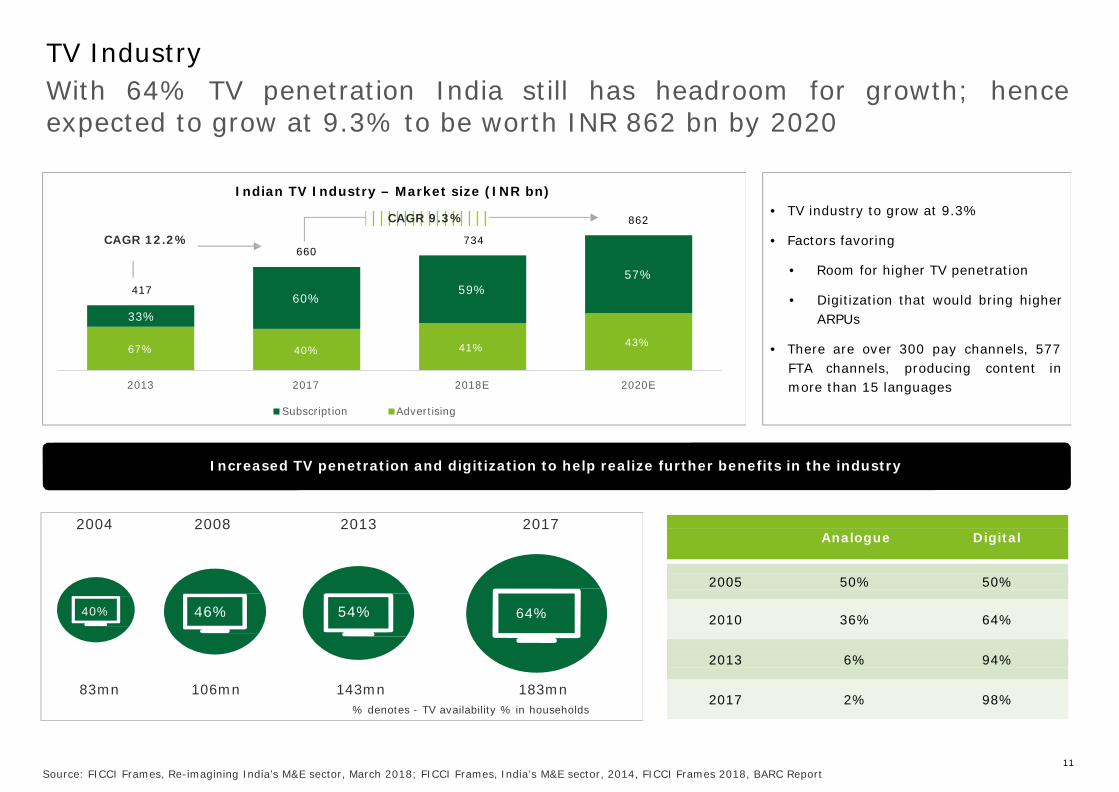
Analogue Digital
2005 50% 50%
2010 36% 64%
2013 6% 94%
2017 2% 98%
With 64% TV penetration India still has headroom for growth; hence expected to grow at 9.3% to be worth INR 862 bn by 2020
CAGR 12.2%
Indian TV Industry – Market size (INR bn)
CAGR 9.3%
734 660
862
57%
• TV industry to grow at 9.3% • Factors favoring
• Room for higher TV penetration 417
33%
60% 59%
• Digitization that would bring higher ARPUs
67% 40% 41% 43%
2013 2017 2018E 2020E
• There are over 300 pay channels, 577
FTA channels, producing content in more than 15 languages
Subscription Advertising
Increased TV penetration and digitization to help realize further benefits in the industry
2004 2008 2013 2017
40% 46% 54% 64%
83mn 106mn 143mn 183mn % denotes - TV availability % in households
11 Source: FICCI Frames, Re-imagining India’s M&E sector, March 2018; FICCI Frames, India’s M&E sector, 2014, FICCI Frames 2018, BARC Report
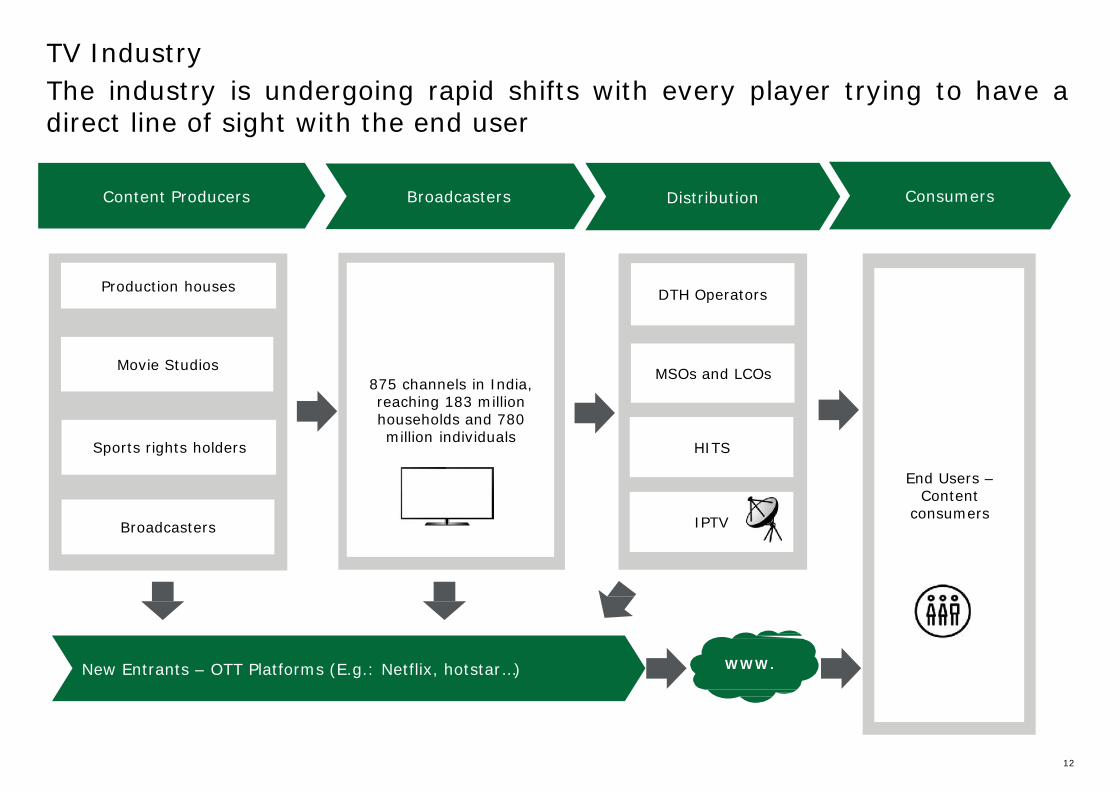
TV Industry
The industry is undergoing rapid shifts with every player trying to have a direct line of sight with the end user
Content Producers Broadcasters Distribution Consumers
Production houses
DTH Operators
Movie Studios
Sports rights holders
875 channels in India, reaching 183 million households and 780 million individuals
MSOs and LCOs
HITS
Broadcasters
IPTV
End Users – Content
consumers
New Entrants – OTT Platforms (E.g.: Netflix, hotstar…) WWW.
12
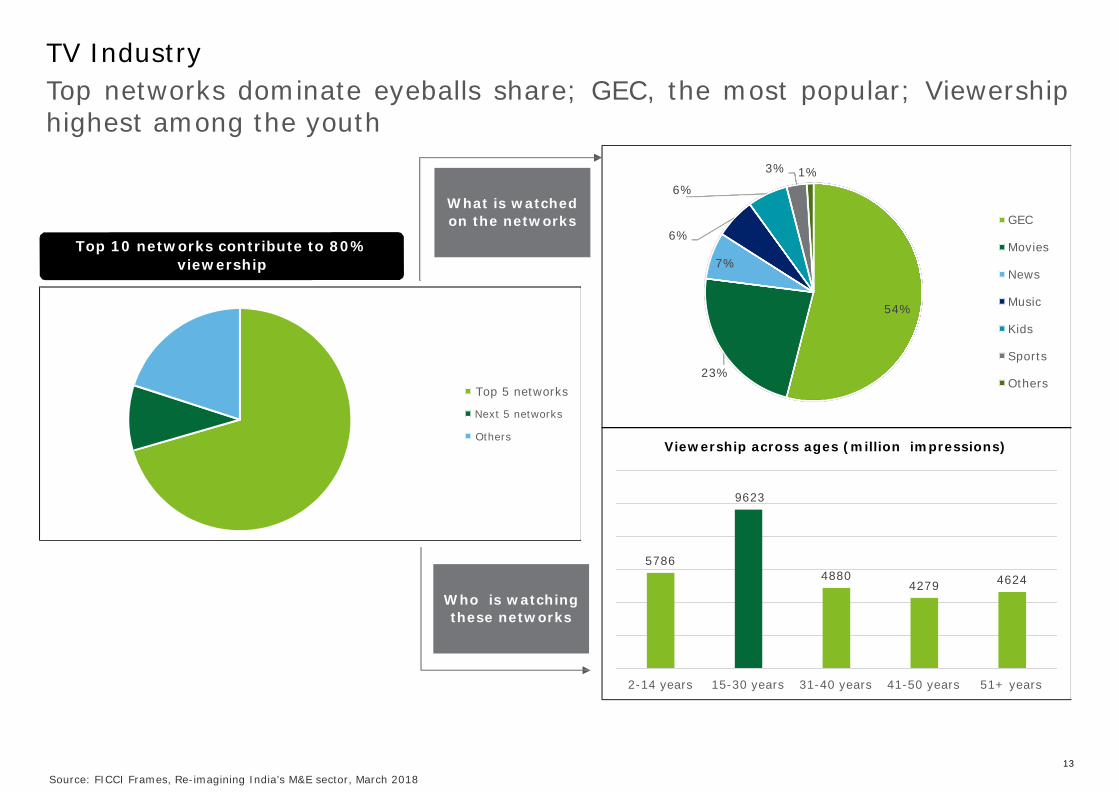
TV Industry
Top networks dominate eyeballs share; GEC, the most popular; Viewership highest among the youth
Top 10 networks contribute to 80% viewership
What is watched on the networks
3% 1%
6% 6%
7%
54%
GEC
Movies
News
Music
Kids
Top 5 networks
23%
Sports Others
Next 5 networks
Others
Viewership across ages (million impressions)
9623
Who is watching these networks
5786 4880
4279 4624
2-14 years 15-30 years 31-40 years 41-50 years 51+ years
13
Source: FICCI Frames, Re-imagining India’s M&E sector, March 2018
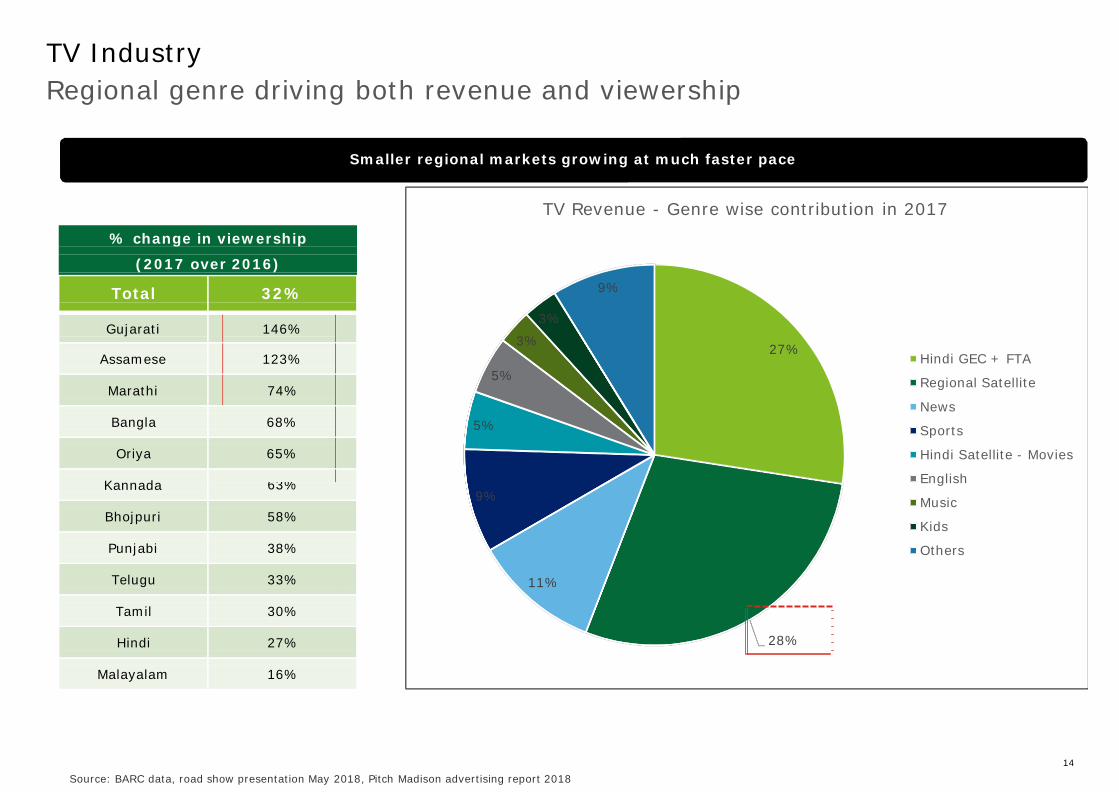
TV Industry
% change in viewership
(2017 over 2016)
Total
32%
Gujarati 146%
Assamese
123%
Marathi
74%
Bangla
68%
Oriya
65%
Kannada 63%
Bhojpuri
58%
Punjabi
38%
Telugu
33%
Tamil
30%
Hindi
27%
Malayalam
16%
Regional genre driving both revenue and viewership
Smaller regional markets growing at much faster pace
TV Revenue - Genre wise contribution in 2017
9%
3%
3% 27%
5%
5%
9%
Hindi GEC + FTA
Regional Satellite
News
Sports
Hindi Satellite - Movies
English
Music
Kids
Others
11%
28%
14
Source: BARC data, road show presentation May 2018, Pitch Madison advertising report 2018

15
Indian Film industry overview
16
Film Industry
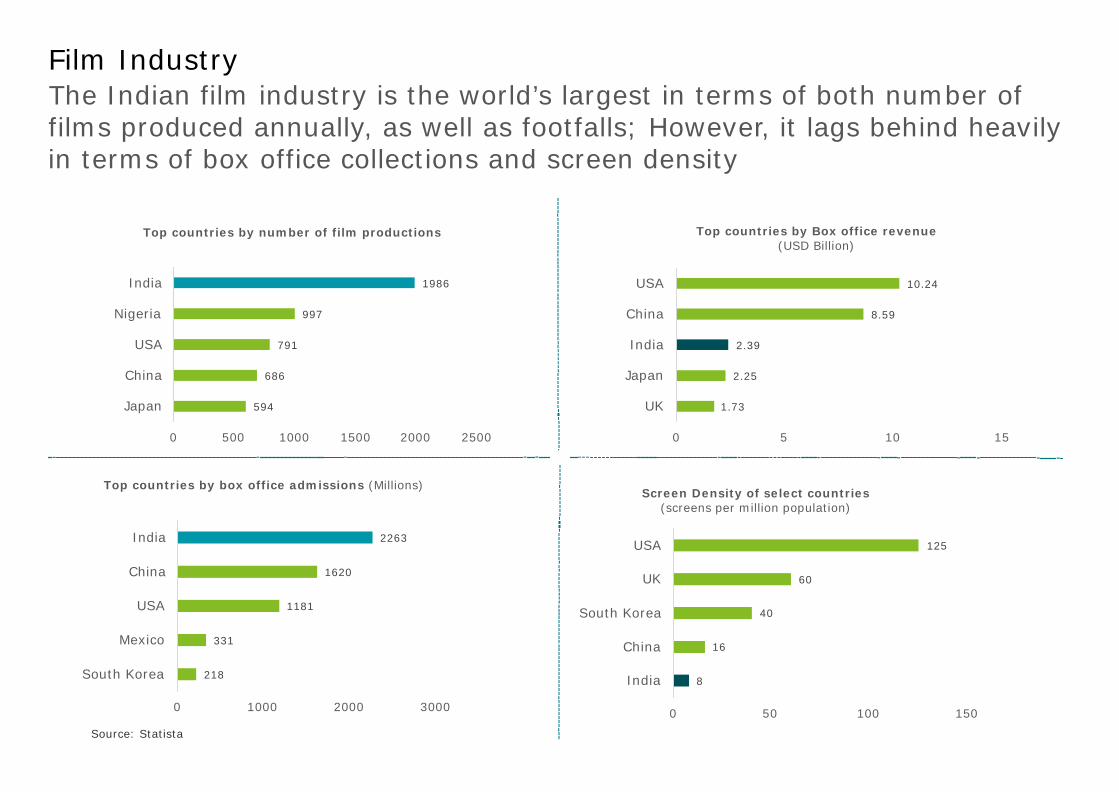
The Indian film industry is the world’s largest in terms of both number of films produced annually, as well as footfalls; However, it lags behind heavily in terms of box office collections and screen density
Top countries by number of film productions Top countries by Box office revenue (USD Billion)
India 1986 USA 10.24
Nigeria 997 China 8.59
USA 791 India 2.39
China 686 Japan 2.25
Japan 594 UK 1.73
0 500 1000 1500 2000 2500 0 5 10 15
Top countries by box office admissions (Millions)
Screen Density of select countries (screens per million population)
India
China
1620
2263
USA
UK
125
60
USA
Mexico
South Korea
331
218
1181
South Korea 40
China 16
India 8
0 1000 2000 3000
Source: Statista
0 50 100 150

Film Industry
20
The Indian Film Industry is expected to grow at a CAGR of 11.9% till 2020 driven by broadcast/digital rights and in-cinema advertising
Segment-wise break up of Indian Film Industry Revenues over 2016-20
140
120
100
96.3
CAGR 11.9%
103.0
INR 165.7B
118.0
INR 192B
The Indian Film Industry posted a growth of 27% in 2017, driven by box office collections – both domestic & international.
Domestic theatricals has been the industry’s biggest revenue stream, it contributed over 60% of the total industry revenues in 2017
85.6
80
60
40
INR 122.4B
INR 156B
25.0 25.0 28.0
22.0
Domestic theatricals along with Overseas theatricals have been the key growth drivers, contributing ~78% of the overall industry topline in 2017
Broadcast rights have been the second largest revenue stream for the industry –expected to grow in the coming years.
Sale of digital rights increased massively by 40% in 2017 and are expected to continue posting double
16.0 19.0 20.0
14.5 digit growth for the next couple of years.
8.5
6.0 5.9 8.5 6.4 10.0 7.5 9 0.4 0.2 0.2 0.3
0 2016 2017 2018E 2020E
Domestic Theatricals Overseas Theatricals Broadcast Rights
Digital/ OTT Rights In Cinema Advertising Home Video
17
Source: Re-imagining India’s M&E Sector – FICCI Report March 2018
Film Industry
18
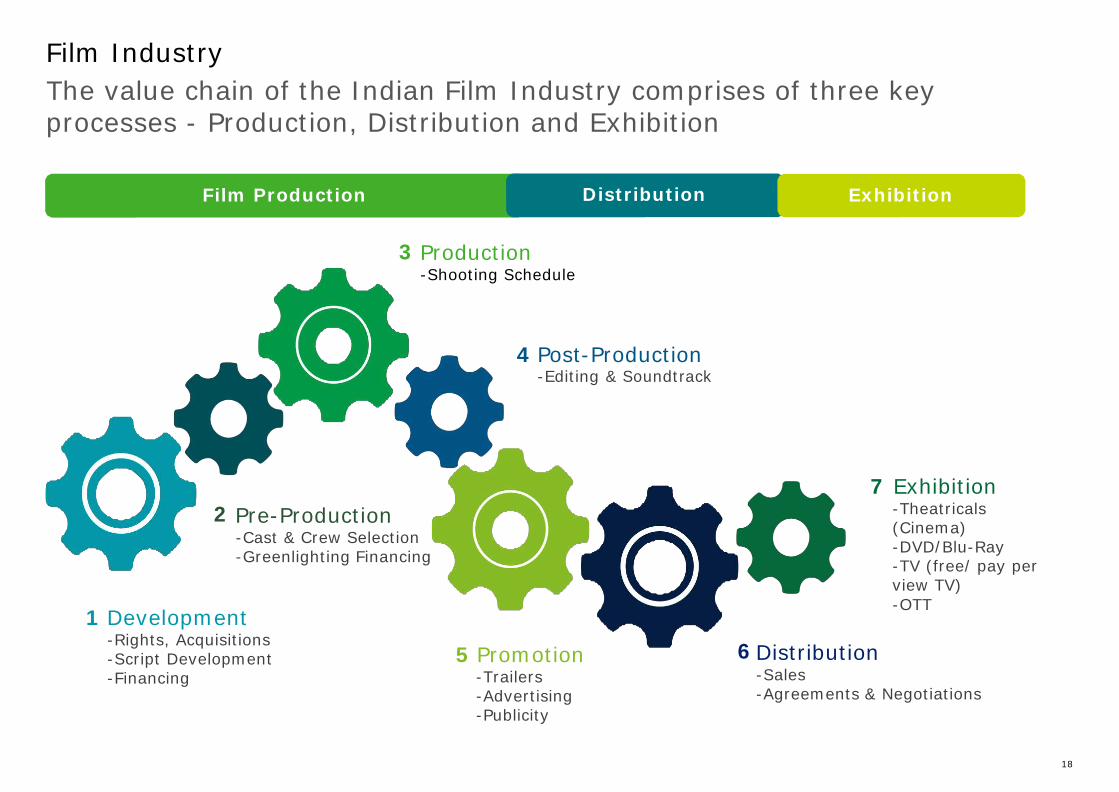
The value chain of the Indian Film Industry comprises of three key processes - Production, Distribution and Exhibition
Film Production Distribution Exhibition
3 Production -Shooting Schedule
4 Post-Production -Editing & Soundtrack
2 Pre-Production -Cast & Crew Selection -Greenlighting Financing
7 Exhibition -Theatricals (Cinema) -DVD/Blu-Ray -TV (free/ pay per view TV) -OTT
1 Development -Rights, Acquisitions -Script Development -Financing
5 Promotion -Trailers -Advertising -Publicity
6 Distribution -Sales -Agreements & Negotiations
Film Industry
19
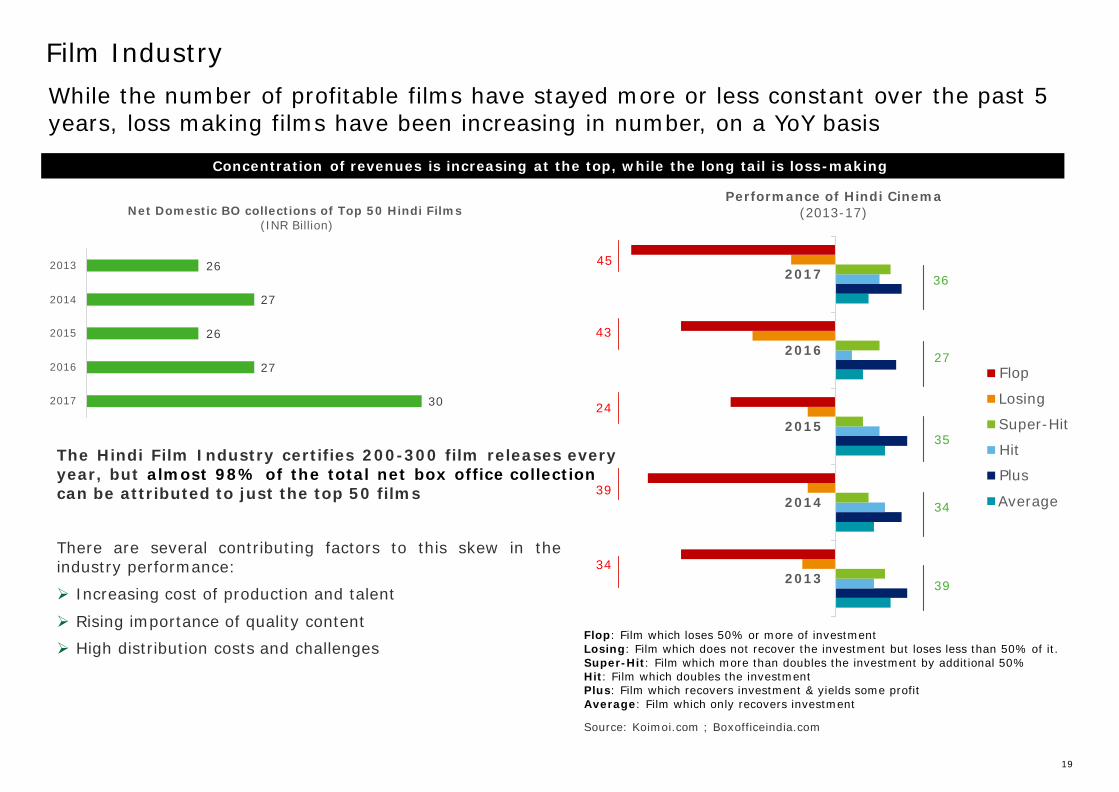
While the number of profitable films have stayed more or less constant over the past 5 years, loss making films have been increasing in number, on a YoY basis
Concentration of revenues is increasing at the top, while the long tail is loss-making
Net Domestic BO collections of Top 50 Hindi Films (INR Billion)
Performance of Hindi Cinema (2013-17)
2013 26
2014 27
45 2017 36
2015 26 43
2016 27
2017 30 24
2016
2015
27
Flop
Losing
Super-Hit 35
The Hindi Film Industry certifies 200-300 film releases every year, but almost 98% of the total net box office collection can be attributed to just the top 50 films 39
There are several contributing factors to this skew in the industry performance: 34
Increasing cost of production and talent
Rising importance of quality content
2014
2013
Hit
Plus
34 Average 39
High distribution costs and challenges Flop: Film which loses 50% or more of investment Losing: Film which does not recover the investment but loses less than 50% of it. Super-Hit: Film which more than doubles the investment by additional 50% Hit: Film which doubles the investment Plus: Film which recovers investment & yields some profit Average: Film which only recovers investment
Source: Koimoi.com ; Boxofficeindia.com
Film Industry
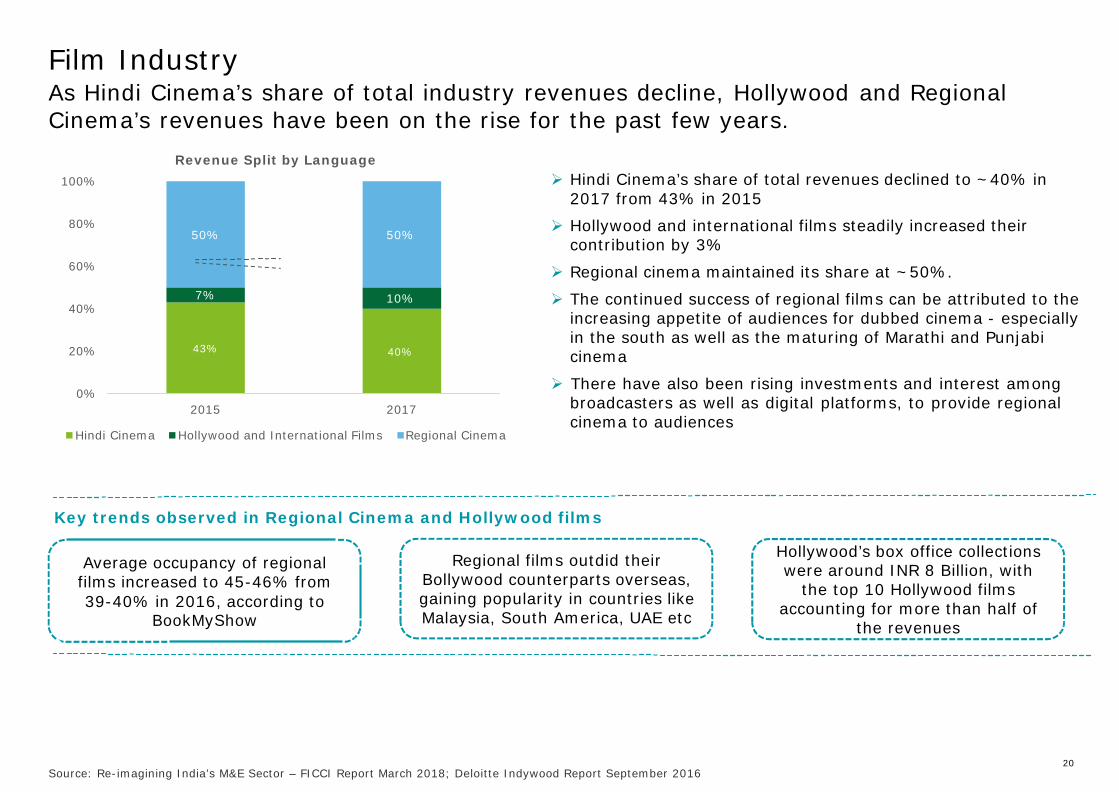
As Hindi Cinema’s share of total industry revenues decline, Hollywood and Regional Cinema’s revenues have been on the rise for the past few years.
100%
80%
60%
40%
20%
0%
Revenue Split by Language
50% 50%
7% 10%
43% 40%
2015 2017
Hindi Cinema’s share of total revenues declined to ~40% in
2017 from 43% in 2015
Hollywood and international films steadily increased their contribution by 3%
Regional cinema maintained its share at ~50%.
The continued success of regional films can be attributed to the increasing appetite of audiences for dubbed cinema - especially in the south as well as the maturing of Marathi and Punjabi cinema
There have also been rising investments and interest among broadcasters as well as digital platforms, to provide regional cinema to audiences
Hindi Cinema Hollywood and International Films Regional Cinema
Key trends observed in Regional Cinema and Hollywood films
Average occupancy of regional films increased to 45-46% from 39-40% in 2016, according to
BookMyShow
Regional films outdid their Bollywood counterparts overseas, gaining popularity in countries like Malaysia, South America, UAE etc
Hollywood’s box office collections were around INR 8 Billion, with
the top 10 Hollywood films accounting for more than half of
the revenues
20 Source: Re-imagining India’s M&E Sector – FICCI Report March 2018; Deloitte Indywood Report September 2016
Film Industry
7.8% 7.6%
22.9%
23.3%
7.8% 7.9%
61.4%
61.3%
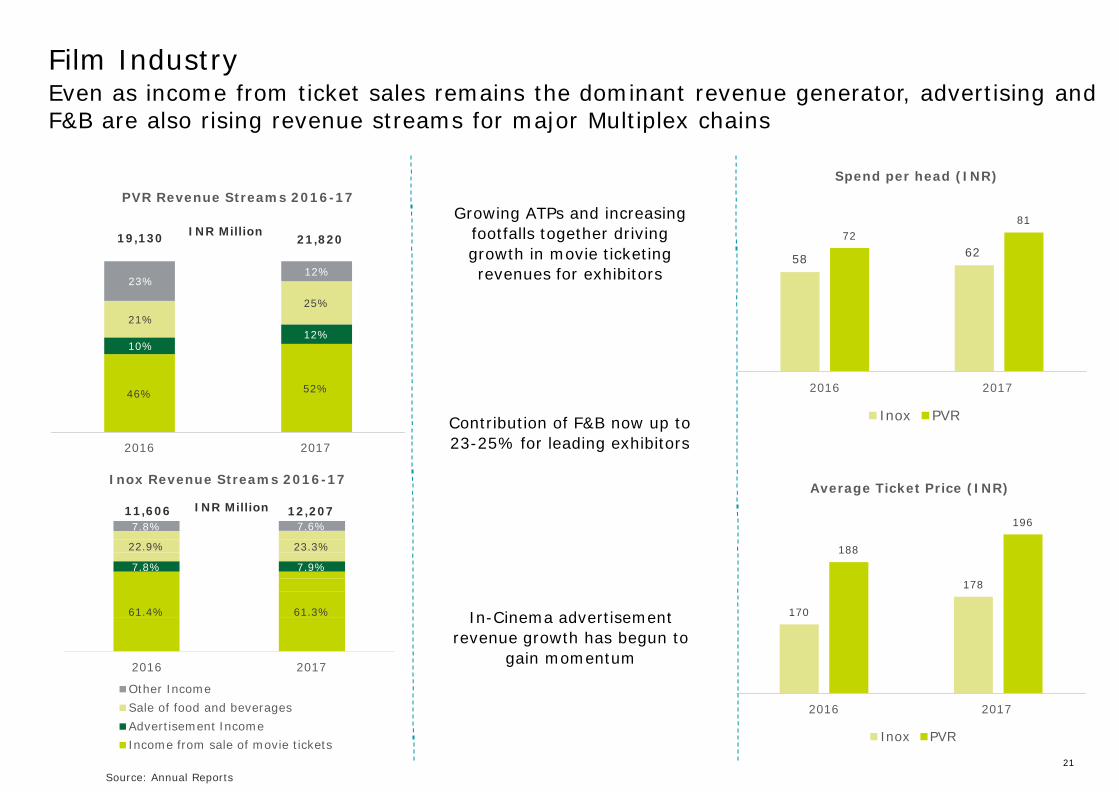
Even as income from ticket sales remains the dominant revenue generator, advertising and F&B are also rising revenue streams for major Multiplex chains
PVR Revenue Streams 2016-17
Growing ATPs and increasing
Spend per head (INR)
81
19,130
23%
INR Million 21,820
12%
footfalls together driving growth in movie ticketing revenues for exhibitors
72
58 62
21%
10%
25%
12%
46% 52%
2016 2017
Contribution of F&B now up to 23-25% for leading exhibitors
2016 2017
Inox PVR
Inox Revenue Streams 2016-17
Average Ticket Price (INR)
11,606 INR Million 12,207
188
196
2016 2017
Other Income
In-Cinema advertisement revenue growth has begun to
gain momentum
170
178
Sale of food and beverages
Advertisement Income
Income from sale of movie tickets
Source: Annual Reports
2016 2017
Inox PVR
21

Film Industry
22
The industry has observed shifting dynamics, in response to internal and external competition, as well as regulatory changes
Multiplex Consolidation
Entry
OTT Plat
FDI
Vertical Integration In order to achieve significant cost advantages, most film studios have created their own distribution arms, thus avoiding profit-sharing agreements.
Multiplex Consolidation The multiplex sector has observed high M&A activity for the past few years, leading to only few big players as compared to a highly fragmented market 5-6 years ago.
Entry of OTT Platforms Identifying India as a lucrative market has led to the entry of many OTT platforms. This has generated a new revenue stream for film producers, as well as given a new avenue to regional/ non-commercial cinema producers for showcasing their work.
FDI The Government of India has granted FDI of up to 100 percent, up from the previous limit of 74 percent, through the automatic route.
Treaties with countries Co-production treaties with nations like Italy, Brazil, UK and Germany have been signed in order to improve the export potential of the film industry.

23
Print Media landscape in India
Overview

*INR bn 2016 2017 2018E 2020E
Advertising 214.8 216.2 238 262.4
Circulation 80.8 87.3 93.4 106.9
Total 295.7 303.4 331.4 369.3
*INR bn 2016 2017 2018E 2020E
Newspaper 281.7 290.4 317.2 353.5
Magazines 14.0 13.0 14.3 15.8
Total 295.7 303.4 331.4 369.3
Print Media
Unlike the global trend, Indian print media continues to grow, largely on back of the vernacular markets
Market Size of Indian Print Industry (INR bn)
2.6 %
296 303.4
6.8 %
331.4
369.3
• The Indian Print industry grew by 2.6% in 2017 to reach
INR 303 mn with Hindi and Vernacular languages growing marginally while English de-growing
• Advertising revenues grew by just 1% in 2017 on account of macro-economic factors such as demonetization, RERA & GST implementation
• Ad Revenues grew in second half on account of increased spending by political parties/government for elections, festival season, focus in yield management, greater customer engagement
2016 2017 2018 2020
• Subscription revenues grew by 8% due to increase in circulation in underpenetrated markets, launch of circulation focused schemes and increase in cover prices
• Magazines contributed 4.3% to the industry and remained largely flat with not many new launches.
• Magazine subscriptions also held on their own and did not change significantly
• Going forward the industry is estimated to grow at an overall CAGR of 6.8% till 2020, with vernacular growing at 8-9% followed by English
*Gross of Taxes
24 Source: FICCI Frames Reimagining India ME sector March 2018

25
Print Media | Subscription Overview Hindi has the largest claimed news circulation at 49% of the total pie
Indian publications by language Indian publications by claimed circulation
12%
41% 49%
47%
12%
H indi E ng lish Other lang ua ges H indi E ng lish Other lang ua ges
• As on March 31, 2017 there were 114,820 registered publications in India of which 16,993 were newspapers.
• 4,007 new publications were registered during 2016-17, while 38 ceased, which was a 3.6% growth.
• The maximum publications across any language were in Hindi (46,587), followed by English (14,365).
• Hindi newspaper claim nearly half of the circulations in India
• Launch of several circulation generating schemes (apart from bundling and discounting) were undertaken in 2017 as the industry focused more on subscription, which increased its share of revenues from 27% to 29% of total revenues.
• Magazine subscriptions on average held their own and did not significantly change.
26
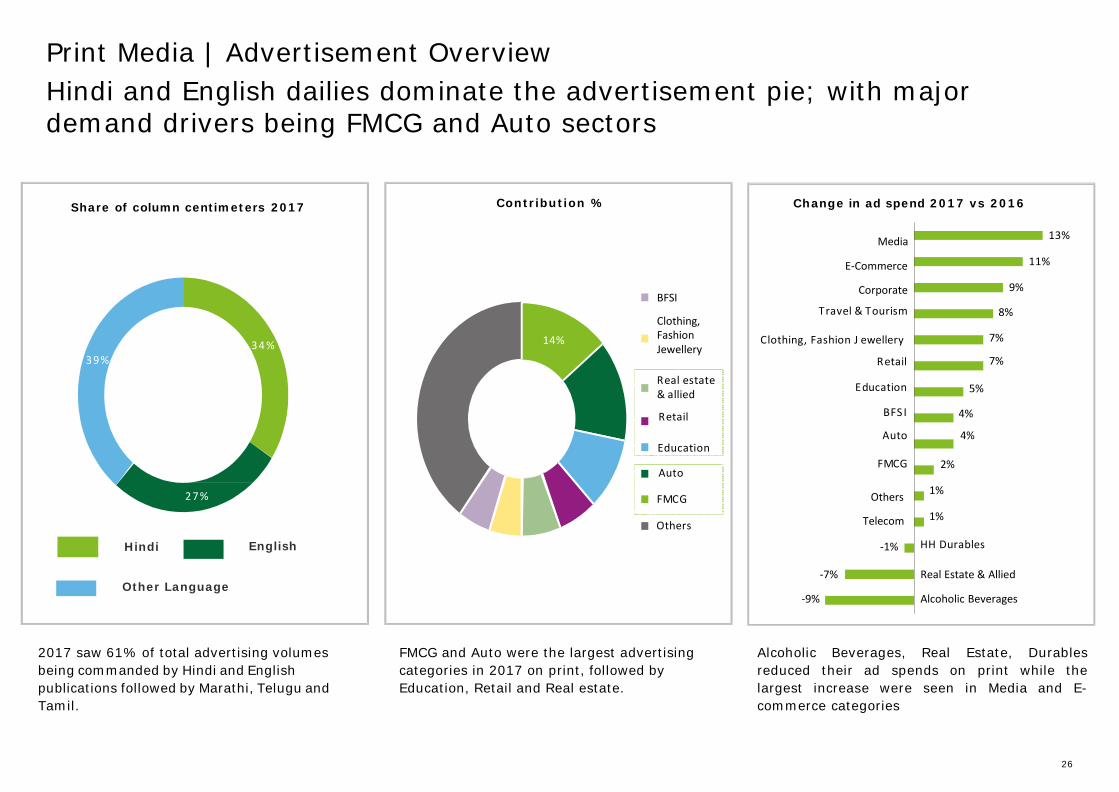
Print Media | Advertisement Overview
Hindi and English dailies dominate the advertisement pie; with major demand drivers being FMCG and Auto sectors
Share of column centimeters 2017 Contribution % Change in ad spend 2017 vs 2016
Media
E-Commerce
13% 11%
3 9 %
2 7 %
3 4 %
14%
BFSI
Clothing, Fashion Jewellery R eal estate & allied
R etail Education Auto
F MCG
Others
Corporate 9%
T ravel & T ourism 8%
C lothing , F ashion J ewellery 7%
R etail 7%
E duc ation 5%
B F S I 4%
A uto 4%
F MCG 2%
Others 1%
Telecom 1%
Hindi English -1% HH Durables
Other Language -7%
-9%
Real Estate & Allied
Alcoholic Beverages 2017 saw 61% of total advertising volumes being commanded by Hindi and English publications followed by Marathi, Telugu and Tamil.
FMCG and Auto were the largest advertising categories in 2017 on print, followed by Education, Retail and Real estate.
Alcoholic Beverages, Real Estate, Durables reduced their ad spends on print while the largest increase were seen in Media and E- commerce categories
27
3}
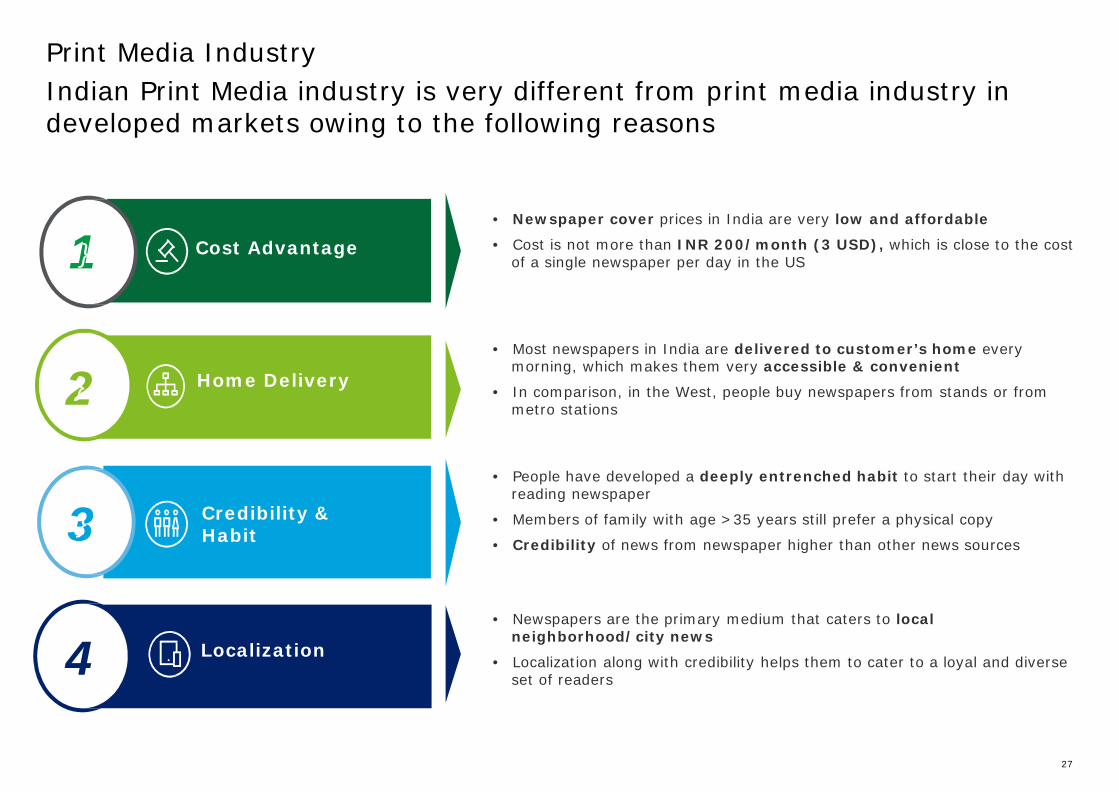
Print Media Industry
Indian Print Media industry is very different from print media industry in developed markets owing to the following reasons
1} Cost Advantage
• Newspaper cover prices in India are very low and affordable
• Cost is not more than INR 200/month (3 USD), which is close to the cost of a single newspaper per day in the US
2} Home Delivery
Credibility & Habit
4 Localization
• Most newspapers in India are delivered to customer’s home every morning, which makes them very accessible & convenient
• In comparison, in the West, people buy newspapers from stands or from metro stations
• People have developed a deeply entrenched habit to start their day with
reading newspaper
• Members of family with age >35 years still prefer a physical copy
• Credibility of news from newspaper higher than other news sources • Newspapers are the primary medium that caters to local
neighborhood/city news
• Localization along with credibility helps them to cater to a loyal and diverse set of readers
28
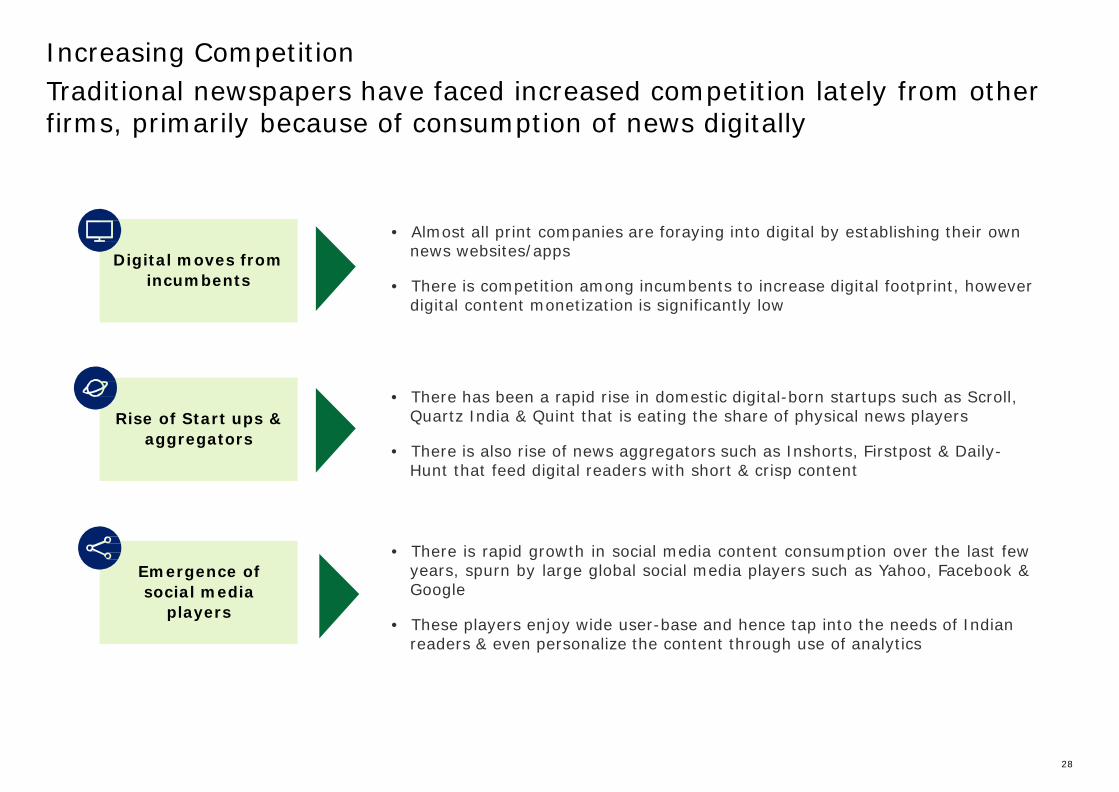
Increasing Competition
Traditional newspapers have faced increased competition lately from other firms, primarily because of consumption of news digitally
Digital moves from incumbents
• Almost all print companies are foraying into digital by establishing their own news websites/apps
• There is competition among incumbents to increase digital footprint, however
digital content monetization is significantly low
Rise of Start ups & aggregators
• There has been a rapid rise in domestic digital-born startups such as Scroll, Quartz India & Quint that is eating the share of physical news players
• There is also rise of news aggregators such as Inshorts, Firstpost & Daily-
Hunt that feed digital readers with short & crisp content
Emergence of social media
players
• There is rapid growth in social media content consumption over the last few years, spurn by large global social media players such as Yahoo, Facebook & Google
• These players enjoy wide user-base and hence tap into the needs of Indian
readers & even personalize the content through use of analytics
29
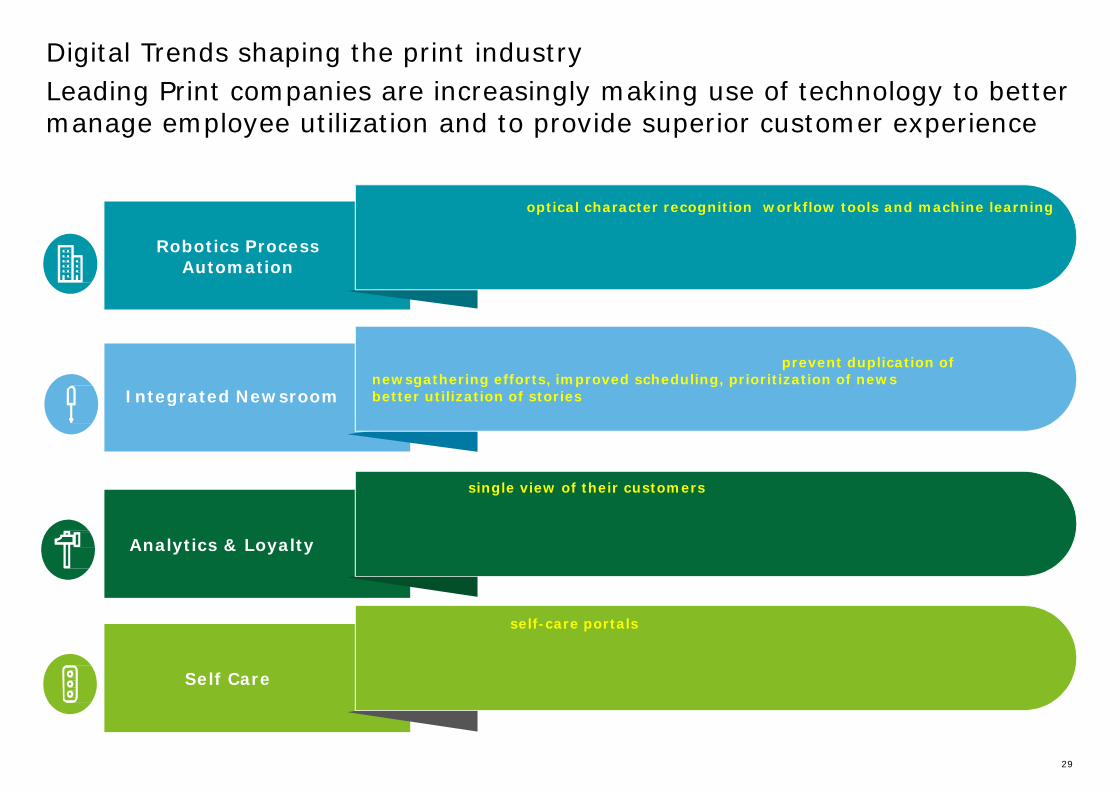
Digital Trends shaping the print industry
Leading Print companies are increasingly making use of technology to better manage employee utilization and to provide superior customer experience
optical character recognition workflow tools and machine learning
Robotics Process Automation
Integrated Newsroom
Analytics & Loyalty
Self Care
prevent duplication of newsgathering efforts, improved scheduling, prioritization of news better utilization of stories
single view of their customers
self-care portals

30
Music industry in India
Overview
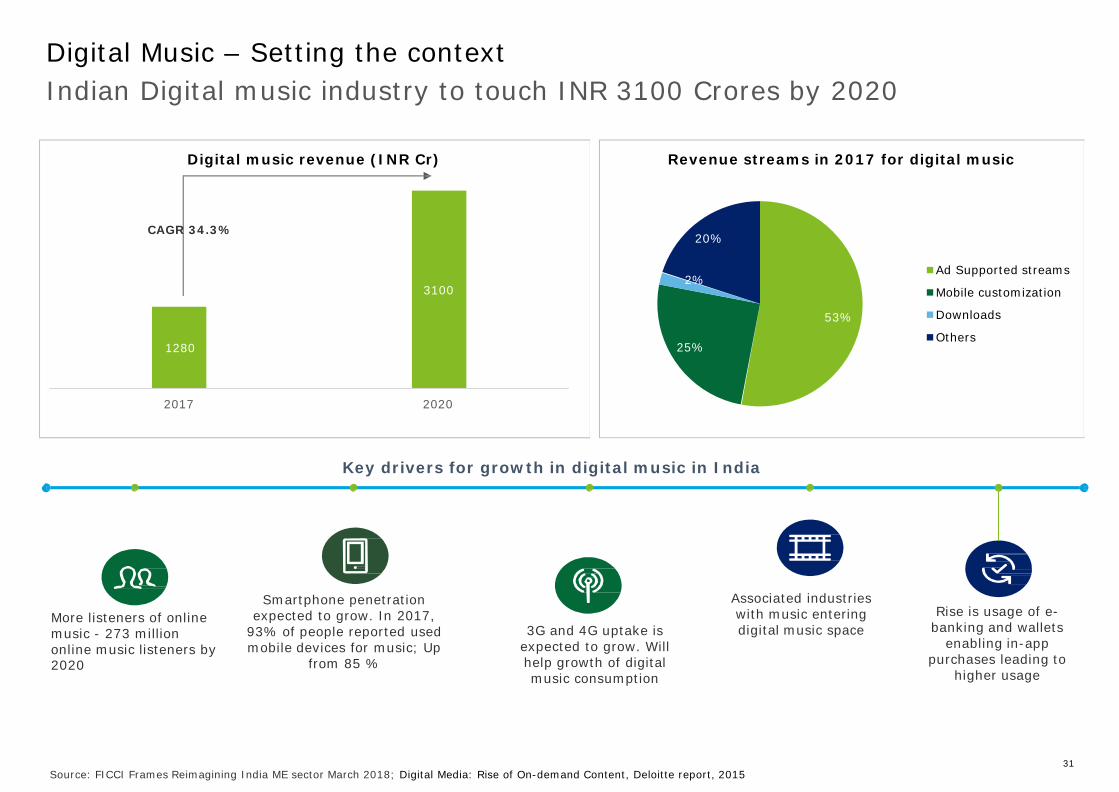
Digital Music – Setting the context Indian Digital music industry to touch INR 3100 Crores by 2020
Digital music revenue (INR Cr) Revenue streams in 2017 for digital music
CAGR 34.3% 20%
1280
3100
2%
25%
53%
Ad Supported streams
Mobile customization
Downloads
Others
2017 2020
Key drivers for growth in digital music in India
More listeners of online music - 273 million online music listeners by 2020
Smartphone penetration expected to grow. In 2017,
93% of people reported used mobile devices for music; Up
from 85 %
3G and 4G uptake is
expected to grow. Will help growth of digital music consumption
Associated industries with music entering digital music space
Rise is usage of e-
banking and wallets enabling in-app
purchases leading to higher usage
31 Source: FICCI Frames Reimagining India ME sector March 2018; Digital Media: Rise of On-demand Content, Deloitte report, 2015

32
Emerging themes in digital music industry Exciting avenues ahead
Trends in the digital music Industry Increase in data consumption Easy availability of cheap & affordable data tariff plans coupled with increasing smartphone penetration in both urban as well as sub-urban areas has led to increased data consumption for audio as well as video platforms
Growing Competitive Market
The market is becoming increasingly competitive with multiple players offering music streaming and other services. Moreover, content partnerships in the digital / OTT space such as Jio and Saavn are poised to put additional pressure on the existing players such as Wynk, Apple Music
Increase in AVOD spends Music and video streaming platforms are expected to further witness a boost in their revenues on account of increase in spends in advertisements on digital platforms. This would lead to further monetization for both streaming companies as well as record labels
Impact of technology on music Major infrastructural improvements and impact of evolving technologies such as AI and Data Analytics are proving pivotal in understanding consumer preferences and assisting musicians, artists and record labels to successfully create and curate preferred content
Partnerships OTT players have looked to partner with local talent to develop original music content e.g. BeingU Music and Sony Music working on exclusive partnership and introducing original content in 2018
Growth in consumption of other genres of music Evolving consumer preferences & tastes coupled with increasing availability of greater variety of content is further promoting consumption of content in regional languages.

33
Sports industry overview
Overview
34
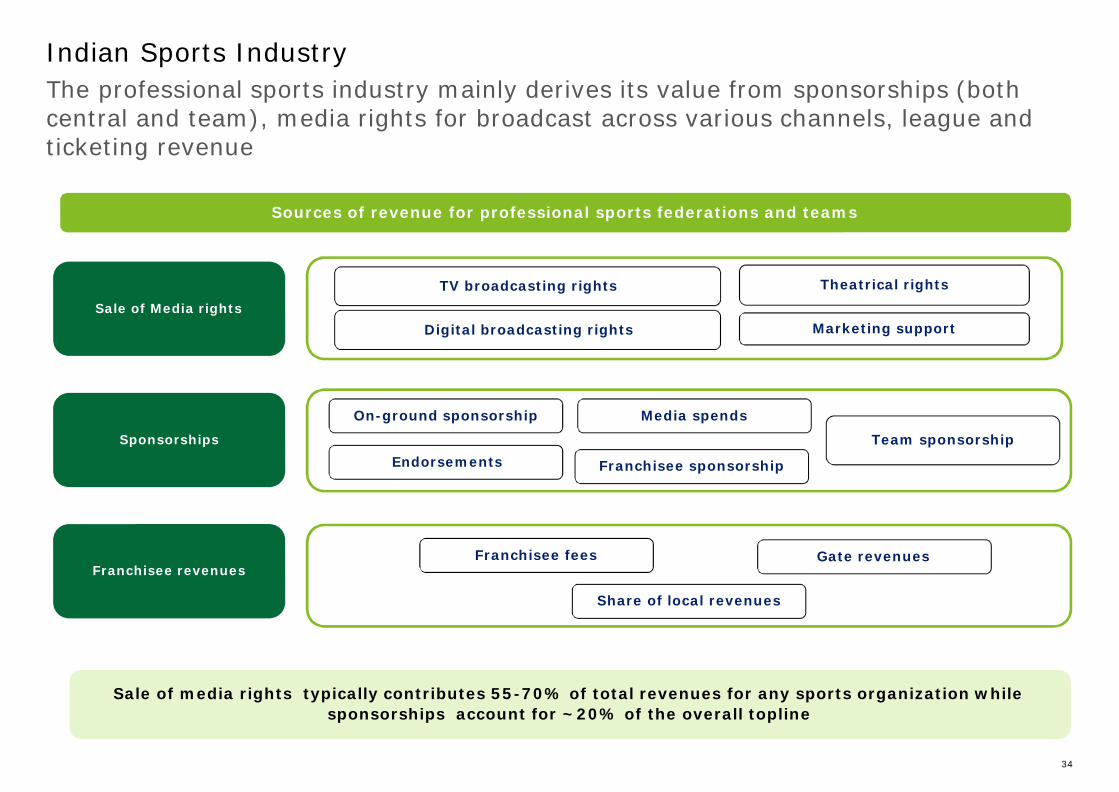
Indian Sports Industry
The professional sports industry mainly derives its value from sponsorships (both central and team), media rights for broadcast across various channels, league and ticketing revenue
Sources of revenue for professional sports federations and teams
Sale of Media rights
TV broadcasting rights Theatrical rights Digital broadcasting rights Marketing support
Sponsorships
On-ground sponsorship Media spends Team sponsorship
Endorsements
Franchisee sponsorship
Franchisee revenues Franchisee fees Gate revenues
Share of local revenues
Sale of media rights typically contributes 55-70% of total revenues for any sports organization while sponsorships account for ~20% of the overall topline
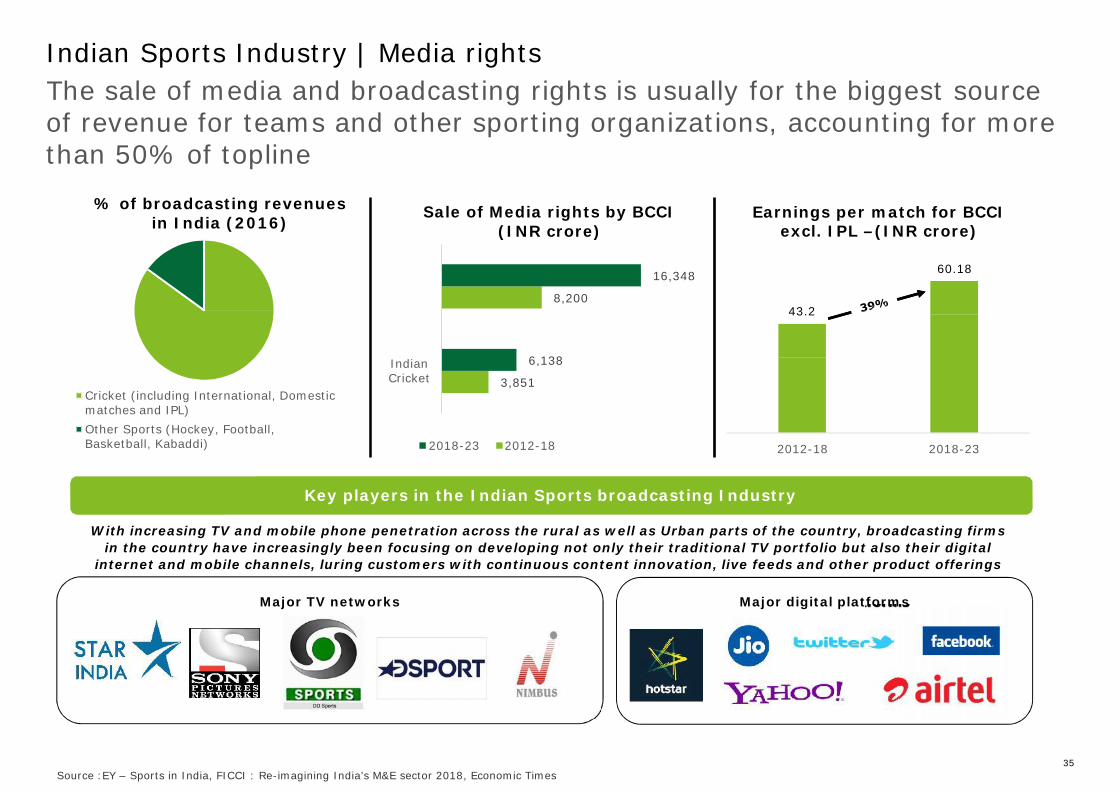
Indian Sports Industry | Media rights
43.2
The sale of media and broadcasting rights is usually for the biggest source of revenue for teams and other sporting organizations, accounting for more than 50% of topline
% of broadcasting revenues in India (2016)
Sale of Media rights by BCCI (INR crore)
Earnings per match for BCCI excl. IPL –(INR crore)
Cricket (including International, Domestic matches and IPL)
Other Sports (Hockey, Football,
Indian Cricket
8,200
6,138
3,851
16,348 60.18
Basketball, Kabaddi) 2018-23 2012-18 2012-18 2018-23
Key players in the Indian Sports broadcasting Industry
With increasing TV and mobile phone penetration across the rural as well as Urban parts of the country, broadcasting firms in the country have increasingly been focusing on developing not only their traditional TV portfolio but also their digital
internet and mobile channels, luring customers with continuous content innovation, live feeds and other product offerings
Major TV networks Major digital platforms
35 Source :EY – Sports in India, FICCI : Re-imagining India’s M&E sector 2018, Economic Times

Indian Sports Industry | Media rights
Cricket is the most popular sport on TV; Soccer, Kabaddi and Wrestling are emerging categories
Unique viewers of Sports leagues in 2016 (mn) Popular Sports properties in India on TV-2017 (% of impressions)
Others 362 60% of the overall viewership
came from Cricket in 2016 Soccer 5%
5%
224 220 Wrestling
5%
109 Kabaddi 16%
Indian Premier League
Indian Super
League
Pro Kabaddi
League
Pro Wrestling
League
Cricket 69%
Viewership for major leagues such as IPL, ISL and PKL
• Data suggests that Cricket continues to be the most popular sport in the country with 69% of the overall number of TV impressions in the country coming from domestic and International Cricketing events
• While cricket continues to be the most popular sport, other
sports such as Kabaddi, Soccer and Wrestling are gradually picking up
Male Female
Rural Urban
• Kabaddi and Soccer are the second and third most watched sports in the country respectively, owing to successful closure of Pro-Kabaddi and Indian Super League seasons and aggressive promotional campaigns
36
Source: Internet and Mobile Association of India, BARC India, FICCI : Re-imagining India’s M&E sector 2018

Gaming industry landscape
Overview
37
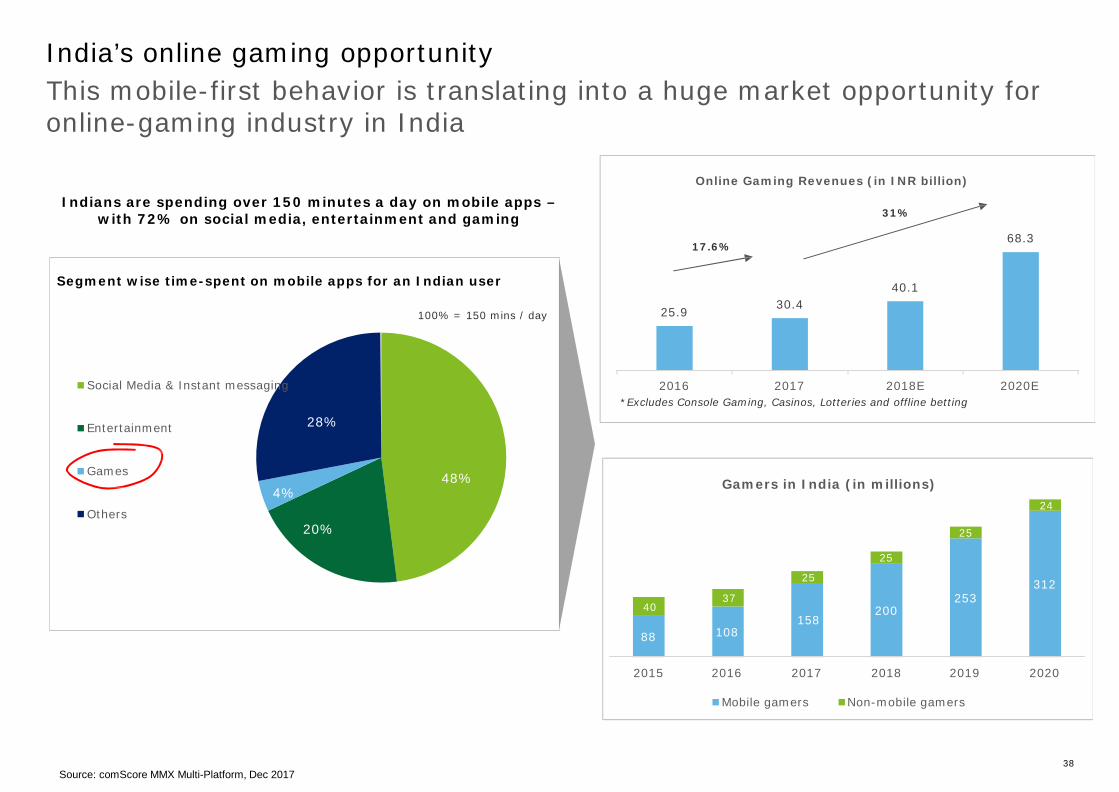
India’s online gaming opportunity
This mobile-first behavior is translating into a huge market opportunity for online-gaming industry in India
Indians are spending over 150 minutes a day on mobile apps –
with 72% on social media, entertainment and gaming
Online Gaming Revenues (in INR billion)
31%
68.3
17.6%
Segment wise time-spent on mobile apps for an Indian user
100% = 150 mins / day
25.9
30.4
40.1
Social Media & Instant messaging
Entertainment
28%
2016 2017 2018E 2020E *Excludes Console Gaming, Casinos, Lotteries and offline betting
Games
Others
4%
20%
48% Gamers in India (in millions)
24
25
25
37 40
158
25 200
253
312
88 108
2015 2016 2017 2018 2019 2020
Mobile gamers Non-mobile gamers
38 Source: comScore MMX Multi-Platform, Dec 2017

India’s online gaming opportunity
39
Advertising
In-app/ subscription
Commissions
Casual games
70%
30%
Social games
10%
90%
Real money games
100%
Spends per gamer are gradually increasing although still lower than global benchmarks; real money and social gamers driving the spends
• Online gaming industry divided into three main genres: • Casual Games • Social Games • Real Money Games
• Currently the size of the Real Money games is estimated to be 55% of the total gaming industry, growing at a robust 25% per annum
• Online card games have been the fastest growing segment: Includes both real money & social games
• In social games, players play for virtual currency which they can replenish through in-app purchases
Revenue Streams
Spend per mobile gamer (in USD)
23
15
10 7.5
4.5 5.1
32
12
7.5
• In India, spend per mobile gamer reached 2.6 USD in 2017 and envisaged to grow further in near future in form of real money and social games purchases
• Other consumer companies will also realize gaming as an important platform for advertising their products resulting in increased revenue
• Indian media houses are using gaming as an interactive form of entertainment to engage consumers
• More Partnerships with Bollywood studios in game development for movies that have been widely accepted by Indian masses is a revenue-making opportunity for gaming companies
1.2 2 2.6
2015 2016 2017
• Baahubali: The Game and Sultan: The Game are some of the top most downloaded games in India
India China SEA MEA
40
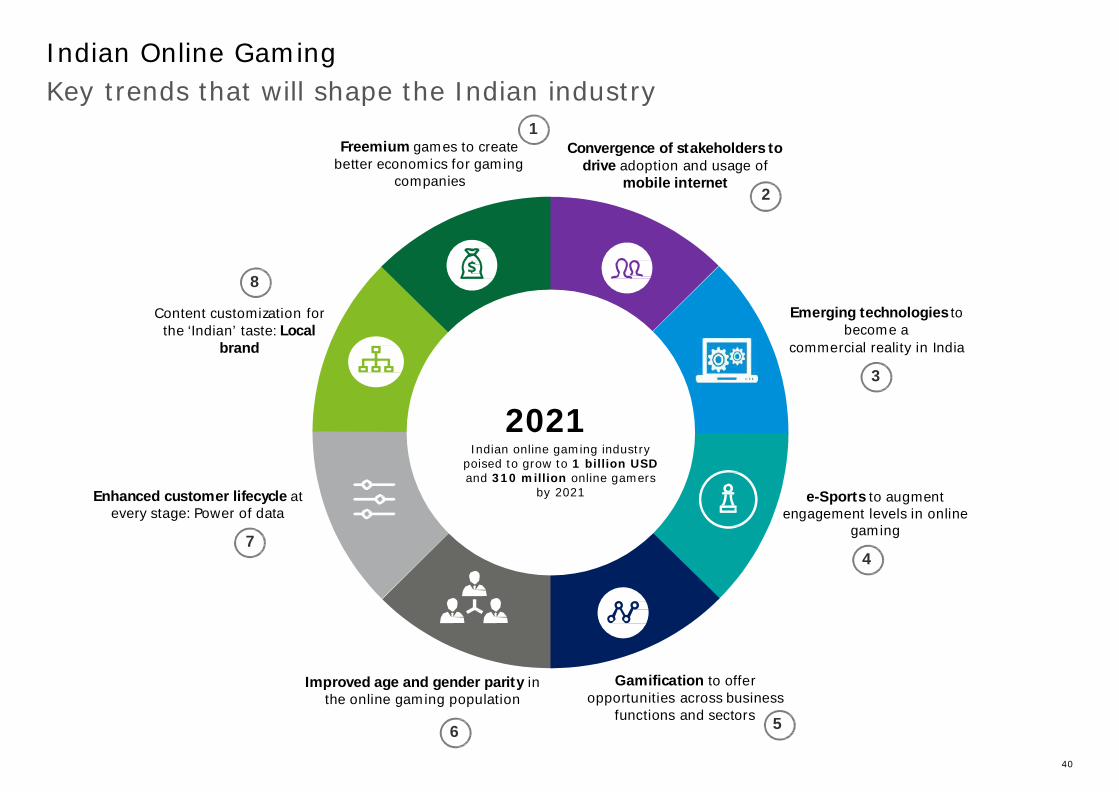
Indian Online Gaming Key trends that will shape the Indian industry
1 Freemium gam es to create
better econom ics for gam ing co m pan ies
Convergence of st akeholders to drive adoption and usage of
mobile internet 2
8
Content custo m ization for the ‘Indian’ taste: Local
brand
Enhanced customer lifecycle at every stage: Pow er of data
7
2021 Indian online gaming industry
poised to grow to 1 billion USD and 310 million online gamers
by 2021
Emerging technologies to becom e a
com m ercial reality in India
3
e-Sport s to au g m ent engagem ent levels in online
gam ing
4
Improved age and gender parit y in the online gam ing population
Gamification to offer opportu n ities across business
functions and sector s 6 5
41
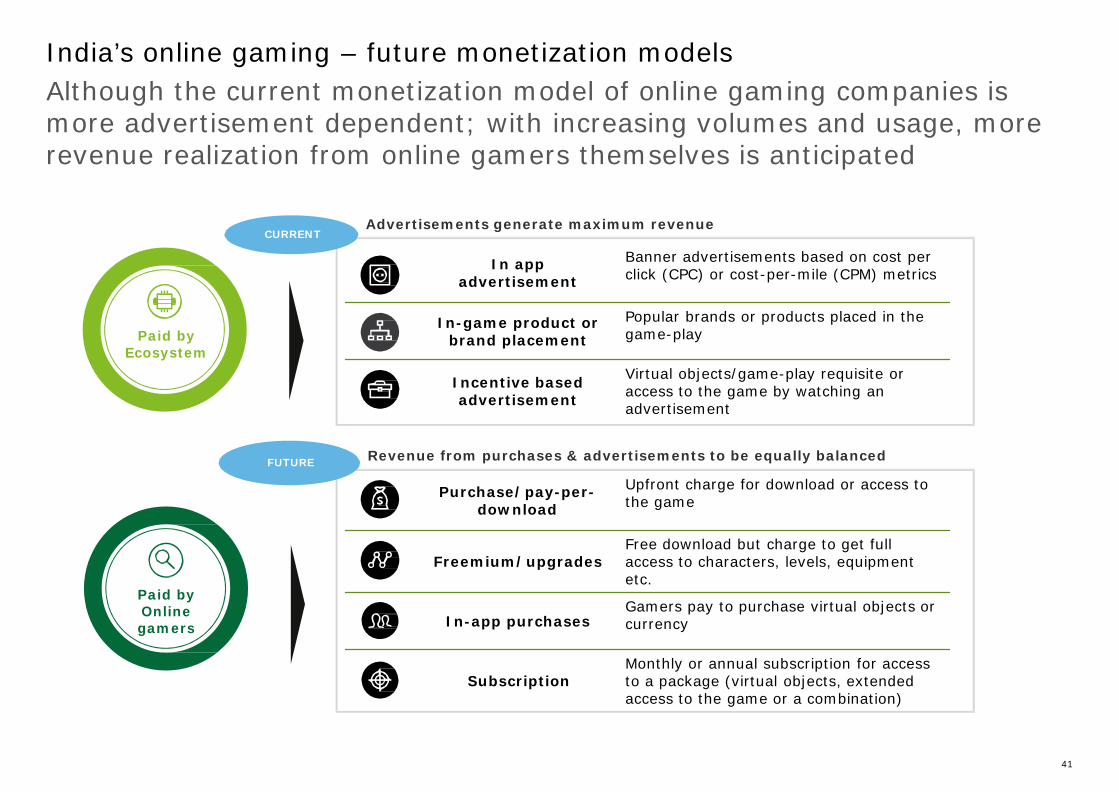
India’s online gaming – future monetization models
Although the current monetization model of online gaming companies is more advertisement dependent; with increasing volumes and usage, more revenue realization from online gamers themselves is anticipated
CURRENT Advertisements generate maximum revenue
Paid by Ecosystem
In app
advertisement In-game product or
brand placement
Incentive based advertisement
Banner advertisements based on cost per click (CPC) or cost-per-mile (CPM) metrics Popular brands or products placed in the game-play
Virtual objects/game-play requisite or access to the game by watching an advertisement
FUTURE Revenue from purchases & advertisements to be equally balanced
Purchase/pay-per- download
Upfront charge for download or access to the game
Paid by Online gamers
Freemium/upgrades
In-app purchases
Free download but charge to get full access to characters, levels, equipment etc.
Gamers pay to purchase virtual objects or currency
Subscription Monthly or annual subscription for access to a package (virtual objects, extended access to the game or a combination)
Thank you!
Jehil Thakkar
Head, Media & Entertainment
Partner, Deloitte Touche Tohmatsu India LLP
Related Documents