The Indian Media & Entertainment Industry 2016 Trends & Analysis - Past, Present & Future Chaitanya Chinchlikar Vice President – Whistling Woods International Vice President – Mukta Arts Ltd [email protected]

Welcome message from author
This document is posted to help you gain knowledge. Please leave a comment to let me know what you think about it! Share it to your friends and learn new things together.
Transcript

The Indian Media & Entertainment Industry
2016Trends & Analysis - Past, Present & Future
Chaitanya ChinchlikarVice President – Whistling Woods International
Vice President – Mukta Arts [email protected]
Source: FICCI-KPMG Report 2016
652728
821918
10261156
1314
1503
1723
1980
2261
0
400
800
1200
1600
2000
2400
2010 2011 2012 2013 2014 2015 2016 2017 2018 2019 2020
INR
Bill
ions
Indian M&E Industry
The Indian M&E Industry - High-volume, low-value.
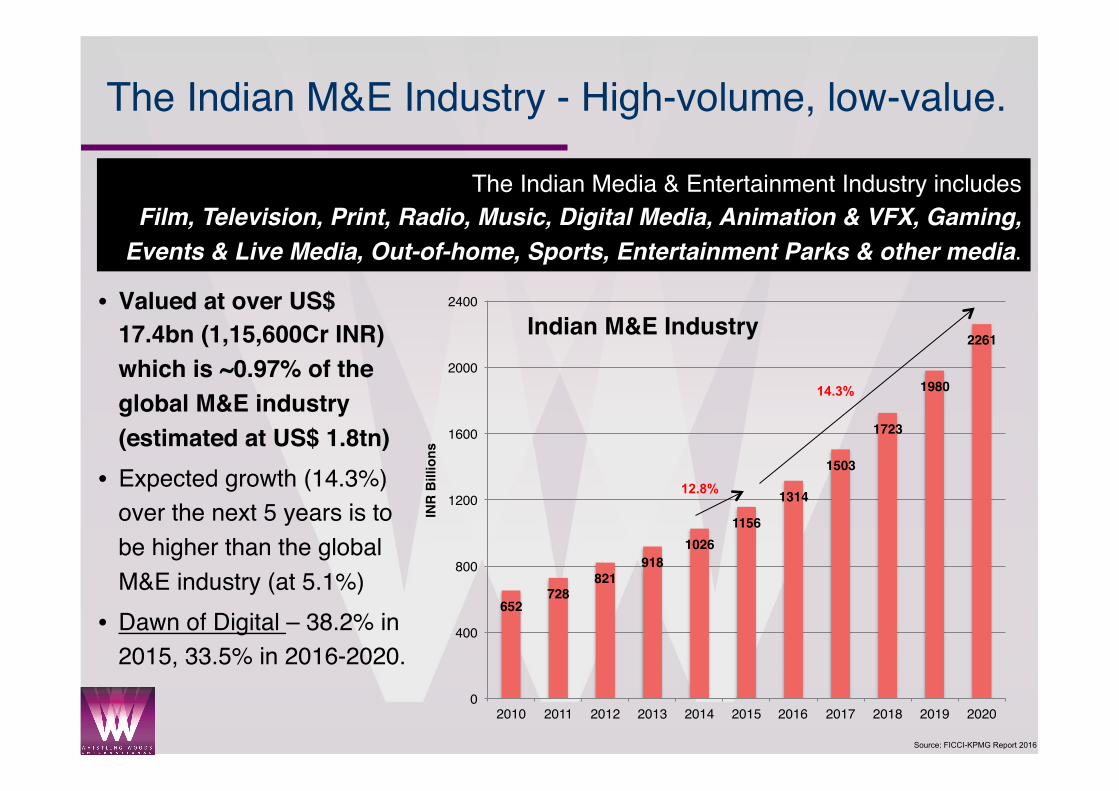
The Indian Media & Entertainment Industry includesFilm, Television, Print, Radio, Music, Digital Media, Animation & VFX, Gaming,
Events & Live Media, Out-of-home, Sports, Entertainment Parks & other media.
• Valued at over US$ 17.4bn (1,15,600Cr INR) which is ~0.97% of the global M&E industry (estimated at US$ 1.8tn)
• Expected growth (14.3%) over the next 5 years is to be higher than the global M&E industry (at 5.1%)
• Dawn of Digital – 38.2% in 2015, 33.5% in 2016-2020.
12.8%
14.3%

Source: FICCI-KPMG Report 2016
Indian M&E Industry – SOTP
0
500
1000
1500
2000
2010 2011 2012 2013 2014 2015 2016 2017 2018 2019 2020
297 329 370 417 475 542
617 710
823 957
1098
193 209
224 243
263
283
305
330
356
384
413
83 93
113 125
126
138
159
174
190
208
227
10
11
13
15
17
20
23
28
33
38
43
9
9
11
10
10
11
12
14
16
18
21
16
18
18
19
22
24
28
32
35
40
45
24
31
35
40
45
51
58
67
78
91
108
10
13
15
19
24
27
31
34
39
45
51
10 15
22
30
44
60
81
114
153
199
255
INR
Billio
ns
TV Print Film Radio Music OOH Animation & VFX Gaming Digital
All sections are growing. Some are growing faster than others

Source: FICCI-KPMG Report 2016
2010 2011 2012 2013 2014 2015 2016 2017 2018 2019 2020
46% 45% 45% 45% 46% 47% 47% 47% 48% 48% 49%
30% 29% 27% 26% 26% 24% 23% 22% 21% 19% 18%
13% 13% 14% 14% 12% 12% 12% 12% 11% 11% 10%
2% 2% 2% 2%
2% 2% 2%
2% 2%
2% 2%
1% 1% 1% 1%
1% 1% 1%
1% 1%
1% 1%
2% 2% 2% 2%
2% 2% 2%
2% 2%
2% 2%
4% 4% 4% 4%
4% 4% 4%
4% 5%
5% 5%
2% 2% 2% 2% 2% 2%
2% 2%
2% 2%
2%
2% 2% 3% 3% 4% 5% 6% 8% 9% 10% 11%
TV Print Motion Picture Radio Music OOH Animation & VFX Gaming Digital
Indian M&E Industry – Market-share

Source: FICCI-KPMG Report 2016
8393
113125 126
138
159174
190
208
227
0
50
100
150
200
250
2010 2011 2012 2013 2014 2015 2016 2017 2018 2019 2020
INR
Bill
ions
The Indian Film Industry• Largest in the world by
films produced with over 1,400 films produced & over 3.25bn tickets sold (~50% theatrical releases)
• At US$ 2.1bn, it is less than the BO of Avatar
• 2015 was heavily polarised wrt film performance.
• % of online ticketing grew by 5x from 6% to 32%
• Regional & Hollywood are growing domestic theatrical
9.3%
10.5%
Studios have started getting into content production through own productions & strategic alliances
(Reliance – Phantom, Fox – Dharma)

Source: FICCI-KPMG Report 2016
The Indian Film Industry = ‘Bollywood’While‘Bollywood’ is a generally used term to define the Indian Film industry, Hindi films accounted for only 16% of the 1,400+ films that were produced.
The South Indian Film industry accounts for almost 50% of the films
Language No of Films Hindi 234 Tamil 210
Telugu 218 Kannada 157
Malayalam 108 Bengali 139 Marathi 122 Gujrati 67
Bhojpuri 84 Punjabi 9 Others 78 Total 1,426

Source: FICCI-KPMG Report 2016
0%
20%
40%
60%
80%
100%
2011 2012 2013 2014 2015 2016 2017 2018 2019 2020
74% 76% 75% 74% 73% 73% 72% 72% 71% 70%
7% 7% 7% 7% 7% 7% 7% 7% 7% 7%
11% 11% 12% 12% 12% 11% 11% 11% 11% 11%
5% 5% 6% 7% 7% 8% 9% 10% 11% 11% IN
R B
illio
ns
Film Revenues % Breakdown
Domestic Theatrical Overseas Theatrical Home Video Cable & Satellite Rights Ancillary Revenues
Film Revenues BreakdownDomestic Revenues have always had a 90%+ market-share & expected to continue.
This is THE double-edged sword for the industry.
Proving the digital medium’s
dominance, Ancillary revenues as a % of total film
revenue will increase 1.5x over the next 5 years.Home Video, like in the rest of the
world, is dying out fast.
Source: FICCI-KPMG Report 2016
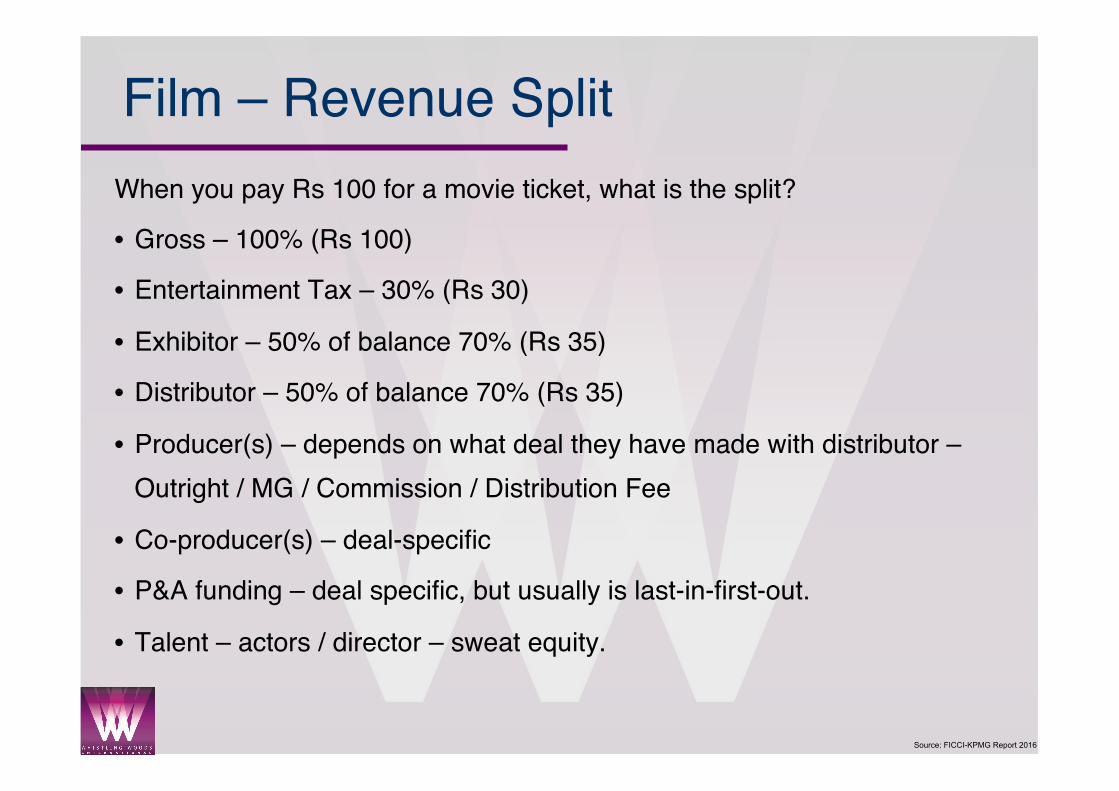
Film – Revenue SplitWhen you pay Rs 100 for a movie ticket, what is the split?
• Gross – 100% (Rs 100)
• Entertainment Tax – 30% (Rs 30)
• Exhibitor – 50% of balance 70% (Rs 35)
• Distributor – 50% of balance 70% (Rs 35)
• Producer(s) – depends on what deal they have made with distributor – Outright / MG / Commission / Distribution Fee
• Co-producer(s) – deal-specific
• P&A funding – deal specific, but usually is last-in-first-out.
• Talent – actors / director – sweat equity.

Source: FICCI-KPMG Report 2016
Exhibition needs to grow!• India has one of the lowest screen
densities among global film markets• Urgent & rapid infrastructure growth in
multiplex screens is needed• Since the Box office is not as robust as
other countries, government intervention is needed by way of SOPs.
126
85 82
61 57
2613
6
0
20
40
60
80
100
120
140Screens/Million
9,200
13,118
18,195
22,000 25,000
1,250 1,470 1,650 1,750 1,950
10,000 8,700 7,600 6,500 6,000
-
5,000
10,000
15,000
20,000
25,000
30,000
2011 2012 2013 2014 2015
Screens
Multiplex-China Multiplex-India SingleScreen-India
2.0
2.7
3.5
4.7
5.7
1.0 1.3 1.4 1.4 1.5
-
1.0
2.0
3.0
4.0
5.0
6.0
2011 2012 2013 2014 2015
Bill
ion
$
Domestic Box Office Size
China India
Source: FICCI-KPMG Report 2016
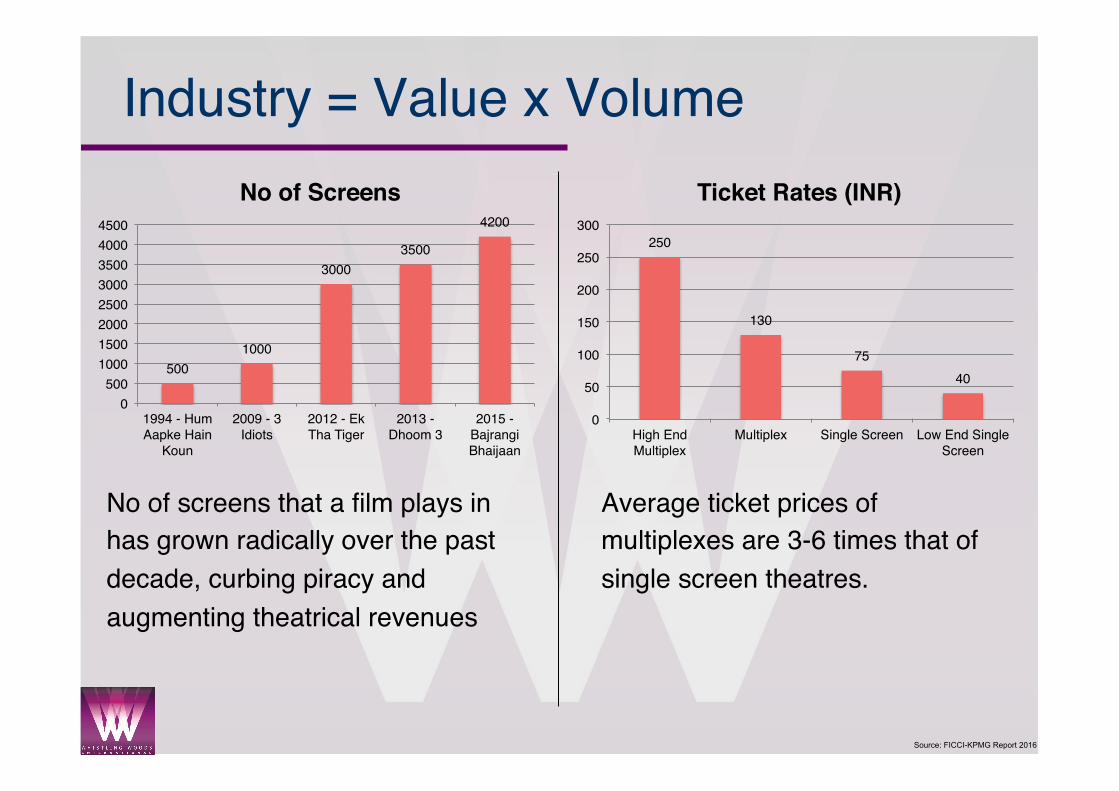
Industry = Value x Volume
No of screens that a film plays in has grown radically over the past decade, curbing piracy and augmenting theatrical revenues
Average ticket prices of multiplexes are 3-6 times that of single screen theatres.
5001000
30003500
4200
0500
10001500200025003000350040004500
1994 - Hum Aapke Hain
Koun
2009 - 3 Idiots
2012 - Ek Tha Tiger
2013 - Dhoom 3
2015 - Bajrangi Bhaijaan
No of Screens
250
130
7540
0
50
100
150
200
250
300
High End Multiplex
Multiplex Single Screen Low End Single Screen
Ticket Rates (INR)

Source: FICCI-KPMG Report 2016
The Indian Film Industry - Key points
• Realisation of the value of Film education. Scale needed. Urgently.• Digital gaining over C&S for release window.
• Regional shows its importance – Marathi, Gujarati, Punjabi
• Hollywood films account for less than 10% of the Indian Film industry.
• Share of Revenue from first week is highly critical (ranges from 55-75% of box office collections)
• Funding avenues grow significantly – Banks (IDBI, Exim, Kotak, YES), Film Funds, Crowd-funding.
• The industry lacks a globally merchandisable home-grown IP brand.
Source: FICCI-KPMG Report 2016
297329
370417
475542
617
710
823
957
1098
0
100
200
300
400
500
600
700
800
900
1000
1100
2010 2011 2012 2013 2014 2015 2016 2017 2018 2019 2020
INR
Bill
ions
TV
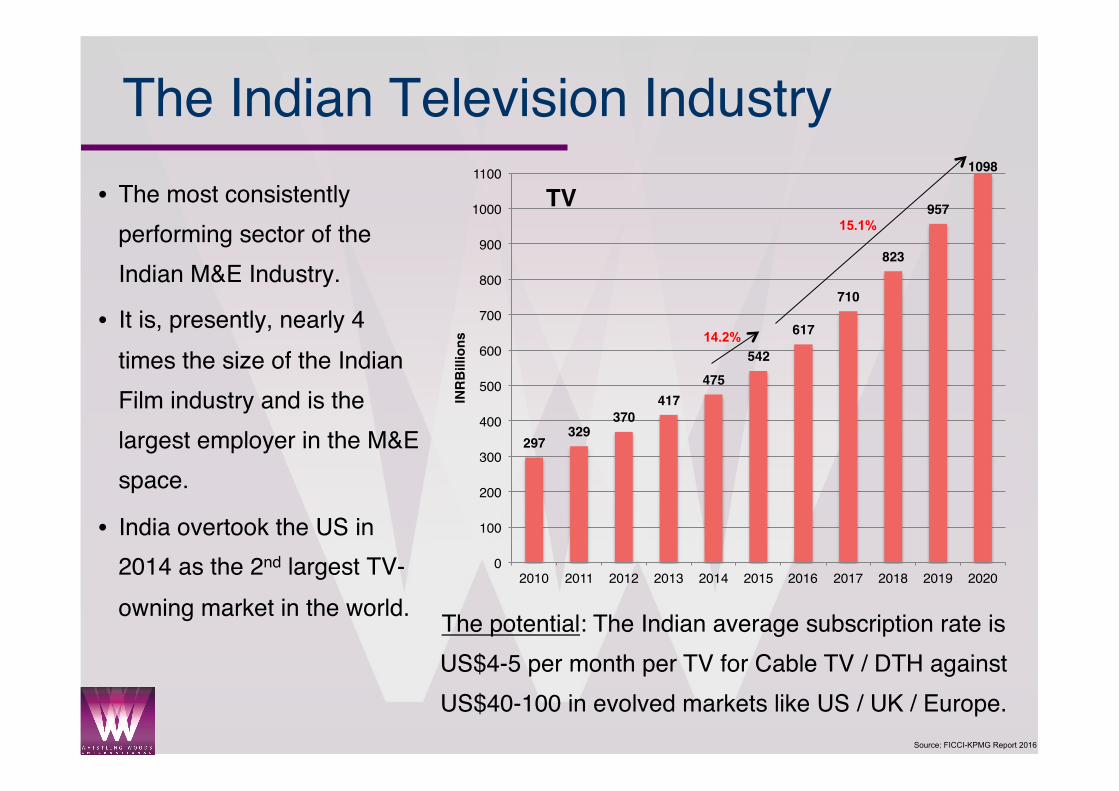
The Indian Television Industry• The most consistently
performing sector of the Indian M&E Industry.
• It is, presently, nearly 4 times the size of the Indian Film industry and is the largest employer in the M&E space.
• India overtook the US in 2014 as the 2nd largest TV-owning market in the world. The potential: The Indian average subscription rate is
US$4-5 per month per TV for Cable TV / DTH against US$40-100 in evolved markets like US / UK / Europe.
14.2%
15.1%
Source: FICCI-KPMG Report 2016
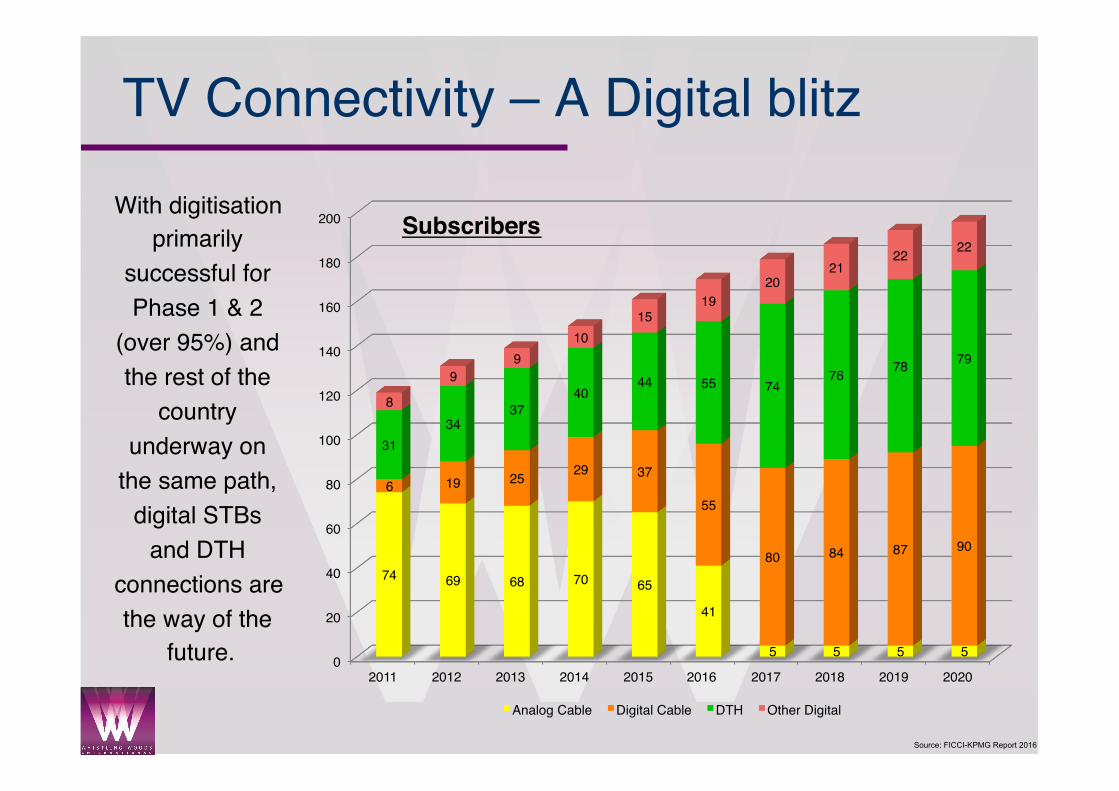
TV Connectivity – A Digital blitz
With digitisation primarily
successful for Phase 1 & 2
(over 95%) and the rest of the
country underway on
the same path, digital STBs
and DTH connections are the way of the
future. 0
20
40
60
80
100
120
140
160
180
200
2011 2012 2013 2014 2015 2016 2017 2018 2019 2020
74 69 68 70 65
41
5 5 5 5
6 19 25 29 37
55
80 84 87 90
3134
3740
44 55 7476 78 79
8
99
1015
1920
2122 22
Subscribers
Analog Cable Digital Cable DTH Other Digital

Source: FICCI-KPMG Report 2016
TV Connectivity, Channels, ARPUs
• India has added, on an avg 4.5 channels/month for the last 15 yrs.
• India has ~400 news channels. Channel differentiation is weak.
138
175200
71%
83% 87%
0
50
100
150
200
250
0%10%20%30%40%50%60%70%80%90%
100%
2010 2015 2020
TV Households& Penetration
248 258 266
299
334
367
214 219 230
261
298
343
150
200
250
300
350
400
2015 2016 2017 2018 2019 2020
ARPUs
DTH Digital Cable
5 55 130
263
550
800
0
100
200
300
400
500
600
700
800
900
1990 1995 2000 2005 2010 2015
Channels & Growth
TV households, C&S penetration & ARPUs are all expected to
grow over the next 5 years
Source: FICCI-KPMG Report 2016
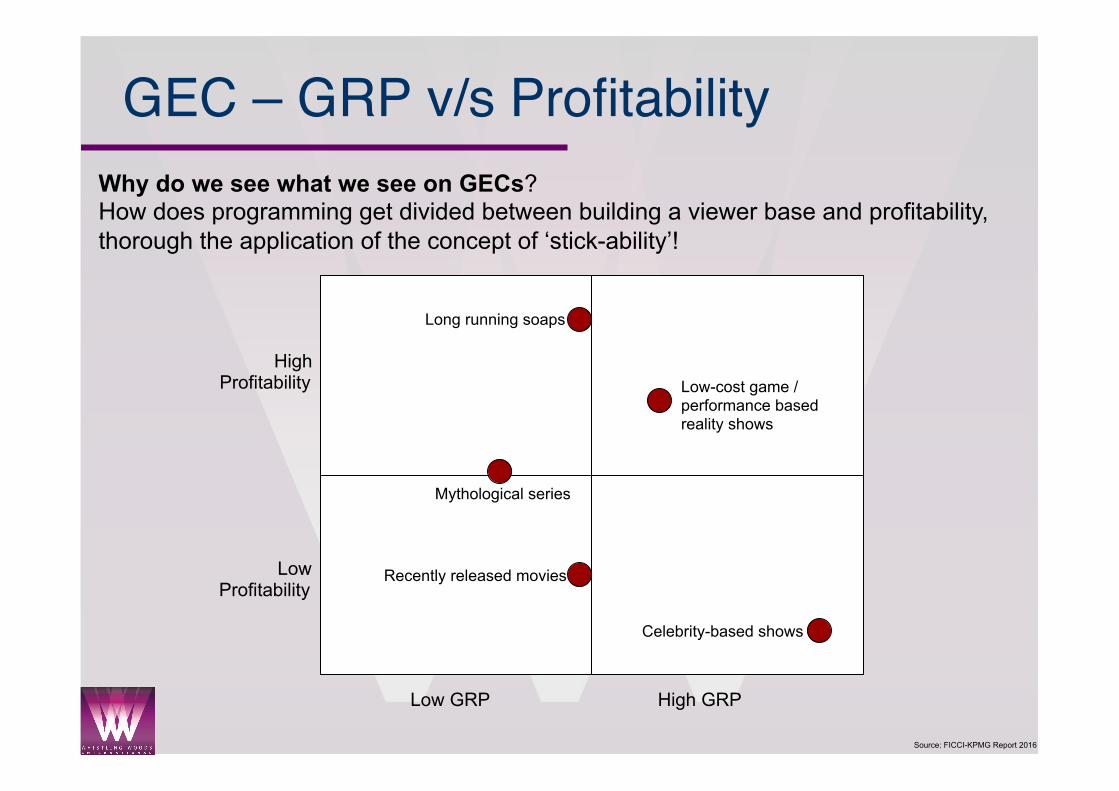
GEC – GRP v/s Profitability
Low GRP High GRP
Low Profitability
High Profitability
Long running soaps
Low-cost game / performance based reality shows
Mythological series
Recently released movies
Celebrity-based shows
Why do we see what we see on GECs? How does programming get divided between building a viewer base and profitability, thorough the application of the concept of ‘stick-ability’!

Source: FICCI-KPMG Report 2016
TV Revenues – Getting better, slowly!• High subscription revenue
growth expected to bring about innovative content / content for a niche audience.
• In 2015, of INR 360 billion paid by consumers, ONLY INR 86 billion reached the broadcasters, which is less than 25%. Underreporting of subscribers, carriage fees & lack of digitisation is the reason for this. 213 245 281 320 361 407 468
548637
733
47 57 69 75 86 100 118 145 174 203
22% 23%25% 23% 24% 25% 25%
26% 27% 28%
0%
5%
10%
15%
20%
25%
30%
0
100
200
300
400
500
600
700
800
2011 2012 2013 2014 2015 2016 2017 2018 2019 2020
INR
Bill
ions
Subscription Revenue
Paid by Consumers Recd by Broadcasters %
213 245 281320
361407
468548
637
733
116 125 136 155 181 210 242 276320
365
0
100
200
300
400
500
600
700
800
2011 2012 2013 2014 2015 2016 2017 2018 2019 2020
INR
Bili
ons
TV Revenues - Split & Growth
Subscription Revenue Advertising Revenue

Source: FICCI-KPMG Report 2016
Viewership & Ad-Revenue – Disparity!
View Ad Rev Regional GEC 29.6% 15.9% Hindi GEC 28.4% 27.5% Hindi Movies 13.4% 6.7% Regional Movies 6.6% 2.8% Kids 5.6% 3.8% Regional News 3.5% 8.3% Hindi News 3.0% 8.4% Regional Music 2.7% 1.4% Music 2.6% 3.0% Sports 2.1% 4.3% Infotainment 1.1% 2.0% English Entertainment 0.5% 4.6% English News 0.0% 5.0% Others 0.9% 6.3%
100.0% 100.0%
• Regional GECs break the Hindi GEC glass ceiling in viewership.
• Regional / Kids channels highly under-indexed
• Hindi movies under-indexed on account of changed release window – TV vs digital.
• News, Sports, English enjoy severe over-indexing

Source: FICCI-KPMG Report 2016
Indian Animation picks up• Broadcasters are willing to pay over
double for good quality Indian Animated content as compared to daily soaps / Hindi general entertainment content, even though this segment gets only 5.6% of the viewership, as compared to 28.4% for Hindi GECs.
• Also the fact that this segment continues to be under-indexed, with only 3.8% ad-revenue share doesn’t bother broadcasters as this content has long-tail revenue
• It offers repeat viewing value, multi-language dubbing value and merchandising value.

Source: FICCI-KPMG Report 2016
Hindi GEC Fiction content changing. Slowly.
• GECs have finally embraced the tele-series format with season-based programming
• The value:volume ratio is reversed in such programming as compared to the daily / weekly soaps.
• For the past 20-odd years, the content has largely mirrored American programming of the 70s-80s, with our soaps comparable to content like the Bold & The Beautiful, Santa Barbara, Dallas, etc.

Source: FICCI-KPMG Report 2016
TV – Key Points• Digitisation – increased revenue for the broadcaster, should lead to
more investment in content (& hence better quality content)• Global proliferation of Indian-origin content is increasing, albeit for
the Indian diaspora only. This is THE BIG opportunity.• Indian animation on TV is starting to matter.
• Hindi GECs are exploring new content programming & a changed value:volume mix in revenue models.
• Lack of quality viewership measurement systems is an issue. Hopefully, BARC should resolve this.
• Targeted advertising is the next step
Source: FICCI-KPMG Report 2016
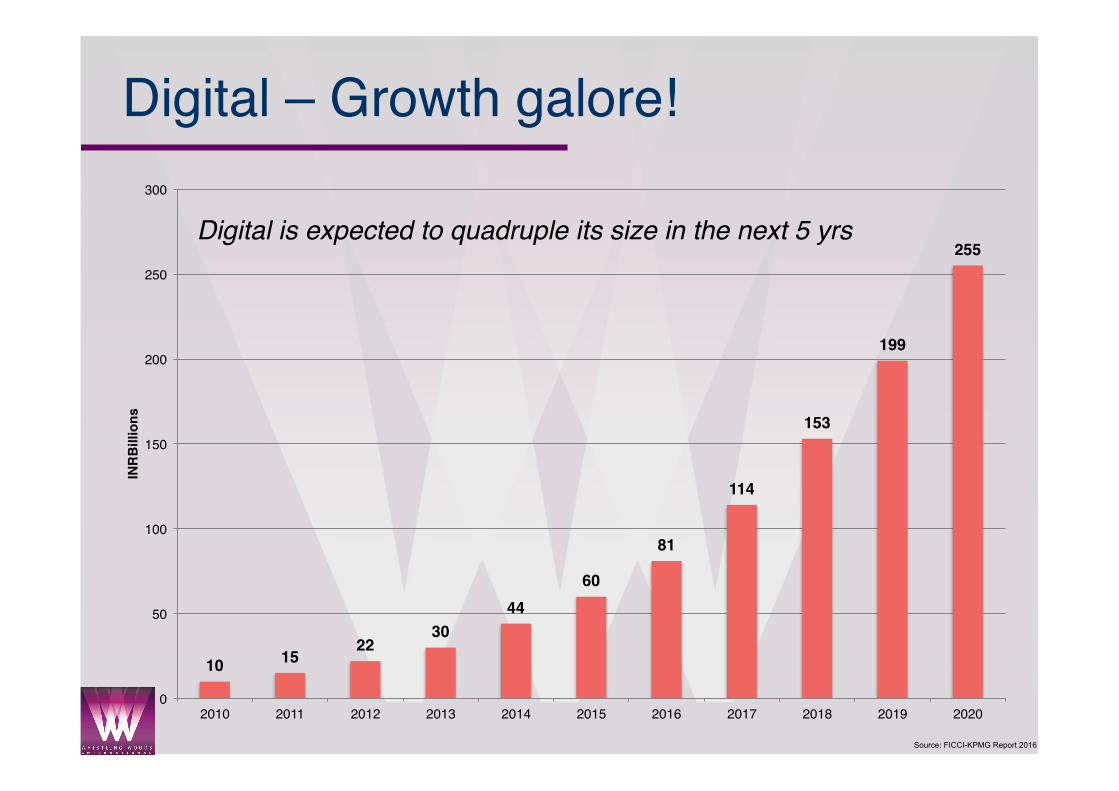
Digital – Growth galore!
10 1522
3044
60
81
114
153
199
255
0
50
100
150
200
250
300
2010 2011 2012 2013 2014 2015 2016 2017 2018 2019 2020
INR
Bill
ions
Digital is expected to quadruple its size in the next 5 yrs

Source: FICCI-KPMG Report 2016
Telecom Base – Volume galore!
Tele-Density: 81.83 Urban: 153.45, Rural: 49.94
AsofDecember2015
TelecomServiceProviders
Ac0vesubscribers
Bhar3Airtel 243,289,404Vodafone 193,600,085
IDEA 171,912,608Reliance 100,890,431
Aircel 85,632,249BSNL 82,507,640Tata 60,727,856
Telenor 50,702,396Sistema 8,006,814
Videocon 6,958,178MTNL 3,614,439
Quadrant 3,047,100TOTAL 1,010,889,200
What’s coming?

Source: FICCI-KPMG Report 2016
Digital – global comparison!
• India has the lowest net penetration among all developing countries and much lower than the developed ones.
• Despite that, India has more internet users than the US.
19%
53%46%
60%
87% 90% 86%
0%10%20%30%40%50%60%70%80%90%
100%
India Brazil China Russia USA UK Japan
Internet Penetration
Avg Broadband speed % of connections > 4MBPS 2014 2015 2014 2015
South Korea 25.3 20.5 96% 96% Hong Kong 16.3 15.8 89% 92%
Japan 15.0 15.0 87% 90% Singapore 12.2 12.5 83% 87%
Taiwan 9.5 10.1 78% 88% New Zealand 7.0 8.7 77% 87%
Thailand 6.6 8.2 85% 93% Australia 6.9 7.8 66% 72% Malaysia 4.1 4.9 39% 53%
China 3.8 3.7 34% 33% Indonesia 3.7 3.0 35% 17%
Vietnam 2.5 3.4 14% 31% Philippines 2.5 2.8 9% 10%
India 2.0 2.5 7% 14%
Source: FICCI-KPMG Report 2016
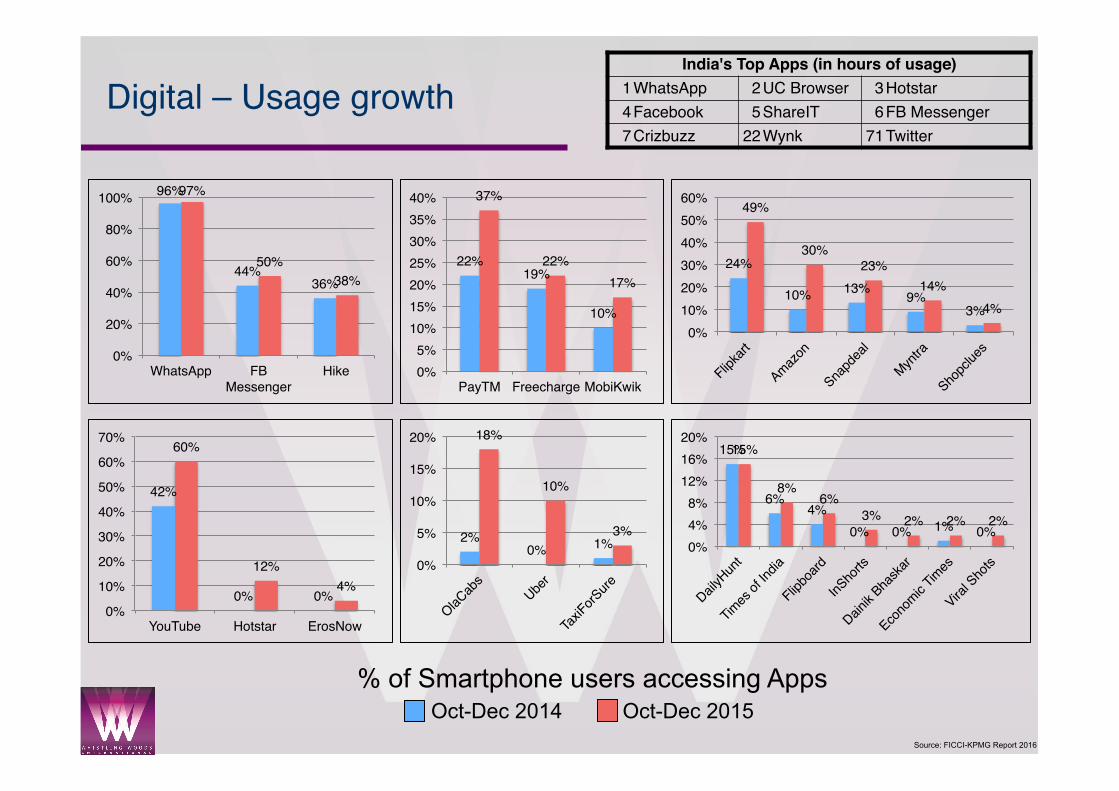
Digital – Usage growthIndia's Top Apps (in hours of usage)
1WhatsApp 2UC Browser 3Hotstar4Facebook 5ShareIT 6FB Messenger7Crizbuzz 22Wynk 71Twitter
96%
44%36%
97%
50%38%
0%
20%
40%
60%
80%
100%
WhatsApp FB Messenger
Hike
% of Smartphone users accessing Apps Oct-Dec 2014 Oct-Dec 2015
22%19%
10%
37%
22%17%
0%5%
10%15%20%25%30%35%40%
PayTM Freecharge MobiKwik
2%0% 1%
18%
10%
3%
0%
5%
10%
15%
20%
24%
10% 13% 9%3%
49%
30%23%
14%4%
0%10%20%30%40%50%60%
42%
0% 0%
60%
12%4%
0%
10%
20%
30%
40%
50%
60%
70%
YouTube Hotstar ErosNow
15%
6%4%
0% 0% 1% 0%
15%
8%6%
3% 2% 2% 2%
0%4%8%
12%16%20%

Source: FICCI-KPMG Report 2016
The Digital Business – A BLITZ of growth!
0
100
200
300
400
500
600
700
800
2015 2016 2017 2018 2019 2020
21 23 25 28 30 33
311388
470564
671
792
Mili
ons
of U
sers
Internet Users
Wired Wireless
51.1 64.9 85.2 107.3 129.5 153.19
16.228.4
46
69.8
102.1
0.0
50.0
100.0
150.0
200.0
250.0
300.0
2015 2016 2017 2018 2019 2020
INR
Bill
ions
Digital Advertising
Web Mobile
0100200300400500600700800900
1000
2014 2015 2016 2017 2018 2019
825 857 886 913 938 960
281348
420494
570640
Mill
ions
of U
sers
TV Internet
18%
050
100150200250300350400450500
2015 2016 2017 2018 2019 2020
173232
286342
399457
116
188249
299
369435
Mill
ions
of U
sers
Net on Mobile Smartphones

Source: FICCI-KPMG Report 2016
All the major global digital platforms are already here

Source: FICCI-KPMG Report 2016
Indian Digital Platforms

Source: FICCI-KPMG Report 2016
Digital – Key Points• The Digital platforms of web, mobile & web-connected smart TVs
are the present & the future.
• Content consumption modes & patterns are already starting to change with a large number of under-18-yr-olds finding their ‘stars’ online.
• YouTube is taking the Indian market very seriously and has set up a ‘YouTube space’ in India, in partnership with Whistling Woods International.
• Most TV networks & some film companies are seriously investing in app & web-based OTT platforms.

Source: FICCI-KPMG Report 2016
2431
3540
4551
58
67
78
91
0
10
20
30
40
50
60
70
80
90
100
2010 2011 2012 2013 2014 2015 2016 2017 2018 2019 2020
INR
Bill
ions
Animation, VFX & Post-Production• The industry has shown growth on
the back of strong VFX / post-prodn growth, but Animation has not grown as much.
• Lack of original IP creation is a major reason of the plateau-ing of the Animation industry.
16.1%
13.8%
1
2 2
4
6
1
4
1
5
3 3
00
1
2
3
4
5
6
7
2000 2005 2006 2007 2008 2009 2010 2011 2012 2013 2014 2015
Animated Films Released Theatrically
2014
2015

Source: FICCI-KPMG Report 2016
23% 22% 20% 18% 16% 15% 14% 13% 12% 12%
14% 13% 12% 11% 11% 10% 10% 9% 8% 8%
20% 22% 23% 25% 28% 31% 34% 36% 39% 42%
44% 44% 45% 45% 45% 44% 43% 41% 40% 39%
0%10%20%30%40%50%60%70%80%90%
100%
2011 2012 2013 2014 2015 2016 2017 2018 2019 2020
Animation Services Animation Product Creation VFX Post-Prodn
Animation, VFX & Post-Production• Even though all areas of the industry are growing, the growth is disparate between Animation & VFX / post-prodn.• From a 65:35 ratio in 2011, the sub-segments reach a 80:20 ratio in 2020.
7.1 7.6 8.0 8.1 8.3 8.8 9.5 10.4 11.4 12.5 4.2 4.5 4.7 5.1 5.6 6.0 6.5 7.0 7.6 8.4 6.2 7.7 9.3 11.3 14.4 18.0 22.5 28.4 35.8
45.1
13.5 15.5 17.7 20.4 22.8
25.5 28.6
32.3
36.5
42.0
-
20.0
40.0
60.0
80.0
100.0
120.0
INR
Bill
ions

Source: FICCI-KPMG Report 2016
Animation on Indian ScreensWhile, only 3 out of the top 10 characters on Indian TV are of Indian
origin, 7 out of the top 10 episodes are for Indian shows

Source: FICCI-KPMG Report 2016
1013
1519
2427
3134
39
45
51
0
5
10
15
20
25
30
35
40
45
50
55
2010 2011 2012 2013 2014 2015 2016 2017 2018 2019 2020
INR
Bill
ions
Gaming
Gaming• Grew over 20%, on the back of
mobile gaming.• With 1bn+ users, increasing travel
time & a young population, India is one of the fastest growing mobile gaming markets in the world
13.9%
46% 49% 51% 52% 55% 57%
39% 35% 32% 30% 28% 26%
15% 16% 17% 18% 18% 17%
0%10%20%30%40%50%60%70%80%90%
100%
2014 2015 2016 2017 2018 2019
Mobile Console PC & Online
12.8%

Source: FICCI-KPMG Report 2016
9 9
1110 10
1112
14
16
18
21
0
2
4
6
8
10
12
14
16
18
20
22
2010 2011 2012 2013 2014 2015 2016 2017 2018 2019 2020
INR
Bill
ions
Music• The Music industry shows
growth for the first time in 3 years.
• Over 50% of Indian web users access unlicensed content.
• Music-on-cloud is expected to gather steam as it rides the 3G/4G wave to deliver streamed music, ad supported, free of cost as well as ‘freemium’ music, hopefully denting piracy.
13.8%
10.2%

Source: FICCI-KPMG Report 2016
Music - Consumption• The consumption % reversed
from 2010 to 2015 between physical & digital.
• Films fuel over 80% of the Music industry (Not good!)
• Indian non-film music (Indie / pop / rock / regional) is struggling, with only Religious & Indian Classical music managing to survive.
• Very little structured music education & training
81.0%
10.0%4.0%2.2% 2.8% Music Consumption
by Genre
Bollywood
International
South Indian
Punjabi
Others
58%
33%
6%3%
20%
55%
15%10%
0%
10%
20%
30%
40%
50%
60%
70%
Physical Digital TV & Radio Public Performance
Music Consumptionby Source
20102015

Source: FICCI-KPMG Report 2016
10 1113
1517
2023
28
33
38
43
0
5
10
15
20
25
30
35
40
45
2010 2011 2012 2013 2014 2015 2016 2017 2018 2019 2020
INR
Bill
ions
Radio
Radio• The growth in 2015 has been built
around increased ad revenue from politics, entertainment, real estate & e-commerce.
• The shift to radio is as it is a cost-effective advertising vehicle, as compared to TV.
16.9%
15.3%

Source: FICCI-KPMG Report 2016
Sports• With the ‘private’ sports
leagues being taxed on lines similar to live entertainment, the line between sports and entertainment has blurred.
• Sports is one of the largest content providers to the broadcast, live events & digital industries.
• Female viewership was at an unprecedented 35-38%, rural viewership at 45%, in 2015.
Inve
stm
ent
IPL
Rea
ch
Investment
ISL
PKL
IPTL PWL
IBL
UBA
HIL
Star SportsINR 200 billion
Sony SixINR 192 billion
Ten SportsINR 6 million
Neo SportsINR 120 million
Source: FICCI-KPMG Report 2016
Live Events• Yet to be ‘organised’
• Growth of ~20%
• Margin growth not as much
• Government spending (elections / events)
• Licensing issues
• Taxation issues
• Live IP-based entertainment on the rise:
o Stand up Comedy
o Theatre

Source: FICCI-KPMG Report 2016
Theme Parks• Emerging area• Destination
entertainment (non-natural-tourism based) yet to consolidate in India
• Evolution:o 1980 – Appu Gharo 1990 – Esselworldo 2010 – Imagica &
Wonderlao 2015 – INR 300 bn+
investment committedo Over next 5 yrs, 19%
CAGR.

Source: FICCI-KPMG Report 2016
Jobs in M&E• As per the NSDC, by 2022, the
Media & Entertainment industry would be requiring 12.5 lakh professionals, ~85% of these in the Film, TV & digtial verticals.
• The media industry as a whole still lacks sufficient world-class training facilities to enable professionalism and best practices.
• Significant government-intervention and private investments will be needed to correct this imbalance
1.60 2.40
4.40
1.40
2.80
6.40
0.60 0.70
1.30
0.20 0.30 0.40 0.20 0.30 0.40
-
1.00
2.00
3.00
4.00
5.00
6.00
7.00
2014 2017 2022
EmploymentGrowth
Film
TV
Radio
Animation, VFX, Gaming

Source: FICCI-KPMG Report 2016
Key Disruptions in 2015 / Trends for 2016
• ANALYTICS – Audience Analytics, Operations Analytics, Event Driven Analytics, Predictive Analytics, Campaign Analytics
• Film – 4k, Digital Rights, Immersive, VR / AR
• TV – 2nd/3rd screen, Targeted Advertising, Interactivity
• Animation & VFX – 3D printing, non-photorealistic rendering, VR / AR
• Advertising – Cross platform, Targeted, Programmatic buying
• Music – Predictive analytics
• Radio – Online platforms
• OOH – Watcher Analytics, Interactivity

Source: FICCI-KPMG Report 2016
What are the pain-points of the Indian M&E Industry?
• Lack of original Intellectual Property creation leading to lack of a globally merchandisable brand.
• M&E Education & Training o Of the 4 lakh people employed, nearly 75% involved in content creation have
no formal training.
o Very few world-class Film & Media institutes with a combined output of approx 500 graduates a year, with 200 of them being from a single institute.
• Innovation – we are followers, not leaders when it comes to formats or technical / narrative innovation.
• Piracy - Affects every sector of the industry & causes nearly 35% revenue reduction
Source: FICCI-KPMG Report 2016
The Great Opportunities in M&E
In the M&E industry, building volume is hard. India already has the volume. We now need to build value to each unit of the already
existing volume. This is done by enhancing quality. The best way to build quality is be educating & training the industry.
The big opportunities in M&E are:
• Screens for Film
• Digital platforms
• Education in M&E
• IP creation – 360deg

Related Documents