Applied Psychophysiology and Biofeedback, Vol. 25, No. 2, 2000 The Incremental Validity of Lumbar Surface EMG, Behavioral Observation, and a Symptom Checklist in the Assessment of Patients with Chronic Low-Back Pain Kenneth R. Lofland, 1,5 Jeffrey E. Cassisi, 2,5 Jennifer B. Levin, 3 Nancy L. Palumbo, 4 and E. Richard Blonsky 1 This study evaluated the comparative ability of lumbar surface EMG, behavioral obser- vation, and a symptom checklist to correctly classify three groups of participants, (1) 18 patients with chronic low-back pain (CLBP), demonstrating excessive and/or anatomically inconsistent motor, sensory, and tenderness responses during a neurological examination, (2) 33 patients with CLBP exhibiting few or no inconsistent responses, and (3) 30 healthy matched controls. Discriminant analyses were used to develop predictive models. Correct classification rates for the individual assessments and all combinations of assessments were contrasted. Each modality predicted group membership significantly better than weighted chance (23%), with the symptom checklist approach having the highest indi- vidual correct classification rate (64%). The best combination of modalities was the symp- tom checklist and lumbar surface EMG (70% correct classification rate). The sensitivity and specificity of the individual assessments and all combinations of assessments are also presented. KEY WORDS: classification of pain; low back pain; nonorganic signs; somatic amplification; somatoform disorder. INTRODUCTION Chronic back pain (CBP) is one of the most common and disabling medical condi- tions reported in industrialized countries (Cavanough & Weinstein, 1994). CBP is the most frequent cause of activity limitation in people below the age of 45 years, the second ranked reason for physicians’ visits, the third most frequent cause for surgical procedures, and at an estimated cost of over $50 billion per year, CBP is one of the most expensive health 1 Pain and Rehabilitation Clinic of Chicago, Illinois 60610. 2 Jackson State University, Jackson, Mississippi 39217-0350. 3 Geha Psychiatric Hospital, Petah Tikva, Israel. 4 HealthSouth, 1 Parkway Center North, Deerfield, Illinois 60015. 5 Address all correspondence to Jeffrey E. Cassisi, Department of Psychology, Jackson State University, P.O. Box 17550, Jackson, Mississippi 39217-0350, or Kenneth R. Lofland, Pain and Rehabilitation Clinic of Chicago, 640 N. LaSalle, Suite 610, Chicago, Illinois 60610. 67 1090-0586/00/0600-0067$18.00/0 C 2000 Plenum Publishing Corporation

Welcome message from author
This document is posted to help you gain knowledge. Please leave a comment to let me know what you think about it! Share it to your friends and learn new things together.
Transcript
P1: FQJ,FTK
Applied Psychophysiology and Biofeedback [apb] PL129-76 June 7, 2000 14:6 Style file version Nov. 19th, 1999
Applied Psychophysiology and Biofeedback, Vol. 25, No. 2, 2000
The Incremental Validity of Lumbar Surface EMG,Behavioral Observation, and a Symptom Checklist inthe Assessment of Patients with Chronic Low-Back Pain
Kenneth R. Lofland,1,5 Jeffrey E. Cassisi,2,5 Jennifer B. Levin,3 Nancy L. Palumbo,4
and E. Richard Blonsky1
This study evaluated the comparative ability of lumbar surface EMG, behavioral obser-vation, and a symptom checklist to correctly classify three groups of participants, (1) 18patients with chronic low-back pain (CLBP), demonstrating excessive and/or anatomicallyinconsistent motor, sensory, and tenderness responses during a neurological examination,(2) 33 patients with CLBP exhibiting few or no inconsistent responses, and (3) 30 healthymatched controls. Discriminant analyses were used to develop predictive models. Correctclassification rates for the individual assessments and all combinations of assessmentswere contrasted. Each modality predicted group membership significantly better thanweighted chance (23%), with the symptom checklist approach having the highest indi-vidual correct classification rate (64%). The best combination of modalities was the symp-tom checklist and lumbar surface EMG (70% correct classification rate). The sensitivityand specificity of the individual assessments and all combinations of assessments are alsopresented.
KEY WORDS: classification of pain; low back pain; nonorganic signs; somatic amplification; somatoformdisorder.
INTRODUCTION
Chronic back pain (CBP) is one of the most common and disabling medical condi-tions reported in industrialized countries (Cavanough & Weinstein, 1994). CBP is the mostfrequent cause of activity limitation in people below the age of 45 years, the second rankedreason for physicians’ visits, the third most frequent cause for surgical procedures, and atan estimated cost of over $50 billion per year, CBP is one of the most expensive health
1Pain and Rehabilitation Clinic of Chicago, Illinois 60610.2Jackson State University, Jackson, Mississippi 39217-0350.3Geha Psychiatric Hospital, Petah Tikva, Israel.4HealthSouth, 1 Parkway Center North, Deerfield, Illinois 60015.5Address all correspondence to Jeffrey E. Cassisi, Department of Psychology, Jackson State University, P.O. Box17550, Jackson, Mississippi 39217-0350, or Kenneth R. Lofland, Pain and Rehabilitation Clinic of Chicago,640 N. LaSalle, Suite 610, Chicago, Illinois 60610.
67
1090-0586/00/0600-0067$18.00/0C© 2000 Plenum Publishing Corporation
P1: FQJ,FTK
Applied Psychophysiology and Biofeedback [apb] PL129-76 June 7, 2000 14:6 Style file version Nov. 19th, 1999
68 Lofland, Cassisi, Levin, Palumbo, and Blonsky
disorders in the U.S. (Cavanough & Weinstein, 1994; Deyo, Cherkin, Conrad, & Volinn,1991; Hazard, Haugh, Reid, Preble, & McDonald 1996; Lawrence & McLemore, 1983;Wiesel, Feffer, & Rothman, 1985).
The frequency and impact of chronic low-back pain (CLBP) are increasing as arelongevity and the average age of the work force (Deyo, 1993; Sypert, 1987). Fordyce(1988) observed that disability due to low-back pain increased at a rate 14 times fasterthan the U.S. population between 1957 and 1976. The rising rate of disability is a seriousproblem when considering that current methods of assessing back pain do not determine aclear cause for as many as 85% of back pain episodes (Long et al., 1996; White & Gordon,1982). Given the increased focus on cost containment in health care and the clear need forimproved assessments, investigating new approaches to CLBP evaluation is warranted.
Patients with CLBP who have symptoms inconsistent with physical findings generallyreceive a diagnosis of one of the somatoform disorders (American Psychiatric Association,1994). Although these disorders vary, they have a common characteristic of symptoms thatare out of proportion to the identified etiology. However, other than the fact that the symp-toms must not be intentionally produced or feigned as in malingering, little guidance isprovided by the DSM-IV regarding how to assess for out-of-proportion symptoms. As aresult, a diagnosis is typically made only after ruling out known medical conditions. Thisdiagnostic approach based on exclusion is not satisfactory because (1) patients who suf-fer from unknown or difficult to diagnose conditions may be diagnosed inappropriately ashaving a somatoform disorder, and (2) those with somatoform disorders endure numerousunnecessary and expensive procedures before obtaining a diagnosis. Therefore, the devel-opment of independent, objective measures of symptom excess is necessary to advance thediagnostic accuracy of this class of disorders.
There are several different measurement approaches used in the psychological assess-ment of CLBP. A tripartite approach suggests combining psychophysiological, behavioral,and self-report methods (Cone & Hawkins, 1977). The relative effectiveness of these dif-ferent methods in the assessment of symptom excess, used alone and in combination, hasnot been explicitly studied. Understanding the incremental validity of each measure in anassessment protocol leads to the development of an optimal battery (Garb, 1984). Often,modalities are combined in clinical practice under the principle of “more is better.” How-ever, adding instruments to an assessment battery may not significantly increase its accuracy(Ben-Porath, McCully, & Almagor, 1993). This study suggests an approach to identify anoptimal assessment battery to classify patients with CLBP into subgroups based on theirlevel of symptom excess. Identifying such a battery of tests to assess symptom excess shouldimprove the diagnostic accuracy of the somatoform disorders in patients with CLBP. Fur-ther, it is proposed that improving the accuracy of diagnosing somatoform disorders mayreduce medical expenses by decreasing extensive and unnecessary evaluation procedures.
The first step in developing an assessment battery is determining what single measure touse within each of the selected assessment modalities (e.g., psychophysiological, behavioral,self-report). The most common psychophysiological method used in the evaluation of CLBPis lumbar surface electromyography (EMG). There are several approaches to evaluatingparaspinal EMG [e.g., during rest, static exertion, dynamic exertion, flexion, extension,using total scores, comparing left–right differences, combined approaches (Kasman, Cram,& Wolf, 1998; Lofland, Mumby, Cassisi, Palumbo, & Camic, 1995)]. The traditional musclespasm model states that resting paraspinal EMG levels are higher for CLBP patients than
P1: FQJ,FTK
Applied Psychophysiology and Biofeedback [apb] PL129-76 June 7, 2000 14:6 Style file version Nov. 19th, 1999
Incremental Validity of Pain Assessment 69
for pain-free controls (Collins, Cohen, Naliboff, & Schandler, 1982). Although other studiesdo not support this theory (see Nouwen & Bush, 1984), the muscle spasm model remainsinfluential as it guides much biofeedback treatment practice (see Cram, 1990).
Various behavioral observation approaches have been developed in the evaluationof CLBP. The most frequently cited approach has been the one originally described byKeefe and Block (1982), which results in a total score of pain behaviors observed. Severalinvestigators have found relationships between the number of pain behaviors and disabilitystatus, financial compensation, and litigation status (Keefe, Crisson, Maltbie, Bradley, &Gil, 1986; Keefe, Wilkins, & Cook, 1984). However, previous studies have been largelyatheoretical regarding the meaning of patient groups displaying high frequencies of painbehaviors (see Keefe, Bradley, & Crisson, 1990).
Dozens of self-report instruments have been developed to evaluate CLBP patients.Physical symptom checklists are commonly used with the rationale being that patients whoreport high levels of complaints across multiple organ systems are exhibiting symptom ex-cess (Wahler, 1983). Patients diagnosed with musculoskeletal pain and receiving workers’compensation benefits report significantly more physical symptoms than other CLBP sub-groups (Cassisi, Sypert, Lagana, Friedman, & Robinson, 1993). This finding suggests thatself-reported physical complaints vary within the CLBP population and that evaluating thenumber and extent of physical complaints may help identify differing levels of symptomexcess.
The primary challenge in refining measures of symptom excess is determining an ac-ceptable criterion measure. Rudy, Turk, and Brena (1988) surveyed 75 physicians special-izing in the treatment of chronic pain to determine the value of various medical proceduresused to diagnose back pain. These specialists rated the neurological examination as the mostuseful procedure. Therefore, a standardized neurological examination designed to assesssymptom excess would provide a reasonable criterion measure that would be accepted byexperts in the field.
Fortunately, two such examination procedures have been developed. Waddell,McCulloch, Kummel, and Venner (1980) described a neurological examination to helpidentify what they called “nonorganic” signs. These signs are exaggerated and anatom-ically inconsistent sensory, motor, and pain responses exhibited during the examination.Korbon, DeGood, Schroeder, Schwartz, and Shutty (1987) later modified and extendedWaddell’s original work in an effort to improve the scoring and psychometric properties ofthe procedure. Korbon et al. (1987) called their approach the Somatic Amplification RatingScale (SARS). For them, the signs were indicators of “somatic amplification,” followingthe innovative theory on somatic styles by Barsky and Klerman (1983).
To summarize, this study investigated the relative effectiveness of representative mea-sures from psychophysiological, behavioral, and self-report domains to classify patientsinto High and Low Symptom Excess groups. The incremental validity of each of theseassessment approaches across all combinations was then evaluated, and the sensitivity andspecificity were determined (see Wiggins, 1980).
A neurological examination, the SARS, was used as the criterion measure in the presentstudy to divide the patients into High and Low Symptom Excess groups. The term, symptomexcess, is used throughout this paper rather thansomatic amplificationor nonorganic signs,because it is felt to be more theoretically neutral and relevant to current DSM-IV diagnosticpractices.
P1: FQJ,FTK
Applied Psychophysiology and Biofeedback [apb] PL129-76 June 7, 2000 14:6 Style file version Nov. 19th, 1999
70 Lofland, Cassisi, Levin, Palumbo, and Blonsky
METHOD
Participants
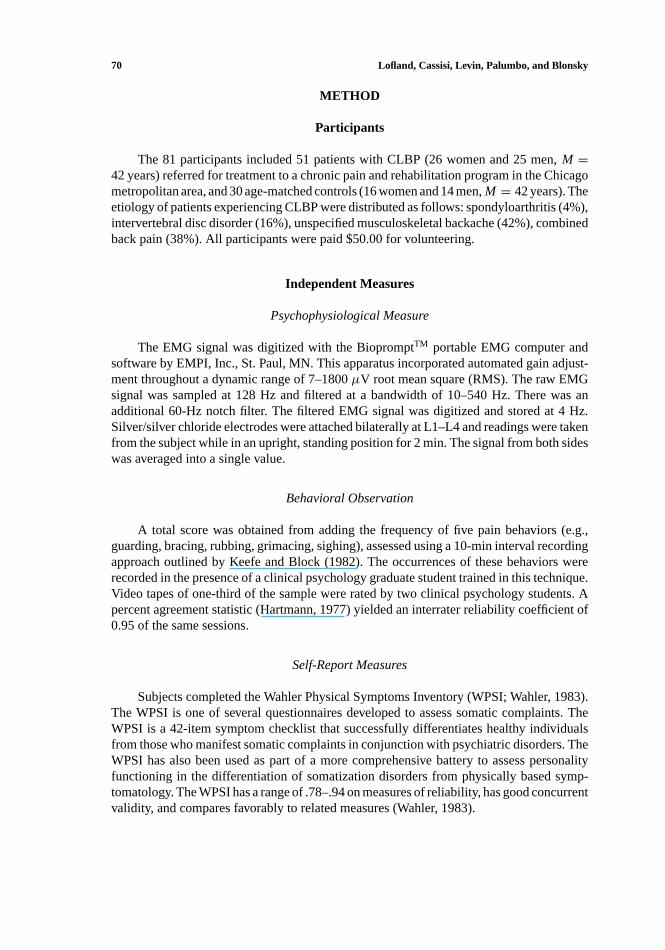
The 81 participants included 51 patients with CLBP (26 women and 25 men,M =42 years) referred for treatment to a chronic pain and rehabilitation program in the Chicagometropolitan area, and 30 age-matched controls (16 women and 14 men,M = 42 years). Theetiology of patients experiencing CLBP were distributed as follows: spondyloarthritis (4%),intervertebral disc disorder (16%), unspecified musculoskeletal backache (42%), combinedback pain (38%). All participants were paid $50.00 for volunteering.
Independent Measures
Psychophysiological Measure
The EMG signal was digitized with the BiopromptTM portable EMG computer andsoftware by EMPI, Inc., St. Paul, MN. This apparatus incorporated automated gain adjust-ment throughout a dynamic range of 7–1800µV root mean square (RMS). The raw EMGsignal was sampled at 128 Hz and filtered at a bandwidth of 10–540 Hz. There was anadditional 60-Hz notch filter. The filtered EMG signal was digitized and stored at 4 Hz.Silver/silver chloride electrodes were attached bilaterally at L1–L4 and readings were takenfrom the subject while in an upright, standing position for 2 min. The signal from both sideswas averaged into a single value.
Behavioral Observation
A total score was obtained from adding the frequency of five pain behaviors (e.g.,guarding, bracing, rubbing, grimacing, sighing), assessed using a 10-min interval recordingapproach outlined by Keefe and Block (1982). The occurrences of these behaviors wererecorded in the presence of a clinical psychology graduate student trained in this technique.Video tapes of one-third of the sample were rated by two clinical psychology students. Apercent agreement statistic (Hartmann, 1977) yielded an interrater reliability coefficient of0.95 of the same sessions.
Self-Report Measures
Subjects completed the Wahler Physical Symptoms Inventory (WPSI; Wahler, 1983).The WPSI is one of several questionnaires developed to assess somatic complaints. TheWPSI is a 42-item symptom checklist that successfully differentiates healthy individualsfrom those who manifest somatic complaints in conjunction with psychiatric disorders. TheWPSI has also been used as part of a more comprehensive battery to assess personalityfunctioning in the differentiation of somatization disorders from physically based symp-tomatology. The WPSI has a range of .78–.94 on measures of reliability, has good concurrentvalidity, and compares favorably to related measures (Wahler, 1983).
P1: FQJ,FTK
Applied Psychophysiology and Biofeedback [apb] PL129-76 June 7, 2000 14:6 Style file version Nov. 19th, 1999
Incremental Validity of Pain Assessment 71
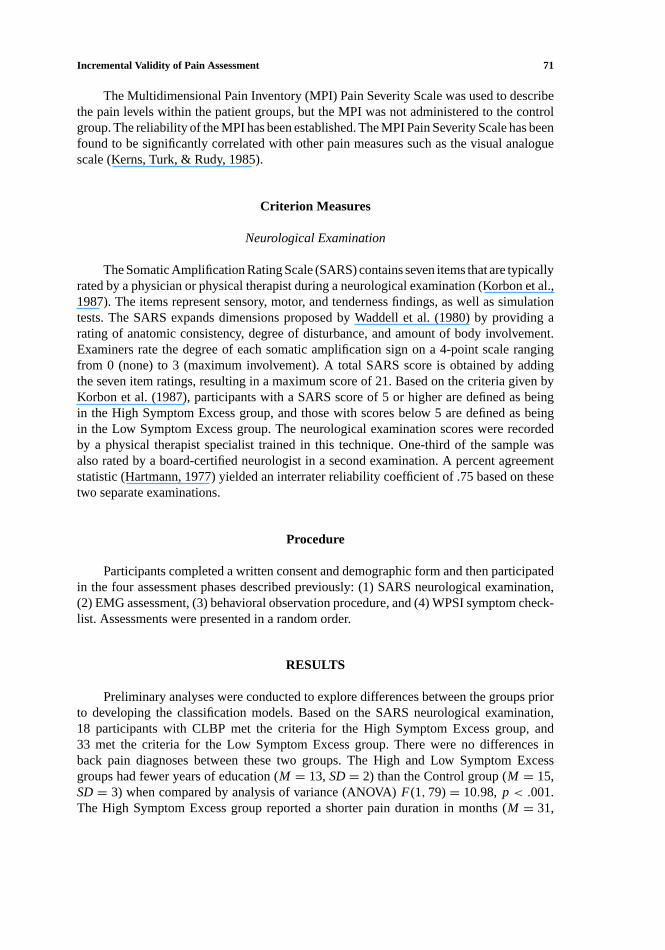
The Multidimensional Pain Inventory (MPI) Pain Severity Scale was used to describethe pain levels within the patient groups, but the MPI was not administered to the controlgroup. The reliability of the MPI has been established. The MPI Pain Severity Scale has beenfound to be significantly correlated with other pain measures such as the visual analoguescale (Kerns, Turk, & Rudy, 1985).
Criterion Measures
Neurological Examination
The Somatic Amplification Rating Scale (SARS) contains seven items that are typicallyrated by a physician or physical therapist during a neurological examination (Korbon et al.,1987). The items represent sensory, motor, and tenderness findings, as well as simulationtests. The SARS expands dimensions proposed by Waddell et al. (1980) by providing arating of anatomic consistency, degree of disturbance, and amount of body involvement.Examiners rate the degree of each somatic amplification sign on a 4-point scale rangingfrom 0 (none) to 3 (maximum involvement). A total SARS score is obtained by addingthe seven item ratings, resulting in a maximum score of 21. Based on the criteria given byKorbon et al. (1987), participants with a SARS score of 5 or higher are defined as beingin the High Symptom Excess group, and those with scores below 5 are defined as beingin the Low Symptom Excess group. The neurological examination scores were recordedby a physical therapist specialist trained in this technique. One-third of the sample wasalso rated by a board-certified neurologist in a second examination. A percent agreementstatistic (Hartmann, 1977) yielded an interrater reliability coefficient of .75 based on thesetwo separate examinations.
Procedure
Participants completed a written consent and demographic form and then participatedin the four assessment phases described previously: (1) SARS neurological examination,(2) EMG assessment, (3) behavioral observation procedure, and (4) WPSI symptom check-list. Assessments were presented in a random order.
RESULTS
Preliminary analyses were conducted to explore differences between the groups priorto developing the classification models. Based on the SARS neurological examination,18 participants with CLBP met the criteria for the High Symptom Excess group, and33 met the criteria for the Low Symptom Excess group. There were no differences inback pain diagnoses between these two groups. The High and Low Symptom Excessgroups had fewer years of education (M = 13,SD= 2) than the Control group (M = 15,SD= 3) when compared by analysis of variance (ANOVA)F(1, 79)= 10.98, p < .001.The High Symptom Excess group reported a shorter pain duration in months (M = 31,

P1: FQJ,FTK
Applied Psychophysiology and Biofeedback [apb] PL129-76 June 7, 2000 14:6 Style file version Nov. 19th, 1999
72 Lofland, Cassisi, Levin, Palumbo, and Blonsky
Table I. Means and Standard Deviations of Each Assessment Approach by Group (df 2, 78)
High SE (N = 18) Low SE (N = 33) Control (N = 30) F p
EMG 15.9a (11.6) 8.7b (5.3) 8.1b (6.0) 10.9 <.001BO 14.6a (13.6) 6.7b (8.1) 2.8c (3.2) 7.4 <.001SC 2.1a (0.7) 1.8b (0.7) 0.7c (0.4) 41.1 <.001
Note. Means in the same row that do not share the same subscript differ on Tukey’sa at p < .05. Values inparentheses representSD. SE: symptom excess; EMG: lumbar surface electromyography (µV); BO: behavioralobservation (total count); SC: symptom checklist (Wahler Physical Symptom Inventory total).
SD = 13) than the Low Symptom Excess group (M = 57, SD = 38, F(1, 49)= 8.2,p < .01). In addition, the High Symptom Excess group reported a higher pain severity(M = 4.8,SD=1, than the Low Symptom Excess group (M = 3.9,SD=1,F(1, 49)= 8.3,p < .01). There was no difference between the High and Low Symptom Excess groups inthe frequency of medical diagnoses when compared by chi-square (see participant section).The Control group contained significantly more employed subjects (80%) than the Highand Low Symptom Excess groups (29%)χ2(1, N = 81)= 19.1, p < .001, and the LowSymptom Excess group contained more employed subjects (39%) than the High SymptomExcess group (11%)χ2(1, N = 81)= 4.5, p < .05. Although there were no differencesbetween the two patient groups in the number currently involved in litigation, the HighSymptom Excess group had more participants with attorneys retained (83%) than the LowSymptom Excess group (49%)χ2(1, N = 81)= 5.9, p < .05.
The means and standard deviations for the lumbar surface electromyographic (EMG),behavioral observation (BO), and symptom checklist (SC) assessment domains are pre-sented in Table I. Univariate ANOVAs compared groups on each measure. Significant groupdifferences emerged on each measure. Post-hoc comparisons with Tukeya were conductedto understand the significant group effects. The High Symptom Excess group had signifi-cantly higher EMG levels than either the Low Symptom Excess group or the Control group(p < .05), but the Low Symptom Excess and Control groups did not differ. Also, the HighSymptom Excess group exhibited significantly more pain behaviors than both the LowSymptom Excess group (p < .05) and the Control group (p < .05) and the Low SymptomExcess group exhibited more pain behaviors than the Control Group (p < .05). Lastly, theHigh Symptom Excess group reported significantly more physical complaints than boththe Low Symptom Excess group and the Control group (p < .05), and the Low SymptomExcess group reported more physical complaints than the Control Group (p < .05).
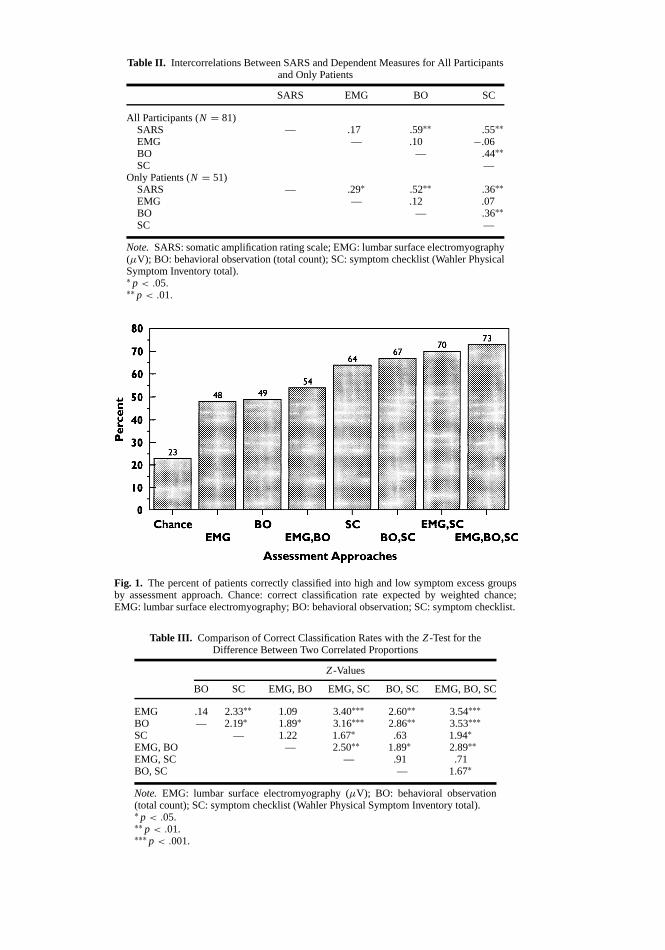
The intercorrelations between the assessment approaches are listed in Table II. Thesevalues demonstrate a significant correlation between the assessment approaches and theSARS and justify their use in the development of a predictive model. These intercorrelationsjustify using the measures alone, and in combination, in a series of separate discriminantanalyses, using the Direct Entry Method. Discriminant analyses were conducted separatelyto produce different classification tables for each measure alone and every possible combi-nation of measures.
The correct classification rate is illustrated by rank order in Figure 1. AZ-test forthe difference between two independent proportions (Betz, 1987; Guilford & Fruchter,1973) was used to compare the percent of participants expected to be correctly classifiedby weighted chance, to the percent actually correctly classified by each prediction model.
P1: FQJ,FTK
Applied Psychophysiology and Biofeedback [apb] PL129-76 June 7, 2000 14:6 Style file version Nov. 19th, 1999
Table II. Intercorrelations Between SARS and Dependent Measures for All Participantsand Only Patients
SARS EMG BO SC
All Participants (N = 81)SARS — .17 .59∗∗ .55∗∗EMG — .10 −.06BO — .44∗∗SC —
Only Patients (N = 51)SARS — .29∗ .52∗∗ .36∗∗EMG — .12 .07BO — .36∗∗SC —
Note. SARS: somatic amplification rating scale; EMG: lumbar surface electromyography(µV); BO: behavioral observation (total count); SC: symptom checklist (Wahler PhysicalSymptom Inventory total).∗ p < .05.∗∗ p < .01.
Fig. 1. The percent of patients correctly classified into high and low symptom excess groupsby assessment approach. Chance: correct classification rate expected by weighted chance;EMG: lumbar surface electromyography; BO: behavioral observation; SC: symptom checklist.
Table III. Comparison of Correct Classification Rates with theZ-Test for theDifference Between Two Correlated Proportions
Z-Values
BO SC EMG, BO EMG, SC BO, SC EMG, BO, SC
EMG .14 2.33∗∗ 1.09 3.40∗∗∗ 2.60∗∗ 3.54∗∗∗BO — 2.19∗ 1.89∗ 3.16∗∗∗ 2.86∗∗ 3.53∗∗∗SC — 1.22 1.67∗ .63 1.94∗EMG, BO — 2.50∗∗ 1.89∗ 2.89∗∗EMG, SC — .91 .71BO, SC — 1.67∗
Note. EMG: lumbar surface electromyography (µV); BO: behavioral observation(total count); SC: symptom checklist (Wahler Physical Symptom Inventory total).∗ p < .05.∗∗ p < .01.∗∗∗ p < .001.
73
P1: FQJ,FTK
Applied Psychophysiology and Biofeedback [apb] PL129-76 June 7, 2000 14:6 Style file version Nov. 19th, 1999
74 Lofland, Cassisi, Levin, Palumbo, and Blonsky
All measures performed significantly better than weighted chance (p < .001). TheZ-testfor the difference between two correlated proportions (Guilford & Fruchter, 1973) was thenused to compare the percent of subjects correctly classified by each model to one another.Table III gives theZ values and significance level for every possible comparison.
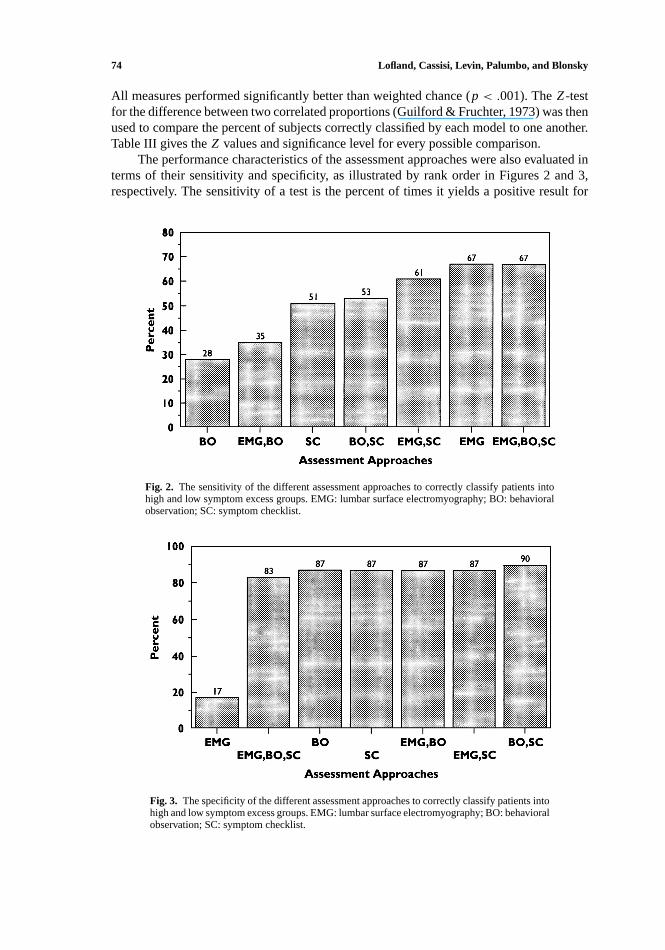
The performance characteristics of the assessment approaches were also evaluated interms of their sensitivity and specificity, as illustrated by rank order in Figures 2 and 3,respectively. The sensitivity of a test is the percent of times it yields a positive result for
Fig. 2. The sensitivity of the different assessment approaches to correctly classify patients intohigh and low symptom excess groups. EMG: lumbar surface electromyography; BO: behavioralobservation; SC: symptom checklist.
Fig. 3. The specificity of the different assessment approaches to correctly classify patients intohigh and low symptom excess groups. EMG: lumbar surface electromyography; BO: behavioralobservation; SC: symptom checklist.
P1: FQJ,FTK
Applied Psychophysiology and Biofeedback [apb] PL129-76 June 7, 2000 14:6 Style file version Nov. 19th, 1999
Incremental Validity of Pain Assessment 75
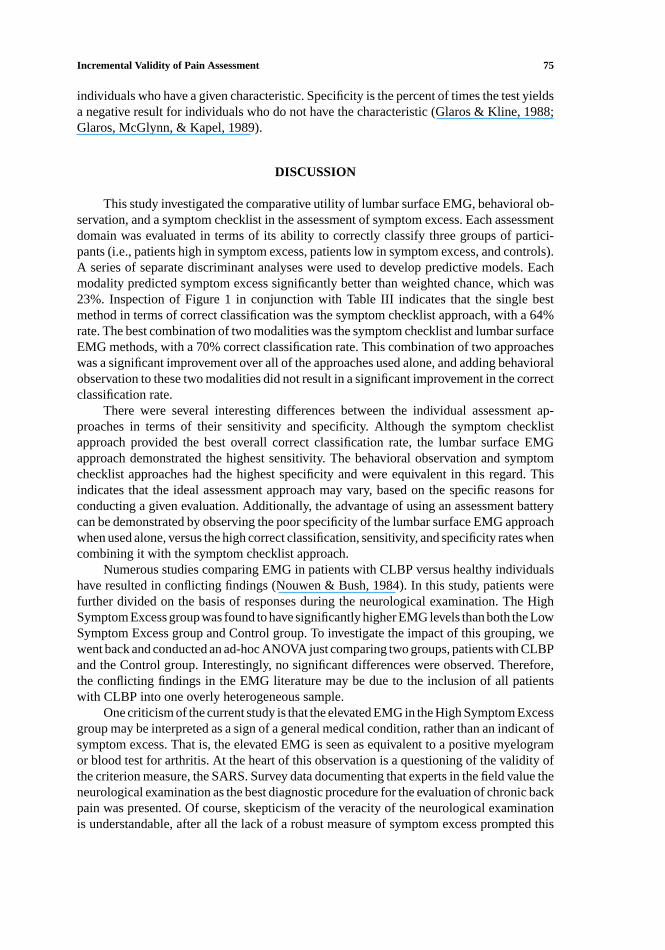
individuals who have a given characteristic. Specificity is the percent of times the test yieldsa negative result for individuals who do not have the characteristic (Glaros & Kline, 1988;Glaros, McGlynn, & Kapel, 1989).
DISCUSSION
This study investigated the comparative utility of lumbar surface EMG, behavioral ob-servation, and a symptom checklist in the assessment of symptom excess. Each assessmentdomain was evaluated in terms of its ability to correctly classify three groups of partici-pants (i.e., patients high in symptom excess, patients low in symptom excess, and controls).A series of separate discriminant analyses were used to develop predictive models. Eachmodality predicted symptom excess significantly better than weighted chance, which was23%. Inspection of Figure 1 in conjunction with Table III indicates that the single bestmethod in terms of correct classification was the symptom checklist approach, with a 64%rate. The best combination of two modalities was the symptom checklist and lumbar surfaceEMG methods, with a 70% correct classification rate. This combination of two approacheswas a significant improvement over all of the approaches used alone, and adding behavioralobservation to these two modalities did not result in a significant improvement in the correctclassification rate.
There were several interesting differences between the individual assessment ap-proaches in terms of their sensitivity and specificity. Although the symptom checklistapproach provided the best overall correct classification rate, the lumbar surface EMGapproach demonstrated the highest sensitivity. The behavioral observation and symptomchecklist approaches had the highest specificity and were equivalent in this regard. Thisindicates that the ideal assessment approach may vary, based on the specific reasons forconducting a given evaluation. Additionally, the advantage of using an assessment batterycan be demonstrated by observing the poor specificity of the lumbar surface EMG approachwhen used alone, versus the high correct classification, sensitivity, and specificity rates whencombining it with the symptom checklist approach.
Numerous studies comparing EMG in patients with CLBP versus healthy individualshave resulted in conflicting findings (Nouwen & Bush, 1984). In this study, patients werefurther divided on the basis of responses during the neurological examination. The HighSymptom Excess group was found to have significantly higher EMG levels than both the LowSymptom Excess group and Control group. To investigate the impact of this grouping, wewent back and conducted an ad-hoc ANOVA just comparing two groups, patients with CLBPand the Control group. Interestingly, no significant differences were observed. Therefore,the conflicting findings in the EMG literature may be due to the inclusion of all patientswith CLBP into one overly heterogeneous sample.
One criticism of the current study is that the elevated EMG in the High Symptom Excessgroup may be interpreted as a sign of a general medical condition, rather than an indicant ofsymptom excess. That is, the elevated EMG is seen as equivalent to a positive myelogramor blood test for arthritis. At the heart of this observation is a questioning of the validity ofthe criterion measure, the SARS. Survey data documenting that experts in the field value theneurological examination as the best diagnostic procedure for the evaluation of chronic backpain was presented. Of course, skepticism of the veracity of the neurological examinationis understandable, after all the lack of a robust measure of symptom excess prompted this
P1: FQJ,FTK
Applied Psychophysiology and Biofeedback [apb] PL129-76 June 7, 2000 14:6 Style file version Nov. 19th, 1999
76 Lofland, Cassisi, Levin, Palumbo, and Blonsky
research in the first place. If one accepts the criterion measure, several interpretations arepossible for the elevated EMG in patients rated high in symptom excess. One explanationis that the muscle spasm model accurately depicts the status of this subgroup of patients,another may be that the elevated EMG reflects the attentional focus of the patient with asomatic preoccupation, still another may be that elevated EMG identifies subtle guardingand bracing that may not necessarily be visible to direct observation. No matter whichtheory proves most accurate, viewing high EMG as a definitive sign of a medical conditionthat negates the criterion measure reverts to dualistic models which contemporary theoriesof somatization have rejected.
A second criticism of the study is the differential interrater reliabilities reported forthe SARS and Behavioral Observation procedures. On first glance it appears problematicthat the SARS, the criterion measure, had a lower interrater reliability than the behavioralobservation approach, a predictor measure. A direct comparison of these two reliabilities isnot appropriate because in the case of the SARS, the raters are viewing the patient during twoseparate examinations to ensure that the examiner ratings are independent, whereas duringthe behavioral observation procedure, the raters are viewing the patient during the sameexamination. Therefore, the interrater reliabilities for the SARS procedure are confoundedby the retest consistency of the patient, whereas those reported for the behavioral observationprocedure are not.
The most important feature missing in this study is cross-validation. That is, ideallythe classification model developed here would be evaluated with a sample of patients andcontrols independent of those used to develop the model. This step is beyond the scope of theresources available to the authors at this time. Nonetheless we believe this study has heuristicvalue in identifying the issues and challenges to establishing incremental validity in this typeof clinical situation with these types of instruments. Also, the reader is cautioned that manydifferent techniques of implementing surface EMG, behavioral observation, and symptomchecklists exist, and that a different mix of EMG equipment or procedures, observationmethods, and questionnaires may result in different classification performance. Ideally,optimal assessment batteries are validated with local techniques and populations.
In conclusion, new approaches to the assessment of symptom excess, particularlywithin the CLBP population, are necessary based on the skyrocketing societal impact ofthis condition. This study effectively evaluated EMG, behavioral, and self-report assess-ment approaches in relation to a neurological examination designed to assess symptomexcess. Each approach was better than chance in classifying patients into High and LowSymptom Excess groups but did so with different strengths and weaknesses. Each approachdemonstrated utility in assessing symptom excess.
ACKNOWLEDGMENTS
This research was partially supported by a Rehabilitation Institute Research Corpo-ration Grant. This research was also supported in part with equipment provided by EMPI,Inc., St. Paul, MN.
REFERENCES
American Psychiatric Association (1994).Diagnostic and statistical manual of mental disorders(4th ed.).Washington, DC: Author.
P1: FQJ,FTK
Applied Psychophysiology and Biofeedback [apb] PL129-76 June 7, 2000 14:6 Style file version Nov. 19th, 1999
Incremental Validity of Pain Assessment 77
Barsky, A. J., & Klerman, G. L. (1983). Overview: Hypochondriasis, bodily complaints, and somatic styles.American Journal of Psychiatry, 140,273–283.
Ben-Porath, Y. S., McCully, E., & Almagor, M. (1993). Incremental validity of the MMPI-2 content scales inthe assessment of personality and psychopathology by self-report.Journal of Personality Assessment, 61,557–575.
Betz, N. E. (1987). Use of discriminant analysis in counseling psychology research.Journal of CounselingPsychology, 34,393–403.
Cassisi, J. E., Sypert, G. W., Lagana, L., Friedman, E. M., & Robinson, M. E. (1983). Pain, disability, andpsychological functioning in chronic low back pain subgroups: Myofascial versus herniated disc syndrome.Neurosurgery, 33,1–9.
Cavanough, J. M., & Weinstein, J. N. (1994). Low back pain: Epidemiology, anatomy, and neurophysiology. InP. D. Wall & R. Melzack (Eds.),Textbook of pain(pp. 309–330). New York: Churchill Livingstone.
Collins, G. A., Cohen, M. J., Naliboff, B. D., & Schandler, S. L. (1982). Comparative analysis of paraspinal andfrontalis EMG, heart rate and skin conductance in chronic low back pain patients and normals to variouspostures and stress.Scandinavian Journal of Rehabilitation Medicine, 14,39–46.
Cone, J. D., & Hawkins, R. P. (1977).Behavioral assessment: New directions in clinical psychology. New York:Brunner/Mazel.
Cram, J. R. (1990).Clinical EMG for surface recordings: Volume 2. Nevada City, CA: Clinical Resources.Deyo, R. A. (1993). Practice variations, treatment fads, rising disability: Do we need a new clinical research
paradigm?Spine, 18,2153–2162.Deyo, R. A., Cherkin, D., Conrad, D., & Volinn, E. (1991). Cost, controversy, crisis: Low back pain and the health
of the public.Annual Review of Public Health, 12,141–156.Fordyce, W. E. (1988). Pain and suffering: A reappraisal.American Psychologist, 43,276–282.Garb, H. N. (1984). The incremental validity of information used in personality assessment.Clinical Psychology
Review, 4,641–655.Glaros, A. G., & Kline, R. B. (1988). Understanding the accuracy of tests with cutting scores: The sensitivity,
specificity, and predictive value model.Journal of Clinical Psychology, 44,1013–1023.Glaros, A. G., McGlynn, F. D., & Kapel, L. (1989). Sensitivity, specificity, and the predictive value of facial
electromyographic data in diagnosing myofascial pain-dysfunction.Journal of Craniomandibular Practice,7, 189–193.
Guilford, J. P., & Fruchter, B. (1973).Fundamental statistics in psychology and education(5th ed.). New York:McGraw-Hill.
Hartmann, D. P. (1977). Considerations in the choice of interobserver reliability estimates.Journal of AppliedBehavior Analysis, 10,103–110.
Hazard, R. G., Haugh, L. D., Reid, S., Preble, J. B., & McDonald, L. (1996). Early prediction of chronic disabilityafter occupational low back injury.Spine, 21,945–951.
Kasman, G. S., Cram., J. R., & Wolf, S. L. (1998).Clinical applications in surface electromyography. Gaithersburg,Maryland: Aspen.
Keefe, F. J., & Block, A. R. (1982). Development of an observation method for assessing pain behavior in chroniclow back pain patients.Behavior Therapy, 13,363–375.
Keefe, F. J., Bradley, L. A., & Crisson, J. E. (1990). Behavioral assessment of low back pain: Identification of painbehavior subgroups.Pain, 40,153–160.
Keefe, F. J., Crisson, J. E., Maltbie, A., Bradley, L., & Gil, K. M. (1986). Illness behavior as a predictor of painand overt behavior patterns in chronic low back pain patients.J. Psychosomatic Research, 30,543–551.
Keefe, F. J., Wilkins, R. H., & Cook, W. A. (1984). Direct observation of pain behavior in low back pain patientsduring physical examination.Pain, 20,59–68.
Kerns, R. D., Turk, D. C., & Rudy, T. E. (1985). The West Haven-Yale Multidimensional Pain Inventory(WHYMPI). Pain, 23,245–256.
Korbon, G. A., DeGood, D. E., Schroeder, M. E., Schwartz, D. P., & Shutty, M. S., Jr. (1987). The developmentof a somatic amplification rating scale for low-back pain.Spine, 12,787–791.
Lawrence, L., & McLemore, T. (1983).1981 summary: National ambulatory medical care survey(NCHS AdvanceData Report No. 88). U.S. Department of Health and Human Services (Pub. No. PHS83-1250).
Lofland, K. R., Mumby, P. B., Cassisi, J. E., Palumbo, N. L., & Camic, P. M. (1995). Lumbar EMG during staticand dynamic activity in pain-free normals: Implications for muscle scanning protocols.Biofeedback andSelf-Regulation, 20,3–18.
Long, D. M., BenDebba, M., Torgerson, W. S., Boyd, R. J., Dawson, R. J., Hardy, R. W., Robertson, J. T., Sypert,G. W., & Watts, C. (1996). Persistent back pain and sciatica in the United States: Patient Characteristics.Journal of Spinal Disorders, 9,40–58.
Nouwen, A., & Bush, C. (1984). The relationship between paraspinal EMG and chronic low back pain.Pain, 20,109–123.
Rudy, T. E., Turk, D. C., & Brena, S. F. (1988). Differential utility of medical procedures in the assessment ofchronic pain patients.Pain, 34,53–60.

P1: FQJ,FTK
Applied Psychophysiology and Biofeedback [apb] PL129-76 June 7, 2000 14:6 Style file version Nov. 19th, 1999
78 Lofland, Cassisi, Levin, Palumbo, and Blonsky
Sypert, G. W. (1987). Lumbar disk disease, part 1: Natural history and diagnosis.Neurology Neurosurgery 7,1–8.Waddell, G., McCulloch, J. A., Kummel, E., & Venner, R. M. (1980). Non-organic physical signs in low back
pain.Spine, 5,117–125.Wahler, H. J. (1983).Wahler Physical Symptoms Inventory Manual. Los Angeles: Western Psychological Services.White, A. A., & Gordon, S. L. (1982). Synopsis: Workshop on idiopathic low-back pain.Spine, 7,141–149.Wiesel, S. W., Feffer, H. L., & Rothman, R. H. (1985).Industrial low back pain(pp. 6, 8). Charlottesville, VA:
The Michie Company.Wiggins, J. S. (1980).Personality and prediction: Principles of personality assessment.Massachusetts: Addison-
Wesley.
Related Documents