DOT HS-801 016 THE INCIDENCE OF DRUGS IN FATALLY INJURED DRIVERS Contract No. DOT-HS-119-1 627 February 1974 Final Report PREPARED FOR: U.S. DEPARTMENT OF TRANSPORTATION NATIONAL HIGHWAY TRAFFIC SAFETY ADMINISTRATION WASHINGTON, D.C. 20590 Document is available to the public through the National Technical Information Service, Springfield, Virginia 22151

Welcome message from author
This document is posted to help you gain knowledge. Please leave a comment to let me know what you think about it! Share it to your friends and learn new things together.
Transcript
DOT HS-801 016
THE INCIDENCE OF DRUGS IN FATALLY INJURED DRIVERS
Contract No. DOT-HS-119-1 627 February 1974 Final Report
PREPARED FOR:
U.S. DEPARTMENT OF TRANSPORTATION
NATIONAL HIGHWAY TRAFFIC SAFETY ADMINISTRATION
WASHINGTON, D.C. 20590
Document is available to the public through the National Technical Information Service, Springfield, Virginia 22151
This document is disseminated under the sponsorship of the Department of Transportation in the interest of information exchange. The United States Government assumes no liability for its contents or use thereof.
Technical Report Documentation Page 1. Report No. 2. Government Accession No. 3. Recipient's Catalog No.
DOT HS-801 016
4. Title and Subtitle 5. Report Dote
The Incidence of Drugs in February 1974 Fatally Injured Drivers 6. Performing Organization Code
8. Performin g Or g anization R eport No .7. Authorts)
E. J. Woodhouse, Ph.D. 9. Performing Organization Name and Address 10. Work Unit No. (TRAIS)
Midwest Research Institute 425 Volker Blvd. 11._caa:rn.tni r,r„nr.nt„
Kansas City, Missouri 64110 DOT-HS-119-1-627 13. Type of Report and Period Covered
12. Sponsoring Agency Name and Address Final Report
Office of Driver Performance Research • 6/18/71 to 9/19/73 National Highway Traffic Safety Administration Department of Transportation 14. Sponsoring Agency Code
15. Supplementary Notes
16. Abstract
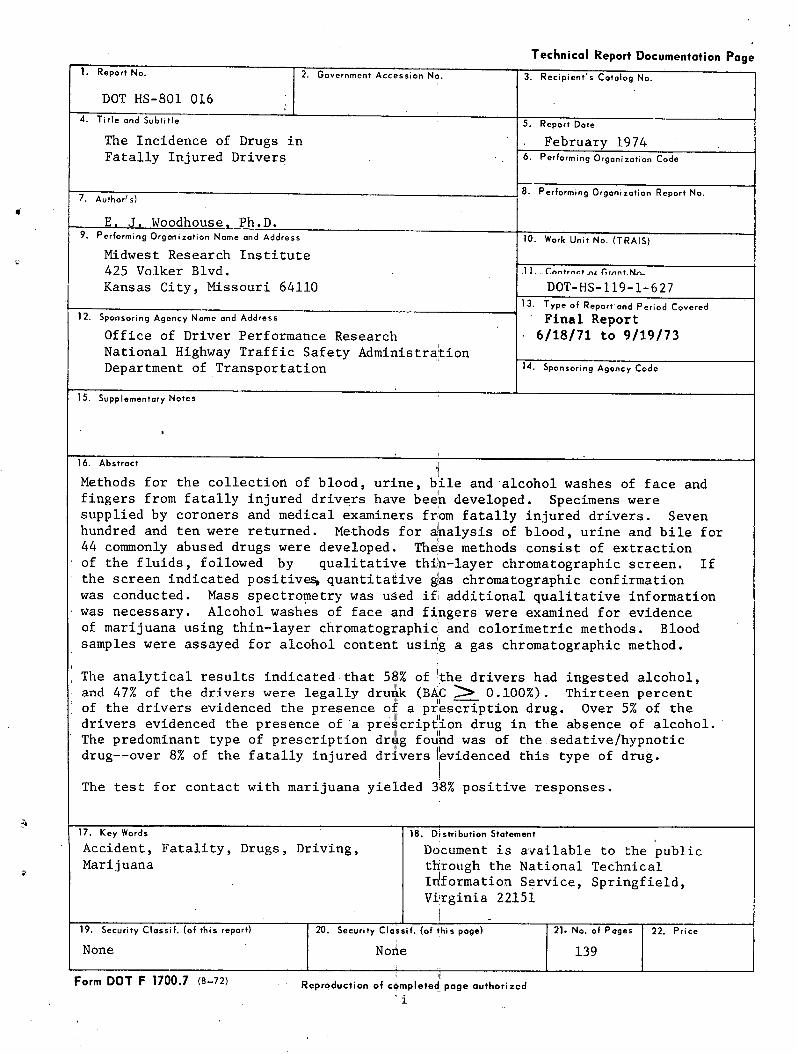
Methods for the collection of blood, urine, bile and alcohol washes of face and fingers from fatally injured drivers have been developed. Specimens were supplied by coroners and medical examiners from fatally injured drivers. Seven hundred and ten were returned. Methods for analysis of blood, urine and bile for 44 commonly abused drugs were developed. These methods consist of extraction of the fluids, followed by qualitative thin-layer chromatographic screen. If the screen indicated positives, quantitative as chromatographic confirmation was conducted. Mass spectrometry was used if additional qualitative information was necessary. Alcohol washes of face and fingers were examined for evidence of marijuana using thin-layer chromatographic'and colorimetric methods. Blood samples were assayed for alcohol content using a gas chromatographic method.
The analytical results indicated that 58% of the drivers had ingested alcohol, and 47% of the drivers were legally drunk (BAC 0.100%). Thirteen percent of the drivers evidenced the presence of a prescription drug. Over 5% of the drivers evidenced the presence of'a prescription drug in the absence of alcohol. The predominant type of prescription drug found was of the sedative/hypnotic drug--over 8% of the fatally injured driversi evidenced this type of drug.
The test for contact with marijuana yielded 38% positive responses.
17. Key Words 18. Distribution Statement
Accident, Fatality, Drugs, Driving, Document is available to the publicMarijuana through the National Technical
Information Service, Springfield,Virginia 22.151
19. Security Classif. (of this report) 20. Security Classif. (of this page) 21. No. of Pages 22. Price
None None 139
Form DOT F 1700.7 (8-72) Reproduction of completed page authorized
'i
PREFACE
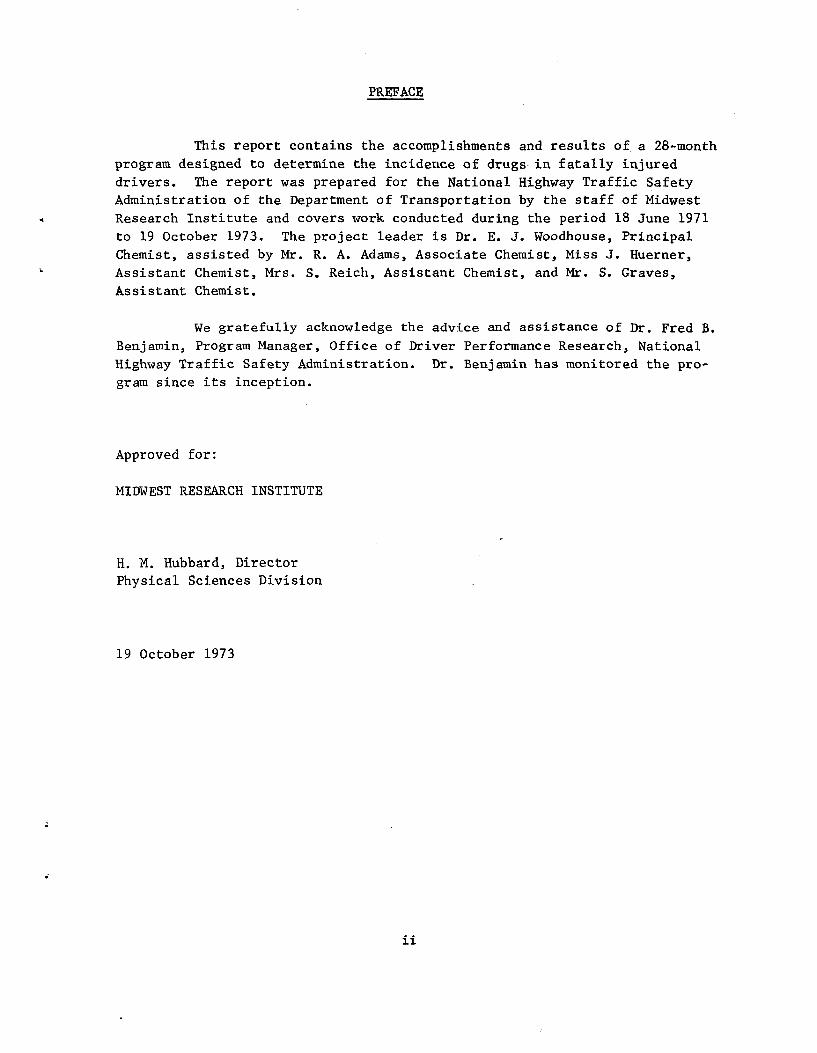
This report contains the accomplishments and results of.a 28-month
program designed to determine the incidence of drugs in fatally injured
drivers. The report was prepared for the National Highway Traffic Safety
Administration of the Department of Transportation by the staff of Midwest
Research Institute and covers work conducted during the period 18 June 1971
to 19 October 1973. The project leader is Dr. E. J. Woodhouse, Principal
Chemist, assisted by Mr. R. A. Adams, Associate Chemist, Miss J. Huerner,
Assistant Chemist, Mrs. S. Reich, Assistant Chemist, and Mr. S. Graves,
Assistant Chemist.
We gratefully acknowledge the advice and assistance of Dr. Fred B.
Benjamin, Program Manager, Office of Driver Performance Research, National
Highway Traffic Safety Administration. Dr. Benjamin has monitored the pro
gram since its inception.
Approved for:
MIDWEST RESEARCH INSTITUTE
H. M. Hubbard, Director Physical Sciences Division
19 October 1973
ii
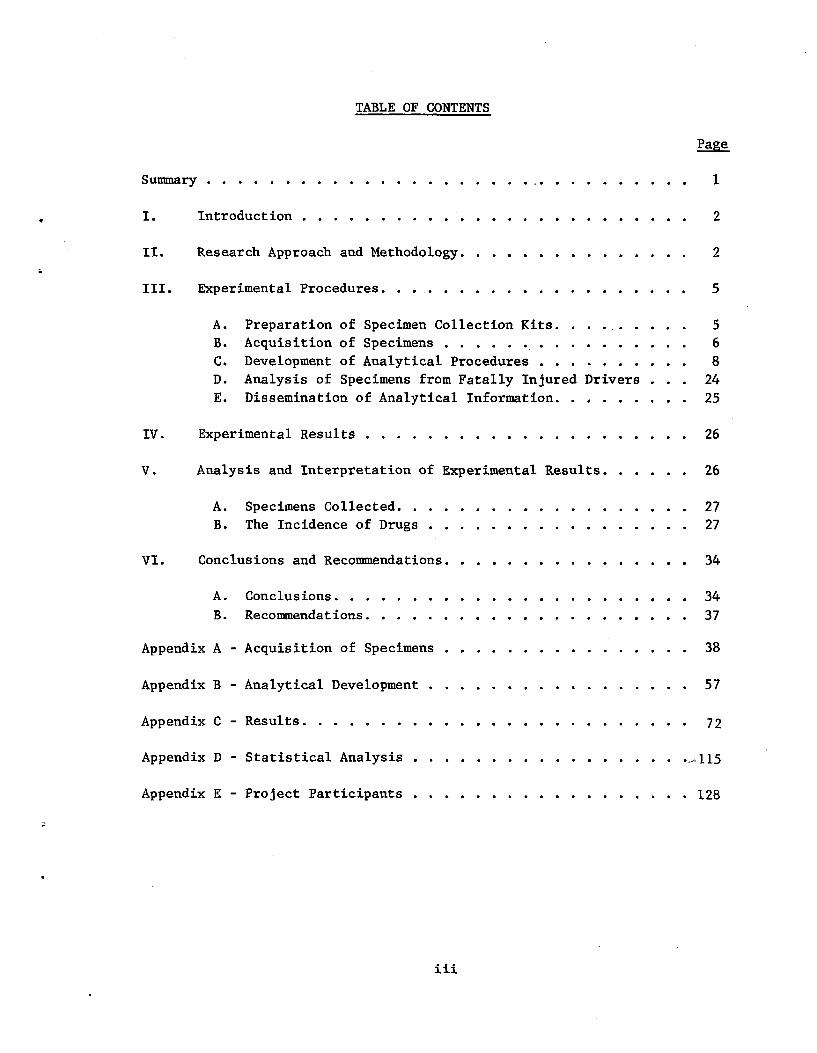
TABLE OF CONTENTS
Page
Summary . . . . . . . . . . . . . . . . . . . . ... . . . . . . . . . 1
I. Introduction . . . . . . . . . . . . . . . . . . . . . . . . . . 2
II. Research Approach and Methodology . . . . . . . . . . . . . . . 2
III. Experimental Procedures. . ... . . . . . . . . . . . . . . . . 5
A. B. C. D.
E.
Preparation of Specimen Collection Kits. . . ... . . . . 5Acquisition of Specimens . . . . . . . . . . . . . . . 6Development of Analytical Procedures . . . . . . . . . . 8Analysis of Specimens from Fatally Injured Drivers . . . 24Dissemination of Analytical Information. . . . . . . . . 25
IV. Experimental Results . . . . . . . . . . . . . . . . . . . . . 26
V. Analysis and Interpretation of Experimental Results. . . . . . 26
A. Specimens Collected . . . . . . . . . . . . . . . . . . . 27
B. The Incidence of Drugs . . . . . . . . . . . . . . . . . 27
VI. Conclusions and Recommendations . . . . . . . . . . . . . . . . 34
A.
B.
Conclusions . . . . . . . . . . . . . . . . . . . . . . . 34
Recommendations . . . . . . . . . . . . . . . . . . . . . 37
Appendix A - Acquisition of Specimens . . . . . . . . . . . . . . . . 38
Appendix B - Analytical Development . . . . . . . . . . . . . . . . . 57
Appendix C - Results . . . . . . . . . . . . . . . . . . . . . . . . . 72
Appendix D - Statistical Analysis . . . . . . . . . . . . . . . . . ....115
Appendix E - Project Participants . . . . . . . . . . . . . . . . . . 128
iii
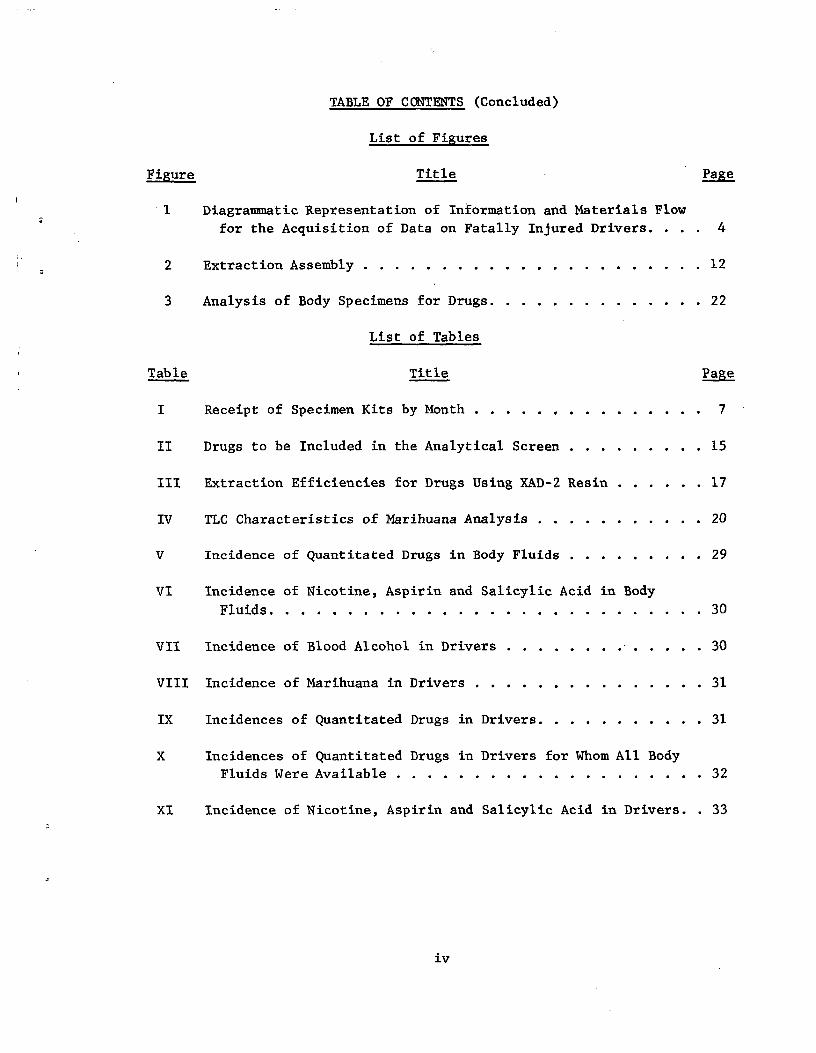
TABLE OF CONTENTS (Concluded)
List of Figures
Figure Title Page
1 Diagrammatic Representation of Information and Materials Flow
for the Acquisition of Data on Fatally Injured Drivers. . . . 4
2 Extraction Assembly . . . . . . . . . . . . . . . . . . . . . . 12
3 Analysis of Body Specimens for Drugs . . . . . . . . . . . . . . 22
List of Tables
Table Title Page
I Receipt of Specimen Kits by Month . . . . . . . . . . . . . . . 7
II Drugs to be Included in the Analytical Screen . . . . . . . . . 15
III Extraction Efficiencies for Drugs Using XAD-2 Resin . . . . . . 17
IV TLC Characteristics of Marihuana Analysis . . . . . . . . . . . 20
V Incidence of Quantitated Drugs in Body Fluids . . . . . . . . . 29
VI Incidence of Nicotine, Aspirin and Salicylic Acid in Body
Fluids . . . . . . . . . . . . . . . . . . . . . . . . . . . . 30
VII Incidence of Blood Alcohol in Drivers . . . . . . . . . . . . 30
VIII Incidence of Marihuana in Drivers . . . . . . . . . . . . . . . 31
IX Incidences of Quantitated Drugs in Drivers. . . . . . . . . . . 31
X Incidences of Quantitated Drugs in Drivers for Whom All BodyFluids Were Available . . . . . . . . . . . . . . . . . . . . 32
XI Incidence of Nicotine, Aspirin and Salicylic Acid in Drivers. . 33
iv
COMMENTSby
Program Manager
This study analyzed the incidence of drugs in the body fluids of a sample of fatally injured drivers. The project also developed and applied screening techniques for the detection of contact with marijuana.
These data indicate that certain drugs may be a highway safety problem. Marijuana and barbituates were the most frequently detected
drugs.
The data collected cannot legitimately be generalized beyond the 700 cases studied-, to apply to any larger group such as all fatally injured drivers in the United States.
The following cautions and constraints should be noted in interpreting the data:
Sampling of Cases
The cases studied were submitted by 36 coroners in different areas of the country who agreed to cooperate in this study. Attempts to use the same criteria for selection of cases in all areas were not successful.
The extent to which the cases selected are representative of a larger population cannot be determined with available data. In addition, all body fluids could not be tested in all cases because of incomplete or contaminated fluid samples.
Interpretation of Drug Data
Drugs may be found in low concentrations in bile and urine for days and sometimes even weeks after they lose their clinical effect. Therefore, in the attached report, bile and urine concentrations below 1 microgram per mililiter were considered as negative. Any concentration of drugs in blood was considered as positive.
The test results report the amount of the drug present at the time of autopsy. Present knowledge does not permit one to work backwards to estimate the amount present at the time of the crash. Furthermore, the effects of different dose levels of drugs on performance are not well established. Thus, if drug presence was reported in a particular case, it may or may not mean that the driver was impaired at the time of the crash.
Marijuana Test Results
This contract included the collection of alcohol washings of the face and fingers of fatally injured drivers which were analyzed for marijuana.
V
The original method of eluting the drug from the swab for analysis by Thin Layer Chromatography (TLC) was unsuccessful. Therefore, about half way through the study, this method was replaced by a colorimetric analysis of the swab itself.
The new technique was investigated by MRI under this contract and
by MRI under a contract with the U. S. Army's Land Warfare Laboratory. None of the subjects gave a positive response prior to smoking and about 787. gave positive results during the first two hours after smoking. The number of positive responses decreased rapidly as the interval between exposure and test increased. This work was limited to living subjects.
The degree of response to the test was not recorded since it is not an indication of the amount inhaled. It shows that marijuana was in contact with the skin area, but not necessarily that it had been smoked.
In the present study when the modified test was applied to samples from 323 drivers, 124 drivers had at least one positive out of three washings (face, and both hands). Since the test can detect 78% of the marijuana smokers, this would indicate that a total of 169 (49%) of the fatally injured drivers tested may have been in contact with marijuana within the last few hours before death.
The test is new and there are some unexpected results that point to the need for further evidence of its accuracy:
o Percent marijuana involvement according to this study is far above expert estimates.
o Marijuana involvement does not show the age-relationshipwhich would be anticipated.
o The tests on each hand show a higher incidence than the test on the face,.
The.following conclusions can be drawn at this time:
o The marijuana-skin-test does need further improvement,standardization, and validation.
o The results of the test are considered an indication thatmarijuana may constitute a major traffic hazard, 'though itis not considered possible to determine the extent of themarijuana hazard on the basis of the current findings.
VI
Major Results
Results indicate that 47% of the drivers were legally drunk. 15.2% had evidence of drugs other than alcohol or marijuana and 38% gave a positive response on at least one of three tests for contact with marijuana.
Conclusion
This study of the incidence of drugs in fatally injured drivers indicates that certain drugs may be a highway safety problem. Marijuana, and the barbituates are the most frequently detected drugs. The results of this limited and preliminary study must be interpreted with caution but they indicate the need and direction of further research.
Fred B. Benjamin/ (D.M.D.,Ph.D.) Program Manager, ODPR
VII
SUMMARY
Methods for the collection of blood, urine, bile, and alcohol
washes of face and fingers from fatally injured drivers have been developed.
Specimens have been collected from Alcohol Safety Action Project areas and
other cooperating areas. The samples were supplied by coroners and medical
examiners from fatally injured drivers who were dead on arrival at the
hospitals. One thousand seven hundred and thirty-one specimen collection
kits were distributed to 57 different areas. Seven hundred and ten were
returned with specimens from 36 areas. Methods for analysis of blood, urine,
and bile for 44 commonly abused drugs were developed. These methods con
sisted of extraction of the fluids, followed by a qualitative thin-layer
chromatographic screen. If the screen indicated positives, quantitative
gas chromatographic confirmation was conducted. Mass spectrometry was also
conducted if additional qualitative information was necessary. Alcohol
washes of face and fingers were examined for evidence of marihuana using
thin-layer chromatographic and colorimetric methods. Blood samples were
assayed for alcohol content using a gas chromatographic method.
The analytical results indicated that 58% of the drivers had.in
gested alcohol, and 47% of the drivers were legally drunk (BAC z 0.100%).
Thirteen percent of the drivers evidenced the presence of a prescription
drug. Over 5% of the drivers evidenced the presence of a prescription drug
in the absence of alcohol. The predominant type of prescription drug found
was of the sedative/hypnotic drug--over 7% of the fatally injured drivers
evidenced this type of drug. The incidence of marihuana indicated by the
swab test was as high as 49%. The present test methods for marihuana have
not been proven reliable. Differing techniques employed in the marihuana
test yielded incidences ranging from 1.68% to 49%.
1
I. INTRODUCTION
This report, the final report in a series. of 20 reports, details
the accomplishments, results and conclusions of a 28-month project designed
to determine the incidence of drugs in fatally injured drivers. Specific
objectives of the project were to develop methods for acquisition and drug
analysis of specimens from fatally injured drivers, and to collect and analyze
such specimens from up to 1,000 fatally injured drivers. The project involved
development of kits for acquisition of specimens, development of analytical
methods for screening specimens for drugs, acquisition of specimens and anal
ysis of specimens.
Described below are the research approach and methodology, ex
perimental procedures, experimental results, analysis and interpretation
of experimental results, conclusions and recommendations and finally,
project participants.
II. RESEARCH APPROACH AND METHODOLOGY
The National Highway Traffic Safety Administration is seeking a
determination of the significance of drugs in highway fatalities. In order
to accomplish this, a comparison must be made between the incidence of drugs
in highway fatalities and the incidence of drugs in living drivers. The
project described in this report was designed to investigate the incidence
of drugs in highway fatalities--specifically the incidence of drugs in
fatally injured drivers.
The research approach and methodology of this project are described
below. (Specific details of operation are to be found in Section III
"Experimental Procedures.")
In order to gain useful information from which a determination of the incidence of drugs in fatally injured drivers could be made, the following research plan was adopted:
Midwest Research Institute (MRI) would assemble and distribute
specimen-collecting kits containing equipment, instructions and identifica
tion (ID) cards to ASAP areas and other areas for the collection of specimens.
The coroners and medical examiners would return the specimens to MRI complete with an ID card. An identical ID card would also be sent by the coroners or medical examiners to the ASAP or area director.
2
MRI would, in the meantime,. develop analytical methods for screen
ing the specimens for drugs. The methods would be qualitative and quantita
tive. Forty-four commonly used drugs, cannabinoids, and blood alcohol would
be screened for.
Upon receiving specimens, MRI would analyze them for the drugs in
the screen. The analytical results would be forwarded to both DoT and the
ASAP directors, coroners, or medical examiners from whom the specimens
originated.
Finally, DoT would issue "Request for Crash Data" forms which MRI
would distribute to all areas from which specimens have been received.
These forms would then be returned i..o MRI complete with all pertinent in
formation about the crash involved.
The information resulting from this program would then be subjected
to a statistical analysis to yield a determination of the incidence of drugs
in fatally injured drivers.
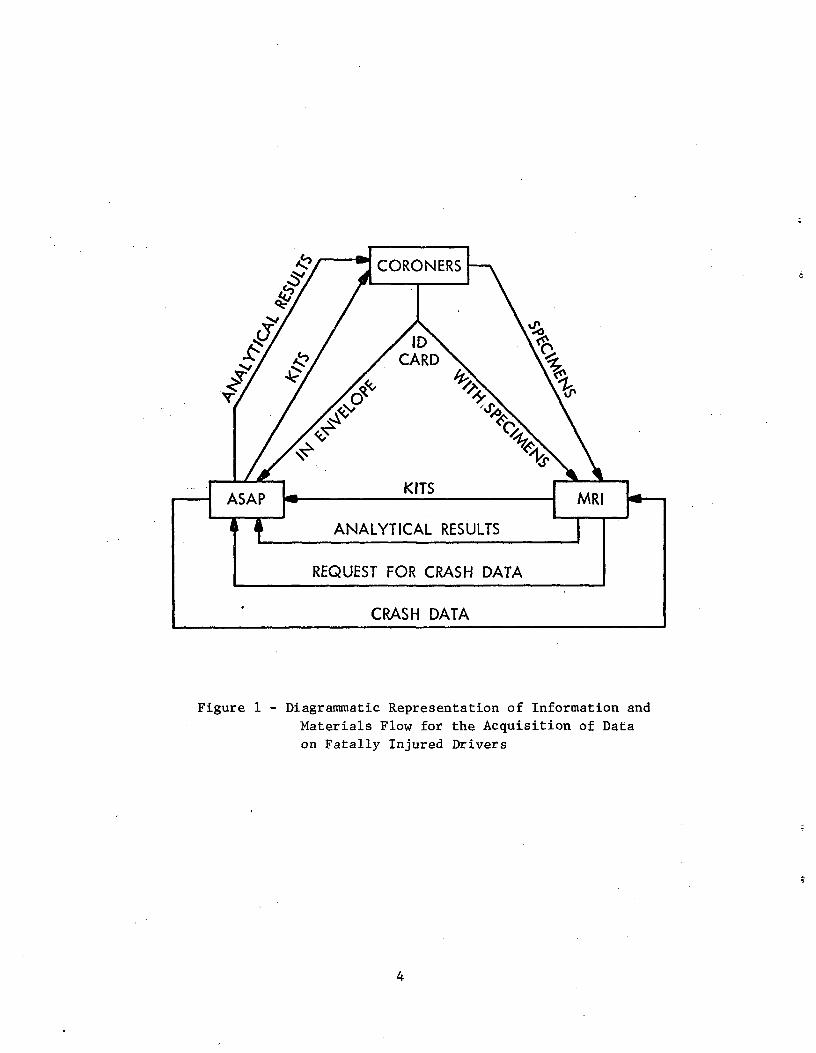
Figure 1 illustrates the major activities, information and mate
rials flow for the total program. Since this was the first program of its
type, a major effort was expended in development of methods both for acquir
ing specimens and analysis of specimens. Certain decisions had to be made
concerning the specimens, drugs and analyses, and after due consultation with
NHTSA and experts in the field, the following important decisions were made:
To acquire specimens from fatally injured drivers who were dead
on arrival at the hospital.
To acquire blood, bile and urine specimens, if possible.
To acquire face and finger washings.
To analyze blood, bile and urine for 44 more commonly abused drugs.
These analyses were to be both qualitative and quantitative.
To analyze blood samples quantitatively for alcohol.
To analyze face and finger washings qualitatively for cannabinoids
(marihuana).
This research plan involved the coordination of many persons and
agencies. The success of the plan depended on the cooperation of all con
cerned, including DoT, MRI, ASAP area directors, coroners, medical examiners
and other potential sources of samples. The accomplishments of the program
are detailed in the next section of this report, "Experimental Procedures."
3
*
JvCORONERS
v
CARD
,^^CAF
^^ Fps
ASAPKITS
M RI
a ANALYTICAL RESULTS
*
REQUEST FOR CRASH DATA
CRASH DATA
Figure 1 - Diagrammatic Representation of Information and
Materials Flow for the Acquisition of Data
on Fatally Injured Drivers *
*
*
*
4
III. EXPERIMENTAL PROCEDURES
This section details accomplishments in the various phases of the program. The following operations are described in order:
A. Preparation of Specimen Collection Kits
B. Acquisition of Specimens
C. Development of Analytical Procedures
D. Analysis of Specimens
E. Dissemination of Analytical Information
A. Preparation of Specimen Collection Kits
The specimen collection kits for this program were designed for
the collection of urine, blood, bile, and face and finger washings. All
the equipment for collection of specimens was included in the kit, which
also contained full instructions and two identification cards, one for
return to MRI and one for mailing to the local ASAP director for his files
and future reference.
ith
A specimen kit specifically consists of the following items:
1. A fully telescopic card box, 6-1/2 in. x 3 in. x 3 in., w
MRI return address and air mail postage paid.
2. A urine collection bottle, 50-ml size, with superior quality
screw cap seal, totally constructed of shatter-proof polypropylene, labeled
"URINE".
3. A bile collection bottle, 30-ml size, similar to the urine
bottle, labeled "BILE," and containing preservative (fluoride).
4. A blood collection kit consisting of a plastic bag containing
a vacutainer holder, a vacutainer blood collection needle, and three 15-ml
vacutainers treated with anticoagulant (oxalate) and preservative (fluoride).
5. A marihuana face and finger wash kit consisting of a plastic
bag containing three enclosed, protected swabs labeled "right hand," "left
hand," and "mouth;" and a small vial containing ethanol.
5
6. An instruction sheet detailing (a) requirements, and (b) howto use the kit.
7. An identification card in duplicate, enclosed in a protective
plastic bag.
8. An envelope addressed to the local ASAP director for use in
returning one of the identification cards.
These kits were assembled and dispatched to ASAP directors and
others upon request. As the program proceeded, records were kept of the
kit disposition for each area in order that each area could be constantly
.supplied with enough kits. At least 100 kits, fully assembled, were kept
on hand at MRI at all times.
Figures A-1 and A-2 indicate the instruction sheet and the identi
fication (ID) card, respectively. These figures are located in Appendix A
"Acquisition of Specimens."
B. Acquisition of Specimens
Alcohol Safety Action Program (ASAP) directors, coroners, and
medical examiners in 57 areas have been contacted by both DoT and MRI in
an effort to acquire specimens from fatally injured drivers. Letters of
program explanation, program requirements, requests for samples and memor
anda were sent to all areas. Trial kits with full instructions were also
dispatched to these areas. The response from 43 areas was sufficiently
encouraging that these areas were supplied with sufficient collection and
mailing kits to initiate specimen collection and mailing to MRI for anal
ysis. Of these 43 areas, 36 have responded as of September 7, 1973, with a
total of 710 specimen sets. Table A-I indicates the total areas contacted,
specimen kits dispatched and specimen kits received. As of September 7, 1973,
MRI has dispatched a total of 1,731 specimen collection kits and received 710
back. Table I indicates the number of specimen kits received per month dur
ing the project.
Our rapport with the supply areas is good; much of this is due to
the efforts of Dr. J. L. Nichols of the Office of Alcohol Countermeasures,
who has been in contact with all the potential areas we have requested
cooperation from.
The condition of most specimen kits was good when they were re
turned to the Institute. Although we had requested samples of urine, blood,
bile and alcohol washings in each case, it was not always possible for the
coroners or medical examiners to furnish all of these items. Table C-I
6
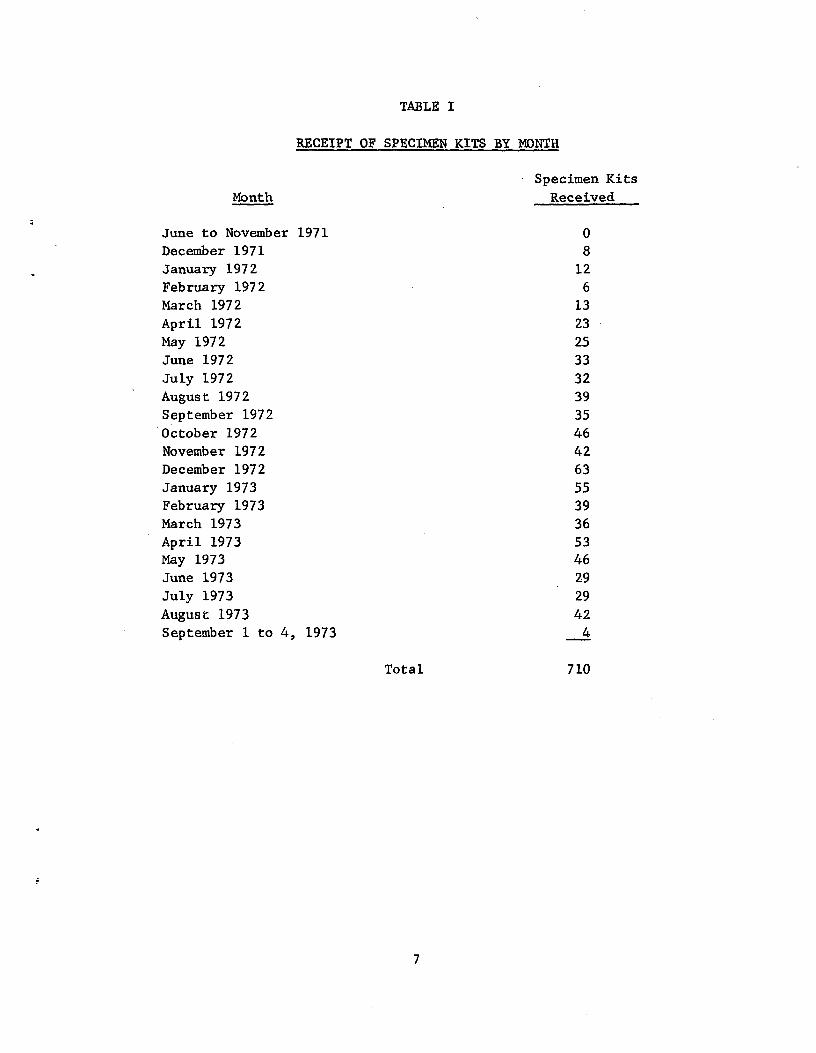
TABLE I
RECEIPT OF SPECIMEN KITS BY MONTH
Specimen Kits Month Received
June to November 1971 0 December 1971 8 January 1972 12 February 1972 6 March 1972 13 April 1972 23 May 1972 25 June 1972 33 July 1972 32 August 1972 39 September 1972 35 October 1972 46 November 1972 42 December 1972 63 January 1973 55 February 1973 39 March 1973 36 April 1973 53 May 1973 46 June 1973 29 July 1973 29 August 1973 42 September 1 to 4, 1973 4
Total 710
7
(Appendix C) includes information on the specimen kits received up until
September 7, 1973, their origin, and the status of the contents. Out of
the total 710 specimen kits, only 699 actually were collected from fatally
injured drivers. The remaining 11 were pedestrians, passenger or airplane
pilots. Of the 699 specimen kits from fatally injured drivers, 97.3% fur
nished the alcohol washes, 56.5% furnished urine, blood, and bile, 74.0%
furnished urine, 97.6% furnished blood, and 75.3% furnished bile.
At the initiation of this project, we also requested that. liver
samples be included in the program. The response from coroners and medical
examiners persuaded us that we were likely to get much better cooperation
from them if we requested only urine, blood, bile and alcohol washings.
Liver samples were, therefore, dropped from the request before any kits
were dispatched. Liver is a good source for analysis of drugs, but since
we were already requesting urine, blood, and bile, we felt that if drugs
had been taken, we would find them in at least one of the fluids requested.
Table A-II (Appendix A) lists the coroners, medical examiners and/or ASAP
personnel with whom collection arrangements were negotiated (successfully
or unsuccessfully).
C. Development of Analytical Procedures
The analytical procedures developed for this program consisted of
a qualitative thin-layer chromatography (TLC) screen followed by a quantita
tive gas chromatographic (GC) confirmation of positives from the TLC screen.
If any doubt existed as to the nature of the drug, mass spectrometric analysi
was also conducted (qualitative). TLC and GC methods were initially chosen
for their already proven reliability to detect and quantitate many drugs in
body fluids.
The above tests were carried out on extracts from the body fluids
or alcohol washes. Various extraction systems were investigated for their
suitability with the above analytical methods.
In order to quantitate drug levels in body fluids, the extraction
efficiency of the system was also determined for the drugs which were con
firmed present in body fluids during the course of this program.
Blood alcohol levels were also determined in this project using
a gas chromatographic technique. Described in detail below are the various
stages of the methods development program. They are:
1. Investigation of the characteristics of pure samples of the
drugs to be screened for.
s
8
2. Investigation of extraction systems on body fluid solutions of the drugs to be screened for.
3. Determination of extraction efficiencies.
4. Investigation of hydrolysis of specimens.
5. Development of analytical methods for marihuana.
6. Development of a total analytical system for the drugs to be
screened for.
7. Determination of blood alcohol levels.
8. Detailed description of some actual analytical system trials
using hospital autopsy samples.
1. Investigation of the characteristics for pure samples of the
drugs to be screened for: Pure samples of the drugs of interest were ac
quired from commercial chemical companies, the Bureau of Narcotics and
Dangerous Drugs, and the National Institute of Mental Health. The drugs
represented the major classes of drugs used and abused in the United States,
including sedatives tranquilizers, analgesics, stimulants, antihistamines
and decongestants, narcotics and miscellaneous, including hallucinogens.
These are listed in Table II (p. 15) under their medical classifications.
The chemical name of the drug is given and this is followed in parentheses
by the name of the most popular prescription item containing this drug if
appropriate.
The drugs were all dissolved in pure methanol at a concentration of 1 mg/ml and stored under deep freeze while not in use. These solutions were used for investigating (a) the thin-layer chromatographic (TLC) and (b) gas chromatographic (GC) characteristics of the drugs.
a. Investigation of the TLC characteristics: To a thin-
layer chromatographic plate (20 cm x 20 cm, Silica Gel G on glass, 250 u
thick) drug solutions were spotted on a horizontal line 2 cm from the
bottom of the plate. Ten microliters of solution was spotted in each case.
Each drug was spotted on at least two different plates. These plates were
then developed in glass TLC tanks containing various test solvents. After
development of the plates for 10 cmfromthe spotting line, the plates were
removed and dried by an air current. When dry the plates were sprayed with
a variety of test visualization reagents and the colors and positions (Rf
values) of the drugs noted. The most sensitive and useful solvents and
visualization reagents were then used again in duplicate tests to establish
reproducibility.
9
The solvents found superior in these tests were:
Solvent No. 1 Acetone:Chloroform 1:9
Solvent No. 2 Ethyl Acetate:Methanol:Ammonia 85:10:5
Solvent No. 3 Ethyl Acetate:Methanol:Ammonia:Benzene,
75:10:2:13
Solvent No. 6 Benzene:Chloroform, 3:7
Solvent No. 11 Benzene
These numbers are not consecutive, but are in accord with the legend to the
total developed analytical system referred to later in the script, Figure 3,
p. 22.
The visualization reagents found superior in these tests were:
UV - ultraviolet light
HgSO4 - mercuric sulfate solution--suspend 5 g of mercuric oxide
in 100 ml water, add 20 ml concentrated sulfuric
acid, cool and dilute to 250 ml with water
DPC - diphenyl carbazone solution--dissolve 5 mg in 50 ml
chloroform
KMn04 - potassium permanganate solution, 0.1% in water
FBB - Fast Blue B solution--250 mg in 100 ml of 0.1 N
hydrochloric acid, followed by a spray with 0.5 N
sodium hydroxide
Nin - Ninhydrin--commercially available in aerosol bombs
IOP - iodoplatinate solution--dissolve 1 g platinum tetra
chloride in 100 ml water, mix with 300 ml water contain
ing 10 g potassium iodide. Dilute to 400 ml with water.
Dilute 1:1 with hydrochloric acid before use.
Table B-I, located in Appendix B "Analytical Development" attached to this
report, indicates the two solvents found most suitable for the drugs of in
terest. The most suitable visualization reagents are also shown. Tables
B-Il and B-III (Appendix B) list the mobilities and color reactions for all
the drugs using these solvents and visualization reagents.
b. Investigation of the GC characteristics: Aliquots of
standard drug solutions were treated with acid or base to release the free
drug and then subjected to GC analysis.
10
Two columns were developed for these drugs--a 6-ft and a
4-ft column, 2 mm and 4 mm ID, respectively, packed with 3% OV-1 on 100/120
mesh Gas Chrom Q. The carrier gas was nitrogen at a flow rate of 50 ml/min,
detector temperature was 260°C, injection port was 240°C. The column tempera
ture was varied. The instrument used in these investigations was a Bendix
2500 Gas Chromatograph. Table B-IV (Appendix R) lists the drug, column used,
column temperature and retention time for all the drugs of interest. The
cannabinoids (marihuana) were excluded from this test since they were analyzed
for by TLC or a color test (qualitative). Reproducibility was ascertained for
the retention times by duplicate runs. The barbiturates were run either as
free barbiturates or as methylated derivatives depending on the retention time
desired. Morphine and hydromorphone had to be methylated to produce reason
able retention times. Methylation was produced on-column using standard
commercial methylation reagents. Acetyl salicyclic acid and salicylic
acid were silylated before injection to produce useful retention times.
2. Investigation of extraction systems on body fluid solutions of drugs to be screened for: Two types of extraction systems were considered
for this program--liquid extraction with diethyl ether and ion-exchange resin
column extraction with XAD-2 resin.* The two methods and their comparison
are described below.
a. Liquid extraction: A volume of body fluid was treated as follows:
Urine - Take 20 ml,
Blood - Take 15 ml, dilute 1:1 with water
Bile - Take 10 ml, dilute 1:1 with water
The fluid was then taken to pH 2.2 with hydrochloric acid and shaken with
an equal volume of diethyl ether. The phases were allowed to separate and
the ether phase removed and allowed to evaporate to a residue. The aqueous
phase was taken to pH 9.3 and extracted again with an equal volume of ether.
Another extraction at pH 11.0 provided a third residue. These residues were
taken up in 100 u1 of methanol and subjected to thin-layer chromatography
and gas chromatography.
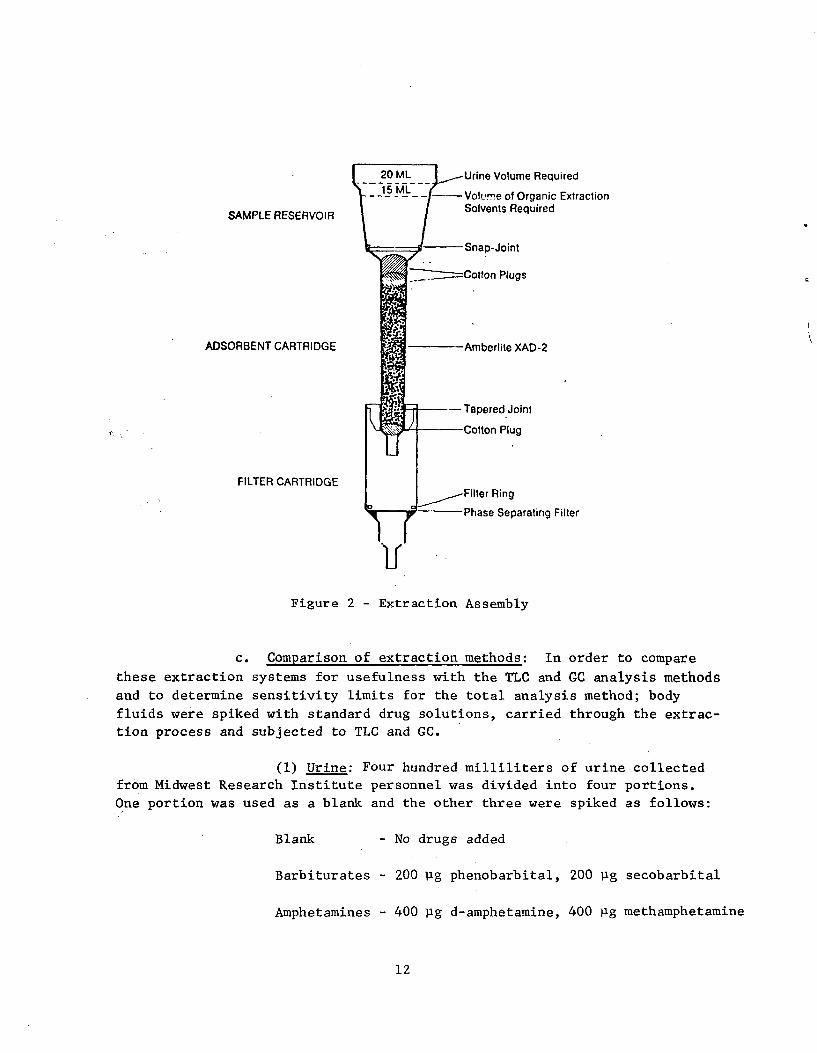
b. Ion exchange resin extraction: The body fluids, diluted
as for liquid extraction, were placed over a column of XAD-2 resin as shown
in Figure 2. The pH of the fluid was adjusted to 9.2 with a buffer solution
and the fluid allowed to run through the column. The fluid was then dis
carded and the column washed with 20 ml water. The drugs were then eluted
from the column using 20 ml of 1,2-dichloroethane/ethyl acetate, 4:6. This
eluate was evaporated to dryness on a water bath at 60°C after the addition
of 1 drop of concentrated hydrochloric acid. The residue was reconstituted
in 100 ill methanol and subjected to thin-layer chromatography and gas
chromatography.
* Available from Brinkmann Instruments, Inc., or Rhom and Haas, Inc.
11
*
20 ML Urine Volume Required15 ML
Volume of Organic ExtractionSolvents Required
SAMPLE RESERVOIR
Snap-Joint
Cotton Plugs
ADSORBENT CARTRIDGE Amberlite XAD-2
- Tapered Joint
Cotton Plug
FILTER CARTRIDGEFilter Ring
Phase Separating Filter
11Figure 2 - Extraction Assembly
c. Comparison of extraction methods: In order to compare *
these extraction systems for usefulness with the TLC and GC analysis methods
and to determine sensitivity limits for the total analysis method; body
fluids were spiked with standard drug solutions, carried through the extrac-
tion process and subjected to TLC and GC.
(1) Urine: Four hundred milliliters of urine collected
from Midwest Research Institute personnel was divided into four portions.
One portion was used as a blank and the other three were spiked as follows:
Blank - No drugs added
*
Barbiturates - 200 ug phenobarbital, 200 ug secobarbital
Amphetamines - 400 jig d-amphetamine, 400 jig methamphetamine
12
Narcotics - 400 jig methadone, 400 jig cocaine, 400 pg
hydromorphone
200 Ag morphine, 200 jig codeine, 200 Rg
meperidine
200 jig quinine, 50 pg nicotine
The above solutions were extracted by both methods,
and the extracts subjected to TLC and GC.
The experiments were repeated until reproducible results
were obtained using any one batch of body fluid. The results for the ether
and resin extraction methods are shown below. In all cases, the resin method
gave cleaner extracts than the ether method. The resin method also yielded
better extraction of many kinds of drugs, especially morphine. At the level
tested, amphetamines and nicotine were detectable only by the resin extract
method.
Drugs Spiked Drugs Found in the Extraction Method
Into Urine Ether Resin
Blank Negative for all Negative for all drugs drugs
Barbiturates Secobarbital Secobarbital
Phenobarbital Phenobarbital
Narcotics Methadone Methadone
Cocaine Cocaine
Hydromorphone Hydromorphone
Morphine (weak) Morphine (very strong)
Codeine Codeine
Meperidine Meperidine
Quinine Quinine
Nicotine
Amphetamines Negative for both d-Amphetamine
Methamphetamine
(2) Blood: Two hundred milliliters of blood (from a
local blood bank) was diluted with 200 ml of water and divided into 100-ml
portions. The portions were spiked with the same drugs and in the same
concentrations as in the case of urine. The blood used in these experiments
was treated with heparin or sodium oxalate to prevent coagulation and with
sodium fluoride to preserve the blood. Extraction procedures employed were
the same as those for urine and were followed by the same TLC and GC pro
cedures as used for urine extracts. In addition, deproteinization of the
13
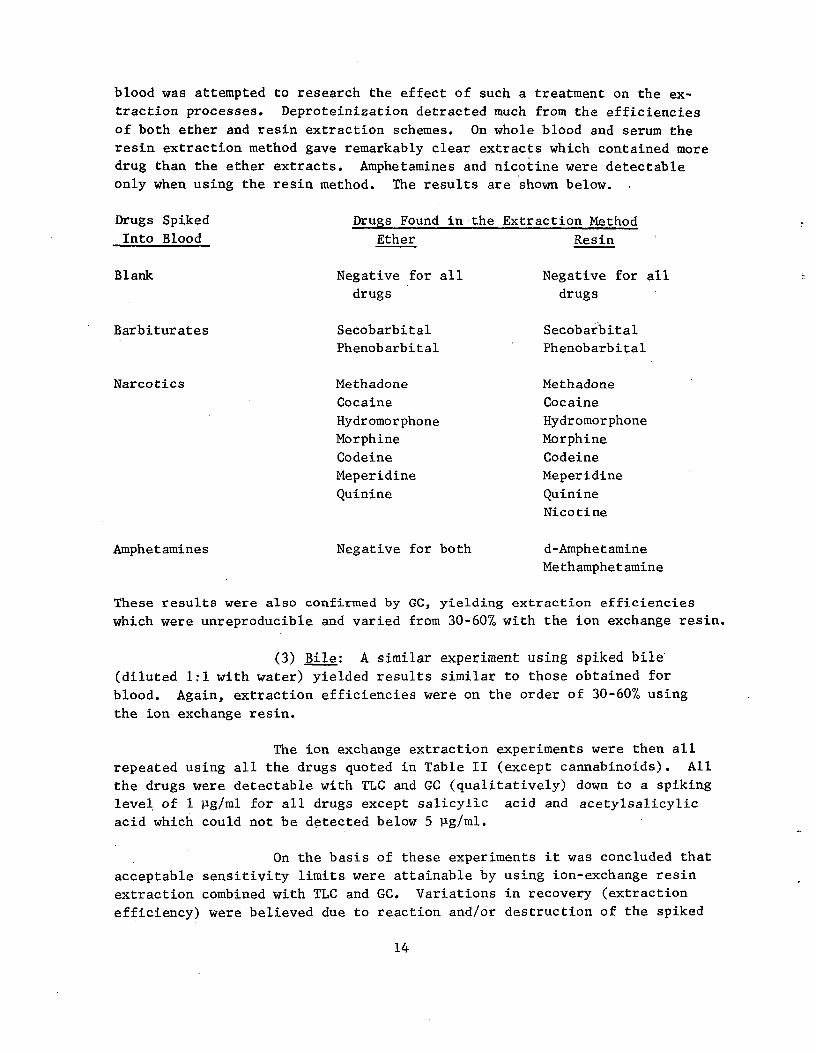
blood was attempted to research the effect of such a treatment on the ex
traction processes. Deproteinization detracted much from the efficiencies
of both ether and resin extraction schemes. On whole blood and serum the
resin extraction method gave remarkably clear extracts which contained more
drug than the ether extracts. Amphetamines and nicotine were detectable
only when using the resin method. The results are shown below.
Drugs Spiked Drugs Found in the Extraction Method
Into Blood Ether Resin
Blank Negative for all Negative for all drugs drugs
Barbiturates Secobarbital Secobarbital
Phenobarbital Phenobarbital
Narcotics Methadone Methadone
Cocaine Cocaine
Hydromorphone Hydromorphone
Morphine Morphine
Codeine Codeine
Meperidine Meperidine
Quinine Quinine
Nicotine
Amphetamines Negative for both d-Amphetamine
Methamphetamine
These results were also confirmed by GC, yielding extraction efficiencies
which were unreproducible and varied from 30-60% with the ion exchange resin.
(3) Bile: A similar experiment using spiked bile (diluted 1:1 with water) yielded results similar to those obtained for
blood. Again, extraction efficiencies were on the order of 30-60% using the ion exchange resin.
The ion exchange extraction experiments were then all
repeated using all the drugs quoted in Table II (except cannabinoids). All
the drugs were detectable with TLC and GC (qualitatively) down to a spiking
level of 1 ug/ml for all drugs except salicylic acid and acetylsalicylic
acid which could not be detected below 5 Pg/ml.
On the basis of these experiments it was concluded that
acceptable sensitivity limits were attainable by using ion-exchange resin
extraction combined with TLC and GC. Variations in recovery (extraction
efficiency) were believed due to reaction and/or destruction of the spiked
14
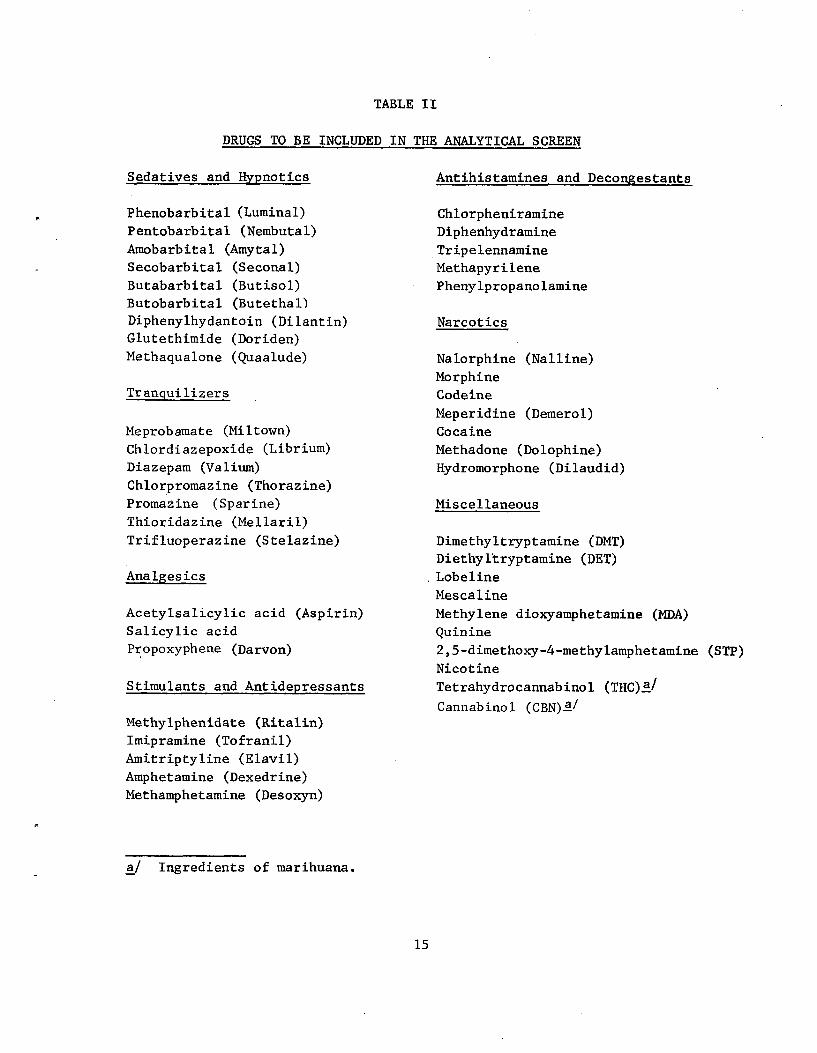
TABLE II
DRUGS TO BE INCLUDED IN THE ANALYTICAL SCREEN
Sedatives and Hypnotics
Phenobarbital (Luminal)
Pentobarbital (Nembutal)
Amobarbital (Amytal)
Secobarbital (Seconal)
Butabarbital (Butisol)
Butobarbital (Butethal)
Diphenylhydantoin (Dilantin)
Glutethimide (Doriden)
Methaqualone (Quaalude)
Tranquilizers
Meprobamate (Miltown)
Chlordiazepoxide (Librium)
Diazepam (Valium)
Chlorpromazine (Thorazine)
Promazine (Sparine)
Thioridazine (Mellaril)
Trifluoperazine (Stelazine)
Analgesics
Acetylsalicylic acid (Aspirin)
Salicylic acid
Propoxyphene (Darvon)
Stimulants and Antidepressants
Methylphenidate (Ritalin)
Imipramine (Tofranil)
Amitriptyline (Elavil)
Amphetamine (Dexedrine)
Methamphetamine (Desoxyn)
a/ Ingredients of marihuana.
Antihistamines and Decongestants
Chlorpheniramine
Diphenhydramine
Tripelennamine
Methapyrilene
Phenylpropanolamine
Narcotics
Nalorphine (Nalline)
Morphine
Codeine
Meperidine (Demerol)
Cocaine
Methadone (Dolophine)
Hydromorphone (Dilaudid)
Miscellaneous
Dimethyltryptamine (DMT)
Diethyl'tryptamine (DET)
.Lobeline
Mescaline
Methylene dioxyamphetamine (MDA)
Quinine
2,5-dimethoxy-4-methylamphetamine (STP)
Nicotine
Tetrahydrocannabinol (THC)a/
Cannabinol (CBN)a/
15
drugs in the body fluids before extraction, since duplicate extractions from the same spiked body fluid yielded reproducible results.
3. Determination of extraction efficiencies: It was found in
previous.work that spiking actual body fluids with low levels of drugs
(1-2 Rg/ml) resulted in unreproducible extraction efficiencies between
different samples of the same body fluid (e.g., urine). We came to the
conclusion that this was due to reaction of the small amount of drug with
the varying ingredients in body fluids. The extraction efficiency was
sufficiently large to give the method a useful sensitivity but not repro
ducible enough for quantitation of drugs in the body fluids.
It was therefore decided to calculate the extraction efficiencies
from water and make the assumption that the same extraction efficiency would
hold for body fluids. This is a valid assumption since body fluids are
mainly water, the ion-exchange resin is capable of extracting 1,000 times
the amount of body fluid we actually use, and we are detecting only the free
drugs.
Another assumption made was that the extraction efficiency at 10
or 20 ug/ml would be the same as at 1 or 2 p.g/ml. To test this, the extrac
tion efficiency of phenobarbital was investigated at levels of 20 ug/ml,
10 pg/ml and 5 Rg/ml in water. Ultraviolet spectroscopy of the initial solu
tions, the water solution after passage through the ion exchange column, and
the eluates from the columns, indicated that the extraction efficiency was
75% at all spiking levels. This was also confirmed by gas chromatography.
It was found necessary to reconstitute all column eluates in at least 1/2 ml
of methanol to avoid loss of drug from the residue vessels. This 1/2 ml
of solution was then reduced to 100 Ill for submission to TLC and GC.
The extraction efficiencies for other drugs were conducted at
levels of 10 ug/ml from water. Experiments were conducted in duplicate to
ensure reliability. These extraction efficiencies as shown in Table III
are used to quantitate levels of drugs found by GC in the body fluids. Ex
traction efficiencies have only been calculated for those drugs we have en
countered in body fluids of fatally injured drivers in this program.
4. Investigation of hydrolysis of specimens: Many drugs, when
administered, are not only metabolized to some extent but are also conjugated
to glucuronic acid as part of the body's effort to aid excretion. These
conjugates or glucuronides will not appear on drug analysis screens since
only free drug is assayed by most analytical methods. It is desirable,
therefore, to break up the glucuronides to the free drug and glucuronic
acid. Hydrolysis will accomplish this, and can be conducted by using acid
or enzymes.
16
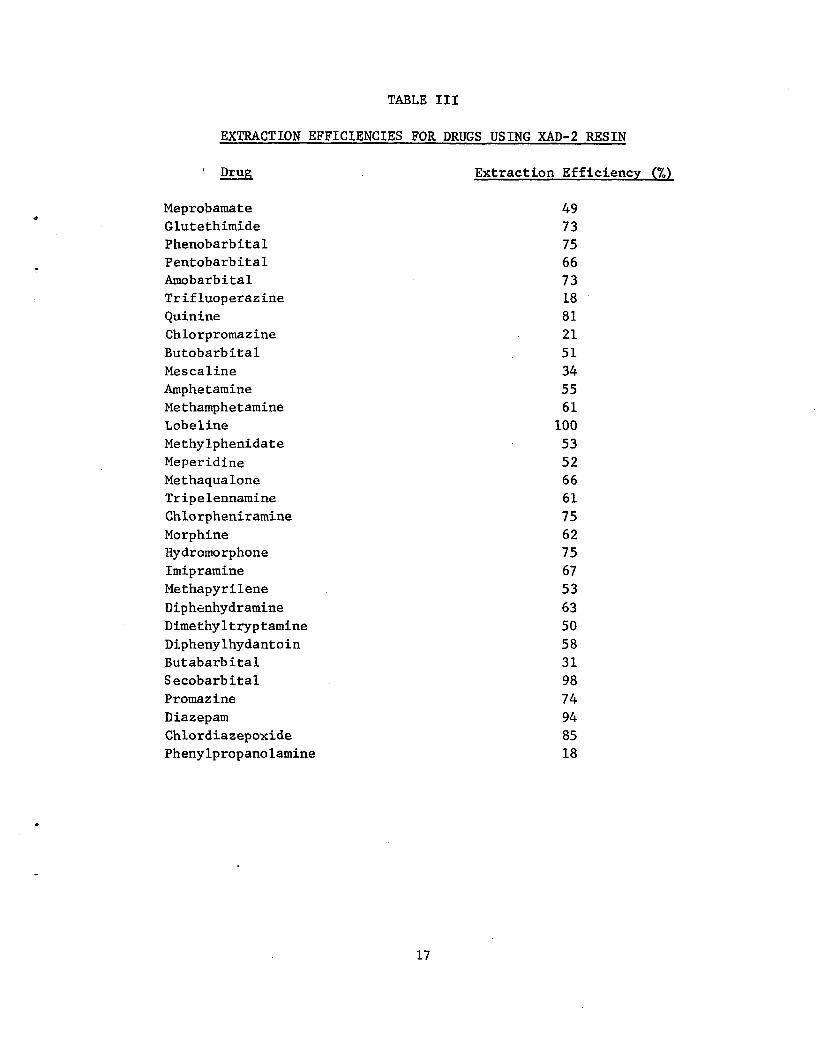
TABLE III
EXTRACTION EFFICIENCIES FOR DRUGS USING XAD-2 RESIN
Drug Extraction Efficiency (%)
Meprobamate 49
Glutethimide 73
Phenobarbital 75
Pentobarbital 66
Amobarbital 73
Trifluoperazine 18
Quinine 81
Chlorpromazine 21
Butobarbital 51
Mescaline 34
Amphetamine 55
Methamphetamine 61
Lobeline 100
Methylphenidate 53
Meperidine 52
Methaqualone 66
Tripelennamine 61
Chlorpheniramine 75
Morphine 62
Hydromorphone 75
Imipramine 67
Methapyrilene 53
Diphenhydramine 63
Dimethyltryptamine 50
Diphenylhydantoin 58
Butabarbital 31
Secobarbital 98
Promazine 74
Diazepam 94
Chlordiazepoxide 85
Phenylpropanolamine 18
17
Acid hydrolysis is fast and efficient, but it also destroys free
drug. The extent of destruction depends on the nature of the drug. Enzyme
hydrolysis is slow but; gentle. The enzyme usually used, 8-glucuronidase,
breaks down only the glucuronide conjugates.
Spiked body fluid experiments were conducted as in the extraction
investigation, using ion exchange resin columns followed by TLC of the re
constituted residues. However, hydrolysis was conducted before extraction
to determine if any detrimental effects were produced by the hydrolysis
conditions. The hydrolysis conditions were:
a. Acid hydrolysis: The spiked fluid was taken to pH 2.0
with hydrochloric acid and then autoclaved at 15 psi for 20 min. After
cooling, the fluids were extracted.
b. Enzyme hydrolysis: The spiked fluid was taken to pH 5.2
and incubated at 37°C for 18 hr in the presence of B-glucuronidase. The
resultant fluids were filtered and then extracted.
The results indicated that acid hydrolysis destroyed quinine
and cocaine and that some barbiturates were lost due to volatility. The
enzyme method destroyed no drugs and no volatilization of drugs was evident.
It was concluded that enzyme hydrolysis of urine, blood, and
bile samples was the most suitable method for the analytical scheme for this
program.
5. Development of analytical methods for marihuana: Six human
volunteers underwent the following experimental procedure in order to
examine the feasibility of detecting marihuana components by washing the
oronasal areas and fingers.
Each volunteer was swabbed around the mouth, nose, inside the
mouth and on the teeth and gums with a cotton ball dipped in ethanol.
Fifty milliliters of ethanol were placed in a beaker for this purpose and
the examiner wore rubber gloves, holding the cotton ball with metal tweezers.
The cotton balls were dipped in the ethanol, squeezed dry and discarded.
The thumb and first two fingers of each hand were dipped into the beaker
and shaken for 15 sec. The ethanol was then allowed to evaporate in a
hood in preparation for analysis.
Each volunteer was then required to smoke a reefer of marihuana.
The marihuana used was a good quality government-furnished variety. The
volunteers were left to smoke at their own pace although they were kept
under strict observation at all times.
18
The volunteers were then washed with ethanol in a similar manner as prior to smoking. The ethanol was evaporated in a hood in preparation for analysis.
Blank specimens consisted of 50 ml of ethanol which was evaporated
to dryness in preparation for analysis.
Spiked specimens consisted of 10 ug each of THC and cannabinol in
50 ml of ethanol. The solution was evaporated in preparation for analysis.
Analysis of the residues from the ethanol solutions was carried
out as follows:
a. Volunteers 1, 2, 3, blank and spiked specimens: The
residues were dissolved in 1 ml of a 1:1 mixture of benzene and petroleum
ether. The solution was placed on an alumina column and washed with 10 ml
of the same benzene:petroleum ether solution. The cannabinoids were then
eluted with 5 ml of a 1:1 mixture of benzene:chloroform. The eluate was
evaporated to 1/2 ml and spotted on a TLC plate. The plate was developed
in benzene and sprayed with Fast Blue B, followed by sodium hydroxide solu
tion (0.5N). A standard solution of THC was applied to each plate before
developing the check on the validity of the results.
It was found that in all cases the washings showed either
no cannabinoids present or extremely faint indications of their presence.
The standard THC spot showed up very well in all cases. The conclusion is
that the cannabinoids were trapped on the column. Further elution did
alleviate the problem.
b. Volunteers 4, 5, 6, blank and spiked specimens: The
residues were dissolved as much as possible in 1 ml of methanol. Surplus
fat was physically removed from the solution. Methanol solution (1/2 ml)
was spotted onto TLC plates along with a standard spot of THC. The plates
were developed in benzene and sprayed with Fast Blue B followed by 0.5N
sodium hydroxide.
In the case of the blank specimen, no detectable traces of
cannabinoids were found. Likewise with all three "before smoking" washes-
no cannabinoids were found. The standard THC spot gave a red spot at Rf
4.0; the spiked wash gave two spots, red at Rf 4.0 (THC),. blue at Rf 4.75
(cannabinol). All three "after smoking" washes gave strong bright spots,
red at Rf 4.5 (THC) and blue at Rf 4.75 (cannabinol).
The total results are summarized in Table IV. The conclu
sion is that the column technique, while removing fat from the samples,
also removes much or most of the very fat soluble cannabinoids. Elimina
tion of the column purification step results in a spotting solution from
19
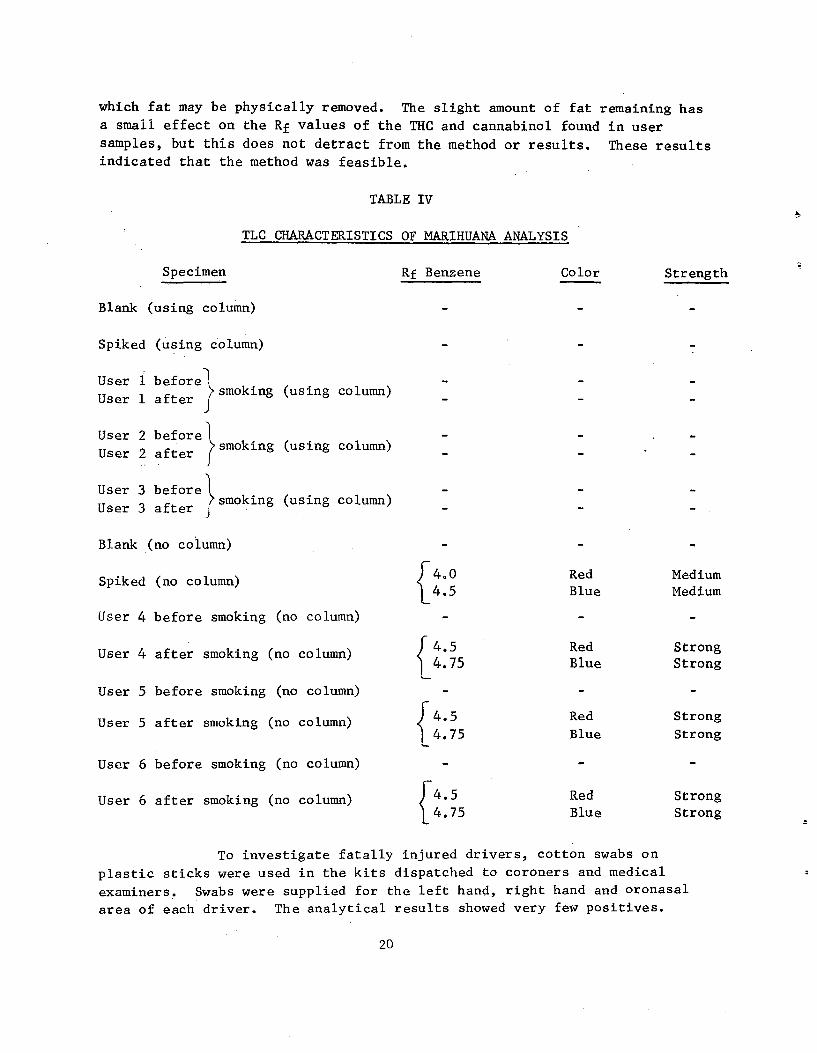
which fat may be physically removed. The slight amount of fat remaining has
a small effect on the Rf values of the THC and cannabinol found in user
samples, but this does not detract from the method or results. These results
indicated that the method was feasible.
TABLE IV
TLC CHARACTERISTICS OF MARIHUANA ANALYSIS
Specimen Rf Benzene Color Strength
Blank (using column) - -
Spiked (using column)
User 1 beforel - - smoking (using column)
User 1 after
User 2 before smoking (using column)
User 2 after
User 3 before l smoking (using column)
User 3 after
Blank (no column)
400 Red MediumSpiked (no column) 4.5 Blue Medium
User 4 before smoking (no column)
4.5 Red StrongUser 4 after smoking (no column)
4.75 Blue Strong1User 5 before smoking (no column)
User 5 after smoking (no column) 4.5 Red Strong
4.75 Blue Strong
User 6 before smoking (no column)
User 6 after smoking (no column) 14.5 Red Strong4.75 Blue Strong
To investigate fatally injured drivers, cotton swabs on
plastic sticks were used in the kits dispatched to coroners and medical
examiners. Swabs were supplied for the left hand, right hand and oronasal
area of each driver. The analytical results showed very few positives.
20
and upon investigation it was found that the swabs were retaining the
cannabinoids, i.e., elution of the cannabinoids from the swabs was not
occurring. Experiments in which the swabs were spiked with cannabinoids
indicated that the cannabinoids were stable on the swabs for periods of
over 3 weeks at room temperature and it was therefore concluded that a
color test for cannabinoids on the swab would yield better results than the
TLC method which required elution. The on-the-swab test method has been
proven effective for lip swabs from marihuana pipe smokers and is documented.
in the U.S. Army Land Warfare Laboratory Technical Report No. LWL-CR-08C72.
Seventy-eight percent of a population of 100 smokers yielded positive results
in this study after smoking 600 mg of marihuana containing 1.7% THC. No
false positives were recorded. Table B-5 (page 70) summarizes the results
of the LWL study. Interfering substances in this test were evaluated using
spiked swabs and the only substances found constituting an interference were
Areca, Catechu, Mormon Tea and Yohimbe. Table B-VI (page 71) lists the sub
stances examined for interference in this test and the color reactions ob
tained. The on-the-swab test consists of moistening the swabs with two drops
of 0.25% Fast Blue B in 0.1N hydrochloric acid and allowing them to dry for
2 min. Following this period, the swabs are moistened with two drops of 0.2N
sodium hydroxide solution. Any red or pink color appearing within 2 sec
of the addition of the sodium hydroxide is considered a positive.
The on-the-swab color test was employed on fatally injured
driver swabs in the latter part of this program. Of the 710 sample sets
analyzed, Nos. 1-365 were analyzed using the TLC method in which the three
swabs were combined in an eluate, and Nos. 366-710 were analyzed using the
.on-the-swab method on the three separate swabs (left-hand, right-hand, mouth).
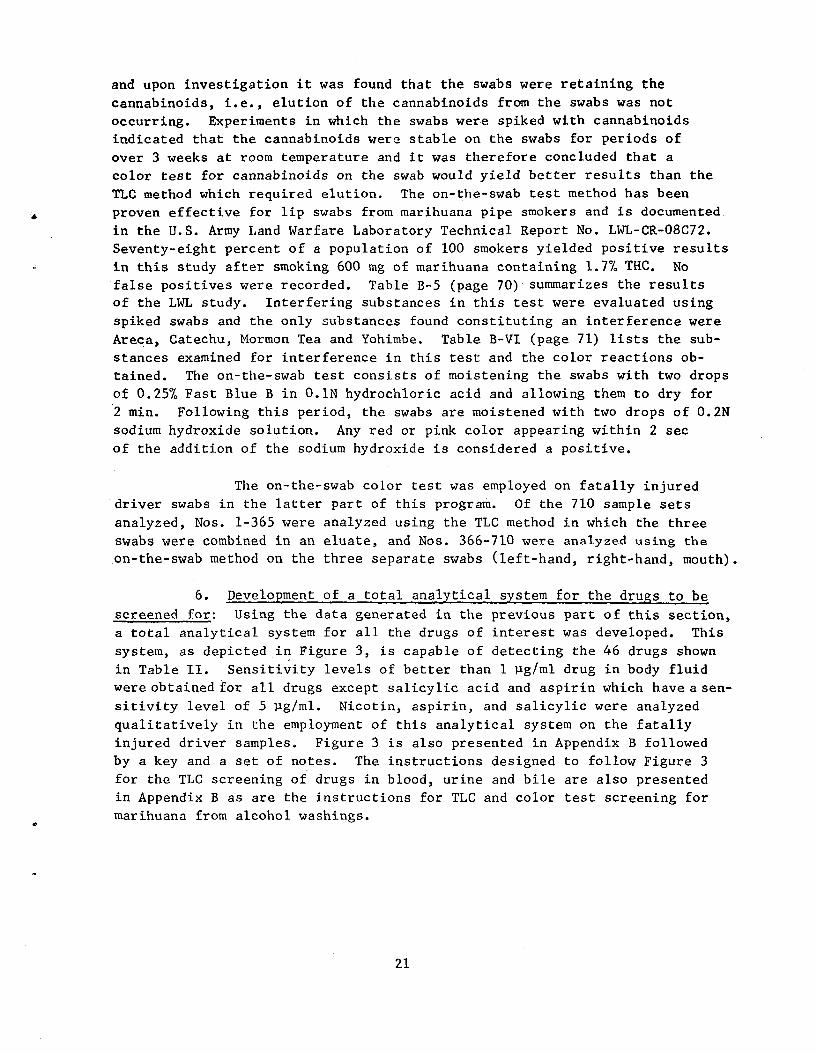
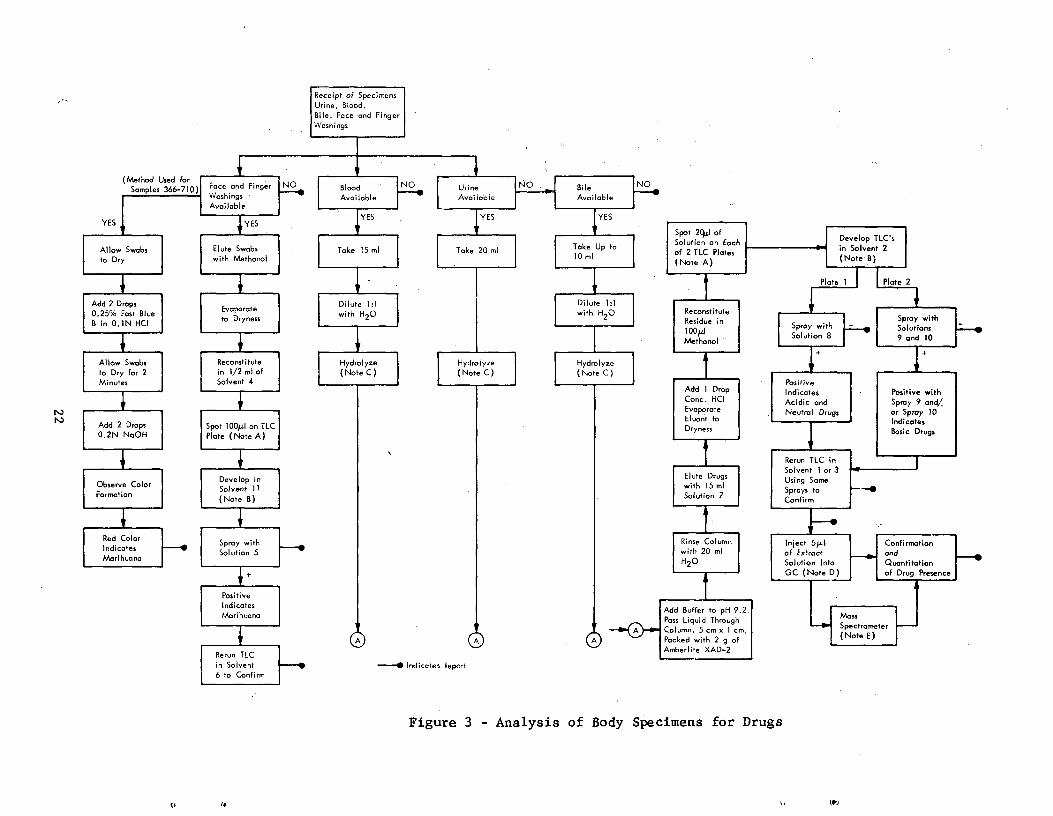
6. Development of a total analytical system for the drugs to be
screened for: Using the data generated in the previous part of this section,
a total analytical system for all the drugs of interest was developed. This
system, as depicted in Figure 3, is capable of detecting the 46 drugs shown
in Table II. Sensitivity levels of better than 1 ug/ml drug in body fluid
were obtained for all drugs except salicylic acid and aspirin which have a sen
sitivity level of 5 Jig/ml. Nicotin, aspirin, and salicylic were analyzed
qualitatively in the employment of this analytical system on the fatally
injured driver samples. Figure 3 is also presented in Appendix B followed
by a key and a set of notes. The instructions designed to follow Figure 3
for the TLC screening of drugs in blood, urine and bile are also presented
in Appendix B as are the instructions for TLC and color test screening for
marihuana from alcohol washings.
21
*
Receipt of Specimens
Urine, Blood,
Bile, Face and FingerWashings
(Method Used forSamples 366-710)
LI
Foce and Finge
Washings
t
Blood NO Urine
Available l Available
NO Bile
Available
NO
Available
YES YESYES YES
Allow Swabs
to Dry
Elute Swabswith Methanol
IltYES
Take 20 ml Take Up to10 ml
Spot 2[I ofSolution on Eachof 2 TLC Plates(Note A)
Develop TLC'sin Solvent 2(Note B)
Plate 1 I I Plate 2
Add 2 Drops0.25% Fast BlueB in 0.1N HCI
Evaporateto Dryness
Dilute 1:1with H2O *
ReconstituteResidue inloopMethanol
Spray withSpray with SolutionsSolution 8 9 and 10
Allow Swabs Reconstitute Hydrolyze Hydrolyze 4
to Dry for 2 in 1/2 ml of (Note C) (Note C)Minutes Solvent 4 J Positive
Add 1 Drop Indicates Positive with
Add 2 Drops0.2N NaOH
Spot 100µI on TLCPlate (Note A)
*
Conc. HCIEvaporateEluant toDryness
f
Acidic and Spray 9 and/Neutral Drugs or Spray 10
I ndi tca es
Basic Drugs1Rerun TLC in
Observe ColorFormation
Develop inSolvent 11(Note B)
*
Elute Drugswith 15 mlSolution 7
Solvent I or 3Using SomeSprays to
Confirm
4
Red Color
Indicates
Marihuana
Spray withSolution 5
Rinse Columnwith 20 mlH2O
Inject 5N.1 Confirmationof Extract and
Solution Into Quantitation
GC (N to e D) of Drug Presence
PositiveI ndicatesMarihuano
I A
•
Add Buffer to pH 9.2.Pass Liquid ThroughColumn, 5 cm x 1 cm,Packed with 2 g of
MauL Spectrometer
(Note E)
Amberlite XAD-2Rerun TLC
in Solvent --♦ Indicates Report6 to Confirm
Figure 3 - Analysis of Body Specimens for Drugs
Should a positive be qualitatively confirmed by the TLC screen,
the residue containing that positive is subjected to GC analysis by in
jection of 5 pl of the methanolic residue solution into a Bendix 2500 Gas
Chromatograph, using the conditions cited.
7. Determination of blood alcohol levels: All blood specimens
obtained from fatally injured drivers were assayed for blood alcohol. The
r method employed for this assay was a gas-chromatographic technique using
the "head space" method. A small quantity of blood was placed in a serum
bottle with a tight-fitting septum and maintained at a constant temperature
of 40°C for at least 1/2 hr. Analyses were performed by injecting several
microliters of the head space gas above the blood specimen into a GC with
a flame ionization detector. The column was 2 ft by 1/8 in. OD stainless
steel packed with 100/120 mesh Porapak Q. The column temperature was held
at 110°C and the carrier gas flow was held at 50 cc/min.
These conditions gave good peak shape and separation for ethyl
alcohol and acetonitrile, which was employed as an internal standard. A
standard curve was prepared over the concentration range 0.050 to 0.400%
by spiking water at these levels and adding a known amount of acetonitrile.
These solutions were run on the gas chromatograph and the ratio of the
ethyl alcohol to the acetonitrile peak was plotted against percent alcohol.
This curve was employed to determine the alcohol concentration in the blood
samples by extrapolating the peak height ratios to alcohol concentration.
8. Detailed description of some actual analytical system trials
using hospital autopsy samples: Before analysis of fatally injured driver
specimens, several autopsy specimens were examined from the local area
(Kansas City). In most cases, the drugs administered before death were
known. The samples were put through the fully developed screen and con
firmation systems. Detailed below are the results of analysis of fluids
from four autopsy cases.
Drugs Known ID No.
Administered and Specimen Analytical Results
Barbiturates N-71-244 Phenobarbital Blood 2.75 pg/ml
Demerol and N-71-252 Demerol
Morphine Urine 72.4 jig/ml Morphine
42.2 pg/ml
Blood
Bile
23
Drugs Known ID No.
Administered and Specimen Analytical Results
Demerol N-71-257 Demerol
Urine 32.1 ug/ml
Blood Demerol
6.5 fig/ml
Bile Demerol
2.5 iig/ml
Tuinal and MDA* No ID
Urine Phenobarbital 0.317 Pg/ml
Amphetamine 0.13 Jig/ml
Blood Phenobarbital 0.47 ug/ml
Amphetamine trace
Bile Phenobarbital 3.65 ug/ml
Amobarbital 0.217 ug/ml
Secobarbital 0.155 Rg/ml
Amphetamine trace
Specimen acquisition was not easy, but we believe that these four
examples indicate the analytical system developed for this project is most
adequate for detecting drugs in fatally injured drivers.
D. Analysis of Specimens from Fatally Injured Drivers
Specimens from 699 fatally injured drivers have been analyzed using the methods developed and described earlier. The procedure adopted for analy
sis operations was as follows:
1. Specimens are logged in as soon as they arrive. The contents are checked, repackaged if necessary, and frozen until needed for analysis. The ID card is placed in a file and the data from it also entered into a log book and a lab record book.
* It was indicated that the woman had ingested "Tuinal" tablets known to
contain amobarbital and secobarbital. It was also reported that she had
taken a street drug which was analyzed by our laboratory and found to con
tain MDA (methylene dioxy amphetamine) which would be metabolized to amphet
amine. Our analytical results agree with these reports. The official labo
ratory, to which autopsy specimens were also sent, was unable to find amphet
amine and could not find any barbiturates at a level consistent with over
dose symptoms.
24
2. The face and finger washes are analyzed for cannabinoids (mari
huana).
3. Five milliliters of blood is removed for alcohol assay.
4. The fluids are hydrolyzed, diluted, extracted and the extracts frozen until needed.
5. The extracts are subjected to a thin-layer chromatographic (TLC)
screen.
6. Positives from the TLC are run again in a second solvent for
qualitative confirmation.
7. Confirmed positives are reconfirmed and quantitated using gas
chromatography on the same extract.
8. The extracts are subjected to mass spectrometry if any doubt
exists as to the nature of the drug.
9. The results are compiled in a notebook and reports. Quantita
tion is effected using the GC data in conjunction with the extraction efficiency data.
The analytical method developed is dependent on the use of the
XAD-2 extraction resin for body fluid analysis. Quality control checks on
the extraction method were continuously carried out by the laboratory using
spiked samples of body fluids.
The results of the analysis of the 699 specimen sets are presented in Section IV of this report.
. Dissemination of Analytical Information
The analytical data derived from the fatally injured drivers have
been compiled in letter form and distributed to the ASAP Regional Directors
and others from whom the specimens originated. This service to the coroner
and medical examiner has aided in maintaining cooperation between the parties
concerned in this project.
25
IV. EXPERIMENTAL RESULTS
The experimental results for the 699 fatally injured drivers are
listed in Table C-I (Appendix q attached to this report). This listing also
contains 11 sets of specimens which were later found to be collected from
victims other than drivers. The total listing therefore numbers 710 speci
men sets. Table C-I indicates the location of the crash, date of crash,
whether or not detailed information of the crash was available, time of
crash, age and sex of the victim, type of crash and whether the driver
(victim) was at fault. This is followed by the blood alcohol, marihuana and
drug analyses. Drug levels are recorded in jig/ml. The drug level may be
converted to mg % by dividing the Rg/ml level by 10.
The analysis and interpretation of these results are presented inthe next section.
V. ANALYSIS AND INTERPRETATION OF EXPERIMENTAL RESULTS
In order to fully interpret the analytical results from Table C-I,
additional pertinent data on the details of the crashes are necessary. To
fulfill this need, Crash Data Information Forms as shown in Appendix A were
dispatched to each area submitting specimens. The forms were dispatched in
duplicate for each specimen submitted.
As of September 7, 1973, 249.Crash Data Forms had been received
,for the 699 fatally injured drivers analyzed. Table C-I (Appendix C) in
dicates for which drivers Crash Data Forms have been completed. Information
on age and sex of the victim, date, time and type of crash and whether the
driver (victim) was at fault or not has been recorded in Table CI as indicated
from the Crash Data Forms. Copies of the Crash Data Forms have been submitted
to DoT.
To aid in the assessment of the data in Table C-I, and in particular
to assess the amount of bias in the sampling of fatally injured drivers, each
.area submitting samples was asked to complete a questionnaire such as that
shown on p. 38, Appendix A. This questionnaire was designed to elicit in
formation on whether the samples submitted from a given area represented 100%
of the fatally injured drivers within the time period samples were submitted,
and if not, the reasons why not. Table A-III lists the replies from respond
ing areas. Twenty-five areas responded out of the 36 areas receiving the
questionnaire. Essentially, nine areas submitted specimens with no bias.
Twenty areas submitted specimens with no deliberate bias. One area sub
mitted only male drivers and four areas submitted specimens biased on sus
picion of drugs. These latter four areas submitted a total of 60 driver
specimen sets.
26
For the purpose of statistical analysis of the results, specimen
sets 34, 82, 361, 408, 410, 468, 475, 500, 501, 502, and 562 are omitted
since it was found that there victims were not fatally injured drivers.
The remaining 699 specimen sets have been analyzed statistically as below:
A. Specimens Collected
In the 699 specimen sets, from fatally injured drivers, collection
of the following fluids was achieved as follows:
Urine - 517 specimens, i.e., 74.07. of possible total
Blood - 682 specimens, i.e., 97.6% of possible total
Bile - 526 specimens, i.e., 75.3% of possible total
Specimen sets complete with urine, blood, and bile numbered 395,
i.e., 56.5% of possible total. Four specimen kits were received with no
body fluids--only marihuana swabs.
Marihuana swabs were returned in 357 cases out of the 362 tested by the TLC method, i.e., 98.6%.
Marihuana swabs were returned in 323 cases out of the 337 tested by the on-the-swab method, i.e., 95.8%.
Enough blood was received for alcohol analysis in 684 cases out
of the 699 possible, i.e., 97.9% of the cases.
At the time of alysis, seven of the 699 specimen set origins were unknown, i.e., 692 specimen sets were of known origin. The specimen sets of unknown origin at the time of statistical analysis were 504, 539, 540, 542, 590, 661, and 665.
The Incidence of Drugs
The incidence of drugs has been calculated in the body fl
ohol washings (swabs) and drivers with the following criteria ap
- Drugs in urine and bile are assigned as being positive
B.
uids,
alc plying:
only
if a level of 1 ugjml or greater is found.
- Drugs in blood are assigned as positive at any level, in
cluding blood alcohol.
27
- Aspirin, nicotine and salicylic acid are qualitative only
and are assigned positive if found at any level.
- Marihuana results are treated in two separate batches, those
tested by TLC and those tested on-the-swab.
Table V lists the incidences of drugs (other than alcohol, mari
huana, nicotine, aspirin, and salicylic acid) found in urine, blood and bile.
The drugs are classified into groups, i.e., sedatives/hypnotics,
stimulants, antihistamines/decongestants, tranquilizers, narcotic analgesics,
and miscellaneous. Incidences are quoted for each individual drug, each
drug group and finally the incidence of all drugs (other than alcohol, mari
huana, nicotine, aspirin and salicylic acid). The number of cases of the
appearance of a drug in a fluid is given in the table, this is followed by
the percentage of fluid samples the drug was found in.
Table VI indicates the incidences of nicotine, aspirin, and
salicylic acid in urine, blood, and bile samples. In each case, the number
of incidences is followed by the percentages of fluid samples the drug was
found in.
Table VII indicates the incidence of blood alcohol in the 684 blood
samples collected. The alcohol level is stratified in quanta of 0.05% alcohol.
Figures are quoted for drivers who had been drinking alcohol as well as
drivers who were drunk (i.e., blood alcohol level > 0.100%).
Table VIII indicates the incidence of marihuana in drivers as de
termined by the swab tests. The incidences are calculated separately for
the TLC test and the on-the-swab test. The differences between swabs tested
and swabs available are due to the fact that some swabs were too dirty for
testing.
Table IX indicates the incidence of quantitated drugs (except
alcohol) in drivers. All the 695 drivers from whom at least one body fluid
was collected are included in this table (four collection kits were received
containing only swabs). Incidences are quoted for drug groups as well as
for any drugs. Incidences are also quoted for instances when the drugs were
found with or without alcohol.
Table X indicates the incidence of quantitated drugs (except
alcohol) in the 395 drivers from whom all three physiological fluids (urine,
bile, and blood) were collected. Again, incidences are quoted for drug
groups, any drugs and when drugs were found with or without alcohol.
28
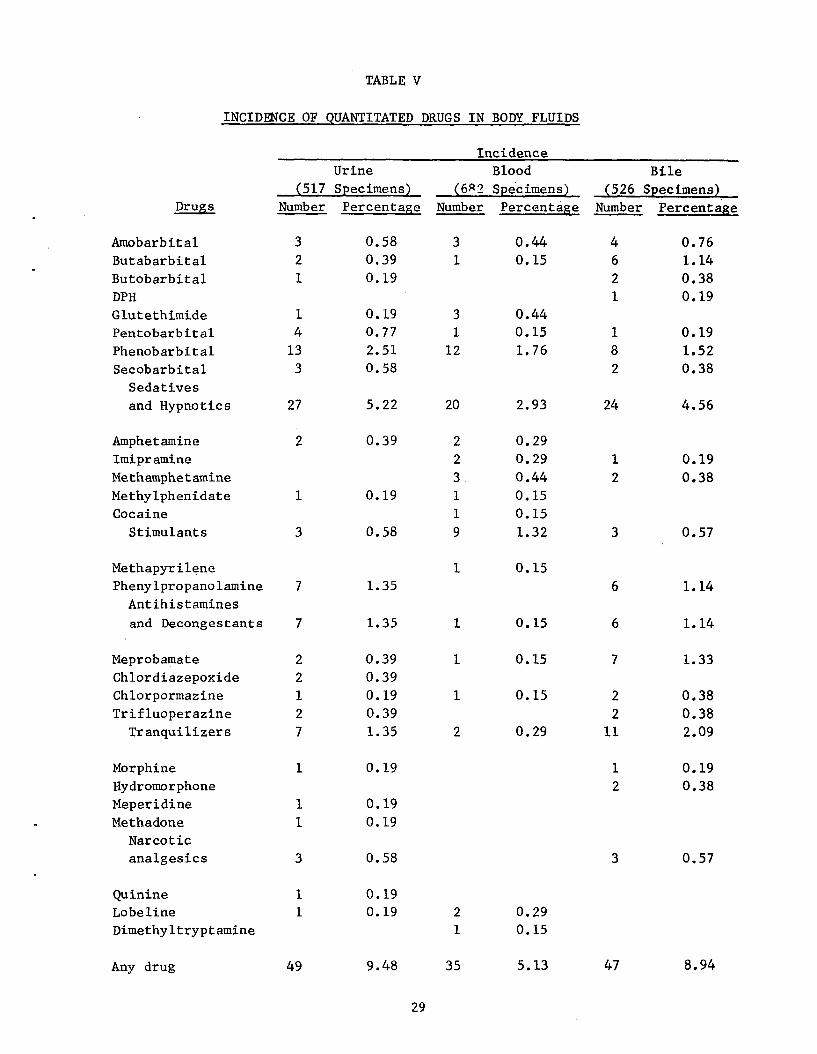
TABLE V
INCIDENCE OF QUANTITATED DRUGS IN BODY FLUIDS
(517 Urine Specimens)
Incidence Blood
(682 Specimens) (526 Bile
Specimens) Drugs Number. Percentage Number Percentage Number Percentage
Amobarbital Butabarbital Butobarbital DPH
Glutethimide Pentobarbital
Phenobarbital Secobarbital
Sedatives
and Hypnotics
3 2 1
1 4
13 3
27
0.58 0.39 0.19
0.19 0.77
2.51 0.58
5.22
3 1
3 1
12
20
0.44 0.15
0.44 0.15
1.76
2.93
4 6 2 1
1
8 2
24
0.76 1.14 0.38 0.19
0.19
1.52 0.38
4.56
Amphetamine Imipramine
Methamphetamine Methylphenidate Cocaine
Stimulants
2
1
3
0.39
0.19
0.58
2 2
3. 1 1
9
0.29 0.29
0.44 0.15 0.15
1.32
1
2
3
0.19
0.38
0.57
Methapyrilene Phenylpropanolamine
Antihistamines
and Decongestants
7
7
1.35
1.35
1
1
0.15
0.15
6
6
1.14
1.14
Meprobamate Chlordiazepoxide Chlorpormazine Trifluoperazine
Tranquilizers
2 2 1 2 7
0.39 0.39 0.19 0.39 1.35
1
1
2
0.15
0.15
0.29
7
2 2
11
1.33
0.38 0.38 2.09
Morphine Hydromorphone Meperidine Methadone
Narcotic analgesics
1
1 1
3
0.19
0.19 0.19
0.58
1 2
3
0.19 0.38
0.57
Quinine
Lobeline Dimethyltryptamine
1
1 0.19
0.19 2 1
0.29 0.15
Any drug 49 9.48 35 5.13 47 8.94
29
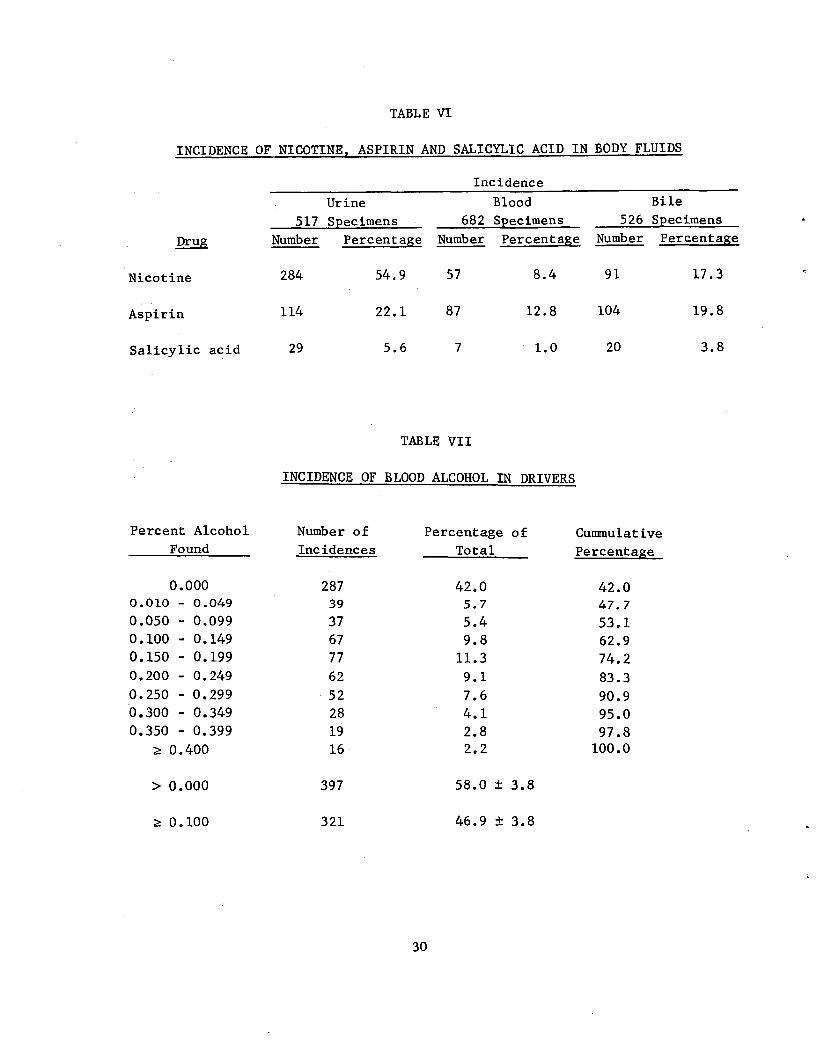
TABLE VI
INCIDENCE OF NICOTINE, ASPIRIN AND SALICYLIC ACID IN BODY FLUIDS
Incidence
Urine Blood Bile
517 Specimens 682 Specimens 526 Specimens
Drug
Nicotine 284 54.9 57 8.4 91 17.3
Aspirin 114 22.1 87 12.8 104 19.8
Salicylic acid 29 5.6 7 1.0 20 3.8
Number Percentage Number Percentage Number Percentage
TABLE VII
INCIDENCE OF BLOOD ALCOHOL IN DRIVERS
Percent Alcohol Number of Percentage of Cummulative Found Incidences Total Percentage
0.000 287 42.0 42.0 0.010 - 0.049 39 5.7 47.7 0.050 - 0.099 37 5.4 53.1 0.100 - 0.149 67 9.8 62.9 0.150 - 0.199 77 11.3 74.2 0.200 - 0.249 62 9.1 83.3 0.250 - 0.299 52 7.6 90.9 .0.300 - 0.349 28 4.1 95.0 0.350 - 0.399 19 2.8 97.8
z 0.400 16 2.2 100.0
> 0.000 397 58.0 ± 3.8
z 0.100 321 46.9 ± 3.8
30
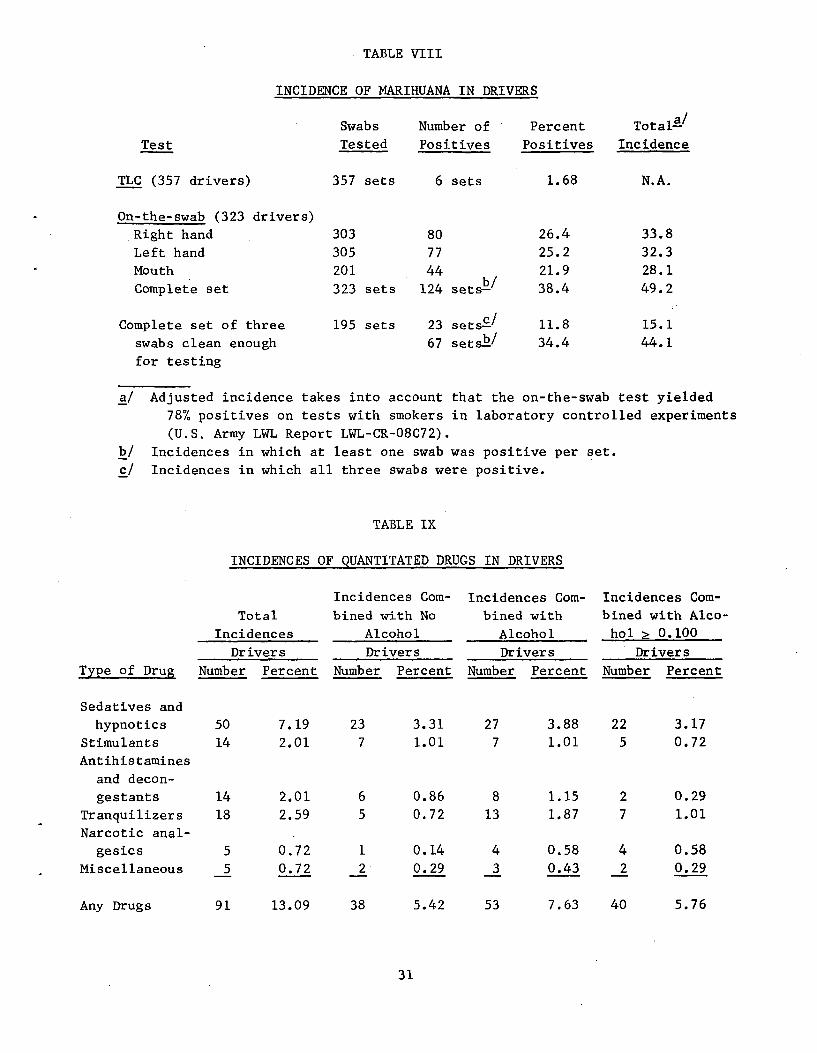
TABLE VIII
INCIDENCE OF MARIHUANA IN DRIVERS
Swabs Number of Percent Total-a/
Test Tested Positives Positives Incidence
TLC (357 drivers) 357 sets 6 sets 1.68 N.A.
On-the-swab (323 drivers)
Right hand 303 80 26.4 33.8
Left hand 305 77 25.2 32.3 Mouth 201 44 21.9 28.1 Complete set 323 sets 124 sets b/ 38.4 49.2
Complete set of three 195 sets 23 sets-c/ 11.8 15.1
swabs clean enough 67 sets-b/ 34.4 44.1
for testing
a/ Adjusted incidence takes into account that the on-the-swab test yielded
78% positives on tests with smokers in laboratory controlled experiments
(U.S. Army LWL Report LWL-CR-08C72).
b/ Incidences in which at least one swab was positive per set.
c/ Incidences in which all three swabs were positive.
TABLE IX
INCIDENCES OF QUANTITATED DRUGS IN DRIVERS
Incidences Com- Incidences Com- Incidences Com-
Total bined with No bined with bined with Alco-
Incidences Alcohol Alcohol hol z 0.100
Drivers Drivers Drivers Drivers
Type of Drug Number Percent Number Percent Number Percent Number Percent
Sedatives and
hypnotics 50 7.19 23 3.31 27 3.88 22 3.17 Stimulants 14 2.01 7 1.01 7 1.01 5 0.72 Antihistamines
and decon
gestants 14 2.01 6 0.86 8 1.15 2 0.29
Tranquilizers 18 2.59 5 0.72 13 1.87 7 1.01 Narcotic anal
gesics 5 0.72 1 0.14 4 0.58 4 0.58
Miscellaneous 5 0.72 2 0.29 3 0.43 2 0.29
Any Drugs 91 13.09 38 5.42 53 7.63 40 5.76
31
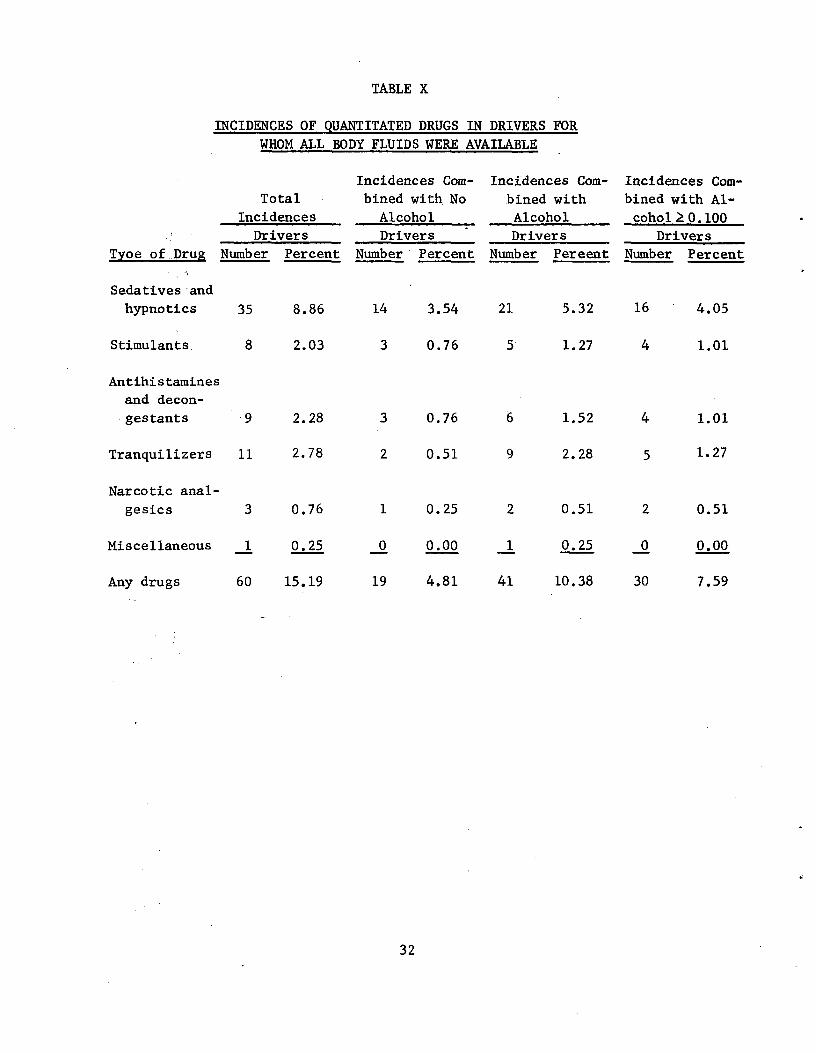
TABLE X
INCIDENCES OF QUANTITATED DRUGS IN DRIVERS FOR
WHOM ALL BODY FLUIDS WERE AVAILABLE
Incidences Com- Incidences Com- Incidences Com-Total bined with No bined with bined with Al-
Incidences Alcohol Alcohol cohol2 0.100 Drivers Drivers Drivers Drivers
Tyoe of-,Drug Number Percent Number Percent Number Pereent Number Percent
Sedatives-and hypnotics 35 8.86 14 3.54 21 5.32 16 4.05
Stimulants. 8 2.03 3 0.76 5 1.27 4 1.01
Antihistamines
and decon
gestants 9 2.28 3 0.76 6 1.52 4 1.01
Tranquilizers 11 2.78 2 0.51 9 2.28 5 1.27
Narcotic analgesics 3 0.76 1 0.25 2 0.51 2 0.51
Miscellaneous 1 0.25 0 0.00 1 0.25 0 0.00
Any drugs 60 15.19 19 4.81 41 10.38 30 7.59
32
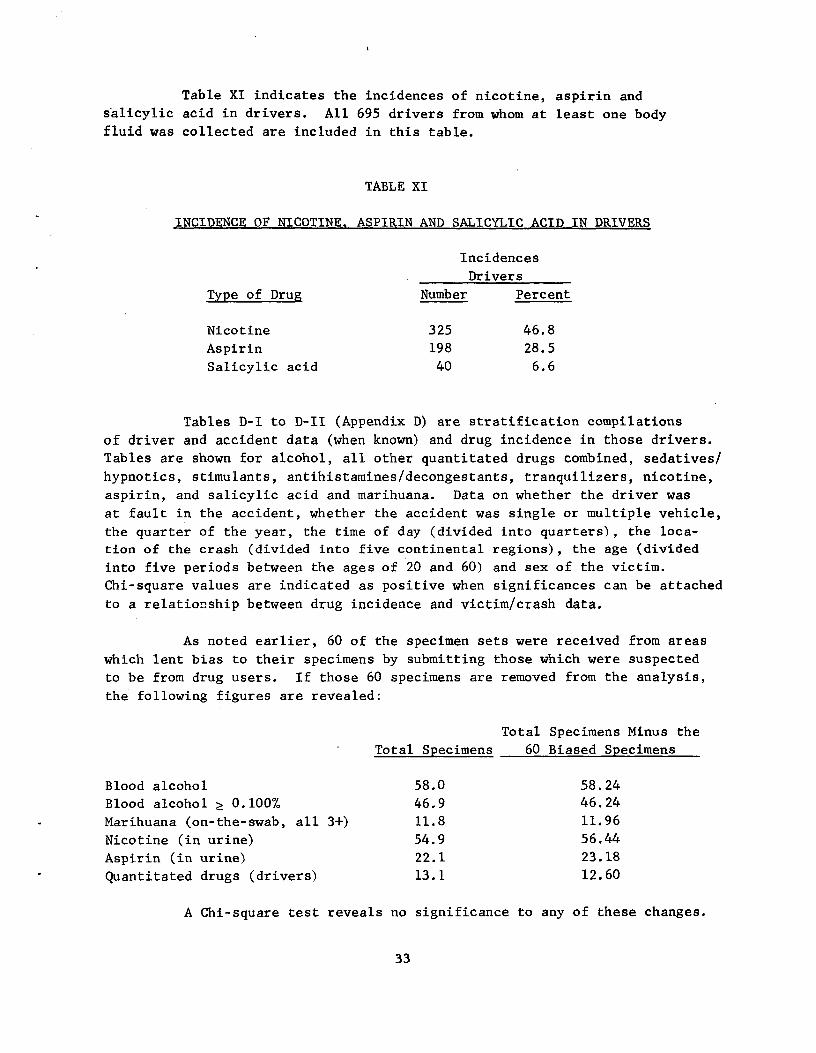
Table XI indicates the incidences of nicotine, aspirin and
salicylic acid in drivers. All 695 drivers from whom at least one body
fluid was collected are included in this table.
TABLE XI
INCIDENCE OF NICOTINE, ASPIRIN AND SALICYLIC ACID IN DRIVERS
Incidences
Drivers
Type of Drug Number Percent
Nicotine 325 46.8
Aspirin 198 28.5
Salicylic acid 40 6.6
Tables D-I to D-II (Appendix D) are stratification compilations
of driver and accident data (when known) and drug incidence in those drivers.
Tables are shown for alcohol, all other quantitated drugs combined, sedatives/
hypnotics, stimulants, antihistamines/decongestants, tranquilizers, nicotine,
aspirin, and salicylic acid and marihuana. Data on whether the driver was
at fault in the accident, whether the accident was single or multiple vehicle,
the quarter of the year, the time of day (divided into quarters), the loca
tion of the crash (divided into five continental regions), the age (divided
into five periods between the ages of 20 and 60) and sex of the victim.
Chi-square values are indicated as positive when significances can be attached
to a relationship between drug incidence and victim/crash data.
As noted earlier, 60 of the specimen sets were received from areas
which lent bias to their specimens by submitting those which were suspected
to be from drug users. If those 60 specimens are removed from the analysis,
the following figures are revealed:
Total Specimens Minus the
Total Specimens 60 Biased Specimens
Blood alcohol 58.0 58.24 Blood alcohol Z 0.100% 46.9 46.24
Marihuana (on-the-swab, all 3+) 11.8 11.96
Nicotine (in urine) 54.9 56.44
Aspirin (in urine) 22.1 23.18
Quantitated drugs (drivers) 13.1 12.60
A Chi-square test reveals no significance to any of these changes.
33
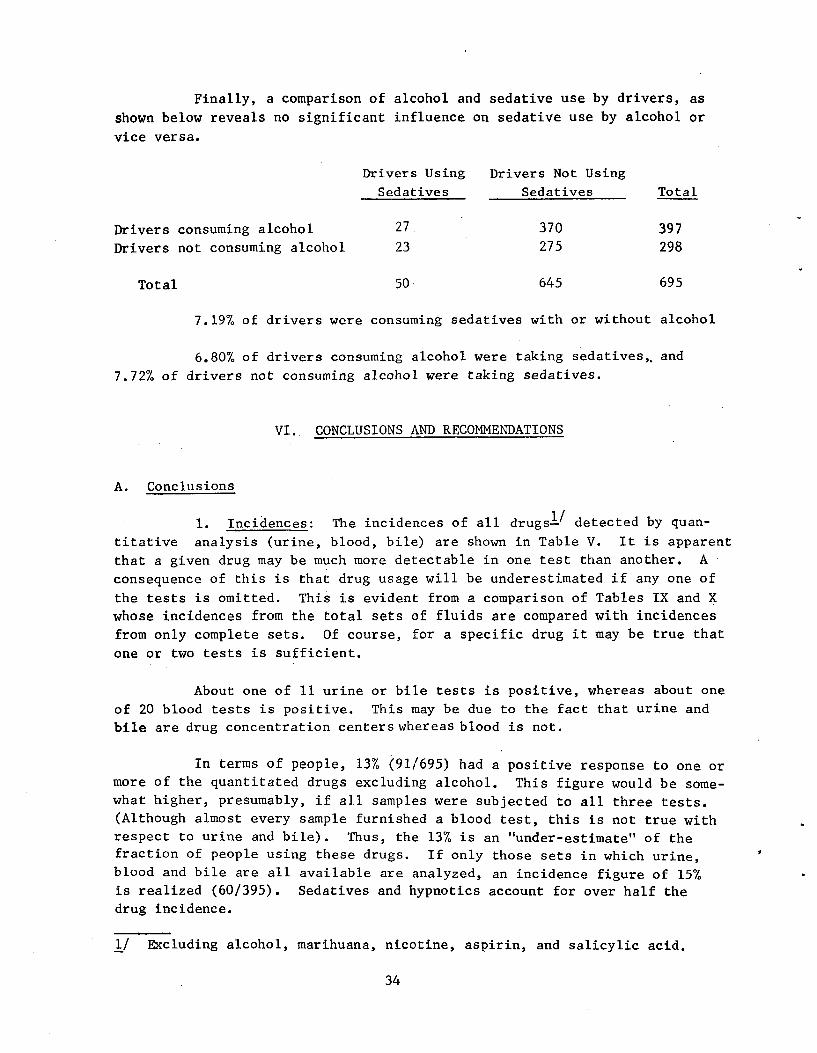
Finally, a comparison of alcohol and sedative use by drivers, as
shown below reveals no significant influence on sedative use by alcohol or
vice versa.
Drivers Using Drivers Not Using
Sedatives Sedatives Total
Drivers consuming alcohol 27. 370 397 Drivers not consuming alcohol 23 275 298
Total 50 645 695
7.19% of drivers were consuming sedatives with or without alcohol
6.80% of drivers consuming alcohol were taking sedatives,, and
7.72% of drivers not consuming alcohol were taking sedatives.
VI. CONCLUSIONS AND RECOMMENDATIONS
A. Conclusions
1. Incidences: The incidences of all drugs" detected by quan
titative analysis (urine, blood, bile) are shown in Table V. It is apparent
that a given drug may be much more detectable in one test than another. A
consequence of this is that drug usage will be underestimated if any one of
the tests is omitted. This is evident from a comparison of Tables IX and X
whose incidences from the total sets of fluids are compared with incidences
from only complete sets. Of course, for a specific drug it may be true that
one or two tests is sufficient.
About one of 11 urine or bile tests is positive, whereas about one
of 20 blood tests is positive. This may be due to the fact that urine and
bile are drug concentration centers whereas blood is not.
In terms of people, 13% (91/695) had a positive response to one or
more of the quantitated drugs excluding alcohol. This figure would be some
what higher, presumably, if all samples were subjected to all three tests.
(Although almost every sample furnished a blood test, this is not true with
respect to urine and bile). Thus, the 13% is an "under-estimate" of the
fraction of people using these drugs. If only those sets in which urine,
blood and bile are all available are analyzed, an incidence figure of 15%
is realized (60/395). Sedatives and hypnotics account for over half the
drug incidence.
1/ Excluding alcohol, marihuana, nicotine, aspirin, and salicylic acid.
34
Table VI displays the incidences of the qualitative responses of
nicotine, aspirin, and salicylic acid in body fluids. It is apparent that
blood and bile tests greatly under-estimate nicotine incidence. The urine
test also detects more aspirin and salicylic acid, but the discrepancy is
much less marked. Table XI displays the incidences (driver-wise) of nicotine
(47%) aspirin (28%) and salicylic acid (6%).
Tables VII and VIII summarize the results of the BAC test and the
marihuana tests. Almost 3 of 5 (58%) drivers had been drinking, and nearly
half (47%) were "drunk" (BAC z 0.10%).
The original (TLC) marihuana detected only six users (1.7%), and
is obviously not compatible with the second test (on-the-swab technique).
The right-hand/left-hand/mouth results are homogeneous and detect 28-34%
marihuana usage. Forty-nine percent of the drivers showed a positive on at
least one swab. The percentage of three-positive marihuana results (based
on the number of samples that permitted all three swab tests) is only 15%.
These figures take into account that 78% of marihuana smokers were detected
in laboratory tests using the swab technique combined with an on-the-swab
color test. It is apparent that the reliability of swab test methods for
marihuana smoker detection needs evaluation. Of significance in this respect
is the fact that lip, forehead, and stomach swabs of six tobacco smokers and
six perspiring athletes at MRI yielded no positives when tested by the on-the
swab technique. Thus, the basic concept of the swab test seems to have merit.
The 50 positive sedative results were examined in an attempt to
differentiate their alcohol incidence from the alcohol usage in nonsedative
users. However, in both the had-been-drinking, and drunk categories there
is no difference, i.e., the sedative user is neither more nor less likely
to use alcohol than the nonsedative user.
2. Stratifications: To some extent, it is possible to examine
the influence (if any) of age,?/ sex, season,3/ region,! time of crash,5/
at fault or not, and single vehicle - multiple vehicle on the drug responses.
The responses stratified were: had been drinking, drunk, marihuana6/
salicylic acid, aspirin, nicotine, stimulants, tranquilizers, antihistamines
and decongestants, sedatives and hypnotics, and "any drug".7/ However, the
2/ Age categories were: < 19, 20-24, 25-29, 30-39, 40-49, 50-59, and z 60.
3/ "Seasons" are: J-F-M (Quarter 1), A-M-J (Quarter 2), J-A-S (Quarter 3),
and O-N-D (Quarter 4).
4/ "Regions" are: "Northwest" - Oregon, Washington; "West" - California,
New Mexico, Nevada; "East" - Maine, New York, Vermont; "South"
Arkansas, Florida, Georgia, Kentucky, Maryland, Virginia; "Midwest"
Michigan, Minnesota, Nebraska, Ohio, Oklahoma, and Wisconsin.
5/ Time categories were: 0000-0059, 0600-1119, 1200-1799, and 1800-2399.
6/ Using only the results after the method was changed to the on-the-swab
method.
7/ Any drug detected by a quantitative analysis (except alcohol).
35

three groups stimulants, tranquilizers, and antihistamines and decongestants
did not produce sufficient sample size to yield formal statistical differ
ences. These three groups will be discussed later. A summary of influences
is:
1. The only drug significantly over-involved in the at-fault
category is alcohol.
2. Alcohol is also the only drug over-involved in single-vehicle
crashes.
3. Alcohol is the only drug upon which time-of-day is a significant influence (with, of course, increasing usage as time increases).
4. Region is not a significant stratification for any response.
5. Age is a significant factor only with respect to alcohol--un
fortunately, age is often not known, however, and many of the comparisons
are based on small sample sizes.
D 6. Sex is a factor with respect to alcohol and nicotine usage,
but not otherwise. In both cases males are over-involved.
7. The factor season (quarter) is associated with all responses
except alcohol and nicotine.
Thus, marihuana is spring-summer activity, aspirin is a winter
"activity", etc.
It is plain that alcohol is by far the most dangerous drug
examined. Alcohol is used by many more people than any other drug (except
nicotine) and thus it's incidence is much easier to analyze statistically.
Unfortunately, we cannot draw a statistically significant sample of amobarbi
tal users, etc. With the exception of the combination alcohol-barbiturates,
no synergistic possibilities were examined.
Finally, the drug groups tranquilizers, antihistamines, and stimu
lants did not furnish enough sample size to stratify meaningfully. It is,
however, at least suggested by the data that males are over-involved in using
tranquilizers and antihistamines, and that young people are over-involved in
using stimulants.
36
B. Recommendations
On the basis of the present results, it is recommended:
1. That a study similar to the present study be initiated to secure a larger volume of data in order to gain more statistical significance in the incidence of drugs found in fatally injured drivers.
2. That such a study be controlled in such a way as to ensure
collection of all specimens and victim/crash data.
3. That such a study be reduced in the scope of drugs analyzed so as to include only those which are indicated by this report to be contributing significantly to the total incidence of drugs; i.e., sedatives/hypnotics, stimulants, and alcohol.
4. That a more reliable test for marihuana smokers and marihuana
intoxication be developed and utilized in a future program.
37
APPENDIX A
ACQUISITION OF SPECIMENS
38
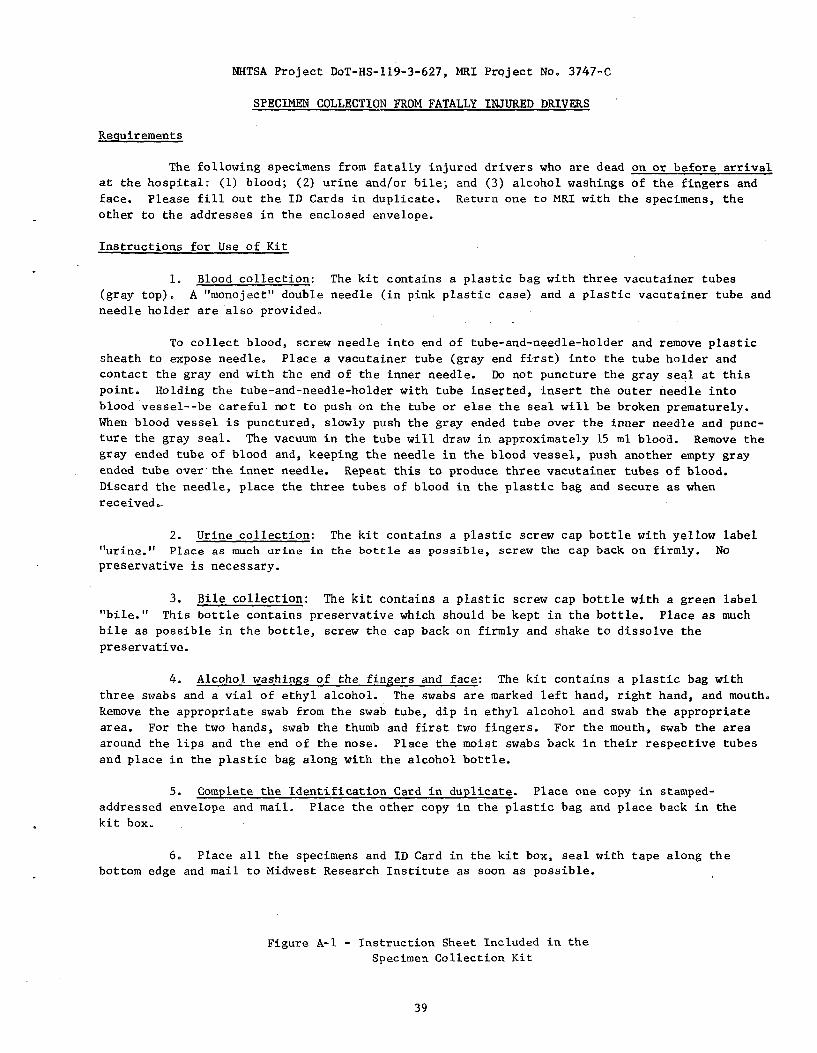
NHTSA Project DoT-HS-119-3-627, MRI Project No. 3747-C
SPECIMEN COLLECTION FROM FATALLY INJURED DRIVERS
Requirements
The following specimens from fatally injured drivers who are dead on or before arrival
at the hospital: (1) blood; (2) urine and/or bile; and (3) alcohol washings of the fingers and
face. Please fill out the ID Cards in duplicate. Return one to MRI with the specimens, the
other to the addresses in the enclosed envelope.
Instructions for Use of Kit
1. Blood collection: The kit contains a plastic bag with three vacutainer tubes
(gray top). A "monoject" double needle (in pink plastic case) and a plastic vacutainer tube and
needle holder are also provided.
To collect blood, screw needle into end of tube-and-needle-holder and remove plastic
sheath to expose needle. Place a vacutainer tube (gray end first) into the tube holder and
contact the gray end with the end of the inner needle. Do not puncture the gray seal at this
point. Holding the tube-and-needle-holder with tube inserted, insert the outer needle into
blood vessel--be careful not to push on the tube or else the seal will be broken prematurely.
When blood vessel is punctured, slowly push the gray ended tube over the inner needle and punc
ture the gray seal. The vacuum in the tube will draw in approximately 15 ml blood. Remove the
gray ended tube of blood and, keeping the needle in the blood vessel, push another empty gray
ended tube over'the inner needle. Repeat this to produce three vacutainer tubes of blood.
Discard the needle, place the three tubes of blood in the plastic bag and secure as when
received..
2. Urine collection: The kit contains a plastic screw cap bottle with yellow label
'"urine.' Place as much urine in the bottle as possible, screw the cap back on firmly. No
preservative is necessary.
3. Bile collection: The kit contains a plastic screw cap bottle with a green label "bile." This bottle contains preservative which should be kept in the bottle. Place as much bile as possible in the bottle, screw the cap back on firmly and shake to dissolve the preservative.
4. Alcohol washings of the fingers and face: The kit contains a plastic bag with three swabs and a vial of ethyl alcohol. The swabs are marked left hand, right hand, and mouth. Remove the appropriate swab from the swab tube, dip in ethyl alcohol and swab the appropriate area. For the two hands, swab the thumb and first two fingers. For the mouth, swab the area around the lips and the end of the nose. Place the moist swabs back in their respective tubes and place in the plastic bag along with the alcohol bottle.
5. Complete the Identification Card in duplicate. Place one copy in stamped-
addressed envelope and mail. Place the other copy in the plastic bag and place back in,the
kit box.
6. Place all the specimens and ID Card in the kit box, seal with tape along the
bottom edge and mail to Midwest Research Institute as soon as possible.
Figure A-1 - Instruction Sheet Included in the
Specimen Collection Kit
39
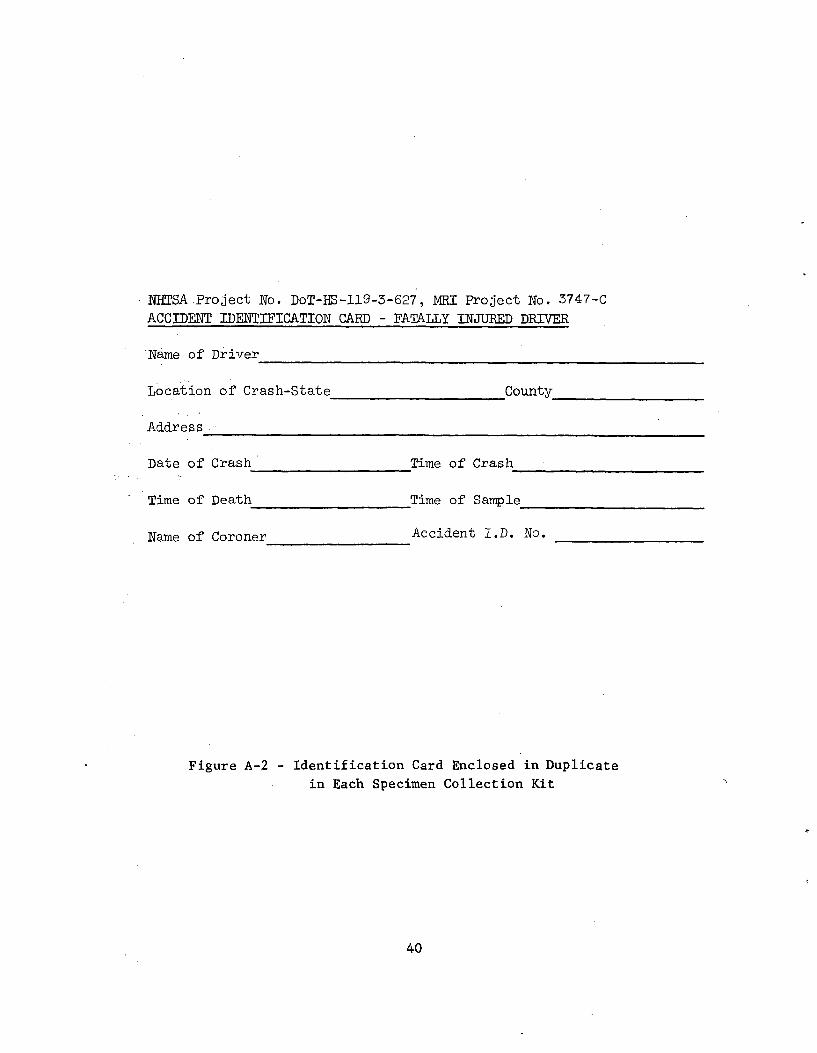
NHTSA.Project No. DoT-HS-119-3-627, MRI Project No. 3747-C
ACCIDENT IDENTIFICATION CARD - FATALLY INJURED DRIVER
'Name of Driver
Location of Crash-State County
Address
Date of Crash Time of Crash
Time of Death Time of Sample
Name of Coroner Accident I.D. No.
Figure A-2 - Identification Card Enclosed in Duplicate
in Each Specimen Collection Kit
40
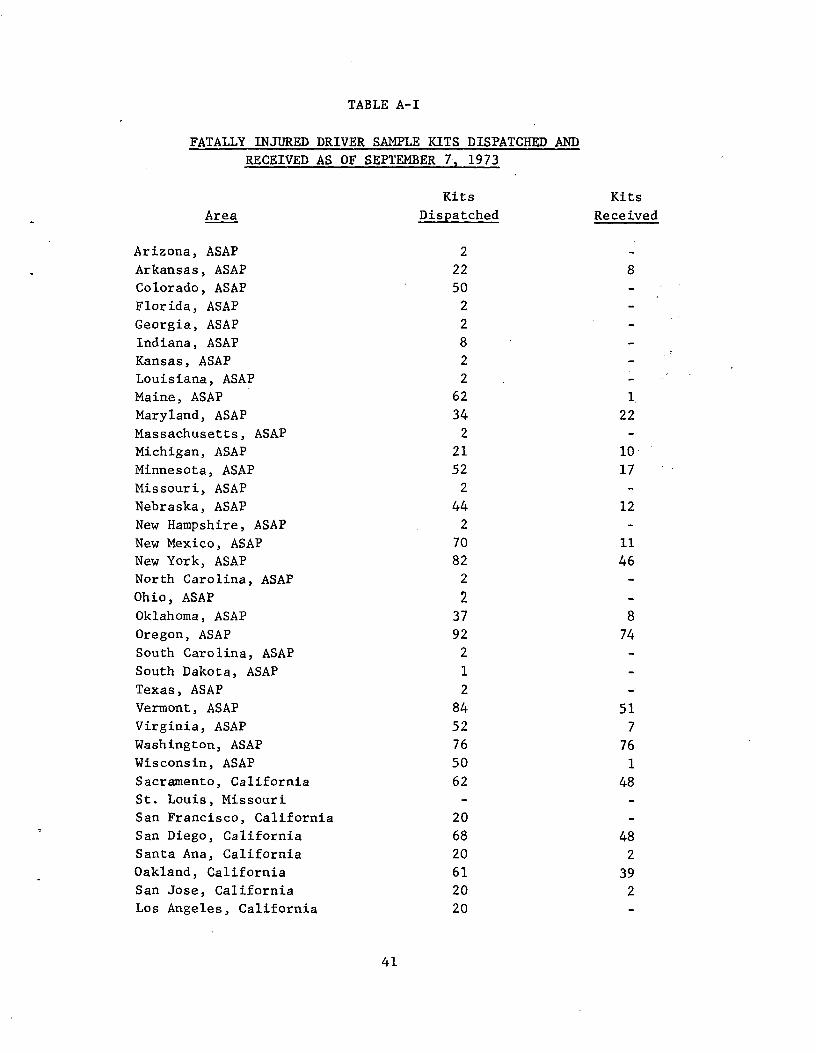
- -
TABLE A-I
FATALLY INJURED DRIVER SAMPLE KITS DISPATCHED AND
RECEIVED AS OF SEPTEMBER 7, 1973
Area
Arizona, ASAP Arkansas, ASAP
Colorado, ASAP Florida, ASAP Georgia, ASAP Indiana, ASAP Kansas, ASAP Louisiana, ASAP
Maine, ASAP
Maryland, ASAP
Massachusetts, ASAP
Michigan, ASAP
Minnesota, ASAP
Missouri, ASAP
Nebraska, ASAP
New Hampshire, ASAP New Mexico, ASAP New York, ASAP North Carolina, ASAP
Ohio, ASAP
Oklahoma, ASAP
Oregon, ASAP
South Carolina, ASAP
South Dakota, ASAP Texas, ASAP Vermont, ASAP Virginia, ASAP
Washington, ASAP
Wisconsin, ASAP
Sacramento, California St. Louis, Missouri
San Francisco, California
San Diego, California Santa Ana, California
Oakland, California
San Jose, California Los Angeles, California
Kits Kits
Dispatched Received
2 22 8
50 2 2 8 2 2
62 1.
34 22
2
21 1052 17
2
44 122
70 1182 46
2
2 37 8
92 74
2
1
2 84 5152 7
76 7650 1
62 48
20
68 4820 2
61 39
20 220
41
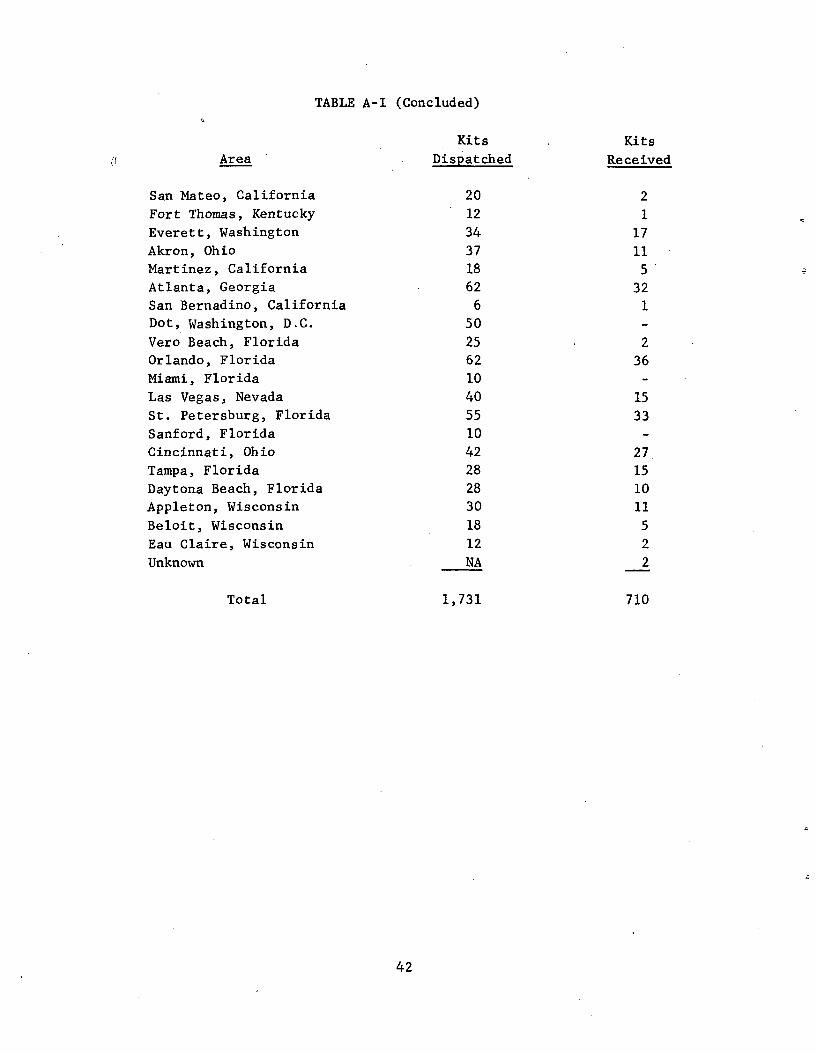
TABLE A-I (Concluded) 0
Kits Kits Area Dispatched Received
San Mateo, California 20 2 Fort Thomas, Kentucky 12 1
Everett, Washington 34 17
Akron, Ohio 37 11 Martinez, California 18 5 Atlanta, Georgia 62 32 San Bernadino, California 6 1 Dot, Washington, D.C. 50 -Vero Beach, Florida 25 2 Orlando, Florida 62 36 Miami, Florida 10 -
Las Vegas, Nevada 40 15 St. Petersburg, Florida 55 33
Sanford, Florida 10 -Cincinnati, Ohio 42 27 Tampa, Florida 28 15 Daytona Beach, Florida 28 10 Appleton, Wisconsin 30 11
Beloit, Wisconsin 18 5 Eau Claire, Wisconsin 12 2
Unknown NA 2
Total 1,731 710
42
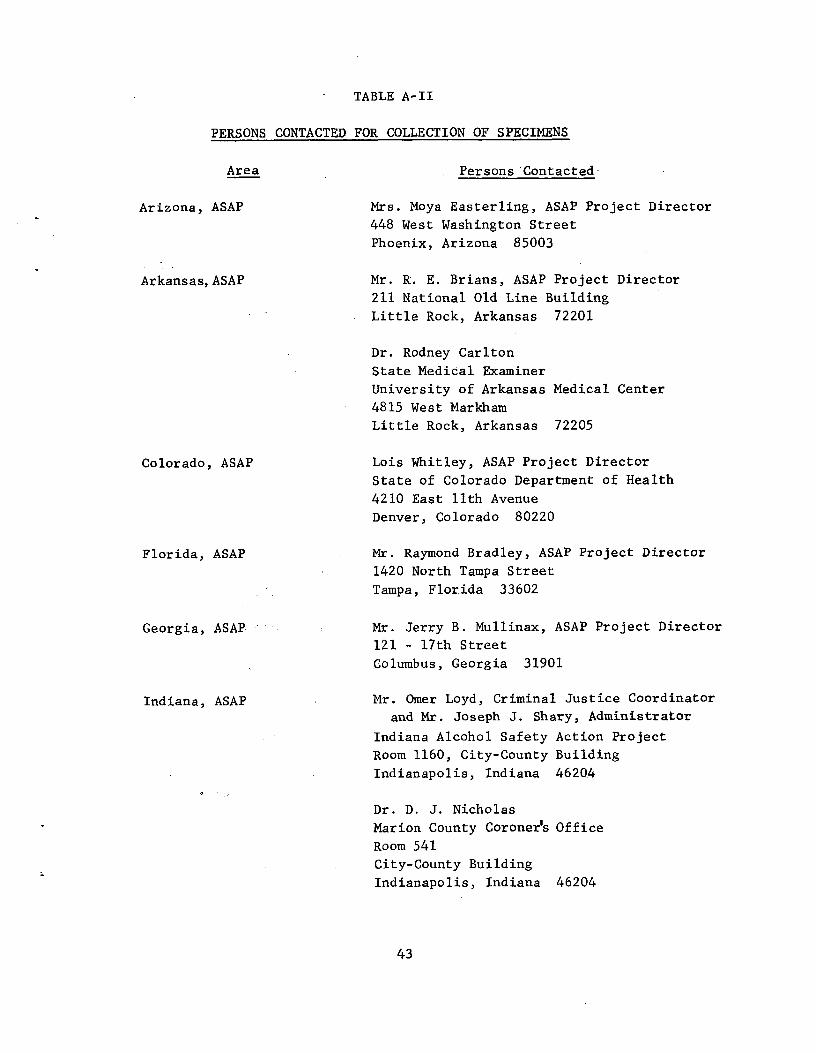
TABLE A-II
PERSONS CONTACTED FOR COLLECTION OF SPECIMENS
Area
Arizona, ASAP
Arkansas, ASAP
Colorado, ASAP
Florida, ASAP
Georgia, ASAP
Indiana, ASAP
Persons'Contacted-
Mrs. Moya Easterling, ASAP Project Director
448 West Washington Street
Phoenix, Arizona 85003
Mr. R. E. Brians, ASAP Project Director
211 National Old Line Building
Little Rock, Arkansas 72201
Dr. Rodney Carlton
State Medical Examiner
University of Arkansas Medical Center
4815 West Markham
Little Rock, Arkansas 72205
Lois Whitley, ASAP Project Director
State of Colorado Department of Health
4210 East 11th Avenue
Denver, Colorado 80220
Mr. Raymond Bradley, ASAP Project Director
1420 North Tampa Street
Tampa, Florida 33602
Mr. Jerry B. Mullinax, ASAP Project Director
121 - 17th Street
Columbus, Georgia 31901
Mr. Omer Loyd, Criminal Justice Coordinator
and Mr. Joseph J. Shary, Administrator
Indiana Alcohol Safety Action Project
Room 1160, City-County Building
Indianapolis, Indiana 46204
Dr. D. J. Nicholas
Marion County Coroner's Office
Room 541
City-County Building
Indianapolis, Indiana 46204
43
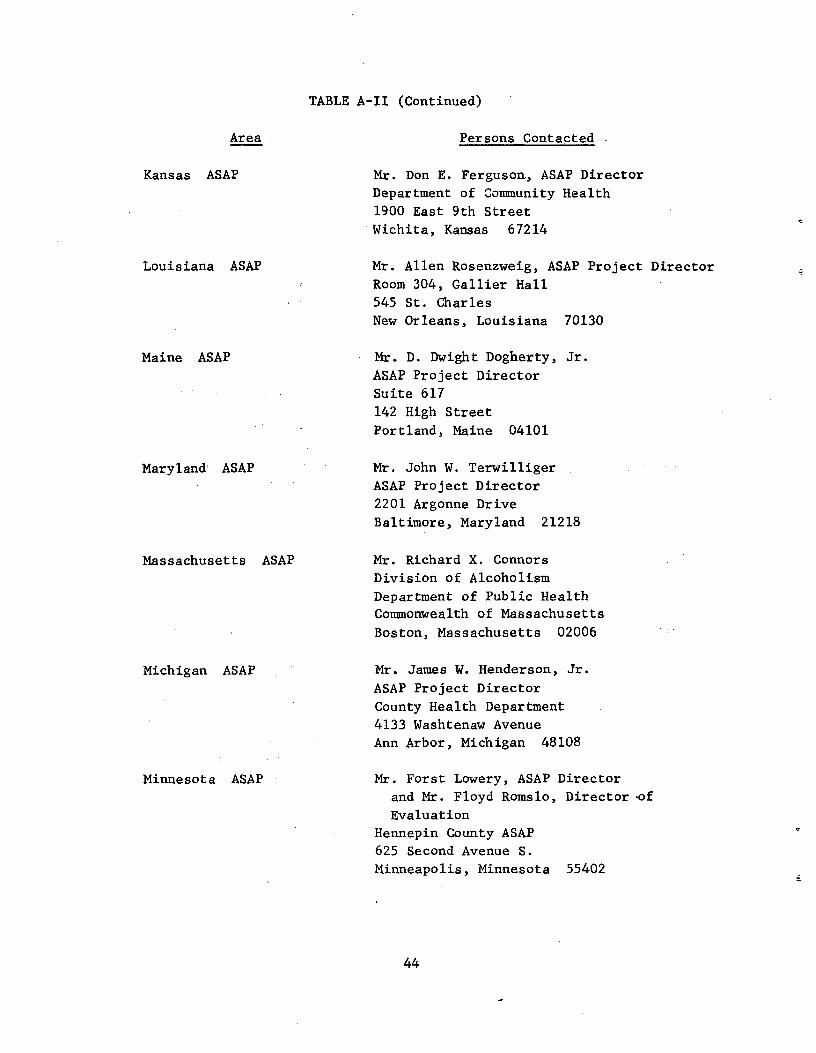
Area
Kansas ASAP
Louisiana ASAP
Maine ASAP
Maryland' ASAP
Massachusetts ASAP
Michigan ASAP
Minnesota ASAP
TABLE A-II (Continued)
Persons Contacted
Mr. Don E. Ferguson., ASAP Director
Department of Community Health
1900 East 9th Street
Wichita, Kansas 67214
Mr. Allen Rosenzweig, ASAP Project Director
Room 304, Gallier Hall
545 St. Charles New Orleans, Louisiana 70130
Mr. D. Dwight Dogherty, Jr.
ASAP Project Director
Suite 617 142 High Street
Portland, Maine 04101
Mr. John W. Terwilliger
ASAP Project Director
2201 Argonne Drive
Baltimore, Maryland 21218
Mr. Richard X. Connors
Division of Alcoholism
Department of Public Health
Commonwealth of Massachusetts Boston, Massachusetts 02006
Mr. James W. Henderson, Jr.
ASAP Project Director
County Health Department
4133 Washtenaw Avenue
Ann Arbor, Michigan 48108
Mr. Forst Lowery, ASAP Director
and Mr. Floyd Romslo, Director,of
Evaluation
Hennepin County ASAP
625 Second Avenue S.
Minneapolis, Minnesota 55402
44
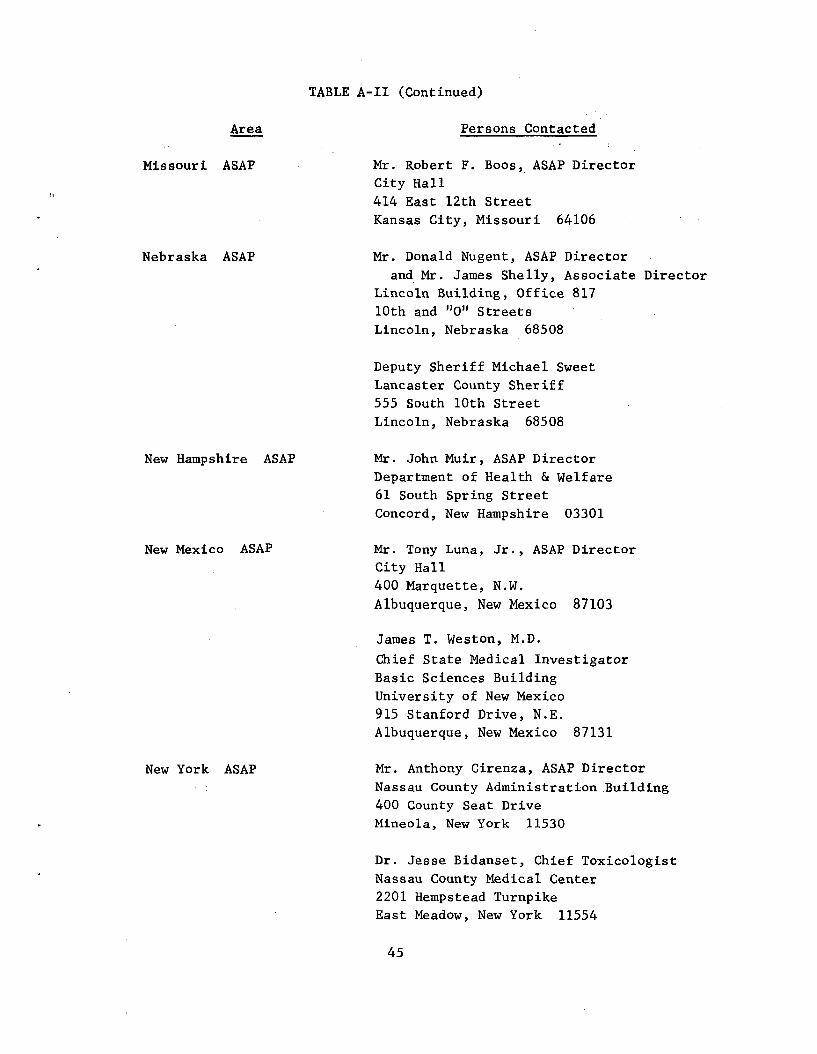
Area
Missouri ASAP
Nebraska ASAP
New Hampshire ASAP
New Mexico ASAP
New York ASAP
TABLE A-II (Continued)
Persons Contacted
Mr. Robert F. Boos, ASAP Director
City Hall
414 East 12th Street Kansas City, Missouri 64106
Mr. Donald Nugent, ASAP Director
and Mr. James Shelly, Associate Director
Lincoln Building, Office 817
10th and "0" Streets
Lincoln, Nebraska 68508
Deputy Sheriff Michael Sweet
Lancaster County Sheriff
555 South 10th Street
Lincoln, Nebraska 68508
Mr. John Muir, ASAP Director
Department of Health & Welfare
61 South Spring Street
Concord, New Hampshire 03301
Mr. Tony Luna, Jr., ASAP Director
City Hall
400 Marquette, N.W.
Albuquerque, New Mexico 87103
James T. Weston, M.D.
Chief State Medical Investigator
Basic Sciences Building
University of New Mexico
915 Stanford Drive, N.E. Albuquerque, New Mexico 87131
Mr. Anthony Cirenza, ASAP Director
Nassau County Administration.Building
400 County Seat Drive
Mineola, New York 11530
Dr. Jesse Bidanset, Chief Toxicologist
Nassau County Medical Center
2201 Hempstead Turnpike
East Meadow, New York 11554
45
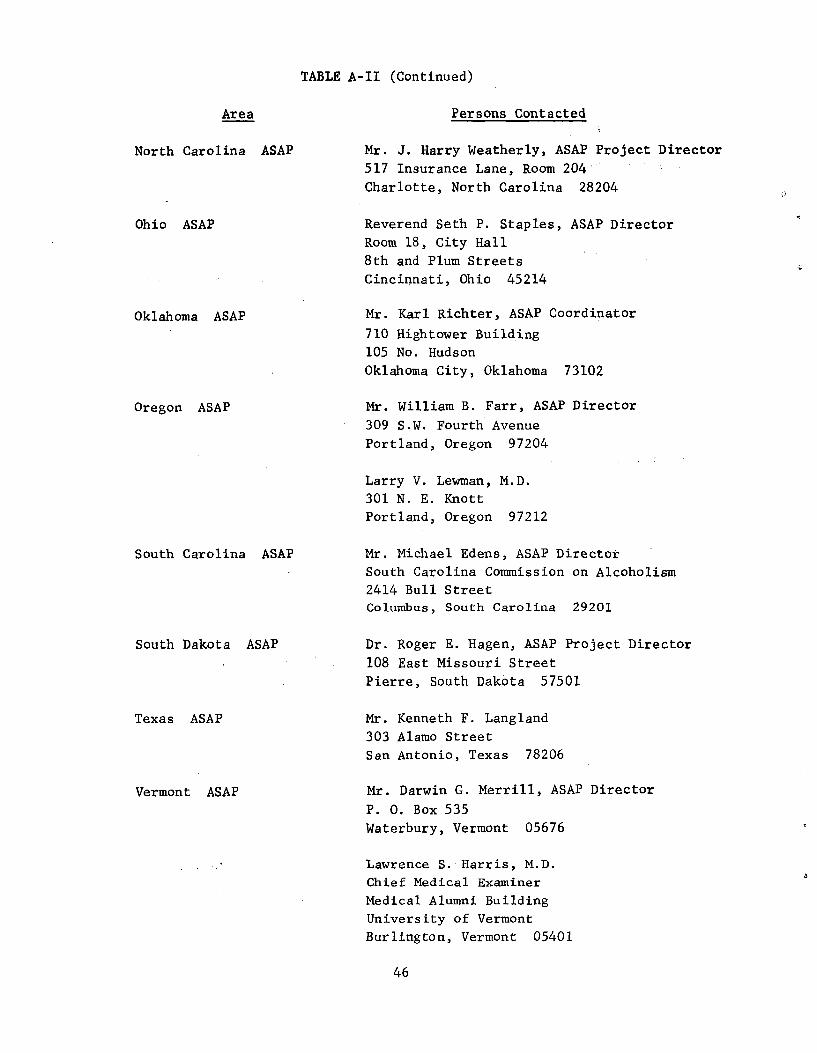
Area
North Carolina ASAP
Ohio ASAP
Oklahoma ASAP
Oregon ASAP
South Carolina ASAP
South Dakota ASAP
Texas ASAP
Vermont ASAP
Persons Contacted
Mr. J. Harry Weatherly, ASAP Project Director
517 Insurance Lane, Room 204
Charlotte, North Carolina 28204
Reverend Seth P. Staples, ASAP Director
Room 18, City Hall
8th and Plum Streets Cincinnati, Ohio 45214
Mr. Karl Richter, ASAP Coordinator
710 Hightower Building
105 No. Hudson Oklahoma City, Oklahoma 73102
Mr. William B. Farr, ASAP Director
309 S.W. Fourth Avenue
Portland, Oregon 97204
Larry V. Lewman, M.D.
301 N. E. Knott
Portland, Oregon 97212
Mr. Michael Edens, ASAP Director
South Carolina Commission on Alcoholism
2414 Bull Street
Columbus, South Carolina 29201
Dr. Roger E. Hagen, ASAP Project Director
108 East Missouri Street
Pierre, South Dakota 57501
Mr. Kenneth F. Langland
303 Alamo Street
San Antonio, Texas 78206
Mr. Darwin G. Merrill, ASAP Director
P. 0. Box 535
Waterbury, Vermont 05676
Lawrence S. Harris, M.D.
Chief Medical Examiner
Medical Alumni Building
University of Vermont
Burlington, Vermont 05401
46
TABLE A-II (Continued)
a
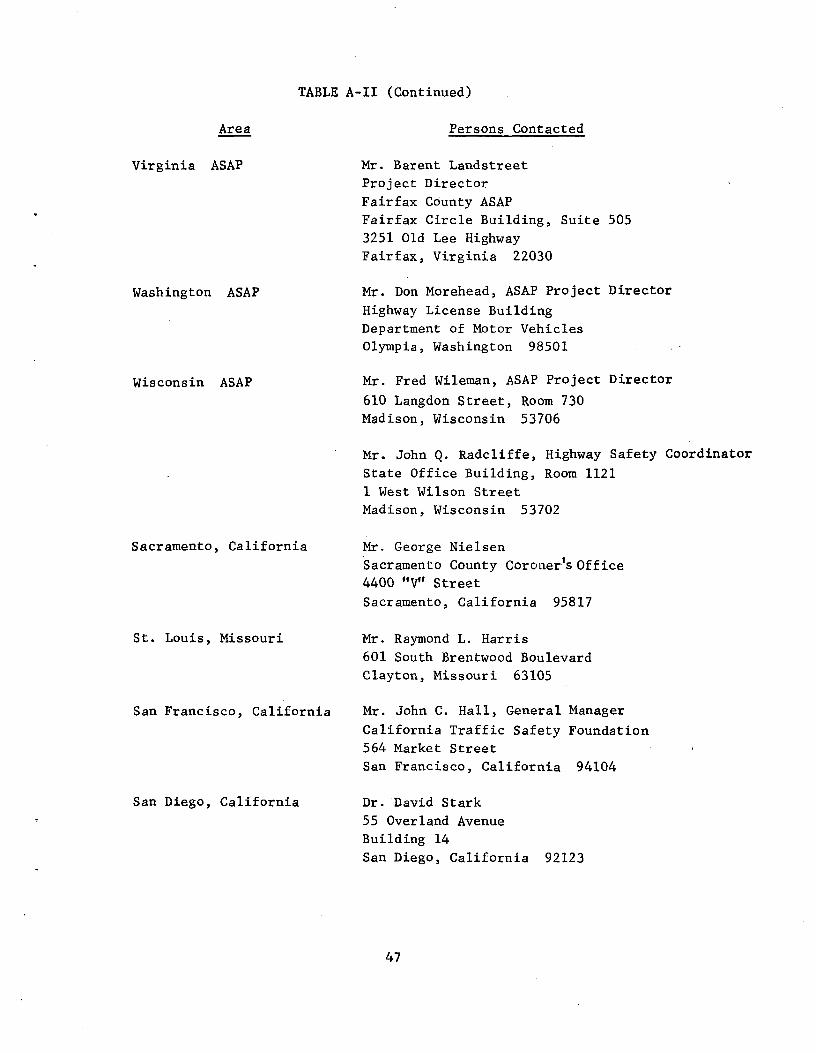
TABLE A-II (Continued)
Area
Virginia ASAP
Washington ASAP
Wisconsin ASAP
Sacramento, California
St. Louis, Missouri
San Francisco, California
San Diego, California
Persons Contacted
Mr. Barent Landstreet
Project Director
Fairfax County ASAP
Fairfax Circle Building, Suite 505
3251 Old Lee Highway
Fairfax, Virginia 22030
Mr. Don Morehead, ASAP Project Director
Highway License Building
Department of Motor Vehicles
Olympia, Washington 98501
Mr. Fred Wileman, ASAP Project Director
610 Langdon Street, Room 730
Madison, Wisconsin 53706
Mr. John Q. Radcliffe, Highway Safety Coordinator
State Office Building, Room 1121
1 West Wilson Street
Madison, Wisconsin 53702
Mr. George Nielsen
Sacramento County Coroner's Office 4400 "V" Street
Sacramento, California 95817
Mr. Raymond L. Harris
601 South Brentwood Boulevard
Clayton, Missouri 63105
Mr. John C. Hall, General Manager
California Traffic Safety Foundation
564 Market Street
San Francisco, California 94104
Dr. David Stark
55 Overland Avenue
Building 14
San Diego, California 92123
47
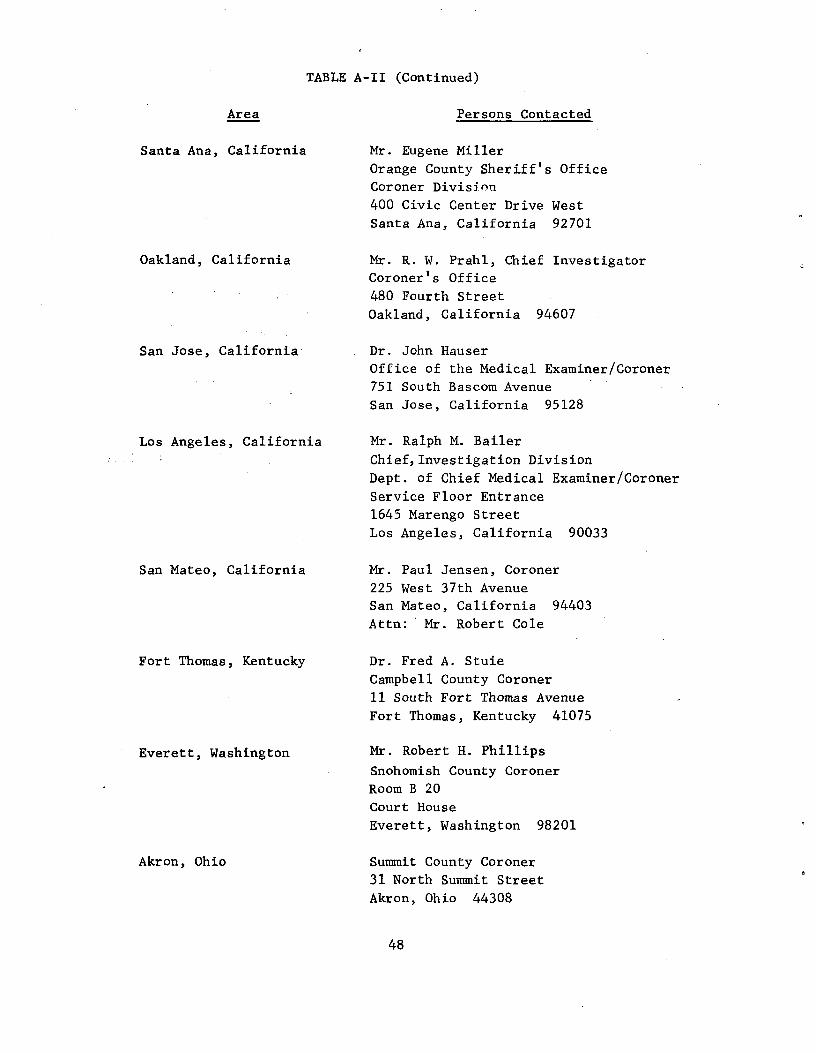
TABLE A-II (Continued)
Area
Santa Ana, California
Oakland, California
San Jose, California
Los Angeles, California
San Mateo, California
Fort Thomas, Kentucky
Everett, Washington
Akron, Ohio
Persons Contacted
Mr. Eugene Miller
Orange County Sheriff's Office
Coroner Division
400 Civic Center Drive West
Santa Ana, California 92701
Mr. R. W. Prahl, Chief Investigator
Coroner's Office
480 Fourth Street Oakland, California 94607
Dr. John Hauser
Office of the Medical Examiner/Coroner
751 South Bascom Avenue
San Jose, California 95128
Mr. Ralph M. Bailer
Chief, Investigation Division
Dept. of Chief Medical Examiner/Coroner
Service Floor Entrance
1645 Marengo Street Los Angeles, California 90033
Mr. Paul Jensen, Coroner
225 West 37th Avenue
San Mateo, California 94403
Attn: Mr. Robert Cole
Dr. Fred A. Stuie
Campbell County Coroner
11 South Fort Thomas Avenue
Fort Thomas, Kentucky 41075
Mr. Robert H. Phillips
Snohomish County Coroner
Room B 20
Court House
Everett, Washington 98201
Summit County Coroner
31 North Summit Street
Akron, Ohio 44308
48
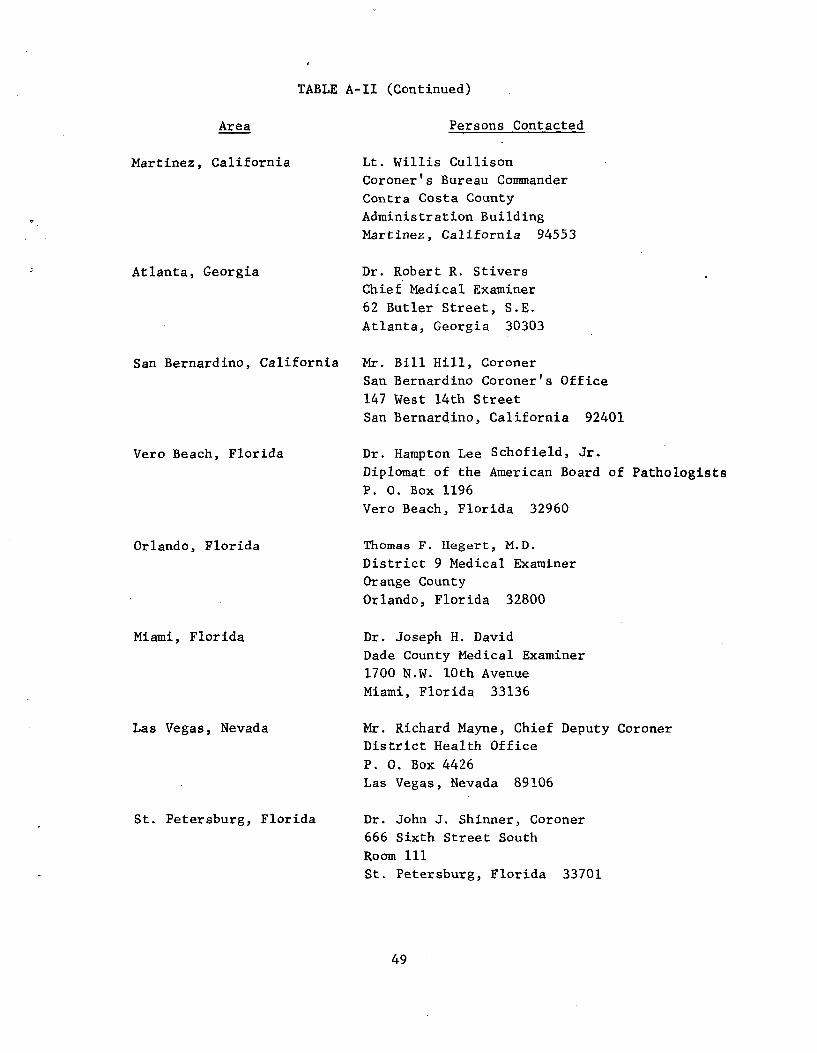
TABLE A-II (Continued)
Area Persons Contacted
Martinez, California Lt. Willis Cullison
Coroner's Bureau Commander
Contra Costa County
Administration Building
Martinez, California 94553
Atlanta, Georgia Dr. Robert R. Stivers
Chief Medical Examiner
62 Butler Street, S.E.
Atlanta, Georgia 30303
San Bernardino, California Mr. Bill Hill, Coroner
San Bernardino Coroner's Office
147 West 14th Street
San Bernardino, California 92401
Vero Beach, Florida Dr. Hampton Lee Schofield, Jr.
Diplomat of the American Board of Pathologists P. 0. Box 1196
Vero Beach, Florida 32960
Orlando, Florida Thomas F. Hegert, M.D.
District 9 Medical Examiner
Orange County
Orlando, Florida 32800
Miami, Florida Dr. Joseph H. David
Dade County Medical Examiner
1700 N.W. 10th Avenue
Miami, Florida 33136
Las Vegas, Nevada Mr. Richard Mayne, Chief Deputy Coroner
District Health Office
P. 0. Box 4426 Las Vegas, Nevada 89106
St. Petersburg, Florida Dr. John J. Shinner, Coroner
666 Sixth Street South
Room 111
St. Petersburg, Florida 33701
49
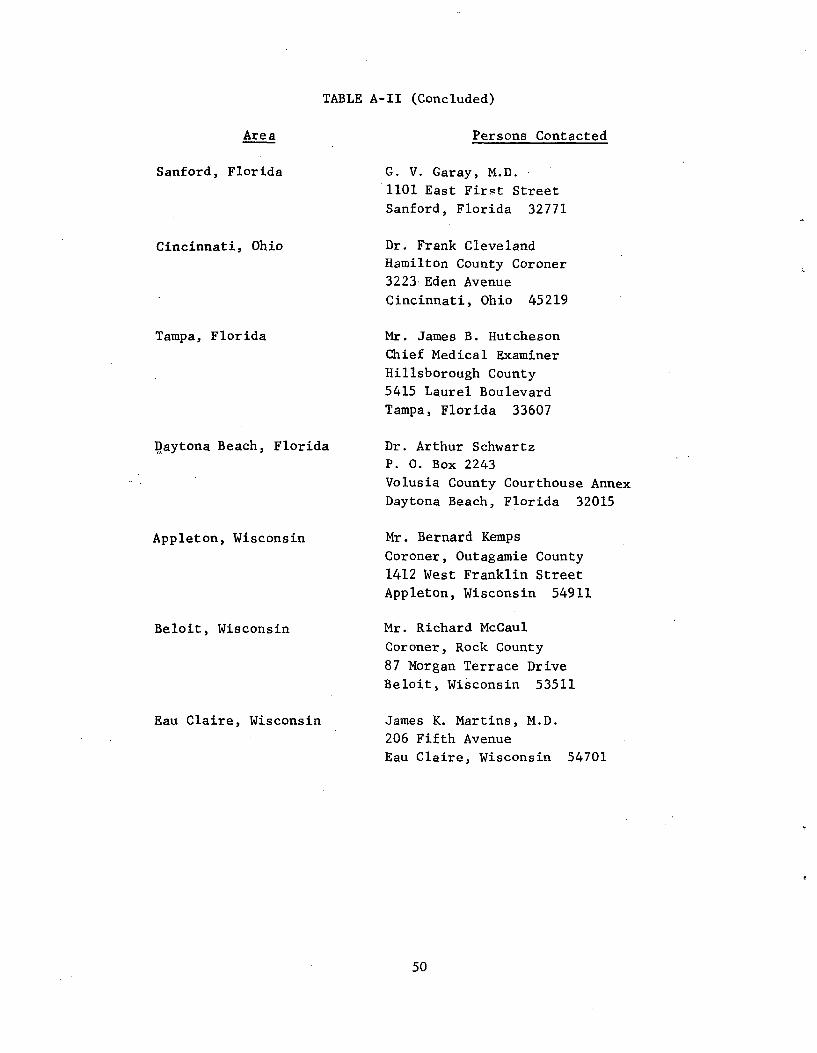
TABLE A-II (Concluded)
Area
Sanford, Florida
Cincinnati, Ohio
Tampa, Florida
Daytona Beach, Florida
Appleton, Wisconsin
Beloit, Wisconsin
Eau Claire, Wisconsin
Persons Contacted
G. V. Garay, M.D.
1101 East First Street Sanford, Florida 32771
Dr. Frank Cleveland
Hamilton County Coroner
3223 Eden Avenue
Cincinnati, Ohio 45219
Mr. James B. Hutcheson
Chief Medical Examiner
Hillsborough County
5415 Laurel Boulevard
Tampa, Florida 33607
Dr. Arthur Schwartz
P. 0. Box 2243
Volusia County Courthouse Annex
Daytona Beach, Florida 32015
Mr. Bernard Kemps
Coroner, Outagamie County
1412 West Franklin Street
Appleton, Wisconsin 54911
Mr. Richard McCaul
Coroner, Rock County
87 Morgan Terrace Drive
Beloit, Wisconsin 53511
James K. Martins, M.D.
206 Fifth Avenue
Eau Claire, Wisconsin 54701
50
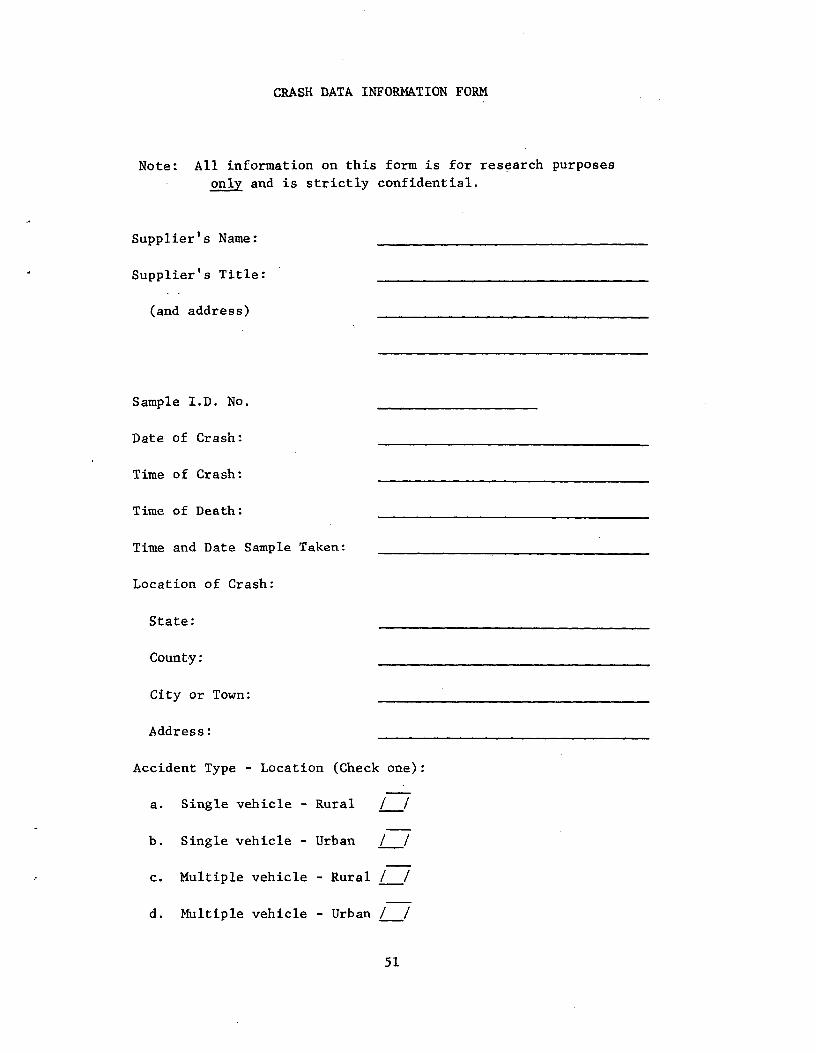
CRASH DATA INFORMATION FORM
Note: All information on this form is for research purposes
only and is strictly confidential.
Supplier's Name:
Supplier's Title:
(and address)
Sample I.D. No.
Date of Crash:
Time of Crash:
Time of Death:
Time and Date Sample Taken:
Location of Crash:
State:
County:
City or Town:
Address:
Accident Type - Location (Check one):
a. Single vehicle - Rural
b. Single vehicle - Urban
c. Multiple vehicle - Rural l /
d. Multiple vehicle - Urban l l
51
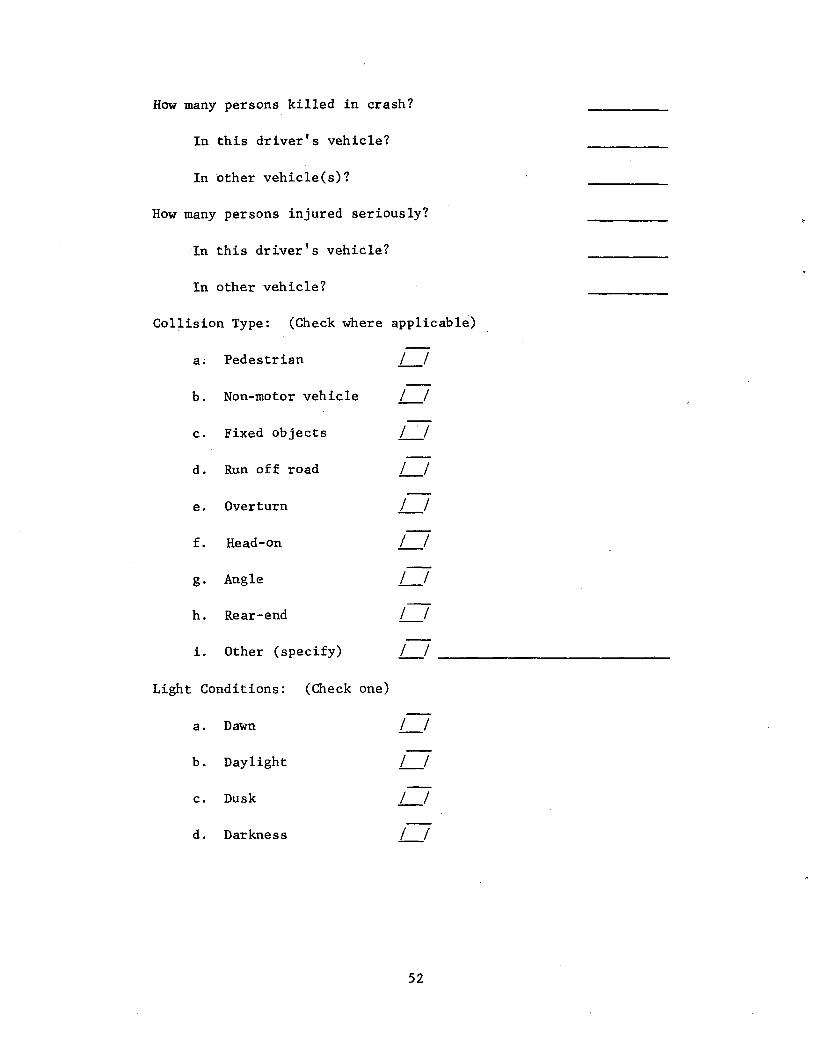
How many persons killed in crash?
In this driver's vehicle?
In other vehicle(s)?
How many persons injured seriously?
In this driver's vehicle?
In other vehicle?
Collision Type: (Check where applicable)
a. Pedestrian
b. Non-motor vehicle
c. Fixed objects
d. Run off road
e. Overturn
f. Head-on
g. Angle
h. Rear-end
i. Other (specify)
Light Conditions: (Check one)
a. Dawn
b. Daylight
c. Dusk
d. Darkness
52
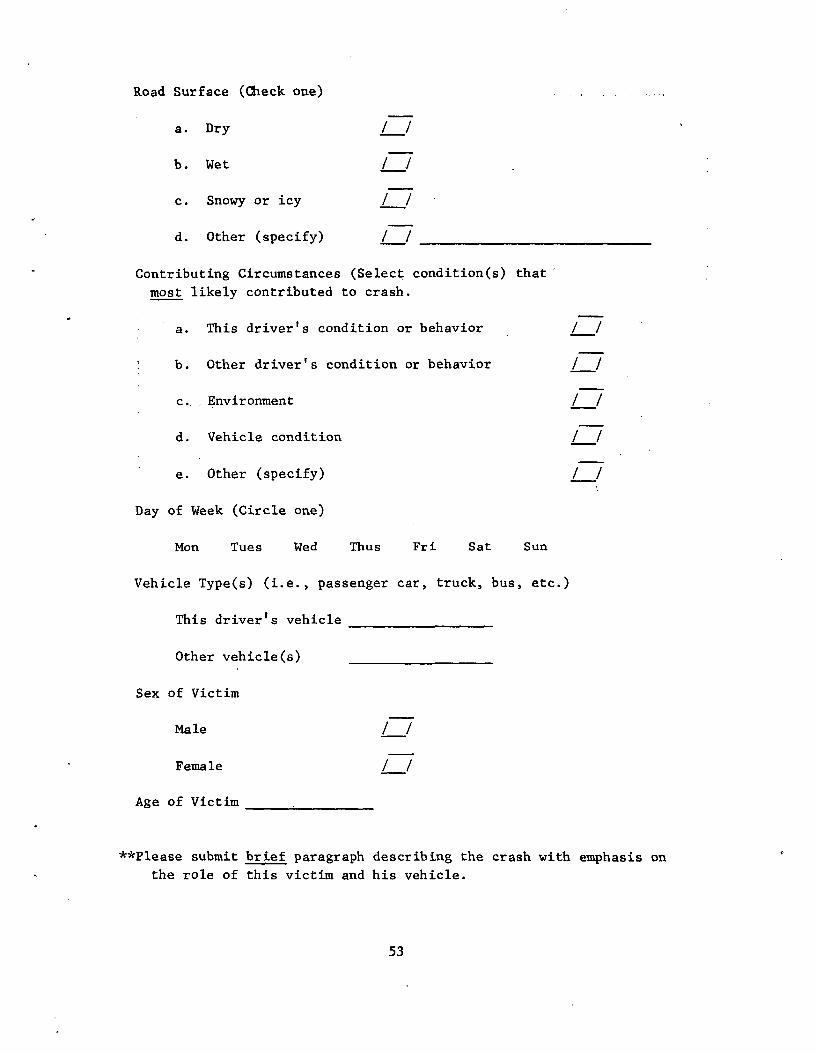
Road Surface (Check one)
a. Dry
b. Wet
c. Snowy or icy
d. Other (specify)
Contributing Circumstances (Select condition(s) that'
most likely contributed to crash.
a. This driver's condition or behavior / /
b. Other driver's condition or behavior
c.. Environment
d. Vehicle condition
e. Other (specify)
Day of Week (Circle one)
Mon Tues Wed Thus Fri Sat Sun
Vehicle Type(s) (i.e., passenger car, truck, bus, etc.)
This drivers vehicle
Other vehicle(s)
Sex of Victim
Male
Female
Age of Victim
**Please submit brief paragraph describing the crash with emphasis on
the role of this victim and his vehicle.
53
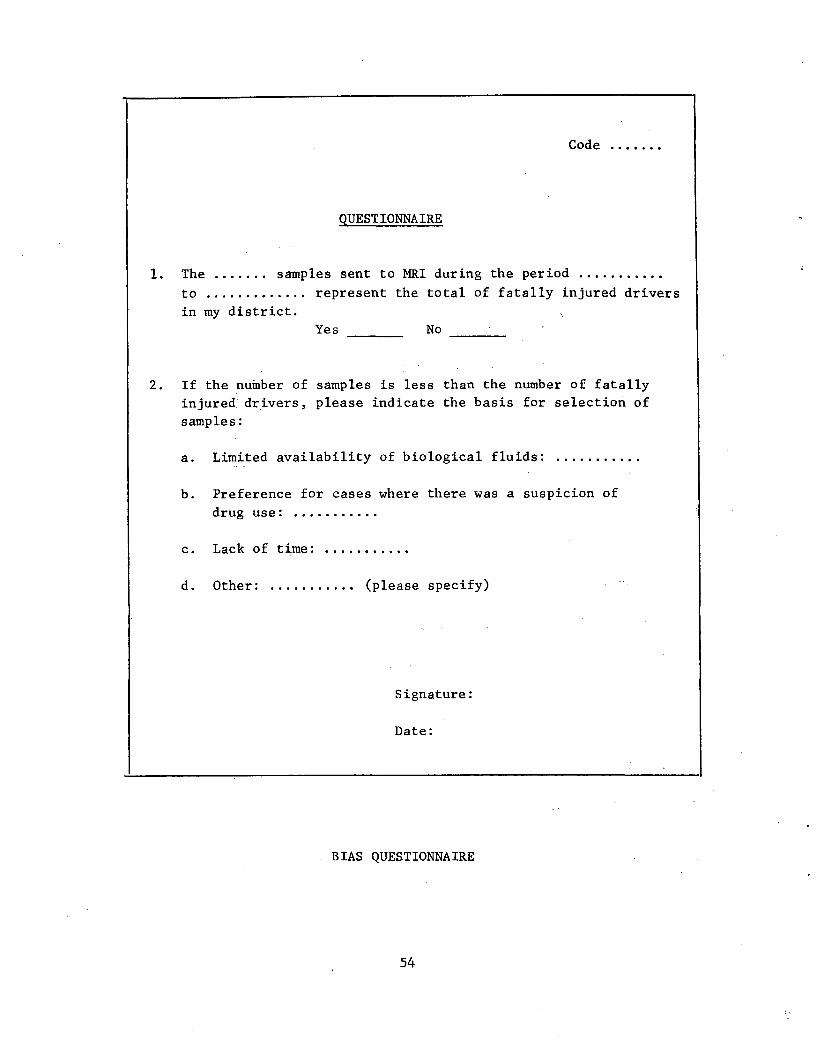
Code .......
QUESTIONNAIRE
1. The ....... samples sent to MRI during the period ...........
to ............. represent the total of fatally injured drivers
in my district.
Yes No
2. If the number of samples is less than the number of fatally
injured' drivers, please indicate the basis for selection of
samples:
a. Limited availability of biological fluids:
b. Preference for cases where there was a suspicion of
drug use: ...........
c. Lack of time: ...........
d. Other: ........... (please specify)
Signature:
Date:
. BIAS QUESTIONNAIRE
54
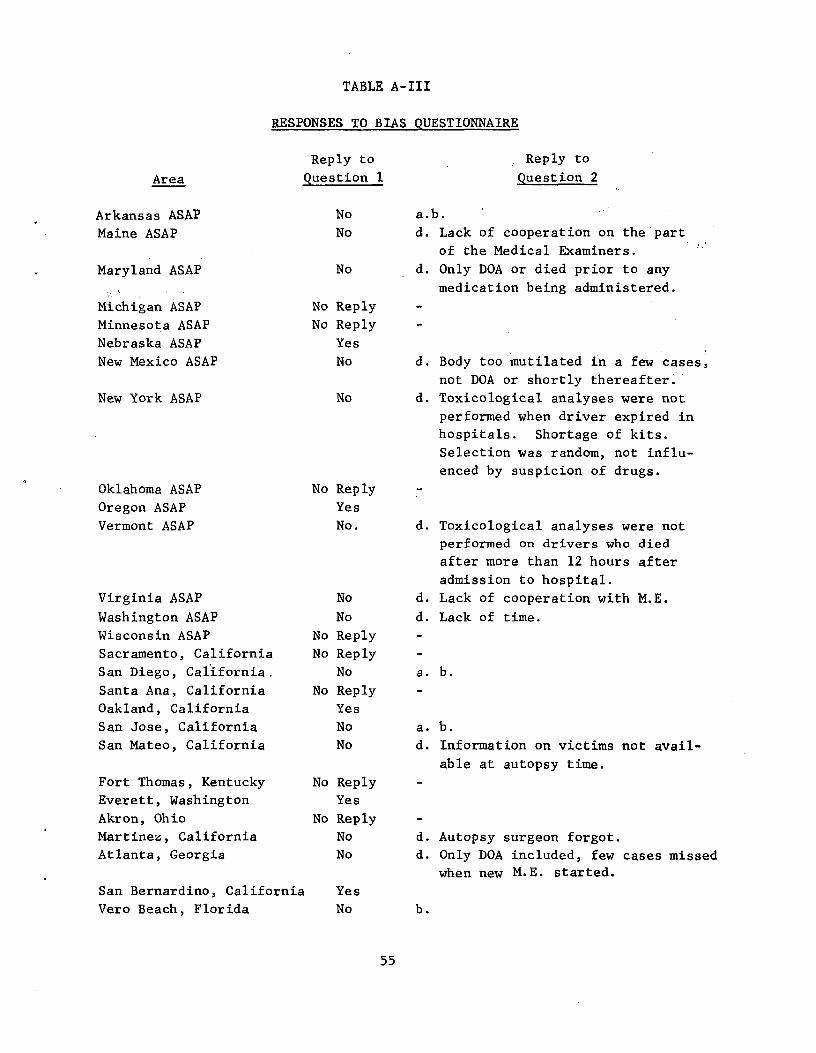
TABLE A-III
RESPONSES TO BIAS QUESTIONNAIRE
Reply to Reply to
Area Question 1 Question 2
Arkansas ASAP No a.b.
Maine ASAP No d. Lack of cooperation on the part of the Medical Examiners.
Maryland ASAP No d. Only DOA or died prior to any
medication being administered.
Michigan ASAP No Reply
Minnesota ASAP No Reply
Nebraska ASAP Yes
New Mexico ASAP No d. Body too mutilated in a few cases,
not DOA or shortly thereafter.
New York ASAP No d. Toxicological analyses were not
performed when driver expired in
hospitals. Shortage of kits.
Selection was random, not influ
enced by suspicion of drugs.
Oklahoma ASAP No Reply
Oregon ASAP Yes
Vermont ASAP No. d. Toxicological analyses were not
performed on drivers who died
after more than 12 hours after
admission to hospital.
Virginia ASAP No d. Lack of cooperation with M.E.
Washington ASAP No d. Lack of time.
Wisconsin ASAP No Reply
Sacramento, California No Reply
San Diego, California, No a. b.
Santa Ana, California No Reply
Oakland, California Yes
San Jose, California No a. b.
San Mateo, California No d. Information on victims not avail
able at autopsy time. Fort Thomas, Kentucky No Reply
Everett, Washington Yes
Akron, Ohio No Reply
Martinez, California No d. Autopsy surgeon forgot.
Atlanta, Georgia No d. Only DOA included, few cases missed
when new M.E. started.
San Bernardino, California Yes
Vero Beach, Florida No b.
55
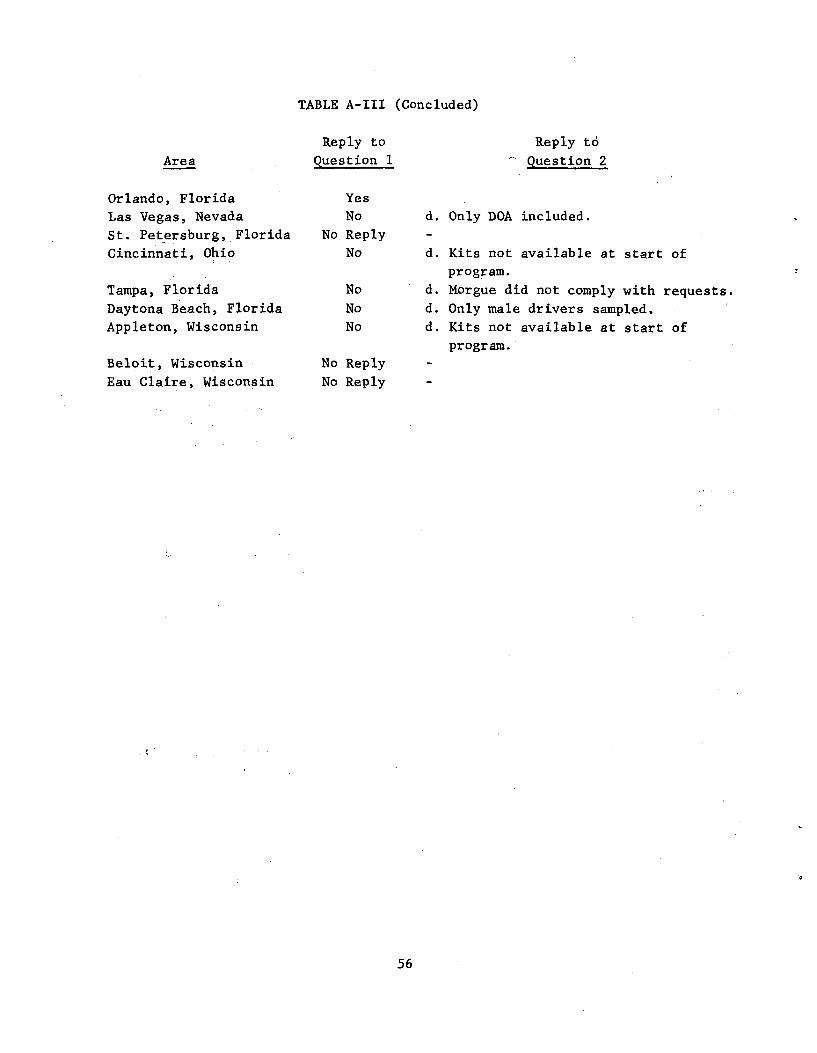
TABLE A-III (Concluded)
Reply to Reply to
Area Question 1 Question 2
Orlando, Florida Yes
Las Vegas, Nevada No d. Only DOA included.
St. Petersburg, Florida No Reply -
Cincinnati, Ohio No d. Kits not available at start of
program.
Tampa, Florida No d. Morgue did not comply with requests. Daytona Beach, Florida No d. Only male drivers sampled. Appleton, Wisconsin No d. Kits not available at start of
program.
Beloit, Wisconsin No Reply
Eau Claire, Wisconsin No Reply
56
APPENDIX B
ANALYTICAL DEVELOPMENT
57
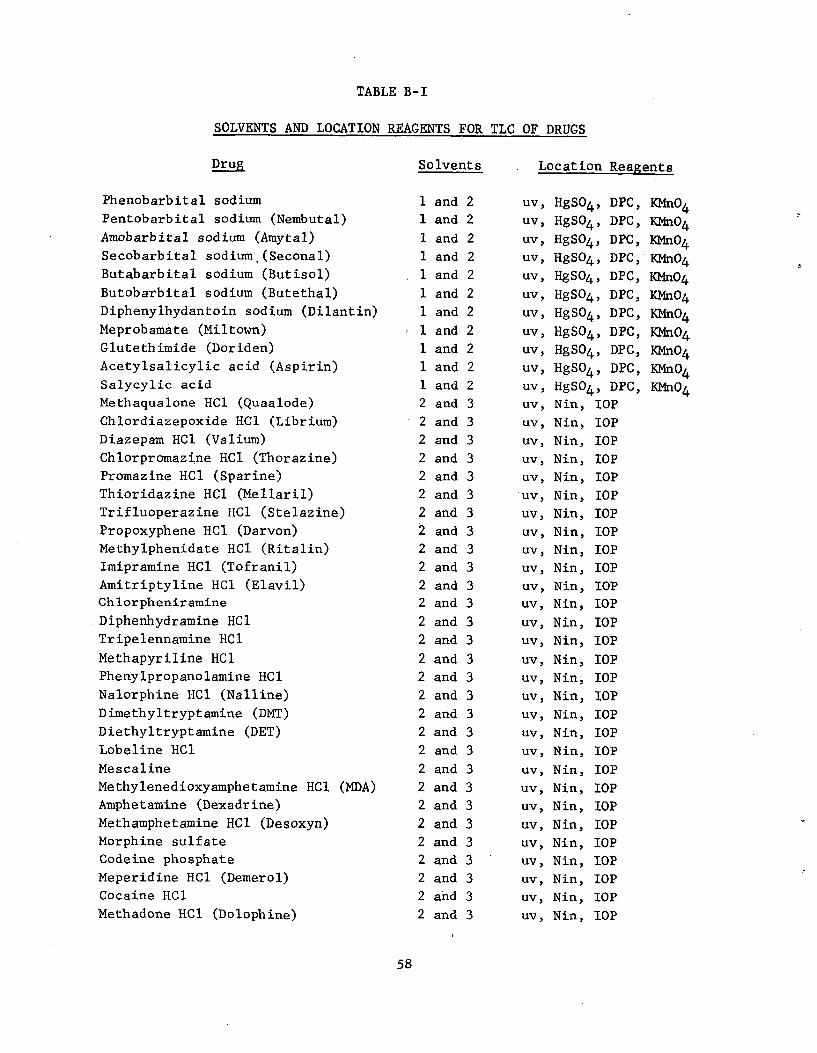
TABLE B-I
SOLVENTS AND LOCATION REAGENTS FOR TLC OF DRUGS
Drug
Phenobarbital sodium
Pentobarbital sodium (Nembutal)
Amobarbital sodium (Amytal)
Secobarbital sodium.(Seconal)
Butabarbital sodium (Butisol)
Butobarbital sodium (Butethal)
Diphenylhydantoin sodium (Dilantin)
Meprobamate (Miltown)
Glutethimide (Doriden)
Acetylsalicylic acid (Aspirin)
Salycylic acid
Methaqualone HC1 (Quaalode)
Chlordiazepoxide HC1 (Librium)
Diazepam HC1 (Valium)
Chlorpromazine HC1 (Thorazine)
Promazine HC1 (Sparine)
Thioridazine HC1 (Mellaril)
Trifluoperazine HC1 (Stelazine)
Propoxyphene HCl (Darvon)
Methylphenidate HC1 (Ritalin)
Imipramine HC1 (Tofranil)
Amitriptyline HC1 (Elavil)
Chlorpheniramine
Diphenhydramine HC1
Tripelennamine HC1
Methapyriline HC1
Phenylpropanolamine HC1
Nalorphine HC1 (Nalline)
Dimethyltryptamine (DMT)
Diethyltryptamine (DET)
Lobeline HC1
Mescaline
Methylenedioxyamphetamine HC1 (MDA)
Amphetamine (Dexadrine)
Methamphetamine HC1 (Desoxyn)
Morphine sulfate
Codeine phosphate
Meperidine HC1 (Demerol)
Cocaine HC1
Methadone HC1 (Dolophine)
Solvents
1 and 2
1 and 2
1 and 2
1 and 2
1 and 2
1 and 2
1 and 2
1 and 2
1 and 2
1 and 2
1 and 2
2 and 3
2 and 3
2 and 3
2 and 3
2 and 3
2 and 3
2 and 3
2 and 3
2 and 3
2 and 3
2 and 3
2 and 3
2 and 3
2 and 3
2 and 3
2 and 3
2 and 3
2 and 3
2 and 3
2 and 3
2 and 3
2 and 3
2 and 3
2 and 3
2 and 3
2 and 3
2 and 3
2 and 3
2 and 3
Location Reagents
uv, HgSO4, DPC, KMnO4
uv, HgSO4, DPC, KMn04
uv, HgSO4, DPC, KMn04
uv, HgSO4, DPC, KMn04
uv, HgSO4, DPC, KMn04
uv, HgSO4, DPC, KMn04
uv, HgSO4, DPC, KMn04
uv, HgSO4, DPC, KMn04
uv, HgSO4, DPC, KMn04
uv, HgSO4, DPC, KMnO4
uv, HgSO4, DPC, KMn04
uv, Nin, IOP
uv, Nin, IOP
uv, Nin, IOP
uv, Nin, IOP
uv, Nin, IOP
uv, Nin, IOP
uv, Nin, IOP
uv, Nin, IOP
uv, Nin, IOP
uv, Nin, IOP
uv, Nin, IOP
uv, Nin, IOP
uv, Nin, IOP
uv, Nin, IOP
uv, Nin, IOP
uv, Nin; IOP
uv, Nin, IOP
uv, Nin, IOP
uv, Nin, IOP
uv, Nin, IOP
uv, Nin, IOP
uv, Nin, IOP
uv, Nin, IOP
uv, Nin, IOP
uv, Nin, IOP
uv, Nin, IOP
uv, Nin, IOP
uv, Nin, IOP
uv, Nin, IOP
58
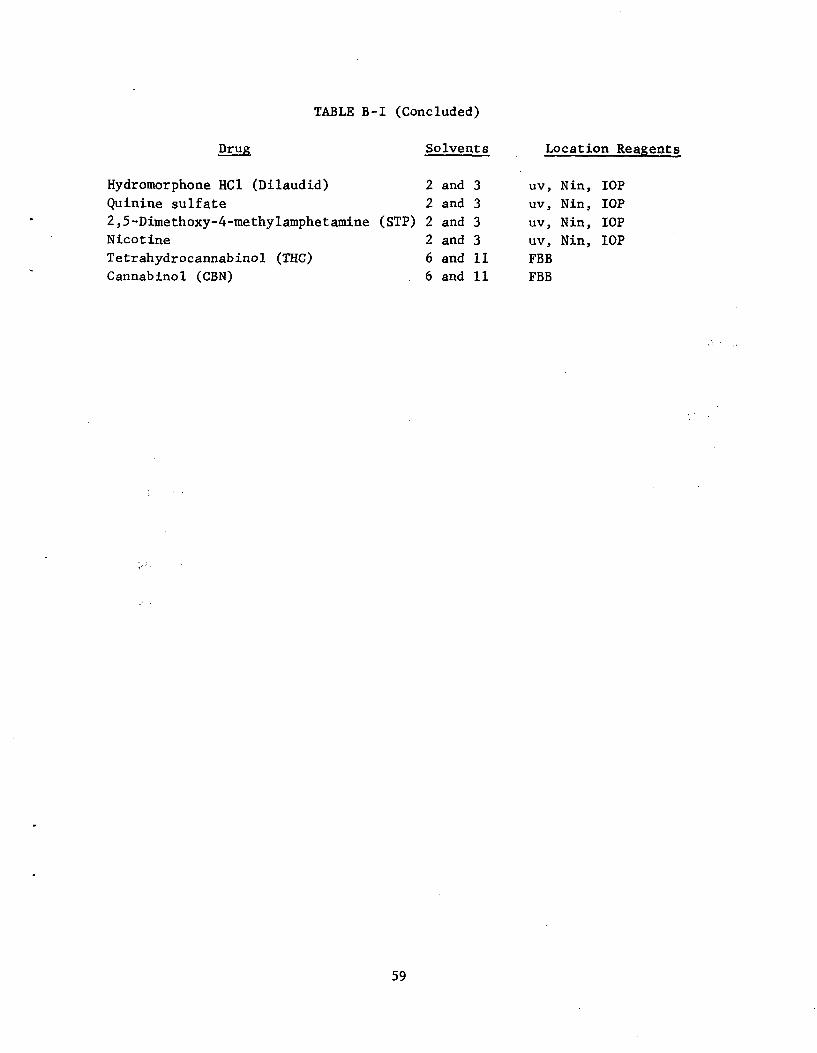
TABLE B-I (Concluded)
Drug Solvents Location Reagents
Hydromorphone HC1 (Dilaudid) 2 and 3 uv, Nin, IOP
Quinine sulfate 2 and 3 uv, Nin, IOP
2,5-Dimethoxy-4-methylamphetamine (STP) 2 and 3 uv, Nin, IOP
Nicotine 2 and 3 uv, Nin, IOP Tetrahydrocannabinol (THC) 6 and 11 FBB Cannabinol (CBN) 6 and 11 FBB
59
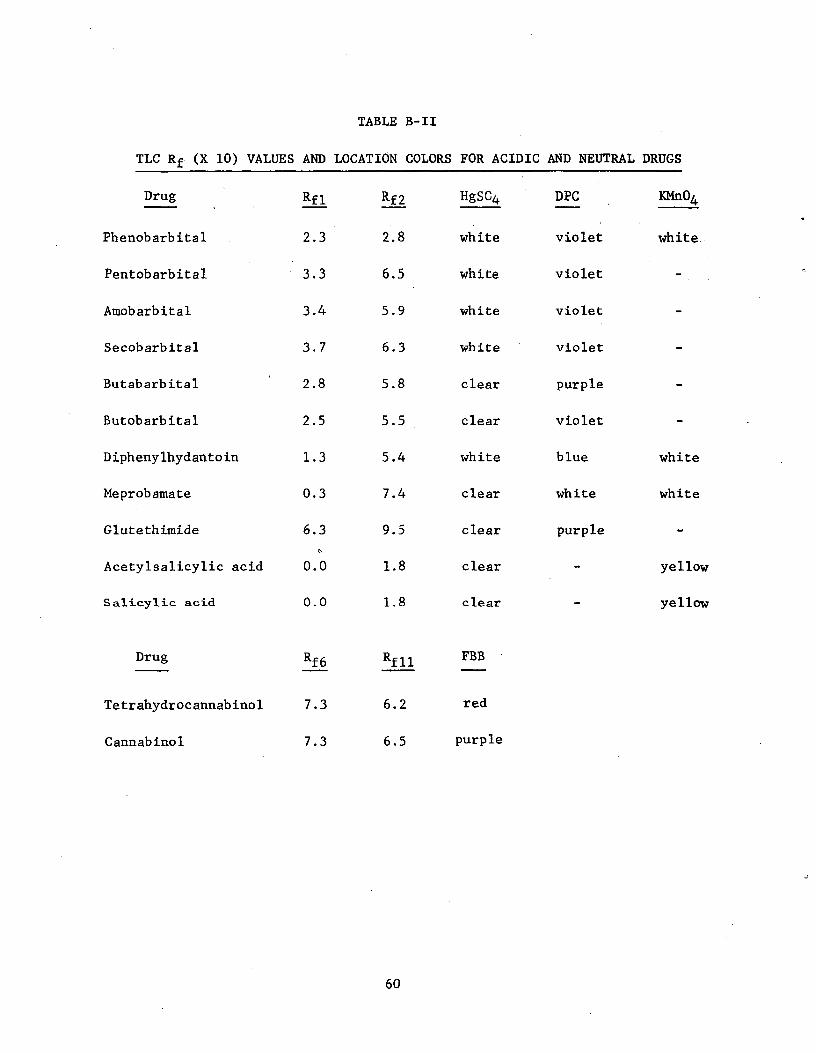
TABLE B-II
TLC Rf (X 10) VALUES AND LOCATION COLORS FOR ACIDIC AND NEUTRAL DRUGS
Drug Rfl Rf2 HgSC4 DPC KMn04
Phenobarbital 2.3 2.8 white violet white
Pentobarbital 3.3 6.5 white violet -
Amobarbital 3.4 5.9 white violet -
Secobarbital 3.7 6.3 white violet -
Butabarbital 2.8 5.8 clear purple -
Butobarbital 2.5 5.5 clear violet -
Diphenylhydantoin 1.3 5.4 white blue white
Meprobamate 0.3 7.4 clear white white
Glutethimide 6.3 9.5 clear purple -
Acetylsalicylic acid 0.0 1.8 clear - yellow
Salicylic acid 0.0 1.8 clear - yellow
Drug Rf 6 Rf 11 FBB
Tetrahydrocannabinol 7.3 6.2 red
Cannabinol 7.3 6.5 purple
60
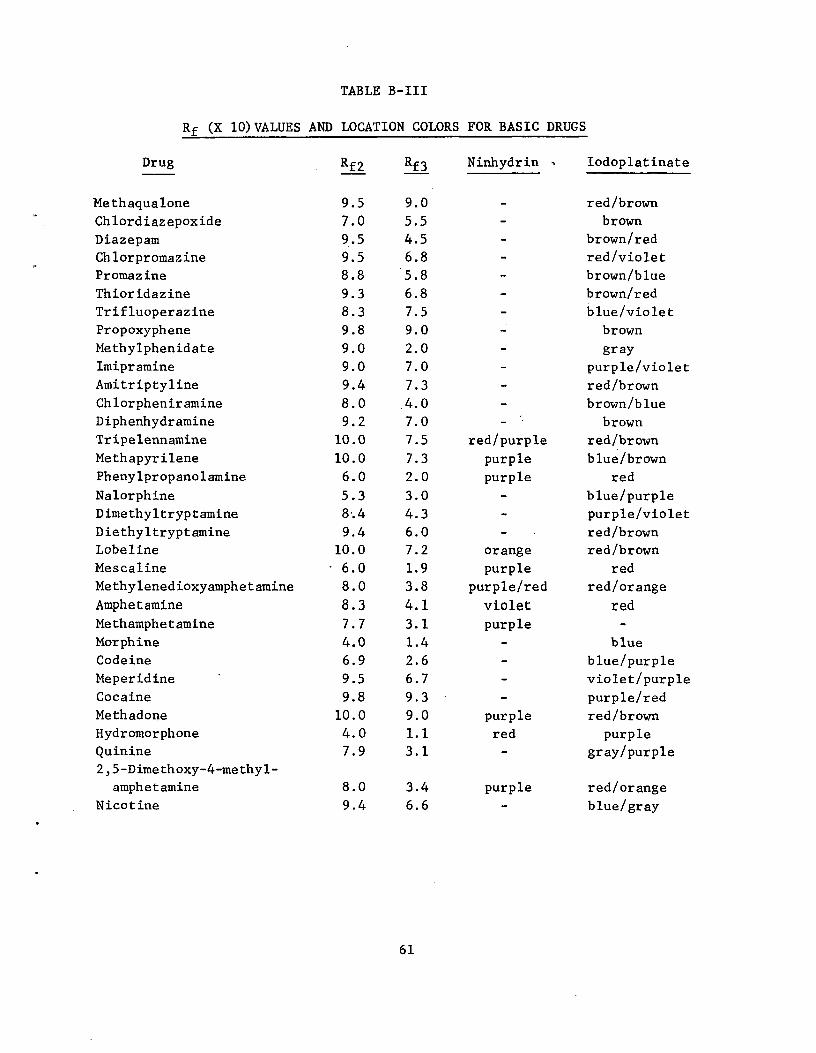
TABLE B-III
Rf (X 10)VALUES AND LOCATION COLORS FOR BASIC DRUGS
Drug
Me th aqua lone
Chlordiazepoxide
Diazepam
Chlorpromazine
Promazine
Thioridazine
Trifluoperazine
Propoxyphene
Methylphenidate
Imipramine
Amitriptyline
Chlorpheniramine
Diphenhydramine
Tripelennamine
Methapyrilene
Phenylpropanolamine
Nalorphine
Dimethyltryptamine
Diethyltryptamine
Lobeline
Mescaline
Methylenedioxyamphetamine
Amphetamine
Methamphetamine
Morphine
Codeine
Meperidine
Cocaine
Methadone
Hydromorphone
Quinine
2,5-Dimethoxy-4-methyl
amphetamine
Nicotine
9.5 9.0 red/brown
7.0 5.5 - brown
9.5 4.5 - brown/red
9.5 6.8 - red/violet
8.8 5.8 - brown/blue
9.3 6.8 - brown/red
8.3 7.5 - blue/violet
9.8 9.0 - brown
9.0 2.0 - gray
9.0 7.0 - purple/violet
9.4 7.3 - red/brown
8.0 .4.0 - brown/blue
9.2 7.0 - brown
10.0 7.5 red/purple red/brown
10.0 7.3 purple blue/brown
6.0 2.0 purple red
5.3 3.0 - blue/purple
8-.4 4.3 - purple/violet
9.4 6.0 - red/brown
10.0 7.2 orange red/brown
6.0 1.9 purple red
8.0 3.8 purple/red red/orange
8.3 4.1 violet red
7.7 3.1 purple
4.0 1.4 - blue
6.9 2.6 - blue/purple
9.5 6.7 - violet/purple
9.8 9.3 - purple/red
10.0 9.0 purple red/brown
4.0 1.1 red purple
7.9 3.1 - gray/purple
8.0 3.4 purple red/orange
9.4 6.6 blue/gray
61
Rf2 Rf3 Ninhydrin a Iodoplatinate
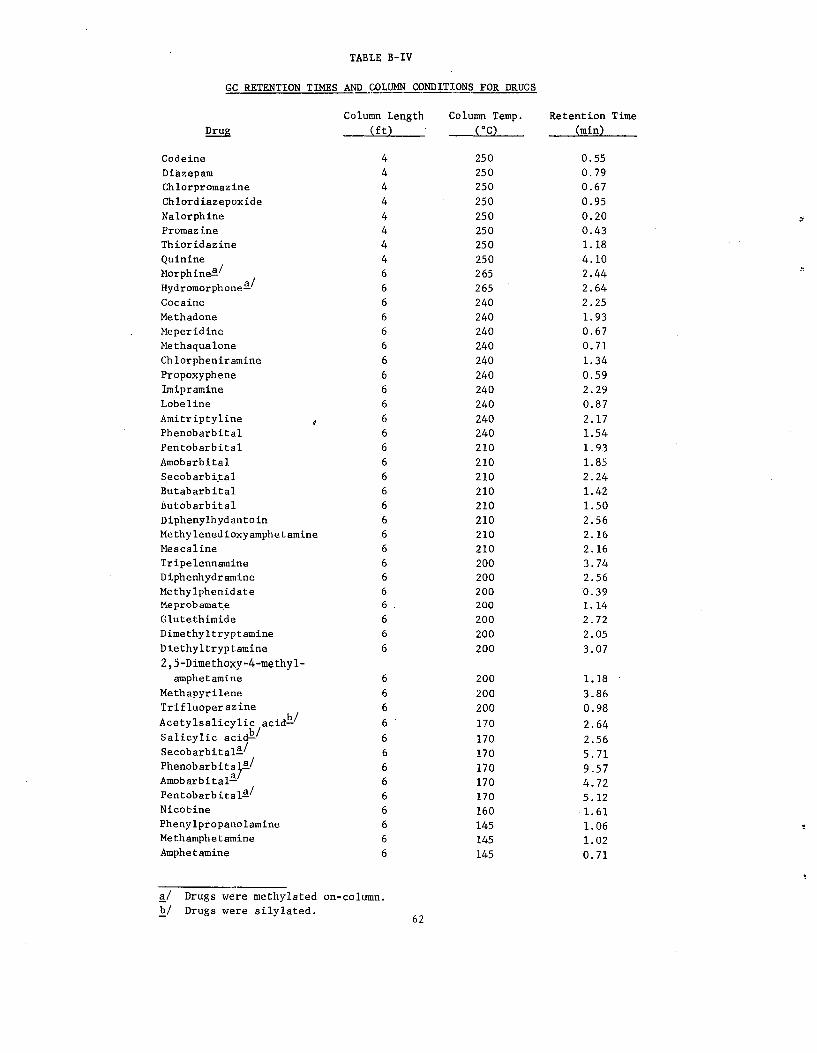
TABLE B-IV
GC RETENTION TIMES AND COLUMN CONDITIONS FOR DRUGS
Column Length Column Temp. Retention Time
Drug (ft) (°C) _ (min)
Codeine 250 0.55Diazepam 250 0.79Chlorpromazine 250 0.67Chlordiazepoxide 250 0.95Nalorphine 250 0.20Promazine 250 0.43Thioridazine 250 1.18Quinine 250 4.10Morphinea/ 265 2.44Hydromorphonea/ 265 2.64
Cocaine 240 2.25Methadone 240 1.93Meperidine 240 0.67Methaqualone 240 0.71Chlorpheniramine 240 1.34Propoxyphene 240 0.59Imipramine 240 2.29
Lobeline 240 0.87Amitriptyline 240 2.17Phenobarbital 240 1.54Pentobarbital 210 1.93Amobarbital 210 1.85Secobarbital 210 2.24Butabarbital 210 1.42Butobarbital 210 1.50Diphenylhydantoin 210 2.56Methylenedioxyamphetamine 210 2.16Mescaline 210 2.16Tripelennamine 200 3.74Diphenhydramine 200 2.56Methylphenidate 200 0.39Meprobamate 200 1.14
Glutethimide 200 2.72 Dimethyltryptamine 200 2.05
Diethyltryptamine 200 3.07 2,5-Dimethoxy-4-methyl
amphetamine 6 200 1.18
Methapyrilene 6 200 3.86 Trifluoperazine 6 200 0.98 Acetylsalicylic acidb/ 6 170 2.64 Salicylic acid!!/ 6 170 2.56 Secobarbitala/ 6 170 5.71 Phenobarbital, a/ 6 170 9.57 Amobarbitala 6 170 4.72 Pentobarbitala/ 6 170 5.12 Nicotine 6 160 1.61 Phenylpropanolamine 6 145 1.06 Methamphetamine 6 145 1.02 Amphetamine 6 145 0.71
R/ Drugs were methylated on-column. b/ Drugs were silylated.
62

*
Receipt of SpecimensUrine, Blood,Bile, Face and Finger
Washings
(Method Used forSamples 366-710) Face and Finger
Washings
"NO BloodAvailable
NO Urine
Available
NO Bile
Available
*
Available
YES YESYES YES YES
Allow Swabsto Dry
Elute Swabswith Methanol
Take 15 ml Take 20 ml Take Up to10 ml
Spot 2(ILI ofSolution on Eachof 2 TLC Plates(Note A)
'Develop TLC si n S lo vent 2(Note B)
Plate I I I Plate 2•
Add 2 Drops0,25% Fast BlueB in 0.1N HCI
Evaporateto Dryness
Dilute 1:1with H 2O
*
Dilute 1:1with H2O Reconstitute
Residue in100pJMethanol
Spray withSolution 8 F^ Spray with
Solutions9 and 10
I
Allow Swabs Reconstitute Hydrolyze Hydrolyze Hydrolyzeto Dry for 2 in 1/2 ml of (Note C ) (Note C ) (Note C)Minutes Solvent 4 Positive
Add I Drop Indicates Positive with
Add 2 Drops0.2N N0OH
Spot 100p1 on TLCPlate (Note A)
Conc. HCI Acidic and Spray 9 and/Evaporate Neutral Drugs or Spray 10Eluont to IndicatesDryness Basic Drugs
*
Rerun TLC in
Observe ColorFormation
Develop inSolvent 11(Note a)
Solvent I or 3Elute Drugs
Using Somewith 15 ml Sprays toSolution 7 Confirm
*
Red ColorIndicatesMarihuana
Spray with
Solution 5
*
* *
Rinse Column Inject 5p.1 Confirmationwith 20 ml of Extract andF-NH2O Solution Into Quontitation
GC (Note D) of Drug Presence
I`rPositive
Indicates
Marihuana
I *
A
Add Buffer to pH 9.2Pass Liquid Through Mass
Column, 5 cm x 1 cm, 1-1 Spectrometer
Packed with 2 g of (Note E)
Rerun TLCAmberlite XAD-2
in Solvent eport-^ Indicates R6 to Confirm
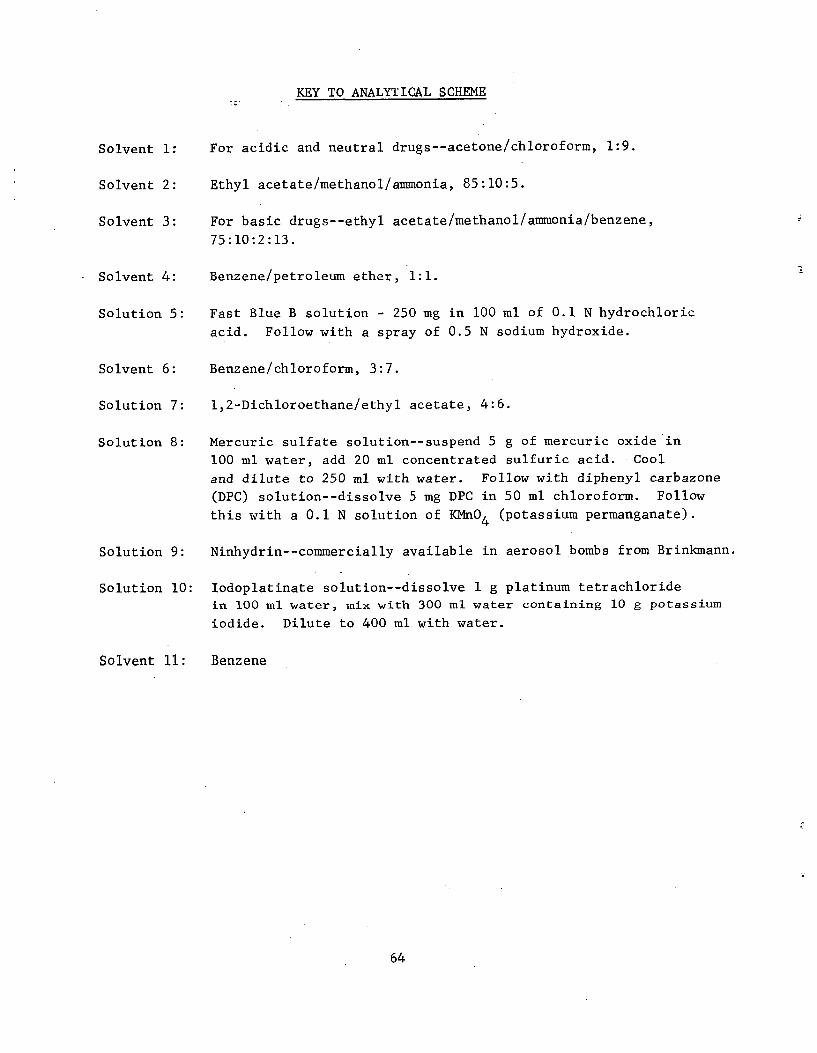
KEY TO ANALYTICAL SCHEME
Solvent 1: For acidic and neutral drugs--acetone/chloroform, 1:9.
Solvent 2: Ethyl acetate/methanol/ammonia, 85:10:5.
Solvent 3: For basic drugs--ethyl acetate/methanol/ammonia/benzene,
75:10:2:13.
Solvent 4: Benzene/petroleum ether, 1:1.
Solution 5: Fast Blue B solution - 250 mg in 100 ml of 0.1 N hydrochloric
acid. Follow with a spray of 0.5 N sodium hydroxide.
Solvent 6: Benzene/chloroform, 3:7.
Solution 7: 1,2-Dichloroethane/ethyl acetate, 4:6.
Solution 8: Mercuric sulfate solution--suspend 5 g of mercuric oxide in
100 ml water, add 20 ml concentrated sulfuric acid. Cool
and dilute to 250 ml with water. Follow with diphenyl carbazone
(DPC) solution--dissolve 5 mg DPC in 50 ml chloroform. Follow
this with a 0.1 N solution of KMnO4 (potassium permanganate).
Solution 9: Ninhydrin--commercially available in aerosol bombs from Brinkmann.
Solution 10: Iodoplatinate solution--dissolve 1 g platinum tetrachloride
in 100 ml water, mix with 300 ml water containing 10 g potassium
iodide. Dilute to 400 ml with water.
Solvent 11: Benzene
64
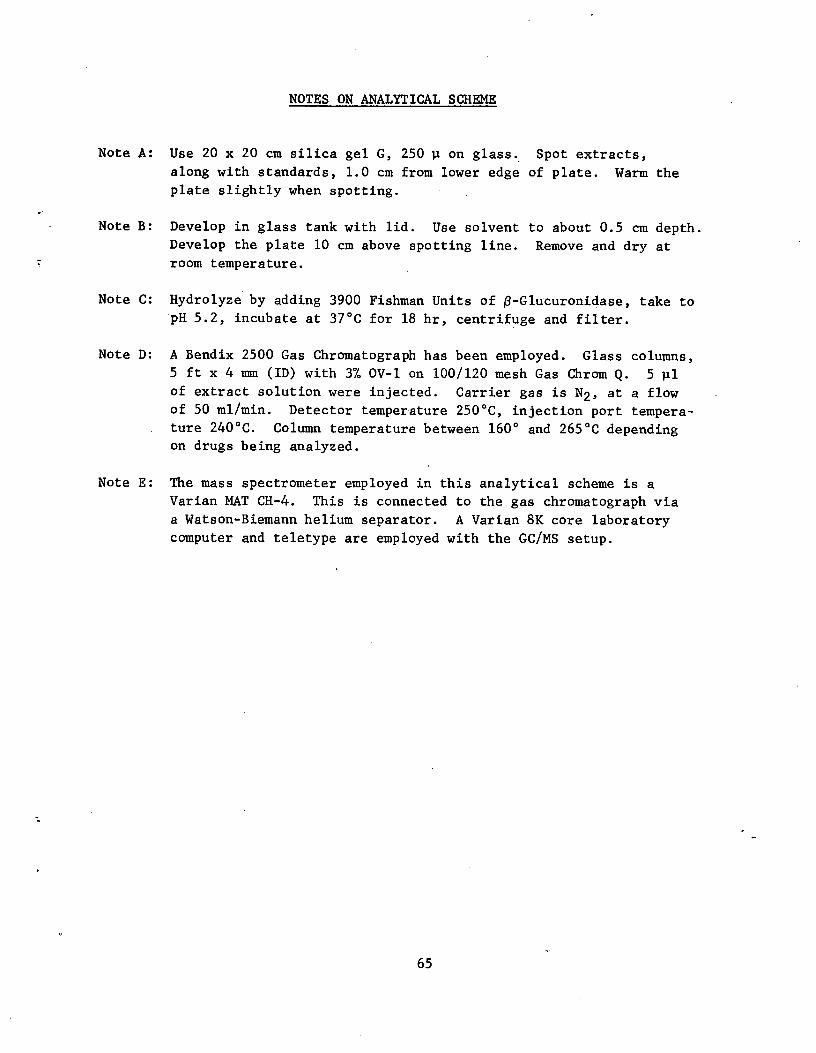
NOTES ON ANALYTICAL SCHEME
Note A: Use 20 x 20 cm silica gel G, 250 p on glass. Spot extracts,
along with standards, 1.0 cm from lower edge of plate. Warm the
plate slightly when spotting.
Note B: Develop in glass tank with lid. Use solvent to about 0.5 cm depth.
Develop the plate 10 cm above spotting line. Remove and dry at
room temperature.
Note C: Hydrolyze by adding 3900 Fishman Units of /3-Glucuronidase, take to pH 5.2, incubate at 37°C for 18 hr, centrifuge and filter.
Note D: A Bendix 2500 Gas Chromatograph has been employed. Glass columns,
5 ft x 4 mm (ID) with 3% OV-1 on 100/120 mesh Gas Chrom Q. 5 pl
of extract solution were injected. Carrier gas is N2, at a flow
of 50 ml/min. Detector temperature 250°C, injection port tempera
ture 240°C. Column temperature between 160° and 265°C depending
on drugs being analyzed.
Note E: The mass spectrometer employed in this analytical scheme is a
Varian MAT CH-4. This is connected to the gas chromatograph via
a Watson-Biemann helium separator. A Varian 8K core laboratory
computer and teletype are employed with the GC/MS setup.
65
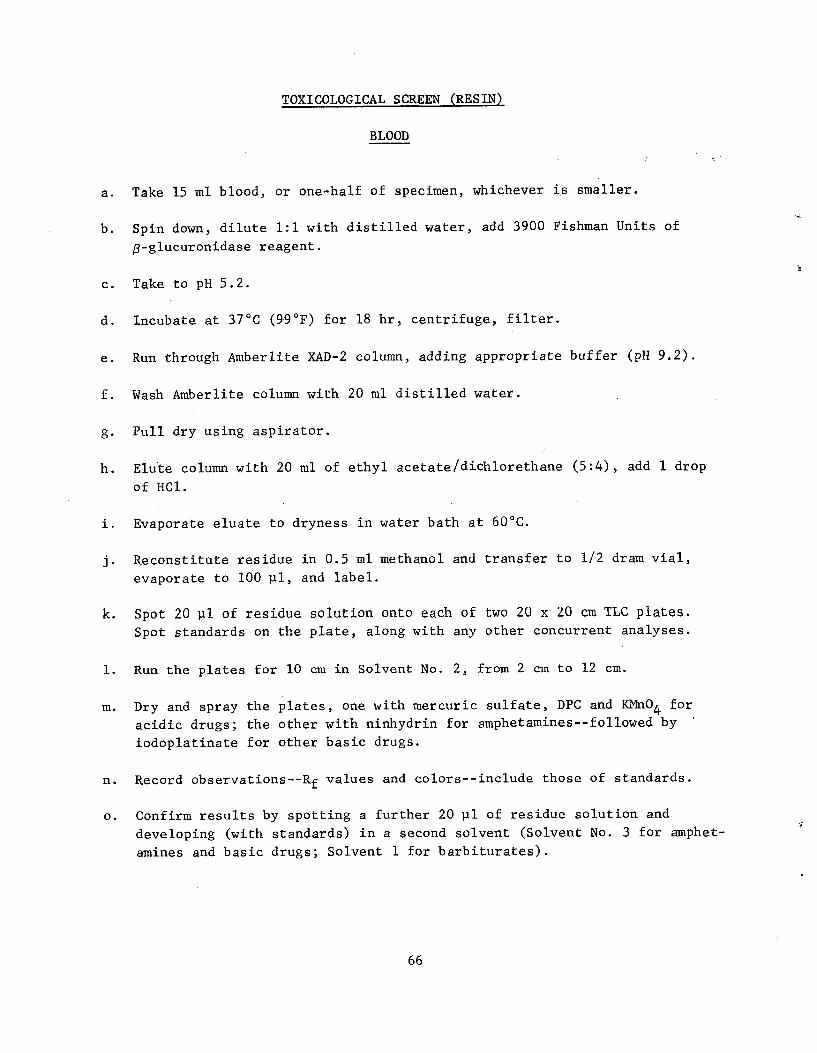
TOXICOLOGICAL SCREEN (RESIN)
BLOOD
a. Take 15 ml blood, or one-half of specimen, whichever is smaller.
b. Spin down, dilute 1:1 with distilled water, add 3900 Fishman Units of
R-glucuronidase reagent.
c. Take to pH 5.2.
d. Incubate at 37°C (99°F) for 18 hr, centrifuge, filter.
e. Run through Amberlite XAD-2 column, adding appropriate buffer (pH 9.2).
f. Wash Amberlite column with 20 ml distilled water.
g. Pull dry using aspirator.
h. Elute column with 20 ml of ethyl acetate/dichlorethane (5:4), add 1 drop
of HC1.
i. Evaporate eluate to dryness in water bath at 60°C.
j. Reconstitute residue in 0.5 ml methanol and transfer to 1/2 dram vial,
evaporate to 100 pl, and label.
k. Spot 20 pl of residue solution onto each of two 20 x 20 cm TLC plates.
Spot standards on the plate, along with any other concurrent analyses.
1. Run the plates for 10 cm in Solvent No. 2, from 2 cm to 12 cm.
M. Dry and spray the plates, one with mercuric sulfate, DPC and KMnO4 for
acidic drugs; the other with ninhydrin for amphetamines--followed by
iodoplatinate for other basic drugs.
n. Record observations--Rf values and colors--include those of standards.
o. Confirm results by spotting a further 20 pl of residue solution and
developing (with standards) in a second solvent (Solvent No. 3 for amphet
amines and basic drugs; Solvent 1 for barbiturates).
66
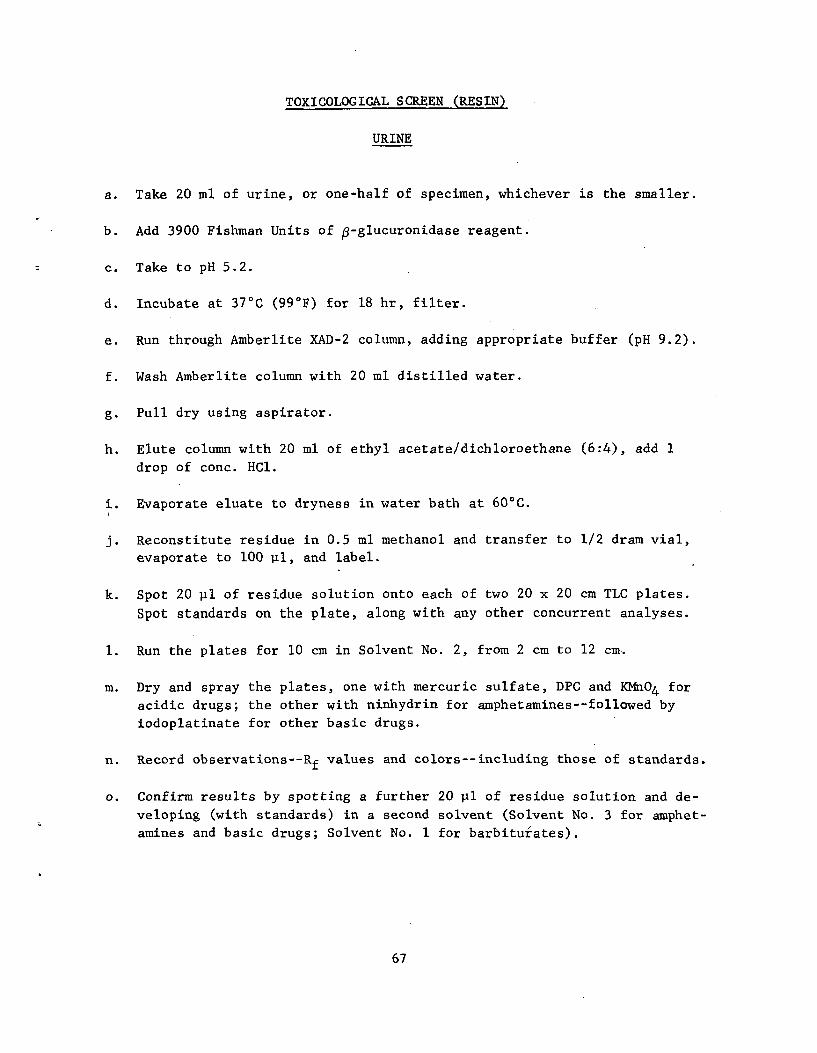
TOXICOLOGICAL SCREEN (RESIN)
URINE
a. Take 20 ml of urine, or one-half of specimen, whichever is the smaller.
b. Add 3900 Fishman Units of 13-glucuronidase reagent.
c. Take to pH 5.2.
d. Incubate at 37°C (99°F) for 18 hr, filter.
e. Run through Amberlite XAD-2 column, adding appropriate buffer (pH 9.2).
f. Wash Amberlite column with 20 ml distilled water.
g. Pull dry using aspirator.
h. Elute column with 20 ml of ethyl acetate/ dichloroethane (6:4), add 1
drop of conc. HC1.
i. Evaporate eluate to dryness in water bath at 60°C.
j. Reconstitute residue in 0.5 ml methanol and transfer to 1/2 dram vial,
evaporate to 100 ul, and label.
k. Spot 20 pl of residue solution onto each of two 20 x 20 cm TLC plates.
Spot standards on the plate, along with any other concurrent analyses.
1. Run the plates for 10 cm in Solvent No. 2, from 2 cm to 12 cm.
m. Dry and spray the plates, one with mercuric sulfate, DPC and KMn04 for
acidic drugs; the other with ninhydrin for amphetamines--followed by
iodoplatinate for other basic drugs.
n. Record observations--Rf values and colors--including those of standards.
o. Confirm results by spotting a further 20 pl of residue solution and de
veloping (with standards) in a second solvent (Solvent No. 3 for amphet
amines and basic drugs; Solvent No. 1 for barbiturates).
67
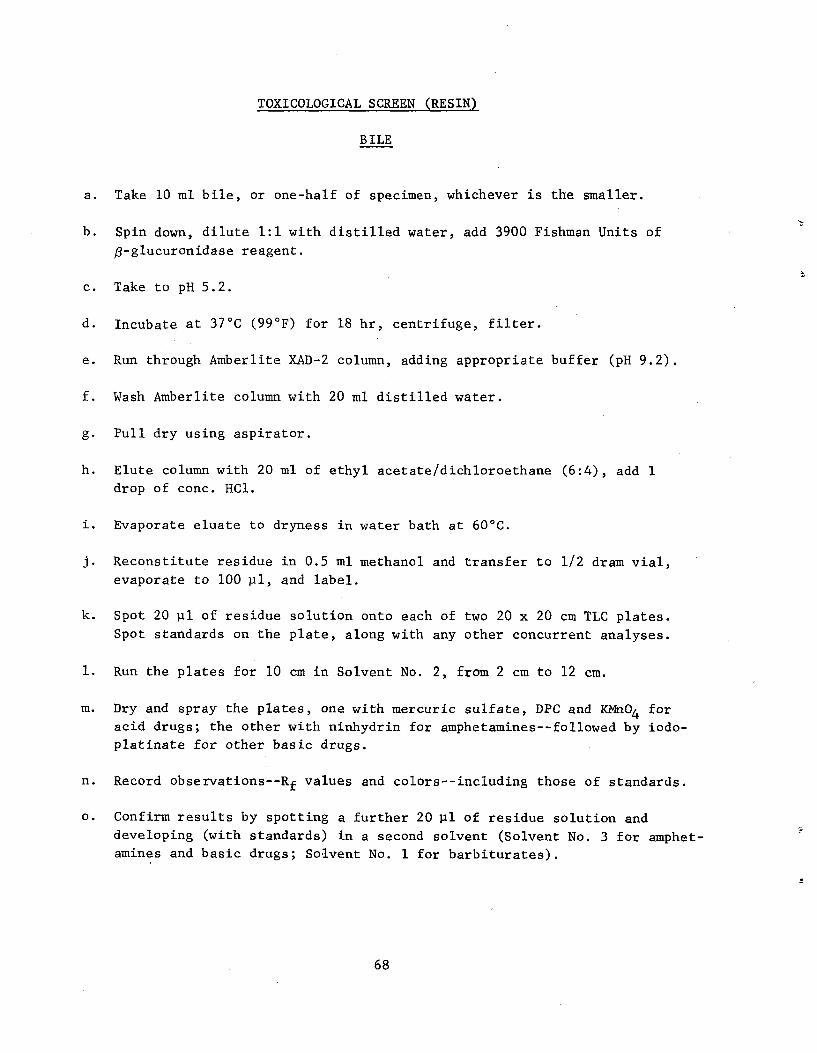
TOXICOLOGICAL SCREEN (RESIN)
B ILE
a. Take 10 ml bile, or one-half of specimen, whichever is the smaller.
b. Spin down, dilute 1:1 with distilled water, add 3900 Fishman Units of
$-glucuronidase reagent.
c. Take to pH 5.2.
d. Incubate at 37°C (99°F) for 18 hr, centrifuge, filter.
e. Run through Amberlite XAD-2 column, adding appropriate buffer (pH 9.2).
f. Wash Amberlite column with 20 ml distilled water.
g. Pull dry using aspirator.
h. Elute column with 20 ml of ethyl acetate/dichloroethane (6:4), add 1
drop of conc. HC1.
i. Evaporate eluate to dryness in water bath at 60°C.
J Reconstitute residue in 0.5 ml methanol and transfer to 1/2 dram vial,
evaporate to 100 pl, and label.
k. Spot 20 ul of residue solution onto each of two 20 x 20 cm TLC plates.
Spot standards on the plate, along with any other concurrent analyses.
1. Run the plates for 10 cm in Solvent No. 2, from 2 cm to 12 cm.
M. Dry and spray the plates, one with mercuric sulfate, DPC and KMnO4 for
acid drugs; the other with ninhydrin for amphetamines--followed by iodo
platinate for other basic drugs.
n. Record observations--Rf values and colors--including those of standards.
o. Confirm results by spotting a further 20 pl of residue solution and
developing (with standards) in a second solvent (Solvent No. 3 for amphet
amines and basic drugs; Solvent No. 1 for barbiturates).
68
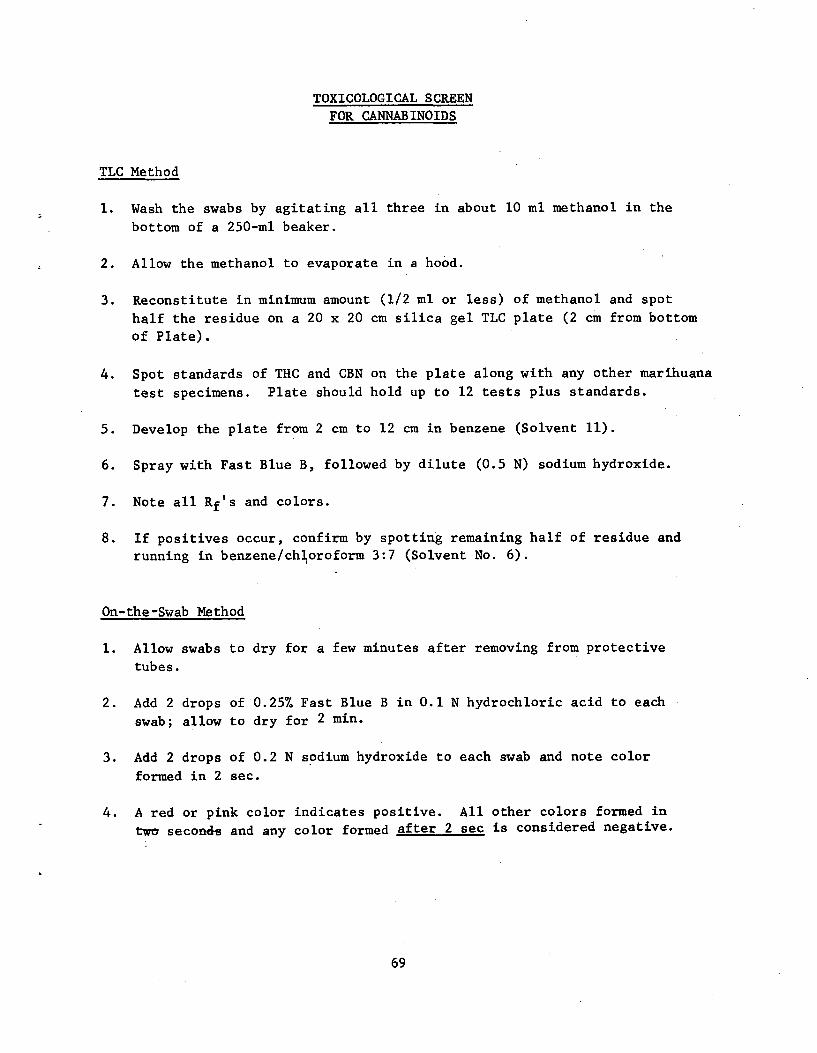
TOXICOLOGICAL SCREEN
FOR CANNABINOIDS
TLC Method
1. Wash the swabs by agitating all three in about 10 ml methanol in the
bottom of a 250-m1 beaker.
2. Allow the methanol to evaporate in a hood.
3. Reconstitute in minimum amount (1/2 ml or less) of methanol and spot
half the residue on a 20 x 20 cm silica gel TLC plate (2 cm from bottom
of Plate).
4. Spot standards of THC and CBN on the plate along with any other marihuana
test specimens. Plate should hold up to 12 tests plus standards.
5. Develop the plate from 2 cm to 12 cm in benzene (Solvent 11).
6. Spray with Fast Blue B, followed by dilute (0.5 N) sodium hydroxide.
7. Note all Rf's and colors.
8. If positives occur, confirm by spotting remaining half of residue and running in benzene/chloroform 3:7 (Solvent No. 6).
On-the-Swab Method
1. Allow swabs to dry for a few minutes after removing from protective
tubes.
2. Add 2 drops of 0.257 Fast Blue B in 0.1 N hydrochloric acid to each swab; allow to dry for 2 min.
3. Add 2 drops of 0.2 N sodium hydroxide to each swab and note color
formed in 2 sec.
4. A red or pink color indicates positive. All other colors formed in
two seconds and any color formed after 2 sec is considered negative.
69
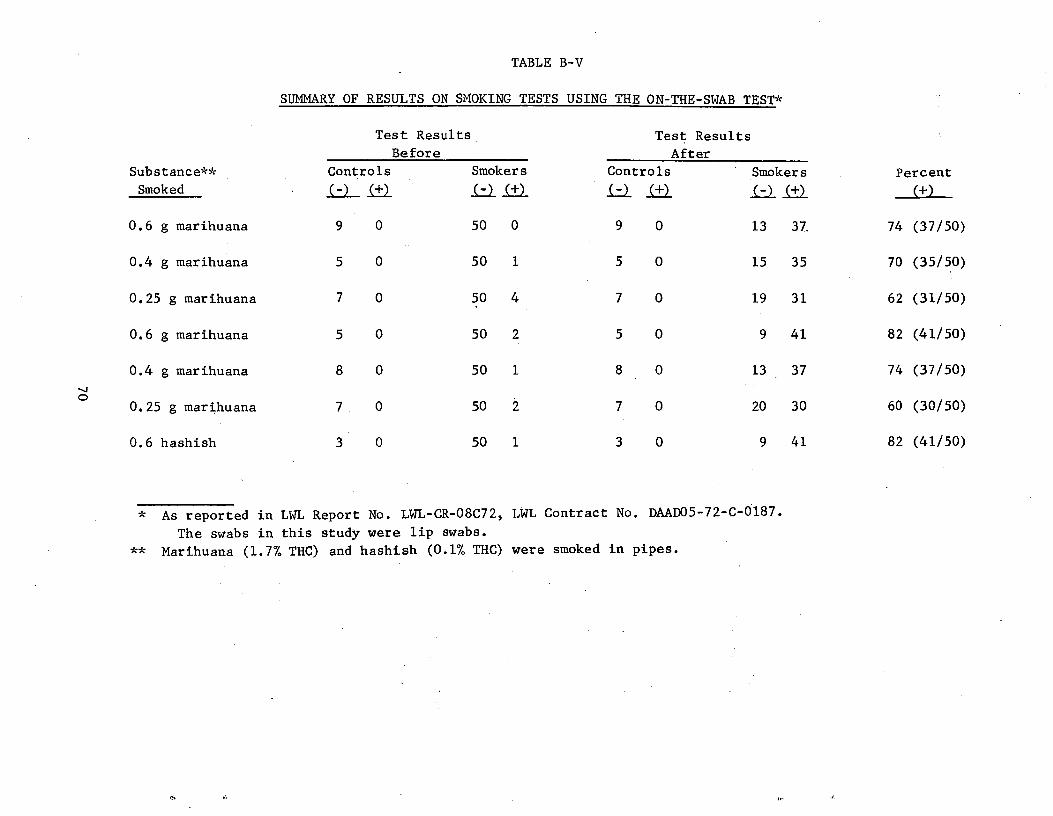
TABLE B-V
SUMMARY OF RESULTS ON SMOKING TESTS USING THE ON-THE-SWAB TEST*
Substance**
Smoked
Test Results
Before
Controls Smokers
Test Results
After
Controls Smokers Percent
0.6 g marihuana 9 0 50 0 9 0 13 37, 74 (37/50)
0.4 g marihuana 5 0 50 1 5 0 15 35 70 (35/50)
0.25 g marihuana 7 0 50 4 7 0 19 31 62 (31/50)
0.6 g marihuana 5 0 50 2 5 0 9 41 82 (41/50)
0.4 g marihuana 8 0 50 1 8 0 13 37 74 (37/50)
0.25 g marihuana 7 0 50 2 7 0 20 30 60 (30/50)
0.6 hashish 3 0 50 1 3 0 9 41 82 (41/50)
*
**
As reported in LWL Report No. LWL-CR-08C72, LWL Contract No. DAAD05-72-C-0187.
The swabs in this study were lip swabs.
Marihuana (1.7% THC) and hashish (0.1% THC) were smoked in pipes.
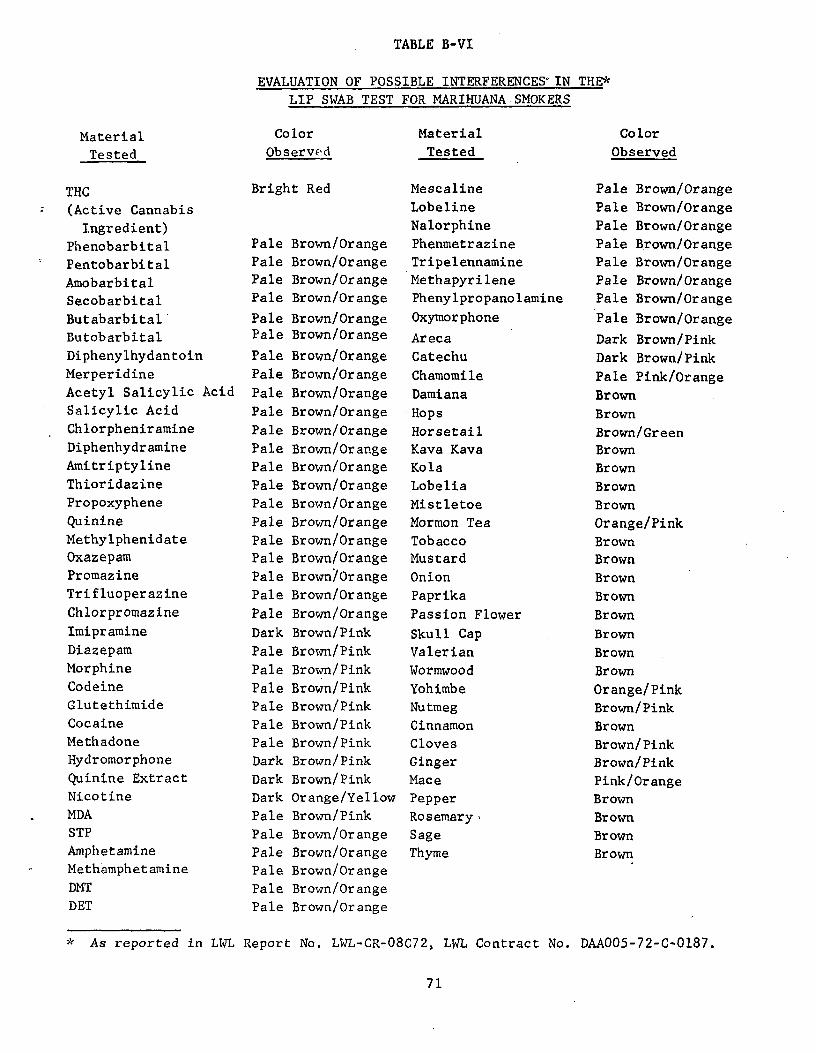
TABLE B-VI
EVALUATION OF POSSIBLE INTERFERENCES IN THE*
LIP SWAB TEST FOR MARIHUANA SMOKERS
Material Color Material Color
Tested Observed Tested Observed
THC Bright Red Mescaline Pale Brown/Orange
(Active Cannabis Lobeline Pale Brown/Orange
Ingredient) Nalorphine Pale Brown/Orange
Phenobarbital Pale Brown/Orange Phenmetrazine Pale Brown/Orange
Pentobarbital Pale Brown/Orange Tripelennamine Pale Brown/Orange
Amobarbital Pale Brown/Orange Methapyrilene Pale Brown/Orange
Secobarbital Pale Brown/Orange Phenylpropanolamine Pale Brown/Orange
Butabarbital Pale Brown/Orange Oxymorphone Pale Brown/Orange
Butobarbital Pale Brown/Orange Areca Dark Brown/Pink Diphenylhydantoin Pale Brown/Orange Catechu Dark Brown/Pink Merperidine Pale Brown/Orange Chamomile Pale Pink/Orange Acetyl Salicylic Acid Pale Brown/Orange Damiana Brown Salicylic Acid Pale Brown/Orange • Hops Brown Chlorpheniramine Pale Brown/Orange Horsetail Brown/Green Diphenhydramine Pale Brown/Orange Kava Kava Brown Amitriptyline Pale Brown/Orange Kola Brown Thioridazine Pale Brown/Orange Lobelia Brown Propoxyphene Pale Brown/Orange Mistletoe Brown Quinine Pale Brown/Orange Mormon Tea Orange/Pink Methylphenidate Pale Brown/Orange Tobacco Brown Oxazepam Pale Brown/Orange Mustard Brown Promazine Pale Brown/Orange Onion Brown Trifluoperazine Pale Brown/Orange Paprika Brown Chlorpromazine Pale Brown/Orange Passion Flower Brown Imipramine Dark Brown/Pink Skull Cap Brown Diazepam Pale Brown/Pink Valerian Brown Morphine Pale Brown/Pink Wormwood Brown Codeine Pale Brown/Pink Yohimbe Orange/Pink Glutethimide Pale Brown/Pink Nutmeg Brown/Pink Cocaine Pale Brown/Pink Cinnamon Brown Methadone Pale Brown/Pink Cloves Brown/Pink Hydromorphone Dark Brown/Pink Ginger Brown/Pink Quinine Extract Dark Brown/Pink Mace Pink/Orange Nicotine Dark Orange/Yellow Pepper Brown MDA Pale Brown/Pink Rosemary, Brown STP Pale Brown/Orange Sage Brown Amphetamine Pale Brown/Orange Thyme Brown Methamphetamine Pale Brown/Orange
DMT Pale Brown/Orange
DET Pale Brown/Orange
* As reported in LWL Report No. LWL-CR-08C72, LWL Contract No. DAA005-72-C-0187.
71

APPENDIX C
RESULTS
72
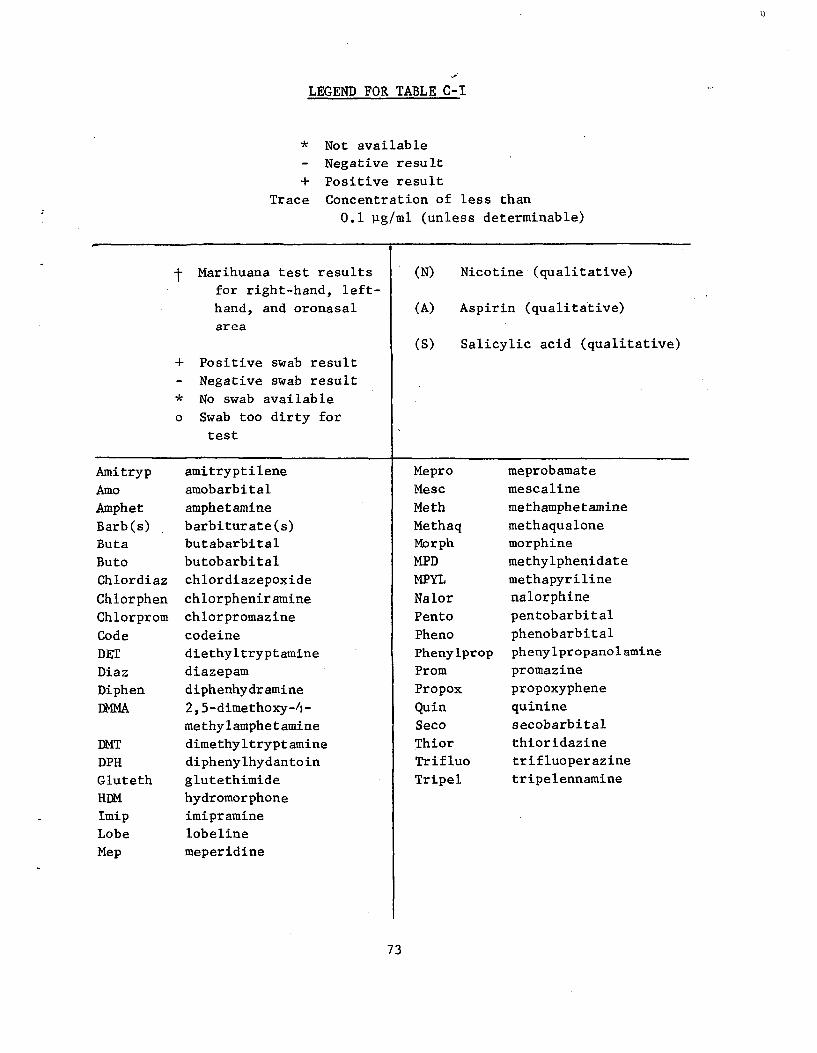
I)
LEGEND FOR TABLE C-I
* Not available
Negative result
+ Positive result Trace Concentration of less than
0.1 pg/ml (unless determinable)
t Marihuana test results (N) Nicotine (qualitative) for right-hand, left-
hand, and oronasal (A) Aspirin (qualitative) area
(S) Salicylic acid (qualitative)
+ Positive swab result
Negative swab result
* No swab available
o Swab too dirty for
test
Amitryp amitryptilene Mepro meprobamate
Amo amobarbital Mesc mescaline
Amphet amphetamine .Meth methamphetamine
Barb(s) barbiturate(s) Methaq methaqualone Buta butabarbital Morph morphine
Buto butobarbital MPD methylphenidate
Chlordiaz chlordiazepoxide MPYL methapyriline
Chlorphen chlorpheniramine Nalor nalorphine
Chlorprom chlorpromazine Pento pentobarbital
Code codeine Pheno phenobarbital
DET diethyltryptamine Phenylprop phenylpropanolamine
Diaz diazepam Prom promazine
Diphen diphenhydramine Propox propoxyphene
DMMA 2, 5-dimethoxy-fi•- Quin quinine
methylamphetamine Seco secobarbital
DMT dimethyltryptamine Thior thioridazine
DPH diphenylhydantoin Trifluo trifluoperazine
Gluteth glutethimide Tripel tripelennamine
HDM hydromorphone
Imip imipramine
Lobe lobeline
Mep meperidine
73
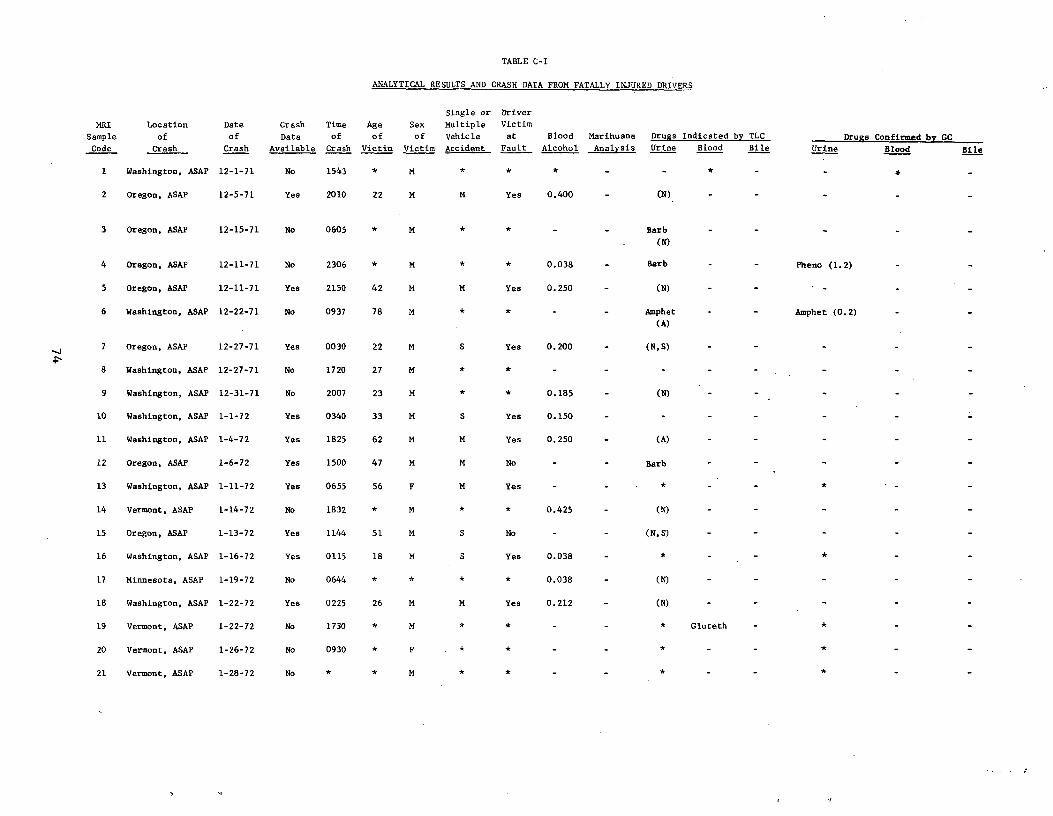
TABLE C-I
ANALYTICAL RESULTS AND CRASH DATA FROM FATALLY INJURED DRIVERS
Single or Driver
MRI Location Date Crash Time Age Sex Multiple Victim
Sample of of Data of of of Vehicle at Blood Marihuana Drugs Indicated by TLC Drugs Confirmed by GC
Code Crash Crash Available Crash Victim Victim Accident Fault Alcohol Analysis Urine Blood Bile Urine Blood Bile
I Washington, ASAP 12-1-71 No 1543 * M * * *
2 Oregon, ASAP 12-5-71 Yes 2010 22 M M Yes 0.400 - (N)
3 Oregon, ASAP 12-15-71 No 0605 * M * * - - Barb - - -
(N)
4 Oregon, ASAP 12-11-71 No 2306 * M * * 0.038 - Barb - - Pheno (1.2)
5 Oregon, ASAP 12-11-71 Yes 2150 42 M M Yes 0.250 (N)
6 Washington, ASAP 12-22-71 No 0937 78 M * * - - Amphet - - Amphet (0.2)
(A)
7 Oregon, ASAP 12-27-71 Yes 0030 22 M S Yes 0.200 (N,S)
8 Washington, ASAP 12-27-71 No 1720 27 M * * -
9 Washington, ASAP 12-31-71 No 2007 23 M * * 0.185 (N)
10 Washington, ASAP 1-1-72 Yes 0340 33 M S Yes 0.150
11 Washington, ASAP 1-4-72 Yes 1825 62 M M Yes 0.250 (A)
12 Oregon, ASAP 1-6-72 Yes 1500 47 M M No Barb
13 Washington, ASAP 1-11-72 Yes 0655 56 F M Yes
14 Vermont, ASAP 1-14-72 No 1832 * M * * 0.425 - (N)
15 Oregon, ASAP 1-13-72 Yes 1144 51 M S No - - (N,S)
16 Washington, ASAP 1-16-72 Yes 0115 18 M S Yes 0.038 - *
17 Minnesota, ASAP 1-19-72 No 0644 * * * * 0.038 - (N)
18 Washington, ASAP 1-22-72 Yes 0225 26 M M Yes 0.212 - (N)
19 Vermont, ASAP 1-22-72 No 1730 * M * * - - * Gluteth -
20 Vermont, ASAP 1-26-72 No 0930 * F * * - - * - -
21 Vermont, ASAP 1-28-72 No * * M * * - - * - -
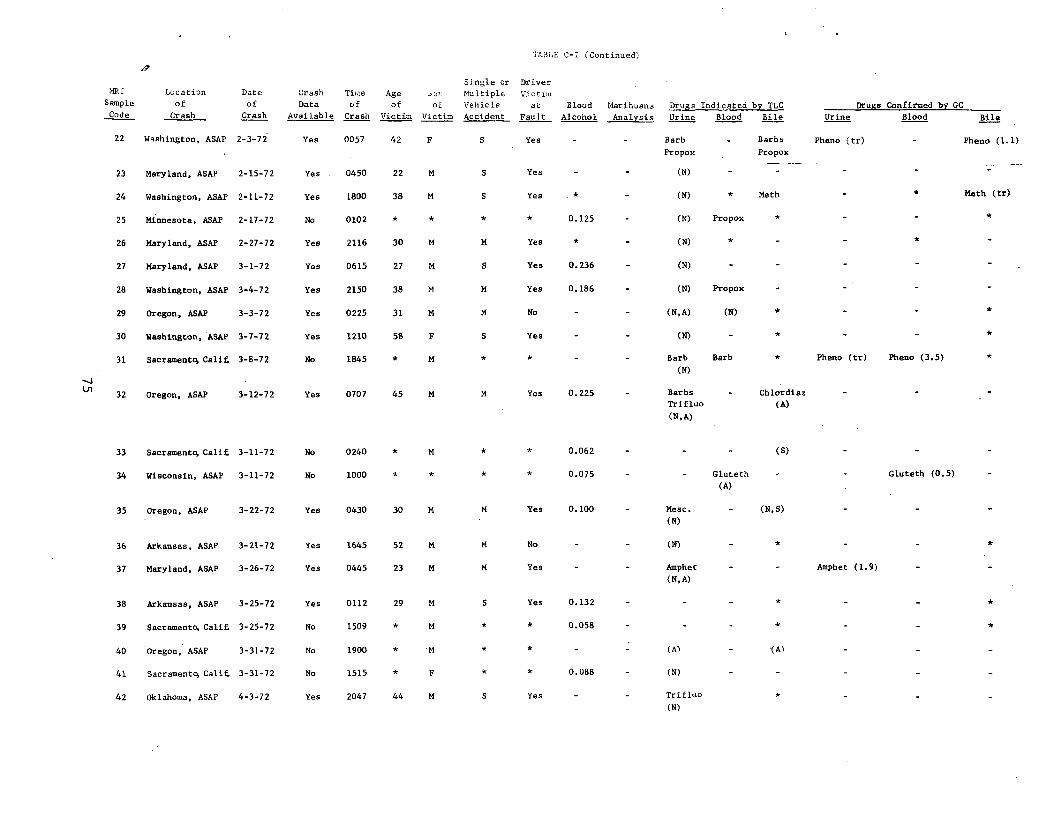
TABLE C-_ (Continued)
Single or Driver !RI Location Date Crash Time Age ^_... h.ultiple Victim
S ample
Code
of
Crash
of
Crash
Data
Available
of
Crash
of
Victim
of
Victim
Vehicle
Accident
at
Fault
Blood
Alcohol
Marihuana
Analysis
Drugs Indicated by TLC
Urine Blood Bile Urine
Drugs Confirmed by GC
Blood Bile
22 Washington, ASAP 2-3-72 Yes 0057 42 F S Yes - - Barb
Propox
- Barbs
Propox
Pheno (tr) Pheno (1.1)
23 Maryland, ASAP 2-15-72 Yes 0450 22 M S Yes (N)
24 Washington, ASAP 2-11-72 Yes 1800 38 M S Yes * (N) * Meth * Meth (tr)
25 Minnesota, ASAP 2-17-72 No 0102 * * * * 0.125 (N) Propox
26 Maryland, ASAP 2-27-72 Yes 2116 30 M M Yes (N) * -
27 Maryland, ASAP 3-1-72 Yes 0615 27 M S Yes 0.236 (N) -
28 Washington, ASAP 3-4-72 Yes 2150 38 M M Yes 0.186 (N) Propox
29 Oregon, ASAP 3-3-72 Yes 0225 31 M M No - (N, A) (N)
30
31
Washington, ASAP
Sacramentq Calif.
3-7-72
3-8-72
Yes
No
1210
1845
58
*
F
M
S
*
Yes
*
-
- -
(N)
Barb
(N)
Barb * Pheno (tr) Pheno (3.5) *
32 Oregon, ASAP 3-12-72 Yes 0707 45 M Yes 0.225 - Barbs
Trifluo
(N,A)
- Chlordiaz
(A)
33 Sacramentq Calif. 3-11-72 No 0240 * M * * 0.062 - - - (S)
34 Wisconsin, ASAP 3-11-72 No 1000 * * * * 0.075 - - Gluteth
(A)
Gluteth (0.5)
35 Oregon, ASAP 3-22-72 Yes 0430 30 M M Yes 0.100 - Mesc.
(N)
- (N,S)
36 Arkansas, ASAP 3-21-72 Yes 1645 52 M M No (N)
37 Maryland, ASAP 3-26-72 Yes 0445 23 M M Yes - - Amphet
(N, A)
- - Amphet (1.9)
38 Arkansas, ASAP 3-25-72 Yes 0112 29 M S Yes 0.132 - - - * - -
39 Sacramento .Calif. 3-25-72 No 1509 M * 0.058 - - - * - - *
40 Oregon, ASAP 3-31-72 No 1900 * M * * - - (A) (A)
41 Sacramentq Calif. 3-31-72 No 1515 * F * * 0.088 - (N)
42 Oklahoma, ASAP 4-3-72 Yes 2047 44 M S Yes - - Trifluo
.(N)
*
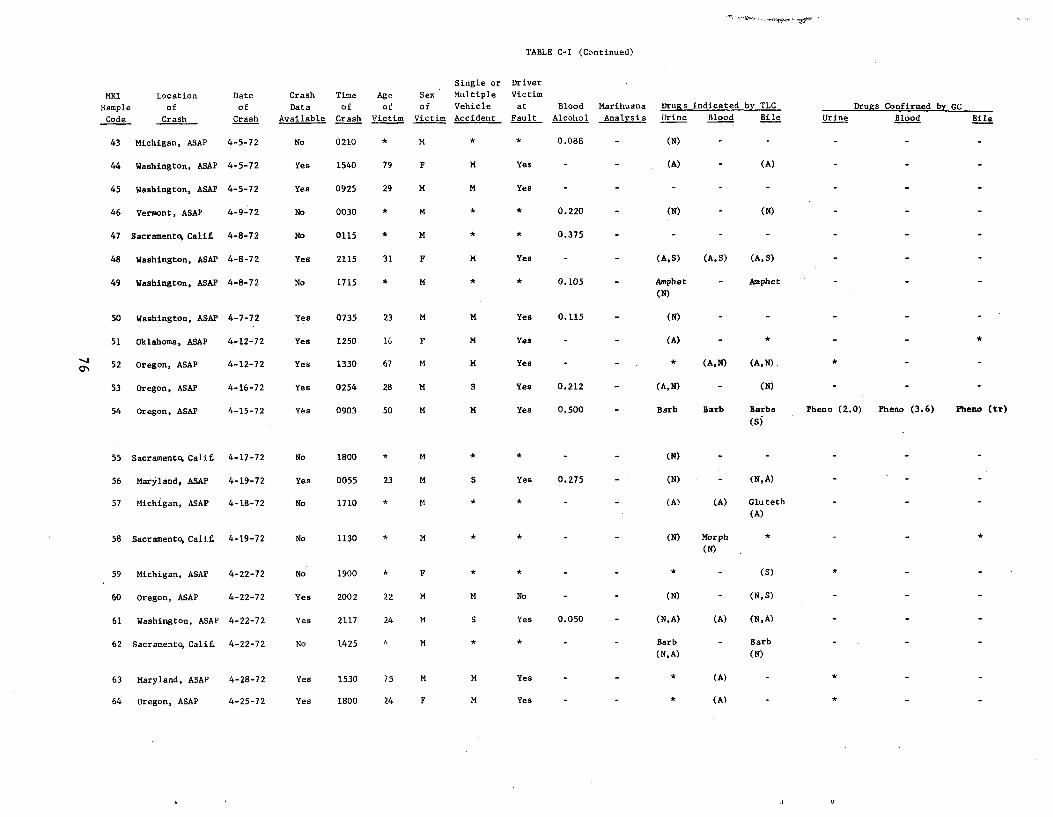
TABLE C-I (Continued)
Single or Driver
MRI Location Date Crash Time Age Sex Multiple Victim
Sample of of Data of of of Vehicle at Blood Marihuana Drugs Indicated by TLC Drugs Confirmed by GC
Code Crash Crash Available Crash Victim Victim Accident Fault Alcohol Analysis Urine Blood Bile Urine Blood Bile
43 Michigan, ASAP 4-5-72 No 0210 * M * * 0.088 (N)
44 Washington, ASAP 4-5-72 Yes 1540 79 F M Yes - - (A) - (A)
45 Washington, ASAP 4-5-72 Yes 0925 29 M M Yes
46 Vermont, ASAP 4-9-72 No 0030 * M * * 0.220 - (N) - (N)
47 Sacramentq Calif 4-8-72 No 0115 * M * * 0.375 - - - -
48 Washington, ASAP 4-8-72 Yes 2115 31 F M Yes (A,S) (A,S) (A,S)
49 Washington, ASAP 4-8-72 No 1715 * M * * 0.105 - Amphet - Amphet
(N)
50 Washington, ASAP 4-7-72 Yes 0735 23 M M Yes 0.115 - (N) - - - - -
51 Oklahoma, ASAP 4-12-72 Yes 1250 16 F M Yea - - (A) - * - -
52 Oregon, ASAP 4-12-72 Yes 1330 67 M M Yes - - * (A,N) (A,N).. * - -
53 Oregon, ASAP 4-16-72 Yes 0254 28 M S Yes 0.212 - (A,N) - (N) - - -
54 Oregon, ASAP 4-15-72 Yes 0903 50 M M Yes 0.500 - Barb Barb Barbs Pheno (2.0) Pheno (3.6) Pheno (tr)
(S)
55 Sacramentq Calif, 4-17-72 No 1800 * M (N)
56 Maryland, ASAP 4-19-72 Yes 0055 23 M S Yes 0.275 - (N) - (N,A)
57 Michigan, ASAP 4-18-72 No 1710 * M * * - - (A) (A) Gluteth
(A)
58 Sacramentq Calif 4-19-72 No 1130 * M (N) Morph
(N)
59 Michigan, ASAP 4-22-72 No 1900 F * (S)
60 Oregon, ASAP 4-22-72 Yes 2002 22 M M No - - (N) - (N,S)
61 Washington, ASAP 4-22-72 Yes 2117 24 M S Yes 0.050 - (N,A) (A) (N,A)
62 Sacramento Calif. 4-22-72 No 1425 K M Barb - Barb
(N,A) (N)
63 Maryland, ASAP 4-28-72 Yes 1530 75 M M Yes - - * (A) -
64 Oregon, ASAP 4-25-72 Yes 1800 24 F M Yes - - * (A) -
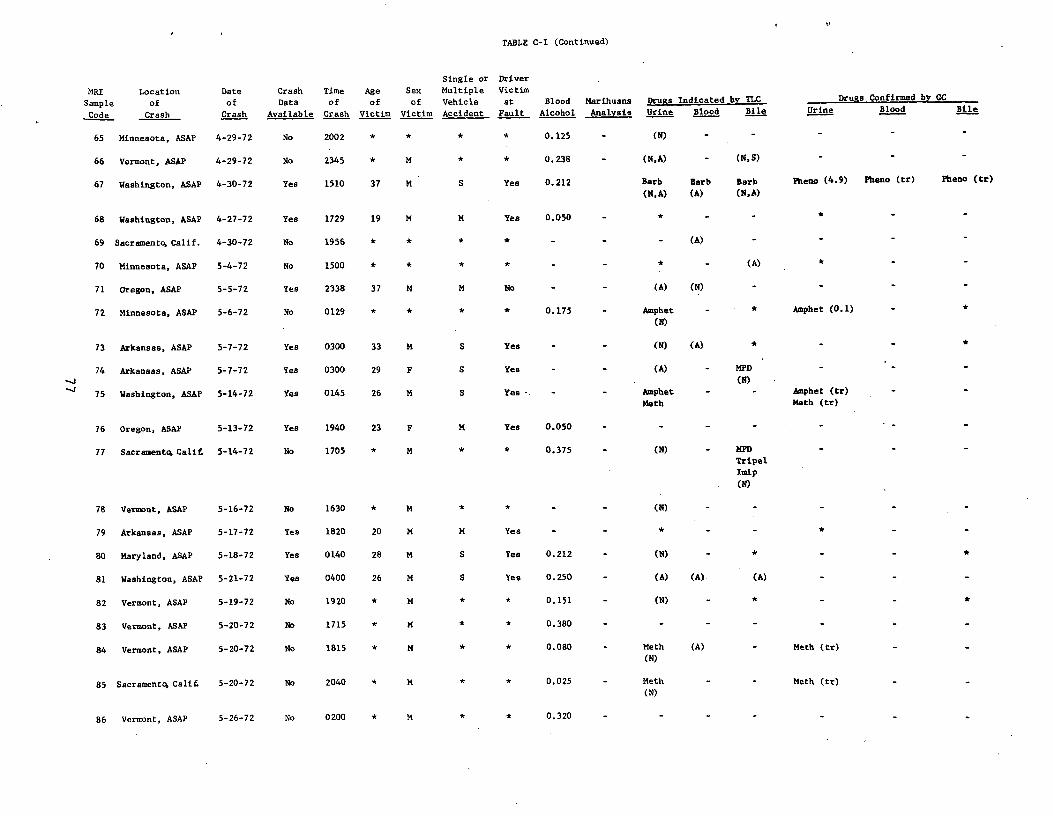
TABLE C-I (Continued)
MRI
Sample
Code
Location
of
Crash
Date
of
Crash
Crash
Data
blAvaila e
Time
fo
Crash
Age
fo
imVict
Sex
fo
iVict m
Single or
Multiple
hi lVe c e
A id tcc en _
Driver
Victim
ta
ltFau
Blood
Alcohol
Marihuana
Analysis
Drugs Indicated by TLC
Urine Blood Bile Urine
Drugs Confirmed by GC
Blood Bile
65 Minnesota, ASAP 4-29-72 No 2002 * * * * 0.125 - (N) - -
66 Vermont, ASAP 4-29-72 No 2345 * M * * 0.238 - (N,A) - (N,S) - -
67 Washington, ASAP 4-30-72 Yes 1510 37 M S Yes 0.212 Barb
(N,A)
Barb
(A)
Barb
(N,A)
Pheno (4.9) Pheno (tr) Pheno (tr)
68 Washington, ASAP 4-27-72 Yes 1729 19 M M Yes 0.050 - * - - * -
69 Sacramento Calif. 4-30-72 No 1956 (A) - -
70 Minnesota, ASAP 5-4-72 No 1500 * * (A)
71 Oregon, ASAP 5-5-72 Yes 2338 37 M M No (A) (N) - -
72 Minnesota, ASAP 5-6-72 No 0129 * * * * 0.175 Amphet
(N)
* Amphet (0.1)
73 Arkansas, ASAP 5-7-72 Yes 0300 33 M S Yes (N) (A) * - - *
74
75
Arkansas, ASAP
Washington, ASAP
5-7-72
5-14-72
Yes
Yes
0300
0145
29
26
F
M
S
S
Yes
Yes •. - -
(A)
Amphet
Meth
-
MPD
(N)
-
-
Amphet (tr)
Meth (tr)
76 Oregon, ASAP 5-13-72 Yes 1940 23 F M Yes 0.050
77 Sacramento Cali£ 5-14-72 No 1705 * M * * 0.375 (N) MPD
Tripel
Imip
(N)
78 Versant, ASAP 5-16-72 No 1630 * M * * - - (N) - - -
79 Arkansas, ASAP 5-17-72 Yes 1820 20 M M Yes - - * - -
80 Maryland, ASAP 5-18-72 Yes 0140 28 M S Yes 0.212 - (N) - * - *
81 Washington, ASAP 5-21-72 Yes 0400 26 M S Yes 0.250 - (A) (A) (A) -
82 Vermont, ASAP 5-19-72 No 1920 * M * * 0.151 - (N) - * - *
83 Vermont, ASAP 5-20-72 No 1715 * M * * 0.380 - - - - -
84 Vermont, ASAP 5-20-72 No 1815 * M * * 0.080 - Meth
(N)
(A) - Meth (tr)
85 Sacramento Ca1i£ 5-20-72 No 2040 * M * * 0.025 - Meth
(N) Meth (tr)
86 Vermont, ASAP 5-26-72 No 0200 * M * * 0.320
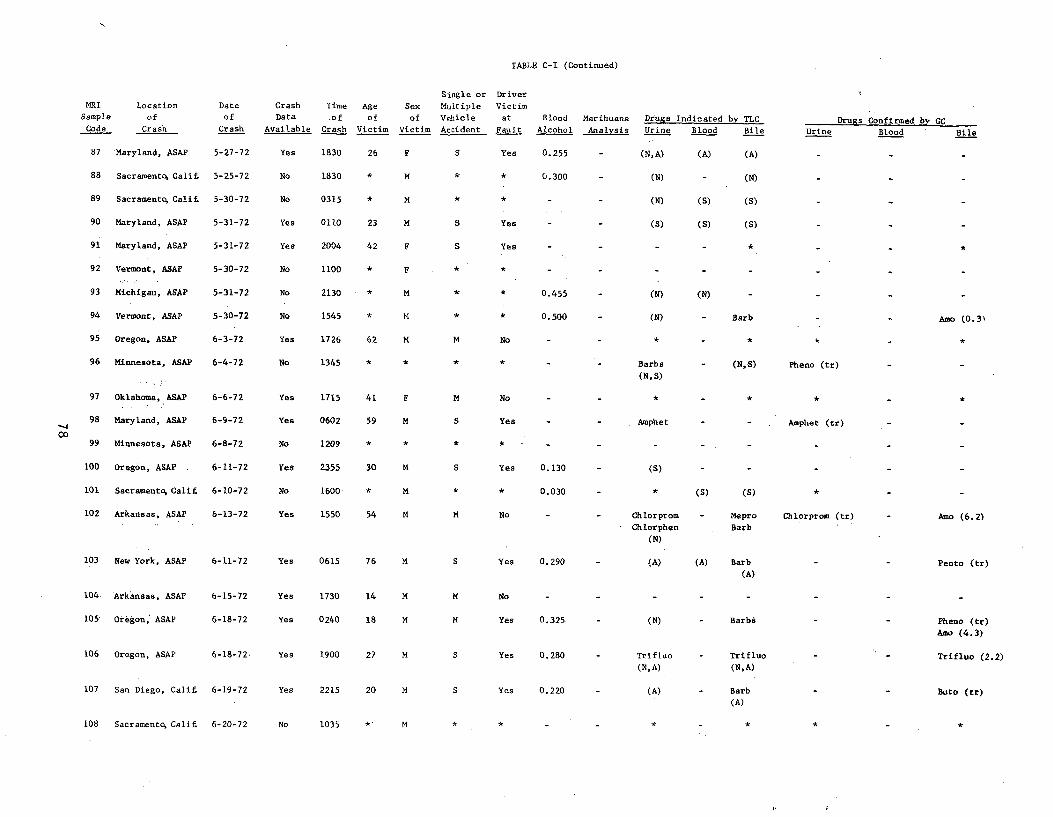
TABLE C-I (Continued)
MRI
Sample
Code
Location
of
Crash
Date
of
Crash
Crash
Data
Available
Time
of
Crash
Age
of
Victim
Sex
of
Victim
Single or
Multiple
Vehicle
Accident
Driver
Victim
at
Fault
Blood
Alcohol
Marihuana
Analysis
Drugs Indicated by TLC
Urine Blood Bile Urine Drugs Confirmed by GC
Blood Bile
87 Maryland, ASAP 5-27-72 Yes 1830 26 F S Yes 0.255 (N, A) (A) (A)
88 Sacramentq Calif 5-25-72 No 1830 * M 0.300 (N) - (N)
89 Sacramentq Cali£ 5-30-72 No 0315 * M (N) (S) (S)
90 Maryland, ASAP 5-31-72 Yes 0110 23 M S Yes - - (S) (S) (S)
91 Maryland, ASAP 5-31-72 Yes 2004 42 F S Yes *
92 Vermont, ASAP 5-30-72 No 1100 F *
93 Michigan, ASAP 5-31-72 No 2130 * M * * 0.455 - (N) (N)
94 Vermont, ASAP 5-30-72 No 1545 * t4 * * 0.500 - (N) - Barb Amo (0.3\
95 Oregon, ASAP 6-3-72 Yes 1726 62 M M No - - * - *
96 Minnesota, ASAP 6-4-72 No 1345 * * * * - Barbs
(N,S)
- (N,S) Pheno (tr)
97 Oklahoma, ASAP 6-6-72 Yes 1715 41 F M No - - * - * * - *
98 Maryland, ASAP 6-9-72 Yes 0602 59 M S Yes - - Amphet - - Amphet (tr)
99• Minnesota, ASAP 6-8-72 No 1209 * * *
100 Oregon, ASAP . 6-11-72 Yes 2355 30 M S Yes 0.130 (S)
101 Sacramentq Calif 6-10-72 No 1600 M * * 0.030 * (S) (S) *
102 Arkansas, ASAP 6-13-72 Yes 1550 54 M M No Chlorprom
Chlorphen
(N)
- Mepro
Barb
Chlorprom (tr) Amo (6.2)
103 New York, ASAP 6-11-72 Yes 0615 76 M S Yes 0.290 - (A) (A) Barb (A)
Pento (tr)
104 Arkansas, ASAP 6-15-72 Yes 1730 14 M M No
105' Oregon, ASAP 6-18-72 Yes 0240 18 M M Yes 0.325 - (N) - Barbs Pheno (tr)
Amo (4.3)
106 Oregon, ASAP 6-18-72 Yes 1900 27 M S Yes 0.280 Trifluo - Trifluo Trifluo (2.2) (N,A) (N,A)
107 San Diego, Calif. 6-19-72 Yes 2215 20 M S Yes 0.220 - (A) - Barb Buto (tr) (A)
108 Sacramento, Calif 6-20-72 No 1035 * M * *
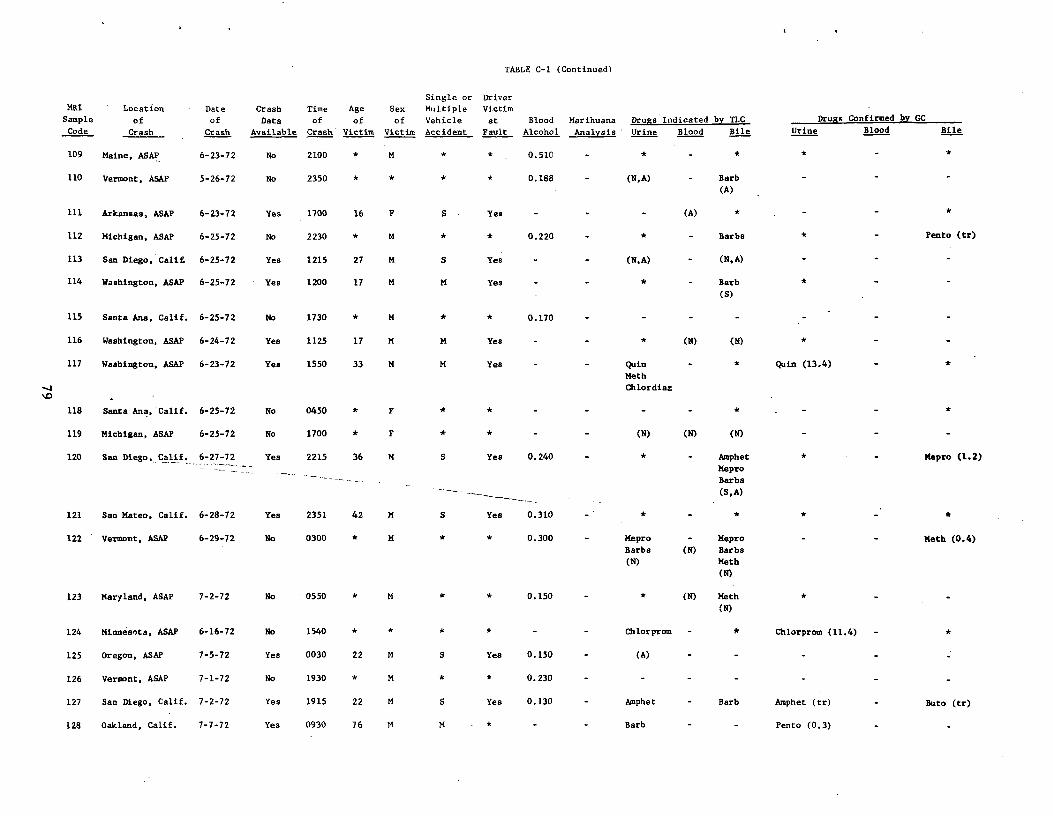
TABLE C-I (Continued)
MRI
Sample
Code
Location
of
Crash
Date
of
Crash
Crash
Data
Available
Time
of
Crash
Age
of Victim
Sex
of
Victim
Single or
Multiple
Vehicle
Accident
Driver
Victim
at Fault
Blood
Alcohol
Marihuana
Analysis
Drugs Indicated by TLC
Urine Blood Bile
Drugs Confirmed by GC
Urine Blood Bile
109 Maine, ASAP 6-23-72 No 2100 M * * 0.510 * *
110 Vermont, ASAP 5-26-72 No 2350 * * * * 0.188 (N,A) Barb
(A)
111 Arkansas, ASAP 6-23-72 Yes 1700 16 F S Yes (A) * *
112 Michigan, ASAP 6-25-72 No 2230 M * * 0.220 * Barbs * - Pento (tr)
113 San Diego, Cali£ 6-25-72 Yes 1215 27 M S Yes (N,A) (N,A)
114 Washington, ASAP 6-25-72 Yes 1200 17 M M Yes * Barb
(S)
*
115 Santa Ana, Calif. 6-25-72 No 1730 * M 0.170
116 Washington, ASAP 6-24-72 Yes 1125 17 M M Yes - - * (N) (N) *
117 Washington, ASAP 6-23-72 Yes 1550 33 M M Yes - - Quin
Meth
Chlordiaz
* Quin (13.4) *
118 Santa Ana, Calif. 6-25-72 No 0450 * F * *
119 Michigan, ASAP 6-25-72 No 1700 * F * * - - (N) (N) (N)
120 lif. 6-27-72 Yes 2215 36 M S Yes 0.240 * Amphet
Mepro
Barbs
(S,A)
* Mepro (1.2)
121 San Mateo, Calif. 6-28-72 Yes 2351 42 M S Yes 0.310 * *
122 Vermont, ASAP 6-29-72 No 0300 * M * * 0.300 - Mepro
Barbs
(N)
-
(N)
Mepro
Barbs
Meth
(N)
Meth (0.4)
123 Maryland, ASAP 7-2-72 No 0550 * M * * 0.150 - * (N) Meth
(N)
*
124 Minnesota, ASAP 6-16-72 No 1540 * * * * - Chlorprom * Chlorprom (11.4) - *
125 Oregon, ASAP 7-5-72 Yes 0030 22 M S Yea 0.150 (A)
126 Vermont, ASAP 7-1-72 No 1930 * M * * 0.230
127 San Diego, Calif. 7-2-72 Yes 1915 22 M S Yes 0.130 Amphet - Barb Amphet (tr) Buto (tr)
128 Oakland, Calif. 7-7-72 Yes 0930 76 M M * - - Barb - - Pento (0.3)
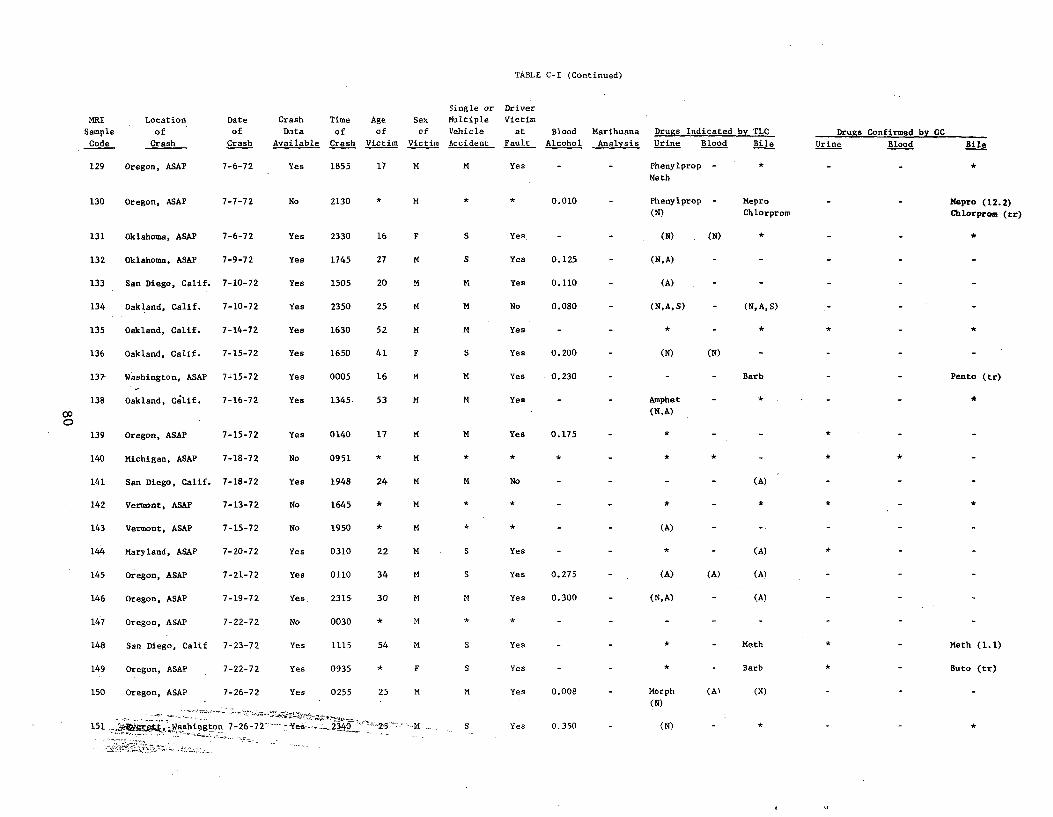
*
TABLE C-I (Continued)
MRI
Sample
Code
Location
of
Crash
Date
of
Crash
Crash
Data
Available
Time
of
Crash
Age
of
Victim
Sex
of
Victim
Single or
Multiple
Vehicle
Accident
Driver
Victim
at
Fault
Blood
Alcohol
Marihuana
Analysis
Drugs Indicated by TLC
Urine Blood Bile
Drugs Confirmed by GC
Urine Blood Bile
129 Oregon, ASAP 7-6-72 Yes 1855 17 M M Yes - Phenylprop -
Math
*
130 Oregon, ASAP 7-7-72 No 2130 * M * * 0.010 Phenylprop -
(N)
Mepro
ChlorpromMepro (12.2)
Chlorprom (tr)
131 Oklahoma, ASAP 7-6-72 Yes 2330 16 F S Yes. - (N) (N) *
132 Oklahoma, ASAP 7-9-72 Yes 1745 27 M S Yes 0.125 (N,A)
133 San Diego, Calif. 7-10-72 Yes 1505 20 M M Yes 0.110 (A)
134 Oakland, Calif. 7-10-72 Yes 2350 25 M M No 0.080 (N,A,S) (N,A,S)
135 Oakland, Calif. 7-14-72 Yes 1630 52 M M Yes * * * *
136 Oakland, Calif. 7-15-72 Yes 1650 41 F S Yes 0.200 (N) (N)
137- Washington, ASAP 7-15-72 Yes 0005 16 M M Yes 0.230 Barb Pento (tr)
138 Oakland, Calif. 7-16-72 Yes 1345 53 M M Yes Amphet
(N,A)
* *
139 Oregon, ASAP 7-15-72 Yes 0140 17 M M Yes 0.175 *
140 Michigan, ASAP 7-18-72 No 0951 * M * * * * * * *
141 San Diego, Calif. 7-18-72 Yes 1948 24 M M No (A)
142 Vermont, ASAP 7-13-72 No 1645 * M * * * * *
143 Vermont, ASAP 7-15-72 No 1950 * M (A)
144 Maryland, ASAP 7-20-72 Yes 0310 22 M S Yes * - (A)
145 Oregon, ASAP 7-21-72 Yes 0110 34 M S Yes 0.275 (A) (A) (A)
146 Oregon, ASAP 7-19-72 Yes. 2315 30 M M Yes 0.300 (N,A) (A)
147 Oregon, ASAP 7-22-72 No 0030 * M
148 San Diego, Calif 7-23-72 Yes 1115 54 S Yes Meth * Meth (1.1)
149 Oregon, ASAP 7-22-72 Yes 0935 F S Yes Barb Buto (tr)
150 Oregon, ASAP 7-26-72 Yes 0255 25 M Yes 0.008 Morph (A)
(N)
(N)
151 ..<;aer€fi,. Washington 7-26-72 -Yes--•- 2340 ' "'' S Yes 0.350 (N) *
*
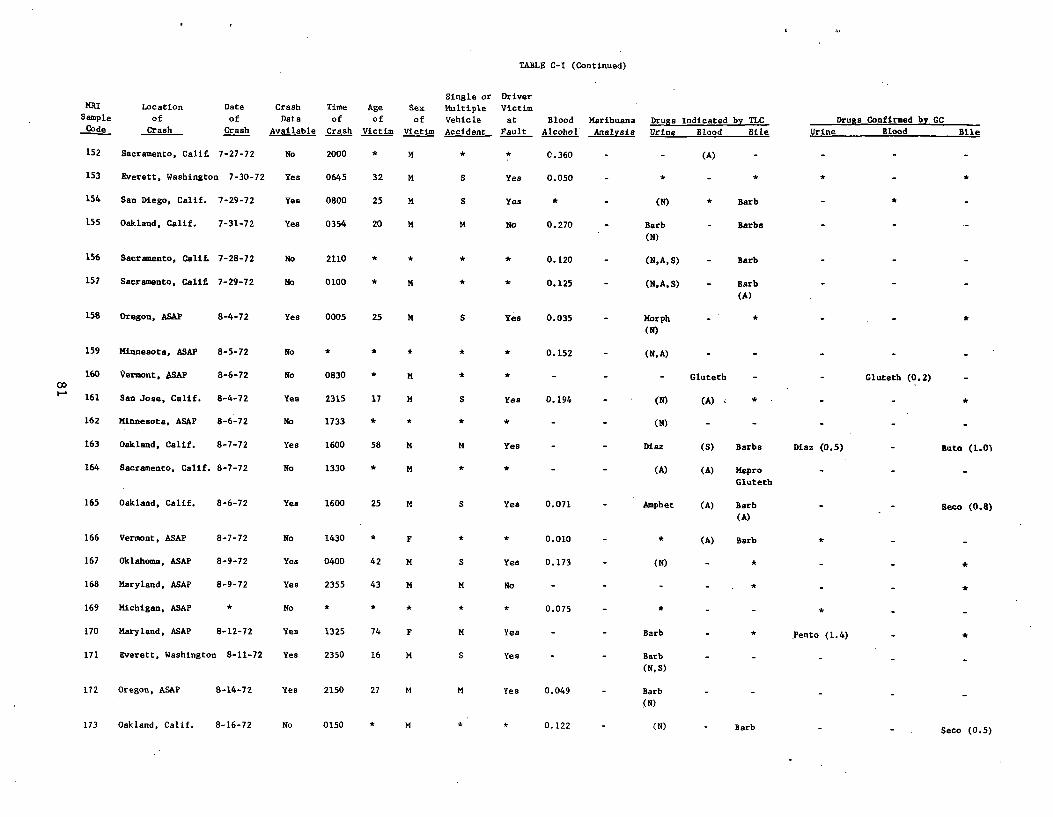
TABLE C-I (Continued)
MRI
Sample
Code
Location
of
Crash
Date
of
Crash
Crash
Data
Available
Time
of
Crash
Age
of
Victim
Sex
of
Victim
Single or
Multiple
Vehicle
Accident
Driver
Victim
at
Fault
Blood
Alcohol
Marihuana
Analysis
Drugs Indicated by TLC
Urine Blood Bile
Drugs Confirmed by CC
Urine Blood Bile
152 Sacramento, Calif. 7-27-72 No 2000 * M * * C.360 - - (A) - - - -
153 Everett, Washington 7-30-72 Yes 0645 32 M S Yes 0.050 - * - * * -
154 San Diego, Calif. 7-29-72 Yes 0800 25 M S Yes * - (N) * Barb
155 Oakland, Calif. 7-31-72 Yea 0354 20 M M No 0.270 - Barb
(N)
- Barbs
156 Sacramento, Calif. 7-28-72 No 2110 * * * * 0.120 - (N,A,S) - Barb
157 Sacramento, Calif, 7-29-72 No 0100 * M * * 0.125 - (N,A,S) - Barb
(A)
158 Oregon, ASAP 8-4-72 Yes 0005 25 M S Yea 0.035 - Morph
(N)
- * - -
159 Minnesota, ASAP 8-5-72 No * * * * * 0.152 (N, A)
160 Vermont, .SAP 8-6-72 No 0830 * M * * - - - Gluteth - - Gluteth (0.2) -
161 San Jose, Calif. 8-4-72 Yes 2315 17 14 S Yes 0.194 - (N) (A) < * - - *
162 Minnesota, ASAP 8-6-72 No 1733 * * * * (N)
163 Oakland, Calif. 8-7-72 Yes 1600 58 M M Yes Diaz (S) Barbs Diaz (0.5) Buto (1.0)
164 Sacramento, Calif. 8-7-72 No 1330 * M * * - (A) (A) Mepro
Gluteth
165 Oakland, Calif. 8-6-72 Yes 1600 25 M S Yes 0.071 - Amphet (A) Barb
(A) Seco (0.8)
166 Vermont, ASAP 8-7-72 No 1430 * F * * 0.010 - (A) Barb *
167 Oklahoma, ASAP 8-9-72 Yes 0400 42 M S Yes 0.173 - (N) - * - *
168 Maryland, ASAP 8-9-72 Yea 2355 43 M M No - - - - * - *
169 Michigan, ASAP * No * * * * * 0.075 - * - -
170 Maryland, ASAP 8-12-72 Yes 1325 74 F M Yes - - Barb - * Pento (1.4) *
171 Everett, Washington 8-11-72 Yea 2350 16 M S Yes Barb
(N,S)
172 Oregon, ASAP 8-14-72 Yes 2150 27 M M Yes 0.049 - Barb
(N)
173 Oakland, Calif. 8-16-72 No 0150 * M * * 0.122 (N) Barb Seco (0.5)
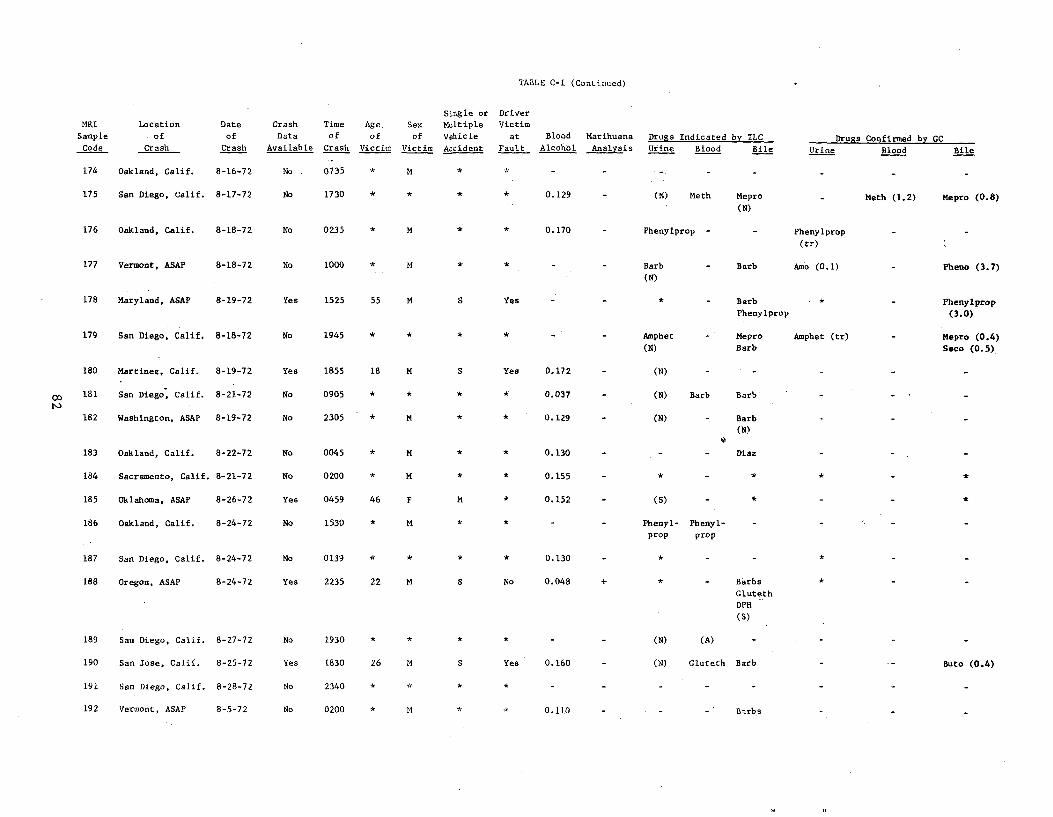
TABLE C-I (Continued)
MRI
Sample
Code
Location
. of
Crash
Date
of
Crash
Crash
Data
Available
Time
of
Crash
Age.
of
Victim
Sex
of
Victim
Single or
Multiple
Vehicle
Accident
Driver
Victim
at
Fault
Blood
Alcohol
Marihuana
Analysis Drugs Indicated by TLC
Urine Blood Bile Drugs Confirmed by GC
Urine Blood Bile
174 Oakland, Calif. 8-16-72 No . 0735 * M
175 San Diego, Calif. 8-17-72 No 1730 * * * * 0.129 (N) Meth Mepro
(N) Meth (1.2) Mepro (0.8)
176 Oakland, Calif. 8-18-72 No 0235 * M 0.170 - Phenylprop - Phenylprop
(tr)
177 Vermont, ASAP 8-18-72 No 1000 * M * Barb
(N)
- Barb Amo (0.1) - Pheno (3.7)
178 Maryland, ASAP 8-19-72 Yes 1525 55 M S Yes * Barb
Phenylprop
* - Phenylprop
(3.0)
179 San Diego, Calif. 8-18-72 No 1945 * * Amphet
(N)
- Mepro
Barb
Amphet (tr) - Mepro (0.4)
Seco (0.5)
180 Martinez, Calif. 8-19-72 Yes 1855 18 M S Yes 0.172 - (N) - -
181 San Diego, Calif. 8-21-72 No 0905 * * * *` 0.037 - (N) Barb Barb
182 Washington, ASAP 8-19-72 No 2305 * M * * 0.129 - (N) Barb
(N)
183 Oakland, Calif. 8-22-72 No 0045 * M * * 0.130 - - - Diaz
184 Sacramento, Calif. 8-21-72 No 0200 * M * 0.155
185 Oklahoma, ASAP 8-26-72 Yes 0459 46 F M * 0.152 (S) * *
186 Oakland, Calif. 8-24-72 No 1530 * M Phenyl-
prop
Phenyl-
prop
187 San Diego, Calif. 8-24-72 No 0139 * * * * 0.130 *
188 Oregon, ASAP 8-24-72 Yes 2235 22 M S No 0.048 + * - Barbs
Gluteth
DPH
(S)
189 San Diego, Calif. 8-27-72 No 1930 * * * * - - (N) (A)
190 San Jose, Calif. 8-25-72 Yes 1830 26 M S Yes 0.160 (N) Gluteth Barb Buto (0.4)
191 San Diego, Calif. 8-28-72 No 2340 * * * * -
192 Vermont, ASAP 8-5-72 No 0200 * M * * 0.110 - - Barbs
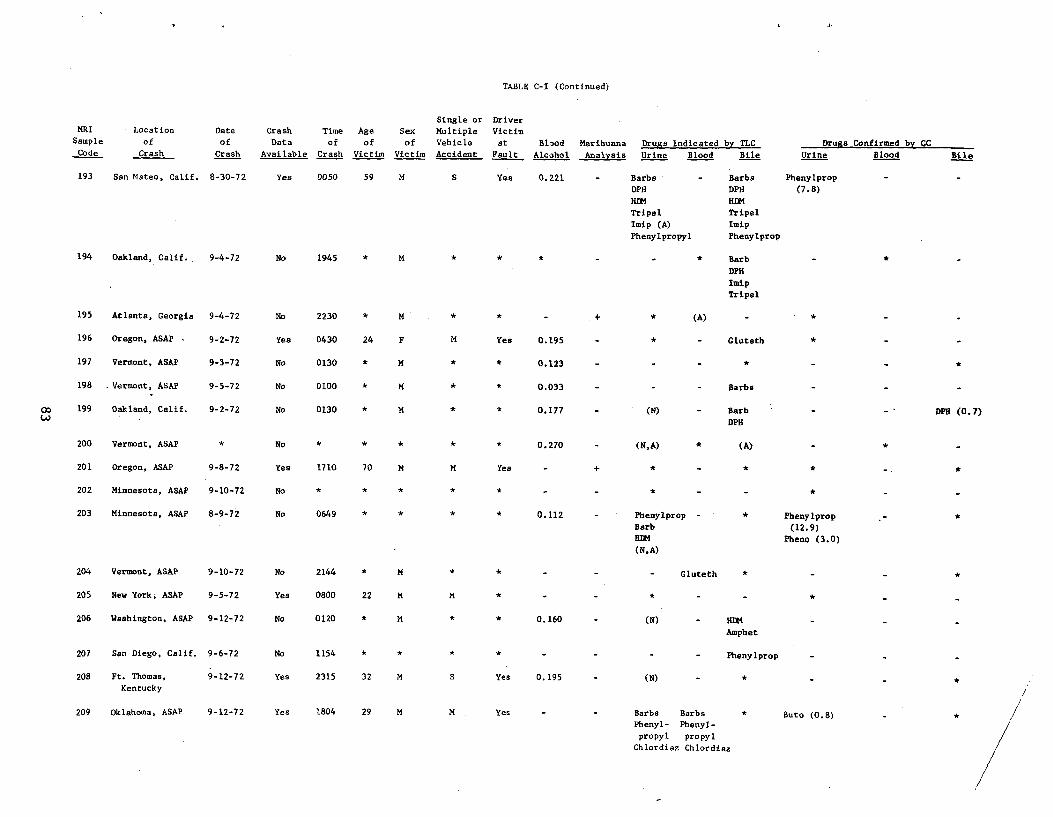
TABLE C-I (Continued)
Single or Driver MRI Location Date Crash Time Age Sex Multiple Victim
Sample of of Data of of of Vehicle at Blood Marihuana Drugs Indicated by TLC Drugs Confirmed by GC Code Crash Crash Available Crash Victim Victim Accident Fault Alcohol Analysis Urine Blood Bile Urine Blood Bile
193 San Mateo, Calif. 8-30-72 Yes 0050 59 M S Yea 0.221 - Barbs - Barbs Phenylprop
DPH DPH (7.8)
HIM HDM
Tripel Tripel
Imip (A) Imip
Phenylpropyl Phenylprop
194 Oakland, Calif., 9-4-72 No 1945 * M * * * - - * Barb
DPH
Imip
Tripel
195 Atlanta, Georgia 9-4-72 No 2230 * M * * - + * (A) *
196 Oregon, ASAP 9-2-72 Yes 0430 24 F M Yes 0.195 * Gluteth *
197 Vermont, ASAP 9-3-72 No 0130 * M * * 0.123 * *
198 -Vermont, ASAP 9-5-72 No 0100 * M * * 0.033 Barbs
199 Oakland, Calif. 9-2-72 No 0130 * M * * 0.177 (N) Barb DPH (0.7) DPH
200 Vermont, ASAP * No * * 0.270 - (N,A) * (A) *
201 Oregon, ASAP 9-8-72 Yes 1710 70 M M Yes - + * - * *
202 Minnesota, ASAP 9-10-72 No
203 Minnesota, ASAP 8-9-72 No 0649 * * 0.112 - Phenylprop * Phenylprop Barb (12.9) BIM Pheno (3.0) (N,A)
204 Vermont, ASAP 9-10-72 No 2144 * M * Gluteth * *
205 New York, ASAP 9-5-72 Yes 0800 22 M M * - - * *
206 Washington, ASAP 9-12-72 No 0120 * M * * 0.160 - (N) - HDM
Amphet
207 San Diego, Calif. 9-6-72 No 1154 * * * * Phenylprop
208 Ft. Thomas, 9-12-72 Yes 2315 32 M S Yes 0.195 - (N) -Kentucky
209 Oklahoma, ASAP 9-12-72 Yes 1804 29 M M Yes - - Barbs Barbs * Buto (0.8) - * Phenyl- Phenyl-
propyl propyl Chlordiaz Chlordiaz
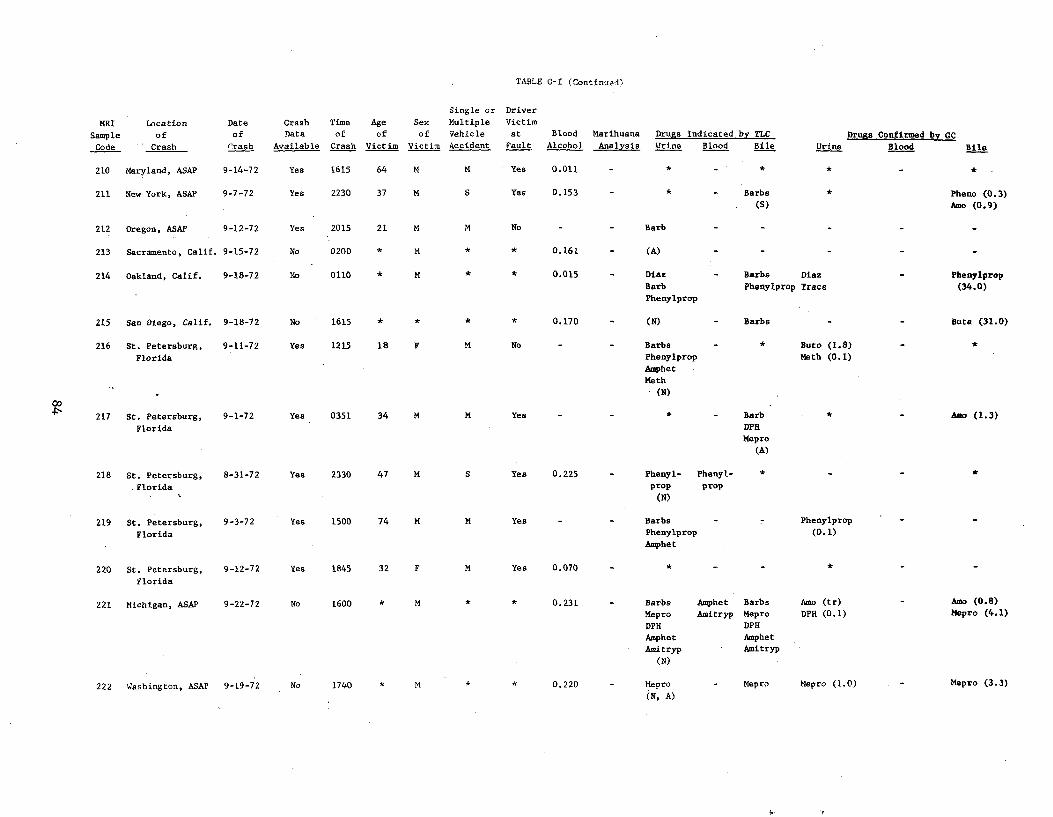
TABLE C-I (Continued)
MRI
Sample
Code
Location
of
Crash
Date
of
Crash
Crash Data
Available
Time
of
Crash
Age
of
Victim
Sex
of
Victim
Single or
Multiple
Vehicle
Accident
Driver
Victim
at
Fault
Blood
Alcohol
Marihuana
Analysis
Drugs Indicated by TLC
Urine Blood Bile Urine
Drugs Confirmed by GC
Blood Bile
210 Maryland, ASAP 9-14-72 Yes 1615 64 M M Yes 0.011 *
211 New York, ASAP 9-7-72 Yes 2230 37 M S Yes 0.153 * Barbs
(S)
* Pheno (0.3)
Amo (0.9)
212 Oregon, ASAP 9-12-72 Yes 2015 21 M M No Barb
213 Sacramento, Calif. 9-15-72 No 0200 * M * * 0.161 - (A)
214 Oakland, Calif. 9-18-72 No 0110 * M * * 0.015 - Diaz
Barb
Phenylprop
- Barbs Diaz
Phenylprop Trace
- Phenylprop
(34.0)
215 San Diego, Calif. 9-18-72 No 1615 * * * 0.170 - (N) - Barbs Buts (31.0)
216 St. Petersburg,
Florida
9-11-72 Yes 1215 18 F M No - - Barbs
Phenylprop
Amphet
Math
(N)
* Buto (1.8)
Meth (0.1)
*
217 St. Petersburg,
Florida
9-1-72 Yes 0351 34 M M Yes * Barb
DPH
Mepro
(A)
* - Amo (1.3)
218 St. Petersburg,
Florida
8-31-72 Yes 2330 47 M S Yes 0.225 - Phenyl-
prop
(N)
Phenyl-
prop
*
219 St. Petersburg,
Florida
9-3-72 Yes 1500 74 M M Yes - - Barbs
Phenylprop
Amphet
- - Phenylprop
(0.1)
220 St. Petersburg,
Florida
9-12-72 Yes 1845 32 F M Yes 0.070 *
221 Michigan, ASAP 9-22-72 No 1600 * M * * 0.231 - Barbs
Mepro
DPH
Amphet
Amitryp
(N)
Amphet
Amitryp
Barbs
Mepro
DPH
Amphet
Amitryp
Amo (tr)
DPH (0.1)
- Amo (0.8)
Mepro (4.1)
222 Washington, ASAP 9-19-72 No 1740 * M * * 0.220 - Mepro
(N, A)
- Mepro Mepro (1.0) Mepro (3.3)
t.
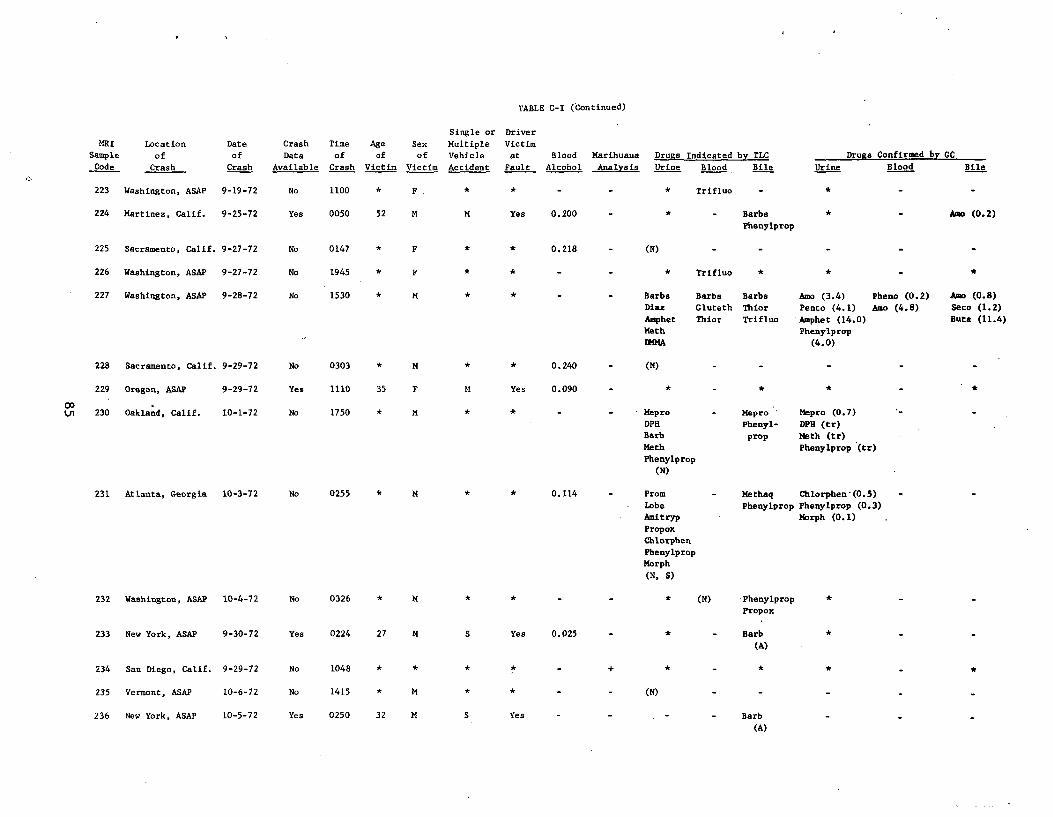
TABLE C-I (Continued)
Single or Driver
MRI Location Date Crash Time Age Sex Multiple Victim
Sample of of Data of of of Vehicle at Blood Marihuana Drugs Indicated by TLC Drugs Confirmed by GC
Code Crash Crash Available Crash Victim Victim Accident Fault Alcohol Analysis Urine Blood Bile Urine Blood Bile
11
223 Washington, ASAP 9-19-72 No 1100 * Trifluo *F .
224 Martinez, Calif. 9-25-72 Yes 0050 52 M M Yes 0.200 - * - Barbs * - Aao (0.2)
Phenylprop
225 Sacramento, Calif. 9-27-72 No 0147 (N)* F * * 0.218
226 Washington, ASAP 9-27-72 No 1945 * F * * - - * Trifluo * * -
227 Washington, ASAP 9-28-72 No 1530 * M Barbs Barbs Barbs Amo (3.4) Pheno (0.2) Ano (0.8)
Diaz Gluteth Thior Pento (4.1) Amo (4.8) Seco (1.2)
Amphet Thior Trifluo 'Amphet (14.0) Buta (11.4)
Math Phenylprop
DMMA (4.0)
228 Sacramento, Calif. 9-29-72 No 0303 * M * * 0.240 (N)
229 Oregon, ASAP 9-29-72 Yes 1110 35 F M Yes 0.090
00 Ln 230 Oakland, Calif. 10-1-72 No 1750 * M Mepro - Mepro ' Mepro (0.7)
DPH Phenyl- DPH (tr) Barb prop Meth (tr)
Math Phenylprop (tr)
Phenylprop
(N)
231 Atlanta, Georgia 10-3-72 No 0255 * M * 0.114 Prom - Methaq Chlorphen-(0.5)
Lobe Phenylprop Phenylprop (0.3)
Amitryp Morph (0.1)
Propox
Chlorphen
Phenylprop
Morph
(N, S)
232 Washington, ASAP 10-4-72 No 0326 * M * * (N) Phenylprop
Propox
233 New York, ASAP 9-30-72 Yes 0224 27 M S Yes 0.025 * - Barb
(A)
234 San Diego, Calif. 9-29-72 No 1048 * * * *
235 Vermont, ASAP 10-6-72 No 1415 * M * * - - (N)
236 New York, ASAP 10-5-72 Yes 0250 32 M S Yes Barb
(A)
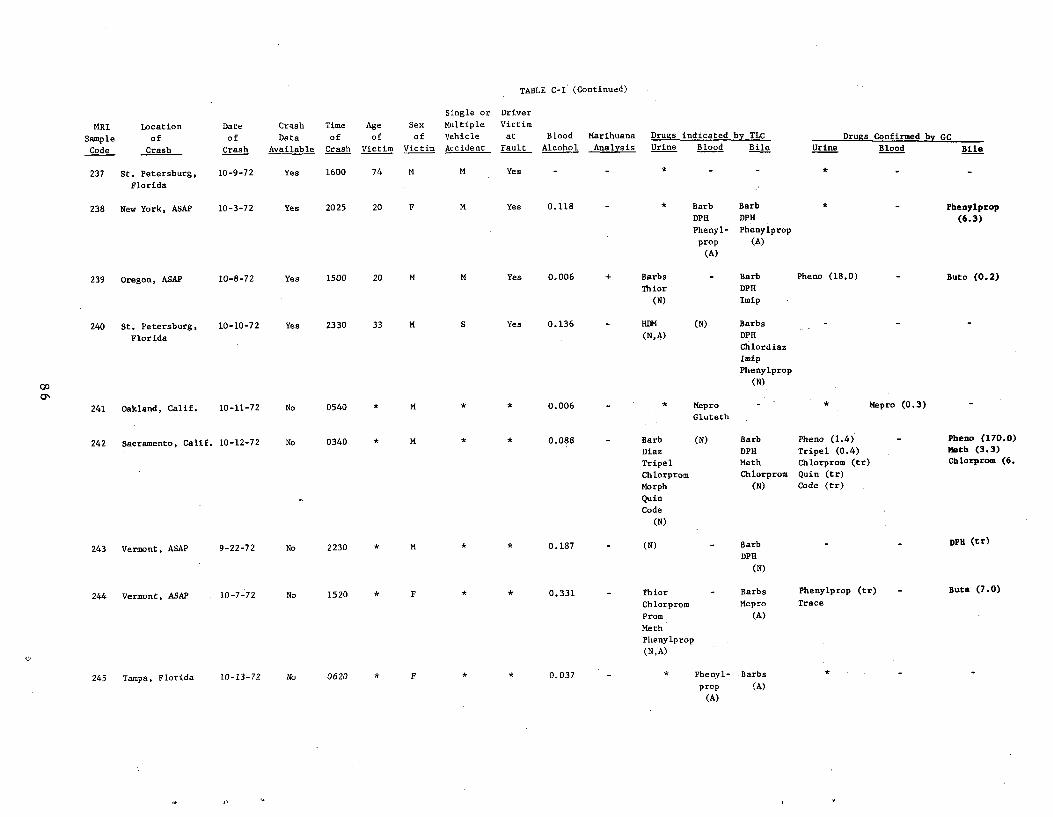
TABLE C-I (Continued)
MRI
Sample
Code
Location
of
Crash
Date
of
Crash
Crash
Data
Available
Time
of
Crash
Age
of
Victim
Sex
of
Victim
Single or
Multiple
Vehicle
Accident
Driver
Victim
at
Fault
Blood
Alcohol
Marihuana
Analysis
Drugs indicated by TLC
Urine Blood Bile Urine
Drugs Confirmed by GC
Blood Bile
237 St. Petersburg,
Florida
10-9-72 Yes 1600 74 M M Yes - - * - - * - -
238 New York, ASAP 10-3-72 Yes 2025 20 F M Yea 0.118 * Barb
DPH
Phenyl-
prop
(A)
Barb
DPH
Phenylprop
(A)
* Phenylprop
(6.3)
39 regon, ASAP 0-8-72 es 500 0 M M es .006 + Barbs
Thior
(N)
- Barb
DPH
Imip
Pheno (18.0) uto (0.2)
0
240 St. Petersburg,
Florida
10-10-72 Yes 2330 33 M S Yes 0.136 HDM
(N,A)
(N) Barbs
DPH
Chlordiaz
Imip
Phenylprop
(N)
241 Oakland, Calif. 10-11-72 No 0540 * M * * 0.006 - * Mepro
Gluteth
- * Mepro (0.3)
242 Sacramento, Calif. 10-12-72 No 0340 * M. * * 0.088 - Barb
Diaz
(N) Barb
DPH
Pheno (1.4)
Tripel (0.4)
- Pheno (170.0)
Meth (3.3)
Tripel Math Chlorprom (tr) Chlorprom (6.
Chlorprom Chlorprom Quin (tr)
Morph (N) Code (tr) -
Quin
Code
(N)
243 Vermont, ASAP 9-22-72 No 2230 * M * * 0.187 (N) Barb DPH (tr)
DPH
(N)
244 Vermont, ASAP . 10-7-72 No 1520 * F * * 0.331 - Thior
Chlorprom
- Barbs
Mepro
Phenylprop (tr)
Trace
- Buta (7.0)
Prom (A)
Meth
Phenylprop
(N,A)
245 Tampa, Florida 10-13-72 No 0620 * F * * 0,037 - * Phenyl- Barbs
prop (A)
(A)
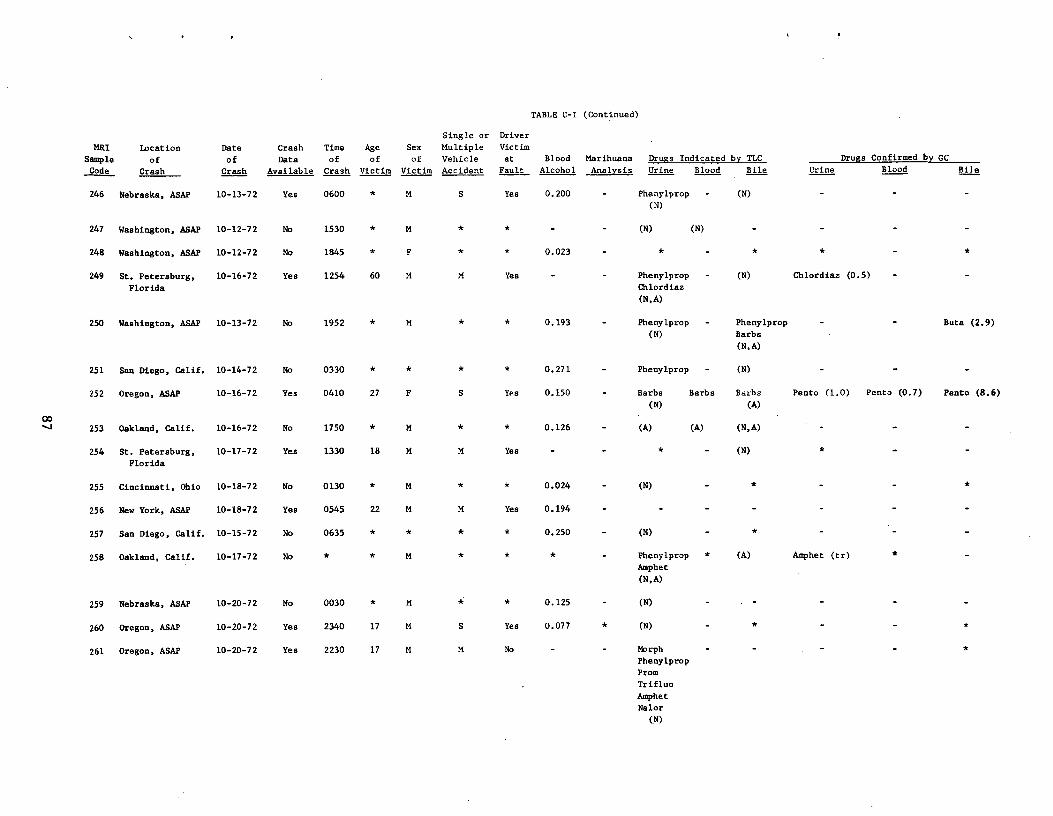
TABLE C-I (Continued)
Single or Driver
MRI Location Date Crash Time Age Sex Multiple Victim
Sample of of Data of of of Vehicle at Blood Marihuana Drugs Indicated by TLC Drugs Confirmed by GC
Code Crash Crash Available Crash Victim Victim Accident Fault Alcohol Analysis Urine Blood Bile Urine Blood Bile
246 Nebraska, ASAP 10-13-72 Yes 0600 * M S Yes 0.200 - Phenylprop
(N)
- (N)
247 Washington, ASAP 10-12-72 No 1530 * M * * - - (N) (N)
248 Washington, ASAP 10-12-72 No 1845 * F * * 0.023 - * -
249 St. Petersburg,
Florida
10-16-72 Yes 1254 60 M M Yes - - Phenylprop
Chlordiaz
(N,A)
- (N) Chlordiaz (0.5)
250 Washington, ASAP 10-13-72 No 1952 * M * * 0.193 - Phenylprop
(N)
- Phenylprop
Barbs
(N, A)
Buta (2.9)
251 San Diego, Calif. 10-14-72 No 0330 * * * * 0.271 - Phenylprop - (N)
252 Oregon, ASAP 10-16-72 Yes 0410 27 F S Yes 0.150 - Barbs
(N)
Barbs Barbs
(A)
Pento (1.0) Pento (0.7) Pento (8.6)
253 Oakland, Calif. 10-16-72 No 1750 * M * * 0.126 - (A) (A) (N,A)
254 St. Petersburg,
Florida
10-17-72 Yes 1330 18 M M Yes - - * - (N)
255 Cincinnati, Ohio 10-18-72 No 0130 * M * * 0.024 - (N) - * - *
256 New York, ASAP 10-18-72 Yes 0545 22 M M Yes 0.194 - - - - -
257 San Diego, Calif. 10-15-72 No 0635 * * * * 0.250 - (N) - * -
258 Oakland, Calif. 10-17-72 No * * M * * * - Phenylprop
Amphet
(N, A)
* (A) Amphet (tr) *
259 Nebraska, ASAP 10-20-72 No 0030 * M * * 0.125 - (N)
260 Oregon, ASAP 10-20-72 Yes 2340 17 M S Yes 0.077 * (N) *
261 Oregon, ASAP 10-20-72 Yes 2230 17 M M No - - Morph
Phenylprop
Prom
Trifluo
Amphet
Nalor
(N)
*
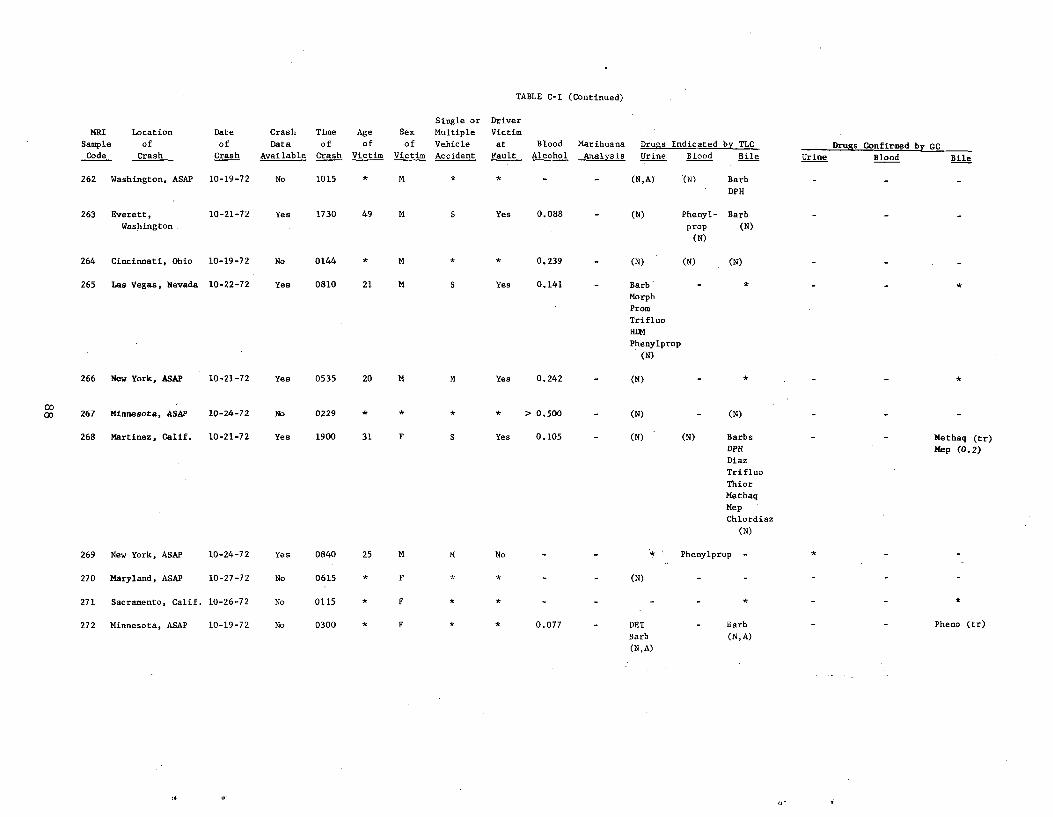
TABLE C-I (Continued)
MRI
Sample
Code
Location
of
Crash
Date
of •
Crash
Crash
Data
Available
Time
of
Crash
Age
of
Victim
Sex
of
Victim
Single or
Multiple
Vehicle
Accident
Driver
Victim
at
Fault
Blood
Alcohol
Marihuana
Analysis
Drugs Indicated by TLC
Urine Blood Bile Urine Drugs Confirmed by GC
Blood Bile
262 Washington, ASAP 10-19-72 No 1015 * M * * - - (N,A) (N) Barb
DPH
263 Everett,
Washington.
10-21-72 Yes 1730 49 M S Yes 0.088 - (N) Phenyl-
prop
(N)
Barb
(N)
264 Cincinnati, Ohio 10-19-72 No 0144 * M * * 0.239 - (N) (N) (N)
265 Las Vegas, Nevada 10-22-72 Yes 0810 21 M S Yes 0.141 - Barb-
Morph
Prom
Trifluo
HEM
Phenylprop(N)
66 ew York, ASAP 0-21-72 es 535 0 M M es 0.242 (N)
00 00 267 Minnesota, ASAP 10-24-72 No 0229 > 0.500 - (N) (N)
268 Martinez, Calif. 10-21-72 Yes 1900 31 F S Yes 0.105 - (N) (N) Barbs
DPH
Diaz
Trifluo
Thior
Methaq
Mep
Chlordiaz
(N)
- - Methaq (tr)
Mep (0.2)
269 New York, ASAP 10-24-72 Yes 0840 25 M No - - * Phenylprop - *
270 Maryland, ASAP 10-27-72 No 0615 * F (N)
271 Sacramento, Calif. 10-26-72 No 0115 * F * * - - - - * - -
272 Minnesota, ASAP 10-19-72 No 0300 * F * * 0.077 - DET
Barb
(N,A)
- Barb
(N,A)
Pheno (tr)
u'
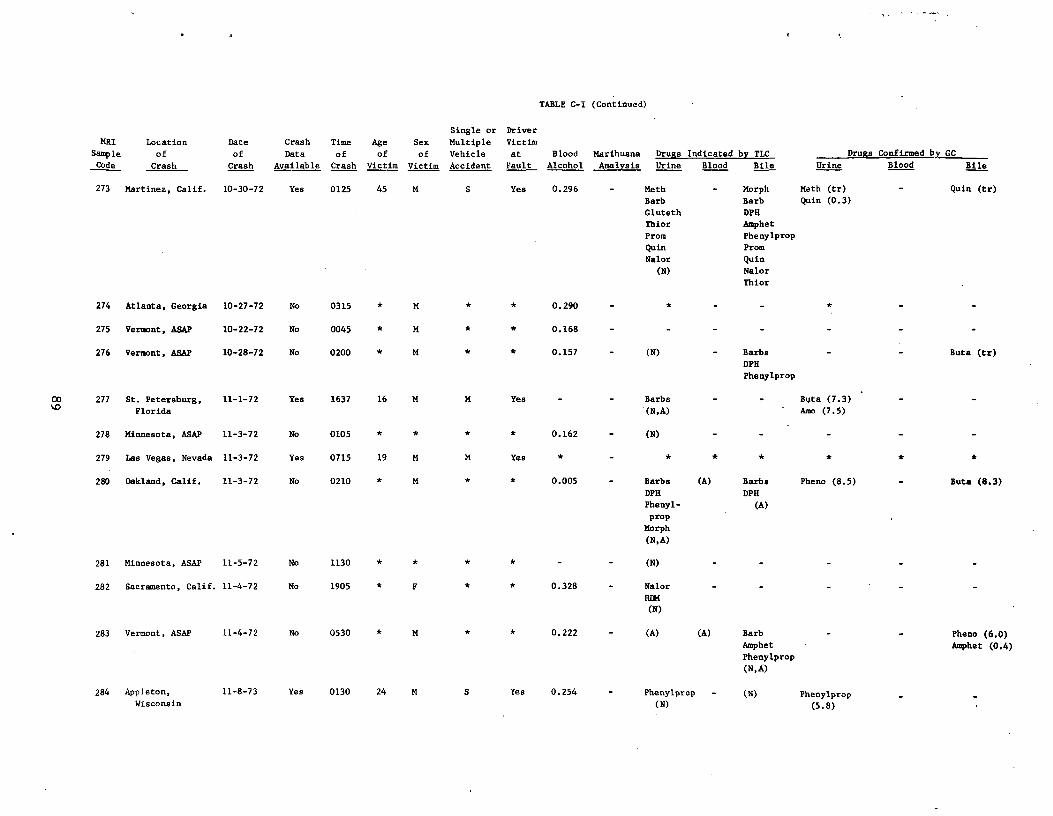
TABLE C-I (Continued)
Single or Driver
MRI Location Date Crash Time Age Sex Multiple Victim
Sample of of Data of of of Vehicle at Blood Marihuana Drugs Indicated by TLC Drugs Confirmed by GC
Code Crash Crash Available Crash Victim Victim Accident Fault Alcohol Analysis Urine Blood . Bile Urine Blood Bile
273 Martinez, Calif. 10-30-72 Yes 0125 45 M S Yes 0.296 - Meth - Morph Meth (tr) Quin (tr)
Barb Barb Quin (0.3)
Gluteth DPH
Thior Amphet
Prom Phenylprop
Quin Prom
Nalor Quin
(N) Nalor
Thior
274 Atlanta, Georgia 10-27-72 No 0315 * M * * 0.290
275 Vermont, ASAP 10-22-72 No 0045 * M * * 0.168
276 Vermont, ASAP 10-28-72 No 0200 * M * * 0.157 (N) Barbs Buts (tr)
DPH
Phenylprop
00 277 St. Petersburg, 11-1-72 Yes 1637 16 M M Yes - - Barbs - - Bpta (7.3) %0 Florida (N,A) Amo (7.5)
278 Minnesota, ASAP 11-3-72 No 0105 * * * * 0.162 - (N)
279 Las Vegas, Nevada 11-3-72 Yes 0715 19 M M Yes * -
280 Oakland, Calif. 11-3-72 No 0210 * M * * 0.005 - Barbs (A) Barbs Pheno (8.5) - Buta (8.3)
DPH DPH
Phenyl (A) prop
Morph
(N, A)
281 Minnesota, ASAP 11-5-72 No 1130 * * * _ _ (N)
282 Sacramento, Calif. 11-4-72 No 1905 * F * * 0.328 - Nalor
REM (N)
283 Vermont, ASAP 11-4-72 No 0530 * M * * 0.222 - (A) (A) Barb - - Pheno (6.0) Amphet Amphet (0.4) Phenylprop
(N,A)
284 Appleton, 11-8-73 Yes 0130 24 M S Yes 0.254 - Phenylprop - (N) Phenylprop Wisconsin (N) (5.8)
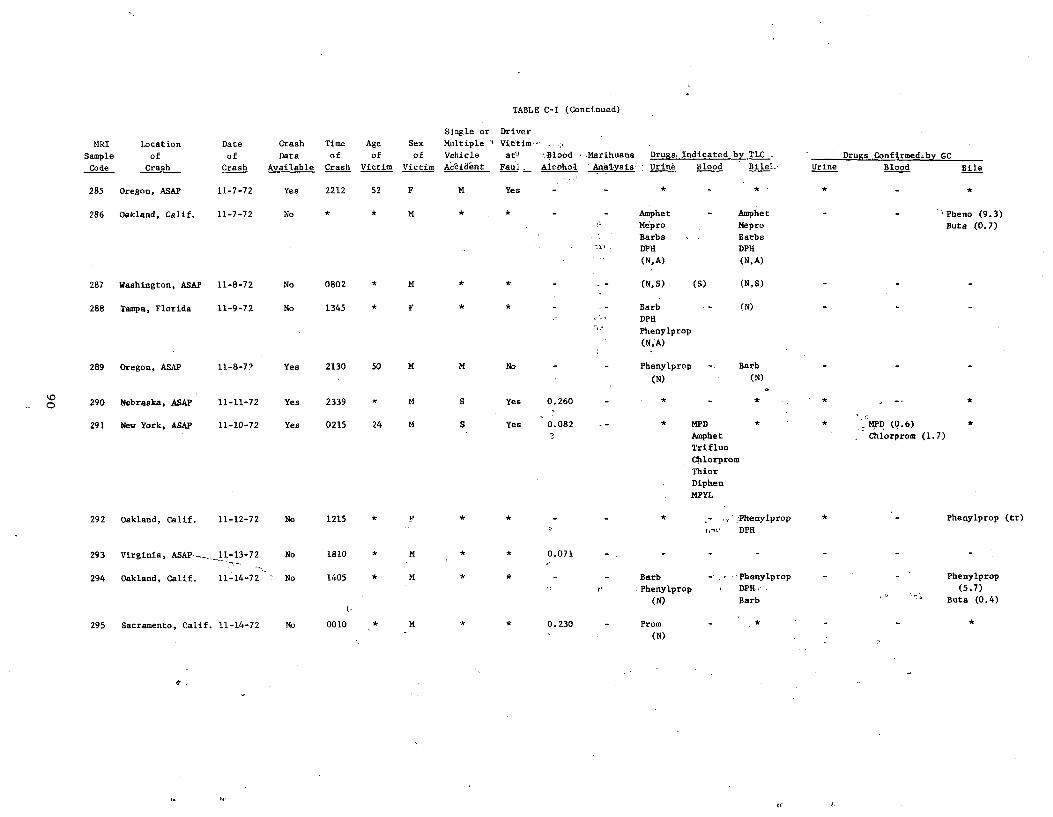
TABLE C-I (Continued)
MRI
Sample
Code
Location
of
Crash
Date
of
Crash
Crash
Data
Available
Time
of
Crash
Age
of
Victim
Sex
of
Victim
Single or
Multiple `
Vehicle
Ac'cid`ent
Driver
Victim,
at'u Blood Marihuana
Faul _ Alcohol 'Anal,^sis'
Drugs, Indicated by TLC__
Ur Ae Blood Bilel_
-
Urine
Drugs..Confirmedrby GC
Blood Bile
285 Oregon, ASAP 11-7-72 Yes 2212 52 F M Yes
286 Oakland, Calif. 11-7-72 No * * M * * - - Amphet
Mepro
Barbs
DPH
(N,A)
Amphet
Mepro
Barbs
DPH
(N,A)
'Pheno (9.3)
Buts (0.7)
287 Washington, ASAP 11-8-72 No 0802 * M * * - (N,S) (S) (N,S) - - -
288 Tampa, Florida 11-9-72 No 1345 * F Barb
DPH
Phenylprop
(N,A)
(N)
289 Oregon, ASAP 11-8-72 Yes 2130 50 M M No Phenylprop
(N)
Barb
(N)
- - -
92 0 b kras a, ASAPNe 11 11-72- Yes 2339 M S Yes 0 260. *
291 New York, ASAP. 11-10-72 Yes 0215 24 M S Yes 0.082 * MPD
Amphet
Trifluo
Chlorprom
Thior
Diphen
MPYL
* * MPD (0.6)
Chlorprom (1.7)
292 Oakland, Calif. 11-12-72 No 1215 *
^i
,';Phenylprop
DPH
* - Phenylprop (tr)
293 Virginia, ASAP--_11-13-72 No 1810 M * * 0.071
294 Oakland, Calif. 11-14-72 No 1405 * M * * - - Barb
Phenylprop
(N)
- Phenylprop
DPH„
Barb
- - Phenylprop
(5.7)
Buta (0.4)
295 Sacramento., Calif. 11-14-72 No 0010 * M * * 0.230 - Prom
(N)
*
u'
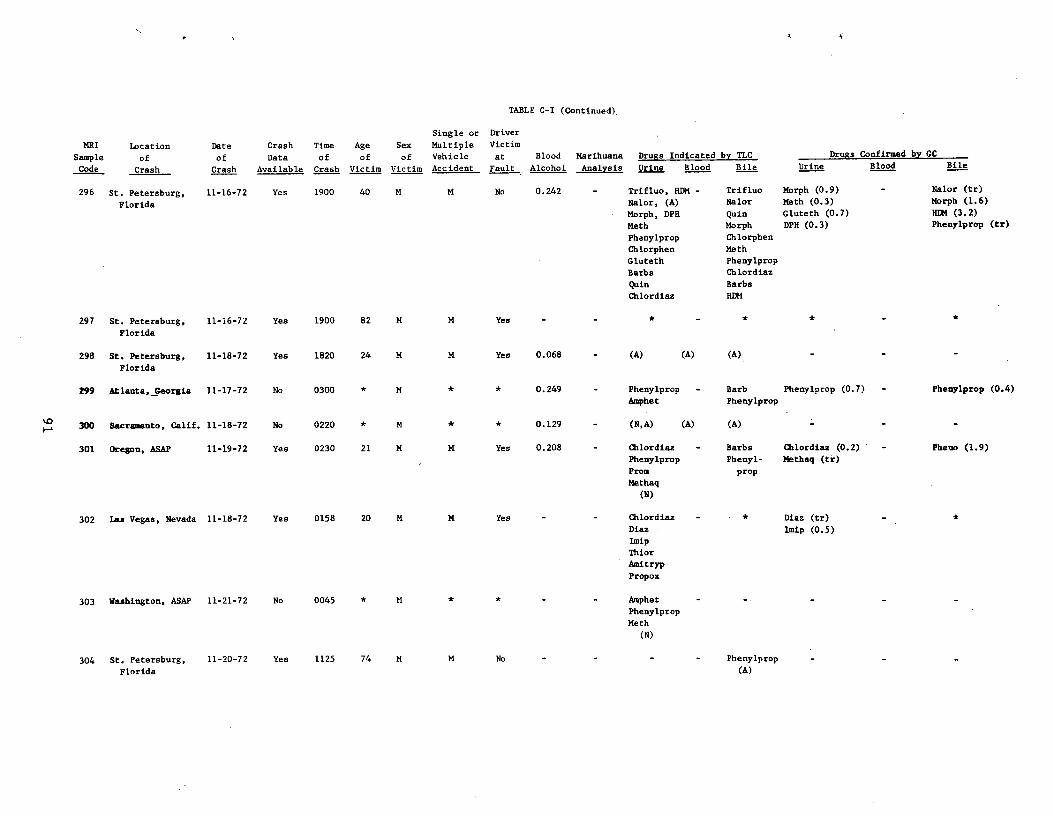
TABLE C-I (Continued),
MRI
Sample
Code
Location
fo
C hras
Date
of
hCras
Crash
Data
ilableAva
Time
of
ashCr
Age
of
Victim
Sex
of
Victim
Single or
Multiple
Vehicle
Accident
Driver
Victim
at
Fault
Blood
Alcohol
Marihuana
Analysis
Drugs Indicated by TLC
Urine Blood Bile Urine
Drugs Confirmed by GC
Blood Bile
296 St. Petersburg,
Florida
11-16-72 Yes 1900 40 M M No 0.242 - Trifluo, HDM -
Nalor, (A)
Morph, DPH
Meth
Phenylprop
Chlorphen
Gluteth
Barbs
Quin
Chlordiaz
Trifluo
Nalor
Quin
Morph
Chlorphen
Meth
Phenylprop
Chlordiaz
Barbs
HDM
Morph (0.9)
Math (0.3)
Gluteth (0.7)
DPH (0.3)
- Nalor (tr)
Morph (1.6)
HDM (3.2)
Phenylprop (tr)
297 St. Petersburg,
Florida
11-16-72 Yes 1900 82 M M Yes - - * - * * - *
298 St. Petersburg,
Florida
11-18-72 Yes 1820 24 M M Yes 0.068 - (A) (A) (A)
299 Atlanta, Georgia 11-17-72 No 0300 * M * * 0.249 - Phenylprop
Amphet
- Barb
Phenylprop
Phenylprop (0.7) - Phenylprop (0.4)
300 Sacramento, Calif. 11-18-72 No 0220 * M * * 0.129 - (N,A) (A) (A)
301 Oregon, ASAP 11-19-72 Yes 0230 21 M M Yes 0.208 - Chlordiaz
Phenylprop
Prom
Methaq
(N)
- Barbs
Phenyl-
prop
Cblordiaz (0.2)
Methaq (ti)
- Pheno (1.9)
302 Las Vegas, Nevada 11-18-72 Yes 0158 20 M M Yes - - Chlordiaz
Diaz
Imip
Thior
Amitryp
Propox
- * Diaz (tr)
Imip (0.5)
-
303 Washington, ASAP 11-21-72 No 0045 * M * * Amphet
Phenylprop
Meth
(N)
304 St. Petersburg,
Florida
11-20-72 Yes 1125 74 M M No Phenylprop
(A)
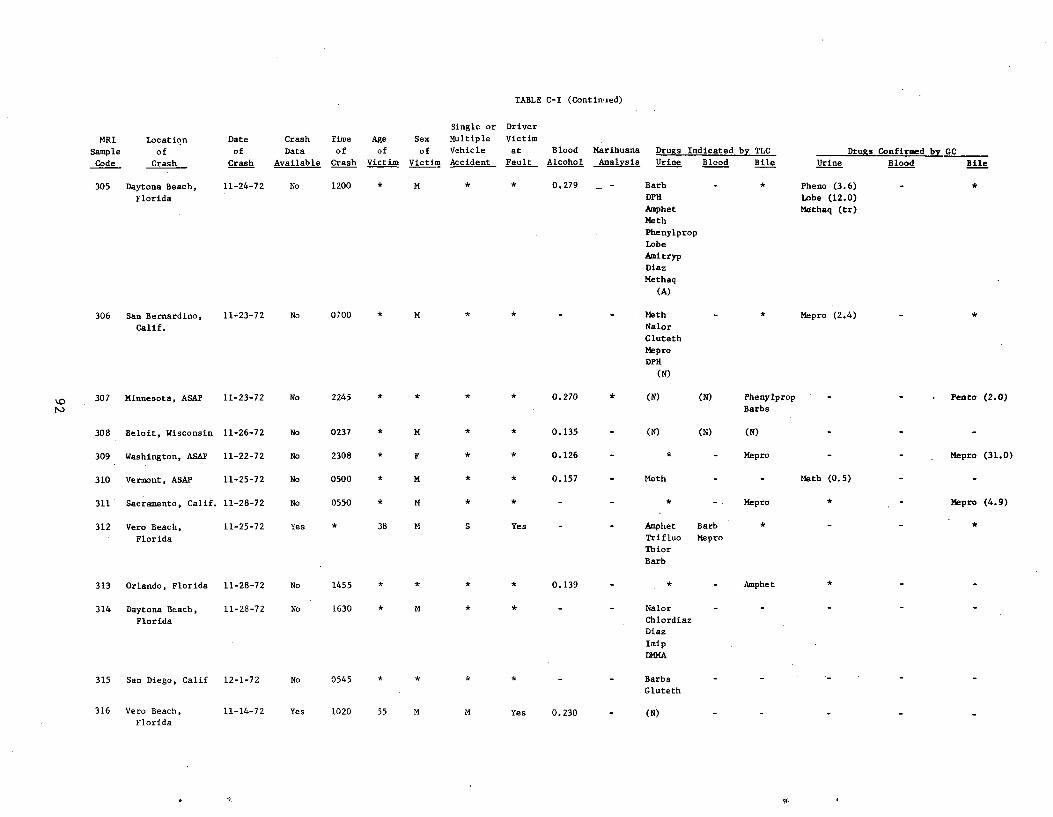
TABLE C-I (Continued)
Single or Driver
MRI Location Date Crash Time Age Sex Multiple Victim
Sample of of Data of of of Vehicle at Blood Marihuana Drugs Indicated by TLC Drugs Confirmed by GC
Code Crash Crash Available Crash Victim Victim Accident Fault Alcohol Analysis Urine Blood Bile Urine Blood Bile
305 Daytona Beach, 11-24-72 No 1200 * M 0.279 Barb - * Pheno (3.6) *
Florida DPH Lobe (12.0)
Amphet Methaq (tr) Meth
Phenylprop
Lobe
Amitryp
Diaz
Methaq
(A)
6 n Bernardino, -23-72 o 00 * M * Meth - * pro (2.4) -
Calif. Nalor
Gluteth
Mepro
DPH
(N)
07 innesota, ASAP 1-23-72 o 245 * * * * .270 * (N) N) henylprop . enno (2.0) Barbs
308 Beloit, Wisconsin 11-26-72 No 0237 * M 0.135 - (N) (N) (N)
309 Washington, ASAP 11-22-72 No 2308 F * 0.126 - * - Mepro Mepro (31.0)
310 Vermont, ASAP 11-25-72 No 0500 * M 0.157 - Meth - - Meth (0.5)
311 Sacramento, Calif. 11-28-72 No 0550 * M * * - - * Mepro Mepro (4.9)
312 Vero Beach, 11-25-72 Yes * 38 M S Yes - - Amphet Barb *
Florida Trifluo Mepro
Thior
Barb
13 Orlando, Florida 1-28-72 o 455 * * * * .139 mphet
314 Daytona Beach, 11-28-72 No 1630 * M * * - - Nalor
Florida Chlordiaz
Diaz
Imip
DMMA
15 an Diego, Calif 2-1-72 o 545 Barbs
Gluteth
316 Vero Beach, 11-14-72 Yes 1020 55 M M Yes 0.230 (N) Florida
it
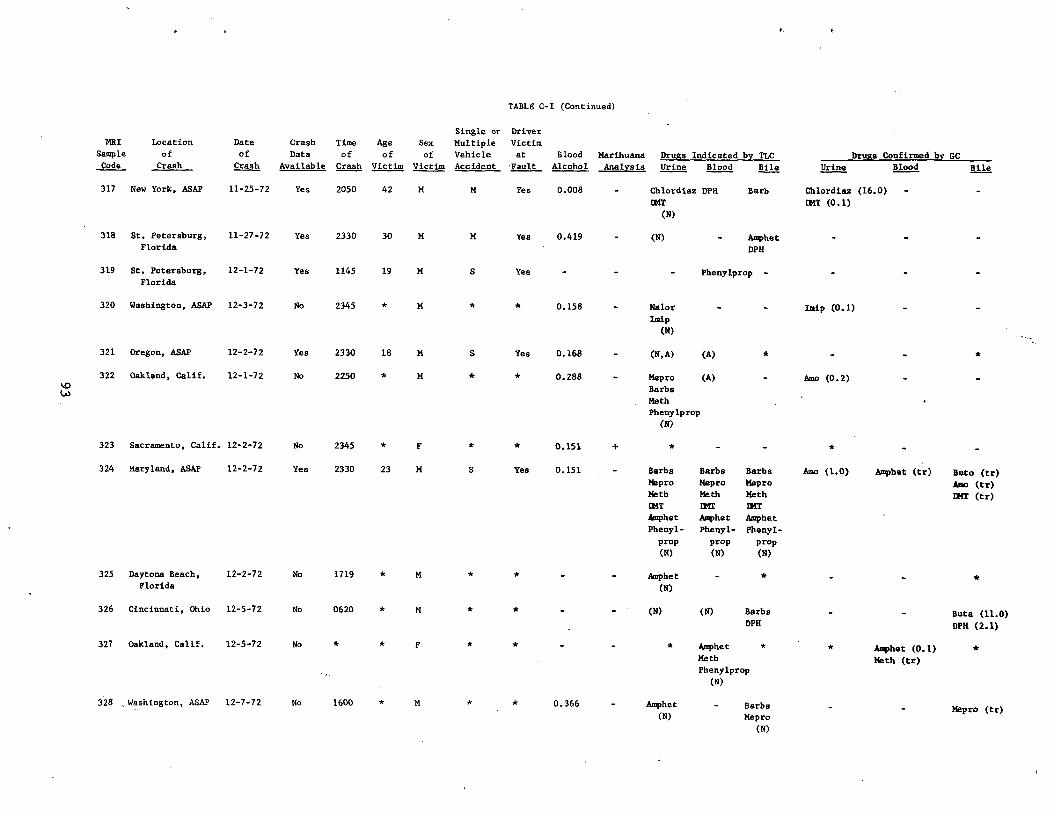
TABLE C-I (Continued)
MRI
Sample
Code
Location
of
Crash
Date
of
Crash
Crash
Data
Available
Single or Driver
Time Age Sex Multiple Victim
of of of Vehicle at
Crash Victim Victim Accident Fault
Blood
Alcohol
Marihuana
Analysis
Drugs Indicated by TLC
Urine Blood Bile Urine
Drusts Confirmed by GC
Blood Bile
317 New York, ASAP 11-25-72 Yes 2050 42 M M Yes 0.008 - Chlordiaz DPH
DMT
(N)
Barb Chlordiaz (16.0)
LMT (0.1)
-
318 St. Petersburg,
Florida
11-27-72 Yes 2330 30 M M Yes 0.419 - (N) - Amphet
DPH
319 St. Petersburg,
Florida
12-1-72 Yes 1145 19 M S Yes Phenylprop -
320 Washington, ASAP 12-3-72 No 2345 * M * * 0.158 - Nalor
Imip
(N)
Imip (0.1)
321 Oregon, ASAP 12-2-72 Yes 2330 18 M S Yes 0.168 - (N,A) (A)
322 Oakland, Calif. 12-1-72 No 2250 * M * 0.288 Mepro (A)
Barbs
Math
Phenylprop
(N)
Amo (0.2)
323 Sacramento, Calif. 12-2-72 No 2345 F * * 0.151 + * *
324 Maryland, ASAP 12-2-72 Yes 2330 23 M S Yes 0.151 Barbs
Mepro
Meth
EMT
Barbs
Mepro
Math
114T
Barba
Mepro
Meth
DMT
Amo (1.0) Amphet (tr) Buto (tr)
Amo (tr)
EM (tr)
Amphet
Phenyl-
Amphet
Phenyl-
Amphet
Phenyl-
prop
(N)
prop
(N)
prop
(N)
325 Daytona Beach,
Florida
12-2-72 No 1719 * M Amphet
(N)
- *
326 Cincinnati, Ohio 12-5-72 No 0620 * M * * (N) (N) Barbs
DPH Buts. (11.0)
DPH (2.1)
327 Oakland, Calif. 12-5-72 No * * F * * * Amphet
Meth
Phenylprop
(N)
Amphet (0.1) Meth (tr)
*
328 Washington, ASAP 12-7-72 No 1600 * M 0.366 Amphet
(N)
- Barbs
Mepro
(N)
Mepro (tr)
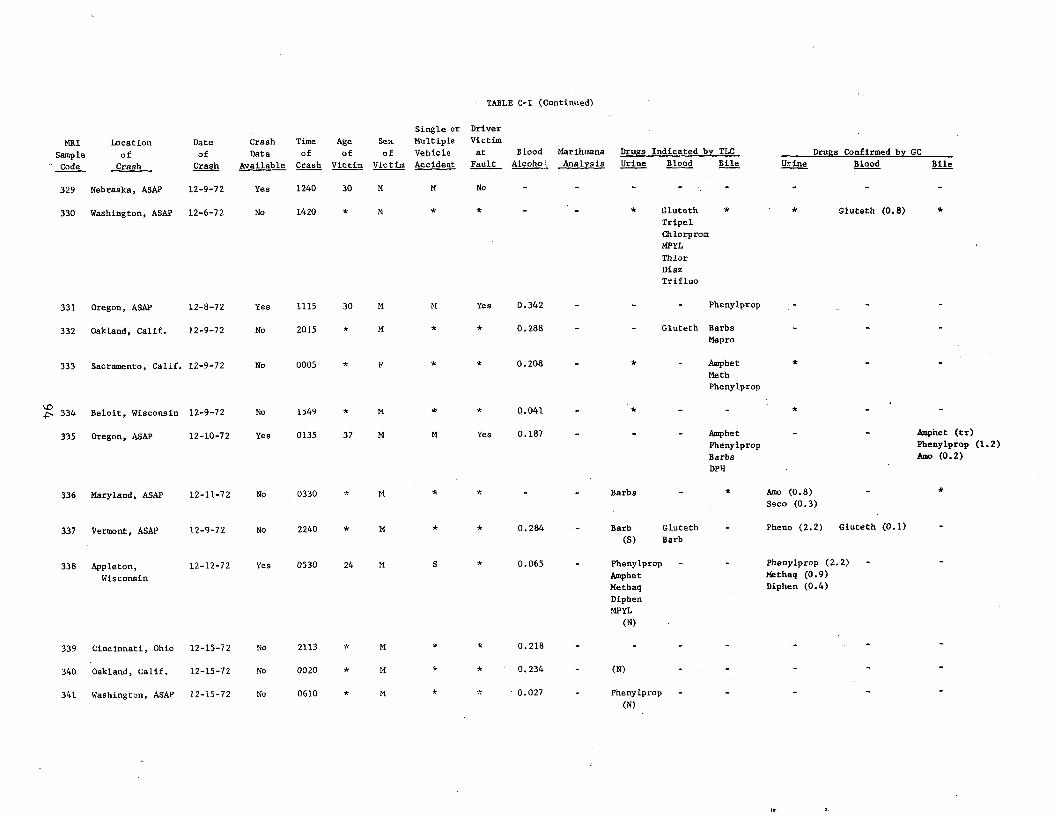
TABLE C-I (Continued)
MRI
leSamp
Code
Location
of
Crash
Date
of
Crash
Crash
Data
Available
Time
of
Crash
Age
of
Victim
Sex
of
Victim
Single or
Multiple
Vehicle
Accident
Driver
Victim
at
Fault
Blood
Alcoho
Marihuana
Analysis
Drugs Indicated by TLC
Urine Blood Bile Urine
Drugs Confirmed by GC
Blood Bile
329 Nebraska, ASAP 12-9-72 Yes 1240 30 M M No
330 Washington, ASAP 12-6-72 No 1420 * M * * - - * Gluteth
Tripel
Chiorprom
MPYL
Thior
Diaz
Trifluo
* * Gluteth (0.8)
331 Oregon, ASAP 12-8-72 Yes 1115 30 M M Yes 0.342 Ph leny prop
332 Oakland, Calif. 12-9-72 No 2015 M * * 0.288 Gluteth Barbs
Mepro
333 Sacramento, Calif. 12-9-72 No 0005 F * * 0.208 * Amphet
Meth
Phenylprop
334 Beloit, Wisconsin 12-9-72 No 1549 * M * * 0.041 *
335 Oregon, ASAP 12-10-72 Yes 0135 37 M M Yes 0.187 - - - Amphet
Phenylprop
Barbs
DPH
- - Amphet (tr)
Phenylprop (1.2)
Amo (0.2)
336 Maryland, ASAP 12-11-72 No 0330 * M * * - - Barbs - * Amo (0.8)
Seco (0.3)
*
337 Vermont, ASAP 12-9-72 No 2240 * M * 0.284 - Barb
(S)
Gluteth
Barb
Pheno (2.2) Gluteth (0.1)
338 Appleton,
Wisconsin
12-12-72 Yes 0530 24 M S * 0.065 - Phenylprop
Amphet
Methaq
Diphen
MPYL
(N)
- - Phenylprop (2.2)
Methaq (0.9)
Diphen (0.4)
-
39 Cincinnati, Ohio 12-15-72 No 113 * M * * .218 -
340 Oakland, Calif. 12-15-72 No 0020 * M * * 0.234 - (N)
341 Washington, ASAP 12-15-72 No 0610 * M * * 0.027 - Phenylprop
(N)
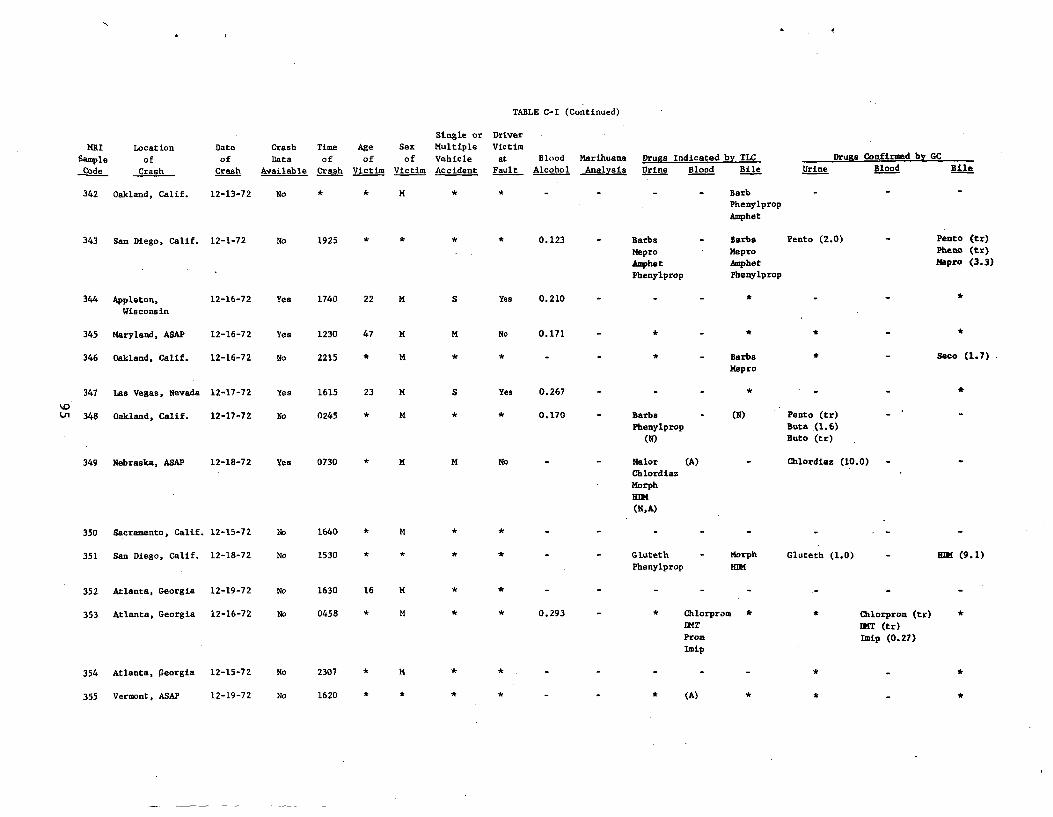
TABLE C-I (Continued)
Single or Driver
MRI
Sample
Code
Location
of
Crash
Date
of
Crash
Crash
Data
Available
Time
of
Crash
Age
of
Victim
Sex
of
Victim
Multiple
Vehicle
Accident
Victim
at
Fault
Blood
Alcohol
Marihuana
Analysis
Drugs Indicated by TLC
Urine Blood Bile Urine Drugs Confirmed by GC
Blood Bile
342 Oakland, Calif. 12-13-72 No * * M * Barb
Phenylprop
Amphet
343 San Diego, Calif. 12-1-72 No 1925 * * * * 0.123 - Barbs - Barbs
Mepro Mepro
Amphet Amphet Phenylprop Phenylprop
Pento (2.0) - Pento (tr) Pheto (tr)
Napro (3.3)
344 Appleton, 12-16-72 Wisconsin
Yes 1740 22 M S Yes 0.210 - - - * -
345 Maryland, ASAP 12-16-72 Yes 1230 47 M M No 0.171 - *
346 Oakland, Calif. 12-16-72 No 2215 * M * - Barbs Mepro
Saco (1.7)
347 Las Vegas, Nevada 12-17-72 Yes 1615 23 M S Yes 0.267 - - - * -
D 348 Oakland, Calif. 12-17-72 No 0245 * M * * 0.170 - Barbs - (N)
Phenylprop
(N)
Pento (tr)
Beta .(1.6)
Buto (tr)
349 Nebraska, ASAP 12-18-72 Yes 0730 * M M No Nalor (A)
Chlordiaz
Chlordiaz (10.0)
Morph
HUM
(N,A)
350 Sacramento, Calif. 12-15-72 No 1640 * M * *
351 San Diego, Calif. 12-18-72 No 1530 * * - - Gluteth - Morph
Phenylprop HUM
Gluteth (1.0) Hn4 (9.1)
352 Atlanta, Georgia 12-19- 7 2 No 1630 16 M *
353 Atlanta, Georgia 12-16-72 No 0458 * M * * 0.293 - * Chlorprom
EMT
Prom
Imip
* Chlorprom (tr) UMT (tr) Imip (0.27)
354 At lanta, Georgia 2-15-72 No 307 * M * * *
355 Vermont, ASAP 12-19-72 No 1620 * * * * (A) * *
%
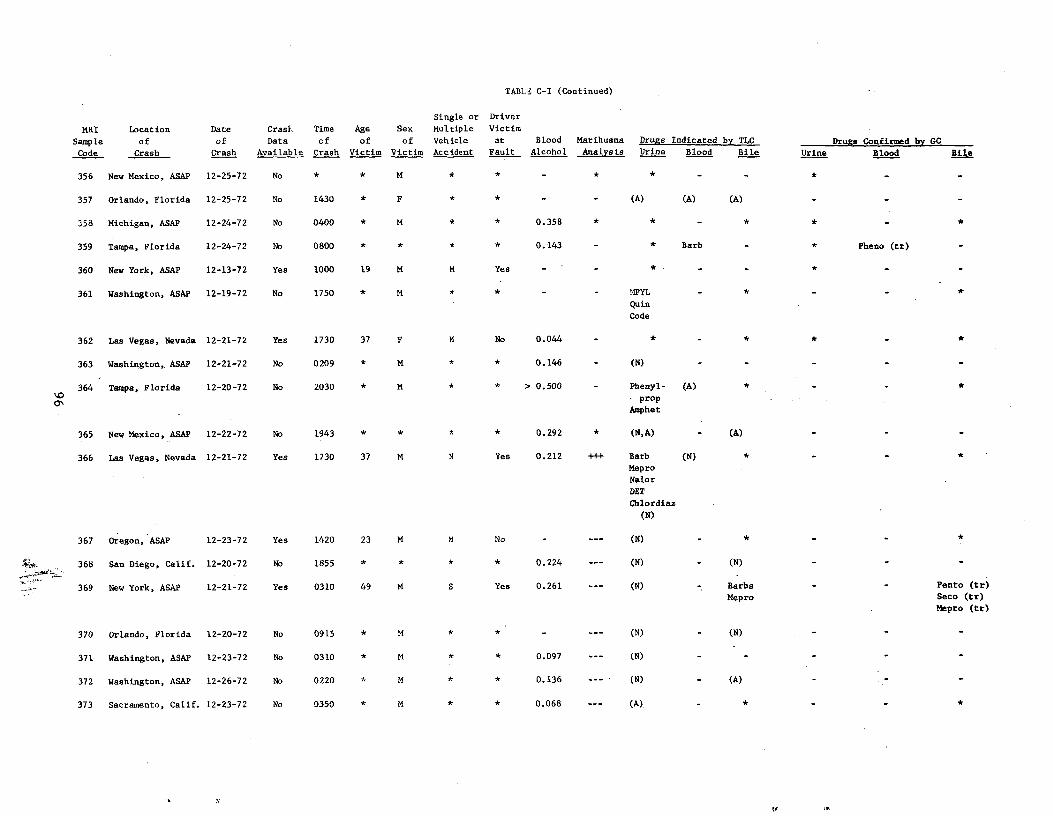
*
TABLE C-I (Continued)
MRI
Sample
Code
Location
of
Crash
Date
of
Crash
Crash
Data
Available
Time
of
Crash
Age
of
Victim
Sex
of
Victim
Single or
Multiple
vehicle
Accident
Driver
Victim
at
Fault
Blood
Alcohol
Marihuana
Analysis
Drugs Indicated by TLC
Urine Blood Bile Urine
Drugs Confirmed by GC
Blood Bile
356 New Mexico, ASAP 12-25-72 No M *
357 Orlando, Florida 12-25-72 No 1430 * F (A) (A) (A)
358 Michigan, ASAP 12-24-72 No 0400 * M * * 0.358 * * -
359 Tampa, Florida 12-24-72 No 0800 * * * * 0.143 - * Barb Pheno (tr)
360 New York, ASAP 12-13-72 Yes 1000 19 M M Yes - - * -
361 Washington, ASAP 12-19-72 No 1750 * M * :'IDYL *
Quin
Code
362 Las Vegas, Nevada 12-21-72 Yes 1730 37 F M No 0.044 - * - * * *
363 Washington, ASAP 12-21-72 No 0209 * M * * 0.146 - (N) - - -
364 Tampa, Florida 12-20-72 No 2030 * M * * > 0.500 - Phenyl-
prop
Amphet
(A) * - *
365 New Mexico, ASAP 12-22-72 No 1943 * * * * 0.292 * (N,A) (A)
366 Las Vegas, Nevada 12-21-72 Yes 1730 37 M M Yes 0.212 +++ Barb
Mepro
Nalor
(N) *
DET
Chlordiaz
(N)
67 regon, ASAP 2-23-72 es 420 3 M M o - --- (N) - * *
368 San Diego, Calif. 12-20-72 No 1855 * * * * 0.224 --- (N) - (N)
369 New York, ASAP 12-21-72 Yes 0310 49 M S Yes 0.261 --- (N) Barbs
Mepro
Pento (tr)
Seco (tr)
Mepro (tr)
370 Orlando, Florida 12-20-72 No 0915 * M * * - --- (N) - (N) - - -
371 Washington, ASAP 12-23-72 No 0310 * M * * 0.097 --- (N) - - - - -
372 Washington, ASAP 12-26-72 No 0220 * M * * 0.136 --- (N) - (A) - -
373 Sacramento, Calif. 12-23-72 No 0350 * M * * 0.068 --- (A). - * - -
*
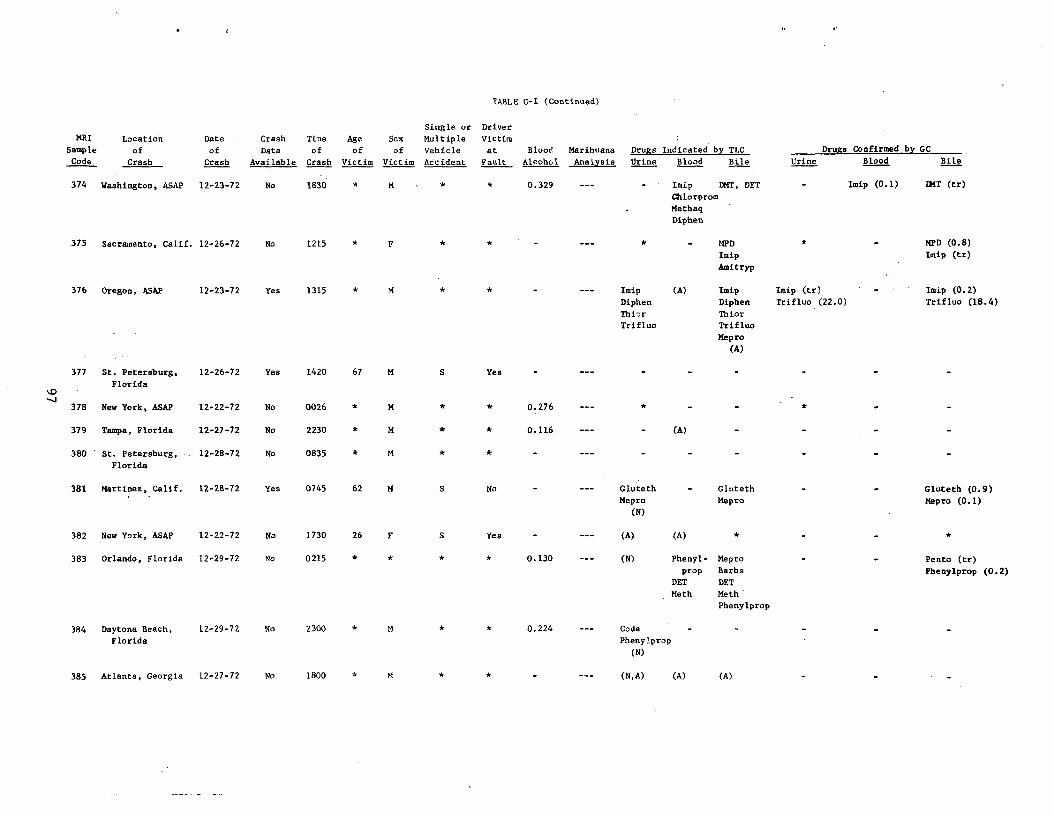
TABLE C-I (Continued)
Single or Driver MRI Location Date Crash Time Age Sex Multiple Victim
Sample of of Data of of of Vehicle at Blood Marihuana Drugs Indicated by TLC Drugs Confirmed by GC
Code Crash Crash Available Crash Victim Victim Accident Fault . Alcohol Analysis Urine Blood Bile Urine Blood Bile
374 Washington, ASAP 12-23-72 No 1830 * M 0.329 Imip DMT, DET - Imip (0.1) DMT (tr)
Chlorprom
Methaq
Diphen
375 Sacramento, Calif. 12-26-72 No 1215 * F * * MPD * - MPD (0.8)
Imip Imip (tr)
Amitryp
376 Oregon, ASAP 12-23-72 Yes 1315 * M * * - --- Imip (A) Imip Imip (tr) - Imip (0.2)
Diphen Diphen Trifluo (22.0) Trifluo (18.4)
Thior Thior
Trifluo Trifluo
Mepro
(A)
377 St. Petersburg, 12-26-72 Yes 1420 67 M S Yes
Florida
378 New York, ASAP 12-22-72 No 0026 M * * 0.276 *
379 Tampa, Florida 12-27-72 No 2230 * M * * 0.116 (A)
380 ' St. Petersburg, 12-28-72 No 0835 * M
Florida
381 Martinez, Calif. 12-28-72 Yes 0745 62 M S No Gluteth - Gluteth - - Gluteth (0.9) Mepro Mepro Mepro (0.1)
(N)
382 New York, ASAP 12-22-72 No 1730 26 F S Yes - --- (A) (A) *
383 Orlando, Florida 12-29-72 No 0215 * * * * 0.130 --- (N) Phenyl- Mepro Pento (tr)
prop Barbs Phenylprop (0.2) DET DET
Meth Meth
Phenylprop
84 aytona Beach, 12-29-72 No 300 * M .224 ode
Florida Phenylprop
(N)
385 Atlanta, Georgia 12-27-72 No 1800 * M * * - --- (N,A) (A) (A)
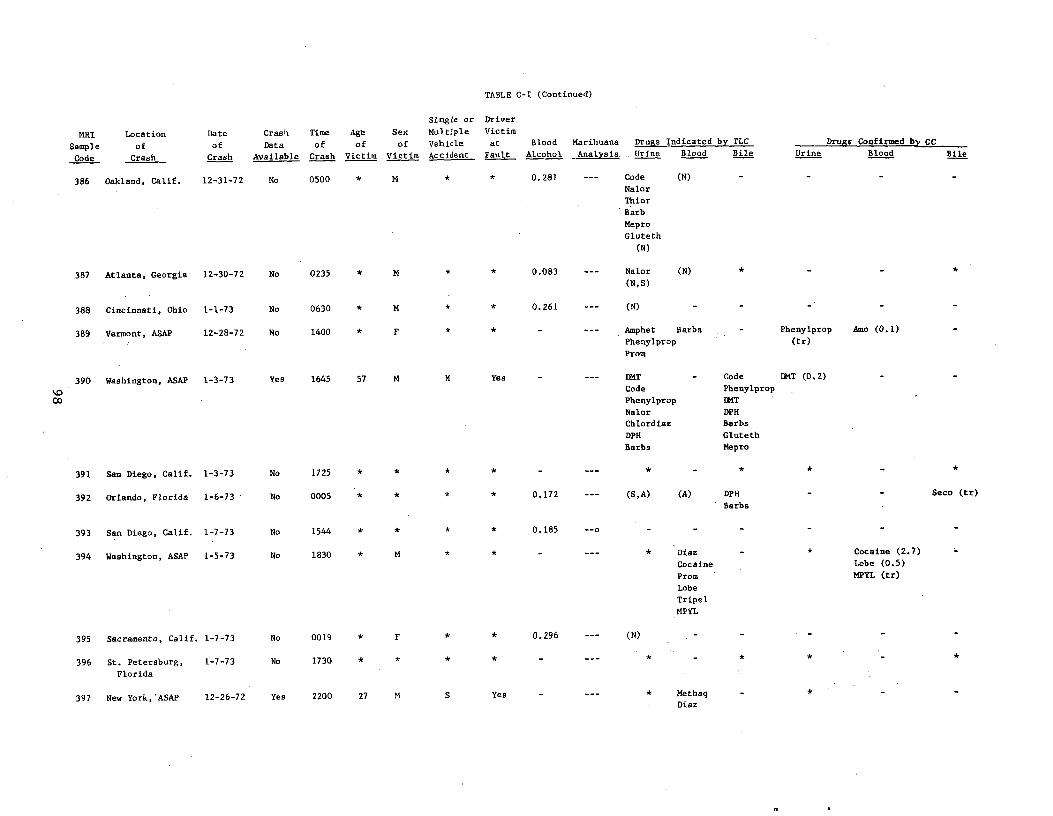
TABLE C-I (Continued)
MRI
Sample
Code
Location
of hCras
Date
of
Cr sha
Crash
Data
Available
Time
of
Crash
Agb
of victim
Sex
of
victim
Single or
Multiple
vehicle Accident
Driver
Victim
at
Fault
Blood
Alcohol
Marihuana
Analysis
Drugs Indicated by TLC
Urine Blood Bile Urine
Drugs Confirmed by GC
Blood Bile
386 Oakland, Calif. 12-31-72 No 0500 * M * * 0.281 --- Code
Nalor
Thior
Barb
Mepro
Gluteth
(N)
(N)
87 Atlanta, Georgia 2-30-72 o 235 * M * * .083 -- Nalor
(N,S)
(N) *
388 Cincinnati, Ohio 1-1-73 No 0630 * M * * 0.261 --- (N)
389 Vermont, ASAP 12-28-72 No 1400 * F * Amphet Barbs
Phenylprop
Prom
- Phenylprop
(tr)
Amo (0.1)
390 Washington, ASAP 1-3-73 Yes 1645 57 M M Yes - --- LMT
Code
Phenylprop
Nalor
Chlordiaz
DPH
Barbs
Code
Phenylprop
LMT
DPH
Barbs
Gluteth
Mepro
Ik1T (0,2)
91 San Diego, Calif. -3-73 o 725 * * * *
392 Orlando, Florida 1-6-73 No 0005 * * * 0.172 --- (S,A) (A) DPH
Barbs
Seco (tr)
393 San Diego, Calif. 1-7-73 No 1544 * * * * 0.185
394 Washington, ASAP 1-5-73 No 1830 * M * * - Diaz
Cocaine
Prom
Lobe
Tripel
MPYL
- * Cocaine (2.7)
Lobe (0.5)
MPYL (tr)
395 Sacramento, Calif. 1-7-73 No 0019 F * 0.296 (N)
396 St. Petersburg,
Florida
1-7-73 No 1730 * * * *
397 New York,'ASAP 12-26-72 Yes 2200 27 M S Yes - --- * Methaq
Diaz
-
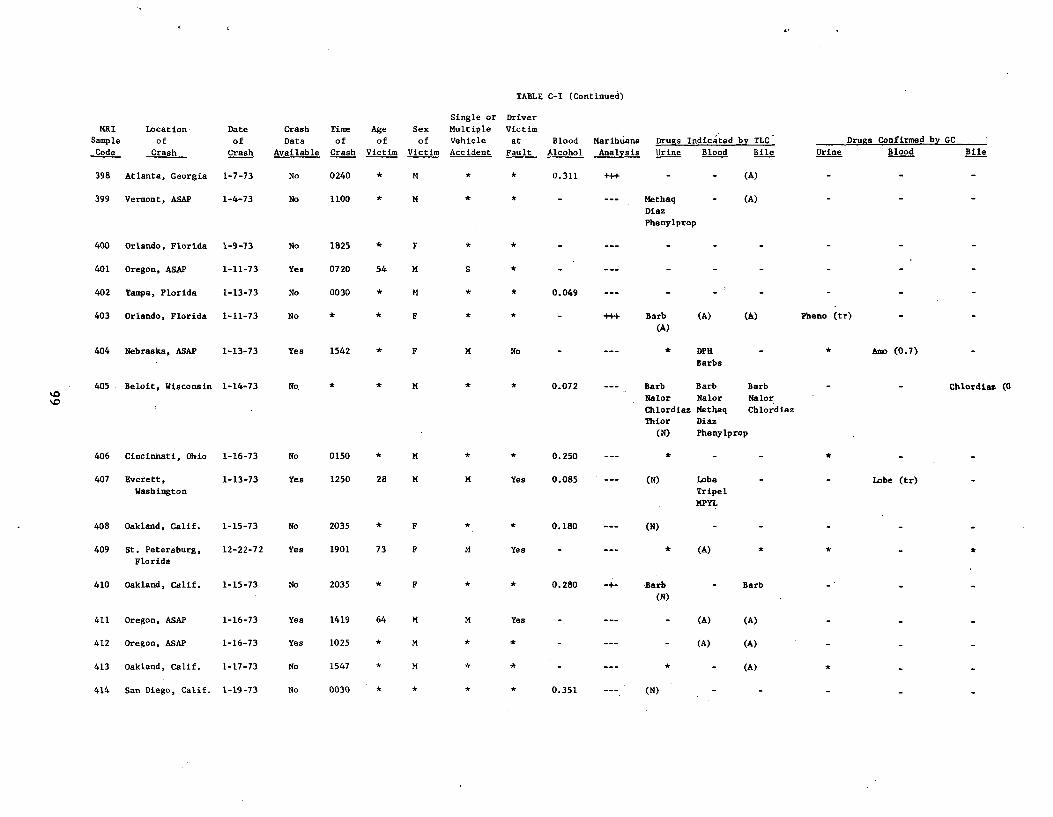
TABLE C-I (Continued)
MRI
Sample
Code
Location
of
Crash
Date
of
Crash
Crash
Data
Available
Time
of
Crash
Age
of
Victim
Sex
of
Victim
Single or
Multiple
Vehicle
Accident
Driver
Victim
at
Fault
Blood
Alcohol
Marihuana
Analysis
_
Drugs Indicated by TLC
Urine Blood Bile Urine
Drugs Confirmed by GC
Blood Bile
398 Atlanta, Georgia 1-7-73 No 0240 * M * * 0.311 +++ - - (A)
399 Vermont, ASAP 1-4-73 No 1100 * M * * - --- Methaq
Diaz
Phenylprop
(A)
400 Orlando, Florida 1-9-73 No 1825 F * *
401 Oregon, ASAP 1-11-73 Yes 0720 54 M S * - --- - - - -
402 Tampa, Florida 1-13-73 No 0030 * M * * 0.049 --- - - - -
403 Orlando, Florida 1-11-73 No * * F * * - +++ Barb
(A)
(A) (A) Pheno (tr)
404 N braska,e ASAP 1-13-73 Yes 1542 * F M No - --- * DPH
Barbs
Amo (0 7).
405 Beloit, Wisconsin 1-14-73 No * * M * * 0.072 -- - Barb Barb Barb
Nalor Nalor Nalor
Chlordiaz Methaq Chlordiaz
Thior Diaz
(N) Phenylprop
Chlordias (0
06 incinnati, Ohio -16-73 o 150 * M * .250 -- * - -
407 Everett,
Washington
1-13-73 Yes 1250 28 M M Yes 0.085 (N) Lobe
Tripel
MPYL
Lobe (tr)
408 Oakland, Calif. 1-15-73 No 2035 * F * *. 0.180 (N)
409 St. Petersburg,
Florida
12-22-72 Yes 1901 73 F M Yes * (A) * *
410 Oakland, Calif. 1-15-73 No 2035 * F * * 0.280 -Barb
(N)
- Barb
411 Oregon, ASAP 1-16-73 Yes 1419 64 M M Yes (A) (A)
412 Oregon, ASAP 1-16-73 Yes 1025 * M * * - (A) (A)
413 Oakland, Calif. 1-17-73 No 1547 * M * * - * - (A)
414 San Diego, Calif. 1-19-73 No 0030 * * * * 0.351 (N)
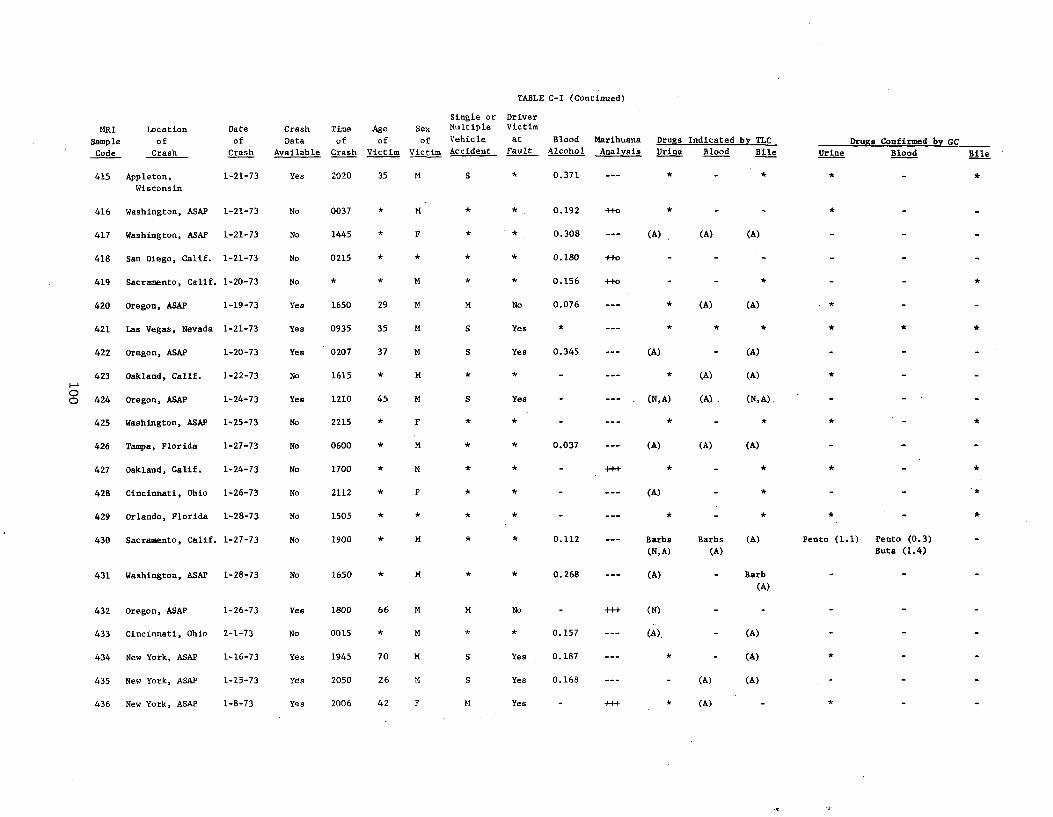
TABLE C-I (Continued)
MRI
Sample
Code
Location
of
Date
of
Crash Crash
Crash
Data
Available
Time
of
Crash
Age
of
Victim
Single or Driver
Sex Multiple Victim
of Vehicle at Blood Marihuana
Victim Accident Fault Alcohol Analysis
Drugs Indicated by TLC
Urine Blood Bile Drugs Confirmed by GC
Urine Blood Bile
415 Appleton,
Wisconsin
1-21-73 Yes 2020 35 M S * 0.371 --- * - * * -
416 Washington, ASAP 1-21-73 No 0037 * M * * 0.192 ++o * - - * -
417 Washington, ASAP 1-21-73 No 1445 * F * * 0.308 --- (A) (A) (A) - -
418 San Diego, Calif. 1-21-73 No 0215 * * * * 0.180 ++o - - - - -
419 Sacramento, Calif. 1-20-73 No * * M * * 0.156 +fo - - * - - *
420 Oregon, ASAP 1-19-73 Yes 1650 29 M M No 0.076 --- * (A) (A) * -
421 Las Vegas, Nevada 1-21-73 Yes 0935 35 M S Yes * --- *
422 Oregon, ASAP 1-20-73 Yes 0207 37 M S Yes 0.345 --- (A) - (A) - -
423 Oakland, Calif. 1-22-73 No 1615 * M * * - --- * (A) (A) * -
p 424 Oregon, ASAP 1-24-73 Yes 1210 45 M S Yes - --- (N, A) (A) (N,A).
425 Washington, ASAP 1-25-73 No 2215 * F * * - --- * - * * - *
426 Tampa, Florida 1-27-73 No 0600 * M * * 0.037 --- (A) (A) (A) - -
427 Oakland, Calif. 1-24-73 No 1700 * M
428 Cincinnati, Ohio 1-26-73 No 2112 * F * * - --- (A) - * - -
429 Orlando, Florida 1-28-73 No 1505 * * * * - --- * - *
430 Sacramento, Calif. 1-27-73 No 1900 * M * * 0.112 --- Barbs Barbs (A)
(N,A) (A)
Pento (1.1) Pento (0.3)
Buta (1.4)
431 Washington, ASAP 1-28-73 No 1650 * M * * 0.268 --- (A) - Barb
(A)
432 Oregon, ASAP 1-26-73 Yes 1800 66 M M No - ++f (N) - -
433 Cincinnati, Ohio 2-1-73 No 0015 * M * * 0.157 --- (A), - (A)
434 New York, ASAP 1-16-73 Yes 1945 70 M S Yes 0.187 --- * - (A) *
435 New York, ASAP 1-15-73 Yes 2050 26 M S Yes 0.168 --- - (A) (A)
436 New York, ASAP 1-8-73 Yes 2006 42 F M Yes - ++ t * (A) - *
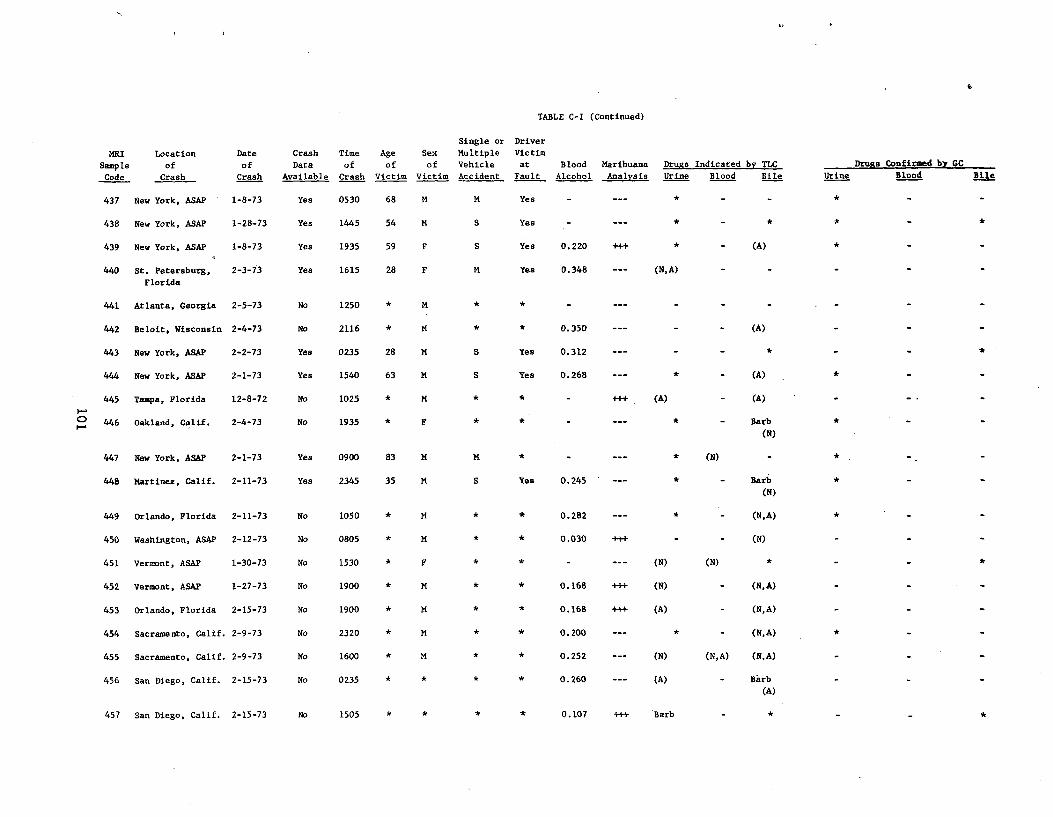
e
TABLE C-I (Continued)
MRI
Sample
Code
Location
of
Crash
Date
of
Crash
Crash
Data
Available
Time
of
Crash
Age
of
Victim
Single or Driver
Sex Multiple Victim
of Vehicle at
Victim Accident Fault
Blood
Alcohol
Marihuana
Analysis
Drugs Indicated by TLC
Urine Blood Bile Urine
Drugs Confirmed by GC
Blood Bile
437 New York, ASAP 1-8-73 Yes 0530 68 M M Yes *
438 New York, ASAP 1-28-73 Yes 1445 54 M S Yes - --- * -
439 New York, ASAP 1-8-73 Yes 1935 59 F S Yes 0.220 +++ * - (A) *
440 St. Petersburg,
Florida
2-3-73 Yes 1615 28 F M Yes 0.348 (N, A)
441 Atlanta, Georgia 2-5-73 No 1250 * M
442 Beloit, Wisconsin 2-4-73 No 2116 * M * 0.350 (A)
443 New York, ASAP 2-2-73 Yes 0235 28 M S Yes 0.312 * *
444 New York, ASAP 2-1-73 Yes 1540 63 M S Yes 0.268 --- * - (A) *
r+ 445
446
Tampa, Florida
Oakland, Calif.
12-8-72
2-4-73
No
No
1025
1935
*
*
M
F
(A) - (A) .
Barb
(N)
*
447 New York, ASAP 2-1-73 Yes 0900 83 M M * (N) *
448 Martinez, Calif. 2-11-73 Yes 2345 35 M S Yes 0.245 * - Barb (N)
*
449 Orlando, Florida 2-11-73 No 1050 * M 0.282 * - (N, A) *
450 Washington, ASAP 2-12-73 No 0805 * M 0.030 +++ - - (N)
451 Vermont, ASAP 1-30-73 No 1530 * F (N) (N) * *
452 Vermont, ASAP 1-27-73 No 1900 * M * 0.168 +++ (N) - (N,A)
453 Orlando, Florida 2-15-73 No 1900 * M * 0.168 +++ (A) - (N, A)
454 Sacramento, Calif. 2-9-73 No 2320 * M * 0.200 --- * - (N,A) *
455 Sacramento, Calif. 2-9-73 No 1600 * M * 0.252 --- (N) (N,A) (N,A)
456 San Diego, Calif. 2-15-73 No 0235 * * * * 0.260 --- (A) - Barb
(A)
457 San Diego, Calif. 2-15-73 No 1505 0.107 +++ Barb * *
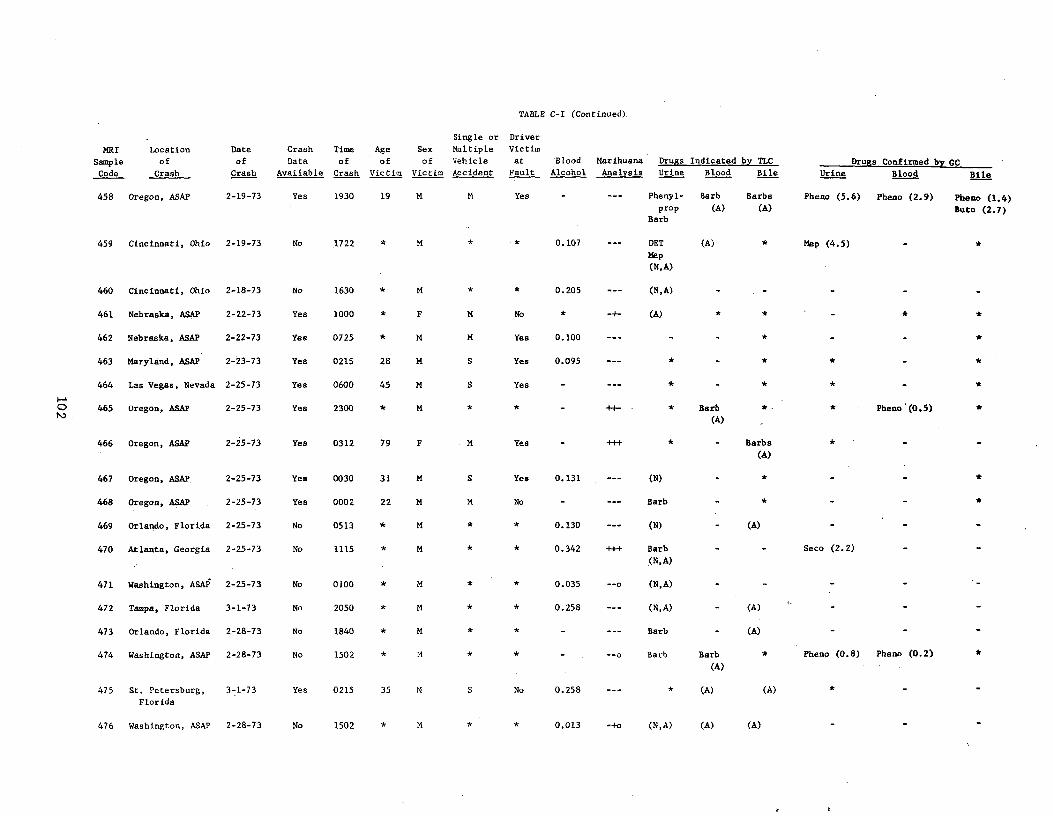
TABLE C-I (Continued).
MRI
Sample
Code
Location
of
Crash
Date
of
Crash
Crash
Data
Available
Time
of
Crash
Single or Driver
Age Sex Multiple Victim
of of Vehicle at
Victim Victim Accident Fault
Blood
Alcohol
Marihuana
Analysis
Drugs Indicated by TLC
Urine Blood Bile Urine
Drugs Confirmed by GC
Blood Bile
458 Oregon, ASAP 2-19-73 Yes 1930 19 M M Yes Phenyl-
prop
Barb
Barb
(A)
Barbs
(A)
Pheno (5.6) Pheno (2.9) Pheno (1.4)
Buto (2.7)
459 Cincinnati, Ohio 2-19-73 No 1722 * M 0.107 DET
Map
(N, A)
(A) * Map (4.5) *
460 Cincinnati, Ohio 2-18-73 No 1630 * M * * 0.205 --- (N,A) - - - - -
461 Nebraska, ASAP 2-22-73 Yes 1000 * F M No * -+ (A) * * - * *
462 Nebraska, ASAP 2-22-73 Yes 0725 * M M Yes 0.100 --- - - * - - *
463 Maryland, ASAP 2-23-73 Yes 0215 28 M. S Yes 0.095 --- * - * * -
r O
464
465
Las Vegas, Nevada
Oregon, ASAP
2-25-73
2-25-73
Yes
Yes
0600
2300
45
*
M
M
S
*
Yes
* - ±+- * Barb
(A)
*
* .
*
* Pbeno'(0.5)
*
466 Oregon, ASAP 2-25-73 Yes 0312 79 F M Yea Barbs (A)
*
467 Oregon, ASAP: 2-25-73 Yes 0030 31 M S Yes 0.131 --- (N) - * - - *
468 Oregon, ASAP 2-25-73 Yes 0002 22 M M No - --- Barb - *
469 Orlando, Florida 2-25-73 No 0513 * M * * 0.130 --- (N) - (A)
470 Atlanta, Georgia 2-25-73 No 1115 * M * * 0.342 +++ Barb
(N,A)
Seco (2.2)
471 Washington, ASAP 2-25-73 No 0100 * M * * 0.035 --o (N,A)
472 Tampa, Florida 3-1-73 No 2050 * M * * 0.258 --- (N,A) - (A) - - -
473 Orlando, Florida 2-28-73 No 1840 * M * * - --- Barb - (A) - -
474 Washington, ASAP 2-28-73 No 1502 * M * * - --o Barb Barb
(A)
* Pheno (0.8) Pheno (0.2)
475 St. Petersburg,
Florida
3-1-73 Yes 0215 35 M S No 0.258 --- * (A) (A)
476 Washington, ASAP 2-28-73 No 1502 * M * * 0.013 -+o (N,A) (A) (A)
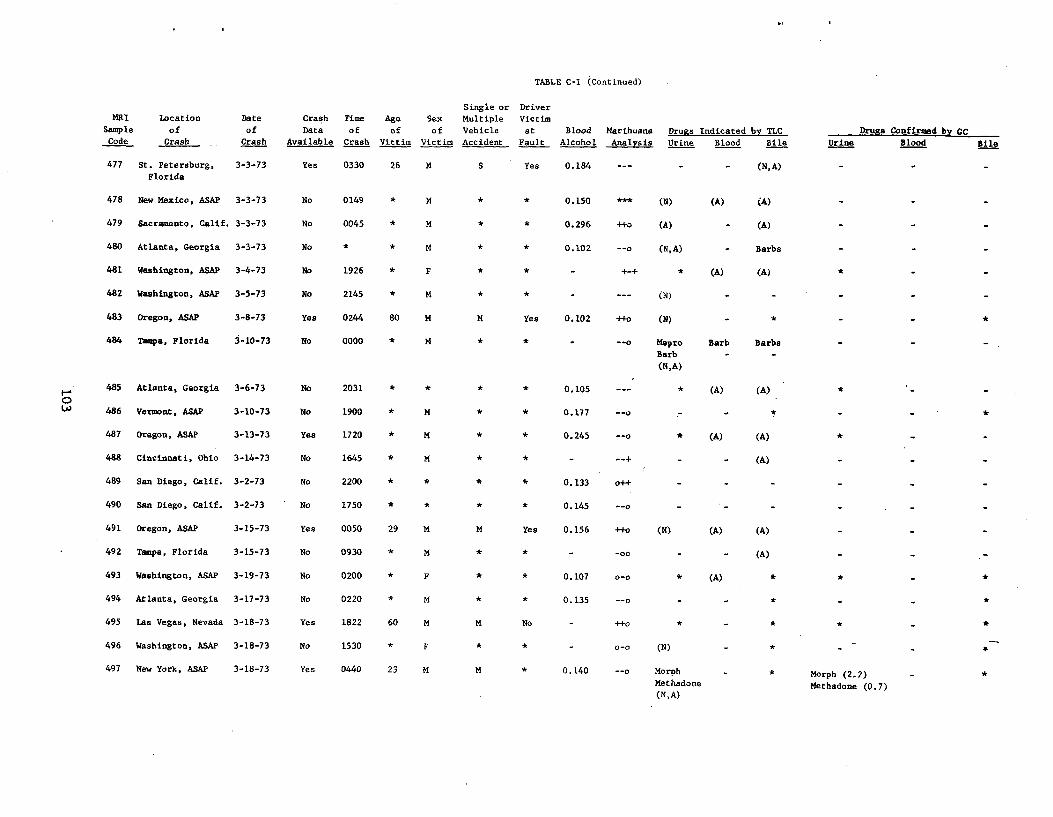
TABLE C-I (Continued)
Single or Driver MRI Location Date Crash Time Age Sex Multiple Victim
Sample of of Data of of of Vehicle at Blood Marihuana Drugs Indicated by TLC Drugs Confirmed by GC Code Crash Crash Available Crash Victim Victim Accident Fault Alcohol Analysis Urine Blood Bile Urine Blood Bile
477 St. Petersburg,
Florida
3-3-73 Yes 0330 26 M S Yes 0.184 (N, A)
478 New Mexico, ASAP 3-3-73 No 0149 * M * * 0.150 *** (N) (A) (A) -
479 Sacramento, Calif. 3-3-73 No 0045 * M * * 0.296 +t0 (A) - (A) -
480 Atlanta, Georgia 3-3-73 No * * M * * 0.102 --o (N,A) - Barbs -
481 Washington, ASAP 3-4-73 No 1926 * F * * - +-+ * (A) (A)
482 Washington, ASAP 3-5-73 No 2145 * M * * - --- (N) - - -
483 Oregon, ASAP 3-8-73 Yes 0244 80 M M Yes 0.102 +fo (N) - * - *
484 Tampa, Florida 3-10-73 No 0000 * M * * - --o Mepro
Barb
(N,A)
Barb
-
Barbs
-
-
485 Atlanta, Georgia 3-6-73 No 2031 * * * * 0.105 --- * (A) (A) *
486 Vermont, ASAP 3-10-73 No 1900 * M * * 0.177 --o - * -
487 Oregon, ASAP 3-13-73 Yes 1720 * M * * 0.245 --o * (A) (A)
488 Cincinnati, Ohio 3-14-73 No 1645 * M * * - --+ - - (A)
489 San Diego, Calif. 3-2-73 No 2200 * * * * 0.133 0++ - - -
490 San Diego, Calif. 3-2-73 No 1750 * * * * 0.145 --o - - -
491 Oregon, ASAP 3-15-73 Yes 0050 29 M M Yes 0.156 ++o (N) (A) (A)
492 Tampa, Florida 3-15-73 No 0930 * M -00 (A) - - -
493 Washington, ASAP 3-19-73 No 0200 * F * * 0.107 0-0 * (A) * * - *
494 Atlanta, Georgia 3-17-73 No 0220 * M * * 0.135 --o - - * - - *
495 Las Vegas, Nevada 3-18-73 Yes 1822 60 M M No - ++o * - * * - *
496 Washington, ASAP 3-18-73 No 1530 * F * * - 0-0 (N) - * - - -+
497 New York, ASAP 3-18-73 Yes 0440 23 M M * 0.140 --o Morph
Methadone
(N,A)
- * Morph (2.2)
Methadone (0.7)
- *
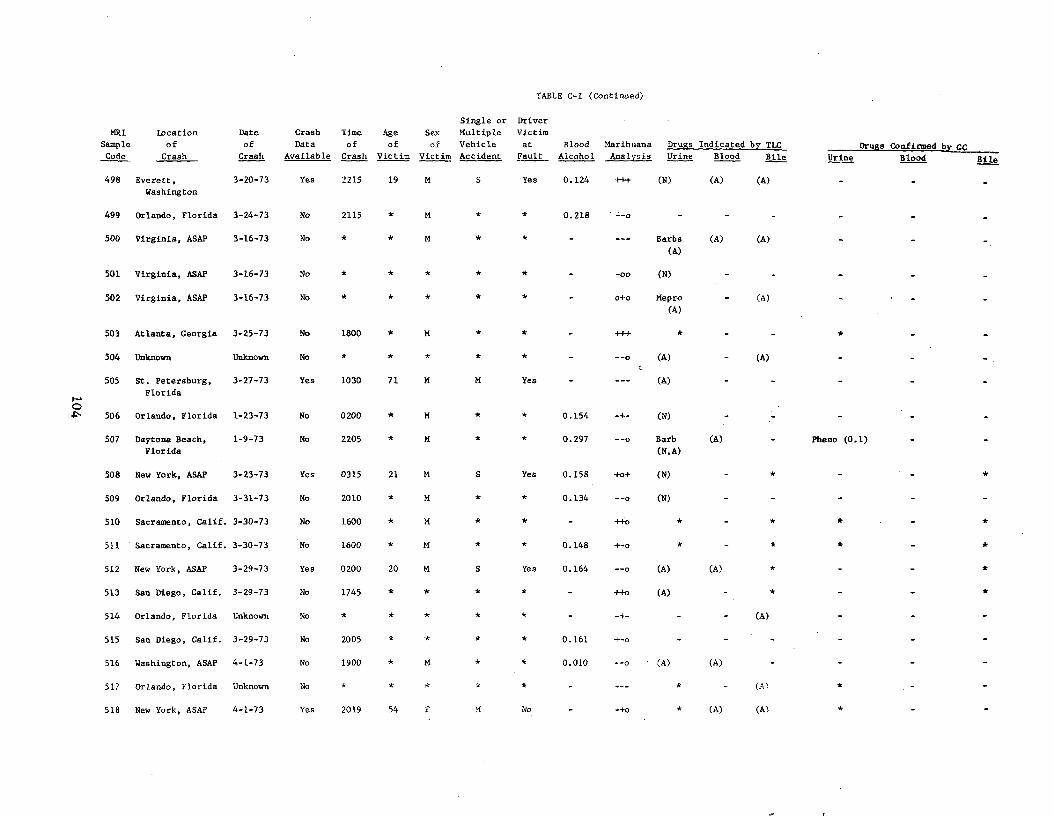
TABLE C-I (Continued)
MRI
Sample
Code
Location
of
Crash
Date
of
Crash
Crash
Data
Available
Time
of
Crash
Age
of
Victim
Sex
of
Victim
Si le orng
Multiple
Vehicle
Accident
D iverr
Victim
at
Fault
Blood
Alcohol
Marihuana
Analysis
Drugs Indicated by TLC
Urine Blood Bile Urine
Drugs Confirmed by cC Blood Bile
498 Everett,
Washington
3-20-73 Yes 2215 19 M S Yes 0.124 +++ (N) (A) (A)
499 Orlando, Florida 3-24-73 No 2115 * M * * 0.218 =-o
500 Virginia, ASAP 3-16-73 No * * M Barbs
(A)
(A) (A)
501 Virginia, ASAP 3-16-73 No -00 (N)
502 Virginia, ASAP 3-16-73 No o+o Mepro
(A) - (A)
503 Atlanta, Georgia 3-25-73 No 1800 * M * * - +++ *
F0 4
504
505
506
Unknown
St. Petersburg,
Florida
Orlando, Florida
Unknown
3-27-73
1-23-73
No
Yes
No
*
1030
0200
*
71
*
*
M
M
*
M
*
*
Yes
*
-
-
0.154
--o
-+
---
c (A)
(A)
(N)
(A)
507 Daytona Beach,
Florida
1-9-73 No 2205 * M * * 0.297 --o Barb
(N, A)
(A) Pheno (0.1)
508 New York, ASAP 3-23-73 Yes 0315 21 N S Yes 0.158 +o+ (N) - * - -
509 Orlando, Florida 3-31-73 No 2010 * M * * 0.134 (N)
510 Sacramento, Calif. 3-30-73 No 1600 * M * * - ++o * - * * -
511 Sacramento, Calif. 3-30-73 No 1600 * M * * 0.148 +-o *
512 New York, ASAP 3-29-73 Yes 0200 20 M S Yes 0.164 --o (A) (A) *
513 San Diego, Calif. 3-29-73 No 1745 * * * * - ++o (A) *
514 Orlando, Florida Unknown No * * * * * - -+ - - (A)
515 San Diego, Calif. 3-29-73 No 2005 * * * * 0.161 +-o -
516 Washington, ASAP 4-1-73 No 1900 * M * * 0.010 --o (A) (A)
517 Orlando, Florida Unknown No (A)
518 New York, ASAP 4-1-73 Yes 2019 54 F M No - -+o * (A) (A)
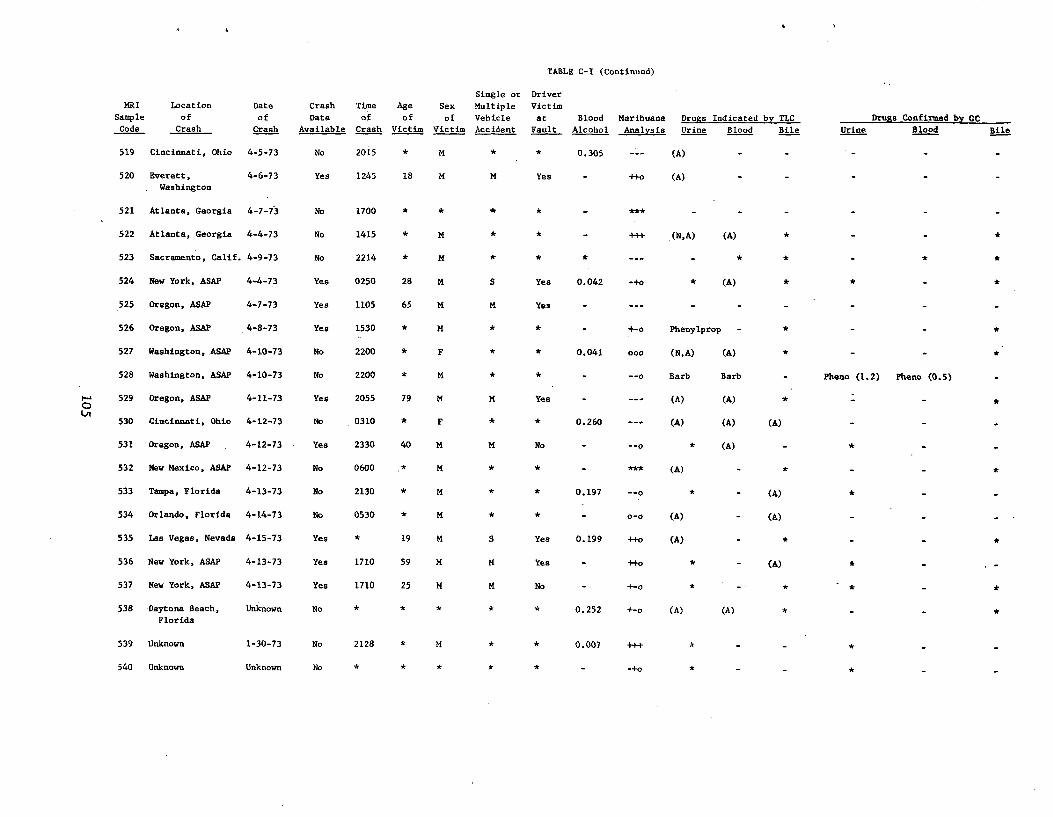
TABLE C-I (Continued)
Single or Driver
MRI Location Date Crash Time Age Sex Multiple Victim
Sample of of Data of of of Vehicle at Blood Marihuana Drugs Indicated by TLC Drugs Confirmed by GC Code Crash Crash Available Crash Victim Victim Accident Fault Alcohol Analysis Urine Blood Bile Urine Blood Bile
519 Cincinnati, Ohio 4-5-73 No 2015 * M * * 0.305 --- (A)
520 Everett, 4-6-73 Yes 1245 18 M M Yes ++o (A) . Washington
521 Atlanta, Georgia 4-7-73 No 1700 * * * * ***
522 Atlanta, Georgia 4-4-73 No 1415 * * - +++ (N,A) (A) *
523 Sacramento, Calif. 4-9-73 No 2214 * M * * * --- - * * *
524 New York, ASAP 4-4-73 Yes 0250 28 M S Yes 0.042 -+0 * (A)
525 Oregon, ASAP 4-7-73 Yes 1105 65 M M Yes - --- - - -
526 Oregon, ASAP 4-8-73 Yes 1530 * M * * - +-o Phenylprop -
527 Washington, ASAP 4-10-73 No 2200 * F * * 0.041 000 (N,A) (A)
528 Washington, ASAP 4-10-73 No 2200 * M * * - --o Barb Barb - Pheno (1.2) Pheno (0.5)
O 529 Oregon, ASAP 4-11-73 Yes 2055 79 M M Yes (A) (A) * Ln
530 Cincinnati, Ohio 4-12-73 No 0310 * F * * 0.260 --- (A) (A) (A)
531 Oregon, ASAP 4-12-73 Yea 2330 40 M M No - --o * (A) - *
532 New Mexico, ASAP 4-12-73 No 0600 * M * * - *** (A) - *
533 Tampa, Florida 4-13-73 No 2130 * M * * 0.197 --o * - (A)
534 Orlando, Florida 4-14-73 No 0530 * M * * - 0-0 (A) (A)
535 Las Vegas, Nevada 4-15-73 Yes * 19 M S Yes 0.199 ++0 (A) * *
536 New York, ASAP 4-13-73 Yes 1710 59 M M Yes - ++o * - (A) * - -
537 New York, ASAP 4-13-73 Yes 1710 25 M M No - +-o * - * - * - *
538 Daytona Beach, Unknown No * * * * * 0.252 +-o (A) (A) * - - * Florida
539 Unknown 1-30-73 No 2128 * M * * 0.007 +++ * -
540 Unknown Unknown No * * * * * - _.+0 * _ - * - -
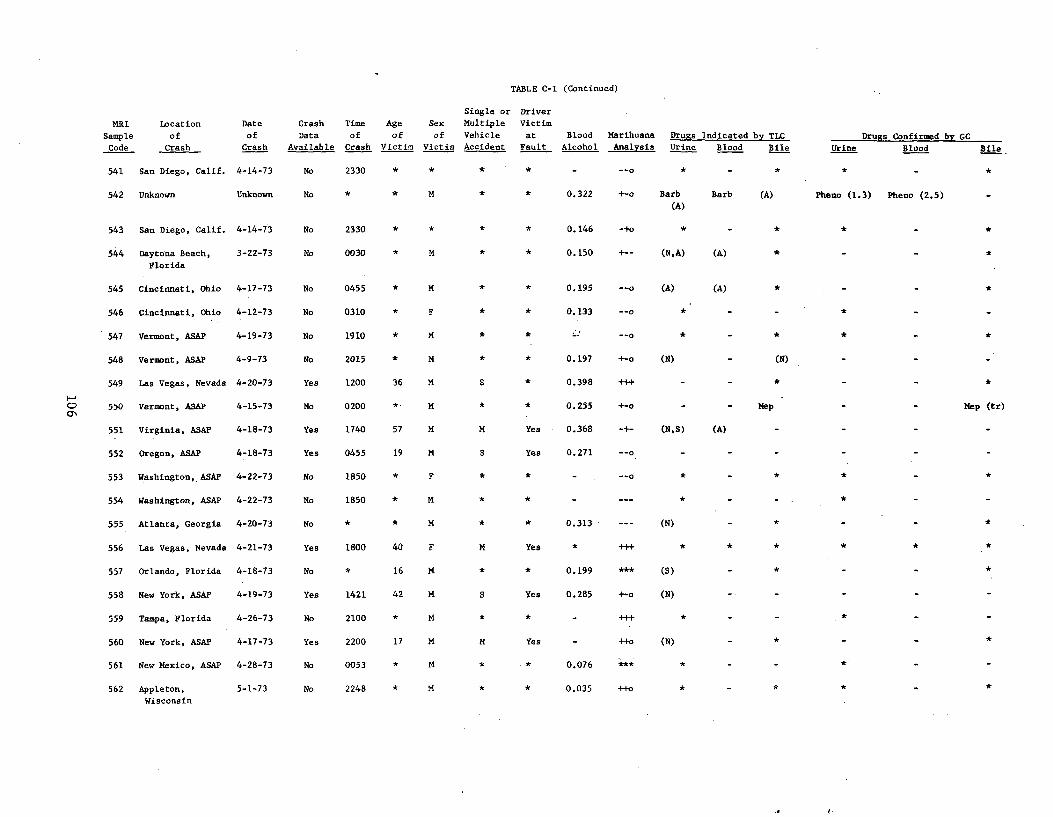
TABLE C-I (Continued)
Single or Driver
MRI Location Date Crash Time Age Sex Multiple Victim
Sample of of Data of of of Vehicle at Blood Marihuana Drugs Indicated by TLC Drugs Confirmed by GC
Code Crash Crash Available Crash Victim Victim Accident Fault Alcohol Analysis Urine Blood Bile Urine Blood Bile
541 San Diego, Calif. 4-14-73 No 2330 * * * * - --o * - * * *
542 Unknown Unknown No * * M * * 0.322 +-o Barb Barb (A) Pheno (1.3) Pheno (2.5) (A)
543 San Diego, Calif. 4-14-73 No 2330 * * * * 0.146 -+o * - * * - *
544 Daytona Beach, 3-22-73 No 0030 * M * * 0.150 +- (N, A) (A) *
Florida
545 Cincinnati, Ohio 4-17-73 No 0455 * M * * 0.195 --o (A) (A) *
546 Cincinnati, Ohio 4-12-73 No 0310 * F * * 0.133 --o * - - *
547 Vermont, ASAP 4-19-73 No 1910 * M * * __p * _ *
548 Vermont, ASAP 4-9-73 No 2015 M * * 0.197 +-o (N) - (N)
549 Las Vegas, Nevada 4-20-73 Yes 1200 36 M S * 0.398 +++ - - *
550 Vermont, ASAP 4-15-73 No 0200 * M * * 0.255 +-o - - Mep Mep (tr)
551 Virginia, ASAP 4-18-73 Yes 1740 57 M M Yes 0.368 -+ (N,S) (A) -
552 Oregon, ASAP 4-18-73 Yes 0455 19 M S Yes 0.271 --o - - -
553 Washington, ASAP 4-22-73 No 1850 * F * * * *
554 Washington, ASAP 4-22-73 No 1850 * M *
555 Atlanta, Georgia 4-20-73 No * * M * * 0.313 --- (N) - * - -
556 Las Vegas, Nevada 4-21-73 Yes 1800 40 F M Yes * +++
557 Orlando, Florida 4-18-73 No * 16 M * * 0.199 *** (S) - * - -
558 New York, ASAP 4-19-73 Yes 1421 42 M S Yes 0.285 +-o (N) - - - -
559 Tampa, Florida 4-26-73 No 2100 * M *
560 New York, ASAP 4-17-73 Yes 2200 17 M M Yes - ++o (N) - * - -
561 New Mexico, ASAP 4-28-73 No 0053 0.076 *** * - -
562 Appleton, 5-1-73 No 2248 M * 0.035 ++o * - *
Wisconsin
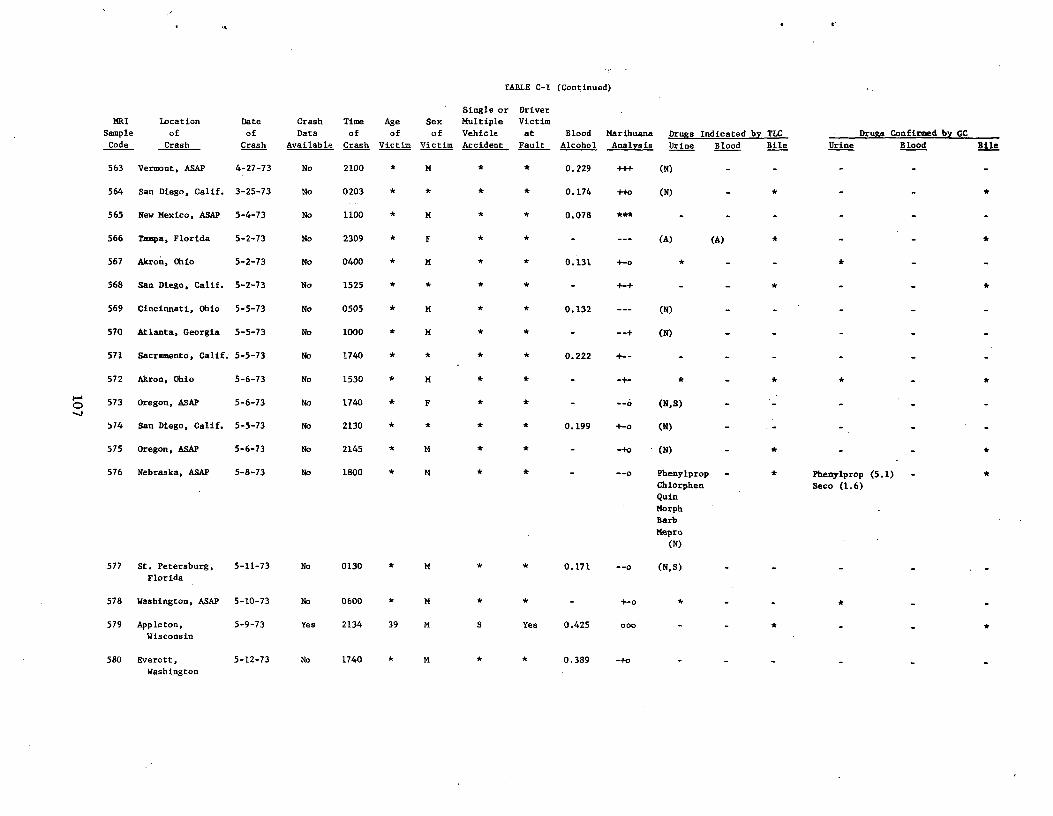
TABLE C-I (Continued)
Single or Driver
MRI Location Date Crash Time Age Sex Multiple Victim
Sample of of Data of of of Vehicle at Blood Marihuana Drugs Indicated by TLC Drugs Confirmed by GC
Code Crash Crash Available Crash Victim Victim Accident Fault Alcohol Analysis Urine Blood Bile Urine Blood Bile
563 Vermont, ASAP 4-27-73 No 2100 * M * * 0.229 +++ (N) - - - - -
564 San Diego, Calif. 3-25-73 No 0203 * * * * 0.174 ++o (N) - * - -
565 New Mexico, ASAP 5-4-73 No 1100 * M * * 0.078 *** - - -
566 Tampa, Florida 5-2-73 No 2309 * F * * - --- (A) (A)
567 Akron, Ohio 5-2-73 No 0400 * M * * 0.131 +-o * - - *
568 San Diego, Calif. 5-2-73 No 1525 * * * * - +-+ - - * - - *
569 Cincinnati, Ohio 5-5-73 No 0505 * M * * 0.132 --- (N) - - - - -
570 Atlanta, Georgia 5-5-73 No 1000 * M * * - --+ (N) - - - - -
571 Sacramento, Calif. 5-5-73 No 1740 * * * * 0.222 +-
572 Akron, Ohio 5-6-73 No 1530 * M * * - -+ * - * * *
573 Oregon, ASAP 5-6-73 No 1740 * F * * - --o (N,S)
574 San Diego, Calif. 5-5-73 No 2130 * * * * 0.199 +-o (N)
575 Oregon, ASAP 5-6-73 No 2145 * M * * - -+o (N) - *
576 Nebraska, ASAP 5-8-73 No 1800 * M * * - --o Phenylprop
Chlorphen
Quin
Morph
Barb
Mepro(N)
- * Phenylprop (5.1)
Seco (1.6)
- *
577 St. Petersburg,
Florida
5-11-73 No 0130 * M * * 0.171 --o (N,S)
578 Washington, ASAP 5-10-73 No 0600 * M * - +-o * *
579 Appleton,
Wisconsin
5-9-73 Yes 2134 39 M S Yea 0.425 ono - - * - - *
580 Everett,
Washington
5-12-73 No 1740 * M * * 0.389 -+o
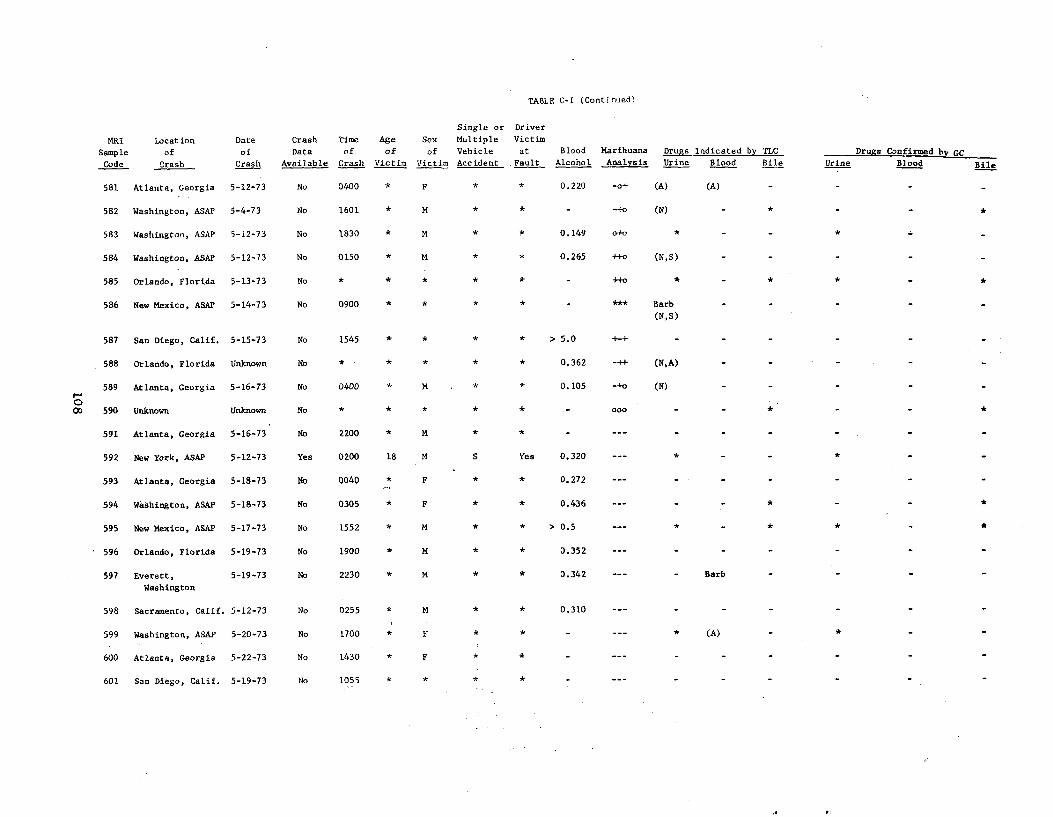
TABLE C-I (Continued)
Single or Driver
MRI Location Date Crash Time Age Sex Multiple Victim
Sample of of Data of of of Vehicle at Blood Marihuana Drugs Indicated by TLC Drugs Confirmed b GC Code Crash Crash Available Crash Victim Victim Accident Fault Alcohol Analysis Urine Blood Bile Urine Blood Bile
581 Atlanta, Georgia 5-12-73 No 0400 * F * 0.220 -o+ (A) (A)
582 Washington, ASAP 5-4-73 No 1601 * M * * - -+0 (N) * *
583 Washington, ASAP 5-12-73 No 1830 * M * * 0.149 0+0 *
584 Washington, ASAP 5-12-73 No 0150 * M * * 0.265 ++o (N,S)
585 Orlando, Florida 5-13-73 No * * * * * - ++0 * * *
586 New Mexico, ASAP 5-14-73 No 0900 * * * * - *** Barb
(N,S)
587 San Diego, Calif. 5-15-73 No 1545 * * * * > 5.0 +-+ -
588 Orlando, Florida Unknown No * * * * * 0.362 -++ (N,A)
589 Atlanta, Georgia 5-16-73 No 0400 * M * * 0.105 -+o (N)
O 00 590 Unknown Unknown No * * * * * 000 *
591 Atlanta, Georgia 5-16-73 No 2200 * M * * - --- - - - -
592 New York, ASAP 5-12-73 Yes 0200 18 M S Yes 0.320 --- * - -
593 Atlanta, Georgia 5-18-73 No 0040 * F * * 0.272 --- - - - -
594 Washington, ASAP 5-18-73 No 0305 * F * * 0.436 --- - - * - *
595 New Mexico, ASAP 5-17-73 No 1552 * M * * > 0.5 --- * - *
596 Orlando, Florida 5-19-73 No 1900 * M * * 0.352 --- - - - -
597 Everett, 5-19-73 No 2230 * M * * 0.342 --- - Barb - -
Washington
598 Sacramento, Calif. 5-12-73 No 0255 * M * * 0.310
599 Washington, ASAP 5-20-73 No 1700 * F * * - (A) *
600 Atlanta, Georgia 5-22-73 No 1430 * F * * -
601 San Diego, Calif. 5-19-73 No 1055 * * * * -
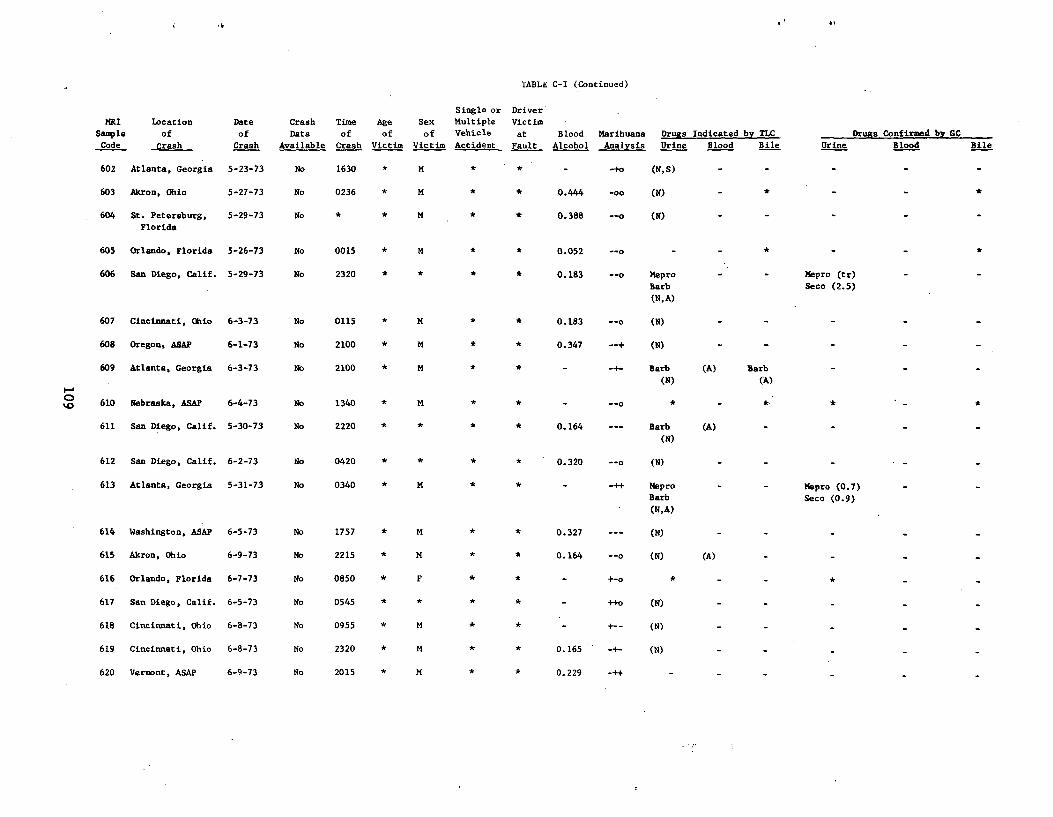
Mt
TABLE C-I (Continued)
MRI location Date Crash Time Age
Single or Driver
Sex Multiple Victim
Sample of of Data of of of Vehicle at Blood Marihuana Drugs Indicated by TLC Drugs Confirmed by GC
Code Crash Crash Available Crash Victim Victim Accident Fault Alcohol Analysis Urine Blood Bile Urine Blood Bile
602 Atlanta, Georgia 5-23-73 No 1630 * M * * - -+o (N,S) - - - - -
603 Akron, Ohio 5-27-73 No 0236 * M * * 0.444 -oo (N) - * - -
604, St. Petersburg, 5-29-73 No * * M * * 0.388 --0 (N) - - - - -Florida
605 Orlando, Florida 5-26-73 No 0015 * M * * 0.052 --o - - * - -
606 San Diego, Calif. 5-29-73 No 2320 * * * * 0.183 --o Mepro - - Mepro (tr)
Barb Seco (2.5)
(N,A)
607 Cincinnati, Ohio 6-3-73 No 0115 * M * * 0.183 --o (N)
608 Oregon, ASAP 6-1-73 No 2100 * M * * 0.347 --+ (N)
609 Atlanta, Georgia 6-3-73 No 2100 * M * * - -+- Barb (A) Barb
(N) (A)
610 Nebraska, ASAP 6-4-73 No 1340 * M * * - --o * - *
611 San Diego, Calif. 5-30-73 No 2220 * * 0.164 --- Barb (A)
(N)
612 San Diego, Calif. 6-2-73 No 0420 * * * * 0.320 --o (N)
613 Atlanta, Georgia 5-31-73 No 0340 * M * * - -++ Mepro - - Mepro (0.7)Barb Seco (0.9)
(N,A)
614 Washington, ASAP 6-5-73 No 1757 * M * * 0.327 (N)
615 Akron, Ohio 6-9-73 No 2215 * M * * 0.164 --o (N) (A)
616 Orlando, Florida 6-7-73 No 0850 * F * * - +-o
617 San Diego, Calif. 6-5-73 No 0545 * * * * - ++o (N)
618 Cincinnati, Ohio 6-8-73 No 0955 * M * * - +-- (N)
619 Cincinnati, Ohio 6-8-73 No 2320 * N * * 0.165 -+- (N)
620 Vermont, ASAP 6-9-73 No 2015 * M * * 0.229 -++ -
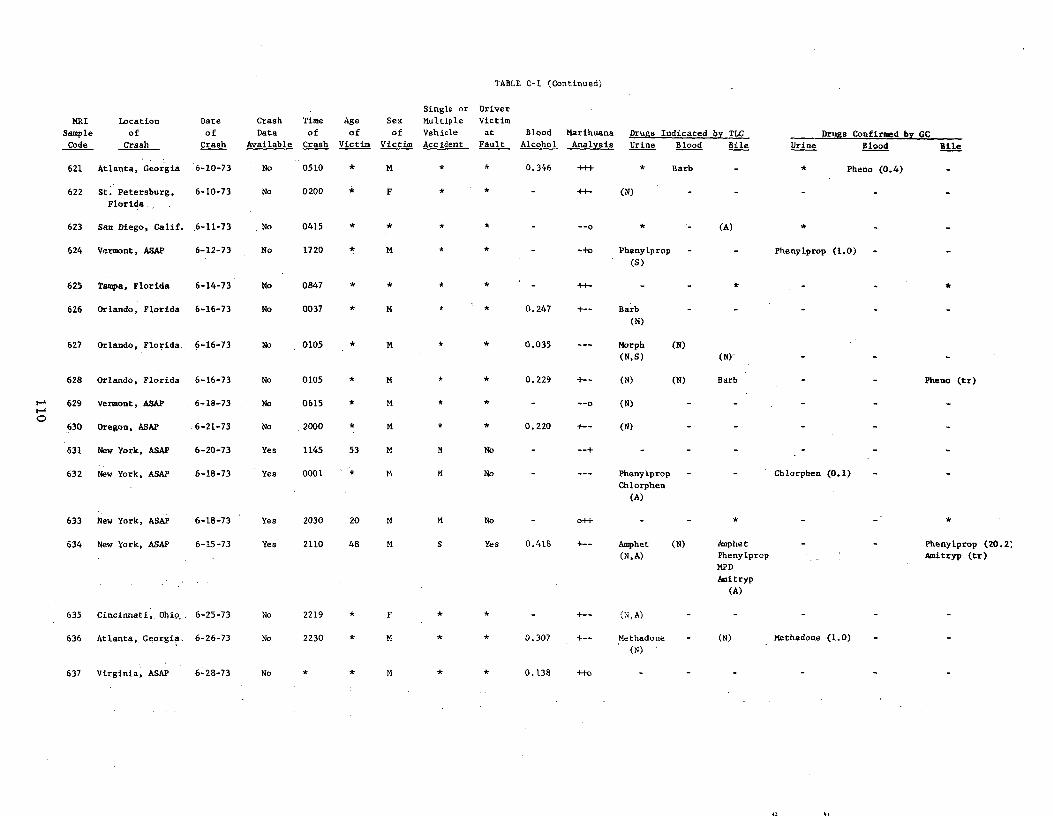
TABLE C-I (Continued)
MRI
Sample
Code
Location
of
Crash
Date
of
Crash
Crash
Data
Available
Time
of
Crash
Age
of
Victim
Sex
of
Victim
Single or
Multiple
Vehicle
Accident
Driver
Victim
at
Fault
Blood
Alcohol
Marihuana
Analysis
Drugs Indicated by TLC
Urine Blood Bile Urine
Drugs Confirmed by GC
Blood Bile
621 Atlanta, Georgia 6-10-73 No 0510 * M * * 0.346 .. * Barb - * Pheno (0.4)
622 St. Petersburg, Florida
6-10-73 No 0200 * F ++ (N)
623 San Diego, Calif. 6-11-73 No 0415 --0 * - (A) *
624 Vermont, ASAP 6-12-73 No 1720 * M * * - -+o Phenylprop
(S)
- - Phenylprop (1.0) -
625 Tampa, Florida 6-14-73 No 0847 * ++ *
626 Orlando, Florida 6-16-73 No 0037 * M * * 0.247 +- Barb
(N)
627 Orlando, Florida, 6-16-73 No 0105 * M * * 0.035 --- Morph
(N,S)
(N)
(N)'
628 Orlando, Florida 6-16-73 No 0105 * M * * 0.229 +- (N) (N) Barb Pheno (tr)
629 Vermont, ASAP 6-18-73 No 0615 * M * * - --o (N) - -
630 Oregon, ASAP 6-21-73 No .2000 * M * * 0.220 +- (N) - -
631 New York, ASAP 6-20-73 Yes 1145 53 M M No - --+ - - -
632 New York, ASAP 6-18-73 Yes 0001 * M M No - --- Phenylprop
Chlorphen
(A)
Chlorphen (0.1)
633 New York, ASAP 6-18-73 Yes 2030 20 M M No o++
634 New York, ASAP 6-15-73 Yes 2110 48 M S Yes 0.418 +-- Amphet
(N,A)
(N) Amphet
Phenylprop
MPD
Amitryp
(A)
Phenylprop (20.2;
Amitryp (tr)
35 incinnati, Ohio.. -25-73 o 219 * F )
636 Atlanta, Georgia. 6-26-73 No 2230 * M * * 0.307 +- Methadone
(N)
- (N) Methadone (1.0)
637 Virginia, ASAP 6-28-73 No * * M * * 0.138 ++o
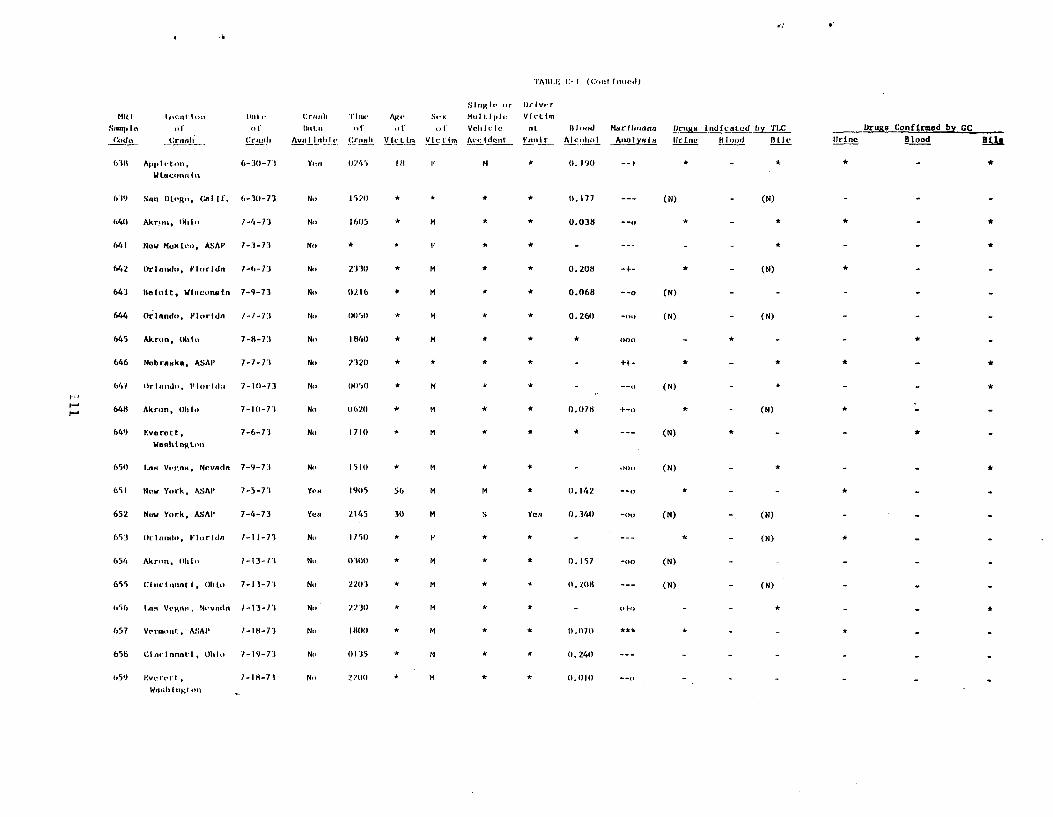
•i
•)'AIII.N, C-I ((:.,I hosed)
Slnµlr or Ilr Ivor
MI(I Inc'.nt Ion IkUo Crnnh 'I'Inx• AP.,- Sex Mu l((ple Victim
Snmp Iv of of Inttn of of of Vehicle nt Is lood Marihuana Oruga Indicated by TLC Drugs Confirmed by CC
Coda Crnah Crnnh AvnIIit Crnah Vlrtfm Vlct(m Accident Inuit Alcohol Ana)yala !!incUrIs lood BIIe Urine Blood Bile
638 Appleton, 6-:10-73 Yen (1745 I8 I M * 0.190
Wtacunnlo
679 San Diego' Calif. 6-30-73 No 157(1 * * * * 0.177 --- (N) - (N)
640 Akron, (Nil,, 7-4-73 No 16(15 * M * * 0.038 --o * - * *
1,41 Now Moxlco, ASAP 7-3-73 No * * ) * * - --- - -
642 Orlando, Florldn 7-6-73 No •1330 * M * * 0.208 -+ * - (N) *
643 Beloit, WI,,conain 7-9-73 Nt' 0216 * M * * 0.068 --o (N) - - -
644 O lando, Florldn 1-7-73 No (105(1 * M * * 0.260 -on (N) - (N) -
645 Akron, Ohto 7-8-11 No 1840 * M * * * 000 - * - - *
646 Nebraska, ASAI' 7-7-73 No 232(1 * * * * - ++ * - * *
641 Orland,,, F(orld:, 7-10-73 No ()1150 * M * (N) - * - - *
648 Akron, 01,10 7-10-73 No 067(1 * M * * 0.078 +-0 * - (N) *
649 F.vorott, 7-6-73 Ni. 171(1 * M (N)
Wnnhtnglun
650 Lnn Vegan, Ncvndn 7-9-73 No 1510 * M * * - 000 (N) - *
651 New York, ASAI' 7-5-73 Yen 19(15 56 M M * 0.142 --o * - - *
652 New York, ASAI' 7-4-73 Yea 2145 30 M S Yen 0.340 -oo (N) (N) -
653 Orlando, Florida 1-11-73 No 1750 * F * * - --- * - (N) *
654 Akron, Ohio 7-13-71 Ni' (1101 * M * * 0.157 -00 (N) - - -
655 CinctnnatI, Ohl,. 7-13-73 No 2203 * M * * (1,208 --- (N) - (N) -
656 Inn Vegan, Nevado 1-13-7.1 No 7230 M * * - ofo * *
657 Vermont, ASAP 7-18-73 No 18(11) * M * * 0.070 *** *
656 Cinvinnntl, Ohl,. 7-19-73 Ni (1135 * M * * (1.240 ---
659 6vercrl , 1-18-77. No 210(1 * M * * (1.1110 --o
W1,111 higi oil -
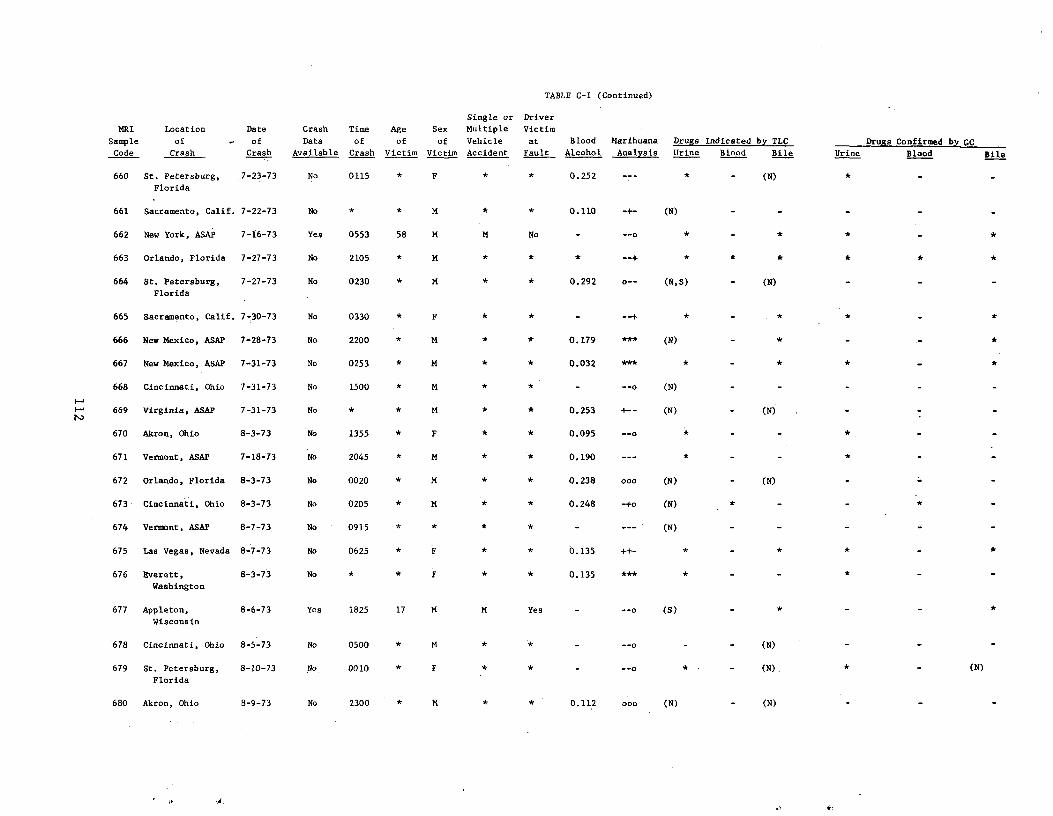
TABLE C-I (Continued)
Single or Driver
MRI Location Date Crash Time Age Sex Multiple Victim
Sample of - of Data of of of Vehicle at Blood Marihuana Drugs Indicated by TLC Drugs Confirmed by CC
Code Crash Crash Available Crash Victim Victim Accident Fault_ Alcohol Analysis Urine Blood Bile Urine Blood Bile
660 St. Petersburg, 7-23-73 No 0115 * F * * 0.252 -- * - (N) *
Florida
661 Sacramento, Calif. 7-22-73 No * * M * 0.110 -+ (N)
662 New York, ASAP 7-16-73 Yes 0553 58 M M No - --o * - * * *
663 Orlando, Florida 7-27-73 No 2105 M * * * * *
664 St. Petersburg, 7-27-73 No 0230 * M * * 0.292 o- (N,S) - (N)
Florida
665 Sacramento, Calif. 7-30-73 No 0330 F * * * *
666 New Mexico, ASAP 7-28-73 No 2200 * M 0.179 *** (N) * *
667 New Mexico, ASAP 7-31-73 No 0253 * M * * 0.032 *** * - *
668 Cincinnati, Ohio 7-31-73 No 1500 * M * - --o (N)
669 Virginia, ASAP 7-31-73 No M * * 0.253 +- (N) (N)
670 Akron, Ohio 8-3-73 No 1355 * F * * 0.095 --o
671 Vermont, ASAP 7-18=73 No 2045 M * 0.190 --- * *
672 Orlando, Florida 8-3-73 No 0020 * M 0.238 000 (N) (N)
673 Cincinnati, Ohio 8-3-73 No 0205 * M * 0.248 -+o (N) * - *
674 Vermont, ASAP 8-7-73 No 0915 * * * * - --- (N) - -
675 Las Vegas, Nevada 8-7-73 No 0625 * * 0.135 ++ * - *
676 Everett,
Washington
8-3-73 No * * F * * 0.135 *** * - - *
677 Appleton,
Wisconsin
8-6-73 Yes 1825 17 M M Yes - --o (S) - *
678 Cincinnati, Ohio 8-5-73 No 0500 * M * * - --0 - (N)
679 St. Petersburg,
Florida
8-10-73 No 0010 * F (N) * (N)
680 Akron, Ohio 8-9-73 No 2300 * N * * 0.112 000 (N) (N)
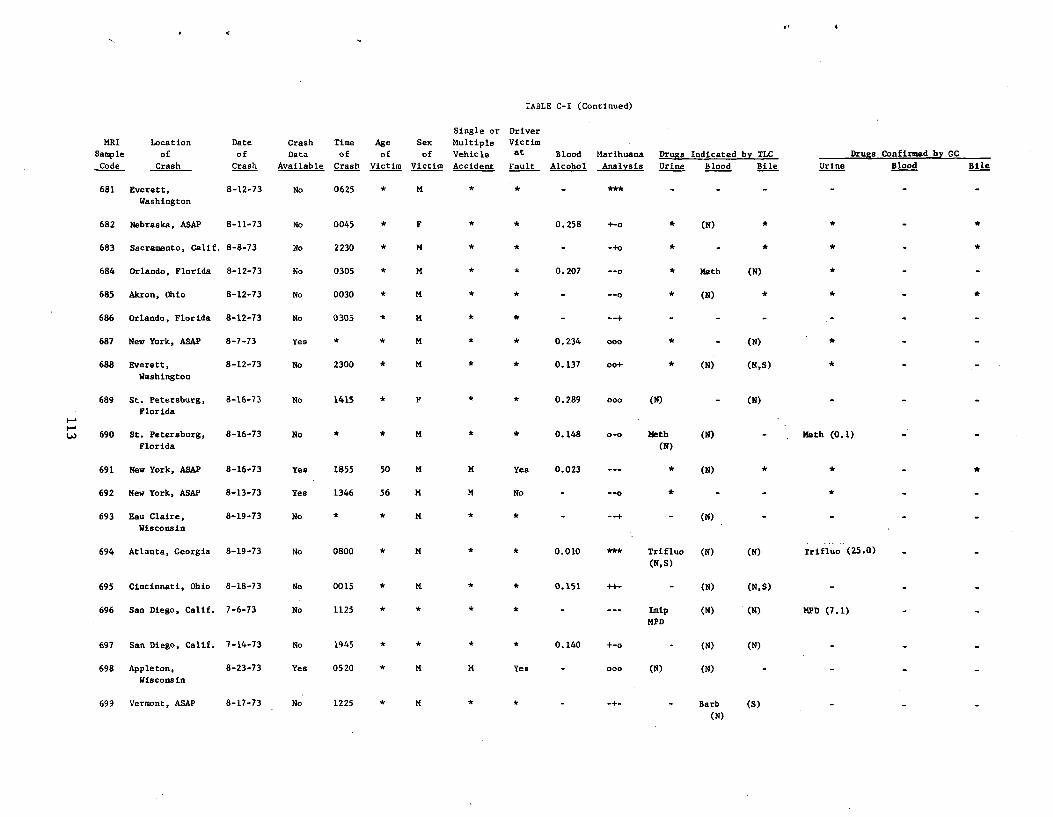
TABLE C-I (Continued)
MRI
Sample
Code
Location
of
Crash
Date
of
Crash
Crash
Data
Available
Time
of
Crash
Age
of
Victim
Sex
of
Victim
Single or
Multiple
Vehicle
Accident
Driver
Victim
at
Fault
Blood
Alcohol
Marihuana
Analysis
Drugs Indicated by TLC
Urine Blood Bile Urine
Drugs Confirmed by GC
Blood Bile
681 Everett,
Washington
8-12-73 No 0625 * M ***
682 Nebraska, ASAP 8-11-73 No 0045 * F * 0.258 +-o * (N) *
683 Sacramento, Calif. 8-8-73 No 2230 * M * * - -+o * - * * -
684 Orlando, Florida 8-12-73 No 0305 * M * * 0.207 --o * Meth (N)
685 Akron, Ohio 8-12-73 No 0030 * M * * - --o * (N) *
686 Orlando, Florida 8-12-73 No 0305 * M * * - --+ - -
687 New York, ASAP 8-7-73 Yes * * M * * 0.234 000 * - (N) *
688 Everett,
Washington
8-12-73 No 2300 * M * * 0.137 oo+ * (N) (N,S)
689 St. Petersburg,
Florida
8-16-73 No 1415 * F * * 0.289 000 (N) - (N)
690 St. Petersburg,
Florida
8-16-73 No * * M * * 0.148 0-0 Meth
(N)
(N) - Meth (0.1)
691 New York, ASAP 8-16-73 Yes 1855 50 M M Yea 0.023 --- * (N) *
692 New York, ASAP 8-13-73 Yes 1346 56 M M No
693 Eau Claire,
Wisconsin
8-19-73 No * * M (N)
694 Atlanta, Georgia 8-19-73 No 0800 * M 0.010 *** Trifluo
(N,S)
(N) (N) Trifluo (25.0)
695 Cincinnati, Ohio 8-18-73 No 0015 * K * * 0.151 ++ (N) (N,S)
696 San Diego, Calif. 7-6-73 No 1125 Imip
MPD
(N) (N) MPD (7.1)
697 San Diego, Calif. 7-14-73 No 1945 * * * * 0.140 +-o - (N) (N)
698 Appleton,
Wisconsin
8-23-73 Yes 0520 * M M Yes - 000 (N) (N)
699 Vermont, ASAP 8-17-73 No 1225 * M * * - -+ - Barb
(N)
(S)
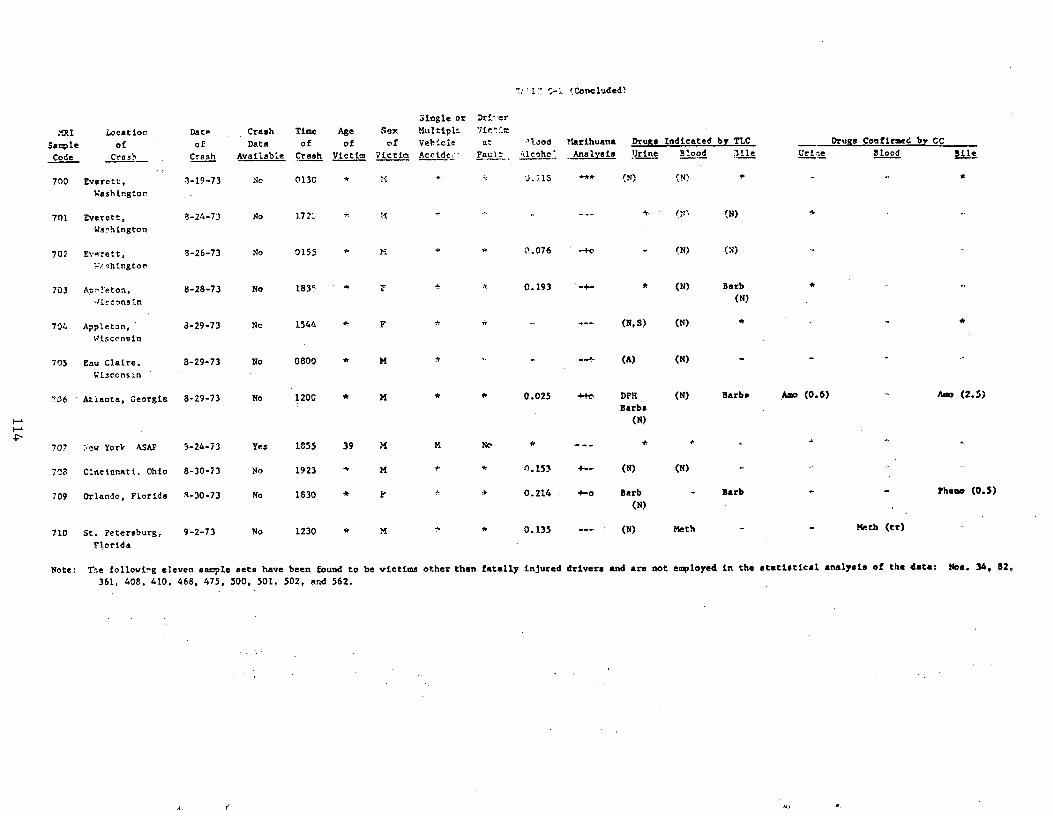
`.1 'Concluded)
Single or Dri•er
n- I Location Date Crash Time Age Sex Multiple 7t'r
Sample of of Data of of of Vehicle at 'loom Marihuana Drugs Indicated by TLC Drugs Confirmed by CC
Code Crash Crash Available Crash Victim Victim Accide__ Fault ^kicoho_. Analysis Urine Blood 3ile Urine Blood Bile
* 700 Everett, 3-19-73 No 0130 * ; J..'•.15 '** ;N) °, N)
Washington
701 Everett. 3-24-73 No 172;; iN) a
Washington
702 Everett, 8-26-73 No 0155 M * 0.076 - M - (N) (N)
eshington
703 A.:;-•!eton, 8-28-73 No 183' * 7 •• 4 0.193 -+- * (N) Barb
Jirconsin (N)
704 Appleton,' 3-29-73 No 1544 * F * - --- (NI S) (N)
Wisconsin
705 Eau Claire. 8-29-73 No 0800 * M * - --+ (A) (N)
Wisconsin
706 Atlanta, Georgia 8-29-73 No 120C * M * * 0.025 ++o DPH (N) Barbs Amo (0.6) Am (2.5)Barbs
(N)
707 >ew York ASAP 3-24-73 Yes 1855 39 M M No * - -
708 Cincinnati. Ohio 8-30-73 No 1923 * M 0.153 4-- (N) (N)
709 Orlando, Florida 4-30-73 No 1830 * Y a 0.214 +-o Barb - Barb lheoa (0.5) (N)
710 St. Petersburg, 9-2-73 No 1230 * *S * 0.135 --- (N) Meth Meth (tr)
Florida
Note: The following eleven sample sets have been found to be victims other than. fatally injured drivers and are not employed in the statistical analysis of the data. Nos. 34. 82,
361, 408, 410. 468, 475, 500, 501. 502, rind 562.
APPENDIX D
STATISTICAL ANALYSIS
115
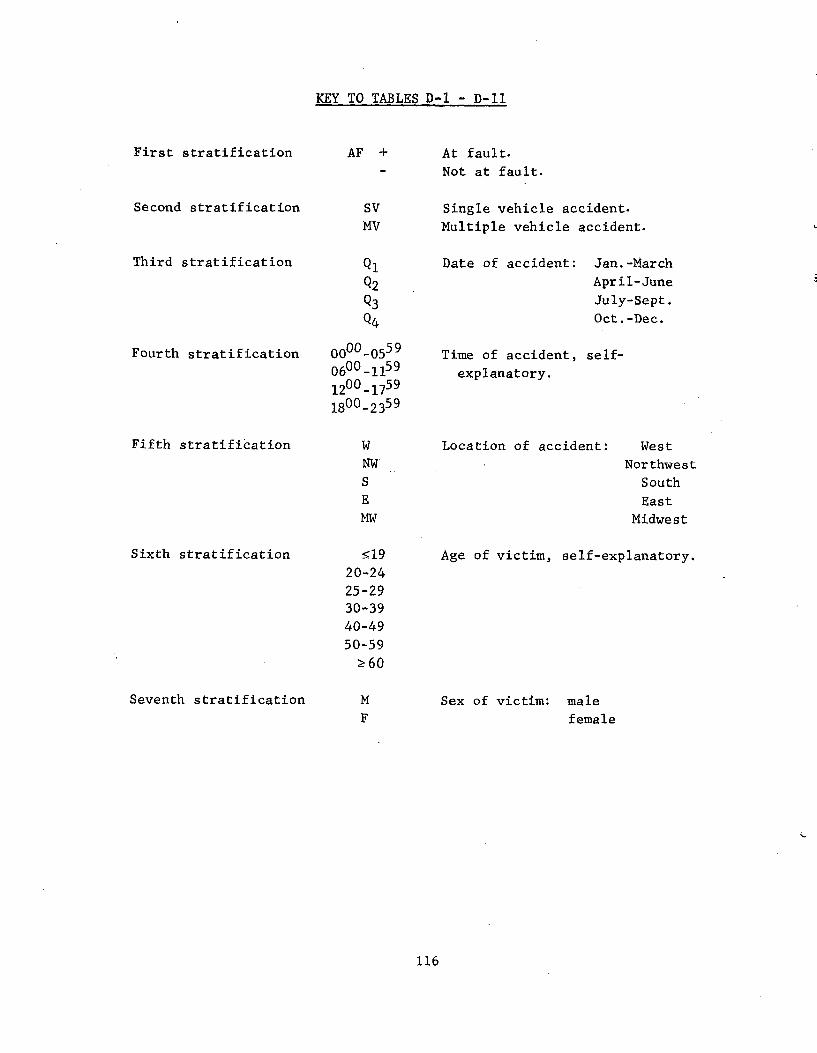
KEY TO TABLES D-1 - D-11
First stratification
Second stratification SV MV
Third stratification Q1
Q2
Q3
Q4
Fourth stratification 0000-05
0600-111200-17
1800-23
Fifth stratification W
NW
S
E
MW
Sixth stratification 519
20-24
25-29 30-39 40-49 50-59
?60
Seventh stratification M
F
59
59 59
59
At fault.
Not at fault.
Single vehicle accident. Multiple vehicle accident.
Date of accident: Jan.-March
April-June
July-Sept.
Oct.-Dec.
Time of accident, self-
explanatory.
Location of accident: West
Northwest
South
East
Midwest
Age of victim, self-explanatory.
Sex of victim: male
female
AF +
116
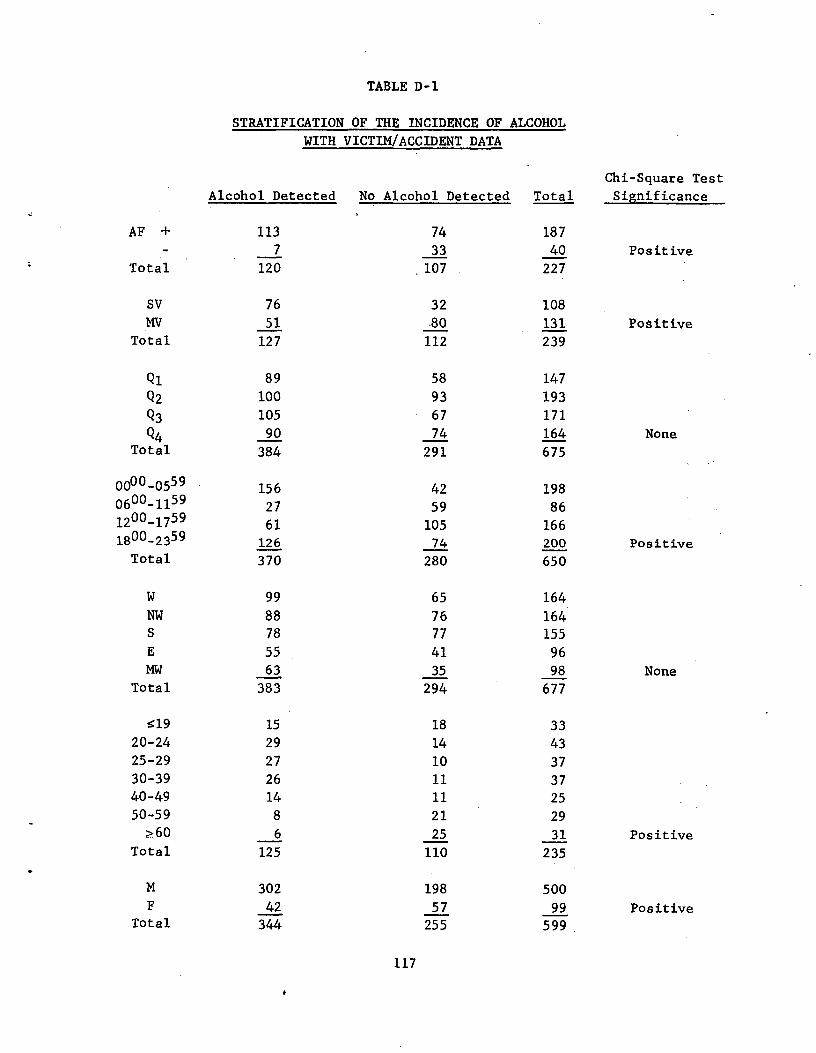
TABLE D-1
STRATIFICATION OF THE INCIDENCE OF ALCOHOL
WITH VICTIM/ACCIDENT DATA
Chi-Square Test
Significance Alcohol Detected No Alcohol Detected Total
AF + 113 74 1877 33 40 Positive
Total 120 107 227
SV 76 32 108 MV 51 •80 131 Positive
Total 127 112 239
Q1 89 58 147
Q2 100 93 193
Q3 105 67 171
Q4 90 74 164 None Total 384 291 675
000-0559 156 42 198 600-1159 27 59 86 200-1759 61 105 166 800-235.9 126 74 200 Positive Total 370 280 650
W 99 65 164 NW 88 76 164 S 78 77 155 E 55 41 96 MW 63 35 98 None
Total 383 294 677
s19 15 18 3320-24 29 14 4325-29 27 10 3730-39 26 11 3740-49 14 11 2550-59 8 21 29
z60 6 25 31 Positive Total 125 110 235
M 302 198 500 F 42 57 99 Positive
Total 344 255 599
0011
117
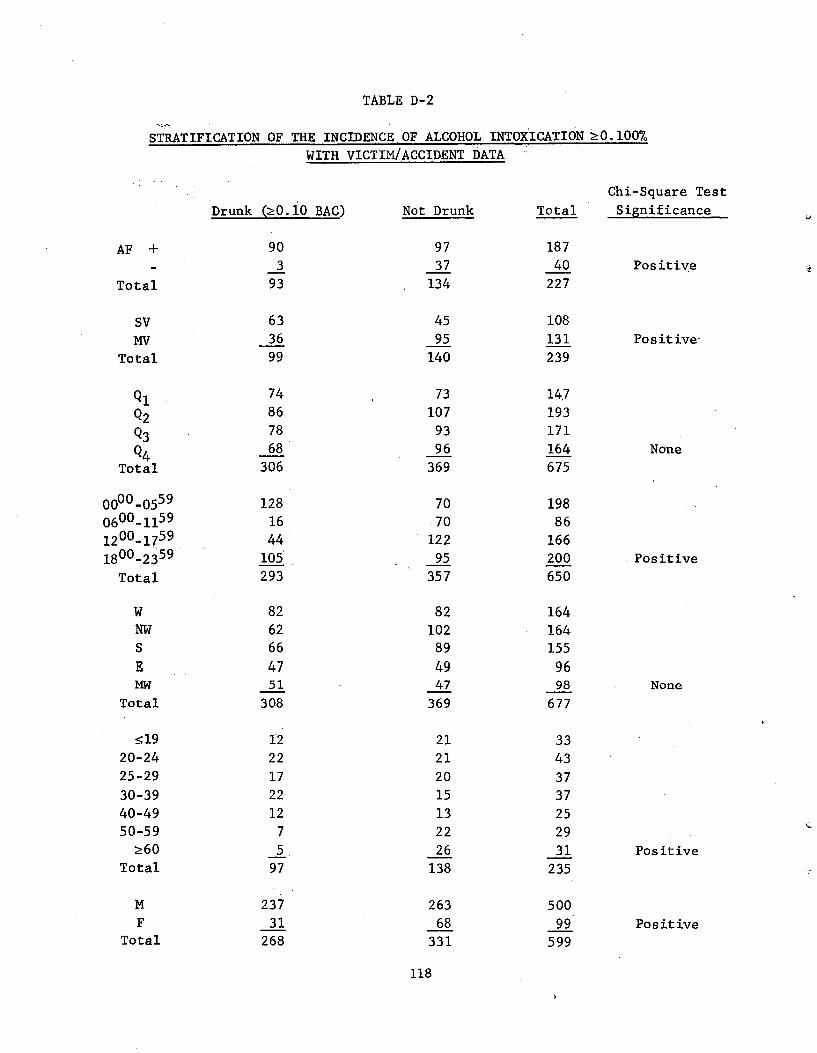
TABLE D-2
STRATIFICATION OF THE INCIDENCE OF ALCOHOL INTOXICATION 20.100%
AF +
Total
SV MV
Total
Ql
Q2
Q3
Q4 Total
0000-0559 0600-1159 1200-1759 1800-2359
Total
W NW S
E MW
Total
519 20-24 25-29
30-39 40-49 50-59
Z60 Total
MF
Total
WITH VICTIM/ACCIDENT DATA
Drunk (>_O.10 BAC) Not Drunk
90 97 3 37
93 134
63 45 36 95 99 140
74 73 86 107 78 93 68 96
306 369
128. 70 16 .70 44 122
105 95 293 357
82 82 62 102 66 89
47 49 51 47
308 369
12 21 22 21 17 20 22 15 12 13
7 22 5 26
97 138
237 263 31 68
268 331
118
Chi-Square Test
Total Significance
18740 Positive
227
108
131 Positive
239
147 193 171 164 None 675
198 86
166 200 Positive 650
164 164 155
96 98 None
677
33 43
37 3,7 25 29
31 Positive
235
500
99 Positive599
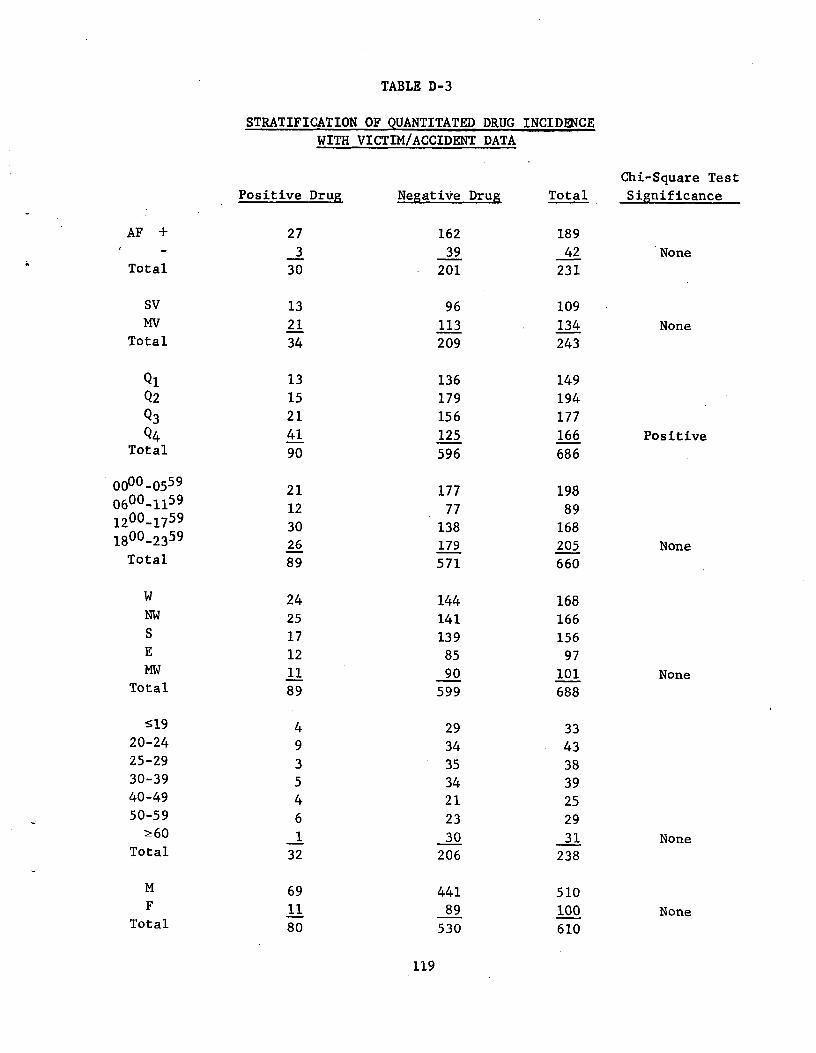
TABLE D-3
STRATIFICATION OF QUANTITATED DRUG INCIDENCE
WITH VICTIM/ACCIDENT DATA
Chi-Square Test
Significance Positive Drug Negative Drug Total
AF + 27 162 1893 39 42 None
Total 30 201 231
SV 13 96 109MV 21 113 134 None
Total 34 209 243
Q1 13 136 149 Q2 15 179 194 Q3 21 156 177 Q4 41 125 166 Positive
Total 90 596 686
0000-0559 21 177 198 0600-1159 12 77 89 1200-1759 30 138 168 1800-2359 26 179 205 None
Total 89 571 660
W 24 144 168 NW 25 141 166 S 17 139 156 E 12 85 97 MW 11 90 101 None
Total 89 599 688
519 4 29 3320-24 9 34 4325-29 3 35 3830-39 5 34 3940-49 4 21 2550-59 6 23 29
>_ 60 1 30 31 NoneTotal 32 206 238
M 69 441 510 F 11 89 100 None
Total 80 530 610
119
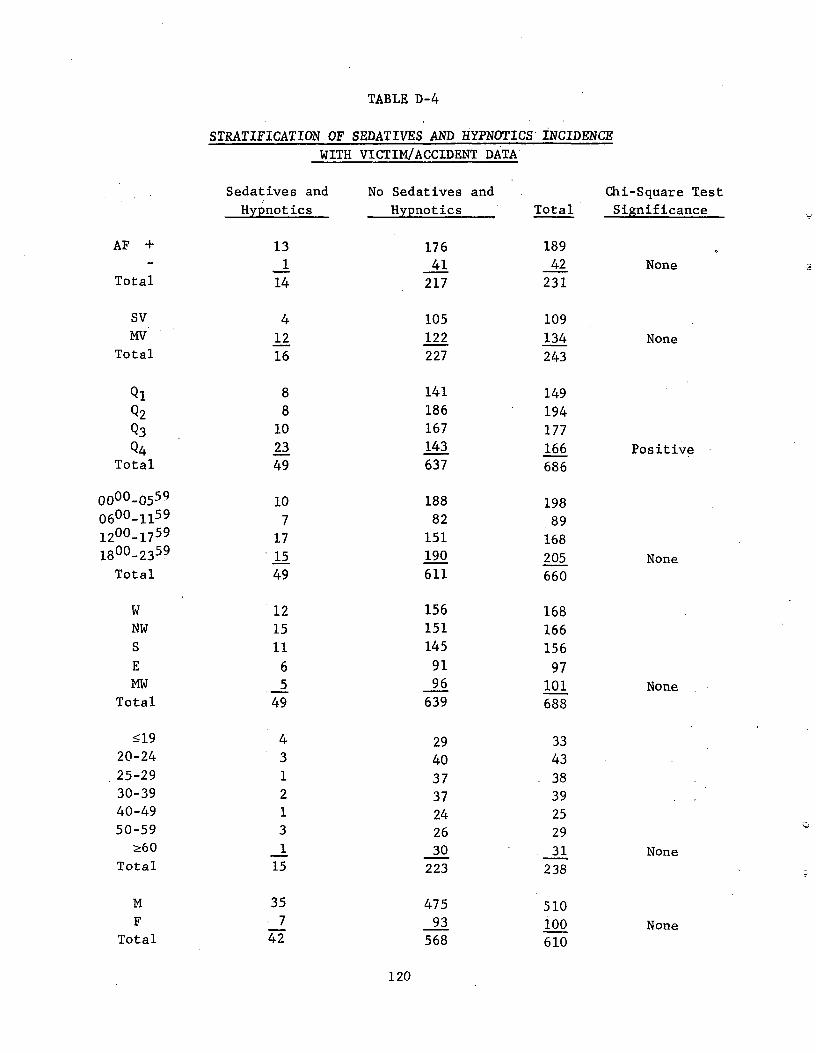
I
TABLE D-4
STRATIFICATION OF SEDATIVES AND HYPNOTICS INCIDENCE WITH VICTIM/ACCIDENT DATA
Sedatives and No Sedatives and Chi-Square Test
Hypnotics Hypnotics Total Significance
AF + 13 176 1891 41 42 None
Total 14 217 231
SV 4 105 109MV 12 122 134 None
Total 16 227 243
Q1 8 141 149Q2 8 186 194Q3 10 167 177Q4 23 143 166 Positive
Total 49 637 686
0000-0559 10 188 198 0600-1159 7 82 89 1200_1759 17 151 168 1800-2359 15 190 205 None
Total 49 611 660
W 12 156 168NW 15 151 166S 11 145 156E 6 91 97MW 5 96 101 None
Total 49 639 688
s19 4 29 3320-24 3 40 4325-29 1 37 3830-39 2 37 3940-49 1 24 2550-59 3 26 29
>_60 1 30 31 NoneTotal 15 223 238
M 35 475 510 F . 7 93 100 None
Total 42 568 610
120
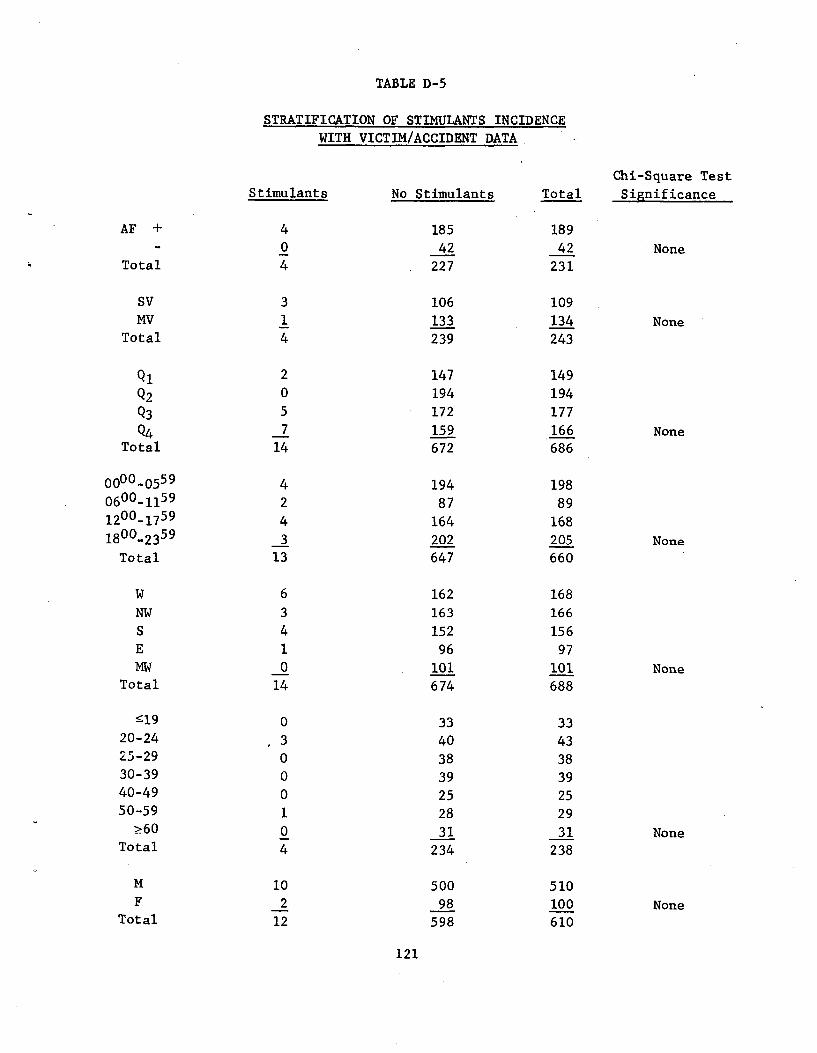
TABLE D-5
STRATIFICATION OF STIMULANTS INCIDENCE
WITH VICTIM/ACCIDENT DATA
Chi-Square Test Stimulants No Stimulants Total Significance
AF + 4 185 1890 42 42 None
Total 4 227 231
SV 3 106 109MV 1 133 134 None
Total 4 239 243
Q1 2 147 149
Q2 0 194 194
Q3 5 172 177
Q4 7 159 166 None Total 14 672 686
0000-0559 4 194 198 0600-1159 2 87 89 1200_1759 4 164 168 1800-2359 3 202 205 None
Total 13 647 660
W 6 162 168
NW 3 163 166
S 4 152 156
E 1 96 97 MW 0 101 101 None
Total 14 674 688
519 0 33 3320-24 3 40 4325-29 0 38 3830-39 0 39 3940-49 0 25 2550-59 1 28 29
>60 0 31 31 NoneTotal 4 234 238
M 10 500 510F 2 98 100 None
Total 12 598 610
121
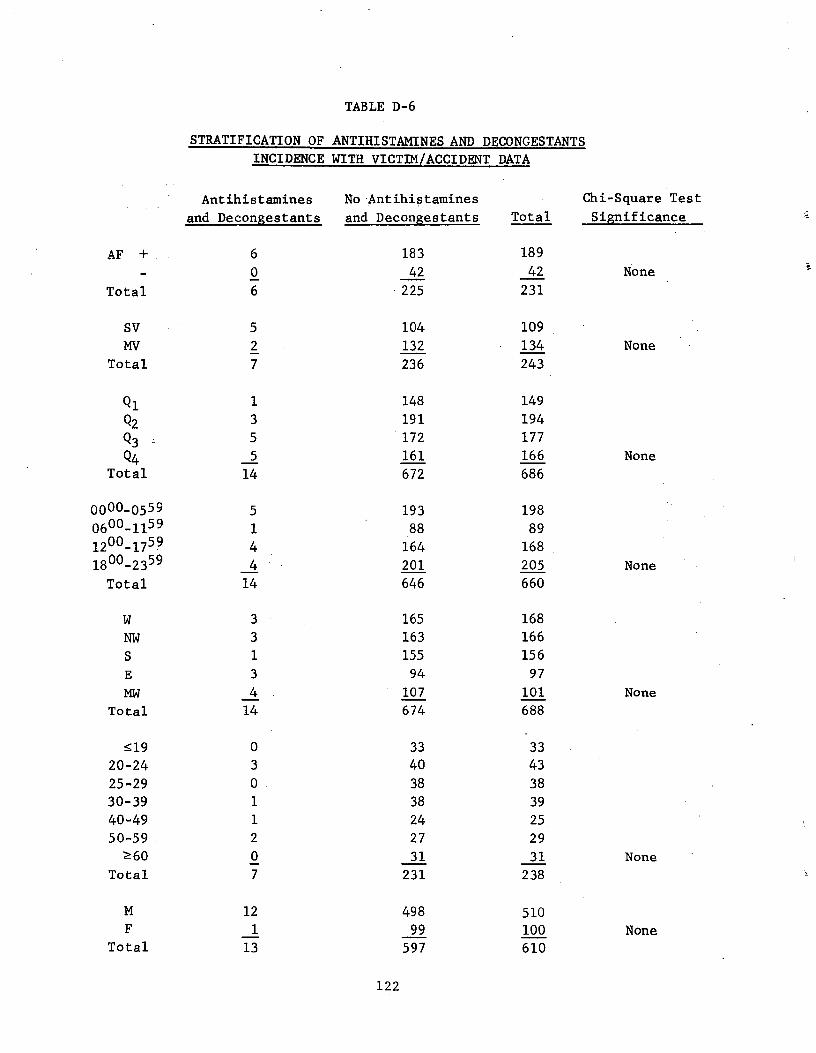
TABLE D-6
STRATIFICATION OF ANTIHISTAMINES AND DECONGESTANTS
INCIDENCE WITH VICTIM/ACCIDENT DATA
Antihistamines No Antihistamines Chi-Square Test
and Decongestants and Decongestants Total Significance
AF + 6 183 189
0 42 42 None
Total 6 225 231
SV 5 104 109
MV 2 132 134 None
Total 7 236 243
Q l 1 148 149
Q2 3 191 194 Q3 , 5 172 177
Q4 5 161 166 None
Total 14 672 686
0000-0559 5 193 198 0600-1159 1 88 89 1200-1759 4 164 168 1800-2359 4 201 205 None
Total 14 646 660
W 3 165 168
NW 3 163 166
S 1 155 156
E 3 94 97
MW 4 107 101 None
Total 14 674 688
s19 0 33 3320-24 3 40 43
25-29 0 38 3830-39 1 38 3940-49 1 24 2550-59 2 27 29
Z60 0 31 31 None
Total 7 231 238
M 12 498 510F 1 99 100 None
Total 13 597 610
122
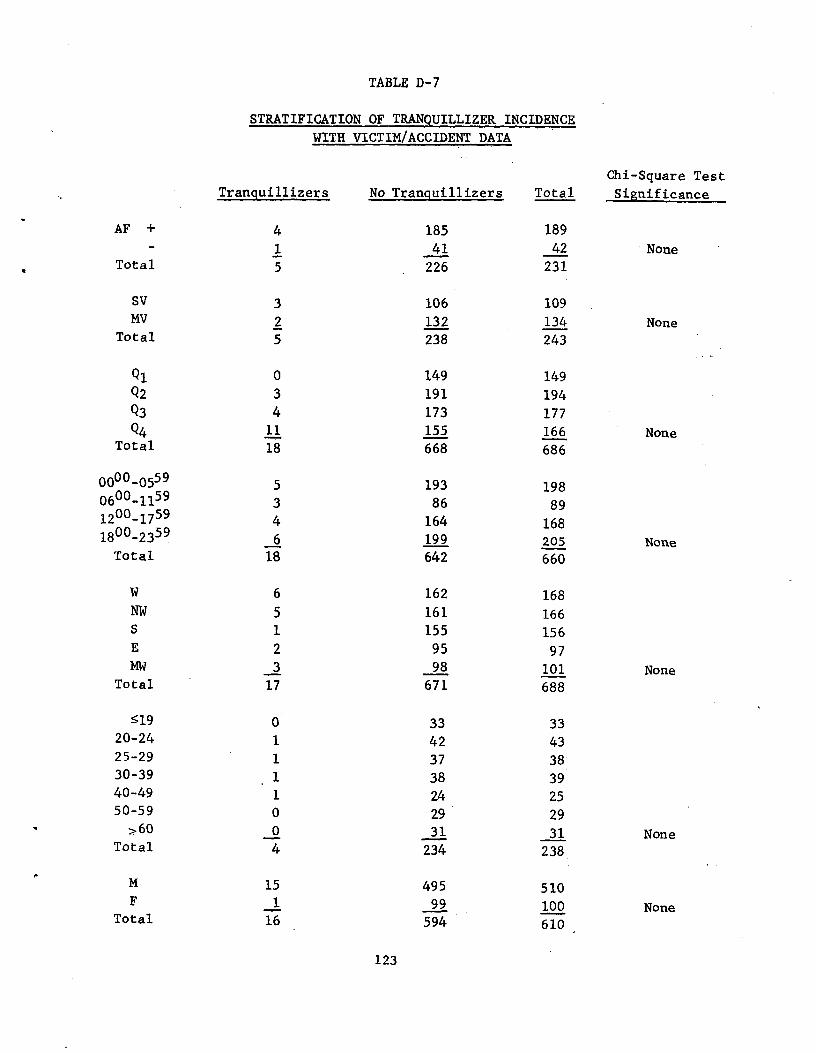
TABLE D-7
STRATIFICATION OF TRANQUILLIZER INCIDENCE
WITH VICTIM/ACCIDENT DATA
Chi-Square Test Tranquillizers No Tranquillizers Total Significance
AF + 4 185 189
1 41 42 NoneTotal 5 226 231
SV 3 106 109MV 2 132 134 None
Total 5 238 243
Ql 0 149 149Q2 3 191 194Q3 4 173 177Q4 11 155 166 None
Total 18 668 686
0000-0559 5 193 198 0600-1159 3 86 89 1200-1759 4 164 168 1800-2359 6 199 205 None
Total 18 642 660
W 6 162 168 NW 5 161 166 S 1 155 156 E 2 95 97 MW 3 98 101 None
Total 17 671 688
519 33 3320-24 42 4325-29 37 3830-39 38 3940-49 24 2550-59 29 29
z60 0 31 31 NoneTotal 4 234 238
M 15 495 510 F 1 99 100 None
Total 16 594 610
123
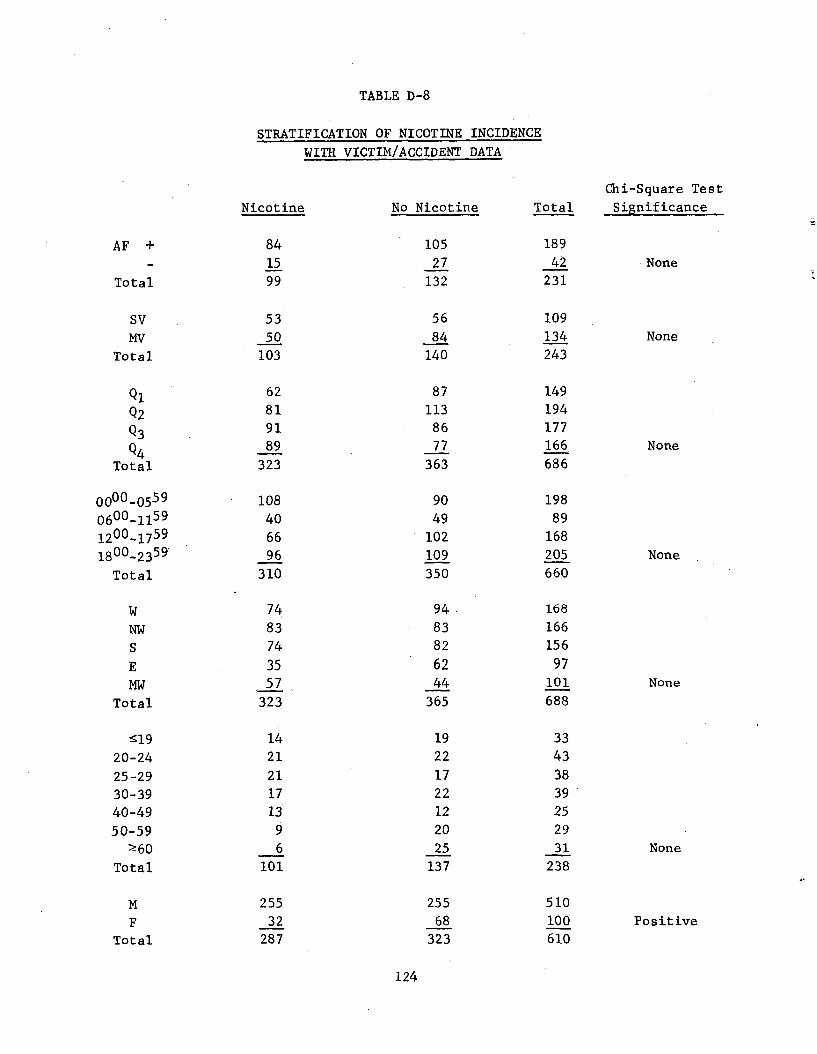
TABLE D-8
STRATIFICATION OF NICOTINE INCIDENCE
WITH VICTIM/ACCIDENT DATA
Nicotine No Nicotine Total
Chi-Square Test
Significance
AF +
Total
84 15 99
105 27
132
189
42 231
None
Sv MV
Total
53 50
103
56
84 140
109
134 243
None
Ql
Q2
Q3
Q4 Total
62 81 91 89
323
87 113 86 77
363
149 194 177 166
686
None
0000-0559 0600_1159 1200-1759 1800-2359
Total
108 40
66 96
310
90 49
102 109 350
198 89
168 205 660
None
W NW S
E MW
Total
74
83 74
35 57
323
94
83 82
62 44
365
168
166 156
97 101
688
None
519 20-24
25-29 30-39 40-49 50-59
X60 Total
14 21
21 17 13
9 6
101
19 22
17 22 12 20 25
137
33 43
38 39 25 29 31
238 None
M F
Total
255 32
287
255 68
323
510 100 610
Positive
124
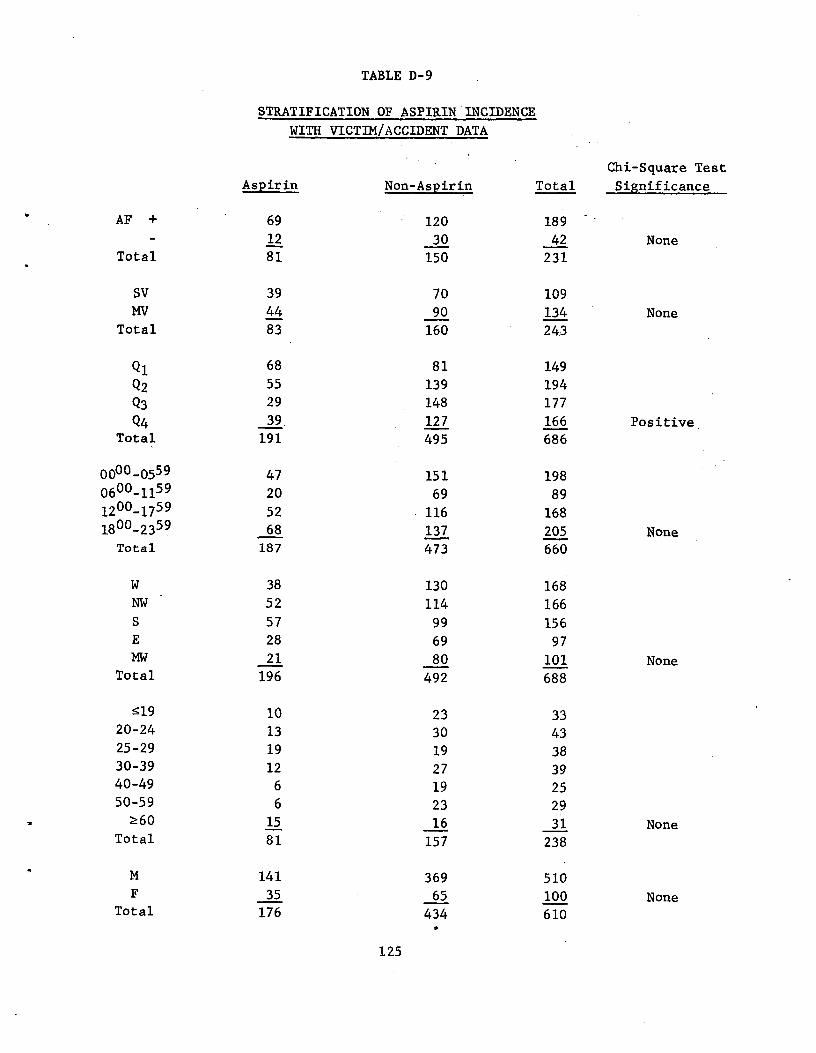
TABLE D-9
STRATIFICATION OF ASPIRIN INCIDENCE
WITH VICTIM/ACCIDENT DATA
Chi-Square Test
Aspirin Non-Aspirin Total Significance
AF + 69 120 18912 30 42 None
Total 81 150 231
SV 39 70 109MV 44 90 134 None
Total 83 160 24.3
Ql 68 81 149 Q2 55 139 194 Q3 29 148 177 Q4 39, 127 166 Positive .
Total 191 495 686
000-0559 47 151 198 600_1159 20 69 89 200_1759 52 116 168 800_2359 68 137 205 None Total 187 473 660
W 38 130 168NW 52 114 166S 57 99 156E 28 69 97 MW 21 80 101 None
Total 196 492 688
s19 10 23 33.20-24 13 30 4325-29 19 19 3830-39 12 27 3940-49 6 19 2550-59 6 23 29
Z60 15 16 31 NoneTotal 81 157 238
m 141 369 510 F 35 65 100 None
0
0
11
Total 176 434 610
125
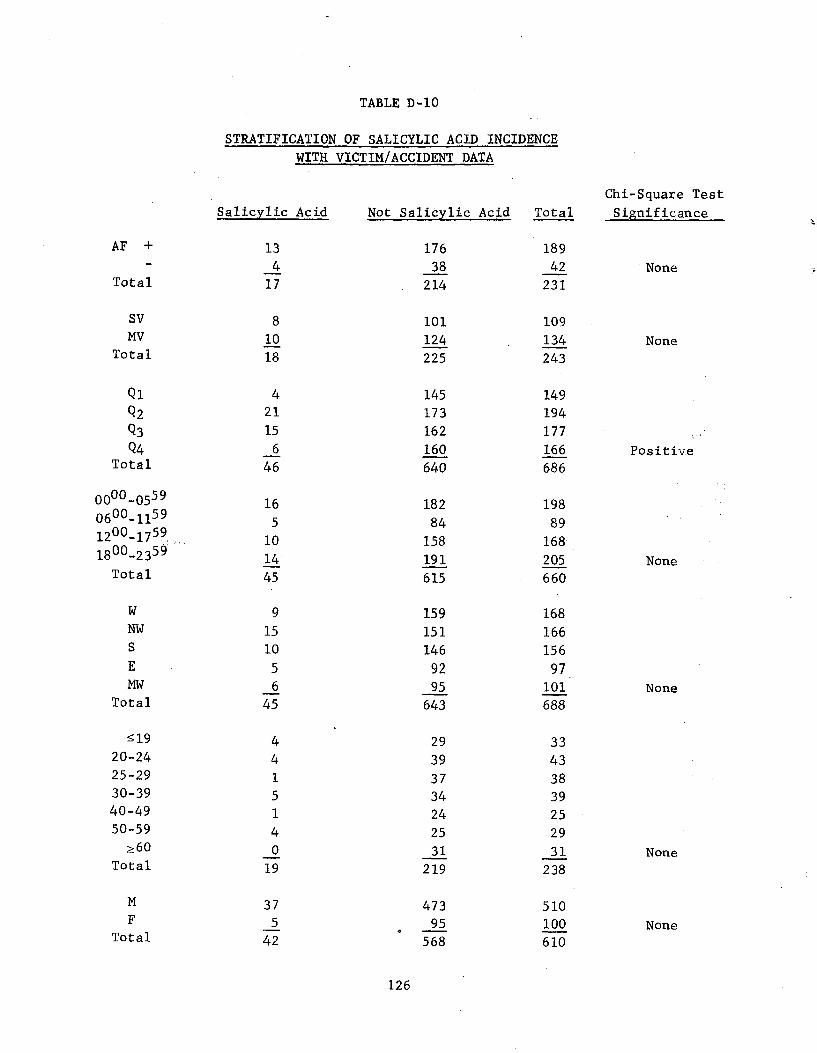
TABLE D-10
STRATIFICATION OF SALICYLIC ACID INCIDENCE
WITH VICTIM/ACCIDENT DATA
Chi-Square Test Significance Salicylic Acid Not Salicylic Acid Total
AF + 13 176 1894 38 42 None
Total 17 214 231
SV 8 101 109, MV 10 124 134 None
Total 18 225 243
Q1 4 145 149Q2 21 173 194Q3 15 162 177
Q4 6 160 166 Positive Total 46 640 686
0000-0559 16 182 198 0600-1159 5 84 89 1200-1759 10 158 168 1800-2359 14 191 205 None
Total 45 615 660
W 9 159 168 NW 15 151 166
10 146 156 5 92 97 6 95 101 None
45 643 688
X19 29 3320-24 39 4325-29 37 3830-39 34 3940-49 24 2550-59 25 29
>60 31 31 NoneTotal 219 238
M 37 473 510 F 5 95 100 None
Total 42 568 610
126
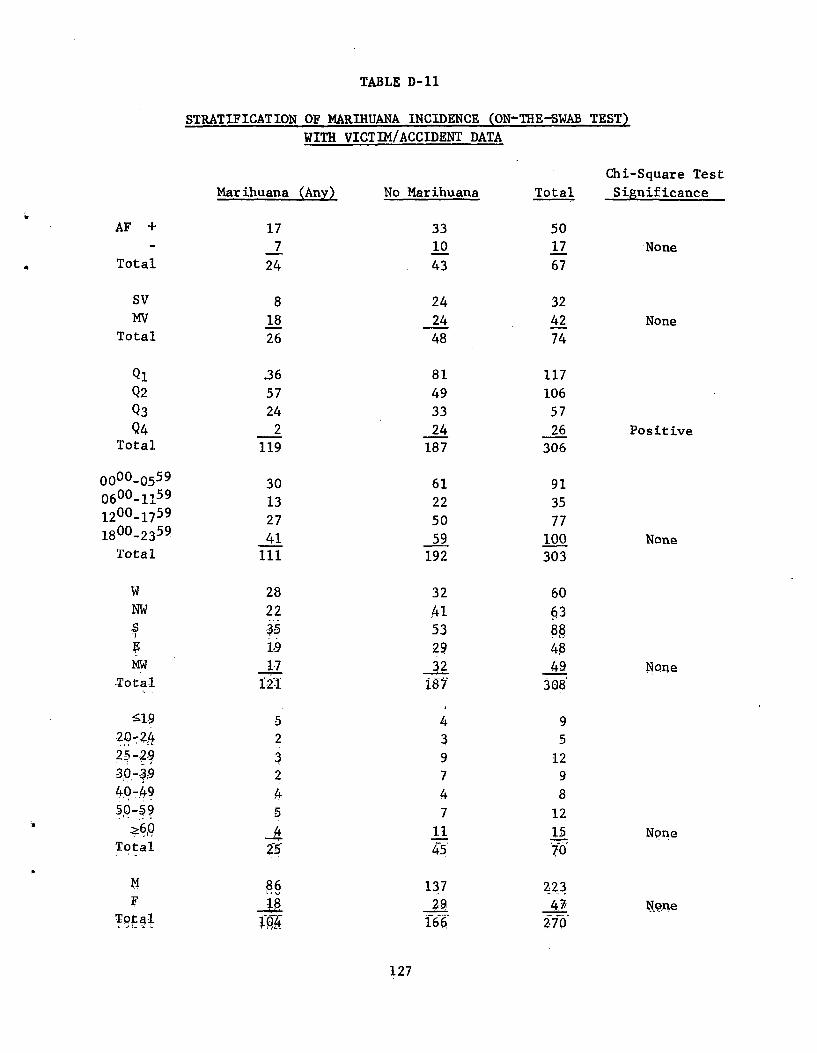
TABLE D-11
STRATIFICATION OF MARIHUANA INCIDENCE (ON-THE-SWAB TEST)
WITH VICTIM/ACCIDENT DATA
Chi-Square Test Significance
AF + 17 33 507 10 17 None
Total 24 43 67
SV 8 24 32MV 18 24 42 None
Total 26 48 74
Ql 36 81 117 Q2 57 49 106
Q3 24 33 57
Q4 2 24 26 Positive Total 119 187 306
000-0559 30 61 91 0600-1159 13 22 35 1200-1759 27 50 77 1800-2359 41 59 100 None
Total 111 192 303
W 28 32 60 NW 22 41 63.,S 35 53 88
119 29 48MW 1-7 32 49 None
Total 12-1 187 3^8
519 5 4 92.0-24 2 3 52,5 2.9 3 9 1230-39 2 7 940-49 4 4 850-59 5 7 12
?60 4 11 15 NoneTotal 25 45 70
M 86 137 223 F U 29 47 None
Total 166 270
Marihuana (Any) No Marihuana Total
0
127
APPENDIX E
PROJECT PARTICIPANTS
128
PROJECT PARTICIPANTS
Personnel participating in this project included Dr. E. J. Woodhouse,
Principal Chemist, who directed the project, and Mr.'R. A. Adams, Associate
Chemist, who was responsible for development of analytical/instrumental
methods. Assisting on the project were Mrs. S. Reich, Assistant Chemist,
Miss J. Huerner, Assistant Chemist, and Mr. S. Graves, Assistant Chemist.
Brief resumes and tasks performed by the above personnel are presented below.
Dr. E. J. Woodhouse, Principal Chemist. Dr. Woodhouse was the
Project Leader and was responsible for directing the project, maintaining
communication between DoT, MRI and the sample supply areas, and directing all
project personnel in an effort to achieve the aims and goals of the project.
Dr. Woodhouse graduated from Nottingham University, England (B.Sc., 1961;
Ph.D., 1964). Dr. Woodhouse was a Postdoctoral Fellow at Oregon State
University before joining the staff at Midwest Research Institute in 1967.
Since then he has directed the Institute's programs involving drug analysis
in body fluids. This has involved method development and application to a
wide variety of drugs in body fluids for methadone maintenance programs and
community treatment centers. Dr. Woodhouse is Project Leader on programs to
develop methods for detecting marihuana smokers and LSD users by body fluid
analysis. Another study under his direction involves the identification of
illicit drug samples from metropolitan areas such as Kansas City, Missouri;
Dayton, Ohio; and New York City. Dr. Woodhouse recently completed two
projects for the U.S. Army on detection systems for marihuana and heroin
users, and a test kit for marihuana plant material.
Mr. R. A. Adams, Associate Chemist. Mr. Adams assumed responsi
bility on this project for supervising the thin-layer chromatographic screen
ing procedures and for developing and supervising the gas chromatographic
and mass spectrometric techniques employed. Mr. Adams graduated from Kansas
State College, Emporia (B.A., 1965) and Kansas City University (M..S., 1969).
Mr. Adams has had extensive experience with instrumental analysis research
including n.m.r., infrared, near infrared spectroscopy. He has drug analysis
experience employing mass spectrometry, gas chromatography, GC/MS, and wet
chemical techniques. He worked with It. G. Cooks at Kansas State University
on the high resolution AEI MS-9, and is currently assisting Dr. Woodhouse
in the GC/MS analysis of drug extracts from street'drug formulations. Mr. Adams is initiating studies into the feasibility of determination of the
origin of opium poppies using gas chromatographic and mass spectometric
techniques.
129
Mrs. S. Reich, Assistant Chemist. Mrs. Reich was responsible for
conducting all extraction and thin-layer chromatographic techniques for the
drug screening process. Mrs. Reich graduated from the University of Kansas,
Lawrence, Kansas (B.A., 1960, Microbiology). She has worked 5 years as a
research assistant at the Kansas University Medical. Center, Kansas City,
Kansas. Her experience included analytical and clinical chemistry, morphology
and physiology of the placenta, and microbial fermentations.
Miss J. Huerner, Assistant Chemist. Miss Huerner was responsible
for conducting blood alcohol assays and the gas chromatographic quantitative
analyses for drugs in the body fluids. Miss Huerner received a B.A. in
Chemistry (1970) from Lake Forest.College and the M.S. in Inorganic Chemistry
(1972) from Michigan State University. Prior to joining the MRI staff in
1972, Miss Huerner was a research assistant at Michigan State University for
a period of 2 years where she did research on the synthesis of fluorophosphines
and on low-resolution microwave studies of boron adducts of fluorophosphines.
While a student at Lake Forest College from 1966 to 1970, she was a research
assistant. on a kinetic study of chlorosilanes. Miss Huerner has experience
with nuclear magnetic resonance (1H, 19F, 11B,31p), infrared, ultraviolet-
visible, microwave, and mass spectral techniques. Her work at MRI has involved
the analysis of drugs of abuse by thin-layer and gas chromatography and
immunoassay..
Mr. S. Graves, Assistant Chemist. Mr. Graves was also responsible
for conducting blood alcohol assays and the gas chromatographic quantitative
analyses-for drugs in the body fluids. Mr. Graves received a B.S. in Chemistry
from Rockhurst College in 1969, and did graduate work in chemistry at the
University of Kansas from 1969-1970. Prior to joining the MRI staff in 1972,
Mr. Graves was a Forensic Chemist for 2 years in the U.S. Army at Ft. Gordon,
Georgia, and Camp Zama, Japan. His activity included the identification and
quantitation of drugs of abuse in dosage form and body fluids which were to
be used as evidence in criminal proceedings. Prior to this Mr. Graves was
a teaching assistant at the University of Kansas, and a research assistant
at Rockhurst College. Mr. Graves specializes in analytical determinations
of pharmaceutical preparations and drugs by wet and instrumental techniques.
Work in which he has been engaged includes the assay and identification of
drugs and impurities of pharmaceutical preparations for cancer chemotherapy.
Other projects to which he has contributed are the quantitative determination
of meperidine and acetaminophen in blood serum samples.
130
Related Documents