ORIGINAL RESEARCH published: 02 March 2016 doi: 10.3389/fpsyg.2016.00289 Frontiers in Psychology | www.frontiersin.org 1 March 2016 | Volume 7 | Article 289 Edited by: Pietro Cipresso, IRCCS Istituto Auxologico Italiano, Italy Reviewed by: Suzanne Jak, Utrecht University, Netherlands Rens Van De Schoot, Utrecht University, Netherlands Raman Chandrasekar, Kansas State University, USA *Correspondence: Nigel Guenole [email protected]; [email protected] Specialty section: This article was submitted to Quantitative Psychology and Measurement, a section of the journal Frontiers in Psychology Received: 09 October 2015 Accepted: 14 February 2016 Published: 02 March 2016 Citation: Guenole N (2016) The Importance of Isomorphism for Conclusions about Homology: A Bayesian Multilevel Structural Equation Modeling Approach with Ordinal Indicators. Front. Psychol. 7:289. doi: 10.3389/fpsyg.2016.00289 The Importance of Isomorphism for Conclusions about Homology: A Bayesian Multilevel Structural Equation Modeling Approach with Ordinal Indicators Nigel Guenole 1, 2 * 1 Goldsmiths, University of London, London, UK, 2 IBM Smarter Workforce, London, UK We describe a Monte Carlo study examining the impact of assuming item isomorphism (i.e., equivalent construct meaning across levels of analysis) on conclusions about homology (i.e., equivalent structural relations across levels of analysis) under varying degrees of non-isomorphism in the context of ordinal indicator multilevel structural equation models (MSEMs). We focus on the condition where one or more loadings are higher on the between level than on the within level to show that while much past research on homology has ignored the issue of psychometric isomorphism, psychometric isomorphism is in fact critical to valid conclusions about homology. More specifically, when a measurement model with non-isomorphic items occupies an exogenous position in a multilevel structural model and the non-isomorphism of these items is not modeled, the within level exogenous latent variance is under-estimated leading to over-estimation of the within level structural coefficient, while the between level exogenous latent variance is overestimated leading to underestimation of the between structural coefficient. When a measurement model with non-isomorphic items occupies an endogenous position in a multilevel structural model and the non-isomorphism of these items is not modeled, the endogenous within level latent variance is under-estimated leading to under-estimation of the within level structural coefficient while the endogenous between level latent variance is over-estimated leading to over-estimation of the between level structural coefficient. The innovative aspect of this article is demonstrating that even minor violations of psychometric isomorphism render claims of homology untenable. We also show that posterior predictive p-values for ordinal indicator Bayesian MSEMs are insensitive to violations of isomorphism even when they lead to severely biased within and between level structural parameters. We highlight conditions where poor estimation of even correctly specified models rules out empirical examination of isomorphism and homology without taking precautions, for instance, larger Level-2 sample sizes, or using informative priors. Keywords: isomorphism, homology, multilevel structural equation modeling, ordinal indicators

Welcome message from author
This document is posted to help you gain knowledge. Please leave a comment to let me know what you think about it! Share it to your friends and learn new things together.
Transcript

ORIGINAL RESEARCHpublished: 02 March 2016
doi: 10.3389/fpsyg.2016.00289
Frontiers in Psychology | www.frontiersin.org 1 March 2016 | Volume 7 | Article 289
Edited by:
Pietro Cipresso,
IRCCS Istituto Auxologico Italiano, Italy
Reviewed by:
Suzanne Jak,
Utrecht University, Netherlands
Rens Van De Schoot,
Utrecht University, Netherlands
Raman Chandrasekar,
Kansas State University, USA
*Correspondence:
Nigel Guenole
Specialty section:
This article was submitted to
Quantitative Psychology and
Measurement,
a section of the journal
Frontiers in Psychology
Received: 09 October 2015
Accepted: 14 February 2016
Published: 02 March 2016
Citation:
Guenole N (2016) The Importance of
Isomorphism for Conclusions about
Homology: A Bayesian Multilevel
Structural Equation Modeling
Approach with Ordinal Indicators.
Front. Psychol. 7:289.
doi: 10.3389/fpsyg.2016.00289
The Importance of Isomorphism forConclusions about Homology: ABayesian Multilevel StructuralEquation Modeling Approach withOrdinal IndicatorsNigel Guenole 1, 2*
1Goldsmiths, University of London, London, UK, 2 IBM Smarter Workforce, London, UK
We describe a Monte Carlo study examining the impact of assuming item isomorphism
(i.e., equivalent construct meaning across levels of analysis) on conclusions about
homology (i.e., equivalent structural relations across levels of analysis) under varying
degrees of non-isomorphism in the context of ordinal indicator multilevel structural
equation models (MSEMs). We focus on the condition where one or more loadings are
higher on the between level than on the within level to show that while much past research
on homology has ignored the issue of psychometric isomorphism, psychometric
isomorphism is in fact critical to valid conclusions about homology. More specifically,
when a measurement model with non-isomorphic items occupies an exogenous position
in a multilevel structural model and the non-isomorphism of these items is not modeled,
the within level exogenous latent variance is under-estimated leading to over-estimation
of the within level structural coefficient, while the between level exogenous latent variance
is overestimated leading to underestimation of the between structural coefficient. When
a measurement model with non-isomorphic items occupies an endogenous position in a
multilevel structural model and the non-isomorphism of these items is not modeled, the
endogenous within level latent variance is under-estimated leading to under-estimation of
the within level structural coefficient while the endogenous between level latent variance
is over-estimated leading to over-estimation of the between level structural coefficient.
The innovative aspect of this article is demonstrating that even minor violations of
psychometric isomorphism render claims of homology untenable. We also show that
posterior predictive p-values for ordinal indicator Bayesian MSEMs are insensitive to
violations of isomorphism even when they lead to severely biased within and between
level structural parameters. We highlight conditions where poor estimation of even
correctly specified models rules out empirical examination of isomorphism and homology
without taking precautions, for instance, larger Level-2 sample sizes, or using informative
priors.
Keywords: isomorphism, homology, multilevel structural equation modeling, ordinal indicators
Guenole Isomorphism and Homology
INTRODUCTION
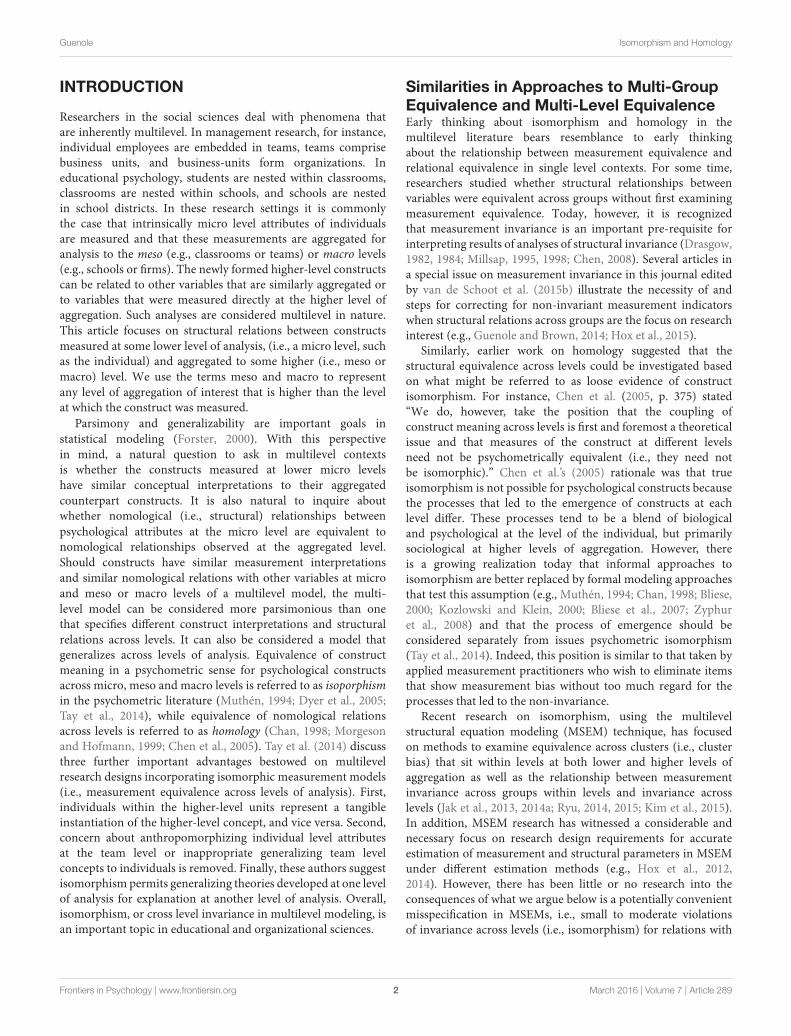
Researchers in the social sciences deal with phenomena thatare inherently multilevel. In management research, for instance,individual employees are embedded in teams, teams comprisebusiness units, and business-units form organizations. Ineducational psychology, students are nested within classrooms,classrooms are nested within schools, and schools are nestedin school districts. In these research settings it is commonlythe case that intrinsically micro level attributes of individualsare measured and that these measurements are aggregated foranalysis to the meso (e.g., classrooms or teams) or macro levels(e.g., schools or firms). The newly formed higher-level constructscan be related to other variables that are similarly aggregated orto variables that were measured directly at the higher level ofaggregation. Such analyses are considered multilevel in nature.
This article focuses on structural relations between constructs
measured at some lower level of analysis, (i.e., a micro level, suchas the individual) and aggregated to some higher (i.e., meso or
macro) level. We use the terms meso and macro to represent
any level of aggregation of interest that is higher than the levelat which the construct was measured.
Parsimony and generalizability are important goals in
statistical modeling (Forster, 2000). With this perspective
in mind, a natural question to ask in multilevel contextsis whether the constructs measured at lower micro levels
have similar conceptual interpretations to their aggregated
counterpart constructs. It is also natural to inquire aboutwhether nomological (i.e., structural) relationships between
psychological attributes at the micro level are equivalent tonomological relationships observed at the aggregated level.
Should constructs have similar measurement interpretations
and similar nomological relations with other variables at micro
and meso or macro levels of a multilevel model, the multi-
level model can be considered more parsimonious than onethat specifies different construct interpretations and structural
relations across levels. It can also be considered a model thatgeneralizes across levels of analysis. Equivalence of constructmeaning in a psychometric sense for psychological constructsacross micro, meso and macro levels is referred to as isoporphismin the psychometric literature (Muthén, 1994; Dyer et al., 2005;Tay et al., 2014), while equivalence of nomological relationsacross levels is referred to as homology (Chan, 1998; Morgesonand Hofmann, 1999; Chen et al., 2005). Tay et al. (2014) discussthree further important advantages bestowed on multilevelresearch designs incorporating isomorphic measurement models(i.e., measurement equivalence across levels of analysis). First,individuals within the higher-level units represent a tangibleinstantiation of the higher-level concept, and vice versa. Second,concern about anthropomorphizing individual level attributesat the team level or inappropriate generalizing team levelconcepts to individuals is removed. Finally, these authors suggestisomorphism permits generalizing theories developed at one levelof analysis for explanation at another level of analysis. Overall,isomorphism, or cross level invariance in multilevel modeling, isan important topic in educational and organizational sciences.
Similarities in Approaches to Multi-GroupEquivalence and Multi-Level EquivalenceEarly thinking about isomorphism and homology in themultilevel literature bears resemblance to early thinkingabout the relationship between measurement equivalence andrelational equivalence in single level contexts. For some time,researchers studied whether structural relationships betweenvariables were equivalent across groups without first examiningmeasurement equivalence. Today, however, it is recognizedthat measurement invariance is an important pre-requisite forinterpreting results of analyses of structural invariance (Drasgow,1982, 1984; Millsap, 1995, 1998; Chen, 2008). Several articles ina special issue on measurement invariance in this journal editedby van de Schoot et al. (2015b) illustrate the necessity of andsteps for correcting for non-invariant measurement indicatorswhen structural relations across groups are the focus on researchinterest (e.g., Guenole and Brown, 2014; Hox et al., 2015).
Similarly, earlier work on homology suggested that thestructural equivalence across levels could be investigated basedon what might be referred to as loose evidence of constructisomorphism. For instance, Chen et al. (2005, p. 375) stated“We do, however, take the position that the coupling ofconstruct meaning across levels is first and foremost a theoreticalissue and that measures of the construct at different levelsneed not be psychometrically equivalent (i.e., they need notbe isomorphic).” Chen et al.’s (2005) rationale was that trueisomorphism is not possible for psychological constructs becausethe processes that led to the emergence of constructs at eachlevel differ. These processes tend to be a blend of biologicaland psychological at the level of the individual, but primarilysociological at higher levels of aggregation. However, thereis a growing realization today that informal approaches toisomorphism are better replaced by formal modeling approachesthat test this assumption (e.g., Muthén, 1994; Chan, 1998; Bliese,2000; Kozlowski and Klein, 2000; Bliese et al., 2007; Zyphuret al., 2008) and that the process of emergence should beconsidered separately from issues psychometric isomorphism(Tay et al., 2014). Indeed, this position is similar to that taken byapplied measurement practitioners who wish to eliminate itemsthat show measurement bias without too much regard for theprocesses that led to the non-invariance.
Recent research on isomorphism, using the multilevelstructural equation modeling (MSEM) technique, has focusedon methods to examine equivalence across clusters (i.e., clusterbias) that sit within levels at both lower and higher levels ofaggregation as well as the relationship between measurementinvariance across groups within levels and invariance acrosslevels (Jak et al., 2013, 2014a; Ryu, 2014, 2015; Kim et al., 2015).In addition, MSEM research has witnessed a considerable andnecessary focus on research design requirements for accurateestimation of measurement and structural parameters in MSEMunder different estimation methods (e.g., Hox et al., 2012,2014). However, there has been little or no research into theconsequences of what we argue below is a potentially convenientmisspecification in MSEMs, i.e., small to moderate violationsof invariance across levels (i.e., isomorphism) for relations with
Frontiers in Psychology | www.frontiersin.org 2 March 2016 | Volume 7 | Article 289

Guenole Isomorphism and Homology
external variables (i.e., homology). This is a notable gap in thecontext of MSEM, which is widely agreed as one of the mostrigorous methods for testing isomorphism and homology.
A Taxonomy of Levels of IsomorphismTay et al. (2014) proposed a new taxonomy of levels for multilevelisomorphism. These authors differentiate the following levelsof configural and metric isomorphism, or “across level”measurement invariance. Strong configural isomorphism existswhen the same number of factors exists on the within andbetween levels and the factor structure contains the same patternof fixed and free loadings. When the same number of factorsexists on multiple levels of analysis but the pattern of fixed andfree factor loadings is not the same, weak configural invarianceis said to exist. It is possible, and in fact common, for fewerfactors to be required at higher levels of analysis and for thehigher-level model to exhibit an entirely different pattern ofloadings. In this case, there is no basis for claims of isomorphism.However, if some of the factors are reproduced with the samezero non-zero loadings patterns, partial configural isomorphismis said to exist. Strong metric isomorphism is said to existwhen a model that shows strong configural isomorphism alsoexhibits equivalent loadings across levels of analysis.Weakmetricisomorphism exists when the rank ordering of the loadings ofitems is equivalent across levels but the precise magnitudes arenot. If even the rank ordering of loadings is not equivalent acrosslevels, there is no basis for claiming metric isomorphism.
Implications of Isomorphism for HomologyAs yet, no consideration has been to the consequences ofthese levels of invariance for relations with external variables,i.e., structural relations between measurement models acrosslevels. Investigating this issue is the goal of the currentstudy, which can be considered an example of examining thepractical consequences of convenient model misspecifications.Studies of such misspecification abound in the psychometricliterature. Instances include exact vs. approximate fit instructural equation models (Hu and Bentler, 1999), whetherdata are “unidimensional enough” that item parameters canbe considered dependable (Drasgow and Lissak, 1983; Bonifayet al., 2015) and the extent to which measurement invariancecan be ignored in multiple group confirmatory factor analyseswithout detrimentally impacting substantive conclusions aboutregression between latent constructs across groups (Chen, 2008;Guenole and Brown, 2014). Similar studies have also examinedthe impact of model misspecification in bi-factor contexts. Forexample, Reise et al. (2013) examined the effect of ignoring bi-factor structures on structural parameter bias as a function ofthe percentage of “contaminated correlations” in the covariancematrix.
More recently, general methods have been proposed thatexamine the consequences of model constraints for particularparameters in models (Oberski, 2014; Kuha and Moustaki, 2015;Oberski et al., 2015) although these approaches are so faruntested in the context of isomorphism in multilevel modeling.In this article, we show that absent strong evidence of metricisomorphism, evidence about structural relations across levels is
rendered difficult to interpret at best and at worst uninterpretabledue to bias in the estimation of structural relations. Isomorphismmust be addressed before drawing conclusions about homology.
Theoretically Derived Research QuestionThe goal of the current article is to examine the implicationsof psychometric isomorphism for conclusions about homologyin the context of MSEMs with categorical indicators. Weinvestigate empirically whether there is any good reason to expectwhether or not psychometric isomorphism (or its absence) isaccurately modeled has important implications for conclusionsabout construct homology (i.e., the equivalence of structuralrelations across levels of analysis). We use a Monte Carloexperimental design to investigate what degree of psychometricnon-isomorphism can be countenanced while still reachingaccurate conclusions about psychometric evidence for homology.This is an important issue representing a trade off appliedresearchers primarily interested in homology will often face. Ifevidence of non-isomorphism is minor, the temptation couldbe to ignore the non-isomorphism and impose the samemeasurement models across levels of analysis. This would permitthe claim of a consistent meaning of constructs across levels.
For instance, along with all the ensuing benefits we havediscussed, this would allow researchers to say that the samepsychological constructs exist across levels with the samenomological relationships instead of needing to say that similarconstructs exist across levels with similar relationships withexternal variables. However, applied researchers would be lesslikely to take this course of action if imposing equivalence acrosslevels led to inaccurate conclusions about homology, which isoften a researcher’s primary interest. Here we concern ourselveswith the situation where researchers recognize that separatemodels should be estimated for each level rather than the casewhere researchers erroneously estimate models at one level whendata are in fact multilevel. For more on the problems with thisapproach see Zyphur et al. (2008).
Multilevel Structural Equation ModelingIn this article we adopt the MSEM framework to examineour hypotheses regarding multilevel isomorphism. MSEM hasseveral advantages that place it among the primary choices formeasuring multilevel constructs (Bliese et al., 2007). For instance,MSEM allows simultaneous estimation of measurement modelson within (disaggregated) and between (aggregated) levels whilein parallel permitting the estimation of structural relationshipsbetween measurement models on within and between levels. Inaddition, a formal statistical test of model fit in the form of thelikelihood ratio test is available. Widely known close fit indicesprovided by common software programs are available for MSEMmodels under frequentist and Bayesian estimation approaches.Readers may refer to Hox (2010) and Ryu and West (2009)for discussions of the adjustments necessary for the calculationof these indices when using MSEM with maximum likelihood.While the Posterior Predictive checking approach is available asa model fit index under Bayesian estimation, its suitability fortesting isomorphism in MSEMs with ordinal indicators has not
Frontiers in Psychology | www.frontiersin.org 3 March 2016 | Volume 7 | Article 289

Guenole Isomorphism and Homology
yet been explored. A secondary goal of this article is to examinethis issue.
The model used as the basis of simulations is presented inFigure 1. This model is a two level structural equation modelwith categorical factor indicators on the within level and randomcontinuous latent indicators on the between level. The solidcircles at the ends of the arrows that emanate from the latentwithin factors fw1 and fw2 indicate random intercepts that varyacross clusters. On the between level these are cluster levelrandom intercepts which serve as the indicators of fb1 andfb2. These random intercepts are presented in circles since theyare the continuous latent random variables that vary acrossclusters. For an equation based representation of the parametersof MSEMs with categorical outcomes readers are referred toGrilli and Rampichini (2007) or Jak et al. (2014a). Parametervalues used in the Monte Carlo study for this model are includedon Figure 1 and are discussed further in the simulation designsection below.
Bayesian Estimation of MultilevelStructural Equation ModelsMSEM involves sampling at both individual and group levels.At level-2, i.e., the group level, samples are often characterizedby small numbers of groups, particularly when the populationitself is small such as when countries are studied. Modelingof effects at level-2 (or higher) also requires some variationat the higher level (i.e., between groups) as captured by the
intraclass correlation for variables. The precise lower limit ofthe ICC required for modeling group level effects is not firmlyestablished, and sometimes level-2 effects are studied even if ICCsfor variables are low indicating little variation between groups.This is especially if the group level effects are of theoreticalinterest.
However, the combination of low ICCs and low numbersof level-2 units creates problems for maximum likelihoodestimation of MSEMs, which assumes large samples andnormality. Recent research has shown Bayesian estimators to bemore accurate than maximum likelihood and to produce fewerinadmissible solutions with lower numbers of level-2 units (Hoxet al., 2012, 2014; Depaoli and Clifton, 2015). As summarizedby Depaoli and Clifton (p. 330): “a Bayesian approach tomultilevel SEM should produce more accurate and efficientestimates because of shrinkage [toward the mean of the prior]. Itshould also eliminate problems with convergence due to negativevariance estimates because priors can be used to bound estimatesto positive values.” In addition to these benefits, Hox et al. (2015)report that Bayesian estimation is more reliable in small samplesand is better for complex models.
For these reasons, in the current study we adopted aBayesian approach to model estimation. Whereas, frequentistestimation methods obtain a single value for parameters, underBayes estimation a distribution for parameters is obtained. Thisdistribution reflects uncertainty about parameters before data arecollected and the likelihood of data that is collected to create the
FIGURE 1 | Least isomorphic and homologous multilevel structural equation model from which all other models can be obtained.
Frontiers in Psychology | www.frontiersin.org 4 March 2016 | Volume 7 | Article 289
Guenole Isomorphism and Homology
posterior distribution. In Mplus, the software used in the currentstudy, this posterior distribution is sampled using Markov ChainMonte Carlo (MCMC) methods based on the Gibbs Sampler toproduce point estimates and confidence intervals. For furtherdetails we refer readers to Kruschke (2011), van de Schootet al. (2014), Zyphur and Oswald (2013), or Lynch (2007) forintroductory treatments and to Gelman et al. (2004) for moreadvanced discussion.
HypothesesOur expectations of the impact of construct isomorphism onconstruct homology (i.e., equivalence of structural parameters)are as follows. First, when measurement models appropriatelymodel the simulated invariance and simulated non-invariance(i.e., correctly modeled lower loadings on the within levelsof models, we anticipate that structural relationships willbe accurately recovered according to all model performancestatistics we shortly introduce. Second, where measurementmodels specify loadings on the within and between levels asinvariant when in fact they are not (i.e., ignoring non-invariantloadings on the within and between levels in the case of higherbetween level factors) the direction of regression parameterbias will depend on whether the ignored non-invariance in themeasurement model is for the exogenous or the endogenousvariable. In the exogenous case, we expect overestimation of thestructural coefficient on the between level and underestimationof the structural coefficient on the between level. Whenthe non-invariant measurement model is in the endogenousposition, we expect underestimation of the within level structuralcoefficient and overestimation of the between level structuralcoefficient.
MATERIALS AND METHODS
Fixed Features of Simulation DesignOur design and reporting approach to examine these hypothesesbroadly follows the stages discussed by Paxton et al. (2001),Bandalos (2006), and Boomsma (2013).
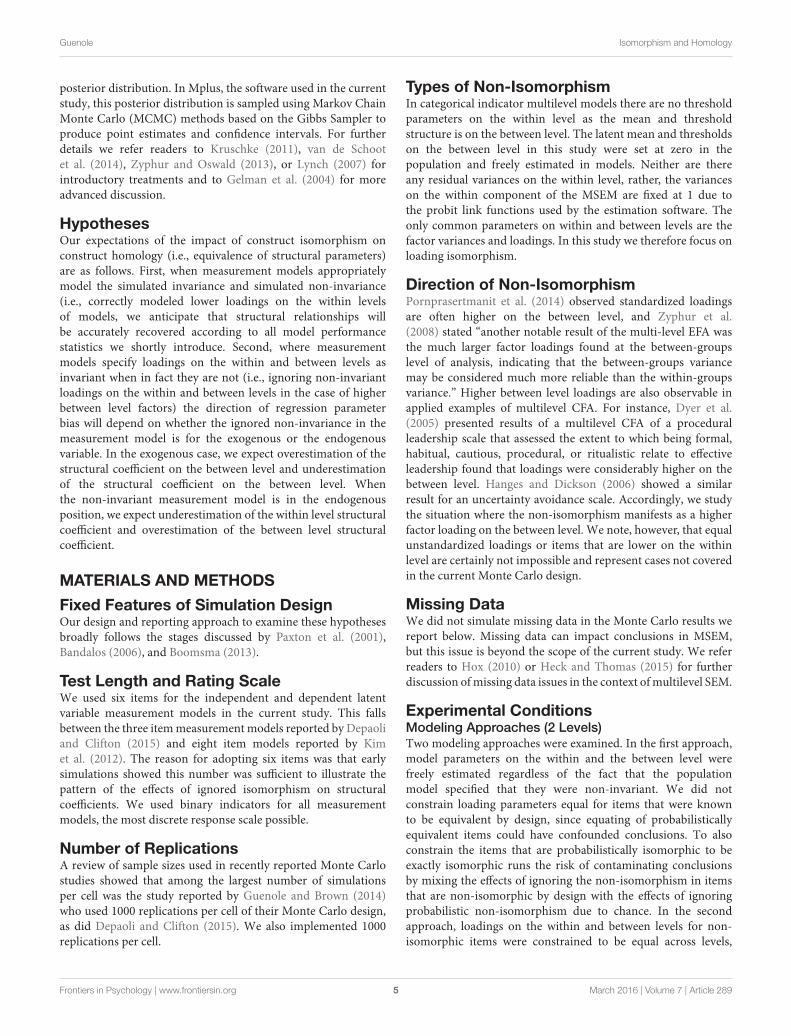
Test Length and Rating ScaleWe used six items for the independent and dependent latentvariable measurement models in the current study. This fallsbetween the three itemmeasurement models reported by Depaoliand Clifton (2015) and eight item models reported by Kimet al. (2012). The reason for adopting six items was that earlysimulations showed this number was sufficient to illustrate thepattern of the effects of ignored isomorphism on structuralcoefficients. We used binary indicators for all measurementmodels, the most discrete response scale possible.
Number of ReplicationsA review of sample sizes used in recently reported Monte Carlostudies showed that among the largest number of simulationsper cell was the study reported by Guenole and Brown (2014)who used 1000 replications per cell of their Monte Carlo design,as did Depaoli and Clifton (2015). We also implemented 1000replications per cell.
Types of Non-IsomorphismIn categorical indicator multilevel models there are no thresholdparameters on the within level as the mean and thresholdstructure is on the between level. The latent mean and thresholdson the between level in this study were set at zero in thepopulation and freely estimated in models. Neither are thereany residual variances on the within level, rather, the varianceson the within component of the MSEM are fixed at 1 due tothe probit link functions used by the estimation software. Theonly common parameters on within and between levels are thefactor variances and loadings. In this study we therefore focus onloading isomorphism.
Direction of Non-IsomorphismPornprasertmanit et al. (2014) observed standardized loadingsare often higher on the between level, and Zyphur et al.(2008) stated “another notable result of the multi-level EFA wasthe much larger factor loadings found at the between-groupslevel of analysis, indicating that the between-groups variancemay be considered much more reliable than the within-groupsvariance.” Higher between level loadings are also observable inapplied examples of multilevel CFA. For instance, Dyer et al.(2005) presented results of a multilevel CFA of a proceduralleadership scale that assessed the extent to which being formal,habitual, cautious, procedural, or ritualistic relate to effectiveleadership found that loadings were considerably higher on thebetween level. Hanges and Dickson (2006) showed a similarresult for an uncertainty avoidance scale. Accordingly, we studythe situation where the non-isomorphism manifests as a higherfactor loading on the between level. We note, however, that equalunstandardized loadings or items that are lower on the withinlevel are certainly not impossible and represent cases not coveredin the current Monte Carlo design.
Missing DataWe did not simulate missing data in the Monte Carlo results wereport below. Missing data can impact conclusions in MSEM,but this issue is beyond the scope of the current study. We referreaders to Hox (2010) or Heck and Thomas (2015) for furtherdiscussion ofmissing data issues in the context ofmultilevel SEM.
Experimental ConditionsModeling Approaches (2 Levels)Two modeling approaches were examined. In the first approach,model parameters on the within and the between level werefreely estimated regardless of the fact that the populationmodel specified that they were non-invariant. We did notconstrain loading parameters equal for items that were knownto be equivalent by design, since equating of probabilisticallyequivalent items could have confounded conclusions. To alsoconstrain the items that are probabilistically isomorphic to beexactly isomorphic runs the risk of contaminating conclusionsby mixing the effects of ignoring the non-isomorphism in itemsthat are non-isomorphic by design with the effects of ignoringprobabilistic non-isomorphism due to chance. In the secondapproach, loadings on the within and between levels for non-isomorphic items were constrained to be equal across levels,
Frontiers in Psychology | www.frontiersin.org 5 March 2016 | Volume 7 | Article 289
Guenole Isomorphism and Homology
regardless of the fact that the populationmodel specified that theywere not equivalent.
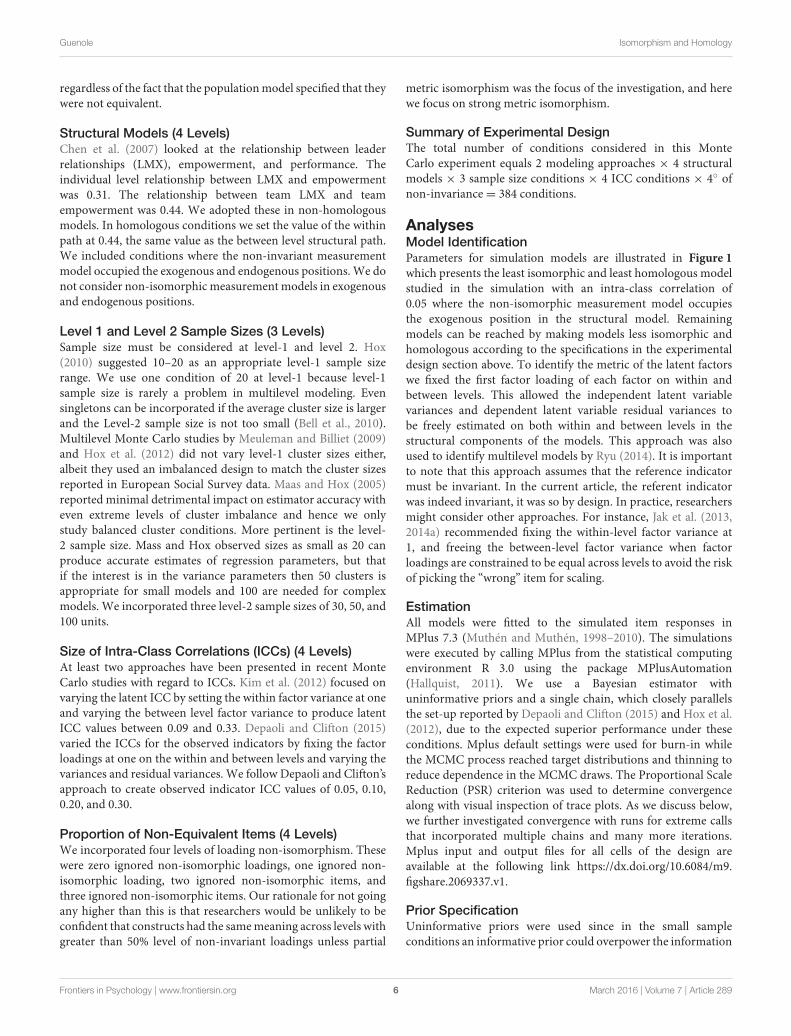
Structural Models (4 Levels)Chen et al. (2007) looked at the relationship between leaderrelationships (LMX), empowerment, and performance. Theindividual level relationship between LMX and empowermentwas 0.31. The relationship between team LMX and teamempowerment was 0.44. We adopted these in non-homologousmodels. In homologous conditions we set the value of the withinpath at 0.44, the same value as the between level structural path.We included conditions where the non-invariant measurementmodel occupied the exogenous and endogenous positions.We donot consider non-isomorphic measurement models in exogenousand endogenous positions.
Level 1 and Level 2 Sample Sizes (3 Levels)Sample size must be considered at level-1 and level 2. Hox(2010) suggested 10–20 as an appropriate level-1 sample sizerange. We use one condition of 20 at level-1 because level-1sample size is rarely a problem in multilevel modeling. Evensingletons can be incorporated if the average cluster size is largerand the Level-2 sample size is not too small (Bell et al., 2010).Multilevel Monte Carlo studies by Meuleman and Billiet (2009)and Hox et al. (2012) did not vary level-1 cluster sizes either,albeit they used an imbalanced design to match the cluster sizesreported in European Social Survey data. Maas and Hox (2005)reported minimal detrimental impact on estimator accuracy witheven extreme levels of cluster imbalance and hence we onlystudy balanced cluster conditions. More pertinent is the level-2 sample size. Mass and Hox observed sizes as small as 20 canproduce accurate estimates of regression parameters, but thatif the interest is in the variance parameters then 50 clusters isappropriate for small models and 100 are needed for complexmodels. We incorporated three level-2 sample sizes of 30, 50, and100 units.
Size of Intra-Class Correlations (ICCs) (4 Levels)At least two approaches have been presented in recent MonteCarlo studies with regard to ICCs. Kim et al. (2012) focused onvarying the latent ICC by setting the within factor variance at oneand varying the between level factor variance to produce latentICC values between 0.09 and 0.33. Depaoli and Clifton (2015)varied the ICCs for the observed indicators by fixing the factorloadings at one on the within and between levels and varying thevariances and residual variances. We follow Depaoli and Clifton’sapproach to create observed indicator ICC values of 0.05, 0.10,0.20, and 0.30.
Proportion of Non-Equivalent Items (4 Levels)We incorporated four levels of loading non-isomorphism. Thesewere zero ignored non-isomorphic loadings, one ignored non-isomorphic loading, two ignored non-isomorphic items, andthree ignored non-isomorphic items. Our rationale for not goingany higher than this is that researchers would be unlikely to beconfident that constructs had the samemeaning across levels withgreater than 50% level of non-invariant loadings unless partial
metric isomorphism was the focus of the investigation, and herewe focus on strong metric isomorphism.
Summary of Experimental DesignThe total number of conditions considered in this MonteCarlo experiment equals 2 modeling approaches × 4 structuralmodels × 3 sample size conditions × 4 ICC conditions × 4◦ ofnon-invariance= 384 conditions.
AnalysesModel IdentificationParameters for simulation models are illustrated in Figure 1
which presents the least isomorphic and least homologous modelstudied in the simulation with an intra-class correlation of0.05 where the non-isomorphic measurement model occupiesthe exogenous position in the structural model. Remainingmodels can be reached by making models less isomorphic andhomologous according to the specifications in the experimentaldesign section above. To identify the metric of the latent factorswe fixed the first factor loading of each factor on within andbetween levels. This allowed the independent latent variablevariances and dependent latent variable residual variances tobe freely estimated on both within and between levels in thestructural components of the models. This approach was alsoused to identify multilevel models by Ryu (2014). It is importantto note that this approach assumes that the reference indicatormust be invariant. In the current article, the referent indicatorwas indeed invariant, it was so by design. In practice, researchersmight consider other approaches. For instance, Jak et al. (2013,2014a) recommended fixing the within-level factor variance at1, and freeing the between-level factor variance when factorloadings are constrained to be equal across levels to avoid the riskof picking the “wrong” item for scaling.
EstimationAll models were fitted to the simulated item responses inMPlus 7.3 (Muthén and Muthén, 1998–2010). The simulationswere executed by calling MPlus from the statistical computingenvironment R 3.0 using the package MPlusAutomation(Hallquist, 2011). We use a Bayesian estimator withuninformative priors and a single chain, which closely parallelsthe set-up reported by Depaoli and Clifton (2015) and Hox et al.(2012), due to the expected superior performance under theseconditions. Mplus default settings were used for burn-in whilethe MCMC process reached target distributions and thinning toreduce dependence in the MCMC draws. The Proportional ScaleReduction (PSR) criterion was used to determine convergencealong with visual inspection of trace plots. As we discuss below,we further investigated convergence with runs for extreme callsthat incorporated multiple chains and many more iterations.Mplus input and output files for all cells of the design areavailable at the following link https://dx.doi.org/10.6084/m9.figshare.2069337.v1.
Prior SpecificationUninformative priors were used since in the small sampleconditions an informative prior could overpower the information
Frontiers in Psychology | www.frontiersin.org 6 March 2016 | Volume 7 | Article 289

Guenole Isomorphism and Homology
in the data (Hox et al., 2012). On the within and between levelsvariance parameter priors were inverse gamma corresponding toa uniform distributionU∼[0, infinity]. Loading parameter priorson the within and between levels were N∼(1, 0.1). Thresholdpriors on the between level were N∼(0, infinity). Regressionmean hyper-parameters were set to the population values withvariance of 0.10 so that the estimates would have greatest densityin the region of the generating value. For a technical discussionof the details of Bayesian estimation in the context of MSEMsreaders are referred to Hox (2010) or Asparouhov and Muthén(2010).
Model PerformanceWe examined the following indicators of model performancea) the proportion of non-converged and inadmissible solutionsb) the average posterior predictive p-value across replications b)the sum of loading errors across items within levels (since thesewere always in the same direction within conditions and the sumindicated the direction of the bias whereas the absolute bias doesnot) and c) the relative bias of latent variances and latent residualvariances, defined as the observed regression parameter minusthe true parameter divided by the true parameter (relative bias ofless than 10% was considered acceptable, between 10 and 20%as substantial, and greater than 20% as unacceptable). Finally,while the section of our design that ignored non-isomorphismcontained model set ups that were non-isomorphic by design, wealso comment on the ability of posterior predictive p-values todistinguish correctly and incorrectly specified models reflectingthe varying degrees of non-isomorphism in the study.
RESULTS
Convergence Checks and AdmissibilityAll models in all conditions converged to admissible solutions.This finding is consistent with research by Depaoli and Clifton(2015) that reported that the convergence rates for Bayesianestimation were near 100% even with uninformative priors. Theonly conditions that these researchers reported did not show100% convergence and admissibility rates were for combinationsof very low ICCs and very small level-2 sample sizes, twoconditions that were not incorporated in this simulation studyfor that reason.
van de Schoot et al. (2015a) observed that variance parametersestimated with Bayesian methods can be subject to spikes(i.e., extreme estimates) especially for variance terms, whichinflate parameter estimates. To examine whether this occurredin the current Monte Carlo study we checked trace plots forthe within and between exogenous latent variance and latentresidual variance parameters for a sample run from each ofthe 384 cells in the design. These showed that in general thetrace plots displayed tight horizontal bands without any obviousincreasing or decreasing patterns in the plots. These sample filesare uploaded to figshare at the following link: https://dx.doi.org/10.6084/m9.figshare.1619654.v3.
We then examined the issue of convergence further usingthe following approach. As a first step, we first identified thecells of the Monte Carlo design that had the largest estimate
variability for the four latent variance parameters in the models,the within latent exogenous variance, within latent residualvariance, and the between latent exogenous variance and betweenlatent residual variance. For the within latent exogenous varianceand within latent exogenous residual variance, these cells turnedout to be from the correctly specified section of the design, theywere cells numbered 100 and 148. These cells had the lowestnumber of level 2 units and the smallest ICC values (j = 30, ICC= 0.05) in the simulation.
These cells showed poor parameter recovery for the regressionparameters of either or both within and between level structuralcoefficients, even though they were correctly specified models. Aswe explain below, they are excluded from the results presentedbelow because of the impact of ignored non-isomorphism onregression parameter recovery since they were poorly estimatedeven when correctly specified. In addition to running furtherchecks on the accuracy for these excluded cells, therefore, we alsoidentified the cells with the greatest variation in these parametersthat were retained for further investigation of convergence.These cells where cell 100 and cell 148, respectively. Finally, weidentified the cells with the largest estimation variability for thebetween level latent exogenous variance and between level latentresidual variance, which were cells 15 and 156, respectively.
For all six specified cells we followed the following steps.First, we re-ran each of these cells using two chains with100,000 iterations, retaining the PSR criterion, and we requestedKolmogorov-Smirnov tests using the Tech 9 option in Mplusand confirmed there were no significant results. In addition tothese precautions, trace plots for a random run from each ofthese conditions inspected to ensure visual inspection of theplots showed good mixing and no obvious spiking. Results ofthese analyses for cells 100 and 148 showed that the structuralregression parameters were still too poorly estimated to warrantinclusion in the comparison of the isomorphismmisspecificationjust as was the case when using the default convergence criteria.
The estimates of the within latent exogenous variance andwithin latent residual variance in these cells were extremelyclose to the estimates from letting Mplus converge based onthe program’s default criteria. For the within latent exogenousvariance, the population value was 1.000, the default criteriaconverged to 0.962 and the longer run with additional diagnosticsconverged to 0.956. For the within latent residual variance thesevalues were 1.000, 1.086, and 1.065.
For the within latent exogenous variance in cell 16 thepopulation variance was 1.000, the Mplus default convergencecriteria produced 0.970, while the longer run with additionaldiagnostics converged to 0.963. For cell 156, the retained cellwith the greatest estimate variability for the within latent residualvariance, the population parameter was 1.000, the estimateproduced byMplus defaults was 1.053, and the estimate producedby the longer run with greater iterations and the additionalconvergence checks was 1.059.
Next we examined the cells with the greatest estimatevariability for the between latent exogenous variance and betweenlatent residual variance, cells 303 and 256, respectively. For thebetween latent exogenous variance the population value was 0.44,the estimate produced by Mplus default convergence criteria
Frontiers in Psychology | www.frontiersin.org 7 March 2016 | Volume 7 | Article 289

Guenole Isomorphism and Homology
was 0.614 and the estimate produced by the greater iterationsand multiple convergence criteria was 0.609. The correspondingvalues for the between latent residual variance were 0.44, 0.674,and 0.664.
Given that these checks on the cells with the largest variabilityin estimates show that the defaultMplus convergence criteria leadto very similar estimates to much longer iterations in the contextof this study, we concluded that the other cells in the design whichshowed less variability in estimates of these parameters have verylikely converged too under the default convergence criteria usedby the Mplus software.
Results of Posterior Predictive CheckingPosterior predictive p-values were examined as an indicatorof global fit for all models. The first results we consider arefor the correctly specified conditions. It was important toincorporate this condition because if we did not, it wouldbe impossible to know to what extent parameter bias in themisspecified conditionwas due to poor estimation and howmuchwas due to the misspecification under study. In other words,we needed to ensure that the correctly specified models wereestimated accurately so that any error in the models for themisspecified condition could clearly be attributed to the ignorednon-isomorphism. The ppp-values for the correctly specifiedconditions showed that the minimum proportion of replicationsin each cell with a PPP > 0.50 was 0.45. For this reason, we donot discuss global fit or parameter estimation accuracy for thecorrectly specified conditions further in this article. However, azip file of all Mplus input and output files, as well as a summaryexcel file where all parameters are extracted for convenientreading, are available at the following link https://dx.doi.org/10.6084/m9.figshare.2069334.v1.
The ppp statistic is known to be insensitive to smallmodel misspecifications with categorical data (Asparouhov andMuthén, 2010). Our results confirmed this finding. Moving fromthe correctly specified models through with zero items withignored non-invariance through to three items with ignorednon-invariance did not result in deterioration in the ppp-values,suggesting that the ppp-value is insensitive to the degrees ofignored isomorphism examined in this design, even for manyignored non-isomorphic items, large intra-class correlations, andthe highest number of level-2 units. While examining the efficacyof the ppp-value to test isomorphism was not the central focus ofthis article, it is nevertheless an important topic and we discussfuture research directions for testing isomorphism in multilevelmodeling with Bayesian estimators in our Discussion section.
Local Accuracy Results for CorrectlySpecified ModelsAll results we now discuss are available at the followinglink https://dx.doi.org/10.6084/m9.figshare.2069334.v1. Weexamined local fit in terms of the relative bias of the regressionparameters on the within and between levels, as the regressioncoefficients summarized the key result we are focusing on inthis study. The relative bias for the regression parameters on thewithin and between levels for the correctly specified conditionswere always acceptable on average with a single exception. The
only conditions where this pattern was violated was for thelowest level of ICC = 0.05. In this condition, even the largestlevel 2 sample size of 100 was not enough to offset the effect ofsmall ICCs on estimation accuracy, despite that level-2 samplesize and ICC values are known to have an interactive impact onaccuracy in the context of multilevel models.
In the current study, increasing the sample size from 30to 50 and 100 while maintaining the 0.05 ICC for the latentvariable ameliorated, but did not eliminate the estimation error.For this reason, in the results that follow for the misspecifiedcondition, we remove conditions where the ICC was 0.05, sinceany estimation error in the incorrectly specified model would notbe uniquely attributable to the intended model misspecification.Estimation in these other conditions was deemed acceptableand we therefore do report these conditions were the itemswere misspecified as being invariant. We do not discuss theparameter accuracy of the correctly specified conditions furtherin this article, however, these results can be examined in both theoriginal Mplus input and output scripts and excel summary filementioned earlier.
Local Accuracy Results for MisspecifiedModel ConditionsAll results we now discuss are available at the following linkhttps://dx.doi.org/10.6084/m9.figshare.2069334.v1.We now turnto discussion of local estimation accuracy, beginning withdiscussion of the within and between loadings and latent varianceand residual latent variances, before turning to within andbetween regression coefficients. The tables of results for each ofthese sets of parameters are presented along with discussion ofresults below. Tables 1, 2 below present an overall summary oftrends in estimation error of regression coefficients, variances,and loadings on within and between levels. Each cell of thistable contains two pieces of information. First the table liststhe sign of the misestimation of the specific parameter for thehighest degree of ignored non-isomorphism. These values alwaystake on one of the following three values: negative, acceptable,or positive. Second, each cell also contains the direction ofchange in the estimation error due to increasing levels of ignorednon-isomorphism. These cells entries read either yes or no. Ayes indicates that increased ignored non-isomorphism led toincreased bias in the specified direction, while no indicates thatthere was little or no change in the estimation accuracy from thelowest to the highest degree of ignored non-invariance.
Within and between LoadingsTables 3–6 contain the sum of bias across factor loadings forconditions where the non-isoporphism was on the exogenousand endogenous measurement models and when the structuralcoefficient was homologous and non-homologous. Within theexogenous and endogenous conditions the bias for loadingswas always in the same direction, and so here we report thesum of bias. Given that the bias was generally very smallloadings about zero or positive (or negative) within conditionsthis is similar to reporting the absolute bias except the signof the bias is maintained. When the misspecified measurementmodel was in the exogenous position the exogenous loading
Frontiers in Psychology | www.frontiersin.org 8 March 2016 | Volume 7 | Article 289

Guenole Isomorphism and Homology
TABLE 1 | Summary of impact of ignored isomorphism on structural
coefficients.
Misspecified IV Misspecified DV
Within beta Positive Yes Negative Yes
Between beta Negative Yes Positive Yes
Each cell of this table contains two pieces of information, the sign of the misestimation
of for the parameter under the highest degree of ignored non-isomorphism (negative,
acceptable, or positive), and the direction of change in the estimation error due to
increasing levels of ignored non-isomorphism where yes indicates that increased ignored
non-isomorphism led to increased bias in the specified direction and no indicates that
there was little or no change in the estimation accuracy from the lowest to the highest
degree of ignored non-invariance.
TABLE 2 | Summary of impact of ignored isomorphism on loadings and
variances.
Misspecified IV Misspecified DV
Latent IV Latent DV Latent IV Latent DV
Within loading Negative Negative Negative Negative
Yes No Yes No
Between loading Positive Acceptable Positive Acceptable
Yes Yes
Within variance/
Residual variance
Negative Positive Negative Negative
Yes No Yes Yes
Between variance/
Residual variance.
Positive Acceptable Acceptable Positive
Yes Yes
Each cell of this table contains two pieces of information, the sign of the misestimation
of for the parameter under the highest degree of ignored non-isomorphism (negative,
acceptable, or positive), and the direction of change in the estimation error due to
increasing levels of ignored non-isomorphism where yes indicates that increased ignored
non-isomorphism led to increased bias in the specified direction and no indicates that
there was little or no change in the estimation accuracy from the lowest to the highest
degree of ignored non-invariance.
bias was negative and the bias increased with greater ignorednon-isomorphism. On the between level the exogenous loadingbias was positive and the positive bias increased with greaterignored non-isomorphism. The endogenous latent loadings werenegative and stable with increased non-invariance on the withinlevel and were acceptable on the between level. When themisspecifiedmeasurementmodel was in the endogenous positionthe exogenous latent loadings on the within level were negativelybiased and the bias increased with further un-modeled non-isomorphism while the loading bias on the between level waspositive and increasingly so with greater non-isomorphism. Theloading bias for the endogenous latent variable was negative andstable with further non-isomorphism while the loading bias onthe between level for the endogenous latent was acceptable.
Within and between Latent Variances and Latent
Residual VariancesTables 3–6 present the relative bias for the latent variances andlatent residual variances. These tables show that when the non-invariant measurement model occupied an exogenous position
in the structural model, the relative bias in exogenous latentvariance on the within level was negative and this negativebias increased with increased ignored non-isomorphism, whilethe between level exogenous latent variance was positive andthe positive bias increased with higher levels of ignored non-isomorphism. The endogenous latent residual variance onthe within level was negatively biased, but was stable withincreased ignored non-isomorphism. On the between level thelatent residual variance relative bias was acceptable. When themisspecifiedmeasurementmodel was in the endogenous positionthe within level relative bias was negative and increasingly sowith further ignored non-isomorphism. On the between level thelatent variance relative bias was acceptable. The residual latentvariable variance on the within level was increasingly negativewith greater ignored non-isomorphism while the between levelresidual variance was positively bias, with bias increasing as morenon-isomorphism was ignored.
Within and between Structural CoefficientsTables 7–10 below summarize the accuracy for structuralcoefficients on the within and between level where the non-invariant measurement model was in the exogenous andendogenous position in the structural model and when thestructural relationship was homologous and non-homologous.This table reveals consistent patterns across simplify reporting ofthe results. First, increased levels of misspecification consistentlyled to increased relative bias. Unacceptable increases in relativebias occurred for even a single equated but non-isomorphicitem.When the ignored non-isomorphism was on the exogenousmeasurement model, the within level structural coefficientbecame increasingly positively biased and the between levelstructural coefficient became increasingly negatively biased withincreased ignored non-isomorphism. When the ignored non-isomorphism was on the endogenous measurement modelthe within level structural coefficient became increasinglynegatively biased and the between level structural coefficientbecame increasingly positively biased with greater ignored non-isomorphism.
DISCUSSION
Psychometric isomorphism is an important topic in the socialsciences, but until recently it has been viewed as a considerationof secondary importance to applied researchers who haveemphasized the importance of homology. Recently, research inmultilevel modeling has focused on methods for testing differentforms of isomorphism in the context of MSEMs (Jak et al., 2013,2014b; Ryu, 2014, 2015; Kim et al., 2015) as well as the aspectsof the research design that produce accurate parameter estimatesunder different estimation approaches, for example, the numberof level-2 clusters required for accurate estimation of parametersusing maximum likelihood and Bayesian estimators (Hox et al.,2012, 2014). Until now, however, the connection betweenpsychometric isomorphism and homology in the context ofMSEMs has not been thoroughly explored. In this article, weused a Monte Carlo design to explore the impact of ignoring
Frontiers in Psychology | www.frontiersin.org 9 March 2016 | Volume 7 | Article 289

Guenole Isomorphism and Homology
TABLE 3 | Latent variable parameter accuracy for homologous condition with non-invariant IV measurement models.
j ICC Items Within Latent IV Within Latent DV Between Latent IV Between Latent DV
Load Var Var Load Var Var Load Var Var Load Var Var
Sum Rel Cov Sum Rel Cov Sum Rel Cov Sum Rel Cov
Bias Bias (%) Bias Bias (%) Bias Bias (%) Bias Bias (%)
30 0.10 0 −0.38 1 0.92 −0.18 8 0.89 −0.36 −3 0.73 0.10 4 0.89
1 −0.55 −6 0.87 −0.19 7 0.90 0.73 35 0.86 0.02 13 0.91
2 −0.75 −13 0.80 −0.18 7 0.91 1.20 58 0.88 0.06 10 0.90
3 −0.94 −21 0.70 −0.19 7 0.90 1.40 72 0.84 0.07 10 0.91
0.15 0 −0.39 0 0.89 −0.18 8 0.89 −0.44 1 0.86 0.20 6 0.94
1 −0.70 −10 0.81 −0.21 7 0.89 0.62 32 0.95 0.21 4 0.93
2 −1.05 −21 0.67 −0.18 7 0.91 1.02 52 0.87 0.10 5 0.93
3 −1.31 −31 0.54 −0.21 6 0.90 1.15 59 0.83 0.08 9 0.93
0.20 0 −0.39 0 0.90 −0.22 6 0.90 −0.37 3 0.93 0.22 5 0.95
1 −0.90 −15 0.76 −0.19 7 0.90 0.50 27 0.93 0.16 6 0.94
2 −1.32 −28 0.57 −0.19 8 0.90 0.83 41 0.89 0.20 6 0.94
3 −1.66 −39 0.40 −0.17 8 0.90 0.89 46 0.87 0.18 7 0.93
50 0.10 0 −0.19 1 0.91 −0.08 5 0.92 −0.24 2 0.84 0.07 5 0.94
1 −0.40 −6 0.87 −0.11 5 0.91 0.80 34 0.92 0.06 7 0.91
2 −0.42 −8 0.87 −0.09 5 0.91 0.72 25 0.93 0.09 5 0.93
3 −0.84 −23 0.62 −0.12 3 0.91 1.47 75 0.68 0.06 7 0.91
0.15 0 −0.19 0 0.92 −0.10 4 0.94 −0.20 1 0.91 0.16 3 0.93
1 −0.61 −12 0.79 −0.09 5 0.91 0.72 31 0.91 0.13 4 0.93
2 −0.95 −23 0.59 −0.10 4 0.91 1.09 51 0.80 0.07 6 0.94
3 −1.23 −33 0.40 −0.07 5 0.92 1.19 56 0.75 0.05 6 0.93
0.20 0 −0.22 0 0.89 −0.10 5 0.91 −0.23 1 0.93 0.12 5 0.93
1 −0.79 −17 0.73 −0.12 4 0.91 0.59 26 0.90 0.14 2 0.94
2 −1.25 −31 0.43 −0.11 4 0.92 0.88 39 0.83 0.11 5 0.95
3 −1.66 −43 0.20 −0.12 4 0.90 0.87 40 0.84 0.12 3 0.95
100 0.10 0 −0.09 0 0.94 −0.09 1 0.91 −0.15 0 0.89 0.12 1 0.91
1 −0.33 −8 0.84 −0.04 3 0.91 0.89 37 0.86 0.06 2 0.92
2 −0.33 −9 0.83 −0.03 3 0.91 0.81 24 0.91 0.02 4 0.93
3 −0.78 −24 0.44 −0.05 2 0.92 1.52 69 0.43 0.04 4 0.93
0.15 0 −0.11 0 0.91 −0.05 2 0.91 −0.17 0 0.92 0.07 1 0.94
1 −0.47 −12 0.78 −0.04 3 0.92 0.80 30 0.84 0.06 2 0.93
2 −0.90 −25 0.41 −0.05 2 0.90 1.13 48 0.62 0.05 2 0.95
3 −1.17 −35 0.18 −0.07 2 0.91 1.22 53 0.50 0.05 2 0.94
0.20 0 −0.10 0 0.91 −0.05 2 0.92 −0.08 2 0.94 0.04 2 0.93
1 −0.68 −17 0.62 −0.05 2 0.91 0.67 26 0.85 0.06 1 0.94
2 −1.26 −34 0.12 −0.06 1 0.92 0.87 36 0.70 0.07 1 0.93
3 −1.61 −44 0.04 −0.05 2 0.92 0.89 37 0.68 0.06 2 0.94
j is the number of level-2 units; ICC, intra-class correlation; items refers to the number of ignored non-isomorphic items; IV, Independent variable; DV, dependent variable; Load, Loading;
Sum Bias, sum of absolute bias on loading parameters; Var, latent factor variance if it is under a latent IV heading and latent residual variance if it is under a latent DV heading; Rel Bias,
relative bias expressed as a percentage; Cov, coverage expressed as a proportion.
isomorphism on conclusions about homology. We note that ourresults apply to the condition of higher between level loadings.
Main FindingsThe results of this study reveal that the connection is anintimate one. In particular, the direction of the estimationerror for the within and between level structural coefficients
depends on the degree of the bias in within and betweenfactor loadings and within and between latent variances. Evenminor levels of item non-isomorphism cannot be ignoredwithout jeopardizing the accuracy of structural parameterestimates across levels of analysis in MSEM studies. Whenthe item non-isomorphism exists and is ignored on theexogenous measurement model, the within structural coefficient
Frontiers in Psychology | www.frontiersin.org 10 March 2016 | Volume 7 | Article 289
Guenole Isomorphism and Homology
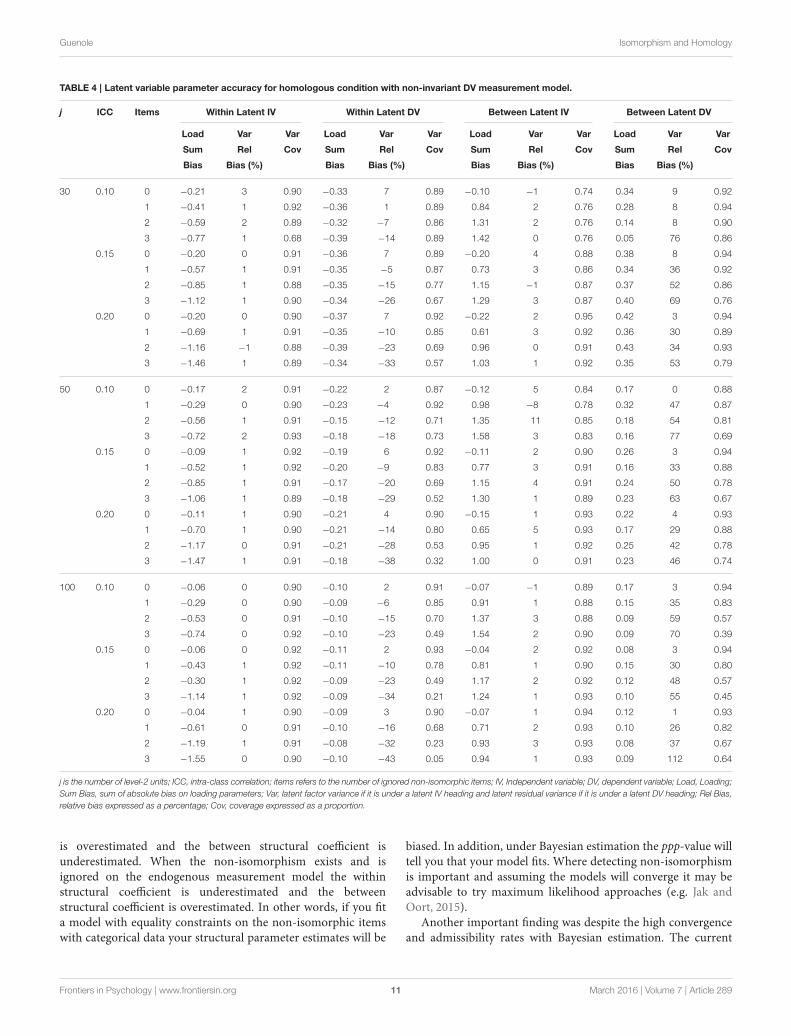
TABLE 4 | Latent variable parameter accuracy for homologous condition with non-invariant DV measurement model.
j ICC Items Within Latent IV Within Latent DV Between Latent IV Between Latent DV
Load Var Var Load Var Var Load Var Var Load Var Var
Sum Rel Cov Sum Rel Cov Sum Rel Cov Sum Rel Cov
Bias Bias (%) Bias Bias (%) Bias Bias (%) Bias Bias (%)
30 0.10 0 −0.21 3 0.90 −0.33 7 0.89 −0.10 −1 0.74 0.34 9 0.92
1 −0.41 1 0.92 −0.36 1 0.89 0.84 2 0.76 0.28 8 0.94
2 −0.59 2 0.89 −0.32 −7 0.86 1.31 2 0.76 0.14 8 0.90
3 −0.77 1 0.68 −0.39 −14 0.89 1.42 0 0.76 0.05 76 0.86
0.15 0 −0.20 0 0.91 −0.36 7 0.89 −0.20 4 0.88 0.38 8 0.94
1 −0.57 1 0.91 −0.35 −5 0.87 0.73 3 0.86 0.34 36 0.92
2 −0.85 1 0.88 −0.35 −15 0.77 1.15 −1 0.87 0.37 52 0.86
3 −1.12 1 0.90 −0.34 −26 0.67 1.29 3 0.87 0.40 69 0.76
0.20 0 −0.20 0 0.90 −0.37 7 0.92 −0.22 2 0.95 0.42 3 0.94
1 −0.69 1 0.91 −0.35 −10 0.85 0.61 3 0.92 0.36 30 0.89
2 −1.16 −1 0.88 −0.39 −23 0.69 0.96 0 0.91 0.43 34 0.93
3 −1.46 1 0.89 −0.34 −33 0.57 1.03 1 0.92 0.35 53 0.79
50 0.10 0 −0.17 2 0.91 −0.22 2 0.87 −0.12 5 0.84 0.17 0 0.88
1 −0.29 0 0.90 −0.23 −4 0.92 0.98 −8 0.78 0.32 47 0.87
2 −0.56 1 0.91 −0.15 −12 0.71 1.35 11 0.85 0.18 54 0.81
3 −0.72 2 0.93 −0.18 −18 0.73 1.58 3 0.83 0.16 77 0.69
0.15 0 −0.09 1 0.92 −0.19 6 0.92 −0.11 2 0.90 0.26 3 0.94
1 −0.52 1 0.92 −0.20 −9 0.83 0.77 3 0.91 0.16 33 0.88
2 −0.85 1 0.91 −0.17 −20 0.69 1.15 4 0.91 0.24 50 0.78
3 −1.06 1 0.89 −0.18 −29 0.52 1.30 1 0.89 0.23 63 0.67
0.20 0 −0.11 1 0.90 −0.21 4 0.90 −0.15 1 0.93 0.22 4 0.93
1 −0.70 1 0.90 −0.21 −14 0.80 0.65 5 0.93 0.17 29 0.88
2 −1.17 0 0.91 −0.21 −28 0.53 0.95 1 0.92 0.25 42 0.78
3 −1.47 1 0.91 −0.18 −38 0.32 1.00 0 0.91 0.23 46 0.74
100 0.10 0 −0.06 0 0.90 −0.10 2 0.91 −0.07 −1 0.89 0.17 3 0.94
1 −0.29 0 0.90 −0.09 −6 0.85 0.91 1 0.88 0.15 35 0.83
2 −0.53 0 0.91 −0.10 −15 0.70 1.37 3 0.88 0.09 59 0.57
3 −0.74 0 0.92 −0.10 −23 0.49 1.54 2 0.90 0.09 70 0.39
0.15 0 −0.06 0 0.92 −0.11 2 0.93 −0.04 2 0.92 0.08 3 0.94
1 −0.43 1 0.92 −0.11 −10 0.78 0.81 1 0.90 0.15 30 0.80
2 −0.30 1 0.92 −0.09 −23 0.49 1.17 2 0.92 0.12 48 0.57
3 −1.14 1 0.92 −0.09 −34 0.21 1.24 1 0.93 0.10 55 0.45
0.20 0 −0.04 1 0.90 −0.09 3 0.90 −0.07 1 0.94 0.12 1 0.93
1 −0.61 0 0.91 −0.10 −16 0.68 0.71 2 0.93 0.10 26 0.82
2 −1.19 1 0.91 −0.08 −32 0.23 0.93 3 0.93 0.08 37 0.67
3 −1.55 0 0.90 −0.10 −43 0.05 0.94 1 0.93 0.09 112 0.64
j is the number of level-2 units; ICC, intra-class correlation; items refers to the number of ignored non-isomorphic items; IV, Independent variable; DV, dependent variable; Load, Loading;
Sum Bias, sum of absolute bias on loading parameters; Var, latent factor variance if it is under a latent IV heading and latent residual variance if it is under a latent DV heading; Rel Bias,
relative bias expressed as a percentage; Cov, coverage expressed as a proportion.
is overestimated and the between structural coefficient isunderestimated. When the non-isomorphism exists and isignored on the endogenous measurement model the withinstructural coefficient is underestimated and the betweenstructural coefficient is overestimated. In other words, if you fita model with equality constraints on the non-isomorphic itemswith categorical data your structural parameter estimates will be
biased. In addition, under Bayesian estimation the ppp-value willtell you that your model fits. Where detecting non-isomorphismis important and assuming the models will converge it may beadvisable to try maximum likelihood approaches (e.g. Jak andOort, 2015).
Another important finding was despite the high convergenceand admissibility rates with Bayesian estimation. The current
Frontiers in Psychology | www.frontiersin.org 11 March 2016 | Volume 7 | Article 289

Guenole Isomorphism and Homology
TABLE 5 | Latent variable parameter accuracy for non-homologous condition with non-invariant IV measurement model.
j ICC Items Within Latent IV Within Latent DV Between Latent IV Between Latent DV
Load Var Var Load Var Var Load Var Var Load Var Var
Sum Rel Cov Sum Rel Cov Sum Rel Cov Sum Rel Cov
Bias Bias (%) Bias Bias (%) Bias Bias (%) Bias Bias (%)
30 0.10 0 −0.35 3 0.91 −0.20 8 0.91 −0.36 −4 0.74 −0.17 5 0.91
1 −0.59 −6 0.85 −0.18 7 0.91 0.63 32 0.88 −0.09 6 0.93
2 −0.76 −13 0.80 −0.20 6 0.90 1.19 63 0.89 0.02 11 0.92
3 −0.96 −23 0.70 −0.20 5 0.90 1.38 74 0.83 0.06 13 0.91
0.15 0 −0.35 0 0.91 −0.19 8 0.92 −0.40 3 0.85 −0.20 4 0.95
1 −0.73 −11 0.81 −0.22 5 0.92 0.62 32 0.92 −0.17 8 0.94
2 −1.02 −21 0.69 −0.18 7 0.89 1.04 50 0.89 −0.09 10 0.94
3 −1.32 −31 0.53 −0.18 7 0.91 1.13 59 0.86 −0.15 8 0.94
0.20 0 −0.35 2 0.91 −0.23 6 0.90 −0.38 5 0.90 −0.23 7 0.95
1 −0.92 −16 0.77 −0.23 6 0.91 0.52 31 0.92 −0.19 5 0.95
2 −1.39 −29 0.57 −0.18 8 0.91 0.81 −11 0.94 −0.17 40 0.89
3 −1.68 −39 0.40 −0.24 5 0.88 0.86 44 0.88 −0.21 4 0.95
50 0.10 0 −0.22 0 0.91 −0.13 4 0.90 −0.21 3 0.84 −0.09 6 0.93
1 −0.44 −7 0.83 −0.12 3 0.91 0.77 35 0.90 −0.02 6 0.92
2 −0.67 −15 0.72 −0.10 5 0.90 1.28 60 0.82 −0.06 7 0.92
3 −0.90 −25 0.59 −0.09 0 1.00 1.43 74 0.69 −0.03 7 0.91
0.15 0 −0.23 −3 0.92 −0.12 4 0.92 −0.26 1 0.90 −0.15 2 0.95
1 −0.60 −12 0.79 −0.12 4 0.92 0.72 32 0.90 −0.12 4 0.93
2 −0.96 −23 0.59 −0.10 5 0.91 1.09 50 0.80 −0.05 6 0.94
3 −1.23 −33 0.40 −0.11 4 0.89 1.19 58 0.74 −0.15 3 0.94
0.20 0 −0.21 0 0.90 −0.11 5 0.91 −0.20 1 0.92 −0.14 5 0.94
1 −0.78 −17 0.72 −0.12 4 0.91 0.61 27 0.89 −0.13 4 0.93
2 −1.32 −32 0.42 −0.13 4 0.91 0.85 38 0.83 −0.16 1 0.94
3 −1.68 −43 0.21 −0.13 3 0.92 0.84 41 0.83 −0.16 2 0.94
100 0.10 0 −0.08 1 0.94 −0.06 2 0.93 −0.14 1 0.89 −0.10 2 0.90
1 −0.34 −8 0.84 −0.05 1 0.92 0.86 35 0.86 −0.02 4 0.93
2 −0.60 −17 0.67 −0.03 3 0.92 1.32 59 0.60 −0.02 4 0.93
3 −0.80 −25 0.40 −0.06 2 0.92 1.48 69 0.45 0.01 7 0.95
0.15 0 −0.10 1 0.91 −0.06 1 0.91 −0.12 3 0.89 −0.05 3 0.94
1 −0.37 −9 0.81 −0.06 2 0.92 0.87 33 0.86 −0.04 4 0.93
2 −0.58 −16 0.67 −0.06 1 0.93 1.32 54 0.64 −0.03 3 0.92
3 −0.79 −24 0.45 −0.04 2 0.92 1.49 68 0.44 −0.01 4 0.93
0.20 0 −0.10 1 0.93 −0.07 1 0.91 −0.10 2 0.92 −0.07 2 0.94
1 −0.72 −19 0.59 −0.06 1 0.92 0.64 24 0.84 −0.05 3 0.94
2 −1.25 −34 0.17 −0.05 2 0.91 0.89 37 0.70 −0.08 2 0.94
3 −1.65 −45 0.03 −0.05 2 0.92 0.87 37 0.71 −0.05 2 0.94
j is the number of level-2 units; ICC, intra-class correlation; items refers to the number of ignored non-isomorphic items; IV, Independent variable; DV, dependent variable; Load, Loading;
Sum Bias, sum of absolute bias on loading parameters; Var, latent factor variance if it is under a latent IV heading and latent residual variance if it is under a latent DV heading; Rel Bias,
relative bias expressed as a percentage; Cov, coverage expressed as a proportion.
study showed that even Bayesian estimation has limits withregard to estimation accuracy with very low level-2 samplesizes and low ICCs. This finding affirms the results of Hoxet al. (2014) and Hox et al. (2012) who also observed limitson the estimation accuracy of Bayesian methods, even thoughBayesian estimation outperformed Maximum Likelihood intheir studies in this regard. In this study the smallest ICC
condition of 0.05 led to unacceptable relative bias in the betweenregression parameters even in the correctly specified conditionsof the simulation. This estimation error was mitigated but noteliminated by increasing the level-2 sample size to 100 units. Itis generally accepted that small ICCs can still warrant Level-2modeling if the Level-2 factor is of theoretical interest. However,it is advisable that researchers investigating isomorphism and
Frontiers in Psychology | www.frontiersin.org 12 March 2016 | Volume 7 | Article 289

Guenole Isomorphism and Homology
TABLE 6 | Latent variable parameter accuracy for non-homologous condition with non-invariant DV measurement model.
j ICC Items Within Latent IV Within Latent DV Between Latent IV Between Latent DV
Load Var Var Load Var Var Load Var Var Load Var Var
Sum Rel Cov Sum Rel Cov Sum Rel Cov Sum Rel Cov
Bias Bias (%) Bias Bias (%) Bias Bias (%) Bias Bias (%)
30 0.10 0 −0.20 1 0.90 −0.36 7 0.92 −0.16 −1 0.76 −0.30 3 0.89
1 −0.45 2 0.91 −0.36 −2 0.85 −0.76 −1 0.75 −0.33 33 0.96
2 −0.70 1 0.88 −0.35 −11 0.82 1.28 2 0.74 −0.13 58 0.91
3 −0.82 1 0.91 −0.38 1 0.91 1.49 3 0.76 −0.22 79 0.87
0.15 0 −0.23 1 0.91 −0.38 7 0.90 −0.19 2 0.87 −0.42 8 0.93
1 −0.61 0 0.90 −0.38 −7 0.87 0.71 4 0.87 −0.41 33 0.93
2 −0.89 2 0.91 −0.32 −16 0.80 1.13 4 0.88 −0.34 53 0.83
3 −1.14 1 0.89 −0.32 −25 0.67 1.25 3 0.89 −0.36 65 0.80
0.20 0 −0.22 1 0.90 −0.36 6 0.92 −0.26 5 0.96 −0.39 2 0.92
1 −0.71 0 0.91 −0.38 −10 0.83 0.61 1 0.90 −0.37 29 0.91
2 −1.28 1 0.90 −0.35 −27 0.64 0.86 2 0.89 −0.43 42 0.86
3 −1.51 0 0.90 −0.37 −34 0.52 0.98 2 0.92 −0.34 48 0.82
50 0.10 0 −0.15 1 0.90 −0.21 3 0.93 −0.14 2 0.85 −0.30 5 0.93
1 −0.38 1 0.91 −0.19 −5 0.87 0.84 0 0.84 −0.27 35 0.91
2 −0.59 1 0.91 −0.20 −13 0.81 1.32 2 0.85 −0.28 59 0.81
3 −0.81 1 0.91 −0.19 −21 0.68 1.49 5 0.84 −0.24 70 0.73
0.15 0 −0.14 1 0.90 −0.19 3 0.92 −0.12 4 0.90 −0.22 4 0.94
1 −0.53 2 0.90 −0.19 −9 0.82 0.75 6 0.92 −0.19 32 0.90
2 −0.91 1 0.90 −0.19 −22 0.65 1.10 2 0.90 −0.23 52 0.77
3 −1.19 1 0.91 −0.17 −31 0.48 1.21 3 0.90 −0.21 57 0.73
0.20 0 −0.11 1 0.94 −0.21 5 0.91 −0.13 0 0.92 −0.26 4 0.95
1 −0.76 1 0.91 −0.20 −15 0.76 0.62 2 0.94 −0.16 25 0.88
2 −1.27 0 0.90 −0.22 −30 0.47 0.88 3 0.92 −0.23 40 0.81
3 −1.64 0 0.91 −0.22 −42 0.28 0.90 3 0.93 −0.20 43 0.77
100 0.10 0 −0.06 1 0.91 −0.09 2 0.92 −0.08 1 0.90 −0.13 4 0.94
1 −0.33 1 0.92 −0.10 −8 0.84 0.90 3 0.89 −0.11 32 0.84
2 −0.57 0 0.91 −0.11 −16 0.67 1.34 3 0.87 −0.16 59 0.60
3 −0.80 0 0.90 −0.10 −25 0.45 1.48 4 0.90 −0.08 67 0.44
0.15 0 −0.05 1 0.90 −0.08 2 0.92 −0.07 1 0.91 −0.17 2 0.93
1 −0.33 0 0.92 −0.08 −7 0.83 0.89 2 0.89 −0.14 33 0.86
2 −0.56 1 0.90 −0.08 −15 0.68 1.33 2 0.89 −0.12 55 0.61
3 −0.83 0 0.91 −0.10 −25 0.43 1.46 3 0.91 −0.11 66 0.48
0.20 0 −0.05 2 0.91 −0.10 0 0.88 −0.06 0 0.94 −0.12 1 0.93
1 −0.69 1 0.91 −0.09 −17 0.63 0.67 3 0.94 −0.08 25 0.83
2 −1.29 1 0.93 −0.09 −34 0.21 0.86 0 0.94 −0.09 35 0.69
3 −1.66 0 0.91 −0.09 −45 0.03 0.85 2 0.94 −0.10 35 0.67
j is the number of level-2 units; ICC, intra-class correlation; items refers to the number of ignored non-isomorphic items; IV, Independent variable; DV, dependent variable; Load, Loading;
Sum Bias, sum of absolute bias on loading parameters; Var, latent factor variance if it is under a latent IV heading and latent residual variance if it is under a latent DV heading; Rel Bias,
relative bias expressed as a percentage; Cov, coverage expressed as a proportion.
homology with small ICCs get very large sample sizes, i.e.,in excess of 100 units. In many cases, this is a difficult task.For instance, when countries are studied the average level-2 sample size is often much lower. In cases such as this, itis recommended that researchers consider adopting a weaklyinformative or informative prior and examine the sensitivityof the modeling results to the choice of prior by following
techniques described, for example, by Depaoli and van de Schoot(2015).
Limitations and Future DirectionsAs one of our reviewers pointed out, if larger factor loadingsare at the within level, factor loadings at the within level couldbe underestimated and factor loadings at the between-level
Frontiers in Psychology | www.frontiersin.org 13 March 2016 | Volume 7 | Article 289

Guenole Isomorphism and Homology
TABLE 7 | Structural parameter accuracy for homologous condition with
non-invariant IV measurement model.
j ICC Items Within Beta Between Beta
Rel bias (%) Coverage Rel bias (%) Coverage
30 0.10 0 5 0.93 7 0.96
1 8 0.91 −15 0.95
2 15 0.90 −17 0.91
3 20 0.87 −21 0.89
0.15 0 7 0.91 7 0.95
1 10 0.90 −10 0.95
2 20 0.86 −19 0.92
3 28 0.82 −17 0.92
0.20 0 5 0.93 2 0.95
1 15 0.89 −9 0.95
2 24 0.84 −12 0.93
3 35 0.77 −15 0.92
50 0.10 0 4 0.94 −1 0.95
1 6 0.93 −11 0.93
2 9 0.91 −11 0.93
3 18 0.83 −23 0.86
0.15 0 3 0.94 5 0.95
1 10 0.89 −12 0.96
2 18 0.83 −16 0.90
3 28 0.74 −17 0.90
0.20 0 3 0.93 4 0.96
1 13 0.88 −10 0.94
2 24 0.78 −16 0.93
3 37 0.63 −15 0.92
100 0.10 0 1 0.93 1 0.93
1 6 0.90 −15 0.90
2 7 0.90 −12 0.91
3 17 0.74 −24 0.82
0.15 0 1 0.93 1 0.95
1 8 0.89 −11 0.92
2 18 0.73 −17 0.89
3 25 0.61 −19 0.85
0.20 0 2 0.91 2 0.94
1 11 0.83 −9 0.93
2 24 0.62 −14 0.92
3 37 0.37 −14 0.90
j is the number of level-2 units; ICC, intra-class correlation; items refers to the number
of ignored non-isomorphic items; Rel bias, relative bias expressed as a percentage; Cov,
coverage expressed as a proportion.
over-estimated. Consequently, to compensate for the lower(higher) loadings, the factor variance at the within level wouldbe overestimated and the factor variance at the between levelwould be underestimated. This could then have consequencesfor the structural coefficient in the opposite directions fromthe current study. This thought experiment highlights that thecurrent conclusions are specific to the situation with larger factorloadings at the between level and non-isomorphism in one of themeasurement models.
TABLE 8 | Structural parameter accuracy for homologous condition with
non-invariant DV measurement model.
j ICC Items Within Beta Between Beta
Rel bias (%) Coverage Rel bias (%) Coverage
30 0.10 0 3 0.94 3 0.97
1 0 0.92 10 0.95
2 −3 0.92 31 0.94
3 −7 0.87 38 0.94
0.15 0 5 0.92 1 0.96
1 −1 0.93 19 0.95
2 −7 0.89 23 0.95
3 −13 0.86 33 0.94
0.20 0 6 0.94 2 0.95
1 −4 0.91 14 0.96
2 −12 0.85 34 0.93
3 −18 0.80 29 0.94
50 0.10 0 4 0.90 17 0.88
1 3 0.96 27 0.92
2 −4 0.91 26 0.90
3 −10 0.87 36 0.91
0.15 0 3 0.92 4 0.95
1 −4 0.91 13 0.95
2 −11 0.85 25 0.93
3 −16 0.78 33 0.93
0.20 0 2 0.92 2 0.96
1 −7 0.95 13 0.95
2 −15 0.78 22 0.93
3 −22 0.67 26 0.94
100 0.10 0 1 0.94 2 0.95
1 −3 0.92 16 0.94
2 −8 0.86 28 0.89
3 −13 0.75 33 0.88
0.15 0 1 0.93 0 0.95
1 −5 0.89 16 0.94
2 −12 0.78 21 0.90
3 −19 0.56 27 0.89
0.20 0 2 0.92 1 0.94
1 −8 0.86 11 0.95
2 −18 0.61 18 0.92
3 −24 0.38 20 0.91
j is the number of level-2 units; ICC, intra-class correlation; items refers to the number
of ignored non-isomorphic items; Rel bias, relative bias expressed as a percentage; Cov,
coverage expressed as a proportion.
In terms of methodological limitations, the current studyshares certain similar characteristics to the BayesianMonte Carlostudy reported by Hox et al. (2012) in that we were also unableto inspect trace plots for parameter convergence for all modelsdue to many thousands of models that were estimated, butwe emphasize inspection of convergence is critical in appliedapplications. We also undertook extensive further investigationsof the extreme cells in our study. We adopted not to use
Frontiers in Psychology | www.frontiersin.org 14 March 2016 | Volume 7 | Article 289

Guenole Isomorphism and Homology
TABLE 9 | Structural parameter accuracy for non-homologous condition
with non-invariant IV measurement model.
j ICC Items Within Beta Between Beta
Rel bias (%) Coverage Rel bias (%) Coverage
30 0.10 0 4 0.94 15 0.96
1 9 0.93 −8 0.95
2 14 0.91 −22 0.92
3 20 0.90 −19 0.90
0.15 0 6 0.93 3 0.96
1 12 0.93 −8 0.95
2 16 0.92 −10 0.93
3 29 0.86 −17 0.92
0.20 0 2 0.92 5 0.96
1 13 0.92 −5 0.96
2 25 0.88 −11 0.94
3 34 0.84 −14 0.93
50 0.10 0 3 0.93 8 0.94
1 7 0.93 −12 0.94
2 13 0.92 −17 0.88
3 20 0.88 −18 0.88
0.15 0 2 0.94 3 0.93
1 9 0.93 −10 0.95
2 19 0.88 −15 0.92
3 27 0.81 −19 0.91
0.20 0 4 0.94 3 0.94
1 13 0.88 −7 0.95
2 25 0.83 −14 0.92
3 36 0.75 −13 0.92
100 0.10 0 1 0.94 2 0.95
1 6 0.90 −12 0.93
2 12 0.88 −19 0.87
3 17 0.82 −19 0.85
0.15 0 1 0.94 2 0.95
1 6 0.93 −12 0.92
2 11 0.88 −18 0.88
3 17 0.81 −21 0.84
0.20 0 1 0.93 1 0.95
1 12 0.87 −9 0.94
2 25 0.67 −13 0.89
3 37 0.53 −13 0.91
j is the number of level-2 units; ICC, intra-class correlation; items refers to the number
of ignored non-isomorphic items; Rel bias, relative bias expressed as a percentage; Cov,
coverage expressed as a proportion.
informative priors, preferring not to risk the prior overwhelmthe data in our smaller sample conditions. Finally, we also onlylooked at the case where loadings are higher on the betweenlevel.
Future Research DirectionsThe average observed ppp-value for just about all cells ofthe Monte Carlo design met the criterion specified for
TABLE 10 | Structural parameter accuracy for non-homologous condition
with non-invariant DV measurement model.
j ICC Items Within Beta Between Beta
Rel bias (%) Coverage Rel bias (%) Coverage
30 0.10 0 5 0.93 9 0.97
1 −1 0.91 25 0.95
2 −5 0.91 31 0.95
3 −8 0.90 46 0.94
0.15 0 5 0.93 5 0.96
1 −4 0.94 20 0.93
2 −9 0.92 33 0.92
3 −14 0.87 35 0.95
0.20 0 3 0.94 6 0.94
1 −4 0.93 18 0.95
2 −14 0.88 25 0.94
3 −18 0.83 26 0.94
50 0.10 0 1 0.94 2 0.96
1 −2 0.94 19 0.94
2 −6 0.92 40 0.92
3 −12 0.87 34 0.51
0.15 0 2 0.93 3 0.95
1 −6 0.91 16 0.96
2 −11 0.28 22 0.94
3 −17 0.79 29 0.91
0.20 0 3 0.94 1 0.96
1 −8 0.89 15 0.94
2 −15 0.82 22 0.92
3 −24 0.70 22 0.94
100 0.10 0 1 0.93 2 0.95
1 −4 0.92 18 0.91
2 −7 0.88 28 0.90
3 −13 0.78 34 0.86
0.15 0 2 0.94 3 0.95
1 −4 0.93 20 0.93
2 −9 0.86 29 0.89
3 −14 0.78 32 0.87
0.20 0 2 0.94 2 0.95
1 −10 0.86 12 0.95
2 −19 0.65 16 0.92
3 −25 0.44 18 0.92
j is the number of level-2 units; ICC, intra-class correlation; items refers to the number
of ignored non-isomorphic items; Rel bias, relative bias expressed as a percentage; Cov,
coverage expressed as a proportion.
good fit, including the most misspecified models withhigh ICCs and largest level-2 sample size. Moreover,the ppp-value did not deteriorate with increased ignorednon-isomorphism and in some cases improved. It seemsimportant to examine the conditions under which the ppp-value, a key model fit criterion in Bayesian estimation ofstructural equation models, can and cannot be relied onwhen examining isomorphism in MSEMs with ordinal
Frontiers in Psychology | www.frontiersin.org 15 March 2016 | Volume 7 | Article 289

Guenole Isomorphism and Homology
indicators. For now, based on these results and assumingthe models run successfully, more powerful approaches to testisomorphism available in a frequentist frameworkmay be a viableoption.
AUTHOR CONTRIBUTIONS
The author confirms being the sole contributor of this work andapproved it for publication.
REFERENCES
Asparouhov, T., and Muthén, B. (2010). Bayesian analysis of latent variable models
usingMplus. Technical Report. Version 4. Los Angeles, CA:Muthén &Muthén.
Available online at: www.statmodel.com
Bandalos, D. L. (2006). “The use of Monte Carlo studies in structural equation
modeling research,” in Structural Equation Modeling: A Second Course, eds G.
R. Hancock and R. O. Mueller (Greenwich, CT: IAP), 385–426.
Bell, B. A., Morgan, G. B., Kromrey, J. D., and Ferron, J. M. (2010). “The impact of
small cluster size onmultilevel models: a Monte Carlo examination of two-level
models with binary and continuous predictors,” in JSM Proceedings, Section on
Survey Research Methods (Alexandria, VA: American Statistical Association),
4057–4067.
Bliese, P. D. (2000). “Within-group agreement, non-independence, and reliability:
implications for data aggregation and analysis,” in Multilevel theory, research,
and methods in organizations, eds K. J. Klein and S. W. J. Kozlowski (San
Francisco, CA: Jossey-Bass), 349–381.
Bliese, P. D., Chan, D., and Ployhart, R. E. (2007). Multilevel methods: future
directions in measurement, longitudinal analyses and nonnormal outcomes.
Organ. Res. Methods 4, 551–563. doi: 10.1177/1094428107301102
Bonifay, W. E., Reise, S. P., Scheines, R., and Meijer, R. R. (2015). When
are multidimensional data unidimensional enough for structural equation
modeling? An evaluation of the DETECT multidimensionality index.
Struct. Equ. Model. Multidiscipl. J. 22, 504–516. doi: 10.1080/10705511.2014.
938596
Boomsma, A. (2013). Reporting monte carlo studies in structural equation
modeling. Struct. Equ. Model. 20, 518–540. doi: 10.1080/10705511.2013.797839
Chan, D. (1998). Functional relations among constructs in the same content
domain at different levels of analysis: a typology of compositionmodels. J. Appl.
Psychol. 83, 234–246. doi: 10.1037/0021-9010.83.2.234
Chen, F. F. (2008).What happens if we compare chopsticks with forks? The impact
of making inappropriate comparisons in cross-cultural research. J. Pers. Soc.
Psychol. 95, 1005. doi: 10.1037/a0013193
Chen, G., Bliese, P. D., and Mathieu, J. E. (2005). Conceptual framework
and statistical procedures for delineating and testing multilevel theories
of homology. Organ. Res. Methods 8, 375–409. doi: 10.1177/10944281052
80056
Chen, G., Kirkman, B. L., Kanfer, R., Allen, D., and Rosen, B. (2007). A multilevel
study of leadership, empowerment, and performance in teams. J. Appl. Psychol.
92, 331. doi: 10.1037/0021-9010.92.2.331
Depaoli, S., and Clifton, J. P. (2015). A Bayesian approach to multilevel structural
equation modeling with continuous and dichotomous outcomes. Struct. Equ.
Model. Multidiscipl. J. 22, 327–351. doi: 10.1080/10705511.2015.1044653
Depaoli, S., and van de Schoot, R. (2015). Improving transparency and
replication in Bayesian statistics: the WAMBS-checklist. Psychol. Methods. doi:
10.1037/met0000065. [Epub ahead of print].
Drasgow, F. (1982). Biased test items and differential validity. Psychol. Bull. 92,
526–531. doi: 10.1037/0033-2909.92.2.526
Drasgow, F. (1984). Scrutinizing psychological tests: measurement equivalence and
equivalent relations with external variables are the central issues. Psychol. Bull.
95, 134–135. doi: 10.1037/0033-2909.95.1.134
Drasgow, F., and Lissak, R. I. (1983). Modified parallel analysis: a procedure for
examining the latent dimensionality of dichotomously scored item responses.
J. Appl. Psychol. 68, 363. doi: 10.1037/0021-9010.68.3.363
Dyer, N. G., Hanges, P. J., and Hall, R. J. (2005). Applying multilevel confirmatory
factor analysis techniques to the study of leadership. Leadersh. Q. 16, 149–167.
doi: 10.1016/j.leaqua.2004.09.009
Forster, M. R. (2000). Key concepts in model selection: performance and
generalizability. J. Math. Psychol. 44, 205–231. doi: 10.1006/jmps.1999.1284
Gelman, A., Carlin, J. B., Stern, H. S., and Rubin, D. B. (2004). Bayesian Data
Analysis, 2nd Edn. Boca Raton, FL: ChapmanandHall CRC.
Grilli, L., and Rampichini, C. (2007). Multilevel factor models for ordinal variables.
Struct. Equ. Modeling 14, 1–25. doi: 10.1080/10705510709336734
Guenole, N., and Brown, A. (2014). The consequences of ignoring measurement
invariance for path coefficients in structural equation models. Front. Psychol.
5:980. doi: 10.3389/fpsyg.2014.00980
Hallquist, M. (2011).MplusAutomation: Automating Mplus Model Estimation and
Interpretation. R package version 0.6. Available online at: http://cran.r-project.
org/web/packages/MplusAutomation/index.html
Hanges P. J., and Dickson, M.W. (2006). Agitation over aggregation: clarifying the
development of and the nature of the GLOBE scales. Leadersh. Q. 17, 522–536.
doi: 10.1016/j.leaqua.2006.06.004
Heck, R. H., and Thomas, S. L. (2015). An Introduction to Multilevel Modeling
Techniques: MLM and SEM Approaches Using Mplus. New York, NY:
Routledge.
Hox, J. (2010). Multilevel Analysis: Techniques and Applications. New York, NY:
Routledge.
Hox, J., Moerbeek, M., Kluytmans, A., and Van De Schoot, R. (2014). Analyzing
indirect effects in cluster randomized trials. The effect of estimation method,
number of groups and group sizes on accuracy and power. Front. Psychol. 5:78.
doi: 10.3389/fpsyg.2014.00078
Hox, J., van de Schoot, R., and Matthijsse, S. (2012). How few countries will do?
Comparative survey analysis from a Bayesian perspective. Survey Res. Methods
6, 87–93. doi: 10.18148/srm/2012.v6i2.5033
Hox, J. J., de Leeuw, E. D., and Zijlmans, E. A. O. (2015). Measurement equivalence
in mixed mode surveys. Front. Psychol. 6:87. doi: 10.3389/fpsyg.2015.00087
Hu, L. T., and Bentler, P. M. (1999). Cutoff criteria for fit indexes in covariance
structure analysis: conventional criteria versus new alternatives. Struct. Equ.
Modeling 6, 1–55. doi: 10.1080/10705519909540118
Jak, S., and Oort, F. J. (2015). On the power of the test for cluster bias. Br. J. Math.
Stat. Psychol. 68, 434–455. doi: 10.1111/bmsp.12053
Jak, S., Oort, F. J., and Dolan, C. V. (2013). A test for cluster bias: detecting
violations of measurement invariance across clusters in multilevel data. Struct.
Equ. Modeling 20, 265–282. doi: 10.1080/10705511.2013.769392
Jak, S., Oort, F. J., and Dolan, C. V. (2014a). Measurement bias in multilevel data.
Struct. Equ. Modeling 21, 31–39. doi: 10.1080/10705511.2014.856694
Jak, S., Oort, F. J., and Dolan, C. V. (2014b). Using two-level factor analysis to
test for cluster bias in ordinal data. Multivariate Behav. Res. 49, 544–553. doi:
10.1080/00273171.2014.947353
Kim, E. S., Kwok, O. M., and Yoon, M. (2012). Testing factorial invariance in
multilevel data: a Monte Carlo study. Struct. Equ. Modeling 19, 250–267. doi:
10.1080/10705511.2012.659623
Kim, E. S., Yoon, M., Wen, Y., Luo, W., and Kwok, O. M. (2015). Within-level
group factorial invariance with multilevel data: multilevel factor mixture and
multilevel mimic models. Struct. Equ. Model. Multidiscipl. J. 22, 603–616. doi:
10.1080/10705511.2015.1060485
Kozlowski, S. W. J., and Klein, K. J. (2000). “A multilevel approach to theory
and research in organizations: contextual, temporal, and emergent processes,”
in Multilevel Theory, Research and Methods in Organizations: Foundations,
Extensions, and New Directions, eds K. J. Klein and S. W. J. Kozlowski (San
Francisco, CA: Jossey-Bass), 3–90.
Kruschke, J. K. (2011). Doing Bayesian Data Analysis. Burlington, MA: Academic
Press.
Kuha, J., and Moustaki, I. (2015). Non-equivalence of measurement in latent
variable modelling of multigroup data: a sensitivity analysis. Psychol. Methods
20, 523–536. doi: 10.2139/ssrn.2332071
Lynch, S. (2007). Introduction to Applied Bayesian Statistics and Estimation for
Social Scientists. NewYork, NY: Springer.
Frontiers in Psychology | www.frontiersin.org 16 March 2016 | Volume 7 | Article 289
Guenole Isomorphism and Homology
Maas, C. J. M., andHox, J. J. (2005). Sufficient sample sizes for multilevel modeling.
Methodology 1, 85–91. doi: 10.1027/1614-2241.1.3.85
Meuleman, B., and Billiet, J. (2009). A Monte Carlo sample size study: how many
countries are needed for accurate multilevel SEM? Surv. Res. Methods 3, 45–58.
doi: 10.18148/srm/2009.v3i1.666
Millsap, R. E. (1995). Measurement invariance, predictive invariance,
and the duality paradox. Multivariate Behav. Res. 30, 577–605. doi:
10.1207/s15327906mbr3004_6
Millsap, R. E. (1998). Invariance in measurement and prediction: their relationship
in the single-factor case. Psychol. Methods 2, 248–260. doi: 10.1037/1082-
989X.2.3.248
Morgeson, F. P., and Hofmann, D. A. (1999). The structure and function
of collective constructs: implications for multilevel research and theory
development. Acad. Manage. J. 24, 249–265.
Muthén, B. O. (1994). Multilevel covariance structure analysis. Sociol. Methods Res.
22, 376–398. doi: 10.1177/0049124194022003006
Muthén, L. K., and Muthén, B. O. (1998–2010). Mplus User’s Guide. 6th Edn. Los
Angeles, CA: Muthén & Muthén.
Oberski, D. L. (2014). Evaluating sensitivity of parameters of interest to
measurement invariance in latent variable models. Polit. Anal. 22, 45–60. doi:
10.1093/pan/mpt014
Oberski, D. L., Vermunt, J. K., and Moors, G. B. D. (2015). Evaluating
measurement invariance in categorical data latent variable models with the
EPC-interest. Polit. Anal. 23, 550–563. doi: 10.1093/pan/mpv020
Paxton, P., Curran, P. J., Bollen, K. A., Kirby, J., and Chen, F. (2001). Monte Carlo
experiments: design and implementation. Struct. Equ. Modeling 8, 287–312.
doi: 10.1207/S15328007SEM0802_7
Pornprasertmanit, S., Lee, J., and Preacher, K. (2014). Ignoring clustering
in confirmatory factor analysis: some consequences for model fit and
standardized parameter estimates. Multivariate Behav. Res. 49, 518–543. doi:
10.1080/00273171.2014.933762
Reise, S. P., Scheines, R., Widaman, K. F., and Haviland, M. G. (2013).
Multidimensionality and structural coefficient bias in structural equation
modeling a bifactor perspective. Educ. Psychol. Meas. 73, 5–26. doi:
10.1177/0013164412449831
Ryu, E., and West, S. G. (2009). Level-specific evaluation of model fit in
multilevel structural equation modeling. Struct. Equ. Modeling 16, 583–601.
doi: 10.1080/10705510903203466
Ryu, E. (2014). Factorial invariance in multilevel confirmatory factor
analysis. Br. J. Math. Stat. Psychol. 67, 172–194. doi: 10.1111/bmsp.
12014
Ryu, E. (2015). Multiple group analysis in multilevel structural equation
model across level 1 groups. Multivariate Behav. Res. 50, 300–315. doi:
10.1080/00273171.2014.1003769
Tay, L., Woo, S. E., and Vermunt, J. K. (2014). A conceptual framework
of cross-level Isomorphism: psychometric validation of multilevel
constructs. Organ. Res. Methods 17, 77–106. doi: 10.1177/10944281135
17008
van de Schoot, R., Broere, J. J., Perryck, K. H., Zondervan-Zwijnenburg, M., and
Van Loey, N. E. (2015a). Analyzing small data sets using Bayesian estimation:
the case of posttraumatic stress symptoms following mechanical ventilation
in burn survivors. Eur. J. Psychotraumatol. 6:25216. doi: 10.3402/ejpt.v6.
25216
van de Schoot, R., Kaplan, D., Denissen, J., Asendorpf, J. B., Neyer, F. J. and
van Aken, M. A. G. (2014). A gentle introduction to Bayesian analysis:
applications to research in child development. Child Dev. 85, 842–860. doi:
10.1111/cdev.12169
van de Schoot, R., Schmidt, P., De Beuckelaer, A., (eds.) (2015b). Measurement
Invariance. Lausanne: Frontiers Media.
Zyphur, M. J., Kaplan, S. A., and Christian, M. S. (2008). Assumptions of cross-
level measurement and structural invariance in the analysis of multilevel
data: problems and solutions. Group Dyn. 12, 127. doi: 10.1037/1089-2699.12.
2.127
Zyphur, M. J., and Oswald, F. L. (2013). Bayesian estimation and inference A User’s
Guide. J. Manage. 39, 5–13. doi: 10.1177/0149206313501200
Conflict of Interest Statement: The author declares that the research was
conducted in the absence of any commercial or financial relationships that could
be construed as a potential conflict of interest.
Copyright © 2016 Guenole. This is an open-access article distributed under the terms
of the Creative Commons Attribution License (CC BY). The use, distribution or
reproduction in other forums is permitted, provided the original author(s) or licensor
are credited and that the original publication in this journal is cited, in accordance
with accepted academic practice. No use, distribution or reproduction is permitted
which does not comply with these terms.
Frontiers in Psychology | www.frontiersin.org 17 March 2016 | Volume 7 | Article 289
Related Documents