EISEVIER Aquaculture Aquaculture 144 (1996) 103-I 19 The importance of bacterial multiplication in the selection, by oxytetracycline-HCl, of oxytetracycline-resistant bacteria in marine sediment microcosms Joe Kerry a, Marian Slattery b, Shirley Vaughan b, Peter Smith bp * ’ Food Technology Department, University College Cork, Cork, Ireland b Fish Disease Group, Department of Microbiology, University College Galway, Galway, Ireland Accepted 25 March 1996 Abstract Small-scale microcosms were used to investigate the impact of oxytetracycline-HCl on both metabolic processes and the emergence of elevated frequencies of resistance in marine sediment microflora. The microcosms were designed to simulate the environment of sediments found under fish farms, and included marine mud, fish feed and sea water. Measurements of the rate of changes in gas pressure in the sealed microcosms were used as a proxy indicator of metabolic activity. In these microcosms, the sediment was the most significant source of gas-generating bacteria and the feed provided the major substrate for gas production. The frequency of resistance was monitored by differential plate counts on 2216 V media with and without 25 kg ml- ’ oxytetracycline-HCl. After a 2-3-day adaptation phase all microcosms entered a steady-state phase during which the increase in gas pressure was linear with respect to time. The addition of oxytetracycline-HCl (0.1-600 pg g- ‘) resulted in an increase in the length of the adaptation phase but had no effect on the rate of gas pressure increase in the steady-state phase. The frequency of oxytetracycline-resistant colony-forming units was determined after 194 h incubation of the microcosms. The frequency in microcosms containing over 25 kg g-r was > 90%; in those containing 6.25 Fg g-’ or less the frequency was < 7%. Investigations revealed that there was a rapid increase in cell numbers only during the first 2-3 days of the incubation, and that the majority of the increase in resistance frequency occurred during this time. If the addition of oxytetracycline-HCl was delayed until after 3 days incubation little selection for increased resistance frequency occurred. * Corresponding author. Fax: + 353-91-7505 14. E-mail: [email protected] 00448486/%/$15.00 Copyright 0 1996 Elsevier Science B.V. All rights reserved. PII SOO44-8486(96)01321-X

Welcome message from author
This document is posted to help you gain knowledge. Please leave a comment to let me know what you think about it! Share it to your friends and learn new things together.
Transcript
EISEVIER
Aquaculture
Aquaculture 144 (1996) 103-I 19
The importance of bacterial multiplication in the selection, by oxytetracycline-HCl, of
oxytetracycline-resistant bacteria in marine sediment microcosms
Joe Kerry a, Marian Slattery b, Shirley Vaughan b, Peter Smith bp * ’ Food Technology Department, University College Cork, Cork, Ireland
b Fish Disease Group, Department of Microbiology, University College Galway, Galway, Ireland
Accepted 25 March 1996
Abstract
Small-scale microcosms were used to investigate the impact of oxytetracycline-HCl on both metabolic processes and the emergence of elevated frequencies of resistance in marine sediment microflora. The microcosms were designed to simulate the environment of sediments found under fish farms, and included marine mud, fish feed and sea water. Measurements of the rate of changes in gas pressure in the sealed microcosms were used as a proxy indicator of metabolic activity. In these microcosms, the sediment was the most significant source of gas-generating bacteria and the feed provided the major substrate for gas production. The frequency of resistance was monitored by differential plate counts on 2216 V media with and without 25 kg ml- ’ oxytetracycline-HCl. After a 2-3-day adaptation phase all microcosms entered a steady-state phase during which the increase in gas pressure was linear with respect to time. The addition of oxytetracycline-HCl (0.1-600 pg g- ‘) resulted in an increase in the length of the adaptation phase but had no effect on the rate of gas pressure increase in the steady-state phase. The frequency of oxytetracycline-resistant colony-forming units was determined after 194 h incubation of the microcosms. The frequency in microcosms containing over 25 kg g-r was > 90%; in those containing 6.25 Fg g-’ or less the frequency was < 7%. Investigations revealed that there was a rapid increase in cell numbers only during the first 2-3 days of the incubation, and that the majority of the increase in resistance frequency occurred during this time. If the addition of oxytetracycline-HCl was delayed until after 3 days incubation little selection for increased resistance frequency occurred.
* Corresponding author. Fax: + 353-91-7505 14. E-mail: [email protected]
00448486/%/$15.00 Copyright 0 1996 Elsevier Science B.V. All rights reserved. PII SOO44-8486(96)01321-X
104 J. Kerry et al./Aquaculture 144 (1996) 103-119
These data are compared with the data from other microcosm studies of the impact of oxytetracycline on marine sediment processes. It is suggested that the extent of cell division achieved in such systems is a critical parameter determining the results that they generate.
Keywords: Fish f-s; Marine sediments; Metabolic processes; Microcosms; Oxytetracyche-XI; Resistance frequency
1. Introduction
Antimicrobial agents administered to fish in fish farms must either be metabolised by fish, rapidly degraded in the aquatic environment or be present in the effluent of the farms. Smith et al. (1994a) have demonstrated that in a land-based hatchery, the quasi-totality of the oxytetracycline administered to fish in a freshwater salmon hatchery left the farm associated with either uneaten feed pellets or faecal particles. It has been argued that oxytetracycline leaving a marine farm will also be particle-associated (Jacobsen and Berglind, 1988; Lunestad, 1992). The subsequent distribution of the agent within the marine environment will depend on the density and size of these particles (Smith et al., 1994b). In marine farms, uneaten feed pellets will be deposited on the sediments under the cages, whereas the lighter faecal pellets will be dispersed over a wider area. However, faecal pellets are frequently disrupted by fish movement and may leave a cage as a fine cloud. The fate of this material has not been adequately mapped (Coyne et al., 1994a; Smith et al., 1994b). The presence of oxytetracycline in the under-cage sediments following the administration of medicated feed has been docu- mented in a number of studies, all of which have employed high performance liquid chromatography (HPLC) analysis (Bjiirklund et al., 1990; Bjijrklund et al., 1991; Samuelsen et al., 1992; Coyne et al., 1994a; Coyne et al., 1994b; Weston et al., 1994). Most of these studies have reported between 1 and 10 pg oxytetracycline per g of sediment. Samuelsen et al. (19921, however, detected approximately 300 pg g-‘. Coyne et al. (1994a) have suggest that these exceptionally high concentrations may have been the result of a high level of overfeeding at the farm studied.
The potential biological significance of the presence of oxytetracycline in the sediments under cages cannot be deduced directly from the results of HPLC analysis (Smith et al., 1994b). Lunestad and Goksrayr (1990) have demonstrated that the biological activity of oxytetracycline is dramatically reduced in the presence of the concentrations of Mg*+ and Ca*’ present in sea water. The work of Sithole and Guy (1987a), Sithole and Guy (1987b), Pinck et al. (19611, Soulides et al. (1961) and Vaughan and Smith (1996) would suggest that the presence of sediment may further reduce the activity of this agent. A number of studies have attempted to assess the impact of sediment oxytetracycline concentrations by monitoring the frequencies of resistance to oxytetracycline in the microflora of this environment (Nygaard et al., 1992; Samuelsen et al., 1992; Hansen et al., 1993; Kerry et al., 1994; Weston et al., 1994; Kerry et al., 1995). The causal relationship between the presence of oxytetracycline in marine sediments and the frequency of resistance that have been reported has, however, been questioned by Samuelsen et al. (1992) and Smith et al. (1994b). Kapetanaki et al. (1995) have demonstrated that elevated frequencies of resistance can develop in marine
J. Kerry et al./Aquaculture 144 (1996) 103-119 105
sediment systems in the absence of oxytetracycline. McPhearson et al. (1991) and Vaughan et al. (1996) have also presented data that question the causal relationship between the presence of oxytetracycline and the frequency of oxytetracycline resistance in the microflora of freshwater environments. In contrast, DePaola (1995) and DePaola et al. (1995) have presented evidence that suggests a link between the frequency of oxytetracycline resistance in intestinal and aquatic microflora and the administration of oxytetracycline-medicated and oxytetracycline-contaminated feeds to catfish.
Hansen et al. (1993) studied the impact of oxytetracycline, and other antimicrobial agents, on metabolic processes in sediments and on the frequency of resistance in the microflora. They used 400 p,g g- ’ oxytetracycline in laboratory-based experimental tanks and reported a depression of sulphate reduction activity that extended for 29-70 days. The frequencies of resistance they detected showed an irregular pattern over time and were significantly lower than those reported by Samuelsen et al. (1992) in field studies. Klaver and Mathews (1994) have also studied the impact of 12.5-75 kg gg ’ oxytetracycline on the activity of pure cultures of nitrifying bacteria in laboratory simulations of freshwater/sediment systems. They reported a depression of activity in the presence of the antimicrobial agent which lasted for at least 11 days.
The present study attempted to monitor metabolic processes and resistance frequen- cies in microcosm simulations of the under-cage environment and to determine the impact of the presence of oxytetracycline-HCl, over a range of 0.1-600 p,g g- ’ , on these two parameters.
2. Materials and methods
2.1. Sediment and sea water
The marine sediments used in this work were collected from an inter-tidal area of Galway Bay which was at least 5 km from any sewage outfall or fish farm. The sediments were primarily a fine shell sand and showed varying visible signs of sulphide production. The sea water was also collected from Galway Bay at a site free from obvious anthropogenic influences. The salinity of the sea water was 31%0.
2.2. Fish feed
The fish feed used in these experiments was a commercial salmon fry pellet produced by a major feed compounder.
2.3. Microcosm experiments
The microcosm experiments were carried out in 50 ml glass vials (No. 12911, Pierce, UK). Each vial used in these experiments was pre-sterilised and then filled with 14.0 g sediment, 20 ml fresh sea water and 0.8 g fish feed. In control vials no feed was added. When all these components had been added to the vials, they were sealed with sterile gas-tight butyl rubber bungs (No. 2048-l 1800, Belco Glass Inc., Vineland, NM, USA).
106 J. Kerry et al./Aquaculture 144 (1996) 103-119
In vials where the gas pressure was expected to be high, the bungs were held in place with aluminium seals (No. 13214, Pierce, UK). All experiments were initiated within 2 h of sealing the vials. At zero time all vials were vented and then immediately incubated at 22°C on an orbital shaker at 100 r.p.m. in the dark. Gas pressure readings were taken from all vials at approximately 12-h intervals for the duration of the experiments. During each experiment mean pressure readings from five replicate vials were used to generate each data point for each experimental condition. These five vials were termed a microcosm set. In each experiment control microcosm sets containing no food were included. In experiments involving investigation of the impact of oxytetracycline, two oxytetracycline-free microcosm sets were also included. The pH of each vial was determined prior to the start of incubation and at the end of the experimental period.
2.4. Oxytetracycline-HCl
Oxytetracycline-HCl was obtained from Vetrapharm (Hampshire, UK) and stored in an air-tight container in the dark at 4°C. Filter-sterilised oxytetracycline-HCl stock solutions were prepared in distilled water for each experiment and 0.1 ml of various dilutions were added to vials to give final oxytetracycline-HCl concentrations in the range 0.1-600 p,g g- ’ of the vial contents.
2.5. Bacteriological analysis
Total viable counts and viable counts of resistant bacteria were determined on 2216 V agar medium (V%t’%nen, 1977) with and without 25 pg ml- ’ oxytetracycline-HCl by the methods of Kerry et al. (1994). 2216 V is a modification of a medium initially formulated for the isolation of marine heterotrophs by Zobell (1941).
2.6. Definition of resistance
In this paper, resistance is arbitrarily defined as the ability to form colonies on agar plates containing 25 p,g ml-’ oxytetracycline-HCI in 2216 V medium after 3 days incubation at 22°C. The frequency of resistance was determined as the number of resistant colony-forming units counted on 2216 V agar media with 25 p.g ml-’ oxytetracycline-HCl divided by the count obtained on the same medium with no oxytetracycline-HCl, and multiplied by 100.
2.7. The pressure transducer
The device used in this study to monitor pressure change during the course of an activity test was a hand-held pressure transducer (Concannon et al., 1988a; Concannon et al., 1988b). The transducer comprises a sensing element consisting of a 2.5 mm square silicon chip with integral sensing diaphragm. The sensing element is connected to a digital panel metre module and the device is powered by a 7.5 V DC transformer. Readings were obtained by inserting the needle of the transducer through the rubber bungs of the test vials. Pressure loss during readings was minimal. The transducer is
J. Kerry et al./Aquaculture 144 (1996) 103-119 107
capable of measuring a pressure increase or decrease of two atmospheres (0 + 202 kPa) over a range of - 200 to +200 mV. The relationship between pressure and mV recorded by the transducer was linear over this range (Donlon, 1992).
2.8. Gas chromatography
Samples of vial head-space gas were analyzed for methane content by gas chromatog- raphy analysis using a glass column (1.8 m X 4 mm i.d., 6 mm o.d.) packed with Poropak 4100-120 mesh, in a PYE Unicam 204 chromatograph fitted with a gas-sam- pling port and hydrogen flame ionisation detector. The column temperature was 35°C. The injection port and detector temperatures were 105°C and lOO”C, respectively. Nitrogen was the carrier gas at a flow rate of 60 ml min-‘. Samples were injected in triplicate, and the results were averaged and expressed as percentage methane by calibration against similarly injected samples of pure methane.
3. Results
3.1. Properties of the microcosm system
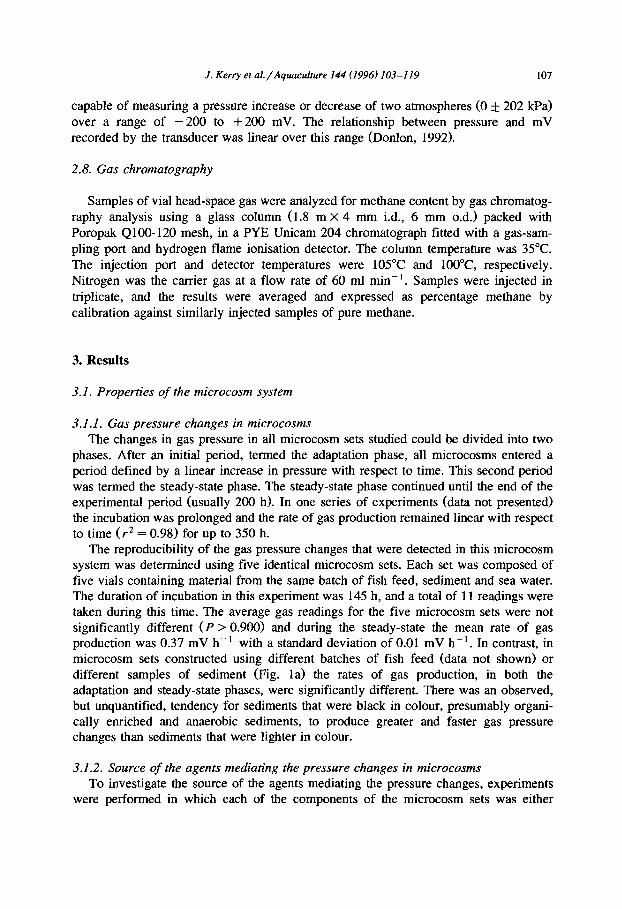
3.1.1. Gas pressure changes in microcosms The changes in gas pressure in all microcosm sets studied could be divided into two
phases. After an initial period, termed the adaptation phase, all microcosms entered a period defined by a linear increase in pressure with respect to time. This second period was termed the steady-state phase. The steady-state phase continued until the end of the experimental period (usually 200 h). In one series of experiments (data not presented) the incubation was prolonged and the rate of gas production remained linear with respect to time (r2 = 0.98) for up to 350 h.
The reproducibility of the gas pressure changes that were detected in this microcosm system was determined using five identical microcosm sets. Each set was composed of five vials containing material from the same batch of fish feed, sediment and sea water. The duration of incubation in this experiment was 145 h, and a total of 11 readings were taken during this time. The average gas readings for the five microcosm sets were not significantly different (P > 0.900) and during the steady-state the mean rate of gas production was 0.37 mV h- ’ with a standard deviation of 0.01 mV h- ’ . In contrast, in microcosm sets constructed using different batches of fish feed (data not shown) or different samples of sediment (Fig. la) the rates of gas production, in both the adaptation and steady-state phases, were significantly different. There was an observed, but unquantified, tendency for sediments that were black in colour, presumably organi- cally enriched and anaerobic sediments, to produce greater and faster gas pressure changes than sediments that were lighter in colour.
3.1.2. Source of the agents mediating the pressure changes in microcosms To investigate the source of the agents mediating the pressure changes, experiments
were performed in which each of the components of the microcosm sets was either
108 J. Kerry et al./Aquacubure 144 (1996) 103-119
140-1 (c)
-2of 0 50 100 150 200
Time (hours)
Fig. 1. Factors influencing gas pressure changes in microcosm sets. Note the variation in scale of the vertical
axes. (a) Gas pressure changes in three microcosm sets constructed using different sediments. Rates of
pressure increase in all three set were linear (r* > 0.99) during the steady state. Steady-state rates of pressure
increase: -, 0.51 mV h-l; n , 0.42 mV h-l; 0, 0.21 mV h-‘. (b) Effect of sterilisation of microcosm
components on gas pressure changes. W, microcosm sets containing non-sterile sediment; 0, microcosm sets
containing non-sterile seawater, - , microcosm sets containing non-sterile fish feed; 0, microcosm sets
containing no feed. All other components in these microcosm Sets were sterile. (c) Gas pressure changes in
three microcosm sets constructed using different amounts of feed. 0, microcosm sets containing no feed; B, microcosm sets containing 0.4 g feed per vial; - , microcosm sets containing 0.8 g feed per vial; 0, microcosm sets containing 1.6 g feed per vial.
non-sterile or was sterilised prior to its addition to the microcosm (Fig. lb). In all the microcosm sets where both the sediment and the sea water were sterile, no increases in gas pressure were detected during a 250-h incubation period. In all the microcosm sets where the sediment was sterile but the sea water was non-sterile, a slight increase in gas pressure was detected during the early part of this period. In all the microcosm sets where the sediment was non-sterile, the gas pressure changes were indistinguishable from control microcosms in which all components were non-sterile. In experiments where fish food was absent, no gas production was detected irrespective of whether the other two components were sterile or not (Fig. lb). When the fish feed component of the
J. Kerry et al./Aquaculture 144 (1996) 103-119 109
-20-c I 0 50 100 150 200
Time (hours)
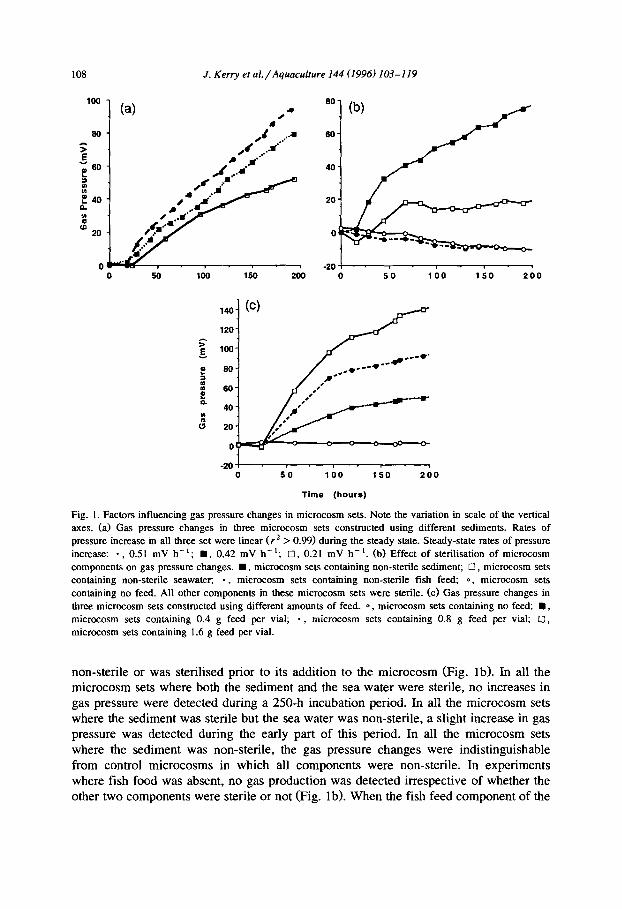
Fig. 2. Examples of microcosm gas pressure changes determined for various concentrations of oxytetracy- cline-HCl in Experiment 1. *. 600 pg g-‘; n , 200 p,g g-l; q , 75 pg g-l; 0, 1.56 Pg g-l,
vials in a microcosm set was increased from 0.4 g to 1.6 g, both the extent of gas production and its rate of production increased (Fig. lc). These data demonstrate that the agents underlying the reproducible pressure changes detected were heat-sensitive and therefore most probably microbiological in nature. Further, they indicate that the fish feed was the most important substrate for gas production, and that the sediments were the most important source of the biological agents, or at least of critical components of these biological agents.
3.2. Effect of addition of oxytetracycline-HCl to microcosms
3.2.1. Effects of pressure changes over time To investigate the effect of oxytetracycline-HCl on the gas pressure changes in the
microcosm system, a study was made of the performance of 18 microcosm sets in which the concentration of the agent was varied over the range 0.1-600 kg g- ’ (Experiment 1). In addition, two microcosm sets were included which contained no oxytetracycline. Fig. 2 presents selected data from this experiment and illustrates the major consequences of oxytetracycline-HCl addition on the gas pressure changes over time. All microcosm sets reached the steady state, as defined by their correlation to a straight line equation (r* > 0.99>, and increasing concentrations of oxytetracycline-HCl had no effect on the rates of gas pressure increase during this phase (Table 1). The mean of the rates measured in the 18 microcosm sets during this phase was 0.44 mV h- ’ (range 0.40-0.47 mV h-‘) and the standard deviation was 0.02 mV h-‘.
The predominant effect of increasing oxytetracycline-HCl concentrations was on the gas pressure changes in the adaptation phase (Fig. 2). In oxytetracycline-free microcosm systems, significant pressure increases occurred during this phase. Increasing the concentrations of oxytetracycline-HCl in the microcosm system resulted in a progres- sive reduction in the net gas production recorded during the adaptation phase and a
110 J. Kerry et nl./Aquaculture 144 (1996) 103-119
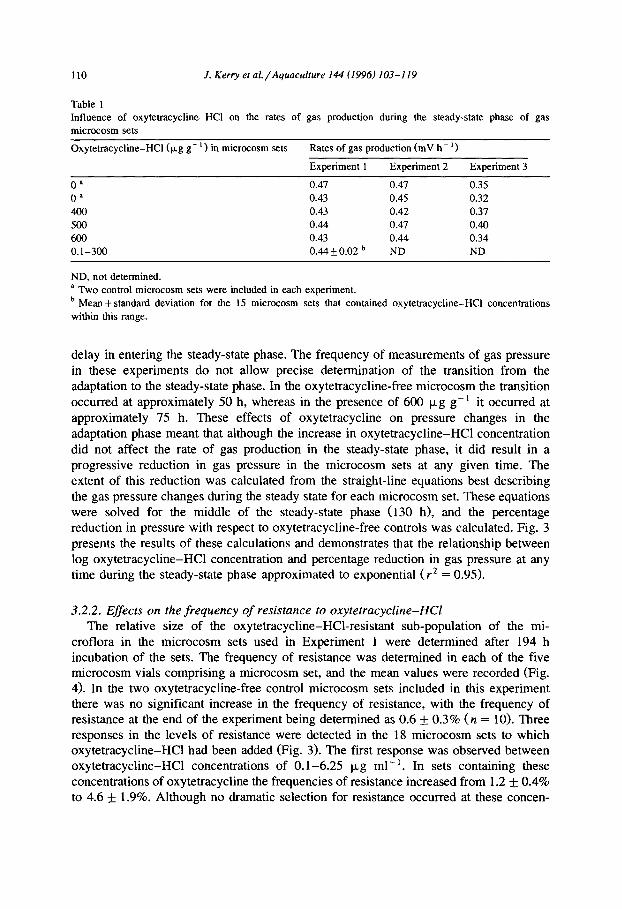
Table 1 Influence of oxytetracycline-HCI on the rates of gas production during the steady-state phase of gas
microcosm sets
Oxytetracycline-HCI (kg g- ’ ) in microcosm sets Rates of gas production (mV h- ‘)
Experiment 1 Experiment 2 Experiment 3
Oa 0.47 0.47 0.35
0’ 0.43 0.45 0.32
400 0.43 0.42 0.37
500 0.44 0.47 0.40
600 0.43 0.44 0.34
0.1-300 0.44+0.02 b ND ND
ND, not determined.
a Two control microcosm sets were included in each experiment.
b Mean f standard deviation for the 15 microcosm sets that contained oxytetracycline-HCI concentrations
within this range.
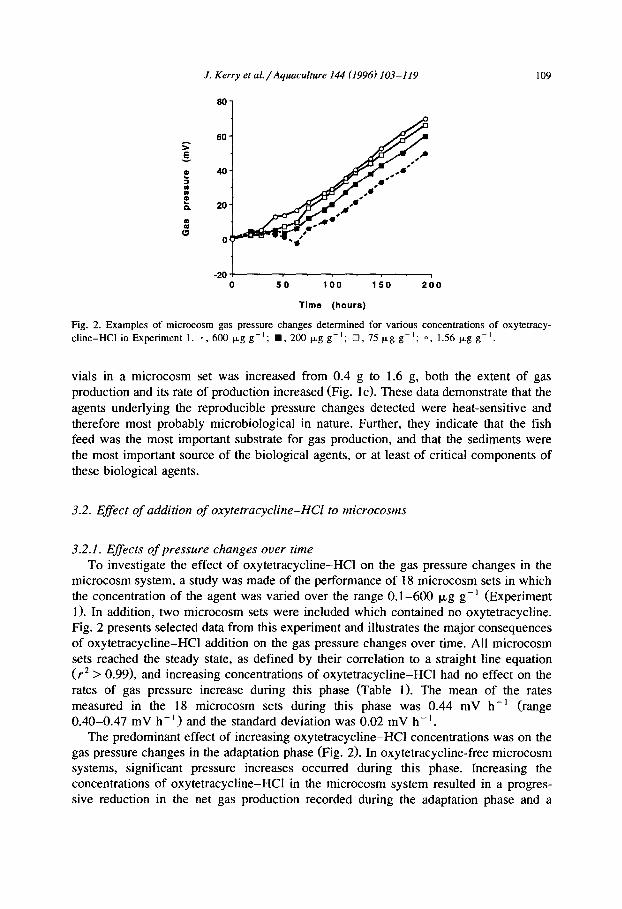
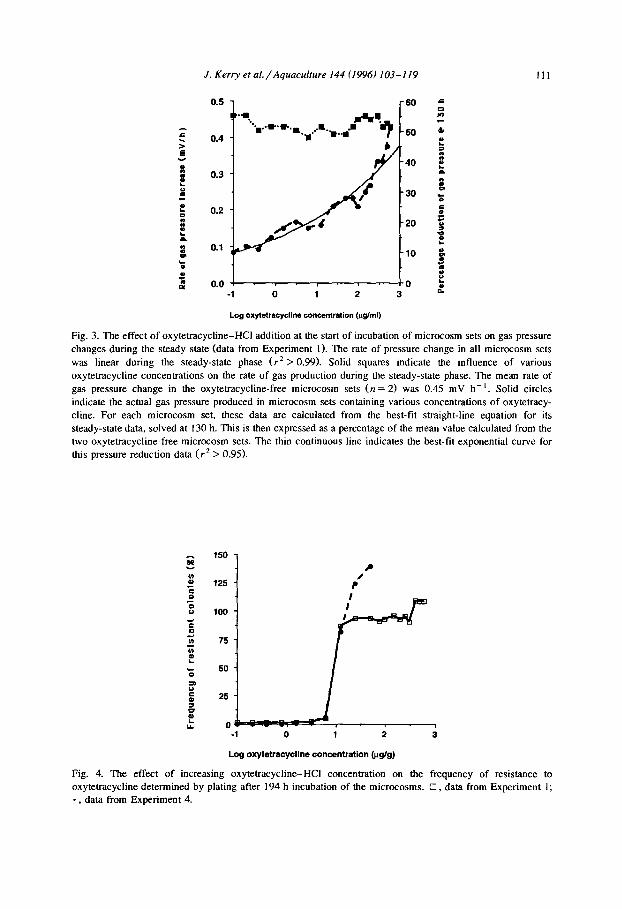
delay in entering the steady-state phase. The frequency of measurements of gas pressure in these experiments do not allow precise determination of the transition from the adaptation to the steady-state phase. In the oxytetracycline-free microcosm the transition occurred at approximately 50 h, whereas in the presence of 600 p,g g- * it occurred at approximately 75 h. These effects of oxytetracycline on pressure changes in the adaptation phase meant that although the increase in oxytetracycline-HCl concentration did not affect the rate of gas production in the steady-state phase, it did result in a progressive reduction in gas pressure in the microcosm sets at any given time. The extent of this reduction was calculated from the straight-line equations best describing the gas pressure changes during the steady state for each microcosm set. These equations were solved for the middle of the steady-state phase (130 h), and the percentage reduction in pressure with respect to oxytetracycline-free controls was calculated. Fig. 3 presents the results of these calculations and demonstrates that the relationship between log oxytetracycline-HCl concentration and percentage reduction in gas pressure at any time during the steady-state phase approximated to exponential ( r2 = 0.95).
3.2.2. Efsects on the frequency of resistance to oxytetracycline-HCI The relative size of the oxytetracycline-HCI-resistant sub-population of the mi-
croflora in the microcosm sets used in Experiment 1 were determined after 194 h incubation of the sets. The frequency of resistance was determined in each of the five microcosm vials comprising a microcosm set, and the mean values were recorded (Fig. 4). In the two oxytetracycline-free control microcosm sets included in this experiment there was no significant increase in the frequency of resistance, with the frequency of resistance at the end of the experiment being determined as 0.6 + 0.3% (n = 10). Three responses in the levels of resistance were detected in the 18 microcosm sets to which oxytetracycline-HCI had been added (Fig. 3). The first response was observed between oxytetracycline-HCl concentrations of 0.1-6.25 p,g ml-i. In sets containing these concentrations of oxytetracycline the frequencies of resistance increased from 1.2 +_ 0.4% to 4.6 +_ 1.9%. Although no dramatic selection for resistance occurred at these concen-
J. Kerry et al./Aquaculture 144 (1996) 103-119
0.04 I I . 1 10 -1 0 1 2 3
Log oxytetracycline concentration (pgml)
111
Fig. 3. The effect of oxytetracycline-HC1 addition at the start of incubation of microcosm sets on gas pressure
changes during the steady state (data from Experiment 1). The rate of pressure change in all microcosm sets
was linear during the steady-state phase (r* > 0.99). Solid squares indicate the influence of various
oxytetracycline concentrations on the rate of gas production during the steady-state phase. The mean rate of
gas pressure change in the oxytetracycline-free microcosm sets (n = 2) was 0.45 mV h-l. Solid circles
indicate the actual gas pressure produced in microcosm sets containin g various concentrations of oxytetracy- cline. For each microcosm set, these data are calculated from the best-fit straight-line equation for its
steady-state data, solved at 130 h. This is then expressed as a percentage of the mean value calculated from the
two oxytetracycline-free microcosm sets. The thin continuous line indicates the best-tit exponential curve for
this pressure reduction data (r2 > 0.95).
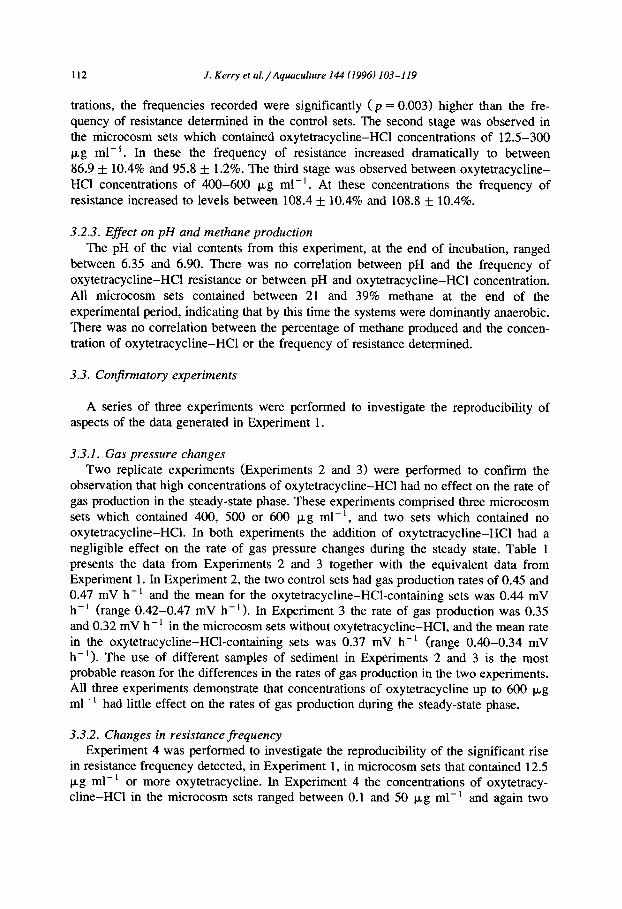
0 -1 0 1 2 3
Log oxytetracycline concentration @g/g)
Fig. 4. The effect of increasing oxytetracycline-HCI concentration on the frequency of resistance to oxytetracycline determined by plating after 194 h incubation of the microcosms. 0, data from Experiment 1;
* , data from Experiment 4.
112 J. Kerry et al./Aqwculture 144 (1996) 103-119
trations, the frequencies recorded were significantly ( p = 0.003) higher than the fre- quency of resistance determined in the control sets. The second stage was observed in the microcosm sets which contained oxytetracycline-HCl concentrations of 12.5-300 p,g ml-‘. In these the frequency of resistance increased dramatically to between
86.9 + 10.4% and 95.8 + 1.2%. The third stage was observed between oxytetracycline- HCl concentrations of 400-600 pg ml- ‘. At these concentrations the frequency of
resistance increased to levels between 108.4 + 10.4% and 108.8 + 10.4%.
3.2.3. ESfect on pH and methane production
The pH of the vial contents from this experiment, at the end of incubation, ranged between 6.35 and 6.90. There was no correlation between pH and the frequency of oxytetracycline-HCI resistance or between pH and oxytetracycline-HCI concentration. All microcosm sets contained between 21 and 39% methane at the end of the experimental period, indicating that by this time the systems were dominantly anaerobic. There was no correlation between the percentage of methane produced and the concen- tration of oxytetracycline-HCl or the frequency of resistance determined.
3.3. Conjbnatory experiments
A series of three experiments were performed to investigate the reproducibility of aspects of the data generated in Experiment 1.
3.3.1. Gas pressure changes Two replicate experiments (Experiments 2 and 3) were performed to confirm the
observation that high concentrations of oxytetracycline-HCl had no effect on the rate of gas production in the steady-state phase. These experiments comprised three microcosm sets which contained 400, 500 or 600 kg ml-‘, and two sets which contained no oxytetracycline-HCl. In both experiments the addition of oxytetracycline-HCl had a negligible effect on the rate of gas pressure changes during the steady state. Table 1 presents the data from Experiments 2 and 3 together with the equivalent data from Experiment 1. In Experiment 2, the two control sets had gas production rates of 0.45 and 0.47 mV h-’ and the mean for the oxytetracycline-HCl-containing sets was 0.44 mV h-’ (range 0.42-0.47 mV h-’ >. In Experiment 3 the rate of gas production was 0.35 and 0.32 mV hh’ in the microcosm sets without oxytetracycline-HCl, and the mean rate in the oxytetracycline-HCl-containing sets was 0.37 mV h- ’ (range 0.40-0.34 mV hh’ 1. The use of different samples of sediment in Experiments 2 and 3 is the most probable reason for the differences in the rates of gas production in the two experiments. All three experiments demonstrate that concentrations of oxytetracycline up to 600 p,g ml-’ had little effect on the rates of gas production during the steady-state phase.
3.3.2. Changes in resistance frequency Experiment 4 was performed to investigate the reproducibility of the significant rise
in resistance frequency detected, in Experiment 1, in microcosm sets that contained 12.5 kg ml-’ or more oxytetracycline. In Experiment 4 the concentrations of oxytetracy- cline-HCl in the microcosm sets ranged between 0.1 and 50 t_~g ml-’ and again two
J. Kerry et nl./Aquaculture 144 (1996) 103-119 113
oxytetracycline-free controls were included. The incubation was continued for 195 h and the frequency of resistance was determined, in duplicate, from the pooled contents of the five vials in each microcosm set at the end of the incubation period (Fig. 4). No significant increase was observed in the frequency of resistance in any of the three oxytetracycline-free microcosm sets, with the frequency of resistance at the end of the experiment being determined as 0.4 + 0.2% (n = 3). The frequency of resistance of the flora in the microcosm set containing between 0.1 and 6.25 kg ml-’ of oxytetracy- cline-HCl ranged between 0.1% and 6.3%, respectively. A major increase in the frequency of resistance to 91% was observed in the microcosm set containing 12.5 l.r,g ml-’ oxytetracycline-HCl. The frequency of resistance increased to 124% and 139% for sets containing 25 and 50 pg ml-’ of oxytetracycline-HCl, respectively. Thus Experiment 4 confirmed the observation made from the data generated in Experiment 1 that the increase in the oxytetracycline concentration in microcosm sets from 6.25 p,g ml-’ to 12.5 p,g ml-’ resulted in a dramatic change in the frequency of resistance detected after 194 h incubation.
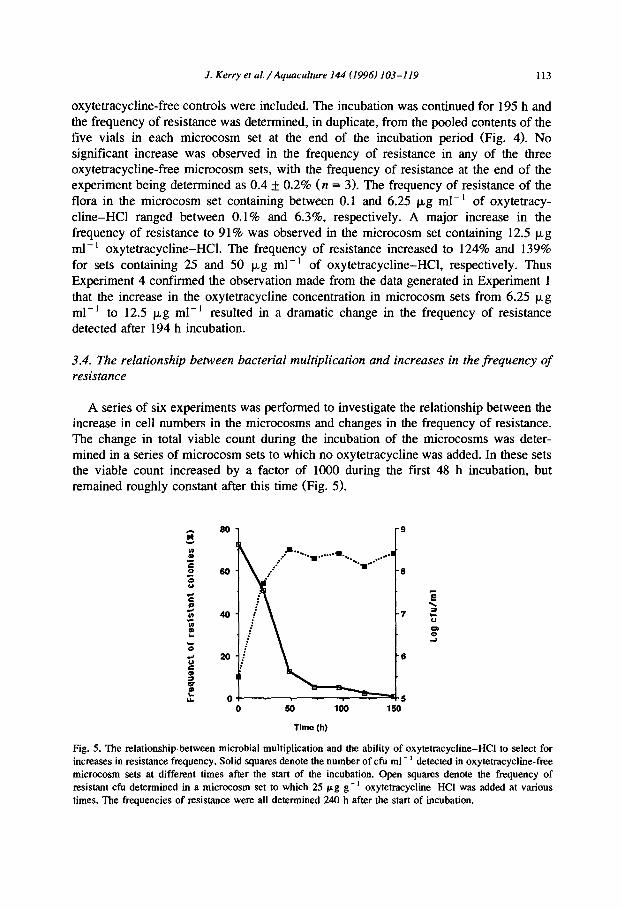
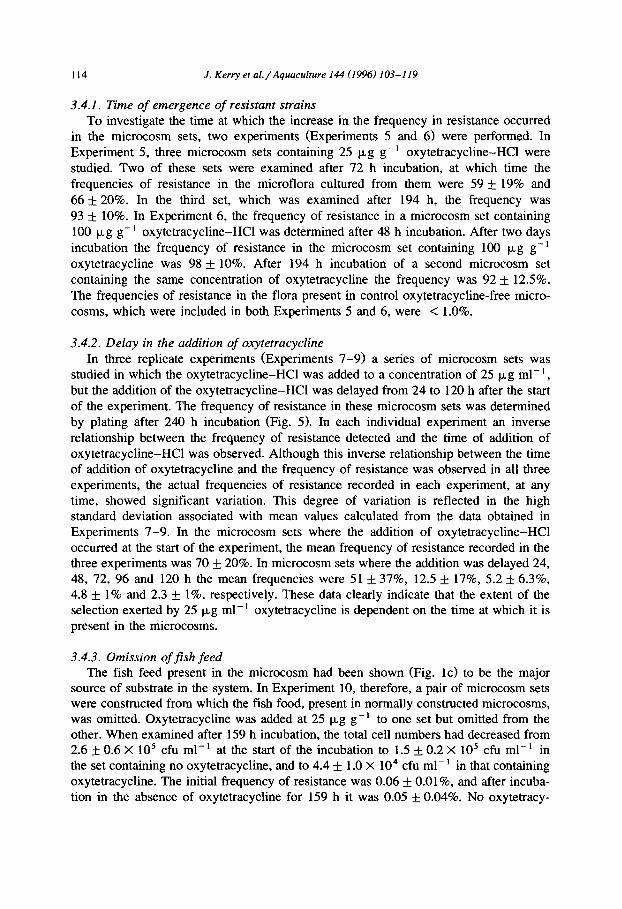
3.4. The relationship between bacterial multiplication and increases in the frequency of resistance
A series of six experiments was performed to investigate the relationship between the increase in cell numbers in the microcosms and changes in the frequency of resistance. The change in total viable count during the incubation of the microcosms was deter- mined in a series of microcosm sets to which no oxytetracycline was added. In these sets the viable count increased by a factor of 1000 during the first 48 h incubation, but remained roughly constant after this time (Fig. 5).
-9
-7
-6
0 50 100 150
Time(h)
f . e 0
$ -I
Fig. 5. The relationship between microbial multiplication and the ability of oxytetracycline-HCI to select for increases in resistance frequency. Solid squares denote the number of cfu ml- ’ detected in oxytetracycline-free microcosm sets at different times after the start of the incubation. Open squares denote the frequency of resistant cfu determined in a microcosm set to which 25 p,g g- ’ oxytetracycline-HCI was added at various
times. The frequencies of resistance were all determined 240 h after the start of incubation.
114 J. Kerry et al./Aquaculture 144 (1996) 103-119
3.4.1. Time of emergence of resistant strains To investigate the time at which the increase in the frequency in resistance occurred
in the microcosm sets, two experiments (Experiments 5 and 6) were performed. In Experiment 5, three microcosm sets containing 25 pg g-’ oxytetracycline-HCl were studied. Two of these sets were examined after 72 h incubation, at which time the frequencies of resistance in the microflora cultured from them were 59 f 19% and 66 jI 20%. In the third set, which was examined after 194 h, the frequency was 93 + 10%. In Experiment 6, the frequency of resistance in a microcosm set containing
100 Pgg-’ oxytetracycline-HCl was determined after 48 h incubation. After two days incubation the frequency of resistance in the microcosm set containing 100 p,g g- ’ oxytetracycline was 98 + 10%. After 194 h incubation of a second microcosm set containing the same concentration of oxytetracycline the frequency was 92 + 12.5%. The frequencies of resistance in the flora present in control oxytetracycline-free micro- cosms, which were included in both Experiments 5 and 6, were < 1.0%.
3.4.2. Delay in the addition of oxytetracycline
In three replicate experiments (Experiments 7-9) a series of microcosm sets was studied in which the oxytetracycline-HCl was added to a concentration of 25 p,g ml-‘, but the addition of the oxytetracycline-HCI was delayed from 24 to 120 h after the start of the experiment. The frequency of resistance in these microcosm sets was determined by plating after 240 h incubation (Fig, 5). In each individual experiment an inverse relationship between the frequency of resistance detected and the time of addition of oxytetracycline-HCl was observed. Although this inverse relationship between the time of addition of oxytetracycline and the frequency of resistance was observed in all three experiments, the actual frequencies of resistance recorded in each experiment, at any time, showed significant variation. This degree of variation is reflected in the high standard deviation associated with mean values calculated from the data obtained in Experiments 7-9. In the microcosm sets where the addition of oxytetracycline-HCl occurred at the start of the experiment, the mean frequency of resistance recorded in the three experiments was 70 + 20%. In microcosm sets where the addition was delayed 24, 48, 72, 96 and 120 h the mean frequencies were 51 + 37%, 12.5 + 17%, 5.2 f 6.3%, 4.8 + 1% and 2.3 &- l%, respectively. These data clearly indicate that the extent of the selection exerted by 25 p,g ml-’ oxytetracycline is dependent on the time at which it is present in the microcosms.
3.4.3. Omission of fish feed The fish feed present in the microcosm had been shown (Fig. lc) to be the major
source of substrate in the system. In Experiment 10, therefore, a pair of microcosm sets were constructed from which the fish food, present in normally constructed microcosms, was omitted. Oxytetracycline was added at 25 pg g-i to one set but omitted from the other. When examined after 159 h incubation, the total cell numbers had decreased from 2.6 f 0.6 X lo5 cfu ml-’ at the start of the incubation to 1.5 + 0.2 X IO5 cfu ml- ’ in the set containing no oxytetracycline, and to 4.4 f 1.0 X lo4 cfu ml- ’ in that containing oxytetracycline. The initial frequency of resistance was 0.06 f O.Ol%, and after incuba- tion in the absence of oxytetracycline for 159 h it was 0.05 f 0.04%. No oxytetracy-
J. Kerry et al./Aquaculture I44 (1996) 103-119 115
cline-resistant colonies (limit of detection 0.02%) were detected in any of the five vials which contained 25 p,g g- ’ oxytetracycline. Thus, in the absence of fish feed no increase in cell numbers occurred, and the presence of 25 pg ml-’ oxytetracycline exerted no selection pressure.
4. Discussion
The most important observation that can be made from these experiments was that, after an initial period of approximately 3 days, concentrations of oxytetracycline-HCl
up to 600 kg g-’ had a negligible impact on the rate of increase of pressure in the microcosms (Table 1). A second important observation was that the frequency of organisms capable of forming colonies on media containing oxytetracycline-HCl showed a direct, but not linear, relationship to the concentration of this agent in the microcosms (Fig. 4).
These observations are in almost direct opposition to those made by Hansen et al. (1993) who, in their microcosms studies of the impact of 400 kg g- ’ oxytetracycline on marine sediments, demonstrated a long-term inhibition of sulphate reduction activity and a small but irregular selection for increased frequency of resistant strains. They reported an initial 90% decrease in the rate of sulphate reduction. This inhibition persisted for at least 29 days, and the rate returned to normal only after 70 days incubation. The frequencies of resistance, defined as the ability to grow on TSCA with 25 kg ml-’ oxytetracycline, were 2.8%, 13.5% and 8.7% after 2, 7 and 80 days incubation, respectively.
It is reasonable to assume that the dramatic differences in the results of the study reported here and that of Hansen et al. (1993) are a function of some aspect of the very significant differences between the microcosm systems and the experimental protocols employed in the two studies. The physical properties of the two microcosm systems were totally different. Those studied by Hansen et al. (1993) comprised static sediments contained in 200-I tanks with sea water continually flowing over the sediment surface. In contrast, those used in this work were closed, agitated systems in 50 ml containers. Although these differences are such that the two systems have practically no physical parameter in common, it is argued here that the nature of the loading of the two systems may have had more impact on the divergent results they generated. In this work fish feed was added to marine mud immediately at the start of the experiment. This resulted in a lOOO-fold increase in culturable bacterial numbers in the oxytetracycline-free microcosms during the first 48 h of the experiments (Fig. 5). After this time the culturable numbers remained approximately constant for the rest of the incubation period. Hansen et al. (1993), on the other hand, placed a lo-cm layer of shell sand on the bottom of their systems and overlaid this with a further layer containing a 1:4 mixture of fish farm effluent and mud. These layers were allowed to stabilise for 4 days prior to the addition of oxytetracycline. They did not analyze the increase in culturable numbers over the first 48 h of their experiment, but the numbers reported on Days 2 and 7 (4 X 10⁵-1 X IO6 cfu ml-‘) were similar to the numbers detected in our microcosms at the start of our experiments (7 X lo5 cfu ml-‘). Thus, it is reasonable to assume that
116 J. Kerry et al./Aquaculture 144 (1996) 103-119
in our systems oxytetracycline-HCl was present during a period of rapid increase of cell numbers, whereas in the system studied by Hansen et al. (1993) no such increase occurred.
In a mixed population of bacteria, oxytetracycline can select for an increase in the frequency of resistant bacteria either by killing sensitive strains or by inhibiting or retarding their growth. Selection by killing is clearly a growth-independent process, whereas the inhibition of growth of the more sensitive bacteria can only exert selection in an environment that supports active cell division. The killing of bacteria requires a higher concentration of biologically active oxytetracycline than their inhibition. A variety of factors in these microcosms will act to reduce the percentage bioactivity (Smith et al., 1994b) of any oxytetracycline present in the matrix of the microcosms under discussion. Lunestad and Goksoyr (1990) have demonstrated that the concentra- tion of Caf+ and Mg++ in sea water will dramatically reduce the biological activity of oxytetracycline. In addition, Pinck et al. (1961) have demonstrated a reduction in biological activity in the presence of sediments. Smith et al. (1996) have demonstrated that the addition of 54 mM Mg++, 10 mM Ca++ and 25% marine sediment to laboratory media increases the minimum bactericidal concentration (MBC) of oxytetra- cycline against Lisronella anguillarum from 6 p,g ml - ’ to > 800 kg ml - ‘. In a study of freshwater sediments, Vaughan and Smith (1996) have shown that the MBC of oxytetracycline-HCl against Staphylococcus aureus and Yersinia ruckeri is increased from 7.0 p,g ml-’ and 18 pg ml-‘, respectively, to 2400 p,g ml-’ and 1200 p_g ml-’ in the presence of 8% river sediment. These data suggest that the extent of the reduction of the biological activity in these microcosms may be such that the concentrations of oxytetracycline included in both these sets of experiments would not have been sufficient to exert a killing action. If this assumption is correct, then any selection for increased resistance frequency in the microcosm systems must have been a function of the inhibition of the growth of sensitive bacteria. The extent of the selection and the frequencies of resistance observed would therefore be a direct function of the extent of microbial multiplication achieved in them.
If the arguments presented above concerning the relative extent of cell division in the microcosms studied in this work and those studied by Hansen et al. (1993) are correct, then the different extents of microbial multiplication in the two microcosm systems might be responsible for the difference between the results they produced. It can be postulated that at the start-up of both types of microcosms, sufficient biologically active oxytetracycline was present to inhibit both the metabolism and the cell division of sensitive bacteria. In the microcosms studied in this work the extent of cell division was sufficient to allow the multiplication of resistant bacteria. This resulted directly in an increase in the frequency of resistance and a rapid restoration of normal rates of the metabolic processes that were measured in these experiments. In contrast, the absence of cell division in the microcosms studied by Hansen et al. (1993) allowed no emergence of resistant bacteria. Thus, the initial conditions of low resistance frequency and low sulphate reduction activity persisted in their microcosms for a period of 25-70 days. This explanation is dependent on the validity of the model presented here that links increases in resistance frequency to an increase in cell numbers. In this work three predictions of this model were investigated. The model would predict that any increase
J. Kerry et al./Aquaculture 144 (1996) 103-I I9 117
in resistance frequency should occur exclusively during a period of growth in bacterial numbers. The data on the frequencies of resistance after 72 h incubation of the microcosms sets containing 100 p,g gg ’ and after 48 h incubation of those sets containing 25 pg g- ’ are consistent with this prediction. A second prediction would be that a delay in the addition of oxytetracycline-HCl until the rate of increase in cell numbers had declined would reduce the increase in resistance frequency. The data presented in Fig. 4 are consistent with this prediction. A third prediction of this model
would be that in the absence of fish feed the resultant lack of cell multiplication would mean that the presence of 25 kg gg ’ oxytetracycline, even from the start of incubation, would not select any significant increase in the frequency of resistance. Again the data obtained are consistent with this third prediction.
The data of Klaver and Mathews (1994) cannot be easily compared with the data presented in this work or with that presented by Hansen et al. (1993). They studied the impact of oxytetracycline in microcosms containing artificial freshwater, sediment and ammonia, and observed that concentrations of oxytetracycline from 12.5 to 75 p,g ml-’ inhibited nitrification for up to 11 days. As little cell division would be expected in this environment, these data are also consistent with the model developed in this paper. In their experiments, however, Klaver and Mathews (1994) used a commercially available culture of nitrifying bacteria. Thus their data were generated using a more limited microflora than that present in the natural mixed populations studied in this work and that of Hansen et al. (1993).
It must be recognised that gas pressure changes monitored in this work represent a proxy measurement of the biological activities in the microcosms, and all proxy measurement are, to a greater or lesser extent, inaccurate. The data presented in this paper (Fig. la-c) demonstrate, however, that they represent a simply determined, quantitative and reproducible integrative assessment of some of these activities. The production of gases from complex substrates such as fish feed involves the cooperative interaction of a number of microbial groups under anaerobic conditions. Colleran (1992) has reported that methane generation, for example, involves the cooperation of at least four metabolically and physiologically distinct microbial groups. The data presented in this paper cannot provide any information on the various contributions of these groups or the rates of the separate processes they mediate. No data were collected that might provide an understanding of the difference between the processes occurring during the adaptation phase and those occurring during the steady-state phase. It must be remem- bered, however, that the use of aerobic agar plates to investigate changes in the microflora in these microcosms can only provide quantitative information on a fraction of the microbial populations involved. The function of the fraction capable of growth on such media, in the gas production process or the adaptation or steady-state phases, has not be determined.
The data and arguments presented in this paper suggest that the extent of microbial multiplication achieved within a microcosm system will dramatically determine the results which it produces with respect to the rates of various metabolic processes and the emergence of resistant strains in the presence of oxytetracycline. This would suggest that both the protocols adopted in this work and in those reported by Hansen et al. (1993) and Klaver and Mathews (1994) are for different reasons seriously flawed. In this work
118 J. Kerry et al./Aquaculture 144 (1996) 103-119
a relatively large amount of feed was added at the beginning of the experiments, whereas Hansen et al. (1993) added no feed to their system. In the under-cage sediments in the marine environment the situation lies between these two extremes. In the natural environment continuous additions of small amounts of feed are made to these sediments. Weston et al. (1994) has reported preliminary results of a study of the rates of emergence of resistance in microcosms systems where attempts were made to simulate this rate of feed deposition. In these studies fish feed was continuously added to microcosms at a rate determined on the basis of experimental data from marine farms. In a microcosm examined 2 days after the end of a lo-day administration of medicated feed, the frequency of resistance to oxytetracycline was approximately 30%.
If the extent of microbial multiplication is a critical parameter of microcosms, then a further factor that might complicate their design will be the extent to which cell division in the microflora is related to predation rates (Enger et al., 1990). If predation is important, then the inclusion of microbial predators may be required in microcosm studies. The arguments presented in this paper strongly suggest that if microcosms are to be used to establish the probable impact on sediment processes of antimicrobial agents used in fish farms, then information on the comparative rates of cell division that occur in the natural environment, and in the microcosms themselves, will be of critical importance in establishing their validity.
References
Bjdrkhmd, H., Bondestam, J. and Bylund, Cl., 1990. Residues of oxytetracycline in wild fish and sediments from fish farms. Aquaculture, 86: 359-367.
BjBrklund, H.V., RLbergh, C.M.I. and Bylund, G., 1991. Residues of oxolinic acid and oxytetracycline in fish
and sediments from fish farms. Aquaculture, 97: 85-96.
Colleran, E., 1992. Aerobic digestion of agricultural and food processing effluents. In: J.C. Fry, G.M. Gadd,
R.A. Herbert, C.W. Jones and LA. Watson-Clarke (Editors), Microbial Control of Pollution. Society for
General Microbiology Symposium No. 48. Cambridge University Press, Cambridge.
Concannon, F., Quinn, M., O’Flaherty, S. and Colleran, E., 1988a. Automated measurement of specific
methanogenic activity of anaerobic digestion biomass. B&hem. Sot. Trans., 17: 425.
Concannon, F., Reynolds, P.J., Hennigan, A. and Colleran, E., 1988b. Development of a computer&d continuous assay for specific methanogenic activity measurement. In: A. Tilche and A. Rossi (Editors),
Proc. 5th hit. Conf. Anaerobic Digestion. Monduzzi Editore, Bologna, Italy.
Coyne, R., Hiney, M., O’Connor, B., Kerry, J., Cazabon, D. and Smith, P., 1994a. Concentration and persistence of oxytetracycline in sediments under a marine salmon farm. Aquaculture, 123: 3 l-42.
Coyne, R., Hiney, M. and Smith, P., 1994b. Evidence associating overfeeding on a salmon farm with a
prolonged half-life of oxytetracycline in under-cage sediments. Bull. Eur. Assoc. Fish. Pathol., 14: 207-210.
DePaola, A., 1995. Tetracycline resistance by bacteria in response to oxytetracycline-contaminated catfish feed. J. Aquat. Anim. Health, 7: 155-160.
DePaola, A., Peeler, J.T. and Rodrick, G.E., 1995. Effect of oxytetracycline-medicated feed on antibiotic resistance of gram-negative bacteria in catfish ponds. Appl. Environ. Microbial., 61: 2335-2340.
Donlon, B., 1992. Acetogenesis, bacterial adhesion and lignocellulose conversion. Ph.D. Thesis, National
University of Ireland, Dublin. Enger, 0.. Hoff, K., Schei, G.H. and Dundas, I., 1990. Starvation survival of the fish pathogenic bacteria
Vibrio anguillarum and Vibrio salmonicida in marine environments. FEMS Microbial. Ecol., 74: 215-220
Hansen, P.K., Lunestad, B.T. and Samuelsen, O.B., 1993. Effects of oxytetracycline, oxolinic acid, and
flumequine on bacteria in an artificial marine fish farm sediment. Can. J. Microbial., 38: 1307- 1312.
J. Kerry et al./Aquaculture 144 (1996) 103-119 119
Jacobsen, P. and Berglind, L., 1988. Persistence of oxytetracycline in sediments from fish farms. Aquaculture,
70: 365-370.
Kapetanaki, M., Kerry, J., Hiney, M., O’Brien, C., Coyne, R. and Smith, P., 1995. Emergence, in
oxytetracycline-free marine mesocosms, of microorganisms capable of colony formation on oxytetracy-
cline-containing media. Aquaculture, 134: 227-236.
Kerry, J., Hiney, M., Coyne, R., Cazabon, D., NicGabhaimr, S. and Smith, P., 1994. Frequency and
distribution of resistance to oxytetracycline in microorganisms isolated from marine fish farm sediments
following therapeutic use of oxytetracycline. Aquaculture, 123: 43-54.
Kerry, J., Hiney, M., Coyne, R., NicGabhainn, S., Gilroy, D., Cazabon, D. and Smith, P., 1995. Fish feed as a
source of oxytetracycline-resistant bacteria in the sediments under fish farms. Aquaculture, 131: 101-l 13.
Klaver, A.L. and Mathews, R.A., 1994. Effects of oxytetracycline on nitrification in a model aquatic system.
Aquaculture, 123: 237-247.
Lunestad, B.T., 1992. Fate and effects of antibacterial agents in aquatic environments. In: C.M. Michel and
D.J. Alderman (Editors), Chemotherapy in Aquaculture: From Theory to Reality. Office Intemationale des
Epizooties, Paris, 567p..
Lunestad, B.T. and Goksoyr, J., 1990. Reduction in the antibacterial effect of oxytetracycline in sea water by
complex formation with magnesium and calcium. Dis. Aquat. Org., 9 67-72.
McPhearson, R.M., DePaola, A., Zywno, S.R., Motes, Jr., M.L. and Guarino, A.M., 1991. Antibiotic
resistance in gram-negative bacteria from cultured cattish and aquaculture ponds. Aquaculture, 99:
203-211.
Nygaard, K., Lunestad, B.T., Hektocn, H., Berge, J.A. and Hormazabal, V., 1992. Resistance to oxytetracy-
cline, oxolinic acid and furazolidone in bacteria from marine sediments. Aquaculture, 104: 31-36.
Pinck, L.A., Soulides, D.A. and Allison, F.E., 1961. Antibiotics in soils. 2. Extent and mechanism of release.
Soil Sci., 91: 94-99.
Samuelsen, O.B., Torsvik, V. and Ervik, A., 1992. Long-range changes in oxytetracycline concentration and
bacterial resistance towards oxytetracycline in a fish farm sediment after medication. Sci. Total Environ.,
114: 25-36. Sithole, B.B. and Guy, R.D., 1987a. Models for tetracycline in aquatic environments. 1. Interactions with
bentonite clay systems. Water Air Soil Pollut., 32: 303-314.
Sithole, B.B. and Guy, R.D., 1987b. Models for tetracycline in aquatic environments. 2. Interactions with
humic substances. Water Air Soil Pollut., 32: 3 15-32 1.
Smith, P., Donlon, J., Coyne, R. and Cazabon, D., 1994a. Fate of oxytetracycline in a freshwater fish farm:
Influence of effluent treatment systems. Aquaculture, 120: 3 19-325.
Smith, P., Hiney, M.P. and Samuelsen, O.B., 1994b. Bacterial resistance to antimicrobial agents used in fish
farming: A critical evaluation of method and meaning. AMU. Rev. Fish Dis., 4: 273-3 13.
Smith, P., Niland, T., O’Domhnaill, F., O’Tuathaigh, G. and Hiney, M., 1996. Influence of marine sediment
and divalent cations on the activity of oxytctracycline against Listoneh anguillarum. Bull. Eur. Assoc.
Fish Pathol., 16: 54-57.
Soulides, D.A., Pinck, L.A. and Allison, F.E., 1961. Antibiotics in soils. 3. Further studies on release of
antibiotics from clays. Soil Sci., 92: 90-93. Vfit&ten, P., 1977. Effects of composition of substrate and inoculation technique on plate counts of bacteria in
the North Baltic sea. J. Appl. Bacterial., 42: 437-443.
Vaughan, S. and Smith, P., 1996. Estimations of the influence of river sediment on the biological activity of
oxytetracycline HCI. Aquaculture, 141: 67-76.
Vaughan, S., Coyne, R. and Smith, P., 19%. The critical importance of sample site in the determination of the frequency of oxytctracycline resistance in the effluent microflora of a freshwater fish farm. Aquaculture,
139: 47-54.
Weston, D.P., Capone, D.G., Herwig, R.P. and Staley, J.T., 1994. Environmental fate and effects of aquacultural antibacterials in Puget Sound: A report of the University of California pursuant to the National Oceanic and Atmospheric Administration (Award no. NA26FDO109-01). University of California,
Berkeley, CA.
Zobell, C.E., 1941. Studies on marine bacteria. 1. The cultural requirements of heterotrophic species. J. Mar. Res., 4: 42-75.
Related Documents