CENTRE FOR SOCIAL SCIENCE RESEARCH The implications of social context partisan homogeneity for voting behavior: survey evidence from South Africa Collette Schulz Herzenberg CSSR Working Paper No. 329 2013

Welcome message from author
This document is posted to help you gain knowledge. Please leave a comment to let me know what you think about it! Share it to your friends and learn new things together.
Transcript
CENTRE FOR SOCIAL SCIENCE RESEARCH
The implications of social context partisan homogeneity for voting
behavior: survey evidence from South Africa
Collette Schulz Herzenberg
CSSR Working Paper No. 329
2013
Published by the Centre for Social Science Research
University of Cape Town
2013
http://www.cssr.uct.ac.za
This Working Paper can be downloaded from:
http://cssr.uct.ac.za/pub/wp/329/
ISBN 978-1-77011-316-9
© Centre for Social Science Research, UCT, 2013
About the author:
Collette Schulz Herzenberg is a Post-Doctoral Research Fellow at the Democracy in
Africa Research Unit in the Centre for Social Science Research at the University of
Cape Town.
Acknowledgement:
The author would like to acknowledge the A.W. Mellon Foundation for the financial
support for the postdoctoral scholarship. The author would also like to thank
Professor Robert Mattes and Professor Jeremy Seekings at the Centre for Social
Science Research, University of Cape Town, for their comments and advice. Any
errors or omissions rest solely with the author.
1
The implications of social context partisan homogeneity for voting behavior: survey evidence from South Africa
Abstract
Due to the legacy of apartheid segregation South Africa remains a highly
divided society where most voters live in politically homogenous social
environments. This paper argues that political discussion within one’s social
context plays a primary role in shaping political attitudes and vote choice in
South Africa. Specifically, the extent of partisan homogeneity or heterogeneity
within one’s social context has important, yet distinct implications for voting
behaviour. Using data from the Comparative National Elections Project 2004
and 2009 South African post-election surveys, the paper explores the extent of
social context partisan homogeneity in South Africa and finds that voters are not
overly embedded in homogenous social contexts. The paper then demonstrates
the consequences of partisan homogeneity on voting behavior. Homogenous
social contexts tend to encourage stronger partisan loyalties and fewer
defections in vote choice while people in more heterogeneous contexts show less
consistency in their attitudes and behaviour during elections. Finally, the
analysis shows how momentous socio-political events at the time of a particular
election can change the nature of social contexts, with important consequences
for electoral outcomes.
Introduction
Citizens derive much of their political information from people in their
immediate social context (Berelson et al., 1954; Huckfeldt and Sprague, 1987;
Beck et al., 2002; Richardson and Beck, 2007; Beck and Gunther, 2012). As
political information flows to voters via these discussants, they help to shape
perceptions about political parties and election campaigns. The result, scholars
argue, is that the social context has an important bearing on enduring political
attitudes like partisanship and voting choice (Dalton, et al., 1984; Beck et al.,
2002).
2
This paper’s central argument is that, through political discussion, the social
context can play a primary role in shaping political attitudes and vote choice in
South Africa. More specifically, the extent of partisan homogeneity or
heterogeneity within one’s immediate social context has important, yet distinct
implications for voting behaviour. Using data from the Comparative National
Elections Project 2004 and 2009 South African post-election surveys, the paper
explores the extent of social context partisan homogeneity in South Africa and
finds that voters are not overly embedded in homogenous social contexts.
Controlling for other important predictors, including satisfaction with
government’s performance, party identification, campaign interest, age and race,
the paper then demonstrates the consequences of partisan homogeneity on voting
behavior. Homogenous social contexts tend to encourage stronger partisan
loyalties and fewer defections in vote choice. In contrast, people in
heterogeneous networks show less consistency in their attitudes and behaviour
during elections. They are more likely to defect from their party identification
when they vote; are more likely to defect from their previous vote choice in
subsequent elections; have weaker partisan ties; and are more likely to consider
alternative political homes. Finally, the analysis shows how momentous socio-
political events at the time of a particular election can change the nature of social
contexts, with important consequences for electoral outcomes.
The social context and voter behaviour
The social context consists of people with whom individuals maintain ongoing
relationships and with whom they discuss important matters, even political
matters. Some are discussants that individuals choose to engage with frequently
and they are often intimates such as a spouse/partner or a friend or family
member. These discussants form a social network for the individual. However,
the flow of political information to an individual can also occur through weaker,
less intimate ties within his/her wider social context and may include
neighbours, co-workers, family members and friends.
The social context is said to have an especially strong influence on electoral
decisions when political messages contain a distinctive ‘political bias’ (when
they are perceived as favouring one or another political party) that is
‘congruent’, or in agreement, with an individual’s political preferences
(Richardson and Beck, 2007: 188). Since people are likely to adopt the political
views of those around them, the stronger the convergence of similar political
influences from their sources the more likely the voter is to follow suit (Beck et
al., 2002; Richardson and Beck, 2007).
3
People often exercise discretion in the selection of their discussants, usually
preferring to discuss politics with those who hold agreeable preferences.
Moreover, the choice of discussants is often socially constrained to those within
their wider social setting. The result is that the information gleaned by voters
from these people reinforces rather than dilutes pre-existing political preferences
(Berelson et al., 1954; Franklin, 2004: 45). Nevertheless, many individuals are
limited in the control they have over their exposure to political communication
within their social setting. One’s inherent self-selection mechanism is
counteracted by those more distant social interactions within the workplace or
neighbourhood where political opinions may not always be congruent with the
individual. Thus, for most voters, the choice over and construction of a
communication network occurs with pronounced constraints on the supply of
similar political attitudes (Huckfeldt et al., 2004: 21).
In the context of a highly divided or polarised society there are likely to be fewer
societal constraints on the supply of agreeable discussants. The high levels of
political homogeneity (and low levels of political disagreement) within social
groups (juxtaposed by high levels of political polarization between groups) may
mean that the transmission of political information through personal discussants
is likely to be channeled by the dominant cleavage structure that characterizes
the social setting. Voters, caught up in their social cleavages, will be primarily
exposed to the prevailing political biases of that cleavage. Accordingly, two
interconnected processes transpire – both of which encourage group uniformity
in behaviour (Rose and McAllister, 1990: 109). The first is that, through inter-
personal contacts and flows of communication, discussants in highly
homogenous communities will in all likelihood provide political messages that
compliment an individual’s existing partisan beliefs. The second is that
repetitive exposure to these ‘supportive’ partisan messages will reinforce and
strengthen prevailing partisan beliefs. Consequently, when the social group
context is highly homogenous, common partisan responses are generated more
effectively. Conversely, when communities are more politically heterogeneous
and the partisan cues emanating from discussants are diverse, partisan behaviour
is less predictable and mass volatility should increase. Evidence from Japan and
Sweden suggests this is the case – their most heterogeneous communities are the
least effective at mobilizing votes for the dominant parties (Dalton et al., 1984:
18). Thus, social contacts reinforce group awareness, encourage individual
voters to align their voting intentions with group interests, and inform voters of
the likely voting behavior of other group members (Franklin, 2004: 45).
4
South Africa – A model case for social context effects? South Africa presents an ideal case for exploring the effects of the social context
on voter behavior. Due to the legacy of apartheid segregation, South Africa
remains a highly divided society where most voters live in politically
homogenous social environments. Highly stratified racial and political contexts
predetermine the social context. As a result many voters are likely to reside in
homogenous political information networks where their partisan identities reflect
widely among their personal discussants.
During an election campaign, voters receive repetitive partisan messages from a
multiplicity of sources within their social context, each imparting their particular
partisan bias. One can therefore perceive of individual voters as being embedded
in social contexts that take on particular partisan characteristics. In this paper, I
examine the extent of partisan congruence within the social context. I refer to
two types of social contexts. The first is a more ‘homogenous partisan social
context, which exists when half or more of the respondent’s discussants support
the same party. The second type is a more ‘heterogeneous partisan social
context’ where half or more of the respondent’s discussants support a political
party different to his/hers. In other words, under scrutiny is the diversity of the
respondent’s social context in terms of the political opinions and attitudes of
people within that context.
When an individual’s social context is politically homogenous the chances of his
voting behaviour reflecting others in his immediate context increases. This
context type encourages conformity of partisan attitudes and behavior and it is
unlikely that voters will support a different party to the one supported by those
around them. Similarly, political disagreement is less likely where strong
partisan attitudes prevail and political passions are intense (Huckfeldt et al.,
2004: 23). Moreover, in politically charged environments where strong partisan
attitudes prevail, conformity to the attitudes and norms of the dominant group
bring with it social rewards, while deviation can elicit social sanctions including
rejection and derogation. In these situations, political discussions that support
one’s partisan views may suitably be regarded as ‘safe discussions’ whereas
conflict with prevailing political views may constitute ‘dangerous discussion’
(Eveland and Hively, 2009: 206).
When the social context exposes a voter to a more heterogeneous mix of
political viewpoints - where the respondent is exposed to a greater diversity of
political information and partisan attitudes about campaigns, candidates and
parties – it should stimulate more complex thinking about politics. So, while
5
one’s political knowledge and decisions should become more informed, one’s
electoral behaviour should become less predictable or less consistent. These
voters should deviate more frequently from their party identification and
previous vote choices, and they should demonstrate weaker partisan ties.
Heterogeneous partisan social contexts are not expected to be as common as
their more homogenous counterparts in South Africa, but where they exist, their
collective action should present as macro-level electoral volatility.
The paper therefore proposes an alternative theoretical sociological explanation,
not only for individual-level voting decisions, but also for the appearance of
racial or ethnic census-style election results in South Africa. In South Africa,
voter loyalty to racial or ethnic group identities is attributed as the reason for
repeated ‘census-style’ electoral outcomes (Lipset and Rokkan, 1967; Horowitz,
1985). This perspective raises a range of concerns about democratic politics. If
voters are unquestionably loyal to their parties, are unmoved by incumbency
performance and are unwilling to move their support elsewhere elections cannot
function as a sanctioning mechanism over elite behaviour. From a ‘social
context’ perspective, however, census-style or racial bloc voting is less a
consequence of enduring, identity-based loyalties, but rather a macro-level result
of an overload of partisan bias in the political information voters receive from
highly homogenous, ‘sealed’ political environments. Within the context of South
Africa’s racially and politically divided society, patterns of social interaction are
such that many voters seldom encounter other ethnic counterparts within their
closely held networks of political communication, apart from within the
workplace. Therefore, the partisan bias received by individual voters reflects and
corresponds with the society’s dominant cleavages, giving the appearance of
cleavage style voting with the typically characteristic fixed or rigid electoral
outcomes.
However, unlike sociological explanations that emphasize the influence of
‘fixed’ or static identities, the social context may change over time. When
profound socio-political events reverberate throughout a society they can
transform the nature of social networks by changing the flow and political
content of information gleaned through intermediary exposure. When this
happens there are bound to be important consequences for electoral behavior.
Scholars have argued that the precise nature and context of a particular election
may have profound effects on political attitudes and behavior. For instance,
turnout variations have been partly explained by the differences in the political
contexts surrounding each election (Franklin, 2004: 44). The institutional, social
and political context in which individuals are embedded at the time of an
election can make one election more salient over others. As Franklin states, “It
seems that citizens generally understand the “stakes” of any given election,
either through their political discussants, media coverage, or the effects of
6
respective campaigns” (Franklin, 2004: 44). Elections that are perceived as
particularly competitive and especially those that may result in substantive
policy change tend to increase the political interest of the individual and bring
more people to the polls (Franklin, 2004: 151).
The 2009 national and provincial election in South Africa is arguably the most
competitive elections to date. In the years that preceded the elections, a series of
developments brought about several important changes to the political landscape
that all posed significant challenges to the ANC’s electoral dominance. Few
expected the ANC to lose the 2009 elections. Nevertheless, many thought that
the ANC faced new hitherto unseen challenges that might threaten the party’s
overwhelming electoral victories of the three previous democratic elections.
Although the ANC went on to win the 2009 elections, they did so with a smaller
percentage of total votes (which declined from 69.6% in 2004 to 65.9% in 2009)
despite an increase in voter turnout (which increased from 76.7% in 2004 to
77.3% in 2009) (Daniel and Southall, 2009: 234).
Jacob Zuma’s rise to the presidency of the ANC had fuelled the formation of a
new opposition party, the Congress of the People (COPE), by dissidents from
within the ruling party who remained loyal to former president Thabo Mbeki
(Southall, 2009: 1). Many regarded the newcomer to the political scene as a
long-awaited legitimate alternative political home to the ANC, especially for
black African voters. As for the ANC, following a chaotic internal party
succession struggle and the victory of Jacob Zuma as party president, the party
inherited a controversial leader that faced charges of corruption, and later,
allegations of political interferences aimed at quelling the National Prosecuting
Authority’s attempts to prosecute him.
A changing political landscape also saw the largest opposition party, the
Democratic Alliance (DA) re-launch the party, under a new ‘brand’ and a new
style of campaigning in 2009. Under the leadership of Helen Zille, the DA
started to project a more racially inclusive image in an attempt to broaden its
support base in ‘non-traditional’ (black) constituencies, and reach new
audiences. The party also sought to build upon its reputation for competence by
showcasing its performance track record in local government in the City of Cape
Town (Southall, 2009: 6; Schulz-Herzenberg, 2009: 45). As Jolobe says, ‘The
specific goal was to wrestle with the party’s negative image as a white minority
party, to recreate a new DA that would be more diverse, more reflective of South
Africa’s racial, linguistic and cultural heritage’ (Jolobe, 2009:138). The DA’s
2009 campaign presented a marked departure from previous campaigns that had
merely aimed to consolidate the support of minority or middle class interests.
7
Other processes also generated uncertainty about the 2009 election outcomes.
An increase in voters from the born-free generation, those who came of age
politically after 1996 and have little experience of Apartheid, introduced a new
cohort of less predictable voters (with potentially weaker party identification)
into the electorate. Moreover, trends in electoral participation since 1994 show a
noticeable withdrawal of eligible voters at the polls, which, if remobilized,
present a significant force for change (Schulz-Herzenberg, 2009: 24). In
addition, rising social discontent with the delivery of basic essential services
culminated in a wave of service delivery protests across local communities prior
to the elections raising the possibility that voters once loyal to the governing
party may switch to other political homes.
Finally, a distinctive feature of the 2009 elections was the introduction of free
campaign advertising on television to political parties (Glenn and Mattes, 2010).
This gave South African electoral contenders, particularly ill-funded opposition
parties, new opportunities to reach beyond traditional constituencies. Political
advertisements, mainly through electronic media adverts, exposed millions more
voters to a richer diversity of political coverage and information than ever
before.
The social and political context in South Africa at the time of the 2009 elections
was at its most precarious since the founding democratic elections in 1994. Far-
reaching changes in political landscape, which included a dramatic splinter from
the incumbent party, a new legitimate political contender with potential mass
appeal, a rejuvenated and re-focused opposition party, and the uptake of free
television campaign advertising by the largest political parties, undoubtedly
provided heightened stimulus for voters, raising levels of political interest and
discussion about politics during the 2009 campaign. Most importantly, however,
the combined effect of these factors should have diversified the partisan content
of political information flowing through intermediaries, thereby increasing the
levels of partisan heterogeneity in many people’s social contexts, and potentially
changing the way these voters learnt about and responded to parties and
candidates. In short, during the time of the 2009 elections, the proportion of
voters living within a more heterogeneous partisan social context should have
increased compared to the earlier elections, with fewer voters exposed to highly
congruent partisan messages. Subsequently, the ‘reinforcing’ effects of
homogenous social contexts on voting decisions should have declined from
previous years.
8
Research questions
The paper is guided by three research questions:
1. What types of social contexts predominate in South Africa and how much
partisan congruence or diversity do they provide?
I examine levels of partisan homogeneity versus heterogeneity within social
contexts and the overall distributions of the two context types across two
elections and expect to find a higher proportion of respondents in politically
congruent social contexts in South Africa.
2. Do social context types affect voting behavior differently?
I explore the effects of the two context types on individual-level vote behavior
and partisan attitude strength. Individuals in homogenous partisan social contexts
should show greater consistency in their voting behavior, with fewer deviations
from partisanship and previous vote choices, as well as stronger partisan
attitudes. In contrast, voters in heterogeneous contexts are expected to show
lower levels of partisan attitude strength and less consistency in their vote
choices.
3. Are there significant differences between the 2004 and 2009 elections
regarding: a) political engagement with discussants; and b) the extent of
heterogeneity within social contexts?
I compare the frequency of political discussion among voters and the
distribution of context types across the two elections to evaluate whether, as is
expected, political engagement increased, and social contexts became more
politically heterogeneous in 2009.
Significance of the study The findings hold important implications for democracy. Competitive elections,
where incumbents are unsure of the outcome, are essential to the quality of
democracy because they encourage greater elite responsiveness and
accountability to citizens. However, if the flow of political information for most
voters is so excessively homogenous that it simply reinforces existing partisan
attachments, and eclipses consideration of short-term factors like policy or
government performance, the ability of voters to make independent and
informed choices is undermined, and the likelihood of inter-party shifts remains
9
low. This scenario inadvertently consolidates the position of a dominant party by
reducing chances for competitive, unpredictable elections. The implications for
democracy are unfavorable. After all, vote shifts are a prerequisite for the ‘two
turnover’ test, a phenomenon widely regarded as the litmus test of democratic
consolidation in countries like South Africa (Huntington, 1991).
However, if a significant proportion of the electorate is not embedded in
politically homogenous social contexts they are more likely to be exposed to a
diversity of political communication and contrary opinions. This, in turn, should
produce greater levels of political deliberation and disagreement among citizens,
which then encourage greater political tolerance, increase the quality of opinion
formation, and ultimately, enhance opportunities for electoral change (Huckfeldt
et al., 2004: 2). Indeed, the vitality of democratic politics is said to depend on
the presence and survival of political heterogeneity and disagreement among
citizens (Huckfeldt et al., 2004: 2). And, according to Huckfeldt and his
colleagues, it is within politically heterogeneous social networks that political
disagreement can best survive (Huckfeldt et al., 2004: 18). Accordingly, among
these voters, partisan loyalties are less fortified, and they are more receptive to
political alternatives. This uncertainty is the essential ingredient of competitive
democratic elections.
Methods and data sources In this paper, I analyze data from the Comparative National Election Project
(CNEP) 2004 and 2009 South African post-election public opinion surveys. The
CNEP is a multi-national project that studies political communication and social
structure within the context of election campaigns using compatible research
designs and a common core of survey questions (Gunther et al., 2007: 15). The
surveys are designed to explore the impact of the social context and personal
discussion networks and includes batteries of questions that tap exposure to
political information through a range of intermediaries, as well as partisan
congruence between respondents and intermediaries. The similarity of question
items allows for systematic comparisons across two South African election
campaigns. The South African CNEP surveys were conducted nationally
following each election and each included 1 200 personal interviews. The
samples were drawn using multi-stage, stratified, area cluster probability
sampling.
10
Results
1. Types of social context in South Africa The Comparative National Elections Study (CNEP) post-election survey asks
respondents a range of questions about their discussions regarding the election
campaign with their discussants, including family members, friends, neighbours,
co-workers, as well as chosen intimates such as a spouse/partner or primary
discussant. In particular, CNEP asks respondents about the political preferences
of these discussants and whether the respondent perceives that they support the
same party as him/herself. The analysis starts by assessing the extent of ‘partisan
congruence’, or fit between a respondent’s self-declared partisan preference and
his/her discussants.1
1.1 Partisan congruence and the social context The data shows that highly congruent partisan relationships exist between voters
and members of their social context. When asked in 2004 whether their family,
friends, neighbours and co-workers supported the same party as themselves, 65
percent responded positively for family, 46 percent for friends, 45 percent for
neighbours, while 31 percent thought their co-workers supported the same party.
This is in stark contrast to news media where no more than 5 percent of
respondents perceive that they are ever exposed to congruent partisan messages
from their news media sources. In 2009, perceived levels of partisan congruence
with neighbours and co-workers decreased, congruence with friends changed
little, and congruence with family rose slightly (Table 1). The confidence
intervals (with a 5% error) around the percentages suggest that the increase in
perceived partisan congruence with family members, as well as the decrease in
congruence with neighbours and co-workers are increases that can be found in
the wider population. The percentages also move in the expected direction over
the consecutive elections. The two-sample t-test statistic between the two
percentages for each year in each discussant category shows a significant
difference at the .05 level for family, neighbours and co-workers.2
1 See Appendix for information about the operationalization and coding of all variables.
2 Family: t(2398)=3.245, p=.001; Friends: t(2398)=0.787, p=431; Neighbours: t(2398)=6.599,
p=.001; Co-workers: t(2398)=2.996, p=.002. The maximum margin of error at 95% confidence
for sample sizes of 1200 is 2.8%.
11
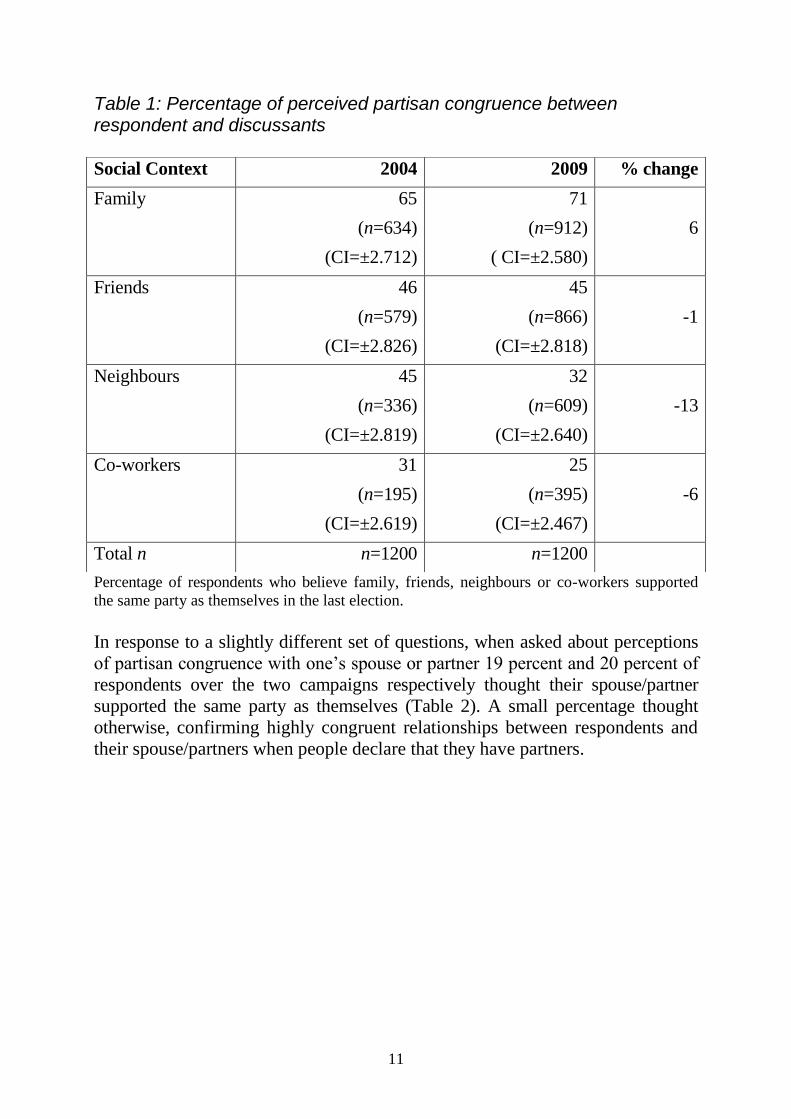
Table 1: Percentage of perceived partisan congruence between respondent and discussants
Percentage of respondents who believe family, friends, neighbours or co-workers supported
the same party as themselves in the last election.
In response to a slightly different set of questions, when asked about perceptions
of partisan congruence with one’s spouse or partner 19 percent and 20 percent of
respondents over the two campaigns respectively thought their spouse/partner
supported the same party as themselves (Table 2). A small percentage thought
otherwise, confirming highly congruent relationships between respondents and
their spouse/partners when people declare that they have partners.
Social Context 2004 2009 % change
Family 65
(n=634)
(CI=±2.712)
71
(n=912)
( CI=±2.580)
6
Friends 46
(n=579)
(CI=±2.826)
45
(n=866)
(CI=±2.818)
-1
Neighbours 45
(n=336)
(CI=±2.819)
32
(n=609)
(CI=±2.640)
-13
Co-workers 31
(n=195)
(CI=±2.619)
25
(n=395)
(CI=±2.467)
-6
Total n n=1200 n=1200
12
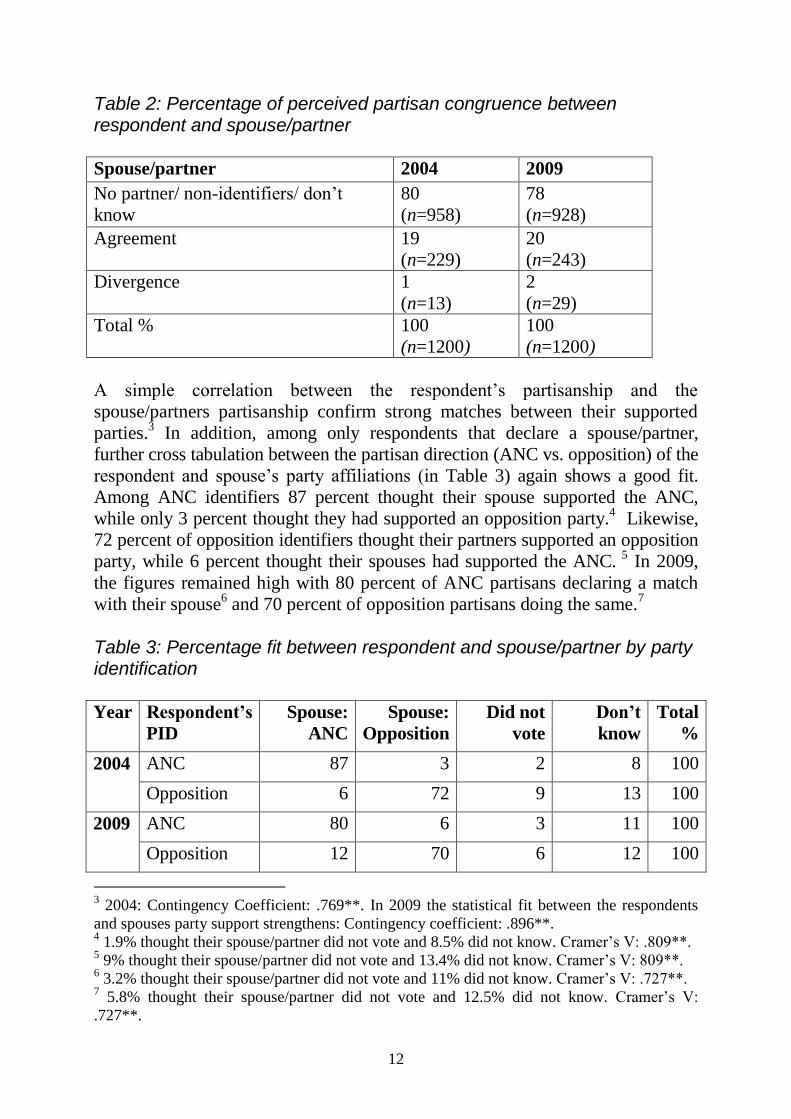
Table 2: Percentage of perceived partisan congruence between respondent and spouse/partner
Spouse/partner 2004 2009
No partner/ non-identifiers/ don’t
know
80
(n=958)
78
(n=928)
Agreement 19
(n=229)
20
(n=243)
Divergence 1
(n=13)
2
(n=29)
Total % 100
(n=1200)
100
(n=1200)
A simple correlation between the respondent’s partisanship and the
spouse/partners partisanship confirm strong matches between their supported
parties.3 In addition, among only respondents that declare a spouse/partner,
further cross tabulation between the partisan direction (ANC vs. opposition) of the
respondent and spouse’s party affiliations (in Table 3) again shows a good fit.
Among ANC identifiers 87 percent thought their spouse supported the ANC,
while only 3 percent thought they had supported an opposition party.4 Likewise,
72 percent of opposition identifiers thought their partners supported an opposition
party, while 6 percent thought their spouses had supported the ANC. 5
In 2009,
the figures remained high with 80 percent of ANC partisans declaring a match
with their spouse6 and 70 percent of opposition partisans doing the same.
7
Table 3: Percentage fit between respondent and spouse/partner by party identification
Year Respondent’s
PID
Spouse:
ANC
Spouse:
Opposition
Did not
vote
Don’t
know
Total
%
2004 ANC 87 3 2 8 100
Opposition 6 72 9 13 100
2009 ANC 80 6 3 11 100
Opposition 12 70 6 12 100
3 2004: Contingency Coefficient: .769**. In 2009 the statistical fit between the respondents
and spouses party support strengthens: Contingency coefficient: .896**. 4 1.9% thought their spouse/partner did not vote and 8.5% did not know. Cramer’s V: .809**.
5 9% thought their spouse/partner did not vote and 13.4% did not know. Cramer’s V: 809**.
6 3.2% thought their spouse/partner did not vote and 11% did not know. Cramer’s V: .727**.
7 5.8% thought their spouse/partner did not vote and 12.5% did not know. Cramer’s V:
.727**.
13
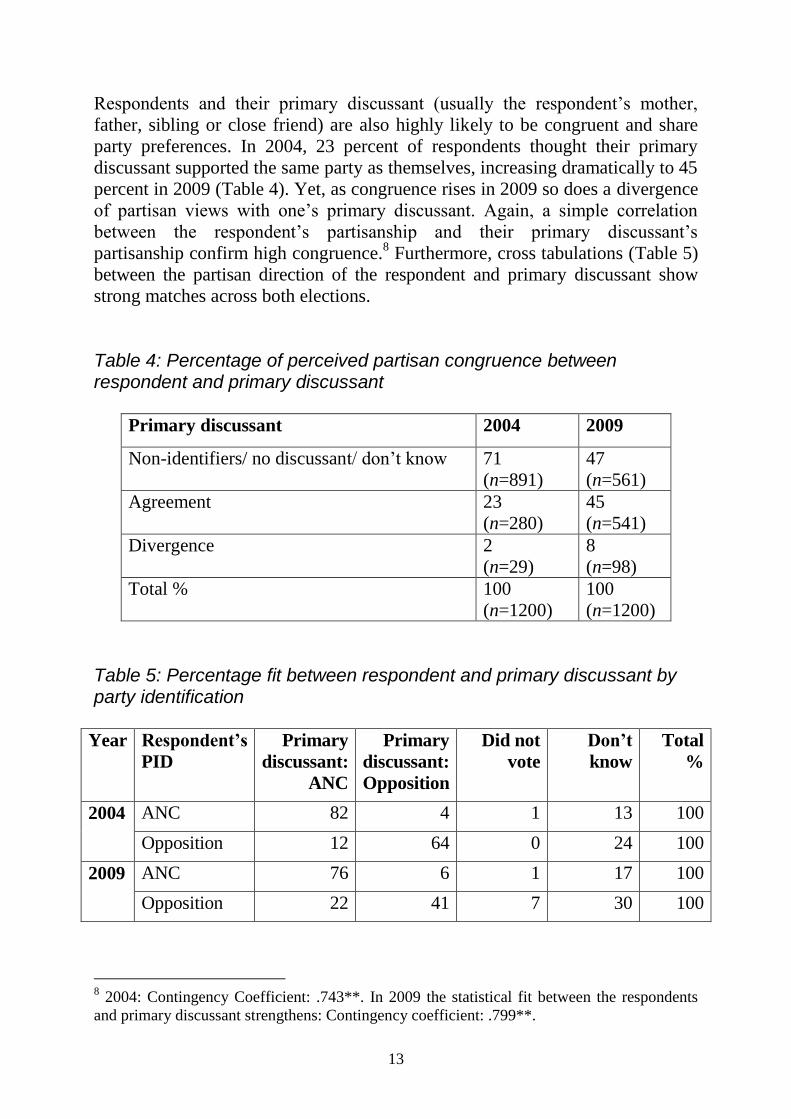
Respondents and their primary discussant (usually the respondent’s mother,
father, sibling or close friend) are also highly likely to be congruent and share
party preferences. In 2004, 23 percent of respondents thought their primary
discussant supported the same party as themselves, increasing dramatically to 45
percent in 2009 (Table 4). Yet, as congruence rises in 2009 so does a divergence
of partisan views with one’s primary discussant. Again, a simple correlation
between the respondent’s partisanship and their primary discussant’s
partisanship confirm high congruence.8 Furthermore, cross tabulations (Table 5)
between the partisan direction of the respondent and primary discussant show
strong matches across both elections.
Table 4: Percentage of perceived partisan congruence between respondent and primary discussant
Primary discussant 2004 2009
Non-identifiers/ no discussant/ don’t know 71
(n=891)
47
(n=561)
Agreement 23
(n=280)
45
(n=541)
Divergence 2
(n=29)
8
(n=98)
Total % 100
(n=1200)
100
(n=1200)
Table 5: Percentage fit between respondent and primary discussant by party identification
Year Respondent’s
PID
Primary
discussant:
ANC
Primary
discussant:
Opposition
Did not
vote
Don’t
know
Total
%
2004
ANC 82 4 1 13 100
Opposition 12 64 0 24 100
2009
ANC 76 6 1 17 100
Opposition 22 41 7 30 100
8 2004: Contingency Coefficient: .743**. In 2009 the statistical fit between the respondents
and primary discussant strengthens: Contingency coefficient: .799**.
14
1.2 Homogenous vs. heterogeneous social contexts During an election campaign, individuals receive repetitive partisan messages
from within their respective social contexts. This section extends the analysis of
partisan congruence with individual discussants to explore the overall extent of
partisan homogeneity in the respondent’s social context. Since there is less
reason to suspect partisan change within the respondent’s most intimate
discussant network dyadic relationships are excluded from the analysis
(spouse/partner and primary discussant). Instead, the respondent is most likely to
experience partisan change within his wider social context. Using discussants
that characterize the wider social setting I calculate a total score for each
respondent that measures the extent of partisan homogeneity/heterogeneity in
his/her social context. The analysis employs this score to produce an aggregate
impression of the type of networks that predominate in South Africa.9
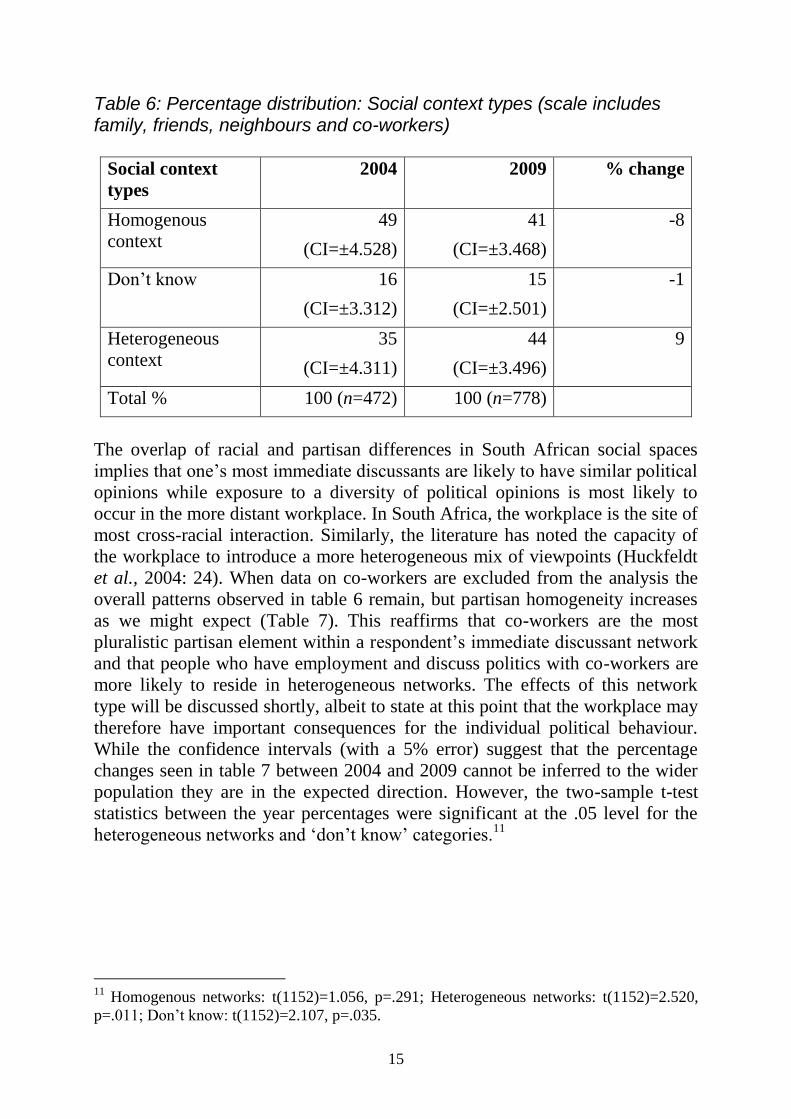
In what types of political information contexts do South African voters reside?
Do most live in mono-partisan worlds? Using the overall distribution scores, the
2004 data shows that just under half of the respondents (49%) were embedded in
more homogenous political environments, where their partisan identity reflected
widely within their immediate social context. A sixth (16%) were uncertain
about the majority of their discussants’ party affiliations, while just over a third
of respondents (35%) lived in more heterogeneous/pluralistic political
environments where almost all their discussants held different partisan
allegiances to themselves (Table 6). The 2009 survey data shows a decline for
those living in highly congruent relationships to 41 percent; a small decline of 1
percent in those uncertain about most of their discussants partisan preferences
(to 15%); and an increase of 9 percent in heterogeneous networks (to 44%). It
appears, therefore, that during the 2009 election campaign less people lived in
homogenous environments, far more had incongruent, pluralistic political
relationships, while slightly less were uncertain about their regular discussant’s
party support. The confidence intervals (with a 5% error) suggest that the eight
percent decrease in homogenous networks between 2004 and 2009 can be
inferred to the wider population. Similarly, the confidence intervals suggest that
the percent increase in heterogeneous networks also hold true for the wider
population. In addition, the two-sample t-test statistics between the percentages
for 2004 and 2009 were significant at the .05 level for both the homogenous
networks and heterogeneous networks categories.10
9 See Appendix for more information about the operationalization and coding of the
dependent variable. 10
Homogenous networks: t(1248)=2.794, p=.005; Heterogenous networks: t(1248)=3.213,
p=.001; Don’t know: t(1248)=0.525, p=.599.
15
Table 6: Percentage distribution: Social context types (scale includes family, friends, neighbours and co-workers)
Social context
types
2004 2009 % change
Homogenous
context
49
(CI=±4.528)
41
(CI=±3.468)
-8
Don’t know 16
(CI=±3.312)
15
(CI=±2.501)
-1
Heterogeneous
context
35
(CI=±4.311)
44
(CI=±3.496)
9
Total % 100 (n=472) 100 (n=778)
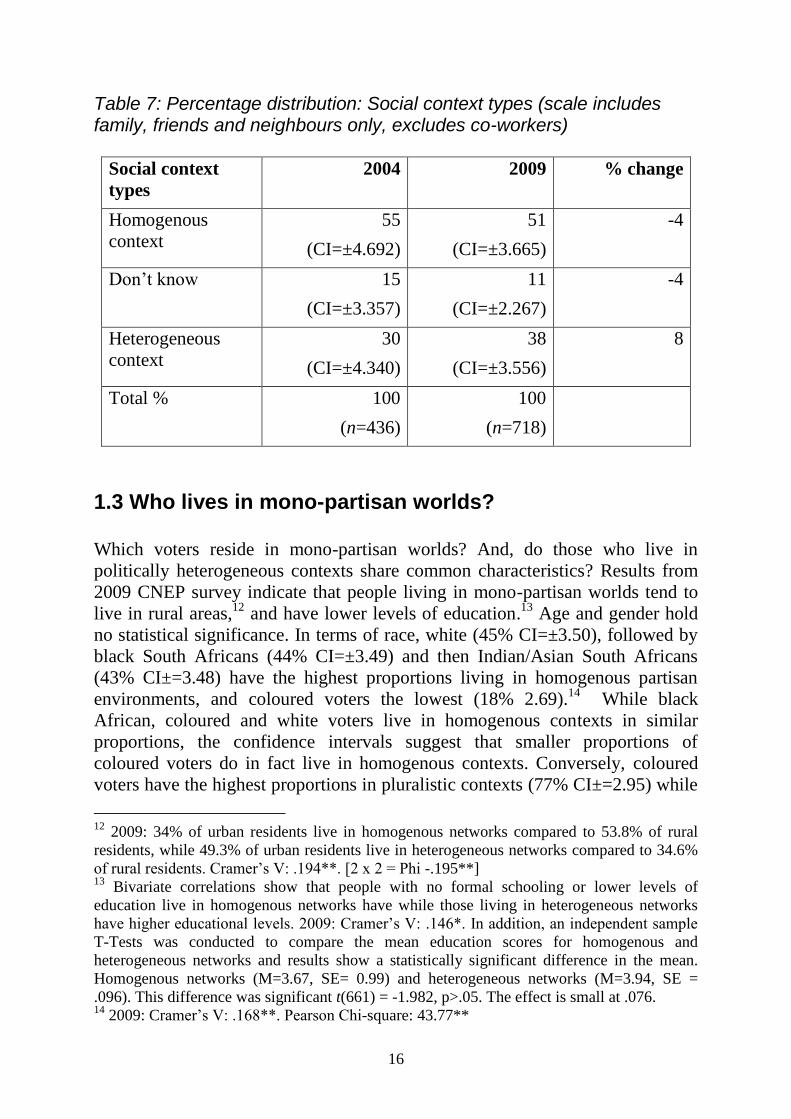
The overlap of racial and partisan differences in South African social spaces
implies that one’s most immediate discussants are likely to have similar political
opinions while exposure to a diversity of political opinions is most likely to
occur in the more distant workplace. In South Africa, the workplace is the site of
most cross-racial interaction. Similarly, the literature has noted the capacity of
the workplace to introduce a more heterogeneous mix of viewpoints (Huckfeldt
et al., 2004: 24). When data on co-workers are excluded from the analysis the
overall patterns observed in table 6 remain, but partisan homogeneity increases
as we might expect (Table 7). This reaffirms that co-workers are the most
pluralistic partisan element within a respondent’s immediate discussant network
and that people who have employment and discuss politics with co-workers are
more likely to reside in heterogeneous networks. The effects of this network
type will be discussed shortly, albeit to state at this point that the workplace may
therefore have important consequences for the individual political behaviour.
While the confidence intervals (with a 5% error) suggest that the percentage
changes seen in table 7 between 2004 and 2009 cannot be inferred to the wider
population they are in the expected direction. However, the two-sample t-test
statistics between the year percentages were significant at the .05 level for the
heterogeneous networks and ‘don’t know’ categories.11
11
Homogenous networks: t(1152)=1.056, p=.291; Heterogeneous networks: t(1152)=2.520,
p=.011; Don’t know: t(1152)=2.107, p=.035.
16
Table 7: Percentage distribution: Social context types (scale includes family, friends and neighbours only, excludes co-workers)
Social context
types
2004 2009 % change
Homogenous
context
55
(CI=±4.692)
51
(CI=±3.665)
-4
Don’t know 15
(CI=±3.357)
11
(CI=±2.267)
-4
Heterogeneous
context
30
(CI=±4.340)
38
(CI=±3.556)
8
Total % 100
(n=436)
100
(n=718)
1.3 Who lives in mono-partisan worlds? Which voters reside in mono-partisan worlds? And, do those who live in
politically heterogeneous contexts share common characteristics? Results from
2009 CNEP survey indicate that people living in mono-partisan worlds tend to
live in rural areas,12
and have lower levels of education.13
Age and gender hold
no statistical significance. In terms of race, white (45% CI=±3.50), followed by
black South Africans (44% CI=±3.49) and then Indian/Asian South Africans
(43% CI±=3.48) have the highest proportions living in homogenous partisan
environments, and coloured voters the lowest (18% 2.69).14
While black
African, coloured and white voters live in homogenous contexts in similar
proportions, the confidence intervals suggest that smaller proportions of
coloured voters do in fact live in homogenous contexts. Conversely, coloured
voters have the highest proportions in pluralistic contexts (77% CI±=2.95) while
12
2009: 34% of urban residents live in homogenous networks compared to 53.8% of rural
residents, while 49.3% of urban residents live in heterogeneous networks compared to 34.6%
of rural residents. Cramer’s V: .194**. [2 x 2 = Phi -.195**] 13
Bivariate correlations show that people with no formal schooling or lower levels of
education live in homogenous networks have while those living in heterogeneous networks
have higher educational levels. 2009: Cramer’s V: .146*. In addition, an independent sample
T-Tests was conducted to compare the mean education scores for homogenous and
heterogeneous networks and results show a statistically significant difference in the mean.
Homogenous networks (M=3.67, SE= 0.99) and heterogeneous networks (M=3.94, SE =
.096). This difference was significant t(661) = -1.982, p>.05. The effect is small at .076. 14
2009: Cramer’s V: .168**. Pearson Chi-square: 43.77**
17
black African (41% CI±=3.46), white (34 CI±=3.34) and Indian/Asian (29
CI±=3.18) populations follow thereafter. Confidence intervals suggest no real
differences between proportions of Indians/Asians and whites, while the
proportions of black African and coloured voters living in heterogeneous
contexts are significantly different to each other and to the other racial groups.
This finding corresponds with previous research which argues that the ‘coloured
vote’ is not homogenous and is divided among a number of political parties
since 1994 (Eldridge and Seekings, 1996; Faull, 2004; Seekings, 2006). Finally,
Indian/Asian (29%) and white voters (21%) have the highest proportions of
voters who do not know the political preferences of members within their social
contexts while there are far lower levels of political ambivalence or uncertainty
among black (15%) and coloured voters (5%).
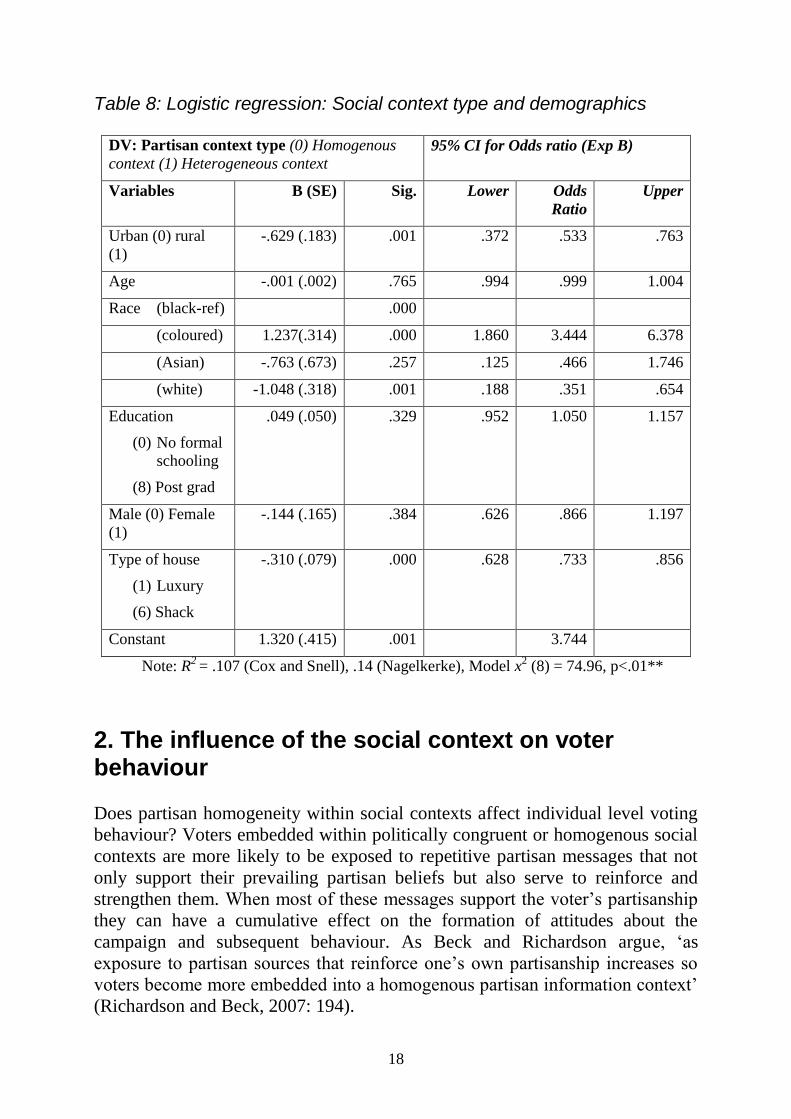
The results of a multivariate logistic regression analysis using the 2009 data
(Table 8) confirm that one’s spatial location matters independently of other
factors in that rural people are more likely to live in homogenous political spaces
while urban residents live in heterogeneous contexts. The results for race once
again confirm that coloured voters have a higher chance of living in
heterogeneous contexts compared to black Africans, whites and Indians. A new
variable, which stands as a rudimentary proxy for poverty status, taps ‘type of
house’, and shows that poorer people have higher odds of living in highly
homogenous political environments. Education loses statistical significance in
the multivariate analysis, and, once again, gender and age remain insignificant.
18
Table 8: Logistic regression: Social context type and demographics
DV: Partisan context type (0) Homogenous
context (1) Heterogeneous context 95% CI for Odds ratio (Exp B)
Variables B (SE) Sig. Lower Odds
Ratio
Upper
Urban (0) rural
(1)
-.629 (.183) .001 .372 .533 .763
Age -.001 (.002) .765 .994 .999 1.004
Race (black-ref) .000
(coloured) 1.237(.314) .000 1.860 3.444 6.378
(Asian) -.763 (.673) .257 .125 .466 1.746
(white) -1.048 (.318) .001 .188 .351 .654
Education
(0) No formal
schooling
(8) Post grad
.049 (.050) .329 .952 1.050 1.157
Male (0) Female
(1)
-.144 (.165) .384 .626 .866 1.197
Type of house
(1) Luxury
(6) Shack
-.310 (.079) .000 .628 .733 .856
Constant 1.320 (.415) .001 3.744
Note: R2
= .107 (Cox and Snell), .14 (Nagelkerke), Model x2 (8) = 74.96, p<.01**
2. The influence of the social context on voter behaviour
Does partisan homogeneity within social contexts affect individual level voting
behaviour? Voters embedded within politically congruent or homogenous social
contexts are more likely to be exposed to repetitive partisan messages that not
only support their prevailing partisan beliefs but also serve to reinforce and
strengthen them. When most of these messages support the voter’s partisanship
they can have a cumulative effect on the formation of attitudes about the
campaign and subsequent behaviour. As Beck and Richardson argue, ‘as
exposure to partisan sources that reinforce one’s own partisanship increases so
voters become more embedded into a homogenous partisan information context’
(Richardson and Beck, 2007: 194).
19
I explore the implications of being embedded within the two context types for
individual level voting behavior and expect to find that living in these two very
different political information networks have different effects on voter behavior.
Individuals in homogenous partisan contexts should show greater consistency
and strength in their voting behavior and attitudes, while those living in
heterogeneous contexts are expected to be less so. The analysis explores
differences in the effects of the two contexts on the following aspects of voter
behaviour:
1. When a voter decides to vote;
2. If a voter is a partisan or non-partisan;
3. Strength of partisan attitudes;
4. If a voter would consider voting for another party;
5. Defections between partisanship and vote choice in the 2004, and 2009
elections; and
6. Changes in vote choice across consecutive elections (party loyalists versus
defectors).
2.1 When did you decide to vote? When asked ‘when did you decide to vote for that party?’ the bivariate
correlations in Table 9 show an association between early and decisive voting
decisions and homogenous partisan contexts, and late decisions and
heterogeneous partisan contexts in both elections (2004: Spearman’s rho .207**;
2009: .253**).15
2.2 Partisan identification Perhaps the most significant political attitude for voting behavior is partisan
identification (Campbell et al., 1960; Dalton, 2002: 174). When asked if the
respondent identifies with any particular political party the bivariate correlations
in Table 9 show an association between being a partisan and living within a
homogenous partisan context and being a non-partisan and living within a
heterogeneous context (2004: Spearman’s rho .248**; 2009: .120**).
15
Spearman’s rho is used repeatedly as the non-parametric equivalent of Pearson’s R in this
paper.
20
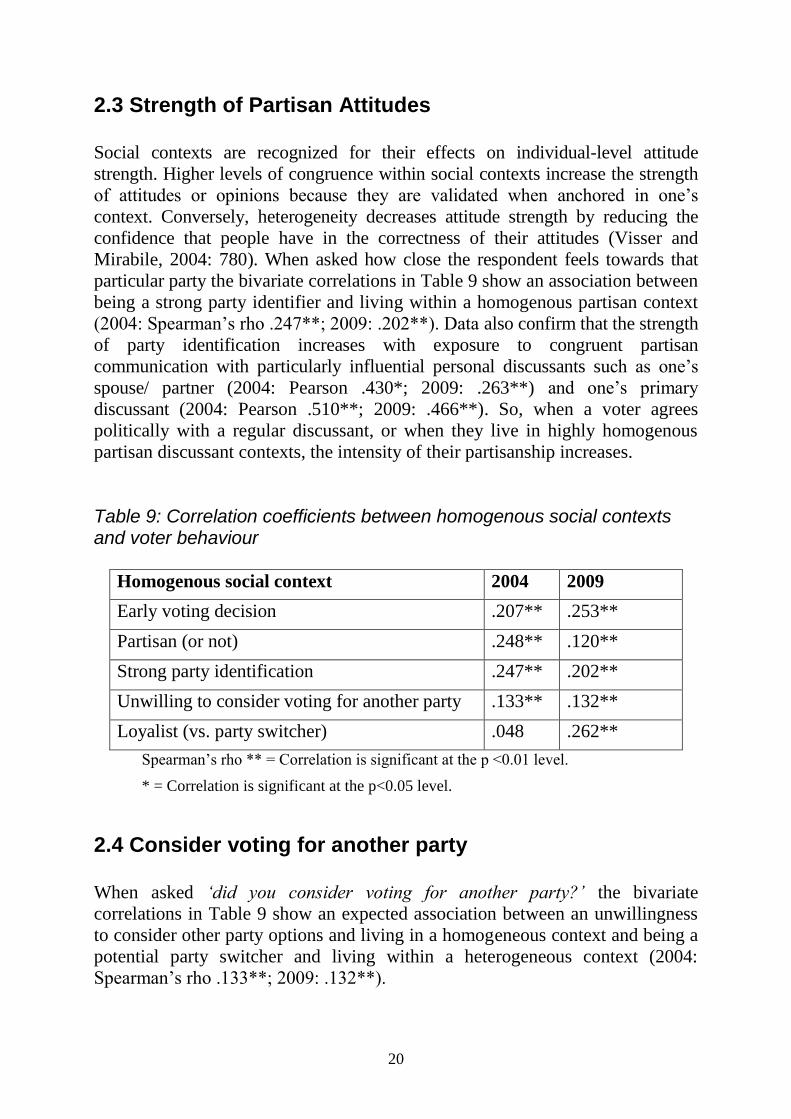
2.3 Strength of Partisan Attitudes Social contexts are recognized for their effects on individual-level attitude
strength. Higher levels of congruence within social contexts increase the strength
of attitudes or opinions because they are validated when anchored in one’s
context. Conversely, heterogeneity decreases attitude strength by reducing the
confidence that people have in the correctness of their attitudes (Visser and
Mirabile, 2004: 780). When asked how close the respondent feels towards that
particular party the bivariate correlations in Table 9 show an association between
being a strong party identifier and living within a homogenous partisan context
(2004: Spearman’s rho .247**; 2009: .202**). Data also confirm that the strength
of party identification increases with exposure to congruent partisan
communication with particularly influential personal discussants such as one’s
spouse/ partner (2004: Pearson .430*; 2009: .263**) and one’s primary
discussant (2004: Pearson .510**; 2009: .466**). So, when a voter agrees
politically with a regular discussant, or when they live in highly homogenous
partisan discussant contexts, the intensity of their partisanship increases.
Table 9: Correlation coefficients between homogenous social contexts and voter behaviour
Homogenous social context 2004 2009
Early voting decision .207** .253**
Partisan (or not) .248** .120**
Strong party identification .247** .202**
Unwilling to consider voting for another party .133** .132**
Loyalist (vs. party switcher) .048 .262**
Spearman’s rho ** = Correlation is significant at the p <0.01 level.
* = Correlation is significant at the p<0.05 level.
2.4 Consider voting for another party When asked ‘did you consider voting for another party?’ the bivariate
correlations in Table 9 show an expected association between an unwillingness
to consider other party options and living in a homogeneous context and being a
potential party switcher and living within a heterogeneous context (2004:
Spearman’s rho .133**; 2009: .132**).
21
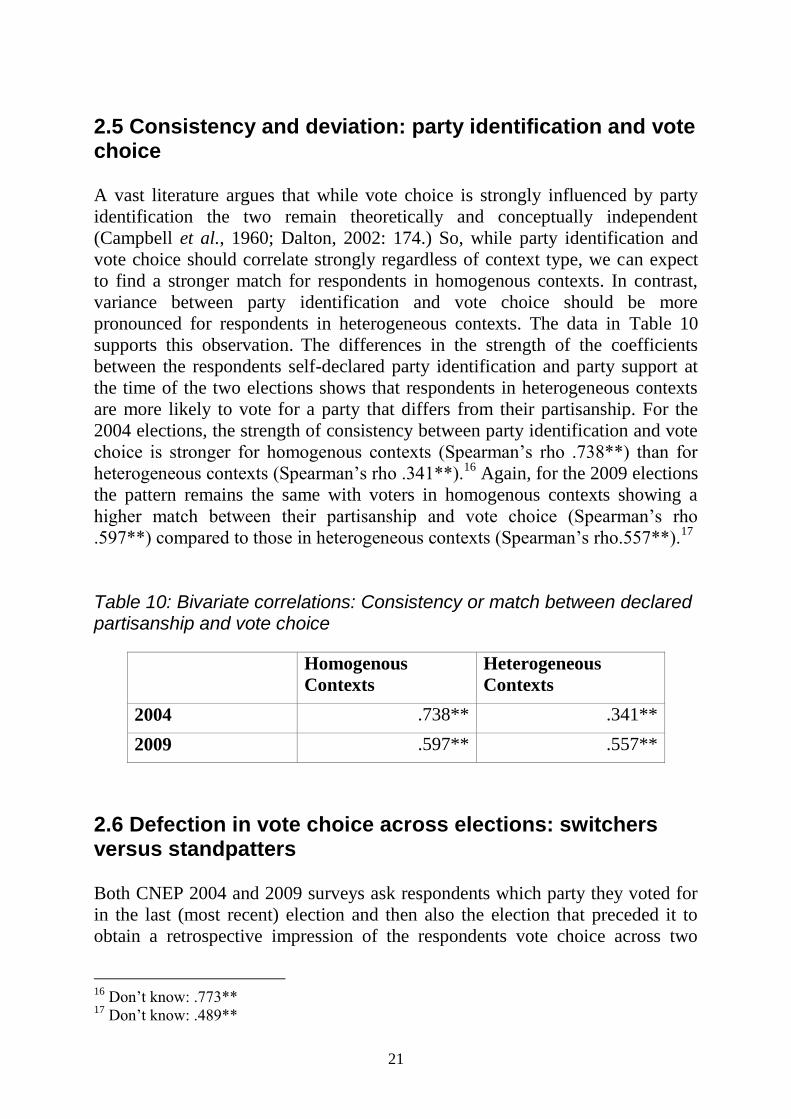
2.5 Consistency and deviation: party identification and vote choice A vast literature argues that while vote choice is strongly influenced by party
identification the two remain theoretically and conceptually independent
(Campbell et al., 1960; Dalton, 2002: 174.) So, while party identification and
vote choice should correlate strongly regardless of context type, we can expect
to find a stronger match for respondents in homogenous contexts. In contrast,
variance between party identification and vote choice should be more
pronounced for respondents in heterogeneous contexts. The data in Table 10
supports this observation. The differences in the strength of the coefficients
between the respondents self-declared party identification and party support at
the time of the two elections shows that respondents in heterogeneous contexts
are more likely to vote for a party that differs from their partisanship. For the
2004 elections, the strength of consistency between party identification and vote
choice is stronger for homogenous contexts (Spearman’s rho .738**) than for
heterogeneous contexts (Spearman’s rho .341**).16
Again, for the 2009 elections
the pattern remains the same with voters in homogenous contexts showing a
higher match between their partisanship and vote choice (Spearman’s rho
.597**) compared to those in heterogeneous contexts (Spearman’s rho.557**).17
Table 10: Bivariate correlations: Consistency or match between declared partisanship and vote choice
Homogenous
Contexts
Heterogeneous
Contexts
2004 .738** .341**
2009 .597** .557**
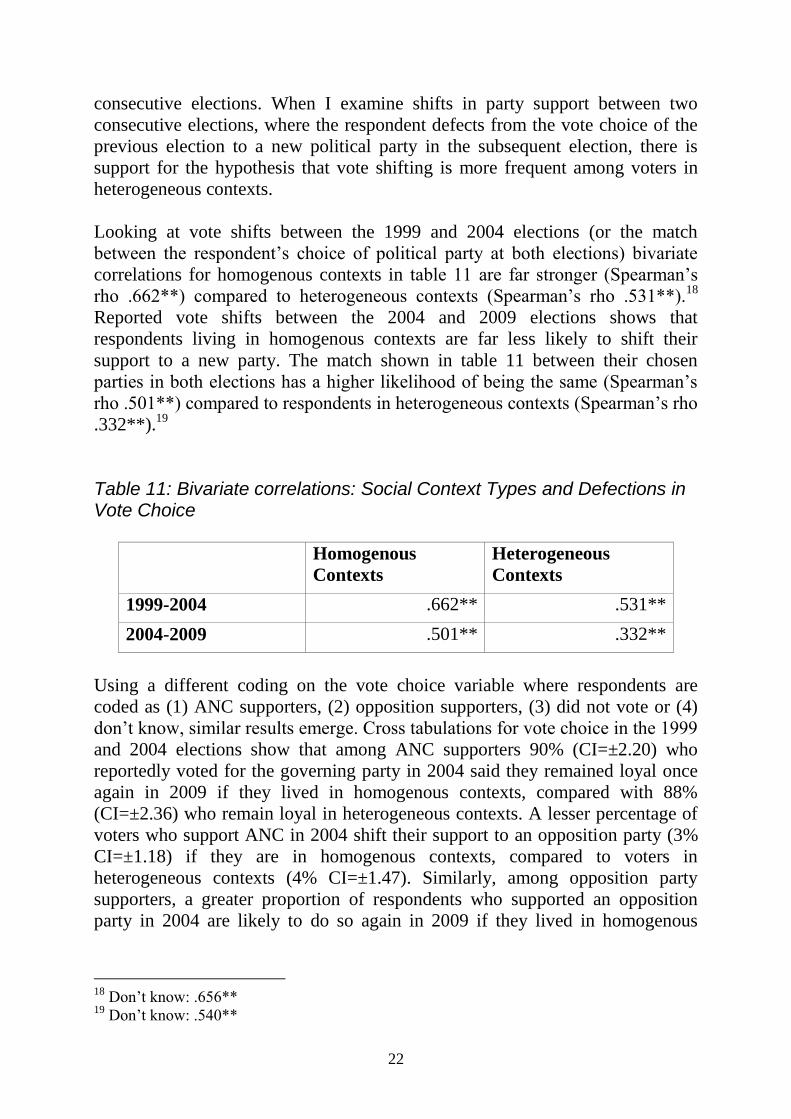
2.6 Defection in vote choice across elections: switchers versus standpatters Both CNEP 2004 and 2009 surveys ask respondents which party they voted for
in the last (most recent) election and then also the election that preceded it to
obtain a retrospective impression of the respondents vote choice across two
16
Don’t know: .773** 17
Don’t know: .489**
22
consecutive elections. When I examine shifts in party support between two
consecutive elections, where the respondent defects from the vote choice of the
previous election to a new political party in the subsequent election, there is
support for the hypothesis that vote shifting is more frequent among voters in
heterogeneous contexts.
Looking at vote shifts between the 1999 and 2004 elections (or the match
between the respondent’s choice of political party at both elections) bivariate
correlations for homogenous contexts in table 11 are far stronger (Spearman’s
rho .662**) compared to heterogeneous contexts (Spearman’s rho .531**).18
Reported vote shifts between the 2004 and 2009 elections shows that
respondents living in homogenous contexts are far less likely to shift their
support to a new party. The match shown in table 11 between their chosen
parties in both elections has a higher likelihood of being the same (Spearman’s
rho .501**) compared to respondents in heterogeneous contexts (Spearman’s rho
.332**).19
Table 11: Bivariate correlations: Social Context Types and Defections in Vote Choice
Homogenous
Contexts
Heterogeneous
Contexts
1999-2004 .662** .531**
2004-2009 .501** .332**
Using a different coding on the vote choice variable where respondents are
coded as (1) ANC supporters, (2) opposition supporters, (3) did not vote or (4)
don’t know, similar results emerge. Cross tabulations for vote choice in the 1999
and 2004 elections show that among ANC supporters 90% (CI=±2.20) who
reportedly voted for the governing party in 2004 said they remained loyal once
again in 2009 if they lived in homogenous contexts, compared with 88%
(CI=±2.36) who remain loyal in heterogeneous contexts. A lesser percentage of
voters who support ANC in 2004 shift their support to an opposition party (3%
CI=±1.18) if they are in homogenous contexts, compared to voters in
heterogeneous contexts (4% CI=±1.47). Similarly, among opposition party
supporters, a greater proportion of respondents who supported an opposition
party in 2004 are likely to do so again in 2009 if they lived in homogenous
18
Don’t know: .656** 19
Don’t know: .540**
23
contexts (79% CI=±2.94 vs. 70% CI=±3.34).20
These differences are less
compelling among ANC voters in 2004 than among opposition voters whose
percentages, according to the confidence intervals, are significantly different.
Results for the second election are more pronounced and most likely reflect the
more competitive nature of the 2009 election and the increase in the diversity of
choice for many more voters. Cross tabulations for vote choice in the 2004 and
2009 elections show that among ANC supporters 93% (CI=±2.42) who voted for
the governing party in 2004 remain loyal once again in 2009 if they lived in
homogenous contexts, compared with 77% (CI=±4.05) who remain loyal in
heterogeneous contexts. A far lesser percentage of voters who support ANC in
2004 shift their support to an opposition party (3% CI=±1.49) if they are in
homogenous contexts, compared to voters in heterogeneous contexts (20%
CI=±3.80). 21
2.7 Loyalists vs. Party Switchers
Finally, I test my hypothesis in a slightly different manner by dividing voters
into ‘loyalists’ (voters who support the same party across two consecutive
elections) and ‘switchers’ (voters who shift their support to another party).
Bivariate correlations with social context types show again (see Table 9) that in
2009 ‘loyalists’ tend to live in homogenous partisan contexts while ‘party
switchers’ associate with heterogeneous partisan environments (Phi .244**;
Spearman’s rho .262**). The findings are not significant for the 2004 election
(Phi .062; Spearman’s rho .048).
2.8 Multivariate analysis: do social contexts make an independent contribution?
A number of theoretical explanations for voting behaviour in South Africa
appear both reasonable and possible. Arguments suggesting that sociological
reasons motivate South African voters are convincing. After all, domestic
politics has pivoted around racial dynamics for many years. The economic and
political performances of government are also important factors: good economic
performance will determine job-creation in the medium term while good
governance, proper socio-economic delivery and institutional and leadership
performances are key measures of any democratic regime. Partisanship remains
a strong indicator of support and the cognitive abilities and voters mediate the
20
Cramer’s V: 568** 21
Cramer’s V: .507**
24
way people perceive and process political information. To estimate the unique,
independent contribution of social contexts it is imperative to ensure that the
effects of one’s context type stand up independently against other important
predictors of voting behavior.
Using the 2009 data, I perform four separate regressions to explore the various
attitudinal and behavioural elements of voting that are explored in the bivariate
analyses above. Predictors include widely accepted theoretical indicators of
voting such as party identification, level of interest in the election campaign, an
evaluation of government performance, and several pertinent demographic
characteristics (age, gender, race, education and urban-rural residence). These
variables are entered together with a set of dummy variables that tap the two
context types. Each multivariate analysis is run twice – in the first regression all
the above-listed variables are entered into the regression. In the second instance,
the insignificant predictors are removed from the model and only the statistically
significant results are included in the analysis. These secondary results are
presented in Tables 12 to 15. The results of the four regressions conclusively
demonstrate that the effect of one’s context type continues to make an
independent and statistically significant contribution towards predicting various
aspects of voting behavior (and in the hypothesized direction) even when other
salient factors are considered. Moreover, social context types often make
relatively larger impacts than these other important predictors.
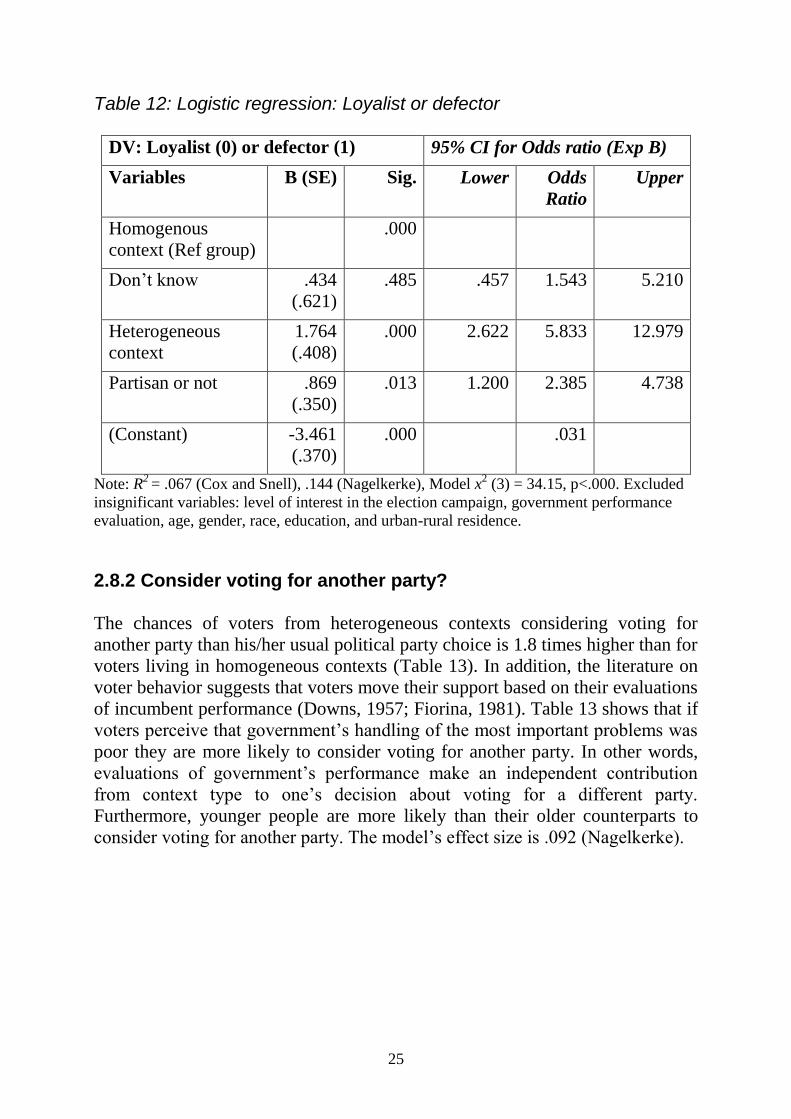
2.8.1 Loyalist or defector The odds of a voter in a heterogeneous context being a ‘defector’ or ‘swing’
voter are 5.8 times higher than for a voter living in a homogenous context (Table
12). The only other statistically significant predictor is whether one is a party
identifier or not. As we might expect, the chances of a non-partisan switching
their vote is 2.3 times higher than a partisan supporter. The model’s effect size is
.144 (Nagelkerke).
25
Table 12: Logistic regression: Loyalist or defector
DV: Loyalist (0) or defector (1) 95% CI for Odds ratio (Exp B)
Variables B (SE) Sig. Lower Odds
Ratio
Upper
Homogenous
context (Ref group)
.000
Don’t know .434
(.621)
.485 .457 1.543 5.210
Heterogeneous
context
1.764
(.408)
.000 2.622 5.833 12.979
Partisan or not .869
(.350)
.013 1.200 2.385 4.738
(Constant) -3.461
(.370)
.000 .031
Note: R2
= .067 (Cox and Snell), .144 (Nagelkerke), Model x2 (3) = 34.15, p<.000. Excluded
insignificant variables: level of interest in the election campaign, government performance
evaluation, age, gender, race, education, and urban-rural residence.
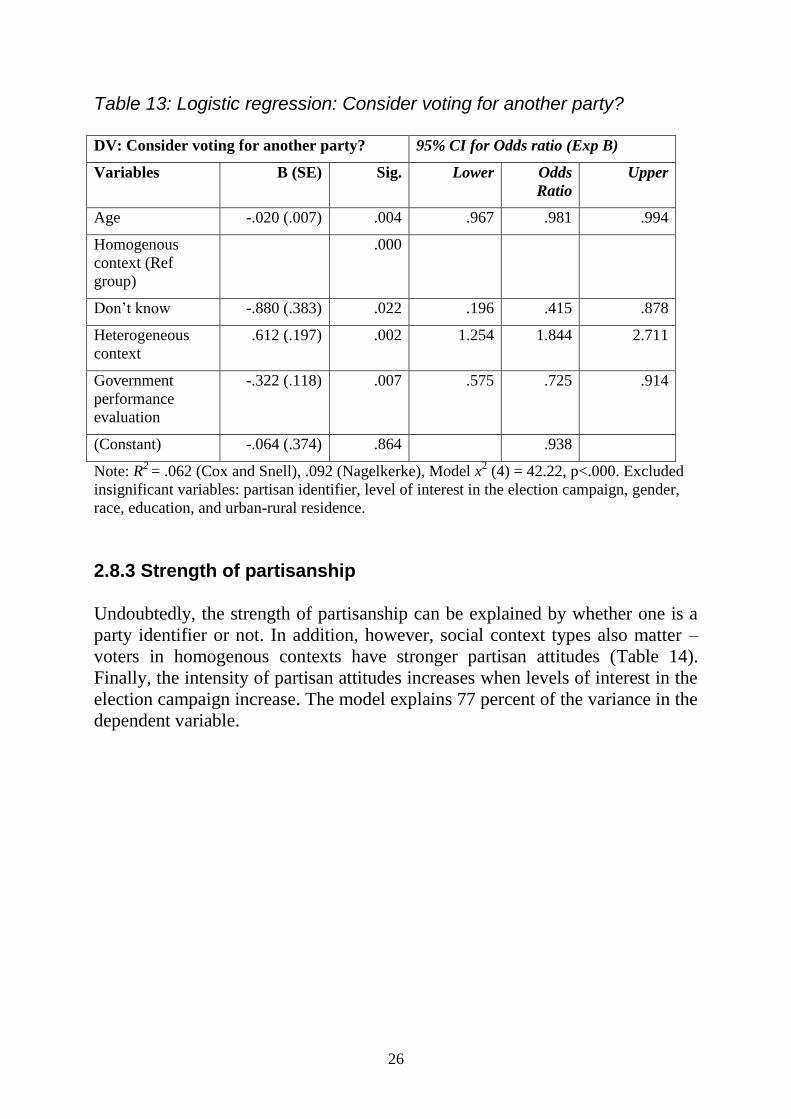
2.8.2 Consider voting for another party? The chances of voters from heterogeneous contexts considering voting for
another party than his/her usual political party choice is 1.8 times higher than for
voters living in homogeneous contexts (Table 13). In addition, the literature on
voter behavior suggests that voters move their support based on their evaluations
of incumbent performance (Downs, 1957; Fiorina, 1981). Table 13 shows that if
voters perceive that government’s handling of the most important problems was
poor they are more likely to consider voting for another party. In other words,
evaluations of government’s performance make an independent contribution
from context type to one’s decision about voting for a different party.
Furthermore, younger people are more likely than their older counterparts to
consider voting for another party. The model’s effect size is .092 (Nagelkerke).
26
Table 13: Logistic regression: Consider voting for another party? DV: Consider voting for another party? 95% CI for Odds ratio (Exp B)
Variables B (SE) Sig. Lower Odds
Ratio
Upper
Age -.020 (.007) .004 .967 .981 .994
Homogenous
context (Ref
group)
.000
Don’t know -.880 (.383) .022 .196 .415 .878
Heterogeneous
context
.612 (.197) .002 1.254 1.844 2.711
Government
performance
evaluation
-.322 (.118) .007 .575 .725 .914
(Constant) -.064 (.374) .864 .938
Note: R2
= .062 (Cox and Snell), .092 (Nagelkerke), Model x2 (4) = 42.22, p<.000. Excluded
insignificant variables: partisan identifier, level of interest in the election campaign, gender,
race, education, and urban-rural residence.
2.8.3 Strength of partisanship Undoubtedly, the strength of partisanship can be explained by whether one is a
party identifier or not. In addition, however, social context types also matter –
voters in homogenous contexts have stronger partisan attitudes (Table 14).
Finally, the intensity of partisan attitudes increases when levels of interest in the
election campaign increase. The model explains 77 percent of the variance in the
dependent variable.
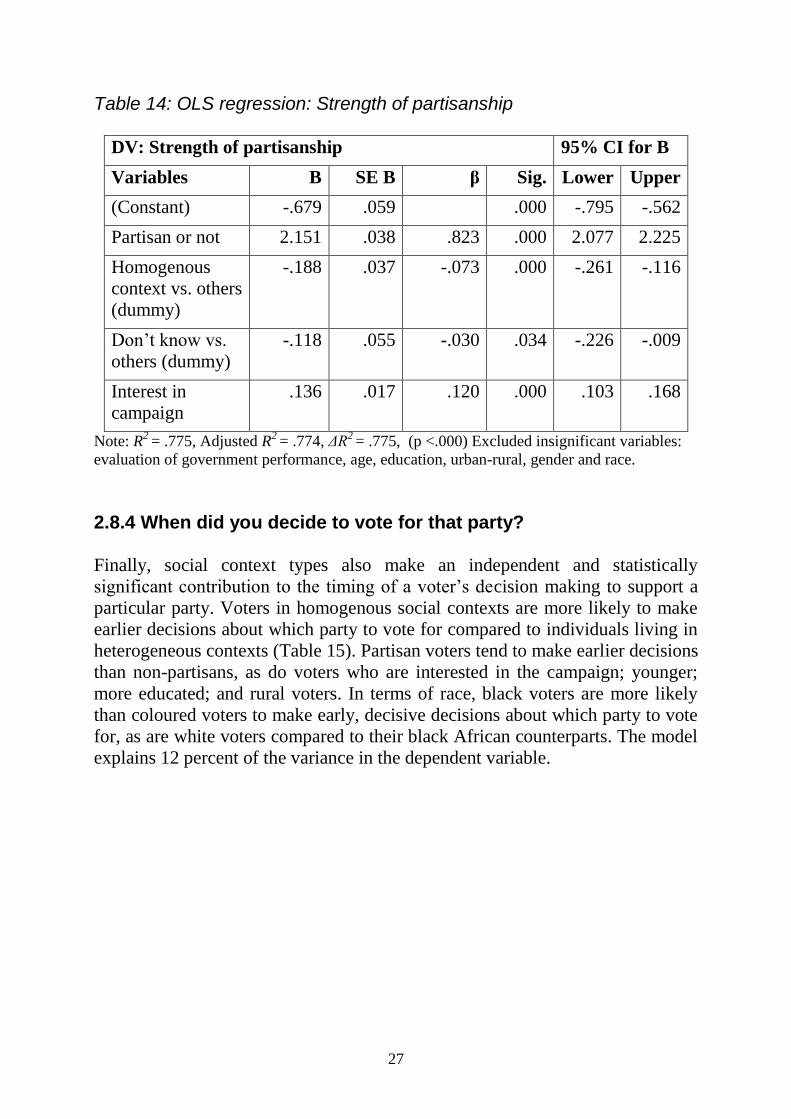
27
Table 14: OLS regression: Strength of partisanship
DV: Strength of partisanship 95% CI for B
Variables B SE B β Sig. Lower Upper
(Constant) -.679 .059 .000 -.795 -.562
Partisan or not 2.151 .038 .823 .000 2.077 2.225
Homogenous
context vs. others
(dummy)
-.188 .037 -.073 .000 -.261 -.116
Don’t know vs.
others (dummy)
-.118 .055 -.030 .034 -.226 -.009
Interest in
campaign
.136 .017 .120 .000 .103 .168
Note: R2
= .775, Adjusted R2
= .774, ΔR2 = .775, (p <.000) Excluded insignificant variables:
evaluation of government performance, age, education, urban-rural, gender and race.
2.8.4 When did you decide to vote for that party?
Finally, social context types also make an independent and statistically
significant contribution to the timing of a voter’s decision making to support a
particular party. Voters in homogenous social contexts are more likely to make
earlier decisions about which party to vote for compared to individuals living in
heterogeneous contexts (Table 15). Partisan voters tend to make earlier decisions
than non-partisans, as do voters who are interested in the campaign; younger;
more educated; and rural voters. In terms of race, black voters are more likely
than coloured voters to make early, decisive decisions about which party to vote
for, as are white voters compared to their black African counterparts. The model
explains 12 percent of the variance in the dependent variable.
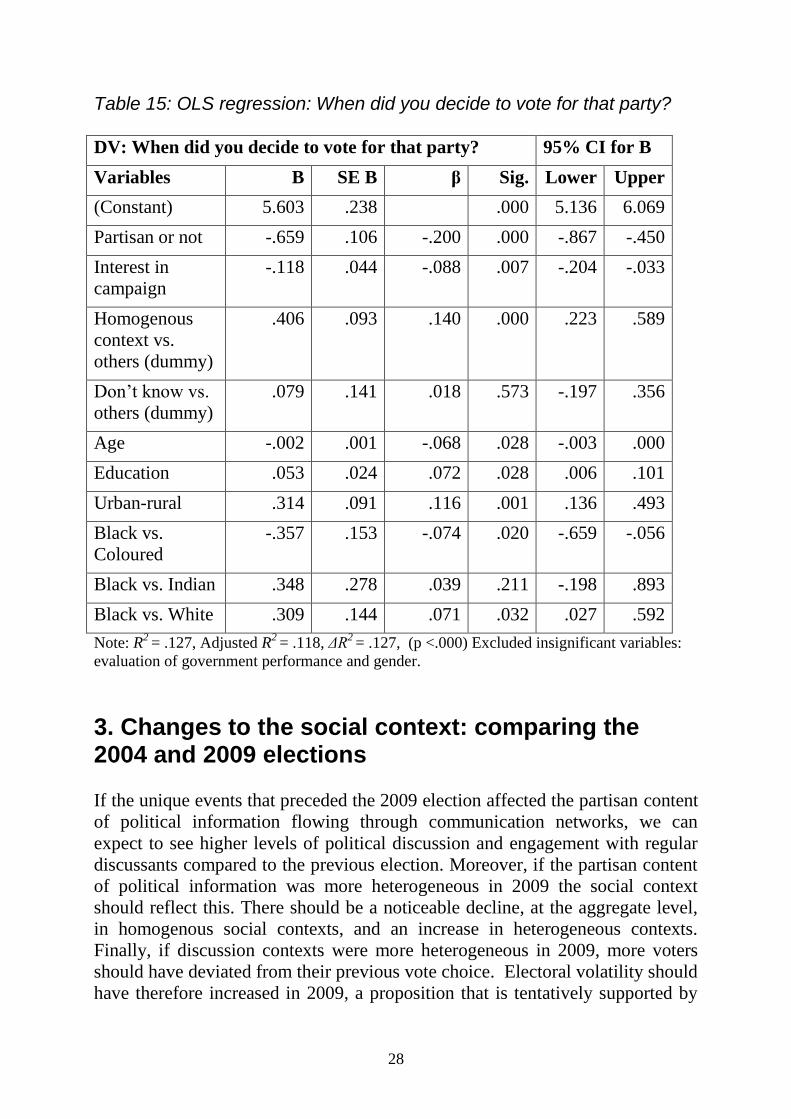
28
Table 15: OLS regression: When did you decide to vote for that party?
DV: When did you decide to vote for that party? 95% CI for B
Variables B SE B β Sig. Lower Upper
(Constant) 5.603 .238 .000 5.136 6.069
Partisan or not -.659 .106 -.200 .000 -.867 -.450
Interest in
campaign
-.118 .044 -.088 .007 -.204 -.033
Homogenous
context vs.
others (dummy)
.406 .093 .140 .000 .223 .589
Don’t know vs.
others (dummy)
.079 .141 .018 .573 -.197 .356
Age -.002 .001 -.068 .028 -.003 .000
Education .053 .024 .072 .028 .006 .101
Urban-rural .314 .091 .116 .001 .136 .493
Black vs.
Coloured
-.357 .153 -.074 .020 -.659 -.056
Black vs. Indian .348 .278 .039 .211 -.198 .893
Black vs. White .309 .144 .071 .032 .027 .592
Note: R2
= .127, Adjusted R2
= .118, ΔR2 = .127, (p <.000) Excluded insignificant variables:
evaluation of government performance and gender.
3. Changes to the social context: comparing the 2004 and 2009 elections
If the unique events that preceded the 2009 election affected the partisan content
of political information flowing through communication networks, we can
expect to see higher levels of political discussion and engagement with regular
discussants compared to the previous election. Moreover, if the partisan content
of political information was more heterogeneous in 2009 the social context
should reflect this. There should be a noticeable decline, at the aggregate level,
in homogenous social contexts, and an increase in heterogeneous contexts.
Finally, if discussion contexts were more heterogeneous in 2009, more voters
should have deviated from their previous vote choice. Electoral volatility should
have therefore increased in 2009, a proposition that is tentatively supported by
29
the shifts in party support seen in that election, particularly the decline in vote
share for the governing party, and growth in support for opposition parties. This
section explores differences between the 2004 and 2009 elections in a)
frequency of political discussion with regular discussants; and b) the extent of
heterogeneity within social contexts.
3.1 Frequency of political discussion: 2004 versus 2009 elections
The most frequent discussants with which to ‘talk politics’ are one’s ‘primary
discussant’, then one’s spouse/partner, followed by family, friends, neighbours
and lastly, co-workers. The low levels of discussion with co-workers may be
partly due to high unemployment levels. For example, in 2004, 31.5 percent of
respondents reported being without a job and were not actively seeking
employment, while 37.9 were without employment and actively seeking
employment (a total of 69.4 percent). And as expected of both groups 88.7 %
and 87.2% respectively reported ‘never’ engaged in discussion with co-workers.
Among employed respondents who report ‘never being engaged in discussion
with co-workers’ was only between 62 and 55 percent.
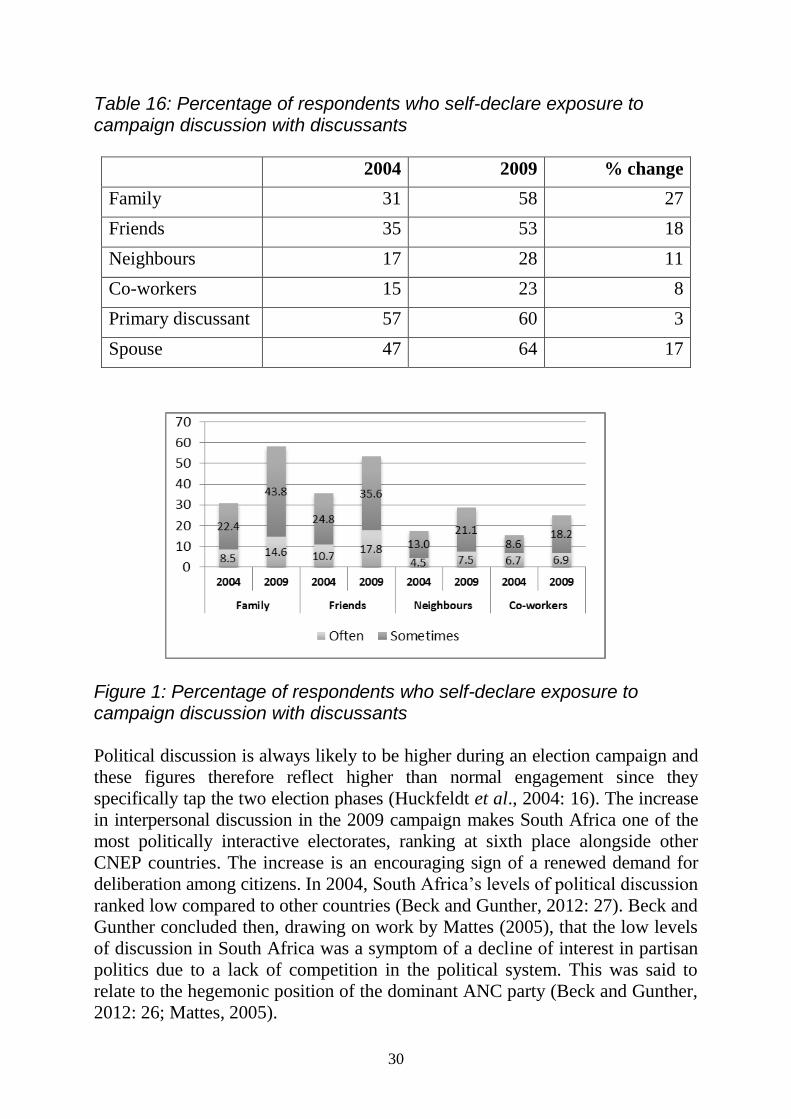
Nevertheless, the overall distribution of campaign closely reflects global patterns
(Beck and Gunther, 2012: 27). A noticeable feature in table 16 is the increase in
political discussion across the two elections. Those who frequently discussed
politics with family (often or sometimes) increased from 31 percent in 2004 to
58 percent in 2009. Similarly, frequent discussion with friends rose from 35
percent to 53 percent, for neighbours from 17 to 28 percent, and for co-workers
from 15 to 23 percent. There is also a slight increase of 3 percent in political
discussion with respondent’s primary discussant from 57 to 60. Again when
asked how often the respondent discussed the election campaigns with their
spouse or partner 47 percent reported they did frequently, increasing to 64 percent
in 2009 (a 17 percent increase).
30
Table 16: Percentage of respondents who self-declare exposure to campaign discussion with discussants
2004 2009 % change
Family 31 58 27
Friends 35 53 18
Neighbours 17 28 11
Co-workers 15 23 8
Primary discussant 57 60 3
Spouse 47 64 17
Figure 1: Percentage of respondents who self-declare exposure to campaign discussion with discussants Political discussion is always likely to be higher during an election campaign and
these figures therefore reflect higher than normal engagement since they
specifically tap the two election phases (Huckfeldt et al., 2004: 16). The increase
in interpersonal discussion in the 2009 campaign makes South Africa one of the
most politically interactive electorates, ranking at sixth place alongside other
CNEP countries. The increase is an encouraging sign of a renewed demand for
deliberation among citizens. In 2004, South Africa’s levels of political discussion
ranked low compared to other countries (Beck and Gunther, 2012: 27). Beck and
Gunther concluded then, drawing on work by Mattes (2005), that the low levels
of discussion in South Africa was a symptom of a decline of interest in partisan
politics due to a lack of competition in the political system. This was said to
relate to the hegemonic position of the dominant ANC party (Beck and Gunther,
2012: 26; Mattes, 2005).
31
During the 2009 campaign, however, a majority or more of respondents report
discussing politics with their first discussant, spouse, family and friends. Few
countries match this level of discussion (Beck and Gunther, 2012: 26). For
instance, political discussions with one’s spouse/partner at 64 percent is a
comparatively higher score than the United Kingdom (42 percent), Germany (43
percent), Hong Kong (26 percent), Japan (32 percent), Chile (47 percent), the
United States (61 percent), and Spain at 62 percent, while falling below Italy (77
percent) and Greece (65 percent) (Richardson and Beck, 2007: 186). But why the
overall increases in frequency of discussion in the 2009 election? Drawing on
Mattes’ earlier point, perhaps changes in perceptions about the hegemonic
position of the ANC and the increasing potential for electoral competition in the
2009 election had bearing on voters’ levels of political engagement during the
campaign. The change in ANC leadership and the ushering in of a controversial
president, as well as the associated split in the governing party and the
emergence of COPE increased expectations that party fortunes could change
and, in turn, may have heightened engagement among voters. Free television
space for political party advertisements and media coverage of the fiercely
fought campaigns, especially between the ANC, COPE and the DA, should have
provided further stimulus for discussion. By contrast, in the 2004 election the
parties offered the voters little that was novel.
The 2009 CNEP election campaign data also shows substantial increases in
exposure to political news from newspapers and television compared to the
earlier 2004 campaign. While 22 percent of respondents received political news
via newspapers at least once or twice a week in the 2004 election this increased
to 31 percent in 2009. And while 41 percent received political news from TV at
least once or twice a week in the 2004 election this increased to 54 percent in
2009. Overall, the increases in exposure to political news and political
discussion suggest that voters in 2009 had access to greater amounts of political
information and were more engaged compared to the previous election.
3.2 Context types: 2004 vs. 2009 elections
Finally, the data supports the proposition that there was an erosion of
‘hermetically sealed’ homogenous partisan social contexts during the 2009
election, and a significant increase in heterogeneous contexts. Data in Table 6
shows an overall decline of 8 percent in homogenous contexts (from 49% to
41%); a slight decrease of 1% in those uncertain about their discussants partisan
preferences (from 16% to 15%); and an increase of 9% in heterogeneous
contexts (from 35% to 44%) and these changes can be inferred to the wider
population.
32
Discussion In South Africa, many voters reside within highly homogenous partisan
discussant contexts, where their partisan identities are congruent with almost all
their personal discussants. Data from the 2004 election found this phenomenon
to be widespread, affecting almost half of the electorate (49%) decreasing to 41
percent in 2009. Yet, many more voters are not embedded in homogenous
political information contexts. Some exist in social contexts where uncertainty
or ambivalence prevails. The rest are subject to cross-pressures as they receive a
mix of contradictory partisan signals from their politically heterogeneous
contexts. The surprisingly low within-group homogeneity regarding political
discussion is important for democratic politics because, as previously noted,
when people are exposed to political deliberation, and even political
disagreement, the quality of opinion formation and, ultimately, the chances for
electoral change increase (Huckfeldt et al., 2004: 2).
The data also shows that the level of partisan homogeneity within social contexts
can influence individual-level electoral behavior, even after other salient
influences are considered. Voters that reside within highly homogenous
discussion contexts tend to be far more consistent in their behaviour, deviating
less frequently from their party identification, or their previous vote choice.
They are also stronger party identifiers making them core supporters for any
political party. Their attitudes towards parties and politics will likely continue to
be shaped by those closest to them as they experience ongoing reinforcement of
their existing partisan attachments. They are likely to continue to conform to the
dominant partisan norm, and are the most unlikely voters to move their support
to another party.
Their behavior at elections also provides a plausible explanation for the
appearance of strong cleavage voting in South Africa, even when people are not
explicitly expressing their racial identities. Outcomes are simply a reflection of
racially defined information contexts, which remain politically homogenous
because of ongoing reinforcement and behavioural conformities. In other words,
the appearance of racial voting simply reflects the compounding effects of the
high levels of partisan bias of the information context within which the voter
resides. As Beck et al. (2002) conclude, ‘…voters do not operate in the social
vacuum that much of the contemporary literature seems to assume. Rather,
voters’ enduring personal characteristics interact with the messages they are
receiving from the established social context in which they operate’ (Beck et al.,
2002: 69).
In contrast, voters with politically diverse or heterogeneous discussion contexts
are more likely to defect from their party identification when they vote; are more
33
likely to defect from their previous vote choice in subsequent elections, have
weaker partisan ties and are more likely to consider alternative political homes.
This finding has particular importance for electoral competition in South
Africa’s one-party dominant democracy. For a substantial proportion of the
electorate, while political discussion and opinion formation is shaped by partisan
attitudes and everyday experiences, it is also profoundly influenced by the extent
of diversity of political communication with those around them. And the mere
presence of deliberation, debate and occasional disagreement within these
contexts should enrich the quality of opinion formation at elections. Ultimately,
these voters are more receptive to short-term political developments, are more
willing to adjust their political attitudes and therefore inject much-needed degree
of electoral uncertainty when they do vote.
Finally, the decrease of partisan homogeneity in discussant contexts across the
two elections suggests that momentous socio-political developments – if
sufficiently powerful – can change the nature of social contexts in a society. In
the case of South Africa, the events leading up to the 2009 election that brought
about the ANC’s leadership change and the rise of COPE challenged voter
loyalties especially among black South Africans. These events diversified the
partisan content of political information flowing to voters, affecting the way they
learnt about and responded to political parties and candidates. Survey data
supports the notion of an exceptional campaign in 2009 – illustrated in the
increases in exposure to political news, increases in political discussion, and
importantly, the overall decline in politically congruent social contexts. This
potential for increased competition among the major political parties, plus free
television and radio space for political party advertisements, was suitably
inspiring for voters to intensify their political discussions and exposure to media
coverage. With many more voters exposed to more partisan diversity, their
discussant contexts became less politically congruent, accounting for the overall
decline in homogenous contexts. With more heterogeneous contexts, electoral
volatility should have increased as more voters deviated from their previous vote
choice. This proposition is tentatively supported by the shifts in party support
witnessed in that election, particularly the declines in ANC support, new support
for COPE, and increases in support for the DA as voters sought new political
homes.
Overall, this decline in homogeneous contexts during 2009 presents an
encouraging sign for South Africa’s democratic future. If the content of political
information flowing through social contexts continues to diversify in future
election campaigns, the ‘buttressing effects’ of partisan congruence on voting
decisions should decrease as homogeneous partisan contexts erode further. This
development should foster new opportunities for political competition.
34
Appendix
1. Types of Social Contexts in South Africa
1.1 Partisan congruence and regular discussants
Family, Friends, Neighbours, Co-workers:
Table 1: Cell percentages are respondents who engage in discussion (either rarely, sometimes or often) with the
regular discussants and support the same party as the respondent. Respondents who state that they never discuss
politics are unlikely to have regular discussants and are unlikely to know which party they support, and are
excluded from the analysis.
Partisan congruence is operationalised by the following item:
Question item: Do you think each of these groups supported the same party as you, supported another party, or
is their support divided among several different parties, or don’t you know enough about their views to say? A.
Family; B. Friends; C. Neighbours; D. Co-workers. (1) Supported same party; (2) Supported another party; (3)
Support is divided among different parties; (9) Don’t know. Recoded as follows: (1) Same party (2) Don’t know
(3) Different party. Total n=1200.
Spouse:
Table 2: Cell percentages in the first row indicate levels of partisan congruence between respondent and
spouse/partner as a percentage of the entire sample.
Partisan congruence is operationalised by a match between the respondents’ self-declared party identification and
the party the respondent believes the spouse supported in the previous election.
Question item: If married or living with partner: Which party did he/she support in the last election?
Party support is coded so that each individual party has the same response code number for both respondent and
discussant and also the categories ‘did not vote’ or ‘do not support a party’.
Primary Discussant:
Table 3: Cell percentages indicate levels of partisan congruence between respondent and primary discussant as a
percentage of the entire sample.
Question item: Now I would like you to think of someone else with whom you most frequently talk about matters
that are most important to you. Which party did he/she support in the last election?
Party support is coded so that each individual party has the same response code number for both respondent and
discussant and also the categories ‘did not vote’ or ‘do not support a party’.
1.2 Homogenous vs. heterogeneous social contexts
A total score of context heterogeneity is calculated for each respondent’s discussant context by tallying the
congruence scores of four of the respondent’s personal discussants. Each respondent is assigned to a category
depending on the extent of congruence within his/her context group. The less heterogeneous/ more homogenous
context category (1) requires that respondents perceive at least two or more of their four discussants support the
same party as they do. The more heterogeneous/ less homogenous context category (3) requires that respondents
think that at least two or more of their four discussants support a different party to theirs. If respondents have
three or more discussants of which they do not know their party preference they coded into the ‘don’t know’
category (2). The scale that excludes co-workers is based on the same requirements; respondents had to respond
positively for at least two or more of three discussants before being placed into a category.
Table 17: Frequency distribution of dependent variable: Social Context Type 2004
2004 Frequency Percent Valid percent Cumulative
percent
More homogenous
(1)
233 19.5 49.4 49.4
Don’t know (2) 75 6.3 15.9 65.3
More heterogeneous
(3)
164 13.7 34.7 100.0
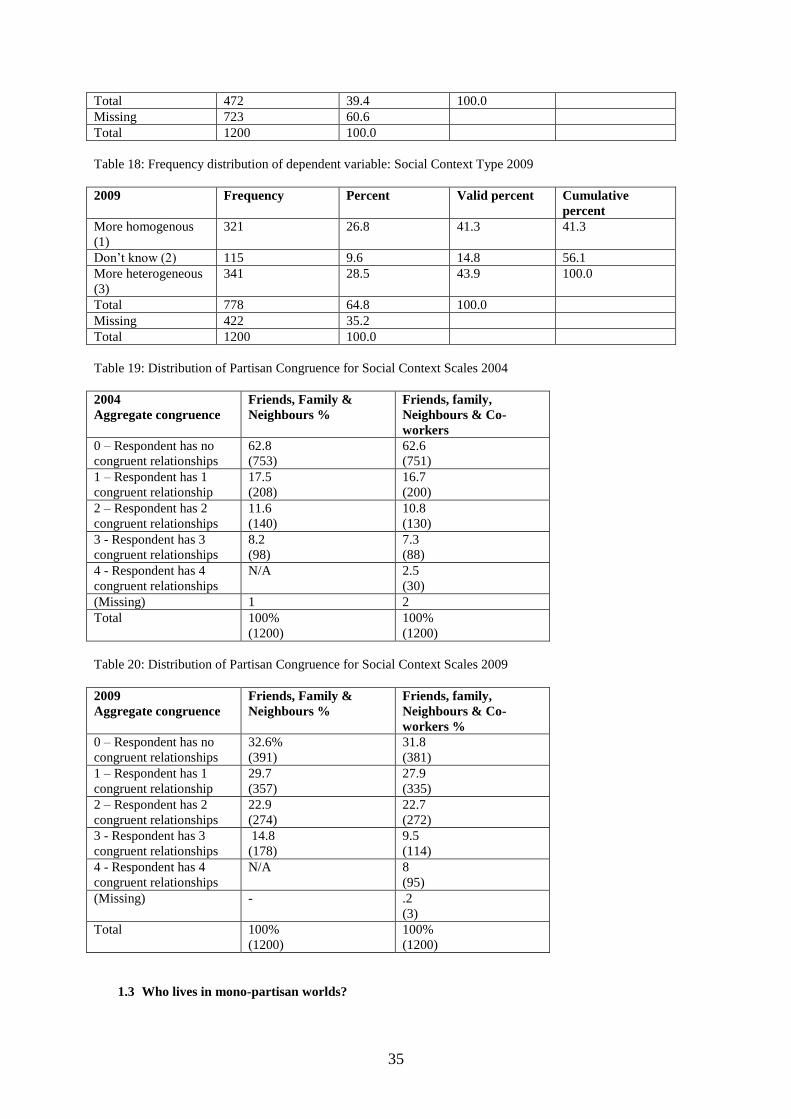
35
Total 472 39.4 100.0
Missing 723 60.6
Total 1200 100.0
Table 18: Frequency distribution of dependent variable: Social Context Type 2009
2009 Frequency Percent Valid percent Cumulative
percent
More homogenous
(1)
321 26.8 41.3 41.3
Don’t know (2) 115 9.6 14.8 56.1
More heterogeneous
(3)
341 28.5 43.9 100.0
Total 778 64.8 100.0
Missing 422 35.2
Total 1200 100.0
Table 19: Distribution of Partisan Congruence for Social Context Scales 2004
2004
Aggregate congruence
Friends, Family &
Neighbours %
Friends, family,
Neighbours & Co-
workers
0 – Respondent has no
congruent relationships
62.8
(753)
62.6
(751)
1 – Respondent has 1
congruent relationship
17.5
(208)
16.7
(200)
2 – Respondent has 2
congruent relationships
11.6
(140)
10.8
(130)
3 - Respondent has 3
congruent relationships
8.2
(98)
7.3
(88)
4 - Respondent has 4
congruent relationships
N/A 2.5
(30)
(Missing) 1 2
Total 100%
(1200)
100%
(1200)
Table 20: Distribution of Partisan Congruence for Social Context Scales 2009
2009
Aggregate congruence
Friends, Family &
Neighbours %
Friends, family,
Neighbours & Co-
workers %
0 – Respondent has no
congruent relationships
32.6%
(391)
31.8
(381)
1 – Respondent has 1
congruent relationship
29.7
(357)
27.9
(335)
2 – Respondent has 2
congruent relationships
22.9
(274)
22.7
(272)
3 - Respondent has 3
congruent relationships
14.8
(178)
9.5
(114)
4 - Respondent has 4
congruent relationships
N/A 8
(95)
(Missing) - .2
(3)
Total 100%
(1200)
100%
(1200)
1.3 Who lives in mono-partisan worlds?
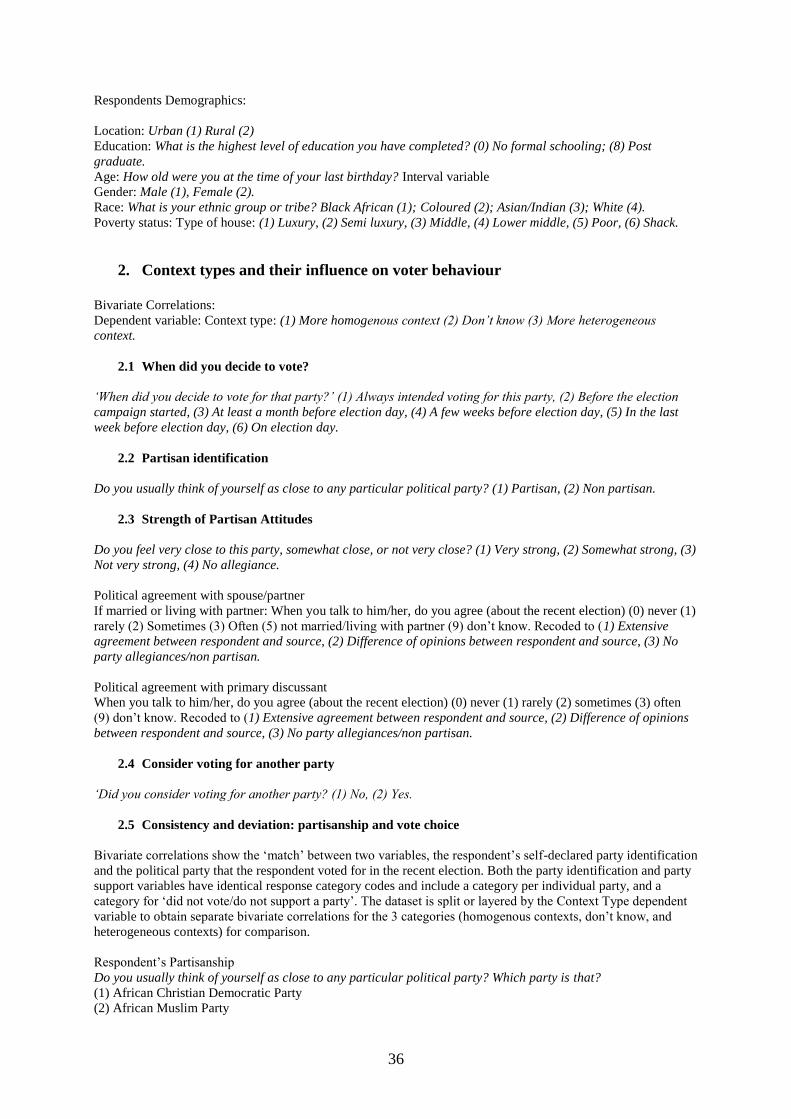
36
Respondents Demographics:
Location: Urban (1) Rural (2)
Education: What is the highest level of education you have completed? (0) No formal schooling; (8) Post
graduate.
Age: How old were you at the time of your last birthday? Interval variable
Gender: Male (1), Female (2).
Race: What is your ethnic group or tribe? Black African (1); Coloured (2); Asian/Indian (3); White (4).
Poverty status: Type of house: (1) Luxury, (2) Semi luxury, (3) Middle, (4) Lower middle, (5) Poor, (6) Shack.
2. Context types and their influence on voter behaviour
Bivariate Correlations:
Dependent variable: Context type: (1) More homogenous context (2) Don’t know (3) More heterogeneous
context.
2.1 When did you decide to vote?
‘When did you decide to vote for that party?’ (1) Always intended voting for this party, (2) Before the election
campaign started, (3) At least a month before election day, (4) A few weeks before election day, (5) In the last
week before election day, (6) On election day.
2.2 Partisan identification
Do you usually think of yourself as close to any particular political party? (1) Partisan, (2) Non partisan.
2.3 Strength of Partisan Attitudes
Do you feel very close to this party, somewhat close, or not very close? (1) Very strong, (2) Somewhat strong, (3)
Not very strong, (4) No allegiance.
Political agreement with spouse/partner
If married or living with partner: When you talk to him/her, do you agree (about the recent election) (0) never (1)
rarely (2) Sometimes (3) Often (5) not married/living with partner (9) don’t know. Recoded to (1) Extensive
agreement between respondent and source, (2) Difference of opinions between respondent and source, (3) No
party allegiances/non partisan.
Political agreement with primary discussant
When you talk to him/her, do you agree (about the recent election) (0) never (1) rarely (2) sometimes (3) often
(9) don’t know. Recoded to (1) Extensive agreement between respondent and source, (2) Difference of opinions
between respondent and source, (3) No party allegiances/non partisan.
2.4 Consider voting for another party
‘Did you consider voting for another party? (1) No, (2) Yes.
2.5 Consistency and deviation: partisanship and vote choice
Bivariate correlations show the ‘match’ between two variables, the respondent’s self-declared party identification
and the political party that the respondent voted for in the recent election. Both the party identification and party
support variables have identical response category codes and include a category per individual party, and a
category for ‘did not vote/do not support a party’. The dataset is split or layered by the Context Type dependent
variable to obtain separate bivariate correlations for the 3 categories (homogenous contexts, don’t know, and
heterogeneous contexts) for comparison.
Respondent’s Partisanship
Do you usually think of yourself as close to any particular political party? Which party is that?
(1) African Christian Democratic Party
(2) African Muslim Party
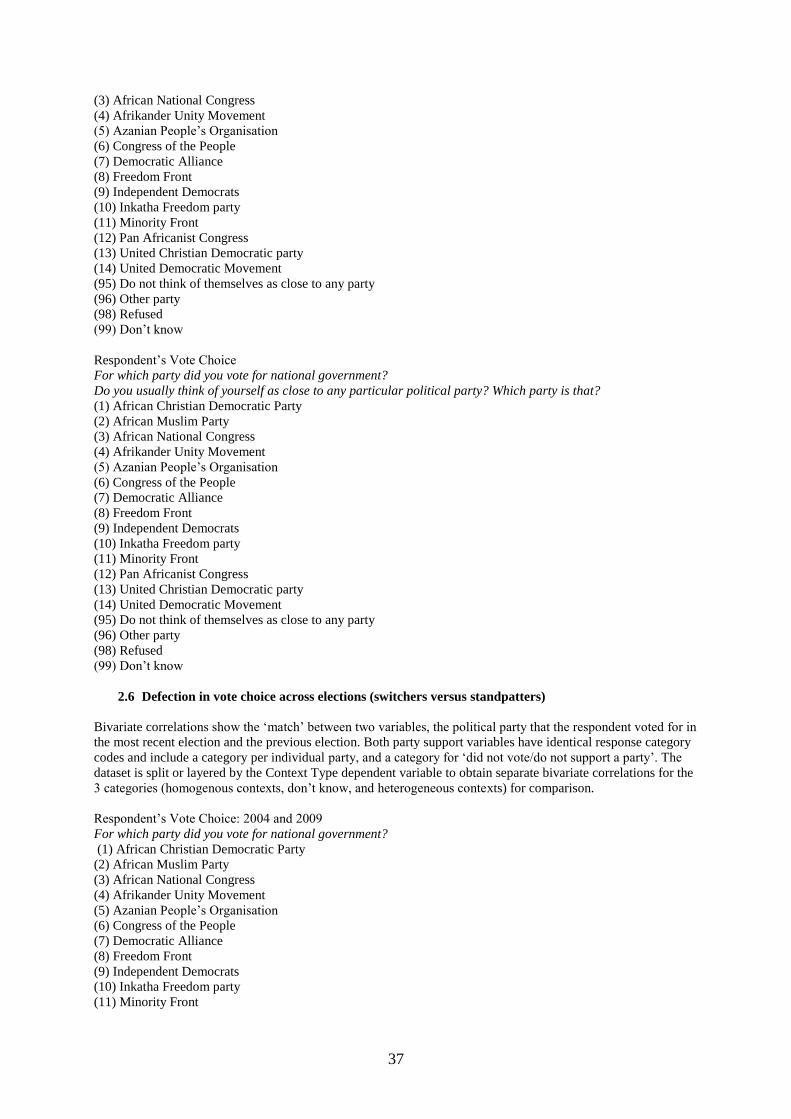
37
(3) African National Congress
(4) Afrikander Unity Movement
(5) Azanian People’s Organisation
(6) Congress of the People
(7) Democratic Alliance
(8) Freedom Front
(9) Independent Democrats
(10) Inkatha Freedom party
(11) Minority Front
(12) Pan Africanist Congress
(13) United Christian Democratic party
(14) United Democratic Movement
(95) Do not think of themselves as close to any party
(96) Other party
(98) Refused
(99) Don’t know
Respondent’s Vote Choice
For which party did you vote for national government?
Do you usually think of yourself as close to any particular political party? Which party is that?
(1) African Christian Democratic Party
(2) African Muslim Party
(3) African National Congress
(4) Afrikander Unity Movement
(5) Azanian People’s Organisation
(6) Congress of the People
(7) Democratic Alliance
(8) Freedom Front
(9) Independent Democrats
(10) Inkatha Freedom party
(11) Minority Front
(12) Pan Africanist Congress
(13) United Christian Democratic party
(14) United Democratic Movement
(95) Do not think of themselves as close to any party
(96) Other party
(98) Refused
(99) Don’t know
2.6 Defection in vote choice across elections (switchers versus standpatters)
Bivariate correlations show the ‘match’ between two variables, the political party that the respondent voted for in
the most recent election and the previous election. Both party support variables have identical response category
codes and include a category per individual party, and a category for ‘did not vote/do not support a party’. The
dataset is split or layered by the Context Type dependent variable to obtain separate bivariate correlations for the
3 categories (homogenous contexts, don’t know, and heterogeneous contexts) for comparison.
Respondent’s Vote Choice: 2004 and 2009
For which party did you vote for national government?
(1) African Christian Democratic Party
(2) African Muslim Party
(3) African National Congress
(4) Afrikander Unity Movement
(5) Azanian People’s Organisation
(6) Congress of the People
(7) Democratic Alliance
(8) Freedom Front
(9) Independent Democrats
(10) Inkatha Freedom party
(11) Minority Front
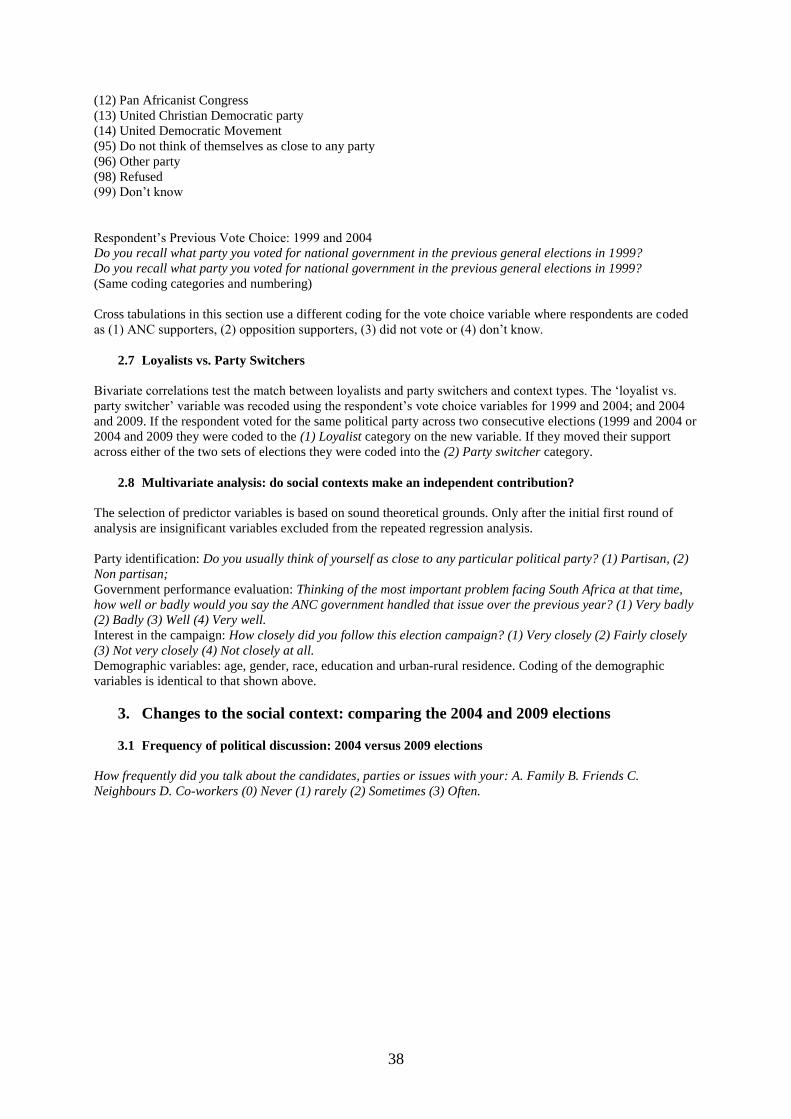
38
(12) Pan Africanist Congress
(13) United Christian Democratic party
(14) United Democratic Movement
(95) Do not think of themselves as close to any party
(96) Other party
(98) Refused
(99) Don’t know
Respondent’s Previous Vote Choice: 1999 and 2004
Do you recall what party you voted for national government in the previous general elections in 1999?
Do you recall what party you voted for national government in the previous general elections in 1999?
(Same coding categories and numbering)
Cross tabulations in this section use a different coding for the vote choice variable where respondents are coded
as (1) ANC supporters, (2) opposition supporters, (3) did not vote or (4) don’t know.
2.7 Loyalists vs. Party Switchers
Bivariate correlations test the match between loyalists and party switchers and context types. The ‘loyalist vs.
party switcher’ variable was recoded using the respondent’s vote choice variables for 1999 and 2004; and 2004
and 2009. If the respondent voted for the same political party across two consecutive elections (1999 and 2004 or
2004 and 2009 they were coded to the (1) Loyalist category on the new variable. If they moved their support
across either of the two sets of elections they were coded into the (2) Party switcher category.
2.8 Multivariate analysis: do social contexts make an independent contribution?
The selection of predictor variables is based on sound theoretical grounds. Only after the initial first round of
analysis are insignificant variables excluded from the repeated regression analysis.
Party identification: Do you usually think of yourself as close to any particular political party? (1) Partisan, (2)
Non partisan;
Government performance evaluation: Thinking of the most important problem facing South Africa at that time,
how well or badly would you say the ANC government handled that issue over the previous year? (1) Very badly
(2) Badly (3) Well (4) Very well.
Interest in the campaign: How closely did you follow this election campaign? (1) Very closely (2) Fairly closely
(3) Not very closely (4) Not closely at all.
Demographic variables: age, gender, race, education and urban-rural residence. Coding of the demographic
variables is identical to that shown above.
3. Changes to the social context: comparing the 2004 and 2009 elections
3.1 Frequency of political discussion: 2004 versus 2009 elections
How frequently did you talk about the candidates, parties or issues with your: A. Family B. Friends C.
Neighbours D. Co-workers (0) Never (1) rarely (2) Sometimes (3) Often.
39
References
Aarts, K., Blais, A. & H. Schmitt (eds.). 2011. Political Leaders and Democratic
Elections. Oxford: Oxford University Press.
Baker, A., Ames, B. & L. R. Renno. 2006. Social context and campaign
volatility in new democracies: networks and neighborhoods in Brazil’s 2002
elections. American Journal of Political Science, 50( 2): 382-399.
Bartels, L. M. 1993. Messages received: The political impact of media exposure.
American Political Science Review, 87(2): 267-285.
Bartolini, S. & P. Mair. 1990. Identity, competition, and electoral availability:
The stabilisation of European electorates 1885-1985. Cambridge: Cambridge
University Press.
Beck, P. A., Dalton, R., Greene, S. & R. Huckfeldt. 2002. The Social Calculus
of Voting: Interpersonal Media and Organizational Influences on Presidential
Choice. American Political Science Review, 96(1): 57-73.
Beck, P. A. & R. Gunther. 2012. ‘Global Patterns of Intermediation’, Paper in
Department of Political Science, Ohio State University.
Berelson, B., Lazarsfeld, P. & W.N. McPhee. 1954. Voting: A study of opinion
formation in a presidential campaign. Chicago: University of Chicago Press.
Butler, D. & D. Stokes. 1969. Political Change in Britain. London: Macmillan.
Campbell, A., Converse, P., Miller, W. & D. Stokes. 1960. The American Voter.
New York: John Wiley & Sons.
Dalton, R. 1984. Cognitive Mobilisation and Partisan Dealignment in Advanced
Industrial Democracies. The Journal of Politics, 46(1): 264-284.
Dalton, R. 2002. Citizen Politics: Public Opinion and Political Parties in
Advanced Democracies, 3rd ed. Chatham House Publishers, New Jersey.
Dalton, R. 2008. The quantity and the quality of party systems: party system
polarization, its measurement and its consequences. Comparative Political
Studies, 41(7): 899-920.
40
Dalton. R., Flanagan, S. & P.A. Beck. 1984. Electoral change in Advanced
Industrial democracies. Realignment or dealignment? New Jersey: Princeton
University Press.
Daniel, J. & R. Southall. 2009. Zunami! The national and provincial electoral
outcomes: Continuity with change’. In: Southall, R. & J. Daniel (eds.). Zunami!
The 2009 South African Elections, 232-269. Johannesburg: Jacana and Konrad-
Adenauer-Stiftung.
Davis, G. 2005. ‘Media Coverage in Election 2004: were some parties more
equal than others?’ In Piombo, J. & L. Nijzink (eds.). Electoral Politics in South
Africa: Assessing the First Democratic Decade, 231-249. New York: Palgrave
Macmillan.
Downs, A. 1957. An Economic Theory of Democracy. New Jersey: Prentice
Hall.
Duncan, J. 2009. ‘Desperately Seeking Depth: The Media and the 2009
Elections’. In: Southall, R. & J. Daniel (eds.). Zunami! The 2009 South African
Elections, 215-231. Johannesburg: Jacana and Konrad-Adenauer-Stiftung.
Eldridge, M. & J. Seekings. 1996. Mandela’s Lost Province: The African
National Congress and the Western Cape Electorate in the 1994 South African
Elections. Journal of Southern African Studies, 22(4): 517-540.
Eveland, W. & M. H. Hively. 2009. Political discussion frequency, network size,
and “heterogeneity” of discussions as predictors of political knowledge and
participation. Journal of Communication, 59: 205-224.
Faull, J. 2004. How the West was won (and lost). Election Synopsis, 1(4): 15-
18..
http://www.cps.org.za/cps%20pdf/election-synopsis_4.pdf
[accessed 02.04.2013].
Ferree, K.E. 2004. The Microfoundations of Ethnic Voting: Evidence from
South Africa. Afrobarometer Working Paper No. 40.
www.afrobarometer.org
Ferree, K.E. 2006. Explaining South Africa’s Racial Census. The Journal of
Politics, 68(4): 803–815.
Field, A. 2009. Discovering Statistics using SPSS, 3rd ed. London: Sage
Publications.
41
Fiorina, M. 1981. Retrospective Voting in American Presidential Elections. New
Haven: Yale University Press.
Flanagan, S., Kohei, S., Miyake I. & B.M. Richardson. 1991. The Japanese
Voter. New Haven: Yale University Press.
Franklin, M.N. 2004. Voter turnout and the dynamics of electoral competition in
established democracies since 1945. New York: Cambridge University Press.
Glenn, I. & R. Mattes. 2010. Political Communications in Post-Apartheid South
Africa. In: Semetko, H. (ed.) The Sage Handbook of Political Communication,
London: Sage Publications.
Green, D., Palmquist, B. & E. Schickler. 2002. Partisan Hearts and Minds:
Political Parties and the Social Identities of Voters. New Haven: Yale
University Press.
Gunther, R., Montero, J.R. & H.J. Puhle. 2007. Introduction: intermediation,
information and electoral politics. In: Gunther, R., Montero, J. & Puhle, H.
(eds.) Democracy, Intermediation, and Voting on Four Continents. New York:
Oxford University Press, 1-28.
Horowitz, D. 1985. Ethnic Groups in Conflict. Berkeley: University of
California Press.
Horowitz, D. 1991. A Democratic South Africa? Constitutional Engineering in a
Divided Society. Oxford: University of California Press.
Huckfeldt, R. & J. Sprague. 1987. Networks in Context: The Social Flow of
Political Information. The American Political Science Review, 81(4): 1197-1216.
Huckfeldt, R. & J. Sprague. 1988. Choice, Social Structure and Political
Information: the informational coercion of minorities, American Journal of
Political Science, 32: 467-482.
Huckfeldt, R. Johnson, P. & J. Sprague. 2004. Political disagreement: The
survival of diverse opinions within communication networks. Cambridge:
Cambridge University Press.
Huckfeldt, R. Beck P.A. Dalton, R. & J. Levine. 1995. Political Environments,
Cohesive Social Groups, and the Communication of Public Opinion. American
Journal of Political Science, 39(4): 1025-1054.
42
Huckfeldt, R., Ikeda, K. & F. Pappi. 2005. Patterns of Disagreement in
Democratic Politics: Comparing Germany, Japan, and the United States.
American Journal of Political Science, 49(3), 497-514.
Huntington, S. 1991. The Third Wave: Democratization in the late Twentieth
Century. Norman: University of Oklahoma Press.
Inglehart, R. 1977. The Silent Revolution: Changing Values and Political Styles
among Western Publics. Princeton N.J: Princeton University Press.
Inglehart, R. 1997. Modernization and Postmodernization: Cultural, Economic
and Political change in 43 countries. Princeton N.J: Princeton University Press.
Jolobe, Z. 2009. The Democratic Alliance. In: Southall, R. & J Daniel (eds),
Zunami! The 2009 South African election, 23-46. Johannesburg: Jacana and
Konrad-Adenauer-Stiftung.
Lijphart, A. 1977. Democracy in plural societies: a comparative exploration.
New Haven: Yale University Press.
Lijphart, A. 1994. Electoral Systems and Party Systems. New York: Oxford
University Press.
Lipset, S. & S. Rokkan. 1967. Party Systems and Voter Alignments: Cross-
National Perspectives. New York: Free Press.
Lipset, S. & S. Rokkan. 1985. Cleavage Structures, Party Systems and Voter
Alignments. In: Lipset, S. & S. Rokkan (eds) Conflict and Consensus: essays in
political sociology, 113-185. New Jersey: Transaction.
Lupia, A., McCubbins, M. & S. Popkin (eds). 2000. Elements of Reason:
Cognition, Choice, and the Bounds of Rationality. Cambridge: Cambridge
University Press.
Magalhaes, P. 2007. Voting and Intermediation: Informational Biases and
Electoral Choices in Comparative Perspective. In: Gunther, R., Montero, J. & H.
Puhle (eds.). Democracy, Intermediation, and Voting on Four Continents, 254-
208. New York: Oxford University Press.
Magalhaes, P., Segatti, P. & T. Shi. (forthcoming), Mobilization, informal
networks, and the social contexts of turnout. Paper for publication as a chapter in
second volume of the Comparative National Elections Project (CNEP)
43
publication series, Richard Gunther, Pedro C. Magalhaes and Alejandro Moreno
(eds).
Mattes, R. 1995. The Election Book: Judgments and choice in South Africa’s
1994 election. Cape Town: Idasa publishers.
Mattes, R. 2005. Voter information, government evaluations, and party images
in the First Decade. In: Piombo, J. & L. Nijzink (eds). Electoral Politics in South
Africa: Assessing the First Democratic Decade, 40-63. New York: Palgrave
Macmillan.
Mattes, R. & A. Gouws. 1998. Race, Ethnicity, and Voting Behaviour: Lessons
from South Africa. In Sisk, T. & A. Reynolds (eds). Elections and Conflict
Management in Africa. Washington, D.C: United States Institute of Peace Press.
Mattes, R. & J. Piombo. 2001. Opposition Parties and the Voters in South
Africa’s General Election of 1999. Democratization, 8(3): 101-128.
Norris, P. 2000. A Virtuous Circle: Political Communications in Postindustrial
Societies. Cambridge: Cambridge University Press.
Popkin, S. 1991. The Reasoning Voter: Communication and Persuasion in
Presidential Elections. Chicago: University of Chicago Press.
Putnam, R. 2000. Bowling Alone. New York: Simon and Schuster.
Richardson, B. & P.A. Beck. 2007. The flow of political information: personal
discussants, the media, and partisans. In: Gunther, R., Montero, J. & H. Puhle.
(eds). Democracy, Intermediation, and Voting on Four Continents, 183-207.
New York: Oxford University Press.
Rose, R. & I. McAllister. 1990. The Loyalties of Voters. London: Sage
publications.
Schulz-Herzenberg, C. 2008. Towards a silent revolution? South African voters
during the first years of democracy: 1994 to 2006. Doctoral thesis, submitted
August 2008. University of Cape Town.
Schulz-Herzenberg, C. 2009. Trends in Party Support & Voter Behaviour, 1994-
2009. In: Southall, R. & J Daniel (eds). Zunami! The 2009 South African
election, 23-46. Johannesburg: Jacana and Konrad-Adenauer-Stiftung.
44
Schulz-Herzenberg, C. 2012. Public opinion during the 2009 South African
elections. In: Henwood, R. & H. Thuynsma (eds). Public Opinion and Interest
Group Politics: South Africa’s Missing Links, 135-153. Africa Institute of South
Africa.
Seekings, J. 2006. Partisan Realignment in Cape Town 1994-2004. Journal of
African Elections, 5(1): 176-203.
Seekings, J. & N. Nattrass. 2006. Class, Race and Inequality in South Africa.
Scottsville, South Africa: University of KwaZulu-Natal Press.
Southall, R. 2009. Zunami! The context of the 2009 election. In: Southall, R. & J
Daniel (eds). Zunami! The 2009 South African election, 1-22. Johannesburg:
Jacana and Konrad-Adenauer-Stiftung.
Torcal, M. & G. Maldonado. 2010. Attitudes towards democracy and the
mechanisms of voting intermediation. Department of Political and Social
Sciences: Research and Expertise Centre for Survey Methodology (RECSM)
Working Paper No. 12. Barcelona: Universitat Pompeu Fabra.
Trilling, R. 1976. Party Image and Electoral Behaviour. New York: John Wiley.
Visser, P. & R. Mirabile. 2004. Attitudes in the social context: the impact of
social network composition on individual-level attitude strength. Journal of
Personality and Social Psychology, 87(6): 779-795.
Related Documents