THE IMPLICATIONS OF IMPLEMENTING THE IMPLICATIONS OF IMPLEMENTING THE IMPLICATIONS OF IMPLEMENTING THE IMPLICATIONS OF IMPLEMENTING ELECTRONIC ELECTRONIC ELECTRONIC ELECTRONIC- HUMAN RESOURCE MANAGEMENT HUMAN RESOURCE MANAGEMENT HUMAN RESOURCE MANAGEMENT HUMAN RESOURCE MANAGEMENT (E (E (E (E-HRM) SYSTEMS IN COMPANIES HRM) SYSTEMS IN COMPANIES HRM) SYSTEMS IN COMPANIES HRM) SYSTEMS IN COMPANIES Thesis Submitted to the Padmashree Dr. D. Y. Patil University, Department of Business Management in partial fulfillment of the requirements for the award of the Degree of DOCTOR OF PHILOSOPHY In BUSINESS MANAGEMENT Submitted by SHILPA VARMA (Enrollment No: DYPPHD- 066100028) Research Guide Dr. R. GOPAL DIRECTOR, DEAN & HEAD OF THE DEPARTMENT PADMASHREE DR. D.Y. PATIL UNIVERSITY, DEPARTMENT OF BUSINESS MANAGEMENT, Sector 4, Plot No. 10, CBD Belapur, Navi Mumbai – 400 614 July 2010

Welcome message from author
This document is posted to help you gain knowledge. Please leave a comment to let me know what you think about it! Share it to your friends and learn new things together.
Transcript

THE IMPLICATIONS OF IMPLEMENTING THE IMPLICATIONS OF IMPLEMENTING THE IMPLICATIONS OF IMPLEMENTING THE IMPLICATIONS OF IMPLEMENTING
ELECTRONICELECTRONICELECTRONICELECTRONIC----
HUMAN RESOURCE MANAGEMENT HUMAN RESOURCE MANAGEMENT HUMAN RESOURCE MANAGEMENT HUMAN RESOURCE MANAGEMENT
(E(E(E(E----HRM) SYSTEMS IN COMPANIES HRM) SYSTEMS IN COMPANIES HRM) SYSTEMS IN COMPANIES HRM) SYSTEMS IN COMPANIES
Thesis Submitted to the Padmashree Dr. D. Y. Patil University, Department of Business Management
in partial fulfillment of the requirements for the award of the Degree of
DOCTOR OF PHILOSOPHY
In
BUSINESS MANAGEMENT
Submitted by
SHILPA VARMA
(Enrollment No: DYPPHD- 066100028)
Research Guide Dr. R. GOPAL
DIRECTOR, DEAN & HEAD OF THE DEPARTMENT
PADMASHREE DR. D.Y. PATIL UNIVERSITY, DEPARTMENT OF BUSINESS MANAGEMENT,
Sector 4, Plot No. 10, CBD Belapur, Navi Mumbai – 400 614
July 2010
2
THE IMPLICATIONS OF THE IMPLICATIONS OF THE IMPLICATIONS OF THE IMPLICATIONS OF
IMPLEMENTING ELECTRONICIMPLEMENTING ELECTRONICIMPLEMENTING ELECTRONICIMPLEMENTING ELECTRONIC----
HUMAN RESOURCE MANAGEMENT HUMAN RESOURCE MANAGEMENT HUMAN RESOURCE MANAGEMENT HUMAN RESOURCE MANAGEMENT
(E(E(E(E----HRM) SYSTEMS IN COMPANIES HRM) SYSTEMS IN COMPANIES HRM) SYSTEMS IN COMPANIES HRM) SYSTEMS IN COMPANIES

3
DEDEDEDECLARATIONCLARATIONCLARATIONCLARATION
I hereby declare that the thesis entitled “The Implications of
Implementing Electronic-Human Resource Management (e-HRM)
Systems in Companies” submitted for the Award of Doctor of
Philosophy in Business Management at the Padmashree Dr. D.Y. Patil
University Department of Business Management is my original work
and the thesis has not formed the basis for the award of any degree,
associateship, fellowship or any other similar titles.
Place: Navi Mumbai
Date:
Dr. R. Gopal Dr. R. Gopal Ms. Shilpa Varma (Head of the department) (Research Guide) (Research Scholar)

4
CERTIFICATE CERTIFICATE CERTIFICATE CERTIFICATE This is to certify that the thesis entitled “The Implications of
Implementing Electronic-Human Resource Management (e-HRM)
Systems in Companies” and submitted by Ms. Ms. Ms. Ms. Shilpa VarmaShilpa VarmaShilpa VarmaShilpa Varma is a
bonafide research work for the award of the Doctor of Philosophy in
Business Management at the Padmashree Dr. D. Y. Patil University
Department of Business Management in partial fulfillment of the
requirements for the award of the Degree of Doctor of Philosophy Doctor of Philosophy Doctor of Philosophy Doctor of Philosophy
in Business Managementin Business Managementin Business Managementin Business Management and that the thesis has not formed the
basis for the award previously of any degree, diploma, associate ship,
fellowship or any other similar title of any University or Institution.
Also certified that the thesis represents an independent work on the
part of the candidate.
Place: Navi Mumbai Date: Dr. R. Gopal Dr. R. Gopal (Head of the department) (Research Guide)

5
ACKNOWLEDGEMENTACKNOWLEDGEMENTACKNOWLEDGEMENTACKNOWLEDGEMENT
In the first place, I am indebted to the Padmashree Dr. D.Y. Patil Padmashree Dr. D.Y. Patil Padmashree Dr. D.Y. Patil Padmashree Dr. D.Y. Patil
University Department of Business Management,University Department of Business Management,University Department of Business Management,University Department of Business Management, which has
accepted me for the Doctorate program and provided me with an
excellent opportunity to carry out the present research project.
I would like to thank all persons who have been instrumental in
making this dissertation see the light of the day directly or indirectly. I
owe my deepest gratitude to my mentor and guide, Dr. R. GopalDr. R. GopalDr. R. GopalDr. R. Gopal
without whose insights and guidance my work would never have been
completed. He helped me retain my focus during the course of this
study and guided me in prioritizing the different phases of this
research. Without his guidance and support this research would not
have taken this current form and could not have been completed
within the scheduled time.
I would like to acknowledge the help of Mr. Govind Joshi (GM,
Systems - Arch Pharmalabs Limited) for detailed technical
discussions on e-technology applications in companies; Mr. Amit
Varma (Faculty – NMIMS) and Dr. Piyush Saxena (Senior Vice
President, Corporate Affairs – RIL) for the help with data collection
from companies and Mr. J.C. Sharma (Consultant, Social Science
Research and Statistics) for his guidance in data analysis. I would
also like to acknowledge the enthusiastic support of Dr. Kavita K.M.
(CEO, JKITM) and Dr. Anuj Verma (GM, CSD – Government of India)
during this work.
I thank my husband Mr. Amar Varma and my daughters Arushi and
Arhana for their perseverance and patience while I was busy
completing this research.
Place: Navi Mumbai
Date: Ms. Shilpa Varma

6
TABLE OF CONTENTSTABLE OF CONTENTSTABLE OF CONTENTSTABLE OF CONTENTS
CHAPTERSCHAPTERSCHAPTERSCHAPTERS PAGE PAGE PAGE PAGE
NO.NO.NO.NO.
LIST OFLIST OFLIST OFLIST OF TABLES TABLES TABLES TABLES 10
LIST OF FIGURESLIST OF FIGURESLIST OF FIGURESLIST OF FIGURES 13
LIST OF ABBREVIATIONSLIST OF ABBREVIATIONSLIST OF ABBREVIATIONSLIST OF ABBREVIATIONS 15
EXECUTIVE SUMMARYEXECUTIVE SUMMARYEXECUTIVE SUMMARYEXECUTIVE SUMMARY 17
1 INTRODUCTIONINTRODUCTIONINTRODUCTIONINTRODUCTION 23
1.1 Changing Role of the Personnel Department 24
1.2 Understanding e-HRM 25
1.2.1 Meaning and Definition of e-HRM 25
1.2.2 Nature and scope of e-HRM 28
1.2.3 Benefits of e-HRM 31
1.3 Standalone Institution Software and Full Fledged ERP Software- A Comparison
33
2222 REVIEW OF LITERATUREREVIEW OF LITERATUREREVIEW OF LITERATUREREVIEW OF LITERATURE 36
3333 OBJECTIVES OF THE RESEARCHOBJECTIVES OF THE RESEARCHOBJECTIVES OF THE RESEARCHOBJECTIVES OF THE RESEARCH 60
3.1 Problem Definition 61
3.2 Importance of the Research 62
3.3 Statement of Objectives 63
3.4 Statement of Hypotheses 64
4444 RESEARCH METHODOLOGYRESEARCH METHODOLOGYRESEARCH METHODOLOGYRESEARCH METHODOLOGY 67
4.1 Understanding the issues 69
4.2 Descriptive Survey 69
4.3 Field Survey 70
4.3.1 Research Instruments 70
4.3.2 Sampling Design 72
4.3.3 Data Acquisition Stage 74
4.4 Data Analysis Stage 75
4.5 Presentation of Findings, Recommendations and Suggestions
75
4.6 Limitations of the Research 76

7
CHAPTERSCHAPTERSCHAPTERSCHAPTERS PAGE PAGE PAGE PAGE
NO.NO.NO.NO.
5555
INTEGRATION OF HR WITH TECHNOLOGY INTEGRATION OF HR WITH TECHNOLOGY INTEGRATION OF HR WITH TECHNOLOGY INTEGRATION OF HR WITH TECHNOLOGY
ENVIRONMENTENVIRONMENTENVIRONMENTENVIRONMENT 77777777
5.1 The Evolution of Technology and MIS 80
5.2 Human Resource Information Systems 84
5.3 Advantages of HRIS 90
5.4 A Generic HRIS Model 93
5.5 A Matrix of Information Vs User 94
5.6 HRIS and the Strategic, Tactical and Operational use of HR
95
6666 EEEE----HRM: AN OVERVIEWHRM: AN OVERVIEWHRM: AN OVERVIEWHRM: AN OVERVIEW 97
6.1 HR Administration 99
6.2 Employee Life Events 99
6.3 E-recruitment 101
6.4 Training Management 102
6.5 Performance Management System 104
6.6 Absence Management 108
6.7 Shift Management System 109
6.8 Resource Management & Timesheet 109
6.9 Planning 111
6.10 Payroll Management 111
6.11 Employee & Manager Self-service 112
6.12 HR & Workgroup Analytics / Reporting 117
6.13 Workflow 117
6.14 Role Players 118
6.15 Key benefits of a good HCM software product 118
7777 THE GLOBAL eTHE GLOBAL eTHE GLOBAL eTHE GLOBAL e----HRM SCENARIOHRM SCENARIOHRM SCENARIOHRM SCENARIO 121
7.1 Emergence of Personnel Management 123
7.2 From Personnel Management to HRM 125
7.3 HR Transformation in the Digital Age 129
7.4 HR in the midst of a seemingly endless Transformation
132
7.5 Recent trends in e-HRM 132
7.5.1 Model of HCM Excellence 132
7.5.2 Global trends in e-HRM -Highlights 135
7.5.3 Overall Application Adoption 136
7.5.4 Vendor Solutions 137
7.5.5 Sourcing 140
7.5.6 E-HRM trends in the APAC countries 141

8
CHAPTERSCHAPTERSCHAPTERSCHAPTERS PAGE PAGE PAGE PAGE
NO.NO.NO.NO.
8888 THE INDIAN eTHE INDIAN eTHE INDIAN eTHE INDIAN e----HRM SCENARIOHRM SCENARIOHRM SCENARIOHRM SCENARIO 147
8.1 E-HRM in India: Vendor Solutions over the years 148
8.1.1 1995 – 1999 149
8.1.2 2000 - 2004 151
8.1.3 2005 - 2009 156
8.1.4 Current Scenario 158
8.2 Some noteworthy e-HRM Applications 160
8.3 Sourcing 168
9999 DATA ANALYSIS AND FINDINGSDATA ANALYSIS AND FINDINGSDATA ANALYSIS AND FINDINGSDATA ANALYSIS AND FINDINGS 171
9.1 Profile of Sample 172
9.2 Response to the Questionnaire 172
9.2.1 Ranking of the drivers for introducing e-HRM systems in companies
172
9.2.2 Usage of e-technology for each of the considered Human Resource Functions
176
9.2.3 Usage of HR Service Delivery Tools 180
9.2.4 Sourcing Solutions 182
9.2.5 Perception of Respondents regarding their company’s position in the e-HRM journey today
182
9.2.6 Perception of Respondents regarding their company’s position in the e-HRM journey after five years
185
9.2.7 Ranking of the barriers to progress in the e-HRM journey
192
9.2.8 Expectation of respondents w.r.t. e-HRM being successful in satisfying employees in their HR needs.
197
9.2.9 Expectation of respondents w.r.t. the benefits from e-HRM justifying the expenditure on the same
199
9.2.10 Opinion of respondents on various aspects of the e-HRM functioning
201
10101010
THE PRETHE PRETHE PRETHE PRE----REQUISITES AND CHALLENGES OF REQUISITES AND CHALLENGES OF REQUISITES AND CHALLENGES OF REQUISITES AND CHALLENGES OF
EEEE----HRMHRMHRMHRM 218
10.1 The Pre-requisites of e-HRM 219
10.2 The Challenges of e-HRM 222

9
CHAPTERSCHAPTERSCHAPTERSCHAPTERS PAGE PAGE PAGE PAGE
NO.NO.NO.NO.
11111111 RECOMMENDATIONS AND SUGGESTIONS RECOMMENDATIONS AND SUGGESTIONS RECOMMENDATIONS AND SUGGESTIONS RECOMMENDATIONS AND SUGGESTIONS 228
11.1 Planning for employee and organizational issues from the outset
229
11.2 Assessing the Flexibility of the HR Technology 231
11.3 Service Delivery Applications 232
11.4 HR Service Centers: Investments to Consider 232
11.5 Outsourcing HR administration 235
11.6 Creating an Effective e Statement: a Primer 236
11.7 Use of Case Management Tools for Compensation Planning
238
11.8 E-Recruitment 239
11.9 E- Retirement 240
11.10 Data mining tools 242
11.11 Investing in Portal Technology 242
11.12 Best Practices of HR Portals 244
11.13 E-learning 246
11.14 HR intranets 248
11.15 Internet & e-mail policies 248
11.16 Web 2.0 and Social Networking Applications 249
11.17 Strategic HCM Applications 249
12121212 CONCLUSION CONCLUSION CONCLUSION CONCLUSION 251
REFERENCE SECTIONREFERENCE SECTIONREFERENCE SECTIONREFERENCE SECTION 256
BIBLIOGRAPHYBIBLIOGRAPHYBIBLIOGRAPHYBIBLIOGRAPHY 257
QUESTIONNAIREQUESTIONNAIREQUESTIONNAIREQUESTIONNAIRE 263
ANNEXURESANNEXURESANNEXURESANNEXURES 272
I Sample Size 273
II Data Analysis Tables 274

10
LIST OF TABLESLIST OF TABLESLIST OF TABLESLIST OF TABLES
TABLE TABLE TABLE TABLE
NO.NO.NO.NO. TITLETITLETITLETITLE PAGE PAGE PAGE PAGE
NO.NO.NO.NO.
1.1 Comparison between Standalone Institution Software and Full Fledged ERP Software
33
5.1 Data and data items of employee file 86 5.2 Data and data items of job files 88 5.3 Data and data items of job applicant’s file 88 5.4 Accidents file data and data items 89 5.5 Claims and injuries file data and data items 89 5.6 Examples of Human Resource Information Systems 90
5.7 Matrix of Information versus User for a Personnel Function
94
6.1 Benefits of an ideal HCM software product 119 7.1 Sourcing solutions and Key Drivers 141 9.1a Percentage of Respondents- City wise 274
9.1b % of Respondents by Type of Sector (Services/Manufacturing)
274
9.1c % of Respondents by Type of Company (MNC/Non-MNC)
274
9.1d % of Respondents (MNC/Non-MNC)*(Services/Manufacturing)
275
9.1e % of Respondents by Size of Company (Annual Turn-over)
275
9.1f % of Respondents by Size of Company (No. of Employees)
275
9.1g City * Type of Sector (Services/Manufacturing) 276
9.1h Size of Company (Annual Turn-over) * Type of Sector (Services/Manufacturing)
277
9.1i Size of Company (No. of Employees) * Type of Sector (Services/Manufacturing)
277
9.1j City * Type of Sector (Services/Manufacturing) 278 9.1k City * Type of Company (MNC/Non-MNC) 279
9.2a Drivers for introducing e-HRM systems to companies: Mean Ranks by Type of Sector ( Services/ Manufacturing)
280
9.2b Drivers for introducing e-HRM systems to companies: Mean Rank Order by Type of Sector (Services/ Manufacturing)
280
9.2c The top five drivers for Services vs Manufacturing groups
173
9.3a Drivers for introducing e-HRM systems to companies: Mean Ranks by Type of Company (MNC/ Non-MNC)
281
9.3b Drivers for introducing e-HRM systems to companies: Mean Rank Order by type of Company (MNC/ Non-MNC)
281
9.3c The top five drivers for MNC vs Non-MNC groups 174

11
TABLE TABLE TABLE TABLE
NO.NO.NO.NO. TITLETITLETITLETITLE PAGE PAGE PAGE PAGE
NO.NO.NO.NO.
9.4a Drivers for introducing e-HRM systems to companies (ANOVA)- Descriptive Statistics
282
9.4b Drivers for introducing e-HRM systems to companies (ANOVA)
284
9.5a Usage of e-technology for Human Resource Functions by Type of Sector (Services/Manufacturing)
285
9.5b Usage of e-technology for HR Functions by Type of Sector (Services vs Manufacturing) - A Comparison
177
9.6a Usage of e-technology for Human Resource Functions by Type of Company (MNC/Non-MNC)
286
9.6b Usage of e-technology for HR Functions by Type of Company- (MNC vs Non-MNC) - A Comparison
179
9.7 Usage of HR Service Delivery Tools by Type of Sector (Services/Manufacturing)
287
9.8 Usage of HR Service Delivery Tools by Type of Company (MNC/Non-MNC)
287
9.9 Perception of Respondents regarding their company’s position in the e-HRM journey today- by Type of Sector (Services/Manufacturing)
288
9.10 Perception of Respondents regarding their company’s position in the e-HRM journey today- by Type of Company (MNC/Non-MNC)
289
9.11 Perception of Respondents regarding their company’s position in the e-HRM journey today – ANOVA
290
9.12 Perception of Respondents regarding their company’s position in the e-HRM journey after 5 years- by Type of Sector (Services/Manufacturing)
291
9.13 Perception of Respondents regarding their company’s position in the e-HRM journey after 5 years- by Type of Company (MNC/Non-MNC)
292
9.14 Perception of Respondents regarding their company’s position in the e-HRM journey after 5 years - ANOVA
293
9.15a Perception of Respondents regarding their company’s position in the e-HRM journey today vs ‘after five years’ – Services group
294
9.15b Perception of Respondents regarding their company’s position in the e-HRM journey today vs ‘after five years’ – Manufacturing group
295

12
TABLE TABLE TABLE TABLE
NO.NO.NO.NO. TITLETITLETITLETITLE PAGE PAGE PAGE PAGE
NO.NO.NO.NO.
9.15c Perception of Respondents regarding their company’s position in the e-HRM journey today vs ‘after five years’ – MNC group
295
9.15d Perception of Respondents regarding their company’s position in the e-HRM journey today vs ‘after five years’ – Non-MNC group
295
9.16a Barriers to progress in the e-HRM journey: Mean Ranks by Type of Sector (Services/Manufacturing)
296
9.16b Barriers to progress in the e-HRM journey: Mean Rank Order by Type of Sector (Services/Manufacturing) 296
9.16c The top five Barriers for Services vs Manufacturing groups
192
9.17a Barriers to progress in the e-HRM journey: Mean ranks by Type of Company (MNC/Non-MNC)
297
9.17b Barriers to progress in the e-HRM journey: Mean Rank Order by type of Company (MNC/Non-MNC)
297
9.17c The top five Barriers for the MNC vs Non-MNC groups 194
9.18a Barriers to progress in the e-HRM journey -ANOVA (one-way)- Descriptive Statistics
298
9.18b Barriers to progress in the e-HRM journey -ANOVA 300
9.19 Expectation of respondents w.r.t. e-HRM being successful in satisfying employees in their HR needs- Services vs Manufacturing
301
9.20 Expectation of respondents w.r.t. e-HRM being successful in satisfying employees in their HR needs- MNC vs Non-MNC
301
9.21 Expectation of respondents w.r.t. the benefits from e-HRM justifying the expenditure on the same- Services vs Manufacturing
301
9.22 Expectation of respondents w.r.t the benefits from e-HRM justifying the expenditure on the same- MNC vs Non-MNC
301
9.23 Opinion of respondents on various aspects of the e-HRM functioning - Mean Ratings by Type of Sector (Services/Manufacturing)
302
9.24 Opinion of respondents on various aspects of the e-HRM functioning - Mean Ratings by Type of Company (MNC/Non-MNC)
303
9.25 Opinion of respondents on various aspects of the e-HRM functioning - (all groups)
304

13
LIST OF FIGURESLIST OF FIGURESLIST OF FIGURESLIST OF FIGURES
FIGURE FIGURE FIGURE FIGURE
NO.NO.NO.NO. TITLETITLETITLETITLE PAGE PAGE PAGE PAGE
NO.NO.NO.NO.
4.1 Survey Process Chart 68
5.1 Technology and Industrial Revolution 80
5.2 Functional subsystems in an MIS used by a manufacturing concern
81
5.3 Relation of activities to functional subsystems 82
5.4 Organizational Behaviour and MIS 83
5.5 The key features of HRIS 84
5.6 HRIS Acquisition Phases 85
5.7 An Employee Record System 87
5.8 The uses of an HRIS system (by sub-system) 91
5.9 HRIS Objectives 92
5.10 A Generic HRIS Model 93
5.11 HRIS support the strategic, tactical and operational use of the human resources of an organization
95
6.1 HR Processes covered by e-HRM - A broad Overview 98 6.2 Confirmation with Appraisal- automatic initiation 100
6.3 The e-Recruitment System 102
6.4 Training System 103 6.5 Self Appraisal System 105
6.6 Performance Management System 106 6.7 The Outputs of a Performance Management System 107
6.8 Resource Management 110
6.9 ESS- A Bird’s Eye View 113 6.10 HR Services under ESS and MSS 115
6.11 Sample self service flowcharts 116 7.1 Transformation of HR to HCM in Business 123
7.2 Cedar Crestone model of HCM Excellence for organizations having an ERP-based HRMS as their foundation
133
7.3 Vendors - Administrative and Service Delivery 137 7.4 Vendors- Strategic and Measurement Applications 139
7.5 Organizational Support for Web 2.0 Technologies - Asia Pacific
144
7.6 Vendors - Administrative and Service Delivery - Asia Pacific
146

14
FIGURE FIGURE FIGURE FIGURE
NO.NO.NO.NO. TITLETITLETITLETITLE
PAGE PAGE PAGE PAGE
NO.NO.NO.NO.
8.1 IDBI Bank’s e-HR process flow- A Sampler 162 8.2 GSKCH (India) HRIS Model 165 9 Opinion of respondents on various aspects of e-HRM -
9.1 The e-recruitment process operates with the need to match employee profile with positions vacant in the organization
203
9.2 The pay structure has been clearly defined in the e-HRM system
205
9.3 The e-HRM process has enabled employees to enroll for flexible benefits administration effectively
206
9.4 The e-HRM process has been effective in providing clear role definitions
208
9.5 The employees have been provided with necessary resources and sufficient training to be able to use e- HRM technology
210
9.6 The e-HRM system has increased employee commitment with the organization by boosting their motivation and confidence levels
211
9.7 E-HRM technology is compatible with other systems in use
213
9.8 The e-HRM system is user friendly 214 9.9 The e-HRM system provides up-to-date information 215
9.10 E-HRM has been an effective change agent for positively molding the employees' attitudes towards the use of technology
216

15
LIST OF ABBREVIATIONSLIST OF ABBREVIATIONSLIST OF ABBREVIATIONSLIST OF ABBREVIATIONS
ANZ Australia/ New Zealand
APAC Asia Pacific
APPLECART
Advanced Payroll Processing & Live Employee Career management, Appraisal, Recruitment and Training
B2E Business to employee
BPCL Bharat Petroleum and Chemicals Limited
BPO Business Process Outsourcing
CBT Computer Based Training
CEO Chief Executive Officer
CHRIS Computerized Human Resource Information Systems
CIO Chief Information Officer
CRP Conference Room Piloting
DSS Decision Support System
EDP Electronic Data Processing
e-HR Electronic-Human Resources
e-HRM Electronic-Human Resource Management
EMS Employee Management System
e-Recruitment Electronic-Recruitment
e-Retirement Electronic-Retirement
ERP Enterprise Resource Planning
ESOPS Employee Stock Options
ESS Employee Self Service
EU European Union
FMCG Fast Moving Consumer Goods
FTE Full-time-equivalent
GSKCH Glaxo Smithkline Consumer Healthcare Limited

16
List of Abbreviations continuedList of Abbreviations continuedList of Abbreviations continuedList of Abbreviations continued HCM Human Capital Management
HR Human Resources
HRIS Human Resource Information Systems
HRM Human Resource Management
HRMIS Human Resource Management Information Systems
HRMS Human Resource Management Systems
ICICI Industrial Credit and Investment Corporation of India
IDBI Industrial Development Bank of India
IHIRM International Association for Human Resource Information Management
IOC Indian Oil Corporation
IS Information Systems
IT Information Technology
ITES Information Technology Enabled Services
KM Knowledge Management
L&T Larsen & Toubro
MIS Management Information Systems
MNC Multinational Company
MSS Management Self Service
ONGC Oil and Natural Gas Company
P&G Proctor & Gamble
SaaS Software as a Service
SAP Systems Application Provider
SME Small Manufacturing Enterprises
SSAD Structured System Analysis and Design
TCS Tata Consultancy Services
TESCO Tata Electric Supply Company
TS Technology Services

17
EEEEXECUTIVE XECUTIVE XECUTIVE XECUTIVE
SSSSUMMARYUMMARYUMMARYUMMARY

18
EXECUTIVE SUMMARYEXECUTIVE SUMMARYEXECUTIVE SUMMARYEXECUTIVE SUMMARY
The managers of 21st century envision that Information Systems will
have a major influence on their style of decision making and their
management style will be highly innovative and personalized. They
will have the ability to extensively browse through large databases for
specific data and also to manipulate the same at own will. Their
paperless office will be highly automated for routine office activities
e.g. resource booking, meeting scheduling. Also, they will be truly
online executives who use computers as tools for improving their
personal productivity.
The objective of this research is to trace the emergence of e-HRM
(electronic- Human Resource Management) in the global arena as well
as in the Indian scenario; to identify the underlying factors and pre-
requisites for the success of an e-HRM venture; to identify the
challenges associated with the implementation and maintenance of e-
HRM systems and to offer recommendations and suggestions for
enhancing the effectiveness of e-HRM systems.
The study is confined to the state of Maharashtra and a sample size of
1000 companies due to cost and time constraints. For purposes of
comparison a broad classification of companies into Services sector
vs Manufacturing sector and also into MNC (Multinational company)
vs Non-MNC has been considered. The research instruments used are
questionnaire and interviews. Appropriate Statistical tools including
19
Chi-Square Test, t-test, ANOVA wherever applicable have been
applied to draw logical conclusions from the data.
The broad framework of the research design incorporates aspects
pertaining to- the possible drivers for introducing e-technology to
the HR systems, the barriers to progress in the e-HRM journey, usage
of e-technology for the various HR functions, usage of HR Service
delivery tools like ESS and MSS, nature of sourcing solutions adopted
by companies for enabling e-technology to HR systems, perception of
respondents on a five-point scale regarding their company’s position
in the e-HRM journey, expectation of respondents w.r.t. e-HRM
system being successful in satisfying employees in their HR needs,
expectation of respondents w.r.t. the benefits from e-HRM justifying
the expenditure incurred on the same and opinion of respondents on
various aspects of the e-HRM functioning.
Implementation of e-HRM involves several challenges with its
attendant implications like - huge set-up costs to support a robust
tech-infrastructure and limitations in mapping all physical HR
processes into e-HRM process, focus on aggressive timelines in
project execution may create conflicts between the process
ownership by HR and IT departments, etc. E-HRM presupposes the
presence of an IT culture as well as a culture of Knowledge
management (KM), with the Human Resource as a process owner,
being clear about the objectives of e-HR and the implementation plan
e.g. defining the milestones for implementation, selection of
implementation partners, a commitment which involves spending

20
long hours, training employees on the optimal use of the portal, etc.
The set-up costs as well as maintenance seem to be one of the
biggest challenges of e-HRM. Costs tend to be proportional to
requirements and the type of organization.
Another important concern is the security of the information
generated through the e-HRM system. Companies have to protect
themselves against the seepage of confidential information and the
subsequent misuse of data. Managing the huge amount of data
generated through Human Resource Management Systems (HRMS) is
a relatively new challenge for companies.
Another challenge is the avoidance of ‘overkill’ and loss of the
‘human touch’. The human side should not be neglected in a bid to be
techno-savvy. E-HRM is more so a challenge for the traditional
companies which need to bring about a change in the mindsets to a
large extent. These companies as compared to those in the IT sector,
BPOs etc. are having a tougher time getting people to speed up on
these HR tools.
Most of the packages are of international standards and based on
best practices. These packages need to be customized as per Indian
Standards in order to make them user-friendly for Indian users. This
customization needs to be taken up in the right perspective. Training
the users is many a time a long drawn out process, as many people
do not find them to be user friendly. Continuous monitoring and

21
feedback are critical for the success of any e-HRM effort in an
organization.
Communicating the value of investment in employee compensation,
health insurance, pension plans and other benefits is crucial for
engaging and motivating employees. It is also advantageous to
separate out Human Resource administration from more strategic
work and standardize and centralize this activity in an in-house
Human Resource service center.
In addition, one has to ensure long term value of the new technology
so that it does not become obsolete by the time it is implemented.
With the introduction of technology into virtually every HR process,
organizations are capturing thousands of pieces of potentially useful
employee information every day. However, this data can be useless
unless data mining tools are used to put the information to work. Data
mining tools use regression and other analytic techniques to discover
and report correlations and trends among sets of data.
Investment in Portal technology is another important area which
needs a careful analysis and prioritization of resources. Two crucial
investments in this area which could be taken up on priority basis are
Personalization and Smart Search. E-learning is increasingly being
used by employers to complement more traditional training methods.
While increasingly sophisticated are now available, employers are
now designing e-learning resources on the basis of what should be
implemented.

22
Any e-HRM installation exercise if taken up in the right perspective,
keeping all the challenges in mind can take an organization a long
way towards success. In companies, which have successfully tackled
these challenges, e-HRM has made life easier for employees. It leaves
Human Resource professionals with more time to focus on strategic
tasks and manage better the company’s most important resource- its
people.

23
CHAPTER CHAPTER CHAPTER CHAPTER 1111
INTRODUCTIONINTRODUCTIONINTRODUCTIONINTRODUCTION
24
CHAPTER 1
INTRODUCTIONINTRODUCTIONINTRODUCTIONINTRODUCTION
1.11.11.11.1 Changing role of the Personnel DepartmentChanging role of the Personnel DepartmentChanging role of the Personnel DepartmentChanging role of the Personnel Department
Over the past decades the role of the personnel department has been
transformed from that of an administrator to more recently a critical
component in the competitive success of the business. When Human
Resources (the Personnel Department) first began to surface as a
function in business, executives and other decision makers were
focused on tangible goods and financial resources. Human
Resources role was to support back-office functions, mainly
legislation requirements, payroll, and personnel data maintenance.
Today, however, every Chief Executive Officer (CEO) speaks of the
people behind the corporation’s success. In fact, many corporations
brand their workforce as part of their marketing campaigns to attract
not only the right talent, but also to attract business and consumer
buyers. Savvy executives understand that, in a tighter, tougher, less
predictable economic climate, they have to take maximum advantage
of the skills and expertise available in the existing employee pool.
During these past few years, corporations have begun to embrace a
“human capital approach,” one that considers the money spent on
fostering innovation in the workforce as an investment. As with any
asset, by nurturing, protecting, and growing this investment,
organizations that align workforce strategies with business goals and

25
objectives will benefit from capturing and focusing the attention of
the workforce. Just as the role of Human Resources continues to
change, technology has continued to evolve. If the role of Human
Resources has always been to deliver the workforce support and
management based on the needs of the business, then technology’s
role has been that of an enabler.
Over the past years, Human Resources processes and procedures
have been supported by everything from complicated file-folder
systems to automation, going from usage of multiple systems and
databases to a single version of the truth with comprehensive Human
Resource Management Systems (HRMS).
Now companies are not only leveraging technology to support the
function of the HR department, but they are also leveraging human
capital technologies for use by everyone in the business.
Consequently, human resources as a function has evolved into
human capital management (HCM). Where HR was the responsibility
of a centralized, or sometimes decentralized, department, HCM is the
job of everyone in the business, from employees to executives.
1.1.1.1.2222 Understanding e Understanding e Understanding e Understanding e----HRMHRMHRMHRM
1.1.1.1.2222.1 Meaning.1 Meaning.1 Meaning.1 Meaning and Definition of e and Definition of e and Definition of e and Definition of e----HRMHRMHRMHRM
People mean different things by the term “e-HRM”. It is a web-based
solution that takes advantage of the latest web application technology
to deliver an online real-time Human Resource Management Solution.

26
It is comprehensive but easy to use, feature-rich yet flexible enough
to be tailored to one’s specific needs. It also refers to the processing
and transmission of digitized information used in HRM, including text,
sound, and visual images, from one computer or electronic device to
another. It will be able to meet the demands of today's Human
Resource Management.
Typically, the term e-HRM is used to describe technology’s role in
enabling the transformation of solely HR activity. Instead of a
centralized personnel team handling everyday tasks such as
approving pay rises, sorting out training and checking holiday
entitlements, these can be handled by the employees themselves or
their line manager. Crucially, the adoption of e-HRM seeks to
minimize or eliminate intervention from HR staff, allowing managers
and employees to perform HR tasks directly with the self service
tools. These can contrast with the shared service center environment,
where the service would normally be expected to be delivered by a
customer service operative or other category of HR staff.
Before starting to define e-HRM, it is also important to identify terms
that possibly carry similar meanings to the term e-HRM, Wright and
Dyer (2000). In addition to e-HR and e-HRM terms are used such as
virtual HRM, HR intranet, web-based HR, computer based human
resource information systems (CHRIS) and HR portals. We are
excluding HR information systems (HRIS), since there is a
fundamental difference between HRIS and e-HR in that basically HRIS
are directed towards the HR department itself. Users of these systems

27
are mainly HR staff. These types of systems aim to improve the
processes within the HR department itself, in order to improve the
service towards the business. With e-HRM, the target group is not
only the HR staff but people outside this department: the employees
and management. HRM services are being offered through an internet
for use by employees. The difference between HRIS and e-HRM can
be identified as the switch from the automation of HR services
towards technological support of information on HR services.
Technically speaking it can be said that e-HRM is the technical
unlocking of HRIS for all employees of an organization.
E-HRM as defined by Kettley P and Reilly P (2003), is a Computerized
Human Resource Information System (CHRIS) and consists of “a fully
integrated, organization-wide network of HR related data, information,
services, databases, tools and transactions.” Such a system can be
described as e-HR, meaning the application of conventional, web and
voice technologies to improve the HR administration, transactions
and process performance.
As stated by Ernst Biesalski “Electronic-Human Resource
Management (E-HRM) is a web based tool to automate and support
HR processes. The implementation of e-HRM is an opportunity to
delegate the data entry to the employees. E-HRM facilitates the usage
of HR market places (e-recruitment) and offers more self-service to
the employees. EHRM is a collection of many different technologies.”

28
Mary Gowan has defined Electronic Human Resource Management
System (E-HRM System) as a web-based solution that takes
advantage of the latest web application technology to deliver an
online real-time human resource management solution. It is
comprehensive but easy to use, feature-rich yet flexible enough to be
tailored to one’s specific needs.
Broderick and Boudreau (1992) defined Human Resource Information
Systems (HRIS) as the “composite to data basis computer
applications and hardware and software that are used to collect or
record, store, manage, deliver, present and manipulate data for
human resources.” According to Ruel, Bondarouk and Looise (2004),
“e-HRM is a way of implementing HR strategies, policies, and
practices in organizations through a conscious and directed support
of and/or with the full use of web-technology-based channels.”
1.1.1.1.2222.2 Nature.2 Nature.2 Nature.2 Nature and Scope of e and Scope of e and Scope of e and Scope of e----HRMHRMHRMHRM
E-HRM is designed to achieve the following objectives- to offer an
adequate, comprehensive and on-going information system about
people and jobs at a reasonable cost; to provide support for future
planning and also for policy formulations; to facilitate monitoring of
human resources demand and supply imbalances; to automate
employee related information; to enable faster response to employee
related services and faster HR related decisions and to offer data
security and personal privacy.

29
The scope of e-HRM can be said to encompass- a decisive step
towards a paperless office; higher speed of retrieval and processing
of data; increased access to HR data and ease in classifying and
reclassifying data; collection of information as the basis for
improving the strategic orientation of HRM; more consistent and
higher accuracy of information/report generated; fast response to
answer queries; a higher internal profile for HR leading to better work
culture; establishing of streamlined, standardized and systematic
procedures; more transparency in the system; cost savings
achievable through process improvements and due to reduction in
duplication of efforts; significant reduction of administrative burden;
adaptability to any client and facilitating management; Integral
support for the management of human resources and all other basic
and support processes within the company and a more dynamic
workflow in the business process, productivity and employee
satisfaction.
E-HRM pervades through each and every function of HR: -- Resource
Management, Compensation and Reward Management, Performance
Management, Training and Development, Employee Relations
Wright and Dyer (2000) distinguish three areas of HRM where
organizations can choose to ‘offer’ HR services face-to-face or
through an electronic means: transactional HRM, traditional HRM, and
transformational HRM. Lepak and Snell (1998) make a similar
distinction, namely operational HRM, relational HRM and
transformational HRM.

30
The first area, operational HRM, concerns the basic HR activities in
the administrative area. One could think of salary administration
(payroll) and personnel data administration. The second area,
relational HRM, concerns more advanced HRM activities. The
emphasis here is not on administering, but on HR tools that support
basic business processes such as recruiting and the selection of new
personnel, training, performance management and appraisal, and
rewards. Transformational HRM, the third area concerns HRM
activities with a strategic character. Here we are talking about
activities regarding organizational change processes, strategic re-
orientation, strategic competence management, and strategic
knowledge management.
The areas mentioned could also be considered as types of HRM that
can be observed in practice. The operational type of HRM provides
the choice between asking employees to keep their own personal data
up-to-date through an HR website or to have an administrative force
in place to do this. For relational HRM there is the choice between
supporting recruitment and selection through a web-based
application or using a paper-based approach (through
advertisements, paper-based application forms and letters etc.)
Finally, in terms of transformational HRM, it is possible to create a
change-ready workforce through an integrated set of web-based tools
that enables the workforce to develop in line with the company’s
strategic choices or to have paper-based materials. In cases where an
organization consciously and in a focused way chooses to put in

31
place web technology for HRM purposes, based upon the idea that
management and employees should play an active role in carrying out
HR work, we can speak of e-HRM.
1.1.1.1.2222.3 Benefits.3 Benefits.3 Benefits.3 Benefits of e of e of e of e----HRMHRMHRMHRM
The main benefits of e-HRM are an increase of quality and pace,
because the existing administrative processes were slow and
inefficient conditional upon mainly paper-based processes.
StandardizationStandardizationStandardizationStandardization:::: By standardizing the system used within the
group and by providing employees with direct access to records,
particularly leave records, the company can achieve a significant
reduction in employee queries and reduce the need for HR to
undertake data entry of employee records.
Ease of recruitment, selection and assessmentEase of recruitment, selection and assessmentEase of recruitment, selection and assessmentEase of recruitment, selection and assessment:::: With e-
recruitment the company gets an additional possibility besides the
normal application by paper to recruit people over the web in an
online-application process. Although this, and like processes, will
always need significant human intervention. E-HRM systems can
streamline the process and reduce errors.
Ease of administering employee recordsEase of administering employee recordsEase of administering employee recordsEase of administering employee records:::: Whether be it leaves,
benefits, personal details, accident and discipline reports, etc., it is
generally accepted that once everyone can overcome the initial IT
phobia, HR and employees will experience fewer headaches and
efficiency will rapidly increase.

32
Reductions Reductions Reductions Reductions inininin cost, time an cost, time an cost, time an cost, time and labor:d labor:d labor:d labor: Reduced duplication,
reduced time spent fixing errors, reduced labor costs through ESS,
reduced or no hard-copy entry. Not only manpower can be saved, the
processing time can also be shortened. With this e-HRM reaches the
prime objective of cost effectiveness.
Access to ESS training enrolment and self development: e-
Training can enable employees to search for and enroll in training
programs on-line and validating course availability. This can
streamline the training administration process enabling employees to
access computer based training. Cost and pace can be individualized
as well.
Cost and ESS:Cost and ESS:Cost and ESS:Cost and ESS: ESS reduces the workload of HR department
substantially, for instance in the traditional method the employee has
to type in a formal leave application get approved from his/her direct
boss who will send it to the HR department for further approval. On
the other hand, with e-leave, the employee needs only to log in and
make his/her leave application and his/her boss will be alerted to
approve. Upon approval the leave balance is automatically updated.
Location and timeliness:Location and timeliness:Location and timeliness:Location and timeliness: With ESS, the employee could log in
online anywhere and anytime without being in the office and without
the leave card could be sitting at the boss’ Table for a few days, lost
or buried.

33
1.31.31.31.3 Standalone Institution Software Vs Full Fledged ERP Standalone Institution Software Vs Full Fledged ERP Standalone Institution Software Vs Full Fledged ERP Standalone Institution Software Vs Full Fledged ERP
SoftwareSoftwareSoftwareSoftware---- A Comparison A Comparison A Comparison A Comparison
TableTableTableTable 1.1 1.1 1.1 1.1
Comparison between Standalone Institution Software and Full Fledged Comparison between Standalone Institution Software and Full Fledged Comparison between Standalone Institution Software and Full Fledged Comparison between Standalone Institution Software and Full Fledged
ERP SoftwareERP SoftwareERP SoftwareERP Software
SlSlSlSl....
No. No. No. No. Stand Stand Stand Stand alone alone alone alone Institution SoftwareInstitution SoftwareInstitution SoftwareInstitution Software Institutional Institutional Institutional Institutional ERPERPERPERP
1. Redundancy of data entry No redundancy
2. Ambiguity of information as different S/W may show different values for same thing.
No ambiguity as the data is served from central location. Same logic of processing keeps away any such ambiguity.
3.
No inter module communication. For example there will be no way for the library software to know if the caution money for the library is collected at fee counter for a particular student.
ERP systems are specially designed for inter module information sharing. Since all modules use the same database and business logic all the modules can interact with each other seamlessly.
4.
Data security is generally an issue with stand alone software as the data base is directly accessible by the users. There are always chances for accidental or deliberate loss of data.
Generally the data is only accessible only through the software interface in a controlled manner. The server is not in direct access of the users, so critical information is always intact.
5. Central backup for the entire system is not possible.
Backup can be managed centrally with a great ease.
6.
Different approach and interfacing for different modules.
Generally similar interfacing approach for all modules. Makes it easy for the top level management to interact.
7. Physical movement of data is required for reporting.
Multiple access point can eliminate physical movement of reports and other data.
8. The dependency level even for routine information is higher in stand alone applications.
Routine information issues are generally available with required users without dependency.
9 No possibility for developing a common business logic.
Runs on common business logic for the institution.
10. Easy to implement. The implementation period is a bit lengthy.
11.
Low initial investment but higher recurring expenditure in terms of man hours and usage of stationary for sharing routine information.
Comparatively high initial investment but low recurring expenditure in man hours and information sharing throughout the institution.
Source: P. Ramasubramanian & Dr. D. Periasamy, “ERP System in Educational Institution-A Survey”, Indian Journal of Training and Development, 36(1), Jan-March, 2006, p.106.

34
Table 1.1 illustrates the differences between the Stand alone
Institution Software and an Institutional ERP. Through ERP it is now
possible to do away with the need for the standalone computer
systems in different departments and have a single unified software
program divided into software modules that enable a total systems
integration which proves to be much more useful and logical. This
linking together of different entities ensures that someone in HR can
look into the Production software to find out the details of the
recommended incentives.
Companies have the option of installing ERP software as a totally
integrated system spanning all the departments of the organization or
they can opt for individual modules like ERP HR or ERP Marketing or
any other to start with and then gradually encompass the other
departments. Hence companies enjoy a lot of flexibility as far as the
usage of ERP is concerned.
In the area of Human Resources we can right away think of two most
frequently used ERP packages viz. SAP and People Soft. These
packages are highly customizable and can address unique needs of
companies. Around one hundred and fifty companies in India are
currently tuned in to SAP alone. Some prominent names amongst
these are ONGC, Asian Paints, L&T, Cadbury, IOC, BPCL, Grasim,
Essar, TATA, Jet Airways, GM, Eicher, Bajaj, Wipro, Infosys, Siemens,
ICICI, Reliance and many more.
It is evident that in the Human Resources arena the use of IT to web-
enable human resource processes for speed and efficiency is termed

35
as e-HR. Holiday homes, conference rooms, guesthouses etc. can be
booked in a matter of minutes. One can access the names, contact
addresses and numbers of employees across various branch offices
and factories of the company across the country. One can readily get
information about the seminars, workshops, etc. of fellow colleagues
in other locations, and also exchange wishes through e-cards. Latest
updates on the stock prices of group companies and information
about competitors’ moves can be availed of without any delay and
without any painful waiting periods. E-HRM is a blessing in disguise
for companies with scattered operations around the globe with
employees required to interact with one another and the
administration for various reasons. The cumbersome task of handling
huge amount of paperwork manually can be done away with.
As is the case with all new systems and concepts, e-HRM too comes
with its own set of challenges and issues which require a careful
scrutiny before being adopted and launched in any organization.
Some of the critical issues and challenges in this context are Cost
Implications, Presence of an IT Culture and a Culture of Knowledge
Management in the client organization, Security of the Information
generated, Training the users and Continuous Monitoring and
Feedback.

36
CHAPTER CHAPTER CHAPTER CHAPTER 2222
REVIEREVIEREVIEREVIEW OF LITERATURE W OF LITERATURE W OF LITERATURE W OF LITERATURE

37
CHAPTER 2CHAPTER 2CHAPTER 2CHAPTER 2
REVIEW OF LITERATURE REVIEW OF LITERATURE REVIEW OF LITERATURE REVIEW OF LITERATURE
Review of literature was a crucial part of the Desk Research done to
gather as much information and data as possible w.r.t. the topic of
research. The Desk Research involved collection and review of data
from various published and unpublished industry reports, journals,
periodicals, books, newspapers, internet, etc.
Human Resource Management, a relatively new term emerged during
1970s. The past thirty –plus decades have been characterized by the
transformation of this role from that of an administrator to, more
recently, a critical component in the competitive success of the
business. In the 1980s and into the 1990s, the role of the personnel
department continued to transform.
According to Beer, Michael, et al. [1985] since the inception of modem
management theory, the terminology used to describe the role and
function of workers has evolved from "personnel" to "industrial
relations" to "employee relations" to "human resources." While all of
these terms remain in use, "human resources" most accurately
represents the view of workers by contemporary management theory:
as valuable resources managed in the same manner as other valuable
resources.
Greenlaw and Kohl [1986] describe three distinct, interrelated fields of
interest addressed by the HRM discipline: human relations,

38
organization theory, and decision areas. Although the method and
degree to which those areas of interest are handled vary among
different HRM departments, a few general rules characterize the
responsibilities, positioning, and structure of most HRM divisions.
In the 1990s several forces were shaping the broad field of HRM and
the key force was that the new technologies—particularly information
technology—brought about the decentralization of communications
and the shake-up of existing paradigms of human interaction and
organizational theory. Satellite communications, computers and
networking systems, fax machines, and other devices were facilitating
rapid change.
According to Broderick & Boudreau [1992], over the years Human
Resource Systems have been acknowledged as important inputs of
corporate decisions making process. Operational and strategic
business objectives are now not being considered in isolation of HR
objectives. Hence, Human Resource Systems are now enterprise-wide
decision support systems. Traditionally, e-HRM is considered as
automated record keeping of employees and computerization of their
payroll. However, it is now well established that HR managers with
information systems can play a greater role beyond their
administrative role.
Scarpello et al [1995] posit four factors, the "four Cs," that should be
used to determine whether or not an HRM department or individual
program is succeeding: commitment, competence, cost-
effectiveness, and congruence. Revenues and costs per employee,

39
when compared to related industry norms, can provide insight into
HRM effectiveness.
In the opinion of Noe, Hollenbeck, Gerhart and Wright [2000] ‘HR
functions can become critical partners in driving success, but to do
so requires that HR changes its focus, its role, and its delivery
systems’. Electronic human resource management (e-HRM) refers to
the processing and transmission of digitized information used in
HRM, including text, sound, and visual images, from one computer to
another electronic device. E-HRM has the potential to change all
traditional human resource management functions. Employees do not
have to be in the same geographic areas to work together.
Use of the internet lets companies search for talent without
geographic limitations. Recruiting can include online job postings,
applications, and candidate screening from the company’s website or
the websites of companies that specialize in online recruiting, such as
monster.com or hotjobs.com. Employees from different geographical
locations can all receive the same training over the company’s
intranet. It also can increase the speed with which employees can
bring a product to market by facilitating communications between
employees on virtual teams using internet discussion forums, video
and audio-conferencing, and global-scheduling.
According to Mark Doughty and Simon Pugh [2000] - today, within
the HR software market there are a myriad of HR systems, payroll,
training administration, 360 degree feedback, psychological testing

40
and competency software tools-typically operating in their own
software fiefdoms. Evidence suggests that most organizations fail to
recognize that nearly all HR software on the market today is at the
foundation level of e-HR. “very few organizations have reached the
strategic level of e-HR.” This involves the development and
deployment of tasks that allow managers, employees and HR to use
the massive amount of data created and housed within the foundation
and service levels of emerging internet technology.
The human resource management function has changed dramatically
over time evolving. Alfred J Walker [2001] asserts that if HR
technology is to be considered successful, it must change the work
performed by the Human Resources personnel by dramatically
improving their level of service, allowing more time for work of higher
value, and reducing their costs. Many systems have been
implemented by cutting HR staff, outsourcing and imposing
technology on what was left. But Walker argues that survey results
demonstrate that overall HR departments have actually upward their
staffing levels over the past decade to do the same work.
Walker advocates the business process re-engineering the HR
function first, then e-engineering the HR work. He suggests the
formation of re-engineering teams of providers, customers and users
to examine the whole range of HR activities including those which are
not being done at present. The end product is a set of processes
organized into broad groupings such as re-sourcing, compensation
or training and development. These processes should then be

41
examined by the re-engineering team and re-designed. From this
redesign comes the picture of a new HR function but Walker argues
that the most effective approach is to introduce new technology to
deal with the redesigned processes.
Gordon B. Davis and Margrethe H. Olson [2002] define the scope or
domain of management information systems as comprising of a
decision support system (DSS) and a knowledge work support
system. That part of the information system designed to support
organizational operations is an operational support system, the part
designed to support decision making is a decision support system
(DSS) and the part that supports knowledge work is a knowledge
work support system. The information system concept is also broad
enough to include information processing support for office work
(office automation). A large proportion of employees are “knowledge
workers”; their duties involve the production and use of information
outputs- documents, reports, analyses, plans, etc. Today,
computerized processing of transaction data is a routine activity of
large organizations.
As compared to a data processing system a management information
system is more comprehensive; encompasses processing in support
of a wider range of organizational functions and management
processes. A Management Information Systems (MIS) orientation
means users have access to decision models and methods for
querying the database on an ad hoc basis.

42
According to Biswanath Ghosh [2002], in an organization the most
valuable input is the human element. The success or failure of an
organization depends to a large extent on the persons who manage
and run the organization. In business the greatest asset is the human
resource of the enterprise and not the plant, equipment or the big
buildings it owns. There was a time when manpower was considered
as a cost factor but now it is recognized as an investment. The e-HRM
can range from basic personnel records to sophisticated networks of
sub-systems with definite purposes. Today most of these will be
computer systems. The manpower information system can provide
necessary information in a form which can be integrated with any
other business data. With most data base systems, there are facilities
to pull out any of the data and present them in the required form.
According to S.A. Kelkar [2003], the main activities of Human
Resources Management where Information systems can be applicable
are Employee records and management, Recruitment & promotion,
Training, Job rotation, Succession planning, Employee stock options,
Evaluation, Compensation and benefits management. Information
Systems also facilitate – Groupware, Document control,
Brainstorming, Collaborative work, Work flow automation. It can
definitely be said that Integrated system better than dispersed
systems. Enterprise Resources Planning Systems consider systems
approach to enterprise and help in planning/ running all business
functions. ERP systems support Supply Chain Management systems.
Being complex, ERP systems need tuning to fit an organization’s

43
requirements and their Installation and testing requires assistance
from experts. Some popular packages used include: SAP, BAAN,
Oracle, PeopleSoft, JD Edwards.
According to L.M.Prasad [2003] the concept of computerized HRIS is
derived “as an organized method of providing information about
human resources, their functioning, external factors relevant to
managing human resources.” Large organizations generally install e-
HR because it enables them to collect store, process and manipulate
large amount of data inputs, reduce costs of maintaining human
resource data, and provide accurate information about human
resources anytime and anywhere. In a computerized HRIS various
subsystems are interlinked and the outcomes of all the systems are
kept in the form of human resource inventory. Whenever a change
takes place in any respect of an employee such a change is
incorporated in the computer input.
E-appraisal and e-recruitment are two of e-HR’s latest trends, more
out of convenience than pure need: “managing of appraisal forms and
resumes are one of the biggest headaches for HR practitioners and
managers. Something like e-leave, on the other hand is already
history”, said Jan Wong [2003], business development manager at
Prosoft. As a more general trend however, Wong suggests that any e-
HR usually reaps quick benefits, including a paperless and more
efficient working day for many HR professionals: “as organizations
become more e-HR savvy, they are beginning to see the benefits
almost immediately.”

44
In the opinion of Michael Armstrong [2003] “the e-HR provides the
information required to manage HR processes.” These may be core
employee database and payroll systems but can be extended to
include such systems as recruitment, e-learning, performance
management and reward. The system may be web-based, enabling
access to be remote or online and at any time. The information
provided by the e-HR process can be communicated across
organizations. If posts static data such as information on HR policies
and communications about employer facilities such as learning
opportunities and flexible benefits. It can include links that enable
managers and other employees to interface directly with HR
applications and make changes or enquiries.
According to Ketlley P, and Reilly P [2003], technology has only
recently developed in a way that enables e-HRM to make its mark,
especially the introduction of corporate intranets and web-enabled
HRIS. The nature of the development path, however, varies
considerably from organization to organization. Before embarking on
e-HRM, organizations should review and optimize their business
processes. This may be a case of major process redesign, or a more
tactical exercise tackling areas of concern. Following a process
review, a common next step is to introduce a form of self service. This
is likely to involve employee self service, where staff can access their
personal record and update it or add new information. Manager self
service is usually a logical development, allowing the sign-off of
various decisions or proposals. Redesigning the HR function will

45
impact on the roles and skills of HR staff. There will be many areas of
up skilling as the move away from transactional work gathers pace.
This will stretch the capability of staff, not just in terms of
technological facility but also in customer and relationship skills.
The development of e-HRM systems is growing, allowing the HR
function to become more strategic. This can most easily be observed
by the fact that today employees tend to ask for advice rather than
administrative assistance. This is the reverse of the situation in the
late 90s. Furthermore, the nature of HR departments has changed
because of the development of e-HRM. A few years ago businesses
tended to have more, but less qualified HR staff whereas today the
reverse applies said Hun Nam Chung [2003] “today’s trend is
adopting measurement-based management with emphasis on
organizational objectives and performance metrics, e-HRM solutions
that provide such features along with best practices should be able to
deliver results. Once this HR infrastructure is put in place, you may
embrace virtual work place initiative to support the increasingly
dynamic and mobile workforce”.
S. Sadagopalan [2004] observes that Information systems to support
the personnel function have once again taken the record keeping view
rather than the decision support view. Particularly in the Indian
context, it is limited to creating large databases often of questionable
value and accuracy. Several agencies in the government sector do
overlapping functions of collecting the same data. Slowly this trend is
changing at least in more enlightened companies. Decision support

46
systems that use the database of personnel information to make
quick estimates of manpower cost, plan future manpower, plan
effective manpower deployment, plan training needs etc. are slowly
getting implemented. Exciting ideas like the creation of multimedia
databases like personal records that incorporate signatures and
pictures are being introduced to provide effective decision support
capability.
Decision Support systems are systems that support decision making
using flexible access to data and models for use by end users; the
systems should provide flexible interfaces to support non-routine,
unstructured decisions often involving uncertain decision situations
and multiple objectives with provision for incorporating the decision
maker’s individual style of decision making. The distinguishing
feature of these systems is their synthesis of data and models in a
flexible manner.
Laudon and Laudon [2004] explore the digital integration of the firm
and the use of internet technology to digitally enable business
processes for electronic business and electronic commerce. They
focus on new applications and technologies that improve firms’
relationships with customers and create additional value through
closer collaboration with suppliers and other business partners.
Talking of Human Resource Information Systems they say that HRIS
maintain employee records; track employee skills, job performance,
and training; and support planning for employee compensation and

47
career development. Strategic –level human resources systems
identify the manpower requirements (skills, educational levels, types
of positions, number of positions, and cost) for meeting the firm’s
long term business plans. At the management level, human resources
systems help managers monitor and analyze the recruitment,
allocation and compensation of employees. Knowledge systems for
human resources support analysis activities related to job design,
training and the modeling of employee career paths and reporting
relationships. Human resources operational systems track the
recruitment and placement of the firm’s employees.
Gupta and Chhabra [2004] introduce the Human Resource
Management function as a system composed of various sub-systems
and strategies, the strategic role of information in Human Resource
Management and technology related issues. They describe the
various subsystems of Human Resource Information Systems (HRIS)
namely compensation Management, relationship management,
training and development, Human Resource Planning and analysis
and reporting issues and brings to light the contemporary issues in
Human Resource Information Systems and its adoption in India.
The advantages of Human Resource Information Systems can be
identified as Reduced Clerical Effort, Risk Management, Training
Management, Financial Planning, Flexible Benefits, Attendance
Reporting and Analysis, and Employee Equity Reporting. The twin
objectives of any Human Resource Information Systems can be
understood as- Operational Efficiency and Effective Managerial

48
Decision Making. Of the various recognized forms of HRIS, the four
common forms are – Concentrated, Distributed, Independent and
Hybrid. The choice of the type of HRIS depends upon the-HR strategy
and level of computerization in an organization.
C.S.V. Murthy [2004] describes Modules of Management Information
Systems (MIS), MIS tools and Selection; Structured System Analysis
and Design (SSAD) including Tools and Techniques for Systems
Development and Systems implementation; Neural Networks in
Business including Artificial Intelligence’s New Paradigm; Strategic
Grid with the Value Chain Model; the ER Model; Information System
Security.
The Personnel Information System deals with the flow of information
about people working in the organization as well as about future
personnel needs. An integrated set of files is used by all the
personnel administration systems. Some of these are: Employee file,
Job file, Job Applicant’s file, Accident file, Claims and Injuries file.
Leonard Jessup and Joseph Valacich [2004] explore the various kinds
of Information Systems and the innovative techniques by which they
are being used by organizations for their benefit. To manage Human
Resources in a Global Organization several things can be done. First,
it is important to hire individuals who are experienced in working in
cross-cultural teams, who can speak different languages, and who
have the necessary cultural sensitivity to empathize with other
cultures. In addition it is also important to hire the proper Information

49
Systems leader or Chief Information Officer (CIO) with the ability both
to understand the global strategies of the company and at the same
time to collaborate successfully with the regional offices to implement
those global strategies.
The organizational culture needs to be modified to fit the needs of
local employees. Finally, the organization as a whole should also be
extremely sensitive to the various cultural issues and political
problems that exist between people from different countries when
they are involved in cross-cultural Information Systems operations.
Such sensitivity and awareness can be developed through careful and
in-depth research and also by having a diverse mix of employees
representing different cultures.
According to Garry Dessler [2004], technological applications play an
increasingly important role in HR. Technology improves HR
functioning in four main ways: self service, call centers, productivity
improvement and outsourcing. Using internet the firm’s employees
can self-service many of their HR transactions such as updating
personal information and changing benefits allocations. HR internet
and data warehouse provide its managers with desktop access to HR
related information such as “how does turnover in my department
compare to that of other departments”.
Technology also enabled to create a centralized call centre. The
improving productivity through HRIS proves another example. These
days more firms are installing internet and computer-based systems

50
for improving HR productivity. Technology also makes it easier to
outsource HR activities to specialist service providers by enabling
service providers to have real-time, internet-based access to the
employer’s HR database.
Susan Foster, Paul Hawking and Andrew Stein [2004] describe that
the application of the internet to the Human Resource function (e-HR)
combines two elements: one is the use of electronic media whilst the
other is the active participation of employees in the process. These
two elements drive the technology that helps organizations lower
administration costs improve employee communication and
satisfaction, provide real time access to information while at the same
time reducing processing time. This technology holds out the
promise of challenging the past role of HR as one of payroll
processing and manual administrative processes to one where cost
efficiencies can be gained, enabling more time and energy to be
devoted to strategic business issues. The relative quick gains with
low associated risk have prompted many companies to realize what
can be achieved through the implementation of a business to
employee (B2E) model. Employee self service (ESS) a solution based
on the B2E model enables employees to access the corporate human
resource information system 24 hours a day and 7 days a week.
According to Ruel, Bondarouk and Looise [2004], “E-HRM is a way of
implementing HR strategies, policies and practices in organizations
through a conscious and directed support of and/or with the full use
of web-technology based channels.” W.S. Jawadekar [2005] explains

51
all concepts which are used in information systems to make them
more effective. It emphasizes the role of decision support systems in
Management Information Systems (MIS) and explains the factors
behind successful implementation of Management Information
Systems within the organization. Organizational Information is the
information required by a number of personnel, departments and
divisions or the functions in the organization.
Such information can be determined by constructing a matrix of
information versus the user. It asserts that the information entity is
one but its usages are different. For example, the employee
attendance information would be used by the personnel department
for legal compliance of maintaining the muster recommended by the
Factory Inspector. The production manager would use it for
scheduling, rescheduling and loading of the jobs on the shop floor
depending upon the persons present. The corporate planning and
administration will use it for manpower assessment and control and
manpower forecasting.
James A. O’Brien [2005] places a major emphasis on the strategic role
of information technology in providing business professionals with
tools and resources for managing business operations, supporting
decision making, enabling enterprise collaboration and gaining
competitive advantage. Human Resource Information Systems (HRIS)
are designed to support (1) planning to meet the personnel needs of
the business, (2) development of employees to their full potential, and
(3) control of all policies and programs. Originally, businesses used
52
computer based information systems to (1) produce paychecks and
payroll reports, (2) maintain personnel records, and (3) analyze the
use of personnel in business operations. Many firms have gone
beyond these traditional personnel management functions and
developed human resource information systems that also support (1)
recruitment, selection and hiring; (2) job placement; (3) performance
appraisals; (4) employee benefits analysis; (5) training and
development; and (6) health, safety, and security.
Gueutal, Stone and Salas [2005] offer practical advice on e-HR for
human resource professionals by giving an overview of the major
technological trends in e-HR, and demonstrate how to use technology
to enhance organizational effectiveness. They trace the
transformation of human resources from manual processes to
sophisticated CRM and ERP systems and examine the effectiveness
of online strategies for attracting talent. They also offer guidelines
that can help organizations design, deliver, implement and sustain e-
selection systems.
Patricia A. K. Fletcher [2005] states that HR has moved from an
administrative, support function to the heart of strategic management
and the use of technology is the key to that transformation. Fletcher
argues that businesses have to adopt a ‘Human Capital Management’
approach to make the most of any organization’s greatest asset: the
skills, knowledge and experience of its staff. She described how in
the 1990s most large businesses introduced HRIS and that in
continuation with re-engineering; this enabled them to replace

53
antiquated, time-consuming personnel processes with automation.
Fletcher contends that for HR to survive in this brave new world it
needs to “possess a technology” Fletcher instances the creation in
some organizations of chief talent officers on talent acquisition and
retention. These, like some replacements for ‘traditional’ HR
executives may have no direct experience of human resource
management at all. Instead they may have “led a line of business and
have had P&L responsibility, understand what it means to be
accountable for delivering business results.”
Ayesha Farooq and Nazia Khan [2005] outline the steps in
implementing an HRIS. These are: Inception of idea, Feasibility Study,
Selecting a project team, Defining the requirements, Vendor analysis,
Contract negotiations, Training, Tailoring the system, Collecting data,
Testing the system, Starting up, Running in parallel, Maintenance,
Audit.
“E-HR” is often characterized as being purely a technological
solution”, state Martin Reddington, Mark Williamson and Mark
Withers [2005], “but where it is used and implemented effectively it
can be a powerful enabler for broader business change”. In simple
words they say e-HR refers to the automation of some or all of the
current HR processes. The more visionary, advanced interpretations
describe a fully integrated organization-wide electronic network of HR
related data, information, services, databases, tools, applications and
transactions that are generally accessible at any time by employees,
managers and professionals. More basic aspirational interpretations

54
suggest that an organization’s implementation of a new software
package for payroll, or the posting of company policies on the
internet, signals its adoption of e-HRM.
Dr.Aravind.S. & Dr.P.Paramashivaiah [2006] emphasize that human
resource is no longer considered a business requirement; rather it
has distinguished itself as one of the core assets of any organization.
With such a great emphasis on human capital, it is critical for every
organization to resort to means that offer quality recruitment
solutions at competitive costs. This is where the realm of e-
Recruitment starts. The Internet is no longer just a rage; it has now
become a very powerful and effective tool at everybody’s disposal. E-
Recruitment is simply using this tool To Hire the Desired persons.
P. Ramasubramanian & Dr. D. Periasamy [2006] have very vividly
described the differences between the Stand alone Institution
Software and an Institutional Enterprise Resource Planning (ERP)
System. Enterprise Resource Planning Systems are specially
designed for inter module information sharing. Since all modules use
the same database and business logic all the modules can interact
with each other seamlessly. Also, generally the data is only
accessible only through the software interface in a controlled manner.
The server is not in direct access of the users, so critical information
is always intact.

55
As per Watson Wyatt [2006] e-HR refers to the broad access to human
resources data, tools and transactions available directly on the web in
most work places today. It describes the “net effect” of the explosion
in web technologies and the dramatic impact this growth has had on
the way employees now receive employment-related information
through integrated self service applications. It also includes the
variety of new technologies available that help connect multiple
systems, tools and databases, both “inside and outside
organizations”.
The article “New research finds e-HR is top priority for a third of UK
businesses” (http://www.onrec.com/content2/news.asp?ID=1104;
25.01.07) talks about the results of a research announced recently by
Microsoft® Great Plains® Business Solutions wherein it has been
found that in U.K. nearly a third of companies, 30%, now rank e-HR as
their number one e-business initiative. The survey of 500 UK
companies explores the growing interest in the use of new
technology to enhance HR practices and the gap between the demand
for such technology and its current usage in British firms. The
findings point to the UK being on the brink of an e-HR explosion, but
that business change is still critical.
Jeff Sacht [2007] observes that a dramatic change in the employment
law arena is forcing Human Resources (HR) to transform its own
operations, and its strategic role in contributing to the success of
business of all size. Today’s business environment along with the

56
increasing importance of technology requires smart thinking, quick
action and rapid adaptation to constantly changing conditions. The
market place increasingly rewards those who respond to the demand
for innovation driven by the web and internet, technology advances,
globalization, skills shortages, and shifting demographics. This new
business landscape means leaving behind old ways of thinking and
doing. Technological change is a key driver for HR transformation,
providing the foundation to support HR’s growing strategic focus. In
particular, web and internet technologies have already given workers
direct access to each other, to HR, and to business information with
such ease and intelligence that every worker can contribute more
directly to business results.
In the view of K. Aswathappa [2006] people management has traveled
a long way, from purely handling industrial disputes; it grew into
personnel management which matured into human resource
management. Of late, HRM is transforming itself to human capital
management. What is to be underlined is that technology also travels
along with the management of people in organizations. If HR’s role
has been to deliver workforce support and management based on the
needs of the business, the role of technology has been one of
enabler. When HR departments make use of the internet and related
technology is to support their activities, the process becomes e-HRM
(where e-stands for electronic). During the past years, HR processes
and procedures have been supported by everything from complicated

57
file folder systems to automation, going from usage of multiple
systems and data bases to a single version of the whole system.
A.K. Gupta broadly explains Human Resource Management
Information System as a system that supports the planning, control,
co-ordination, administration, and management of an organization’s
human resources. E-HR also includes a large number of subsystems
that address the information needs of various human resource
functions. Since e-HR also facilitate vital information on matters such
as payroll, central and state taxes, health benefits, child care,
grievance procedures and other personal information that affects
employees’ personal and professional lives, it is imperative that these
systems be highly responsive to employee needs.
Although many people believe that e-HR can be used only to enhance
HR decisions, in fact they can be used to cut costs, increase
efficiency, and achieve a competitive edge in the market place. Also
the system links the performance of an individual to items such as
past training, educational background, and work history so that
managers can be better equipped to make such decisions. It is quite
startling that every corner you turn, every page you flip and every
other business call you take, some company or some product has
become e-enabled.
Rob Scott [2008] wonders whether the human resources (HR)
fraternity had been caught napping, or if it had in fact pondered and
debated this fast-growing reality. There is a fair amount of e-HR

58
around. If one would separate the HR function into two broad
components, namely transactional and non-transactional activities,
then it is easy to envisage the transactional components being e-
enabled. In most of the non-transactional HR activities, a continuum
of e-possibilities exists. The conservative point on the continuum
would suggest that no electronic mechanisms should be used to
replace “people” activities, while the radical view on the continuum
would suggest that technology could replace all direct human
interaction with the HR customer. The most public response to this
dilemma is that people cannot be removed from the equation unless
you want to create a cold and uninviting work environment. But this is
the same argument used when computer-based training (CBT) was
rearing its head as an alternative to traditional classroom-based
training. Screams of horror were heard from trainers who argued that
people could not learn via a computer screen. In reality, CBT has
proven itself a very suitable and cost-effective e-method, and as
modern software development tools emerge.
The debate is not around whether the non-transactional activities can
be e-enabled or not- clearly it can be done, and as technologies such
as neuro-networks improve, it will enable more “human” activities to
be done via electronic, internet or mobile technologies. The debate for
HR is whether the human interaction role currently played by HR staff
adds any value to the employee, the organization or the work
environment, which could not be done by technology. The bottom line
is that services such as employee counseling and legal issues, which

59
are definite outsourcing opportunities for organizations, and are likely
to remain mainly human –intensive activities, are not currently
suitable to be e-enabled. It would be a sad day to see a colleague
sending an e-mail request to the ‘performance management
computer’ system for a review on a proposed demotion.
A major finding of the Cedar Crestone Survey [2008-09] is that HR
technologies are increasingly important to business leaders. The first
Cedar Crestone Asia Pacific-APAC HR Systems Survey [2008-2009]
discovered that the number one business initiative for APAC survey
respondents is a focus on metrics and analytics and Self service and
moving to an HR service centre approach enables organizations to
serve more employees with their HR staff.
A Review of Literature in context of e-HRM revealed that a number of
studies have been conducted in the western countries w.r.t. e-HRM
whereas not much evidence is found in the Indian Scenario regarding
the usage and feasibility of the concept. In the existing Indian
literature pertaining to e-HRM the focus is on areas like Payroll and
Recruitments whereas other areas like Career Planning, Succession
Planning have not been covered extensively. No extensive study on
Issues and Challenges of e-HRM Practices in Indian Companies has
been identified.
60
CHAPTER 3CHAPTER 3CHAPTER 3CHAPTER 3
OBJECTIVES OF THE OBJECTIVES OF THE OBJECTIVES OF THE OBJECTIVES OF THE
RESEARCH RESEARCH RESEARCH RESEARCH

61
CHAPTER 3CHAPTER 3CHAPTER 3CHAPTER 3
OBJECTIOBJECTIOBJECTIOBJECTIVES OF THE RESEARCH VES OF THE RESEARCH VES OF THE RESEARCH VES OF THE RESEARCH
3.13.13.13.1 Problem DefinitionProblem DefinitionProblem DefinitionProblem Definition
HR research is undertaken to seek answers to a problem faced by the
organization in HRM which cannot be solved without undertaking
research. Therefore in formulating the research the most important
step is to define the problem clearly and specifically. Practice based
e-HRM started earlier than academic research into e-HRM. Although
the human resource (HR) function was an early adopter of computing
technology, it spent the last decade playing catch-up to other
business functions in terms of integrating information technology (IT)
into their processes. During the nineties, organizations became
experienced in using IT for human resource management (HRM).
As within other business functions, IT has become an important tool
for supporting the processes of the HR function and the HR function
is now closing the gap in terms of applying new IT capabilities to
traditional functions. Distributors of the e-HRM technology promise
several advantages an organization can benefit from when using
these technologies. In practice however, the results mentioned are
often not achieved. As the promises of the vendors of e-HRM
technology are not achieved and the investments to be made in e-
HRM are high, research can be of value for identifying the reasons for
not achieving these promises.

62
Two main approaches for the research into e-HRM can be identified.
These approaches are related to the research fields of Information
Technology and Human Resource Management. As different authors
look with different perspectives into e-HRM, it is hard to capture the
essence of e-HRM - whether it is just an IT tool or a new strategy for
HRM? The primary proposal of any e-HRM solution is to diminish
costs of HR transactions, condense time value and make resources
easily available for utilization, which almost every e-HRM solution
promises to give.
A research framework is designed in order to determine how far the
primary designs of the e-HRM solutions work in an organization. How
well it has established its significance among the employees of such
an organization which makes use of the e-HRM technology. With the
determination of these facts the researcher can come to a conclusion
whether e-HRM technology has achieved the promises made.
3.23.23.23.2 Importance of thImportance of thImportance of thImportance of the Researche Researche Researche Research
Through this research an endeavor has been made to identify the
challenges involved in achieving administrative/service excellence by
companies through e-HRM and also the challenges of moving
towards performance excellence. By understanding and overcoming
these challenges, companies can be successful in achieving the
primary objective of any e-HRM venture i.e. to diminish costs of HR
transactions, condense time value and make resources easily
available for utilization.

63
3.3 3.3 3.3 3.3 Statement of Statement of Statement of Statement of ObjectivObjectivObjectivObjectiveseseses
The objectives of this research are:
• To trace the emergence of e-HRM in the global arena.
• To present the overview of the e-HRM functioning in the Indian
scenario.
• To identify the underlying factors and pre-requisites for the
success of an e-HRM venture.
• To identify the challenges associated with the implementation
and maintenance of e-HRM systems.
• Offering recommendations and suggestions for enhancing the
effectiveness of e-HRM systems.

64
3.3.3.3.4444 Statement of HypothesesStatement of HypothesesStatement of HypothesesStatement of Hypotheses
H01111: There is no significant difference between groups and within
groups w.r.t. the considered driver for introducing e-HRM systems in
companies.
H02222: There is no significant difference in usage of e-technology for the
considered HR function between Services vs Manufacturing groups.
H03333: There is no significant difference in the usage of e-technology for
the considered HR function between MNC vs Non-MNC groups.
H04444: There is no significant difference in the usage of the considered
HR Service Delivery Tool between Services vs Manufacturing groups.
H05555: There is no significant difference in the usage of the considered
HR Service Delivery Tool between MNC vs Non-MNC groups.
H06666: There is no significant difference between Services vs
Manufacturing groups regarding their perception of their company’s
position in the e-HRM journey today.
H07777: There is no significant difference between MNC vs Non-MNC
groups regarding their perception of their company’s position in the
e-HRM journey today.
H08888: There is no significant difference between groups and within
groups w.r.t. perception of respondents regarding their company’s
position in the e-HRM journey today.

65
H09999: There is no significant difference between Services vs
Manufacturing groups regarding their perception of their company’s
position in the e-HRM journey after five years.
H010101010: There is no significant difference between MNC vs Non-MNC
groups regarding their perception of their company’s position in the
e-HRM journey after five years.
H011111111: There is no significant difference between groups and within
groups w.r.t. perception of respondents regarding their company’s
position in the e-HRM journey after five years.
H012121212: There is no significant difference in the perception of the
Services group regarding their company’s position in the e-HRM
journey today vs ‘after 5 years’.
H013131313: There is no significant difference in the perception of the
Manufacturing group regarding their company’s position in the e-HRM
journey today vs ‘after 5 years’.
H014141414: There is no significant difference in the perception of the ‘MNC’
group regarding their company’s position in the e-HRM journey today
vs ‘after 5 years’.
H015151515: There is no significant difference in the perception of the ‘Non-
MNC’ group regarding their company’s position in the e-HRM journey
today vs ‘after 5 years’.
H016161616: There is no significant difference between groups and within
groups w.r.t the considered barrier to progress in the e-HRM journey.

66
H017171717: There is no significant difference in the expectation of
respondents w.r.t. e-HRM being successful in satisfying employees in
their HR needs between Services vs Manufacturing groups.
H018181818: There is no significant difference in the expectation of
respondents w.r.t. e-HRM being successful in satisfying employees in
their HR needs between MNC vs Non-MNC groups.
H019191919: There is no significant difference in the expectation of
respondents w.r.t. the benefits from e-HRM justifying the expenditure
on the same between Services vs Manufacturing groups.
H020202020: There is no significant difference in the expectation of
respondents w.r.t. the benefits from e-HRM justifying the expenditure
on the same between MNC vs Non-MNC groups.
H021212121: There is no significant difference in overall opinion on the
considered aspects of e-HRM between Services vs Manufacturing
groups.
H022222222: There is no significant difference in overall opinion on the
considered aspects of e-HRM between MNC vs Non-MNC groups.

67
CHAPTER 4CHAPTER 4CHAPTER 4CHAPTER 4
RESEARCH METHODOLOGYRESEARCH METHODOLOGYRESEARCH METHODOLOGYRESEARCH METHODOLOGY

68
CHAPTER 4CHAPTER 4CHAPTER 4CHAPTER 4
RESEARCH METHODOLOGYRESEARCH METHODOLOGYRESEARCH METHODOLOGYRESEARCH METHODOLOGY
This research is largely exploratory in nature since the concept of e-
HRM is relatively new especially w.r.t. the Indian Scenario. The
research is supported by quantitative analysis and findings.
A broad overview of the Research Methodology for this study is
presented in the following Survey Process Chart:
Figure Figure Figure Figure 4.14.14.14.1
SURVEY PROCESS CHARTSURVEY PROCESS CHARTSURVEY PROCESS CHARTSURVEY PROCESS CHART
Understanding the
Issues
Descriptive Survey
Field Survey
Presentation of
findings,
recommendations
and conclusions
• Research Instruments
• Sampling Design
• Collection of Data
Analysis of Data
• Review of Literature
• Web Search

69
4.14.14.14.1 Understanding the issues:Understanding the issues:Understanding the issues:Understanding the issues:
Initial discussions with some HR executives/IT Professionals/Systems
Experts were held to get a feel of the issues involved and to confirm
the relevance/feasibility of the study.
4.24.24.24.2 Descriptive Survey:Descriptive Survey:Descriptive Survey:Descriptive Survey:
Review of literature and other available information:
• Data from various published and unpublished industry reports,
journals, periodicals, books, newspapers, etc. (including
databases like EBSCO, Pro-quest, India Business Insight
Database and others).
• Net search was conducted to add relevant information to the
secondary sources.
• Websites of several companies were searched to hunt out case
studies which would be relevant to the context of the study.
This was done with a view to enabling an in-depth examination
of the issue under consideration and to generate new ideas and
suggestions. A careful examination of the e-HRM systems in
various organizations has helped in widening the arena and an
objective analysis of the issue under consideration.
The descriptive survey helped in preparing the ground-work for the
next step i.e. the field survey.

70
4.34.34.34.3 Field SurveyField SurveyField SurveyField Survey----
4.3.14.3.14.3.14.3.1 Research InstrumentsResearch InstrumentsResearch InstrumentsResearch Instruments
The research instruments used for collecting primary data were:
- Questionnaire and
- Interviews (a patterned interview approach)
The questionnaire (REFERENCE SECTION) comprises of questions
pertaining to:-
• Ranking of the possible drivers for introducing e-technology to
the HR systems.
• Ranking of the barriers to progress in the e-HRM journey.
• Usage of e-technology for the HR functions. For this purpose
18 HR functions were specified. These are- Recruitment and
Selection, Payroll Management, Leave Management,
Attendance Management, Manpower Planning,
Communication, Training and Development, Performance
Management, Induction, Selecting Benefits, Compensation
Planning, Competency Mapping, Career Planning, Succession
Planning, Employee Transition, Travel Management, Exit
Management and Maintaining Employee Records.
• Usage of HR Service delivery tools like ESS, MSS, Web 2.0,
Intranet and e-Learning Portal.

71
• Nature of Sourcing solutions adopted by companies for
enabling e-technology to HR systems- In-house/Outsourced/
Software-as-a-service.
• Perception of respondents on a five-point scale regarding their
company’s position in the e-HRM journey today vs after 5
years. The scale ranges from ‘Neither understand nor value e-
HRM’ to ‘Complete incorporation of e-HRM strategy into the
business model’.
• Expectation of respondents w.r.t.-
- The e-HRM system being successful in satisfying
employees in their HR needs
- The benefits from e-HRM justifying the expenditure
incurred on the same.
• Opinion of respondents on various aspects of the e-HRM
functioning- Resource Management, Compensation and
Rewards, Performance Management, Training and
Development, Employee Relations and some general aspects
like user-friendliness, timeliness, etc. A five-point scale with
the following degrees was used- Strongly
disagree/Disagree/Undecided/Agree/Strongly agree.
• Open ended questions were also included in the questionnaire
to assess the pre-requisites and challenges of e-HRM and to
elicit suggestions from respondents.

72
4.3.2 Sampling4.3.2 Sampling4.3.2 Sampling4.3.2 Sampling Design Design Design Design
4.3.2.1 The4.3.2.1 The4.3.2.1 The4.3.2.1 The analysis of data is based on the following analysis of data is based on the following analysis of data is based on the following analysis of data is based on the following
classificationclassificationclassificationclassification:::: ----
Services SectorServices SectorServices SectorServices Sector including- Accounting/Consulting/Taxation;
Airlines & Aviation; Banks; Export Houses; Financial Services; High-
tech Services; Hospitals/Healthcare; Hotels/Resorts; Insurance;
Law/Legal Consultants; Management/Engineering /Environment
Consultants; Media/Entertainment; Mutual Fund/Stock Broking; Office
Automation; Placement /HR Training Consultants; Retail; Security;
Travel & Tourism.
MMMManufacturing Sectoranufacturing Sectoranufacturing Sectoranufacturing Sector including- Auto Ancillaries/ Auto
components; Automobiles; Capital Goods/Machine Manufacturing;
Cement; Chemicals; Consumer Goods - Durables/Home Appliances;
Electrical & Electronics; Engineering; FMCG; Food
Processing/Beverages; Garment/Textiles/Accessories;
Gems/Jewelleries/Watches; Iron and Steel; Leather
Shoes/Accessories ; Metals/Mining; Paints; Petrochemicals/Oil/
Gas/Refineries; Pharmaceuticals/Bio-tech; Power/Energy;
Rubber/Plastic/Glass/Wood; Sports & Toys.
A classification of companies into MNCs and NonMNCs and NonMNCs and NonMNCs and Non----MNCsMNCsMNCsMNCs has also
been taken for analysis.

73
4.3.2.24.3.2.24.3.2.24.3.2.2 Sample UnitSample UnitSample UnitSample Unit
A company which has adopted e-HRM (at least three HR functions
being run on e-technology and planning to go further), represented by
a manager or Director responsible for HR functions.
4.3.2.34.3.2.34.3.2.34.3.2.3 Sample Size: based on assumption of infinite Sample Size: based on assumption of infinite Sample Size: based on assumption of infinite Sample Size: based on assumption of infinite
populationpopulationpopulationpopulation
Since the total population i.e. the number of companies in
Maharashtra was not known the sample size on the assumption of
infinite population was calculated to be 1000. (Refer annexure I).
The sample units were identified using Judgement and Convenience
Sampling and a list of 1000 companies was prepared. The
classification of the sample units was-
Services Sector: Services Sector: Services Sector: Services Sector: 344344344344
Manufacturing Sector: 656Manufacturing Sector: 656Manufacturing Sector: 656Manufacturing Sector: 656
Total: Total: Total: Total: 1000 1000 1000 1000
The classification of the sample units into MNC and Non-MNC was-
MNC: MNC: MNC: MNC: 170170170170
NonNonNonNon----MNC: MNC: MNC: MNC: 830830830830
Total: Total: Total: Total: 1000100010001000

74
4.3.34.3.34.3.34.3.3 Data Acquisition stageData Acquisition stageData Acquisition stageData Acquisition stage
Questionnaires were forwarded and responses obtained from the
sample units. It was mentioned in the questionnaire that the identity
of the respondents would be kept confidential.
Interview method was also used to collect data. The interviewees
were briefed about the purpose of the interview and its scope in
advance so that they would be ready with the necessary details and
data. This approach was adopted to overcome the time constraint
since all the respondents were executives in companies holding
crucial positions and having limited time to spare. In conducting
these interviews a structured interview approach was used to avoid
wastage of time.
A focused interview approach was also used to gain an in-depth
insight into the issue of concern and to gain a wider perspective on
the subject of study. In certain cases it was not possible to meet the
respondents personally so that the researcher had to depend upon
telephonic interviews.

75
4.44.44.44.4 Data Analysis stageData Analysis stageData Analysis stageData Analysis stage
Data and Information collected both from Primary as well as
Secondary sources was tabulated and summarized so as to draw
logical conclusions.
• As per the research design the analysis of data is based on the
classification- Services Sector/ Manufacturing Sector, hereafter
referred to as Services Services Services Services ggggroup / Manufacturing grouproup / Manufacturing grouproup / Manufacturing grouproup / Manufacturing group
respectively.
• A sub-classification into MNC/ Non-MNC is also taken for
analysis, hereafter referred to as MNC group/ NonMNC group/ NonMNC group/ NonMNC group/ Non----MNC MNC MNC MNC
groupgroupgroupgroup respectively.
• Appropriate Statistical tools including Chi-Square Test, t-test,
ANOVA wherever applicable have been applied to draw logical
conclusions from the data.
4.54.54.54.5 Presentation of Findings, Recommendations and Presentation of Findings, Recommendations and Presentation of Findings, Recommendations and Presentation of Findings, Recommendations and
Conclusion: Conclusion: Conclusion: Conclusion:
The findings, recommendations, etc. have been presented in the latter
part of this report.

76
4.64.64.64.6 Limitations of the Limitations of the Limitations of the Limitations of the ResearchResearchResearchResearch
• The primary research was confined only to Maharashtra due to
cost and time constraints.
• The primary research is based on companies only in the private
sector. The e-HRM scenario in the public sector has been
covered to a limited extent through secondary research (refer
Chapter 8: The Indian e-HRM Scenario).
• The sampling units were identified using Judgement and
Convenience Sampling.
• Since the total population of companies (Private Sector) in
Maharashtra was not known, the formula for calculation of
sample size was based on assumption of infinite population.
• Findings are based on the assumption that the respondents
have revealed the correct information.

77
CHAPTER 5CHAPTER 5CHAPTER 5CHAPTER 5
INTEGRATION OF HR WIINTEGRATION OF HR WIINTEGRATION OF HR WIINTEGRATION OF HR WITH TH TH TH
TECHNOLOGY TECHNOLOGY TECHNOLOGY TECHNOLOGY
ENVIRONMENT ENVIRONMENT ENVIRONMENT ENVIRONMENT

78
CHAPTER 5CHAPTER 5CHAPTER 5CHAPTER 5
INTEGRATION OF HR WITH TECHNOLOGY ENVIRONMENT INTEGRATION OF HR WITH TECHNOLOGY ENVIRONMENT INTEGRATION OF HR WITH TECHNOLOGY ENVIRONMENT INTEGRATION OF HR WITH TECHNOLOGY ENVIRONMENT
Of all resources at our disposal human resources is the most vital
because its activities control all other resources. Formulating a
strategy so as to ensure that adequate number of right type of people
are selected and made available at right time for carrying out the
various activities of the organization. Whether in industrial or service
sector the organization requires men, materials and equipments.
Organization depends more upon the man as it is the independent
resource and the efficiency of an organization is determined through
their human resources. Therefore the primary duty of the
management is to establish the total human resource into the logical
groups to discharge various managerial, Supervisory, skilled &
unskilled functions of various disciplines and activities through
organization structure.
Historically, the information technology was used in selective areas
and functions. But at present it has increased the velocity of
information flows through organization and handles multiple tasks at
a time and serves as a support tool for decision-making. Technology
and HR are enablers of business. Integration of the two would mean
not only harmonious co-existence but also leveraging one for the
other. Leveraging of technology for HR would mean digitizing the HR
activities and automating transactional activities related to
recruitment, performance management, career planning, and

79
succession planning, training and knowledge management.
Leveraging HR for technology implies managing change associated
with technology by way of communication, training, hiring, retraining,
analysis and conscious keeping. Thus they can play complementary
roles.”
In recent times, technology has become synonymous with
information technology, as hardly any other technological
development of the past would have impacted all spectrum of
business as information technology has impacted. Irrespective of the
kind of business you are in i.e., services or goods, commodity or
branded, trading or manufacturing, contemporary or traditional
deployment of information technology in one form or the other is a
foregone conclusion. To manage and deploy technology in an
effective way, all business Organizations would need knowledge
workers. Managing of these knowledge workers is the responsibility
of HR function. Hence the integration of technology and HR is an
absolute must.
Having understood technology and HR in the present context we
must understand integration in this context. Integration would not
only mean harmonious co-existing but would also mean one
enhancing and complementing the other i.e., technology is used to
enhance effectiveness of HR and HR functions helps in adopting and
managing change brought in by technology deployment.
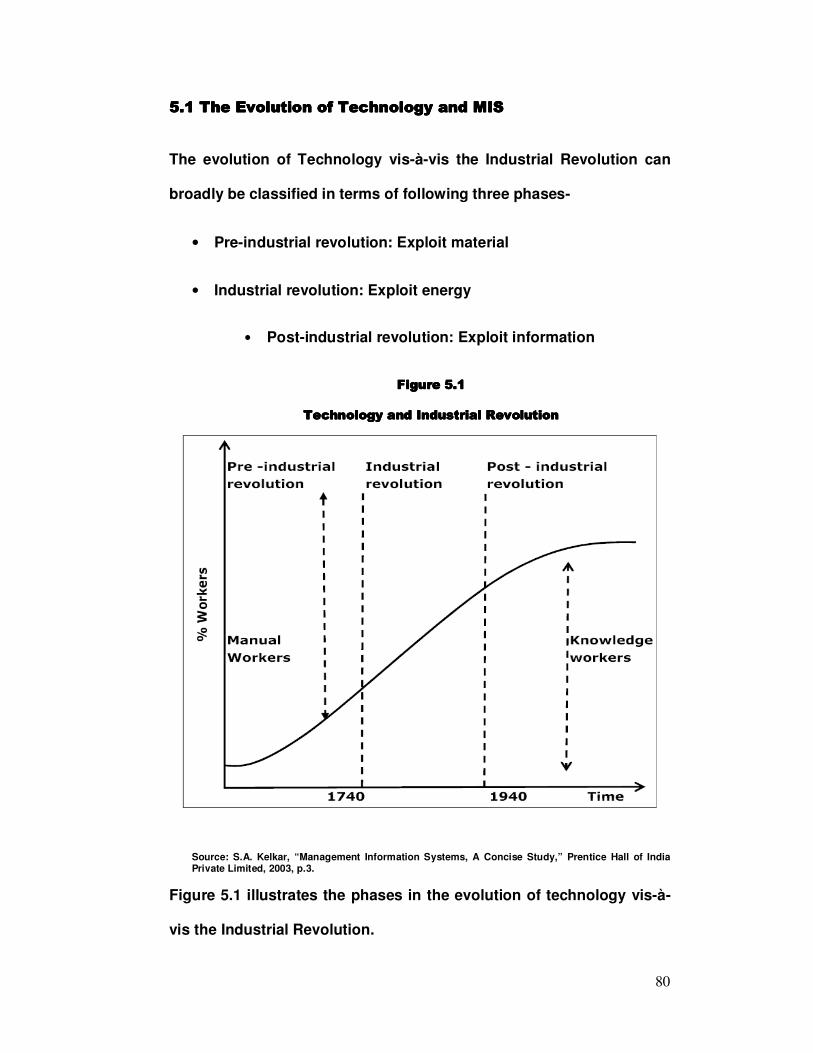
80
5.1 The Evolution of Technology and MIS5.1 The Evolution of Technology and MIS5.1 The Evolution of Technology and MIS5.1 The Evolution of Technology and MIS
The evolution of Technology vis-à-vis the Industrial Revolution can
broadly be classified in terms of following three phases-
• Pre-industrial revolution: Exploit material
• Industrial revolution: Exploit energy
• Post-industrial revolution: Exploit information
FigureFigureFigureFigure 5.1 5.1 5.1 5.1
Technology and Industrial RevolutionTechnology and Industrial RevolutionTechnology and Industrial RevolutionTechnology and Industrial Revolution
Source: S.A. Kelkar, “Management Information Systems, A Concise Study,” Prentice Hall of India Private Limited, 2003, p.3.
Figure 5.1 illustrates the phases in the evolution of technology vis-à-
vis the Industrial Revolution.

81
The wide variety of computer resources to perform transaction
processing for a formal information and reporting system and to
accomplish managerial-decision support are broadly classified as the
organization’s management information system or MIS.
Figure Figure Figure Figure 5555.2.2.2.2
Functional subsystems in an MIS used by a manufacturing concernFunctional subsystems in an MIS used by a manufacturing concernFunctional subsystems in an MIS used by a manufacturing concernFunctional subsystems in an MIS used by a manufacturing concern
Ma
rke
tin
g
Pro
du
ctio
n
Log
isti
cs
Pe
rso
nn
el
Fin
an
ce a
nd
Acc
ou
nti
ng
Info
rma
tio
n P
roce
ssin
g
To
p M
an
ag
em
en
t
Data base Management Systems
Data base
Source: Gordon B. Davis and Margrethe H. Olson, “Management Information Systems- Conceptual
Foundations, Structure, and Development”, Tata McGraw-Hill, New Delhi, 2002, p.15.
Figure 5.2 depicts that MIS may be viewed as a federation of
information systems- one for each major organizational function.
These are Marketing, Production, Logistics, Personnel, Finance and
Accounting, Information Processing and Top management.

82
Figure Figure Figure Figure 5555.3.3.3.3
Relation of activities to functional subsystemsRelation of activities to functional subsystemsRelation of activities to functional subsystemsRelation of activities to functional subsystems
Source: Gordon B. Davis and Margrethe H. Olson, “Management Information Systems-Conceptual
Foundations, Structure, and Development”, Tata McGraw-Hill,New Delhi, 2002, p.16.
The structure of an information system can also be viewed in terms of
the subsystems which perform various activities. These are
Transaction Processing, Operational Control, Management Control
and Strategic Planning (Refer Figure 5.3).
MIS plays a very important role in creating organization behavior
which in turn sets the goals for achievement. Technology and people
decide the organization structure and style of the management.

83
Figure Figure Figure Figure 5555.4.4.4.4
Organizational Organizational Organizational Organizational BehaviorBehaviorBehaviorBehavior and MISand MISand MISand MIS
Source: W.S. Jawadekar, Management Information Systems, Tata McGraw Hill Publishing Company
Limited, 2005, p.48.
Figure 5.4 explains the impact and relationship of MIS on the
organization behavior in terms of modifying the organization
motivation, learning and changes.

84
5.25.25.25.2 Human Resource Information SystemsHuman Resource Information SystemsHuman Resource Information SystemsHuman Resource Information Systems
The key features of a HRIS are depicted in the following figure-
Figure 5.Figure 5.Figure 5.Figure 5.5555
The key features of a HRISThe key features of a HRISThe key features of a HRISThe key features of a HRIS
Source: P.K. Gupta and Sushil Chhabra, ‘Human Resource Information Systems’ Himalaya Publishing
House, 2004, p.48.
Figure 5.5 illustrates the key features constituting a HRIS. These are -
Human Resource Data Bank, Administration, Planning Activities and
Strategic Planning. Continuous Environmental Analysis is also a key
requirement.

85
Figure 5.Figure 5.Figure 5.Figure 5.6666
HRIS Acquisition PhasesHRIS Acquisition PhasesHRIS Acquisition PhasesHRIS Acquisition Phases
Source: P.K. Gupta and Sushil Chhabra, ‘Human Resource Information Systems’ Himalaya Publishing
House, 2004, p.53.
Figure 5.6 illustrates the three HRIS Acquisition Phases – Need
Analysis, Design and Development and Implementation and
Maintenance.

86
The Personnel Information System deals with the flow of information
about people working in the organization as well as about future
personnel needs. An integrated set of files is used by all the
personnel administration systems. Some of these are- Employee file;
Job file; Job Applicant’s file; Accident file and Claims and Injuries file.
Employee file:Employee file:Employee file:Employee file: provides data relevant to many aspects of employee
supervision and administration as well as for workforce planning.
TableTableTableTable 5.1 5.1 5.1 5.1
Data and data items of employee fileData and data items of employee fileData and data items of employee fileData and data items of employee file
Data Data Data Data Data Items Data Items Data Items Data Items
(i)Identification Data
Employee number (File key), name, addresses, telephone numbers, job code, location, shift, citizenship, pointer to next record with same job and location code.
(ii)Performance Data
Last review date, review type, rating, promotability date, next job, comment, next review date, days tardy, days absent without prior approval, idle time as percentage of total, earned hours as percentage of actual hours.
(iii)Benefit Data
Life insurance policy type, effective dates, coverage, pay roll deduction amount, health insurance policy type, effective dates, coverage, retirement plan type code, eligibility date, plan service date, vesting date, pension option date, projected retirement date, projected benefit payment.
(iv) Skills Data
Lost job title, location, reported to name and position, employer, last pay rate, date left position, reason, months in position, pointer to job history file, highest formal education level, year received highest degree, school major, pointer to education history file, language skill codes, technical skill codes, relocation constraint codes.
(v) Payroll data See payroll system.
(vi)Affirmative Action Data.
Race, sex, age, religion.
(vii)Termination Data
Position at the time of termination, department, part time, reported to name and position, pay rate, months in position, pointer to job history file, date of termination, date notice given, last day of work, termination type code (voluntary, misconduct etc), specific reason code, rehire eligibility, exit interview, comments and codes, date claim protest lodged, date of response to protest and outcome, date of appeal.
Source: C.S.V. Murthy, Management Information Systems, Himalaya Publishing House, 2004, Pg. 511.
Table 5.1 illustrates an Employee file in which the data are grouped
under seven headings.

87
A typical human resources Transaction Processing System for
employee record keeping is illustrated in Figure 5.7
Figure 5.7Figure 5.7Figure 5.7Figure 5.7
An employee record systemAn employee record systemAn employee record systemAn employee record system
Source: Kenneth C. Laudon and Jane P. Laudon, “Management Information Systems- Managing the Digital Firm” Prentice Hall of India Private Limited, 2004, p.50.
An employee record system (figure 5.7) maintains basic employee
data, such as the employee’s name, age, sex, marital status, address,
educational background, salary, job title, date of hire, and date of
termination. The system can produce a variety of reports, such as
lists of newly hired employees, employees who are terminated or on
leaves of absence, employees classified by job type or educational
level, or employee job performance evaluations.
Job file:Job file:Job file:Job file: provides job descriptions covering qualifications, duties
and responsibilities. (Refer Table 5.2)

88
Table 5.2Table 5.2Table 5.2Table 5.2
Data and data Data and data Data and data Data and data items items items items of job filesof job filesof job filesof job files
Data Data Data Data Data Items Data Items Data Items Data Items
Identification Data Location code, job code, shift (all three are file keys), cost centre account number, job title, current number of employees, pointer to first employee record.
Position Description Data
Summary statement of duties, specific duties, experience, qualifications, educational qualifications, required references, supervisor (name, job code, location) pay range and scale, number of equivalent full time positions authorized, current unfilled positions, cut-off date.
Budget Data
Labor hours (budget and actual) (past, current, future periods) Average labor cost/hour “ Average related expense/hour Total labor cost Total related expense Pointer to next job in same cost centre
Performance Data Turnover rate, tardiness, frequency, absenteeism in frequency
Source: C.S.V. Murthy, Management Information Systems, Himalaya Publishing House, 2004, Pg. 512.
Table 5.2 shows the data items of job files under four broad
categories.
Job applicant’s fileJob applicant’s fileJob applicant’s fileJob applicant’s file:
TableTableTableTable 5.3 5.3 5.3 5.3
Data and data items of job applicants’ fileData and data items of job applicants’ fileData and data items of job applicants’ fileData and data items of job applicants’ file Data Data Items
Applicant Identification Data
Covers location code, shift, job code, applicant serial number (all in file keys) name, pointer to next name in alphabetical order, address, and telephone.
Work History Data
Covers last job title, location, reported to name and position, employer (name, address, telephone), last pay rate, date terminated (or still on job?), months in position, months with the last employer, reason for leaving, relocation constraint code.
Education Data Covers highest formal education level, year received highest degree, school, major, language skill code, technical skill code.
Application Status Data
Covers how was the applicant reached? Initial screening results, Interview (date, interview results), notification (date, notice sent, sender).
Source: C.S.V. Murthy, Management Information Systems, Himalaya Publishing House, 2004, Pg. 513.
Table 5.3 shows the data and data items of job applicants’ file. The
application identification data identifies the data and the job for which
he or she is applying. The application status data records the actions
taken on the written application.

89
Accident file:Accident file:Accident file:Accident file: contains a record for each reportable accident. It is
usually an event for which the organization may be held responsible for damages.
TableTableTableTable 5.4 5.4 5.4 5.4
Accidents file data and data itemsAccidents file data and data itemsAccidents file data and data itemsAccidents file data and data items
Data Data Data Data Data Items Data Items Data Items Data Items
(i) Time and Place Data
Serial number (file key), date of accident, date reported, time of accident, day of week, physical location of accident, responsible cost centre, responsible supervisor.
(ii) Characteristics Data
Accident type code (preventable), hazard condition code, unsafe act, mechanical failure, vehicle number (motor vehicle accident (MVA type), pavement condition (if MVA type), weather, pointer to claims and injury file.
(iii) Effects Data Report made to government agencies, corrective actions taken. Total property damage, total medical expenses, total lost work time, other expenses.
Source: C.S.V. Murthy, Management Information Systems, Himalaya Publishing House, 2004, Pg. 514.
Table 5.4 depicts the constituents of an Accident file.
Claims and injuries fileClaims and injuries fileClaims and injuries fileClaims and injuries file: These may be insurance claim recorded
by the organization under insurance policies or they may be claimed
by employees under group insurance policies managed by the
organization.
TableTableTableTable 5.5 5.5 5.5 5.5
Claims and injuries file data and data itemsClaims and injuries file data and data itemsClaims and injuries file data and data itemsClaims and injuries file data and data items
Data Data Data Data Data Items Data Items Data Items Data Items
(I) To-Data Relation to organization (employee, customer etc), name (both are file keys), employee number (if any), address, telephone, social security number. (in USA)
(ii) From-Data Payment by company, insurance policy involved, general ledger account.
(iii) Basis-Data Claim type, injury or damage code, description of property damages, safeguards provided, safeguards used, pointer to accident file, pointer to next claim for same accident.
(iv)When-Data Date claim filed, date of final settlement.
(v) Amount-Data
Expense type code, actual cost and insurance reimbursement amount.
Source: C.S.V. Murthy, Management Information Systems, Himalaya Publishing House, 2004, Pg. 514.
The data and data items in a Claims and injuries file may be as per
Table 5.5.

90
5.5.5.5.3333 Advantages of HRISAdvantages of HRISAdvantages of HRISAdvantages of HRIS
Human Resource Information Systems maintain employee records;
track employee skills, job performance, and training; and support
planning for employee compensation and career development.
TableTableTableTable 5.6 5.6 5.6 5.6
Examples of Human Resource Information SystemsExamples of Human Resource Information SystemsExamples of Human Resource Information SystemsExamples of Human Resource Information Systems
System Description Organizational Level
Training and Development Track employee training, skills and
Performance Appraisals Operational
Career pathing Design Career paths for employees Knowledge
Compensation analysis Monitor the range and distribution of
employee wages, salaries and benefits Management
Human Resources Planning Plan the long –term labor force needs of the
organization
Strategic
Source: Kenneth C. Laudon and Jane P. Laudon, “Management Information Systems- Managing the
Digital Firm” Prentice Hall of India Private Limited, 2004, p.50.
Strategic – level human resources systems (Table 5.6) identify the
manpower requirements (skills, educational levels, types of positions,
number of positions, and cost) for meeting the firm’s long term
business plans. At the management level, human resources systems
help managers monitor and analyze the recruitment, allocation and
compensation of employees. Knowledge systems for human
resources support analysis activities related to job design, training
and the modeling of employee career paths and reporting
relationships. Human resources operational systems track the
recruitment and placement of the firm’s employees.

91
The advantages of HRIS can be identified as Reduced Clerical Effort,
Risk Management, Training Management, Financial Planning, Flexible
Benefits, Attendance Reporting and Analysis, and Employee Equity
Reporting.
Figure 5.Figure 5.Figure 5.Figure 5.8888
The uses of an HRIS system (by subThe uses of an HRIS system (by subThe uses of an HRIS system (by subThe uses of an HRIS system (by sub----system)system)system)system)
Source: P.K. Gupta and Sushil Chhabra, ‘Human Resource Information Systems’ Himalaya Publishing
House, 2004, p.46.
Figure 5.8 illustrates the uses of an HRIS system (by sub-system).
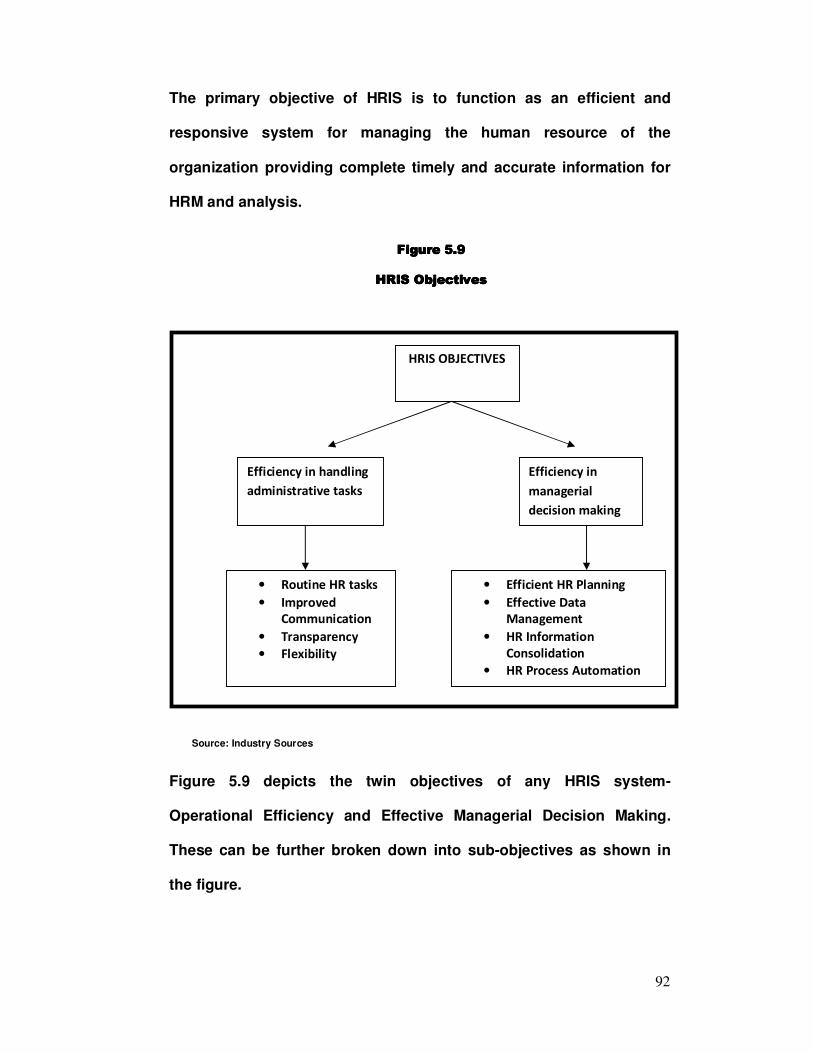
92
The primary objective of HRIS is to function as an efficient and
responsive system for managing the human resource of the
organization providing complete timely and accurate information for
HRM and analysis.
Figure 5.Figure 5.Figure 5.Figure 5.9999
HRIS ObjectivesHRIS ObjectivesHRIS ObjectivesHRIS Objectives
Source: Industry Sources
Figure 5.9 depicts the twin objectives of any HRIS system-
Operational Efficiency and Effective Managerial Decision Making.
These can be further broken down into sub-objectives as shown in
the figure.
HRIS OBJECTIVES
Efficiency in handling
administrative tasks
Efficiency in
managerial
decision making
• Routine HR tasks
• Improved
Communication
• Transparency
• Flexibility
• Efficient HR Planning
• Effective Data
Management
• HR Information
Consolidation
• HR Process Automation

93
5.5.5.5.4444 A A A A Generic HRIS Model Generic HRIS Model Generic HRIS Model Generic HRIS Model
The structure of HRIS depends upon the nature and size of the
organization. It is logical also because the HRIS is viewed from a
strategic perspective by most of the HR managers and practitioners.
Since the HR strategy is unique to the organization, its HRIS model
will be customized.
Figure 5.Figure 5.Figure 5.Figure 5.10101010
A Generic HRIS ModelA Generic HRIS ModelA Generic HRIS ModelA Generic HRIS Model
Source: P.K. Gupta and Sushil Chhabra, ‘Human Resource Information Systems’ Himalaya Publishing
House, 2004, p.47.
For large organizations the HRIS model includes the generic structure
as shown in Figure 5.10.

94
5.5.5.5.5555 A Matrix of Information Vs User A Matrix of Information Vs User A Matrix of Information Vs User A Matrix of Information Vs User
Organizational Information is the information required by a number of
personnel, departments and divisions or the functions in the
organization. Such information can be determined by constructing a
matrix of information versus user as shown in Table 5.7.
TableTableTableTable 5.7 5.7 5.7 5.7
Matrix of Information versus User for a Personnel FunctionMatrix of Information versus User for a Personnel FunctionMatrix of Information versus User for a Personnel FunctionMatrix of Information versus User for a Personnel Function
Information entity
Manager (Personnel)
Manager (Production)
Manager (Administration)
Manager (Accounts)
Employees Attendance
X X X -
Salary, wages and overtime
X X X X
Human resources information
X X X -
Source: W.S. Jawadekar, ‘Management Information Systems’, Tata McGraw Hill Publishing Company
Limited, 2005, pg.153.
It can be observed from Table 5.7 that the information entity is one
but its usages are different. For example, the employee attendance
information would be used by the personnel department for legal
compliance of maintaining the muster recommended by the Factory
Inspector. The production manager would use it for scheduling,
rescheduling and loading of the jobs on the shop floor depending
upon the persons present. The corporate planning and administration
will use it for manpower assessment and control and manpower
forecasting.

95
5.5.5.5.6666 HRIS and the Strategic, Tactical and Operational use HRIS and the Strategic, Tactical and Operational use HRIS and the Strategic, Tactical and Operational use HRIS and the Strategic, Tactical and Operational use
of Human Resourcesof Human Resourcesof Human Resourcesof Human Resources
HRIS Systems are designed to support (1) planning to meet the
personnel needs of the business, (2) development of employees to
their full potential, and (3) control of all policies and programs.
Originally, businesses used computer based information systems to
(1) produce paychecks and payroll reports,
(2) maintain personnel records, and
(3) analyze the use of personnel in business operations.
Figure 5.Figure 5.Figure 5.Figure 5.11111111
Human reHuman reHuman reHuman resource information systems support the strategic, tactical and source information systems support the strategic, tactical and source information systems support the strategic, tactical and source information systems support the strategic, tactical and
operational use of the human resources of an organizationoperational use of the human resources of an organizationoperational use of the human resources of an organizationoperational use of the human resources of an organization
Source: James A. O’Brien, Management Information Systems, Tata McGraw Hill Publishing Company
Limited, 2005, p. 154.
Succession planning
Performance appraisal
planning
Human resources planning
Labor force tracking
Contract costing
Salary forecasting
Labor cost analysis and
budgeting
Turnover analysis
Training effectiveness
Career matching
Compensation effectiveness analysis Benefit preference analysis
Recruiting
Workforce planning/
scheduling
Skill assessments
Performance evaluations
Payroll control
Benefits administration
Strategic
systems
Tactical
systems
Operational
systems
Staffing Training and
Development
Operational
systems

96
Many firms have gone beyond the traditional personnel management
functions and developed human resource information systems (HRIS)
that also support (1) recruitment, selection and hiring; (2) job
placement; (performance appraisals; (4) employee benefits analysis;
(5) training and development; and (6) health, safety, and security.
(Refer figure 5.11).
The great leap forward of web technologies during the past few years
has lead to the birth of Electronic Human Resource Management (e-
HRM) which is a much more powerful enabler in transforming the role
of Human Resource (HR) from an administrator to the more value
adding role of a business partner.

97
CHAPTERCHAPTERCHAPTERCHAPTER 6 6 6 6
EEEE----HRMHRMHRMHRM
AN OVERVIEW AN OVERVIEW AN OVERVIEW AN OVERVIEW

98
CHAPTER 6CHAPTER 6CHAPTER 6CHAPTER 6
EEEE----HRMHRMHRMHRM: : : : AN OVERVIEW AN OVERVIEW AN OVERVIEW AN OVERVIEW
Growing awareness about e-HRM has lead to the growth of several
software products and solutions providers. They specialize in
delivering next-generation enterprise applications in the areas of
Web-based Human Resources Alignment, Employee and Manager Self
Service and Strategic HR Practices like eRecruitment, Performance
Management and Training Administration and also on Workflow
Automation.
FigureFigureFigureFigure 6.1 6.1 6.1 6.1
HR Processes covered by eHR Processes covered by eHR Processes covered by eHR Processes covered by e----HRM HRM HRM HRM ---- A broad Overview A broad Overview A broad Overview A broad Overview
HCM PORTALHCM PORTALHCM PORTALHCM PORTAL
Reports & Analytics
Organization Structure HR Administration
Selection & Recruitment
Personal
Data Employee
Lifecycle Employee
Self Service
Time & Attendance
Timesheet
Shift Planning
Portal
Management Performance
Management Training
Management
Payroll Help desk Policy Compliance
Work flow engine
Source: Industry Sources
E R P
Figure 6.1 gives a broad overview of the HR processes covered by e-
HRM.

99
THE GAMUT OF eTHE GAMUT OF eTHE GAMUT OF eTHE GAMUT OF e----HRM (Constituents of eHRM (Constituents of eHRM (Constituents of eHRM (Constituents of e----HRM)HRM)HRM)HRM)
6.16.16.16.1 HR AdministrationHR AdministrationHR AdministrationHR Administration
Routine HR administration activities and events now get a technology
edge that makes information available on the go. Areas like HR Data
Maintenance can now be automated with individual needs
customized, hence enhancing the power to human resources for
maximum output.
Some of the features include- Aligning HR Services to organizational
vision, maintaining HR Data, managing employee and employment
records, maintaining data masters at multiple levels and others.
6.26.26.26.2 Employee Life EventsEmployee Life EventsEmployee Life EventsEmployee Life Events
Employees experience multiple events and changes throughout their
careers that can result in anxiety and loss of productivity, such as
transfers, promotions, mergers, medical leave, relocation and
separation.
The Personal Information Management System (PIMS) module helps
both employees and HR professionals effectively manage change for
all critical employee transitions by providing- Completely
customizable portals for socialization and efficient delivery of all
relevant information; Employee joining process management;
Smoothen inducting employee into the organizational culture and

100
habitat with induction plan and schedule; Robust task management to
have a defined process; Electronic forms capability to eliminate
errors and speed time to completion; Reduced administrative burden
of paperwork and managing tasks.
FigureFigureFigureFigure 6.2 6.2 6.2 6.2
Confirmation with AppraisalConfirmation with AppraisalConfirmation with AppraisalConfirmation with Appraisal---- automatic initiation automatic initiation automatic initiation automatic initiation
Source: Industry Sources
Figure 6.2 shows automatic initiation of Confirmation with Appraisal
process.
PersonalPersonalPersonalPersonal Information Management Information Management Information Management Information Management: : : : Personal details /
Qualification details/ Remuneration details/ Attachments.
EmploymentEmploymentEmploymentEmployment Data Data Data Data: : : : Current Employment/ Past Employment/
Training Data
HRHRHRHR Management Management Management Management: : : : Position Management/ Employee Creation/
Employee confirmation/ Employee Separation/ Portal Management
Confirm as per due
date
Regret
Extend Probation Period
Approve/Reject
2. On rejection, it
will be sent to the
previous level
Confirmation Appraisal
Appraisal Initiation
Confirmation Approval
1. On Approval, email notification will
be sent to the employee

101
6.36.36.36.3 EEEE----recruitmentrecruitmentrecruitmentrecruitment
E-recruitment turns recruitment hassles into a faster, simpler, more
effective process. Not only is recruitment across locations aligned
with organizational benchmarks, but right talent and position
requirements, and their goals and performance are standardized.
Recruitment Master:Recruitment Master:Recruitment Master:Recruitment Master: City Master Careers / Location Master Careers
/ Region City Mapping / Career Role Master / Functional Role Mapping
Vacancy managementVacancy managementVacancy managementVacancy management: Create Vacancy / Group Vacancy / Post
Vacancy / Publish Vacancy.
Resume ScreeningResume ScreeningResume ScreeningResume Screening: My Vacancies / Resume Search And Short
Listing / Resume Screening By Manager / Resume Search.
Interview managementInterview managementInterview managementInterview management: Schedule Interview / My Interview
Schedule List / Batch Master / Schedule Test / Test Code List / Test
Result / Interview Feedback / Candidate History.
Candidate SelectionCandidate SelectionCandidate SelectionCandidate Selection: Make Offer / Offer Acceptance / Employee
Creation / Offer Document Checklist / Generate Appointment Letter /
Compensation Template.
ConsultantConsultantConsultantConsultant: Create Incentive / Consultant Summary / Billing /
Candidate Registration / Consultant Registration Approval /
Consultant Reimbursement Rating.
Career portalCareer portalCareer portalCareer portal: Hot Links / Vacancy Tags.

102
FigureFigureFigureFigure 6.36.36.36.3
The eThe eThe eThe e----Recruitment SystemRecruitment SystemRecruitment SystemRecruitment System
Source: Industry Sources
Resume posted by
external candidates, internal employees,
Recruiters
Approved vacancies
posted on the job board
Prejoining Activities
Offer Acceptance
Schedule Test/
Interview
Interview Feedback
Make Offer
Resume Search &
Short listing
Vacancy Creation
Create Employee
Master Setup
Generate
Appointment Letter
Figure 6.3 illustrates the steps in the process of e-recruitment.
6.46.46.46.4 Training Training Training Training ManagementManagementManagementManagement
Right Skills at the right time change everything. Training management
involves the following- Create training courses across locations and
specific groups; Build an annual training calendar; Identify training
needs as a part of appraisal; Create / Assign training for identified

103
training needs; Communicate schedule and full course details to
employees and invite nominations from employees, manager; Assign
trainers and venues and generate related correspondence; Tract
attendance; Record faculty and participant feedback; Track under-
subscribed course and view course details for corrective action;
Generate reports to track training costs; Track the effectiveness of
training post the actual training program; Add training records and
employee data; Record both internal and external training.
FFFFigureigureigureigure 6.4 6.4 6.4 6.4
Training SystemTraining SystemTraining SystemTraining System
Source: Industry Sources
Figure 6.4 illustrates a comprehensive training management system.
Participants
Attend Training Attendance Training Record
Creation
Training
Appraisal
Mapping
Nomination by
Manager /
Self/Training
Faculty
Course Cost Entry
Course Schedule
/ Reschedule
Course
Registration
CPE / CPD Master
Master Setup
Faculty Evaluation
Participant
Feedback
Training Details updated
in Employment details Post Training
Feedback

104
6.56.56.56.5 Performance Management SystemPerformance Management SystemPerformance Management SystemPerformance Management System
Performance rating is no longer a grey area. Alignment gives it a
clear vision with well-defined goals and measurement against
objectives. The process of alignment will be complete only when it is
linked to the same measures at the beginning of the process and at
the end of the process: goal setting at the start of the process and
performance normalization in keeping with organizational
performance for the period at the end. This has to cascade to all
levels within the organization. The process clarity and transparency
would make every employee focus and work with one goal in mind.
Performance rating can be communicated to the employee and with a
click be made part of the employment data, enabling easy retrieval in
the future.
GoalGoalGoalGoal Setting Setting Setting Setting
A key element of planning a year ahead, this process is really
persuasion, insistence and planning combined. In any company this
is normally a performance appraisal for the previous year and
simultaneously setting up outlook for the New Year. E-HRM supports
the process by allowing business leaders to set organizational goals,
align employees to the same and review progress periodically. This
process culminates in the performance assessment. The benefit to
users and management is an objective and transparent performance
assessment linked to organizational performance. This also

105
seamlessly links into the compensation, talent identification and
training needs identification.
FigureFigureFigureFigure 6.5 6.5 6.5 6.5
Self Appraisal SystemSelf Appraisal SystemSelf Appraisal SystemSelf Appraisal System
Source: Industry Sources
Figure 6.5 illustrates the format of a self-appraisal system.
360360360360 degree feedback degree feedback degree feedback degree feedback
The 360 degree appraisal system is a key process for leadership
development within the organization. E-HRM’s Performance
Management System supports this process. HR managers can now
mark out employees who need to go through this special feedback
system during the appraisal process.
Self Appraisal with
Goals and Template
Template
Mapped (Y/N)
Self Appraisal with
Goals only
Goals
approved (Y/N)
Self Appraisal
Template Mapped (Y/N)
Either Goals or
Templates have to be
set / mapped
Self Appraisal with Templates
only
Self Appraisal
Save / submit
Approval of Self Appraisal
Mail Notification
to employee

106
Performance NormalizationPerformance NormalizationPerformance NormalizationPerformance Normalization
Performance normalization is the process of aligning the overall
performance ratings with the organizational standards of performance
and excellence. The process is a sequel to the performance appraisal
process and through this employee ratings are brought under the
organizational standards scale. The benefit to the organization is that
rewards (based on the final normalized ratings) are matched to
organizational level of expectations.
FigureFigureFigureFigure 6.6 6.6 6.6 6.6
Performance Management SystemPerformance Management SystemPerformance Management SystemPerformance Management System
Source: Industry Sources
Figure 6.6 illustrates a Performance Management System with
Normalization as a constituent.
Appraisal
Intimation Reviewed Goals
Submission
Goal Submission
Goal Review
Intimation
Goal Setting
Master Setup
Self Appraisal
Normalization
Finalization
Appraisal
record of
each
employee
is updated
with the
normalized
rating

107
FigureFigureFigureFigure 6.7 6.7 6.7 6.7
The Outputs of a Performance Management SystemThe Outputs of a Performance Management SystemThe Outputs of a Performance Management SystemThe Outputs of a Performance Management System
FUNCTIONALITY PERFORMANCE MANAGEMENT
OUTPUTS
Goal Plans
Real-time status of
individual goals
Progress and
Integration with
goals
Individual
Performance
Appraisal &
Rating
Competency Gap
Analysis /
Appraisal Reports
Integration with related talent management systems
Source: Industry Sources
Figure 6.7 illustrates the outputs of an integrated Performance
Management System.
Training Payroll Organization Charting
Goal Setting
Assessment
Development Plan
Appraisal
• Organization Goals
• Individual Goals & Scores
• Assessment Scores
• Development Plan and Scores
• Performance Appraisal
• Normalization

108
6.6.6.6.6666 Absence ManagementAbsence ManagementAbsence ManagementAbsence Management
Planning can be made that difference between losing precious time
and cost in the absence of people. At the same time, just gathering
information to help the employee plan absence can also be a drain on
time and manpower as well. Alignment allows the HR to react and
respond at the right time, to provide all the information in an easy
manner, reducing valuable time on helpdesk calls. The features
include-
• Leave Records:Leave Records:Leave Records:Leave Records: Allows the HR department to maintain
various Holiday types, credit balances to employees as per
eligibility, ensure clarity and uniformity in policy guidelines,
view employee leave records.
• Holiday PlanningHoliday PlanningHoliday PlanningHoliday Planning: enables the employee to view leave
balance under various eligible heads, plan holiday. They can
raise leave requests online and be routed for approval.
• Leave administrationLeave administrationLeave administrationLeave administration: the system enables the employees to
regularize leave for exceptions such as failure to sign-out,
wrong hours recorded.
• Role based WorkflowsRole based WorkflowsRole based WorkflowsRole based Workflows: Allows different users such as
employees, managers, payroll managers and HR administrators
to be part of the application flow as per rules of the
organization.

109
• ReportingReportingReportingReporting: Offers useful reports such as the Punctuality Index
for capturing and analyzing trends in leave and attendance of
the employees, allowing managers to pro-actively take steps to
tackle any irregularities.
6.6.6.6.7777 Shift Shift Shift Shift Management Management Management Management
Through e-HRM shift management helps in gaining complete control
of rotating employees without any surprises. Features include-
Assigning / rotating employees through various shifts; Providing an
overview of employees working in any shift; Linking shift roster to the
transport department and schedule pick-ups.
6.6.6.6.8888 Resource Resource Resource Resource Management & Timesheet Management & Timesheet Management & Timesheet Management & Timesheet
The Resource Planning System enables organizations and line
managers to identify competencies and skills required for projects at
all levels and in each job function, manage resources, timeliness,
costs and data in real-time. It provides flexible tools that enable
collaboration, communication, scheduling and mapping of activities
and costs to specific projects and clients.
This system facilitates entering and maintaining timesheets and cost
details periodically.The timesheet puts the HR manager in complete
control of all the people, projects, time and cost- making information
visible, and accessible in real time. Using an intuitive timesheet

110
software interface the employees are able to capture their timesheets
and expenses in an efficient manner, reducing data entry times.
Resource Management ensures- Effective utilization of resources;
Direct integration with the employee database; Save time by not
scheduling people on unavailable days and times; Organize and track
hours and costs for all project personnel; Organize and keep track of
absence and leave time; Keep staff informed with calendars of leave
and schedules; Generate On Demand Margin Analysis report, to
support management provide realistic budgeting.
FigureFigureFigureFigure 6.8 6.8 6.8 6.8
Resource ManagementResource ManagementResource ManagementResource Management
Define & Assess Competencies
Expense
Management
Workforce
Scheduling
Database Management
(Project-wise & Client-wise)
Time
Management
Project Planning
Optimum utilization of resources
Revenue forecasting
Cost controls
Investigating un-utilized/under-utilized capacity
Source: Industry Sources
Figure 6.8 illustrates the constituents of a typical Resource
Management System.
Resource
Planning

111
6.6.6.6.9999 Planning Planning Planning Planning
This includes- Minutes of Meeting / Task Tracking / Task Tracking
Management.
6.6.6.6.11110000 PayrollPayrollPayrollPayroll Management Management Management Management
The constituents are-
Master SetupMaster SetupMaster SetupMaster Setup:::: Slab / Pay Group / Payroll User Rights / Pay group
Rights / Global parameters / Currency Master / Currency Exchange
Rate Master / Corporate Bank Account / Component / Component
Settings.
LoanLoanLoanLoan: Loan Master / Loan Scheduler / Loan Re-scheduler.
Reimbursement: Reimbursement Eligibility / Reimbursement Types /
Reimbursement Release Date.
SalarySalarySalarySalary: Full and Final Settlement / Salary Hold / Salary Fixed / Salary
Variable / Salary Hold Release / Salary Entry / Salary Adjustment /
Arrear Days / Adjust Breakup.
TaxTaxTaxTax: Tax Component / Tax Declaration / Asset Perks / Asset Master /
Tax Adjustment / Tax Template / Rent Declaration / Rent Free
Accommodation / Tax Remittance
ProcessProcessProcessProcess: Pay process / Show Process / Confirm Process

112
UtilitiesUtilitiesUtilitiesUtilities: View Salary Data / View Tax Data / Leave Reimbursement
Integration / Two Field Master Configuration / Two Field Master / Bank
Transfer / Salary Reconciliation Process.
6.16.16.16.11111 Employee Employee Employee Employee & Manager Self & Manager Self & Manager Self & Manager Self----serviceserviceserviceservice
Alignment is the key for keeping objectives on track and also for
changing information captured along with it. On one hand, the
employee is empowered to track any personal information required at
any time. On the other, automating routine processes saves key HR
and employee time increases bottom-line savings in a big way. The
focus is on the right things, in the right way. The Employee and
Manager Self Service features allow employees to view benefits,
update personal information, submit time sheets, make vacation
requests, and request travel expenses, reimbursement empowering
employees and also frees HR staff to deal with more complex tasks.
(Refer Figure 6.9)

113
Figure 6.9Figure 6.9Figure 6.9Figure 6.9
ESSESSESSESS---- A Bird’s Eye View A Bird’s Eye View A Bird’s Eye View A Bird’s Eye View
Leave RequestLeave CancellationLeave EncashmentLeave Regularization
Visa RequestTravel SummaryTravel ExpensesTravel Request
Business Card Request
Items Requisition
Family Details, Hobby DetailsLanguage ProficiencyNomination DetailsPassport Details, Pension DetailsVehicle Details, Visa DetailsEmployee Attachments
Record Resignation
Exit InterviewClearance Activity
Resource Planning Project Bulk AllocationProject Team AllocationProject Team De-allocationWeekly Timesheet
Induction
Leave
Self CertificationSelf Certification ResultsWelcome Letter
Advance RequestSalary Advance RequestSettlement – Expense Claims
Employee Officiation
IT ApplicationRequest
Course NominationNomination WithdrawalParticipant Feedback
Claims Requisition
Asset RequestAsset Return
Job Board SearchRefer a Friend
Goal Setting, Goal ReviewGoal SubmissionSelf Appraisal – 180 Degree360 Feedback
Attendance RegularizationAttendance Cancellation
Manage Shift, Shift PlanningShift Roster, Shift CalendarEmployees in Shift Employees not in shiftException Shift AssignmentTransport Pickup Report
Employee Self Services
Exit
IT Application
Timesheet
Training
Appraisal Claims &Reimbursement
Attendance
Recruitment
My Needs Advance
Travel
Officiation
PIMS
Asset
Shift
Source: Industry Sources
Figure 6.9 gives a bird’s eye view of an Employee Self Service system.
Employee and Manager Self Service is enabled through:
• Core practice areas: Training, Performance Management,
Recruitment, Absence Management and Personal Information
Management System. Self-service is also available in HR
administration and other non HR administration areas. (Refer
figures 6.9 and 6.10)

114
• Personal Information Management to manage and update
central employee directory, personnel dossiers, company
directories, personal calendars and internal service requests.
• Holiday/Absence Planning to maintain leave records, view
balance, plan holiday, apply for leave and track status of
application.
• Travel Request System to assist employees plan and receive
approval for business travel.
• Advance Request and Expenses System that allows employees
to request various advances by eligibility levels, claim
expenses and settle balances.
• Reimbursement System that allows employees to claim
eligibility.
• Staff Scheduling: Employees record work hours, work
schedules, vacation requests and obtains approval.
• Asset tracking: tracks ownership of company assets with
employees.
• Business Requirements such as stationery and business card
requests.

115
FigureFigureFigureFigure 6.6.6.6.10101010
HR Services under ESS and MSSHR Services under ESS and MSSHR Services under ESS and MSSHR Services under ESS and MSS
Dynamic Claim Construction
Workflow Tracker Employee Transfer Attendance Configuration
Compensation Template
Initiate Prejoining Activities
Organization Structure
IT Application Maintenance
Appraisal Intimation
View Prejoining
Activities Status Manage Role players
Normalization
Recruitment
Employee Data Maintenance
Training Administration
Master Test Template Create Vacancy Post Vacancy Resume Search and Short Listing Schedule Interview Schedule Test Interview Feedback Candidate History Make offer Offer Acceptance
Employee Details Contact Details Bank Details Driving License Education Details Certification Details Employment Details Appraisal Record Training Details Skill Details Critical Incident Details Medical History Accident History Past Employment Details
Course Registration Course Reschedule Training Appraisal Mapping Training Attendance Training Record Creation Participant Feedback View Faculty Evaluation
Asset
On boarding
Confirmation
My Needs
Leave
Asset Master Create Employee Employee Confirmation
Item Category Leave Configuration
Asset Category
Offer Document Checklist
Confirmation Appraisal
Leave Balance Adjustment
Generate Appointment Letter
Confirmation Letter
Induction
Training
Position Management
Appraisal
Exit
Template Faculty Function Profile Appraisal Calendar
Clearance Reminder
Induction Schedule Question
Template Interview Level Rating Scale
Definition Schedule
Interview
Induction Test Results
CPE or CPD Master
Position Management
Competency Definition
Final Closure
Key Result Area
Definition Employee
Deactivation
Employee Reinitiation
Relieving Letter
Claims & Reimbursement
Workflow break-up
Employee Movement/ Transfer
Attendance
Pay Details
Prejoining
Organization Setup
IT Application Appraisal Feedback
Source: Industry Sources

116
Figure 6.10 illustrates the entire gamut of HR Services that can be
catered through Employee Self-service and the management self-
service system.
FigureFigureFigureFigure 6.11 6.11 6.11 6.11
Sample selSample selSample selSample self servicef servicef servicef service flowcharts flowcharts flowcharts flowcharts
((((a) LEAVE REQUESTa) LEAVE REQUESTa) LEAVE REQUESTa) LEAVE REQUEST
(b) ASSET REQUEST (b) ASSET REQUEST (b) ASSET REQUEST (b) ASSET REQUEST ---- BY EMPLOYEEBY EMPLOYEEBY EMPLOYEEBY EMPLOYEE
Asset Requisition Approval
Asset Requisition
Mail Notification to Asset Facilitator &
Employee
Mail Notification to employee
Leave Request Approval
Leave Request Initiation
Source: Industry Sources
Figure 6.11 illustrates two sample self service flow charts- Leave
Request and Asset Request.

117
6.126.126.126.12. HR & Workgroup Analytics / Reporting. HR & Workgroup Analytics / Reporting. HR & Workgroup Analytics / Reporting. HR & Workgroup Analytics / Reporting
Planning and productivity go hand in hand when constant monitoring
is done. Alignment helps in being prepared and deliver exact
business results, saving in futile cost overruns in a big way.
HRMS Reports HRMS Reports HRMS Reports HRMS Reports
Employee History / New Joiners List / Components Master / Employee
Details Report / Employee Movement / Leave Balance / Leavers List /
Leave Transaction / Holiday Master / Location Master Details /
Employee Passport Details / Employee Visa Details / Employee Bank
Details / Employee Family Visa Details / Emergency Contact Details
Report / Employee Salary Details History.
Payroll Reports Payroll Reports Payroll Reports Payroll Reports
Annual Reports/ Employee Reports/ Master Reports/ Monthly Reports/
Payroll Process Reports/ Statutory Reports.
Tax ReportsTax ReportsTax ReportsTax Reports: Summary of Form 16/ Tax computation sheet/ HRA
Rent Declaration – Summary/ Investment Breakup – Summary.
6.6.6.6.11113333 WorkflowWorkflowWorkflowWorkflow
The backbone of any good HCM Software product, workflow is a
technical facilitator for automating transaction routing and
communication steps in a process. It coordinates the work effort to
multiple users, sends communication to the respective stakeholders

118
during steps in the processes. Enforce business processes by
configuration and zero coding, performs routing to various users,
managers authorization at each step and enables configurable
business process without affecting the front end. Workflow may not
necessarily be a module. For each of the processes, users may have a
choice either to have workflow or not.
6.16.16.16.14444 Role Role Role Role Players Players Players Players
Role players are facilitators to manage various transactions in an
HCM software product. The software provides great flexibility in
defining these role players. Using any combination of these
parameters - (location, grade, region, position and city) the role
players can be defined in the system. The power of this is that
employees of the same grade can be facilitated by different role
players depending on which location they operate. This enables the
system to be extendable to any complex organizational structure
spread across different geographies by any level.
6.16.16.16.15555 Key technology benefits of a gooKey technology benefits of a gooKey technology benefits of a gooKey technology benefits of a good HCM software d HCM software d HCM software d HCM software
product product product product
E-HRM helps customers achieve cost and time savings. It gets
translated to ‘hard’ cost savings, high levels of usage as well as ‘soft’
value benefits.
(Refer Table 6.1)

119
TableTableTableTable 6.1 6.1 6.1 6.1
Benefits of an ideal HCM software productBenefits of an ideal HCM software productBenefits of an ideal HCM software productBenefits of an ideal HCM software product
Positive & Positive & Positive & Positive &
High ROI High ROI High ROI High ROI
Easy to Easy to Easy to Easy to
ImplementImplementImplementImplement
High Extent High Extent High Extent High Extent
of Usageof Usageof Usageof Usage Easy to UseEasy to UseEasy to UseEasy to Use
Robust & Robust & Robust & Robust &
SSSSTableTableTableTable
SystemSystemSystemSystem
Achieved Achieved Achieved Achieved
Strategic Strategic Strategic Strategic
ObjectiveObjectiveObjectiveObjective
The cost is
(including
implementation
License,
Maintenance,
etc) much lower
than the savings
attained due to
employee & HR
time saved as
well as savings
due to reduced
communication
& stationery
costs
Can be
implemented
over existing
platforms No
large
investment
required in
hardware or
software
The system is
easy to
understand
and hence
easy to roll
out
All employees
in the
organization
can be
covered
across
regions
Web-based to
ensure
employees on
the move can
also access
the system
Automation of
routine HR
tasks are very
high. Very low
manual
interventions
Easy to navigate
and self
explanatory
screens
Comprehensive
and demarcated
modules
Easy to learn
Can
Handle
Large
number of
users
Errors,
both for
data and
system
are
negligible
Improves
employee
productivity
Creates a
transparent
environment
Reporting tools
assist in
informed
decision making
Communicates
and aligns
employees to
strategic goals
Source: Industry Sources
Table 6.1 illustrates the benefits of an ideal Human Capital
Management software.
E-HRM empowers businesses by:
• Providing a platform for better business-to-employee
communication thereby paving the way for a transparent,
positive organizational culture and higher productivity levels
amongst employees.

120
• Aiding in alignment of individual goals , providing for a
platform to agree on views and actions.
• Supporting informed decision making through analytics and
reporting tools that allow the Business Leaders and managers
to review performance and other metrics related to their human
capital.
• Giving all employees single-window web-based access to all
their HR processes, reducing time spent on administrative
activities, significantly enhancing individual and corporate
productivity.
• Relegating administrative efficiency to the machines while
creating a more strategy focussed HR department.
• Consolidating all employee information in one central
repository precluding the need for multiple employee data files
maintained by individuals across the HR department.
• Automating time and error prone manual processes, achieving
considerable reductions in administrative time and costs and
business process times.
E-HRM aims to help organizations and business leaders maximize the
human performance within and thereby deliver business growth. In
sum, e-HRM empowers HR leaders to engage and manage the real
assets in business: the Employees.

121
CHAPTER CHAPTER CHAPTER CHAPTER 7777
THE GLOBAL eTHE GLOBAL eTHE GLOBAL eTHE GLOBAL e----HRM HRM HRM HRM
SCENARIO SCENARIO SCENARIO SCENARIO

122
CHAPTER 7CHAPTER 7CHAPTER 7CHAPTER 7
THE GLOBAL eTHE GLOBAL eTHE GLOBAL eTHE GLOBAL e----HRM SCENARIOHRM SCENARIOHRM SCENARIOHRM SCENARIO
Human Resource Management, a relatively new term emerged during
the 1970s. Many people continue to refer to the discipline by its older,
more traditional titles, such as personnel management or personnel
administration. The past few decades have been characterized by the
emergence of the personnel department and the subsequent
transformation of this role from that of an administrator to, more
recently, a critical component in the competitive success of the
business.
Human resources as a function has evolved into Human Capital
Management (HCM). Where Human Resources was the responsibility
of a centralized, or sometimes decentralized department, Human
Capital Management is the job of everyone in the business, from
employees to executives.
(Refer figure 7.1)

123
Figure Figure Figure Figure 7777.1.1.1.1
Transformation of Human Resource to Human Capital ManagementTransformation of Human Resource to Human Capital ManagementTransformation of Human Resource to Human Capital ManagementTransformation of Human Resource to Human Capital Management inininin
BusinessBusinessBusinessBusiness
Source: Hal Gueutal (Editor), Dianna L. Stone (Editor), Eduardo Salas (Foreword by), ‘The Brave New
World of e-HR: Human Resources in the Digital Age’, Pfeiffer, 2005, Chapter 1- From Personnel
Administration to Business Driven Human Capital Management - Patricia A. K. Fletcher, p.3.
Figure 7.1 exhibits the Transformation of Human Resources to HCM in
the Business graph.
7.1 Emergence of Personnel Management7.1 Emergence of Personnel Management7.1 Emergence of Personnel Management7.1 Emergence of Personnel Management
In the early part of the 20th century, tax and wage legislation was
introduced to businesses, and by 1943 federal tax was mandated. To
comply with these new requirements, a new function/profession was
created—the payroll professional. This was a huge responsibility,
124
with significant consequences for miscalculation and noncompliance.
Payroll clerks struggled manually through hundreds and, at larger
firms, thousands of payroll records, often with human error, making
auditing, efficiency, and control a virtual impossibility. For some
companies, technology could not come soon enough. Those who
could afford it, like GE, pioneered the automation of the complicated
and cumbersome payroll process. GE implemented the first
homegrown mainframe payroll solution; they also had the first
automated payroll system to process the tens of thousands of
employees across the United States.
As the 70s approached social legislation such as Affirmative Action,
Equal Employment Opportunity, the Occupational Safety and Health
Act, and the Employee Retirement Income Securities Act created a
demand for companies to collect, store, manage, and report more
personnel data than ever before. Due to legislated corporate
responsibility for compliance of workforce practices and worker
safety, a new function was created— the personnel department.
Combined with the payroll department in many businesses, the
personnel department was primarily responsible for managing
personnel information, data, and processes, and ensuring that the
business was compliant with employment legislation.
The role of technology became more and more important. Some
companies, like GE, forced the issue by creating their own technology
before one was available on the market. Payroll vendors began to
emerge, offering not only technology, but in some cases, also

125
services to outsource this function. With the onslaught of legislation,
companies began to look seriously at technology to gain control over
workforce information without significantly increasing costs to the
business. Vendors began to promote Enterprise Resource Planning
(ERP) solutions that combined personnel data and payroll
applications. Some vendors also integrated financial controlling
systems with the Human Resource systems, so that companies could
not only make more efficient financial decisions, but also increase
control over where corporate dollars were spent. The payoff of
technology was not just compliance, operational efficiency, and
control; it also helped to focus resources on other activities beyond
keeping manual records.
As the 1980s came to a close, academicians discussed the changing
role of Human Resource Management. They speculated that many
Human Resource Departments would transform from a police and
polite administrator role into a more strategic role in the business.
7.2 From Personnel Management to Human Resource 7.2 From Personnel Management to Human Resource 7.2 From Personnel Management to Human Resource 7.2 From Personnel Management to Human Resource
ManagementManagementManagementManagement
As the 1990s approached, the pace of competition continued to
quicken as customers became more sophisticated in their demands
and Internet technologies began to emerge and tear down the barriers
to entry for competition. Manufacturing and services organizations
alike began to decentralize functions, while trying to maintain
centralized control through standardized processes and information.

126
In markets that rely heavily on “knowledge workers,” such as
services and high-tech industries, companies were beginning to
embrace telecommuting or virtual work as part of everyday
operations. With a much more diversified workforce in terms of
location, gender, race, talent/skills, career aspirations, and culture,
companies not only required better, more dynamic insight into
personal data, but also tools through which employees could feel
“empowered” and connected to the corporation.
From the mid- to late 1990s, for the United States and many other
Western countries, the dot-com era was alive and well. With sites like
e-Bay and Amazon.com, online commerce broke down competitive
barriers and opened new opportunities for budding businesses and a
new breed of entrepreneurs.
As the century came to a close the Y2K scare lead to a migration of
core data from old, legacy systems to new enterprise solutions that
promised foolproof protection against the potential hazards of Y2K
data loss. Companies that operated in the European Union during this
time were beginning to feel the heat from privacy protection acts
created by the EU to protect employees from information exchange
about them. But what companies required most was control and
insight into business operations.
As globalization continued, so did the rapid pace of competition.
Understanding where the talent was needed and how to quickly close
the talent gap was a core concern for every CEO, which resulted in a

127
push for more strategic technology and human resources practices
that were linked to business strategies, which were starting to be
coined “human capital management.” Using data from such
companies as Saratoga, Human Resources departments began to
collect employee metrics to compare themselves to others in their
industry on such measures as cost per hire, time to hire, and Human
Resources headcount per FTE (full-time-equivalent). Many of these
measurements were used as justification of the purchase and
implementation of Human Resource Information Systems (HRIS) to
automate the more non-value added transactions for which Human
Resources was responsible.
The hope for Human Resources was that with the non-value-added
processes automated, the Human Resources workforce could
concentrate on providing key services to executives, managers, and
employees. At companies such as TransAlta Corporation, a major
North American utilities player, reducing the amount of time on
transactional tasks meant the ability to focus on activities that would
positively impact its business.
Human Resources was transforming its role from just a payroll and
benefits provider into a key business partner who could enable
insight and deliver strategies on the business’s most important and
critical resource: its workforce. As the war for talent raged on in both
white-collar and blue-collar jobs, the timing was perfect. By the mid-
1990s, the Internet, or the Worldwide Web, was a common topic of
both social and business discussions. Many businesses had branded

128
corporate intranets that provided information for their employees,
virtual bulletin boards for information ranging from internal job
postings to a calendar of events, even allowing employees to post
“for sale” notices of private property. More and more, companies
were providing workers with home access to corporate systems via
an intranet. Companies were able to offer employees a way to manage
their personal and personnel information, working toward work/life
balance, while employers were able to keep employees connected to
their own information, enabling a better, more accurate depiction.
As the Human Resources team members became more visible and
value-added programs began to be employed, employees in many
businesses began to have a better relationship with Human
Resources, often seeking them out for career advice. Despite the
turnaround in many businesses, there still were many other
companies where Human Resources struggled to be seen as
valuable. In order to gain insight into even the most seemingly basic
information about the workforce in the 1990s, more and more
companies were beginning to embrace a more comprehensive
approach to HR automation through which disparate systems and
broken processes would be replaced with a “Human Resources
Information System” (HRIS).
Moving further into the decade, companies expanded the automation
of payroll and personnel data and began to capture time worked, as
well as intangible information that helped plan careers and
successions to key roles in the business. Human Resources began to

129
evaluate self-service applications to help streamline business
processes, capture better data, and—most importantly—put
information into the hands of those who most wanted and needed it:
managers and employees. Additionally, in order to keep control over
the integrity of the data and how the systems were used, many
processes leveraged workflow to create “checks and balances.”
Businesses were beginning to rely on data warehousing and analytic
tools to gain valuable insight into the workforce through dynamic
information gathered from across the business.
However, what began to happen—and still continues to be a problem
with many systems in use today— with the advent of the “information
age” came info-glut. Thus, many vendors began to market “portal”
solutions to enable the user to have a window into information he or
she would need to perform on the job, manage career decisions, as
well as manage personal business more proficiently. Users across the
business would gain access to the information needed to make better,
more informed decisions on anything from career mobility and job
performance to better training options and work/life decisions.
7.3 HR Transformation in the Digital Age7.3 HR Transformation in the Digital Age7.3 HR Transformation in the Digital Age7.3 HR Transformation in the Digital Age
From 2000 to the present, the world has seen tremendous change in a
very short span of time. Continued globalization, rising customer and
shareholder expectations, a volatile social and economic climate
plagued by the fear of terrorism, corporate scandal and the resulting
rise of corporate governance issues, downsizing, off-shoring, and a

130
“job-less economic recovery” in the Western world have combined to
create tremendous pressure on executives to create highly flexible
and innovative strategies to outperform the competition and increase
profits and market share while decreasing the cost of doing business.
Unlike the traditional HR approaches of the past, the practice of
human capital management views employee and collective workforce
success as a responsibility of everyone in the business. No longer are
corporate “people issues” the exclusive province of the Human
Resource team—a group that was, and many times still is, distant
from strategic decision making and whose contribution to the bottom
line often goes unrecognized.
In today’s knowledge-based economy, how well a company leverages
its human capital determines its ability to develop or sustain
competitive advantage. As a player in this new business age, Human
Resources or the organization focusing on talent must be able to
translate business opportunity into strategies that will clearly impact
the bottom line. In order to be taken seriously as a player, this
function, like any at the decision table, must be able to clearly
measure its impact. This requires not only the insight capabilities
from data mining and analytics tools created in the 1990s in and into
today, but also the new ability to interpret and use this information to
make value-creating human capital decisions about investments and
divestitures.

131
As the role of Human Resources transforms into a partner and player
in the business, the focus has broadened and now includes, in some
cases, workforce productivity. Now when Human Resources look to
technology to enable business functions, it no longer looks to
solutions to solely automate back-office functions, both transactional
and strategic; they also want solutions that enable a more productive
and focused workforce. As a result, many corporations have adopted
a portal strategy that leverages not only internal production systems,
but also enables collaboration across and outside of the business.
As the market is slowly turning around, many businesses are looking
at and implementing e-recruiting solutions to not only attract outside
talent, but to manage talent internally. New e-recruiting solutions
enable employers to maintain a talent pool, with Customer
Relationship Management like capabilities to maintain relationships
with viable internal and external applicants, alumni, and partners,
even if employment is not offered immediately. Human Resources and
training organizations alike are increasingly turning to e-learning
solutions, many of which provide simulated training so that
employees are better prepared to perform their jobs. In many
applications, e-learning is also integrated with knowledge
management so that employees can access training documents and
other related materials. From an individual perspective, many Human
Resources organizations are turning to an automated balanced
scorecard approach to link employee and team goals to corporate
objectives.

132
7.4 HR in the midst of a seemingly endless transformation7.4 HR in the midst of a seemingly endless transformation7.4 HR in the midst of a seemingly endless transformation7.4 HR in the midst of a seemingly endless transformation
Today, every Human Resources department is in the midst of a
seemingly endless transformation, one that not only encompasses
the function of the Human Resources department, but also its role
within the business, the relationships it maintains, and the technology
it uses and is responsible for deploying. It is clear that transformation
of Human Resources is inevitable. More and more, businesses are
realizing that people are the only true differentiating factor in long-
term competitive success.
7.57.57.57.5 Recent trends in eRecent trends in eRecent trends in eRecent trends in e----HRMHRMHRMHRM
This section highlights the global e-HRM trends in recent times.
7.5.17.5.17.5.17.5.1 ModelModelModelModel of HCM Excellence of HCM Excellence of HCM Excellence of HCM Excellence
The Cedar Crestone survey on the state of HR technology adoption
covering organizations across North America, Europe, Asia and
Australia chalks out a roadmap followed by most organizations that
have an ERP-based HRMS as their foundation.
(Refer figure 7.2)

133
FigureFigureFigureFigure 7.2 7.2 7.2 7.2
Cedar Crestone model of HCM Excellence for organizations having an Cedar Crestone model of HCM Excellence for organizations having an Cedar Crestone model of HCM Excellence for organizations having an Cedar Crestone model of HCM Excellence for organizations having an
ERERERERPPPP----based HRMS as their foundationbased HRMS as their foundationbased HRMS as their foundationbased HRMS as their foundation
Source: CedarCrestone 2008-2009 HR Systems Survey
Figure 7.2 shows the Cedar Crestone model of HCM Excellence for
organizations having an ERP-based HRMS as their foundation.
The roadmap followed by most organizations that have an ERP-based
HRMS as their foundation is as follows-
Administrative ExcellenceAdministrative ExcellenceAdministrative ExcellenceAdministrative Excellence ----
Core HRMS/ERP Foundation: Organizations begin their journey
towards overall HCM excellence with the deployment of core record
keeping systems—typically a state-of-the-art HRMS along with payroll
and possibly benefits administration.
134
Workforce Management: This category includes functions for time
and attendance, absence management, labor budgeting, forecasting,
scheduling, and, increasingly, task management.
Keeping these pieces at a best practice level through upgrading to
recent vendor releases enables organizations to achieve
Administrative Excellence.
Service Delivery ExcellenceService Delivery ExcellenceService Delivery ExcellenceService Delivery Excellence
Organizations with self service applications, increasingly under a
portal umbrella and moving to a service center approach, augmented
by call center technology and a knowledge base that couples person-
specific content with transactional services, are achieving Service
Delivery Excellence.
Self Service and Workflow incorporates Benefits, Pay, Personal Data;
Promotions, Transfers, Salary Actions; and Approvals and
Notifications.
Portal Framework incorporates Identity Management and Single Sign-
on.
Performance ExcellencePerformance ExcellencePerformance ExcellencePerformance Excellence
Organizations with the strategic HCM applications (talent
management) along with a data warehouse that brings data in from
other sources, and analytics to enable measurement and reporting of
workforce performance, are achieving Performance Excellence.

135
7.5.27.5.27.5.27.5.2 Global trends in eGlobal trends in eGlobal trends in eGlobal trends in e----HRM HRM HRM HRM ---- Highlights Highlights Highlights Highlights
(Based on the Cedar Crestone Survey on the state of HR technology
adoption 2008-2009)
• Topping the list of initiatives are activities around metrics and
analytics.
• Administrative applications are very mature with some
movement from in-house to software-as-a-service solutions,
hosting, or full business process outsourcing.
• Service delivery applications continue to be adopted. A move to
a service center approach with an HR-oriented help desk is a
key differentiator.
• Web 2.0 innovations are the arena of early adopters.
Organizations using social networking for recruiting and
branding had double the sales growth of organizations without
these tools.
• The learning management application in any combination with
other talent management applications is linked to the strongest
revenue growth.
• An integrated talent management approach with service
delivery, talent management, and business applications on the
same platform as the core HRMS is a best practice.

136
• The stance organizations are taking regarding sourcing is not
one of total business process outsourcing where processes
and systems are lifted and shifted to an outsourcer. It is still
one of selective outsourcing.
• Change management continues to be the one key differentiator
towards achieving a successful HR technology project or
sourcing change.
7.57.57.57.5.3.3.3.3 Overall Application AdoptionOverall Application AdoptionOverall Application AdoptionOverall Application Adoption
Looking at overall average application adoption, we see the following
adoption pattern.
• Early adopters include high-tech and financial services
organizations. For example, these organizations have more
aggressively moved to some of the Web 2.0 recruiting and
branding technologies as well as the measurement
technologies.
• Mainstream adopters in order of overall average application
adoption are: Agriculture/Mining/Construction (a category that
includes many of the oil and energy companies),
Transportation/Communications/Public Utilities, Other
Manufacturing, Other Services, Retail/Wholesale, and Health
Care.
• Late adopters include Higher Education and Public
Administration.
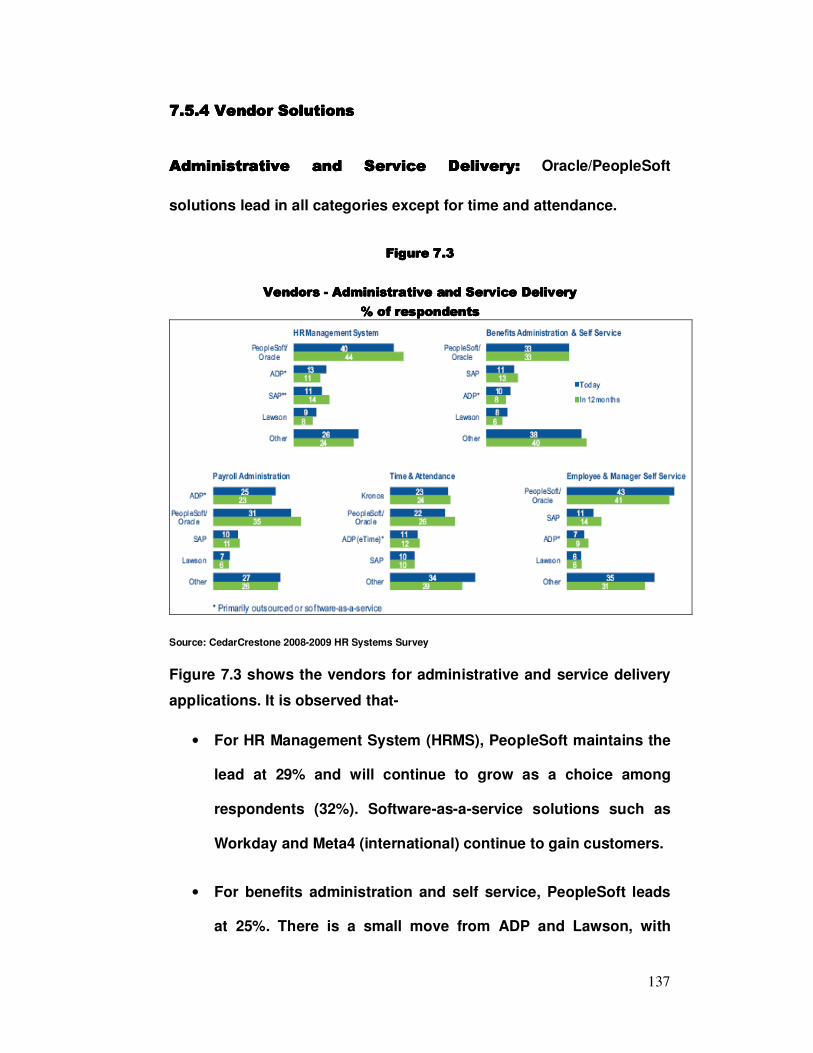
137
7.5.47.5.47.5.47.5.4 Vendor SolutionsVendor SolutionsVendor SolutionsVendor Solutions
Administrative and Service DeliAdministrative and Service DeliAdministrative and Service DeliAdministrative and Service Deliveryveryveryvery:::: Oracle/PeopleSoft
solutions lead in all categories except for time and attendance.
Figure 7.Figure 7.Figure 7.Figure 7.3333
Vendors Vendors Vendors Vendors ---- Administrative and Service Delivery Administrative and Service Delivery Administrative and Service Delivery Administrative and Service Delivery
% of respondents% of respondents% of respondents% of respondents
Source: CedarCrestone 2008-2009 HR Systems Survey
Figure 7.3 shows the vendors for administrative and service delivery
applications. It is observed that-
• For HR Management System (HRMS), PeopleSoft maintains the
lead at 29% and will continue to grow as a choice among
respondents (32%). Software-as-a-service solutions such as
Workday and Meta4 (international) continue to gain customers.
• For benefits administration and self service, PeopleSoft leads
at 25%. There is a small move from ADP and Lawson, with

138
Oracle, SAP, and a myriad of “other” providers picking up
adoption.
• For payroll administration, ADP is the leading provider of
payroll solutions today (25%). Many organizations are shifting
from ADP towards integrated solutions.
• For time and attendance, Kronos maintains a lead today but
over the next 12 months, the workforce management solutions
of Oracle/PeopleSoft will gain share, again adding to a move
towards integrated solutions.
Strategic HCM and MeasurementStrategic HCM and MeasurementStrategic HCM and MeasurementStrategic HCM and Measurement Applications Applications Applications Applications:::: The “best of
breed” vendors such as Taleo and SumTotal/Pathlore give the ERP
vendors some competition today. The picture ahead, however, is one
indicating a continued move away from these vendors towards an
integrated solution based on the core HRMS.
(Refer Figure 7.4)

139
Figure 7.Figure 7.Figure 7.Figure 7.4444
VendorsVendorsVendorsVendors---- Strategic and Measurement Applications Strategic and Measurement Applications Strategic and Measurement Applications Strategic and Measurement Applications
% of Respondents
Source: CedarCrestone 2008-2009 HR Systems Survey
Figure 7.4 shows the vendors for Strategic and Measurement
Applications. It can be observed that-
• For compensation management, PeopleSoft (25%) and Oracle
(10%) lead.
• With the acquisition of Vurv, the combination of Taleo/Vurv now
leads the talent acquisition category. Over the next 12 months,
however, there is indication of a move away from these
software-as-a-service vendors towards integrating this
application onto either PeopleSoft/Oracle or SAP HR
management systems.

140
• For the learning management category, Pathlore/Sum Total
leads PeopleSoft (13% to 12%) today but its customers are
clearly looking at other solutions over the next 12 months. The
best of breed vendor, Saba, will pick up some of these
customers.
• With succession planning, PeopleSoft (16%) and Oracle (4%)
slightly lead the category. Going forward, best of breed vendor
SuccessFactors will continue its move to dominate this
category.
• For the performance management category, PeopleSoft (15%)
and Oracle (4%) lead today and will surge ahead in the next 12
months (18% and 6% respectively). This increase among
PeopleSoft, Oracle, and also SAP respondents again indicates
an overall market move towards an integrated solution based
on the core HRMS choice.
• With the BI and/or workforce measurement analytic category, we
see a battle for dominance between PeopleSoft (15%)/Oracle
(10%) and Business Objects (14%)/SAP (11%) today and over the
next 12 months (PeopleSoft 18%, Business Objects 19%, SAP
15%, and Oracle 17%).
7.5.57.5.57.5.57.5.5 SourcingSourcingSourcingSourcing
The key drivers for HR solutions vary by the three major approaches
as shown in the following Table 7.1

141
TableTableTableTable 7.1 7.1 7.1 7.1
SSSSourcing solutionsourcing solutionsourcing solutionsourcing solutions and Key Drivers and Key Drivers and Key Drivers and Key Drivers
ApproachApproachApproachApproach Key DriverKey DriverKey DriverKey Driver
In-house Achieving return on Investment
Outsourcing(systems/processes) Administrative Services expense reduction
Software-as-a-service Reduce software implementation times
Source: CedarCrestone 2008-2009 HR Systems Survey
Some noticeable trends are-
• The payroll application and process is more partially or fully
outsourced than the core HR record keeping application and
process.
• The overall move towards outsourcing has increased by 18 %
from 2007.
• The stance organizations are taking though is not one of total
business process outsourcing, where the entire process and
core record keeping system and possibly other applications are
totally lifted and shifted to an outsourcer. It is still one of
“selective outsourcing.”
7.7.7.7.5.65.65.65.6 EEEE----HRM trends in the AsiaHRM trends in the AsiaHRM trends in the AsiaHRM trends in the Asia----Pacific (APAC) countriesPacific (APAC) countriesPacific (APAC) countriesPacific (APAC) countries
(Based on Findings of the CedarCrestone 2008-2009 HR Systems
Survey - Focused on Asia and Australia). This survey focused on
getting additional responses from Asia Pacific (APAC) countries

142
including Australia, China, Hong Kong, India, Korea, Malaysia, New
Zealand, Philippines, Singapore, and Taiwan.
RegionalRegionalRegionalRegional Variations Variations Variations Variations
• Australia/New Zealand (ANZ)Australia/New Zealand (ANZ)Australia/New Zealand (ANZ)Australia/New Zealand (ANZ)
The top initiatives where ANZ respondents are spending time is
led by work on improving business process improvements. This is
a very smart profile before beginning automation efforts. The top
automation under way includes portals and employee and
manager self service. The top talent management initiative is
learning management—again a very smart focus in a down
economy—to focus on developing the workforce. Of all the
regions, ANZ is most likely to choose an integrated talent
management application approach, again a smart move as this
delivers a lower total cost of ownership.
ANZ organizations are generally at the leading edge of technology
adoption in the APAC region. They take a holistic view of their
organizational needs. This includes the incorporation of back
office solutions such as financials, human resources record
keeping, and staffing, as well as integration to front-office
products such as a customer relationship management application
and identity management technologies.
• North Asia (China, Hong Kong, Taiwan)North Asia (China, Hong Kong, Taiwan)North Asia (China, Hong Kong, Taiwan)North Asia (China, Hong Kong, Taiwan)
In terms of the initiatives underway, the organizations are
following a similar path to other worldwide global organizations. It

143
is one based on "doing the basics first," which means developing
an HR systems strategy and engaging in business process
improvement before technology implementation.
North Asia organizations have above average adoption of manager
self service and thus are achieving some of the stronger benefits
of service delivery automation. For talent management
applications, they have then deployed training enrollment, learning
management, and competency management. The North Asia
respondent organizations are also spending time on aligning
employee performance with organizational objectives and some
are implementing the performance management application.
• South Asia (India, Malaysia, Philippines, Singapore, South Asia (India, Malaysia, Philippines, Singapore, South Asia (India, Malaysia, Philippines, Singapore, South Asia (India, Malaysia, Philippines, Singapore,
Thailand)Thailand)Thailand)Thailand)
The South Asia respondents particularly among the Indian
organizations are strongly focused on aligning employee
performance with organizational objectives and implementing the
performance management application. They are also implementing
competency management and succession planning. In fact, the
Indian organizations are further along than the other countries of
the region in talent management application adoption.
Indian organizations are much further along than any other
country in their adoption of the HR-oriented help desk. As leading
outsourcing firms serving the rest of the world, many of these
organizations use this technology to serve customers, and are
also applying it to their own employee base. Finally South Asia

144
respondent organizations are quite a bit further along than other
regions in their adoption of the business intelligence applications,
with the most work being done among the Indian Financial
Services organizations.
Focus on Web 2.0 TechnologiesFocus on Web 2.0 TechnologiesFocus on Web 2.0 TechnologiesFocus on Web 2.0 Technologies
In the APAC nations over 40% of respondents are engaged with some
Web 2.0 technologies and these are particularly pertinent for talent
management for recruiting, branding, learning, and collaboration.
Refer Figure 7.5
Figure Figure Figure Figure 7.57.57.57.5
Organizational Support for Web 2.0 Technologies Organizational Support for Web 2.0 Technologies Organizational Support for Web 2.0 Technologies Organizational Support for Web 2.0 Technologies ---- Asia Pacific Asia Pacific Asia Pacific Asia Pacific
Source: CedarCrestone 2008-2009 HR Systems Survey (APAC)
Of note is that South Asia region respondents are ahead of others in
use of Web 2.0. This is because some of the professional services
organizations based in India are using social networking tools for
recruiting. In fact, some of these organizations exclusively use
Facebook and other similar sites for recruiting.

145
Worldwide, twice as many early adopters (financial services and high-
tech organizations) use social networking for recruiting and branding,
as well as wikis for collaboration. These respondents also had double
the sales growth of those without the tools and are reaping some
early advantages in areas including- On-boarding, Recruiting,
Learning and Performance management.
Focus on Business IntelligenceFocus on Business IntelligenceFocus on Business IntelligenceFocus on Business Intelligence
On the warehouse front, APAC respondents report they use a data
warehouse fine tuned for HR more frequently than some other
warehouse that includes workforce data, although among Australian
organizations, the enterprise warehouse is the preferred choice.
Vendor ChoicesVendor ChoicesVendor ChoicesVendor Choices
PeopleSoft and Oracle lead as the vendor solution in place in all the
administrative and service delivery applications and continued
growth appears strong.
(Refer Figure 7.6)

146
FigureFigureFigureFigure 7. 7. 7. 7.6666
Vendors Vendors Vendors Vendors ---- Administrative and Service Delivery Administrative and Service Delivery Administrative and Service Delivery Administrative and Service Delivery ---- Asia Pacific Asia Pacific Asia Pacific Asia Pacific
% of respondents% of respondents% of respondents% of respondents
Source: CedarCrestone 2008-2009 HR Systems Survey (APAC)
PeopleSoft and Oracle also lead with the various talent management
and measurement applications and there is likely to be an increase in
adoption of these applications using the solution provided by the
core HRMS system provider.
Over the years a common set of barriers have been observed led by
one theme- inadequate funding and the inability to show value. Some
other barriers are - Lack of infrastructure (initially web infrastructure
for self service and today a business intelligence infrastructure for
workforce analytics; Lack of analytical and technical skills; Security
fears and Poor /Non-existent change management.

147
CHAPTER CHAPTER CHAPTER CHAPTER 8888
THE INDIAN eTHE INDIAN eTHE INDIAN eTHE INDIAN e----HRM HRM HRM HRM
SCENARIO SCENARIO SCENARIO SCENARIO

148
CHAPTER 8CHAPTER 8CHAPTER 8CHAPTER 8
THE INDIAN eTHE INDIAN eTHE INDIAN eTHE INDIAN e----HRM SCENARIOHRM SCENARIOHRM SCENARIOHRM SCENARIO
E-HRM or the use of technology to enhance the value of HR delivery
in an organization isn’t new to India Inc. But what started with
automation of basic HR transactions is now a key element in the HR
department’s much vaunted transformation into a strategic business
partner. As per the HRD Survey 1996 conducted by Business
Today-Gallup, the major concerns of the managers regarding their
companies' HRD practices included- lack of proper recruitment,
absence of effective appraisal systems, low compensation,
absence of team spirit, lack of career planning and lack of job
satisfaction. Majority of the human resource managers as well as
managers felt that there was a need for Integrated Human
Resource Management Systems in companies.
8.18.18.18.1 EEEE----HRM in India: Vendor Solutions over the yearsHRM in India: Vendor Solutions over the yearsHRM in India: Vendor Solutions over the yearsHRM in India: Vendor Solutions over the years
The pioneers in adopting and apparently in benefiting from the e-HRM
initiatives have been companies in the IT, BPO and retail banking
sectors where employee numbers run into tens of thousands. But
now even traditional FMCG companies are following suit. HR
departments in many non-IT companies are also adopting e-HRM.
Several companies like Maruti, Glaxo SmithKline Beecham, Hero
Honda, Ranbaxy Laboratories Ltd. and Dabur have implemented IT to
enhance their HR functionalities.

149
8.1.18.1.18.1.18.1.1 1995 1995 1995 1995 –––– 1999 1999 1999 1999
Way back in 1996, RS Software introduced Icon, a human resource
management package and in 1998 human resource management
solutions provider Ramco Systems, a division of the Ramco
Industries designed the Ramco Marshall, a software for client server
computing, comprising over 35 enterprise resource planning (ERP)
solutions including human resource management applications.
In 1999 Siemens Information Systems Ltd. (SISL) got a contract from
ONGC for implementation of SAP R/3 –ERP package for the human
resource and facility management functions of ONGC and this was
the single largest human resource package in the Asia-Pacific region,
covering 48,000 employees and over 70 locations of ONGC in India.
Abreast of the dotcom surge, SISL undertook the larger Web-
enabling project work for the S Kumars group. Soingo and Magic
Viewer are two very important medical software products SISL has
developed (2000). In the telecom segment the company is
responsible for setting up call centres for Reliance Telecom,
AirTel and the Delhi Police and also the Department of
Telecommunications (DoT) of the Government of India and the
Indian Railways (IR). The company has main thrust into
healthcare, telecom software development and system integration.
Ramco Systems launched an ERP solution catering to all the HR
requirements of a financial institution (1999). The modules included
personnel, payroll, benefits, training, HR analyst and kiosk, the cost
150
ranging from Rs. 20 lakh to Rs. 50 lakh depending on configurations,
customization, locations and number of users. The initial list of
customers of Ramco’s HRMS included ANZ Grindlays, ICICI, IDBI
Bank, the National Stock Exchange and expanded to several others
including HDFC Bank and ITC Hotels Ltd. Later, Ramco Systems also
launched the ERP package-Ramco ITsuite taking into consideration
the peculiar problems of the IT industry such as- mobility of
employees, project based work and multi-currency transactions.
In 1999, Systime Computers Limited released Calibre, an HRMS
software solution targeted at multi-locational companies. The
modules included- HumanSys which helps a human resource
manager in training analysis and planning, budgeting, objective
driven performance appraisals and in-depth recruitment management;
PayCalc is a payroll and TimeKeeper helps in tracking employee
movements, leave and attendance management.
Around the same time Infotrack Systems Private Limited of
Hyderabad announced the development of a complete HRMS
software- Infotrack-HRMS developed at a total cost of Rs 5 crore and
costing Rs. 20 lakh for base installation/implementation and suited for
public sector units, banks and IT firms having large number of
employees. Infotrack-HRMS allowed a high degree of flexibility by
offering a wide range of masters that enable the user to set up the
system as per the organization’s needs- business group master,
company master, skill master, skill hierarchy, qualification and
designation master, country, city and state masters.

151
8.1.2 8.1.2 8.1.2 8.1.2 2000 2000 2000 2000 ---- 2004 2004 2004 2004
In the year 2000 Tata Consultancy Services (TCS) launched TAO
Systems as a human resource consulting line of business. The
system facilitates the organization transformation by integrating
organization development and human resource development
interventions with information technology. The system comprises
management tools, training interventions, and decision support
systems. These would enable the client organization in preparing for
as well as meeting challenges on strategy, business process
engineering and managing transformational change.
Software Technology Group's (STG) development division is
responsible for setting up a company-wide Intranet system for Gas
Authority of India Ltd (GAIL). The Intranet was to manage the
documentation of GAIL's financial and material management
systems and Human Resource (HR) system. The Intranet has a
built-in online approval system with an e-mail enabled notification
system. It is also equipped with a Smart Card security system for
authentication.
Vakrangee Software Ltd (VSL) of Mumbai in 2001 completely
automated the Human Resource (HR) Department of Maharashtra
government through a Personnel Information System (PIS). The
multilingual software consisted of three modules, payroll,
establishment and vigilance.

152
Ramco Systems Ltd. (RSL) was rated amongst top 100 enterprise
product vendors worldwide (Express Computers, July 2002). The
company's HR and payroll solutions, Ramco HRMP, has been
implemented in over 50 organisations globally, including ICICI
Bank, Central Bank of India, Godrej Soaps, Intel, Shopper's Stop,
Singapore Sports Council, National Bank of Oman and Radisson
Edwardian Hotels of the UK. It is also available in various bundles
to cater to the needs of SME organisations, call centres, software
companies and payroll outsourcing centres. RSL also received an
order from the Government of Andhra Pradesh to design, deploy
and implement human resource management solutions (HRMS),
self-service and learning management solutions. The RSL-led
consortium comprises Hewitt Associates and The Boston Group.
The consortium won the order because of its building expertise
and solution delivery infrastructure called Ramco Virtual Works.
The solutions were deployed to increase the quality of service of
the employees of the Government of Andhra Pradesh.
In 2003, Kodak India Ltd launched online employee development
forms and program, called gold process, as part of its global
human resource information system (HRIS) initiative. It was part of
the online succession planning initiative to identify successors for
the top management of the company for its worldwide businesses.
The system identified capable employees through this system with
their skill sets to identify if they are suitable for senior
management positions in the company. This is an online process.

153
The supervisors and subordinates chalk out a 12-monthly action
plan, based on goals and capabilities as part of the initiative. The
belief was that online initiatives will make the process transparent.
The system also has half-year feedback systems that evaluate the
achievements and misses of the subordinates.
Chennai-based Accel ICIM Systems and Services Limited, provider
of information technology solutions implemented JD Edwards
enterprise resource planning for various functions including
human resources and provided indigenously developed HR and
payroll solution (2004).
Progen ERP Systems of Mumbai (2003) targeted to install its
Enterprise Resource Planning (ERP) software in 200 pharma
companies operating in the small and medium sector by 2005. The
ERP named PERP was specially designed for small and medium
size pharma companies, which cannot afford extensive ERP
packages like SAP, BAAN or Peoplesoft, which are primarily for
large-scale companies and cost Rs1.5 to Rs2 crore. PREP costed
only between Rs30, 000 to Rs60, 000. The ERP package comprised
of six main modules including Human Resources Development
(HRD) and many more applications customised to suit the specific
requirements of the clients.
Manipal Education and Medical Group (2003) set out to automate
its campus management, financial management and human
resource management systems, for which it chose enterprise

154
applications from PeopleSoft India, Bangalore. Fifteen campuses
of the group in Manipal, Nepal, Sikkim and Malacca (Malaysia)
were automated. Around 2004, BaaN staged a comeback as a
specific enterprise software manufacturing company under the new
brand, SSA Global with solutions including BaaN CRM, ERP, etc. The
company supports the pharmaceutical, electronics, automotive,
projects and process industries.
Empower Works Ltd, a part of Polaris Software Labs of Chennai,
developed a human resources software tool called Adrenalin to
improve productivity (2004). The package had modules such as
eRecruitment, Performance and Talent Management Systems,
Project and Resource Planning Systems, Training and
Development. Adrenalin covers human resources, employee
process automation and analytics, enabling the transformation of
a workplace in terms of greater employee productivity.
Oracle Software India Private Limited inculcated India-specific
features like Indian Income tax forms to its Human Resource
Management Systems (HRMS) Suite (2004). The Indian payroll
module enabled new and existing customers to incorporate Indian
taxation rules and aid in calculation of taxes. Oracle had about 40
customers in India and the payroll module will be made available
to them. With the help of Oracle HRMS, companies could manage
varied aspects of their workforce such as payroll and expense
management, recruitments, hiring, benefits, administration, and
training and performance management.

155
HCL Comnet Systems and Services Limited, the information
technology (IT) services management arm of HCL Technologies, in
2004, developed an online tool to connect human resource called
the Smart Business Manager (SBM). SBM is a workflow- based
automation and reporting initiative, which connects all employees
at a global level. It tracks, monitors and updates business
activities across ten business applications like enterprise
resource planning, human resources and sales force automation.
It is a real time reporting and time monitoring tool, which is
transparent.
In 2004, Bharat Electronics Limited signed an agreement with
Wipro Infotech Limited for implementation of MySAP Business
Suite that included human resources, business intelligence and
other modules. In 2005, HCL Technologies Limited reported
efficient management of information through the deployment of
SAP R/3 enterprise resource planning (ERP) package installed in
2001. The package has standardized and integrated all the
processes of the company across global locations. In August
2005, New Delhi Power Limited implemented mySAP ERP 2004
version by SAP India Consulting. Around the same time Paradyne
Infotech of Mumbai developed HrWorQ which is a suite of human
resource information management systems.

156
8.1.38.1.38.1.38.1.3 2005 2005 2005 2005 ---- 2009 2009 2009 2009
In 2005, Kals Information Systems Private Limited of Bangalore, a
provider of software development services, established a human
resource supply division called Aarohum which would offer a
range of products such as annual sourcing contracts and project
sourcing services. Kenexa Technologies launched a new product
in the human resources domain in June 2007. The product, called
e-human capital management, is a complete human resources
(HR) hiring and retention solution, which can be integrated
seamlessly with software architecture planning and enterprise
resource planning systems of an organisation. The solution
contains modules such as applicant tracking, phone screening
and skills and behavioural assessments.
Patni Computer Systems Limited implemented Human Resource
Management Systems (HRMS) at the Bombay Stock Exchange
(BSE). The integrated system enables interaction between human
resource management and information technology. Patni
Computer has also developed a Web-based application to track
issues raised by users (2007). Also, Nimbus Systems (P) Limited
launched Crown24KT, a complete enterprise resource planning
(ERP) solution designed exclusively for the gem and jewellery
industry. The solution is supported by the Microsoft Dynamics
AX4.0, an ERP software for midsize and larger companies. Nimbus
Systems is India's leading information technology service

157
provider to the gem and jewellery industry. Crown24KT will benefit
jewellery manufacturing, precious metal/stone/diamond
management, jewellery inventory management, financial
accounting/CRM, human resource management and business
reports and MIS. Blueshift India Limited experienced a huge spurt
in demand for recruitment automation tools. Blueshift markets
Blueshift RMS (recruitment management systems) to help process
resumes faster and better.
In 2008, Ramco Systems Limited bagged an order for its Human
Capital Management solution from Landmark Group, India. The
solution was aimed at automating the human resources function
and integrating it with other processes within the organization.
Also, NIIT Technologies Limited entered into a tie up with Ramco
Systems. NIIT Technologies software as a service (Saas) made use
of Ramcos OnDemand ERP range for functional processes such
as human resource management and payroll, financials and sales
and distribution. Ramco Systems used NIIT Technologies
operational excellence to expand its solution offering.
SAP India Private Limited and the Mahindra Group inked an
enterprise agreement for consolidation of the group's systems
(2008). Under the agreement, common processes across the
Mahindra Group of companies, such as human resources,
employee services, administration, finance, procurement and
analytics, will be standardised on the SAP technology platform.

158
The agreement will cover all software, maintenance, consulting
services and support under SAP's support offering.
8.1.48.1.48.1.48.1.4 Current ScenarioCurrent ScenarioCurrent ScenarioCurrent Scenario
In the current Indian scenario we can right away think of two most
frequently used names viz. SAP and People Soft. These packages are
highly customizable and can address unique needs of companies. A
considerable number of companies in India are currently tuned in to
SAP alone. Some prominent names amongst these are ONGC, Asian
Paints, L&T, Cadbury, IOC, BPCL, Grasim, Essar, TATA, Jet Airways,
GM, Eicher, Bajaj, Wipro, Infosys, Siemens, ICICI, Reliance and many
more. Amongst the popular HR Packages is EnTrust HR & Payroll
solution offered by Comtel Technologies and also Payroll Champion
from ProcessWeaver. Greytip Software provide HR and Payroll
Software Solutions, called Folklore HRIS, for small and large
organizations. Folklore currently enables processing of more than
3,00,000 pay-slips across more than organizations. Some of the
clients include Dell Computers, HP Globalsoft, Mphasis-EDS, TESCO.
Adrenalin offers a complete online HR & Payroll solution. It offers
four custom packages to suit the business needs and budgets-
Adrenalin Basic, Adrenalin Suite, Adrenalin Smart-build and Adrenalin
SaaS. Saviour has legal activities of all types of payroll and the
EmpXtrack Payroll Software is based on SaaS platform and caters to
small business to large enterprises. Another popular HR Package in
India is Applecart HR & Payroll solution offered by Cosmosoft

159
Technologies. Advanced Payroll Processing & Live Employee Career
management, Appraisal, Recruitment and Training (APPLECART),
provides a comprehensive solution for managing the work force with
powerful querying and reporting features. The various subsystems
under the APPLECART are Personnel Management, Payroll & Tax
Accounting, Leave & Loan management and Joint Venture Passing.
Optimizer Consultancy Private Limited is in the business of payroll
processing and HR related activities. HumaNET is one of the fastest
growing HR software in the industry. With End to End HR functions it
captures from recruitment to retirement all the modules. It also has
the services available on SaaS. HumaNET payroll is a multi company
and multi location product.
Ramco HCM with Analytics, an end-to end comprehensive solution for
Human Capital Management drives the transformation and
automation of HR Service Delivery and enables Best-practice
Workforce Management. It also helps organizations to take critical
business decisions with confidence, synchronize financial and
operational human capital strategies and develop a targeted talent
management plan. Functionalities covered are: Workforce Planning,
Succession Planning, Core Payroll, Performance, Management
Training, Talent Acquisition, Leave Management and Time &
Attendance and Employee Data Management. Altec Ipc Information
Processing Ltd offers a software package - Agile e-hr. Agile e-hr
payroll is multi-user software and an advantage is software can work
in multi currency.
160
8.28.28.28.2 Some noteworthy eSome noteworthy eSome noteworthy eSome noteworthy e----HRM ApplicationsHRM ApplicationsHRM ApplicationsHRM Applications
ICICI Bank has 26,000 employees on its rolls and an estimated
100,000 potential candidates being interviewed every year. Also
consider the case of Reliance Industries with a mammoth employee
base, a large proportion being in a state of flux due to transfers,
promotions, seeking better pastures, etc. at various points of time.
Now, by automating most processes, including recruitment and
integrating them into a central HR management system companies of
the scale of ICICI Bank and Reliance are able to run their HR
departments not only with fewer people but more efficiently as well.
What started with automation of basic HR transactions is now a key
element in the HR department’s much vaunted transformation into a
strategic business partner.
At ICICI Bank’s e-HR portal employees cannot only check their
Provident Fund, Gratuity, Leave Travel Allowance status or the
current value of their ESOPs online but trade in those options as well.
Interestingly so, the week’s cafeteria menu is available on the portal.
Wipro, shifted most of its routine-HR work to a web-based portal
resulting in higher employee satisfaction due to faster HR decisions.
If a foreign travel request had to be sent in paper form, earlier it could
take nearly an hour. Now, on the web, it can be done in minutes. For a
company of its size – with several thousand employees spread all
over – the sheer size of paperwork and HR interaction required was
mind-boggling and inefficient. Consider the complexity of paper-
based processes if HR has to handle leave requests, reimbursements,

161
travel plans, appraisals, recruitment and career planning for each one
of them.
Godrej has been implementing e-HR with its Godrejite portal to e-
enable routine-HR tasks. It also runs an eTraining initiative called
eGyan, where the content is currently out-sourced from Personalitree,
Learn At Satyam and Managementor. At Infosys with strength of
about 49,000, an employee is appraised on various parameters for
every project that he/she executes through the year. When final
appraisals are made at the end of the year all the details are already
available on the system.
At PepsiCo India, employees log on to the company’s global HRMS
software portal to manage their profiles and set development goals
for the future. Their e-HR software called the Connect Survey enables
employees to rate their bosses on parameters like whether they
recognize their efforts, enable them recognize good work-life balance
or connect them beyond day-to-day work.
TCS recently launched its digital HR Information System, which
allows an individual to apply for leave, get online approvals, file for
loans directly and voice grievances. TCS, employee benefits also
include Visa Information Processing System (for checking visa
status) and the Branch Assets library being maintained on the
company’s intranet by the HR department.

162
Figure 8.1Figure 8.1Figure 8.1Figure 8.1
IDBI Bank’s eIDBI Bank’s eIDBI Bank’s eIDBI Bank’s e----HR process flow HR process flow HR process flow HR process flow –––– A sampler A sampler A sampler A sampler
Source: ‘Automating Employee Interactions’ Indian Management, June 2003, p.60

163
It can be observed from figure 8.1 that at IDBI Bank, various HR
processes have been broken down into a logical sequence outlining
the minutest details. This is then mapped onto the e-Medium in the
form of flow charts.
P & G, uses technology to good effect in the form of an employee
portal My.pg.com that facilitates internal communication and helps
employees to access compensation and benefits using a web-based
application. The portal offers payroll information and employee data
using SAP HR. There are eForms for registering changes, travel
information, HR policies and stock options. It also helps an individual
identify and register for training programmes. P&G uses Recruitsoft –
a web–based application management system – to significantly
improve recruitment. Pgoncampus is a customised Internet portal to
enhance the communication between P&G and each individual in
targeted B-schools. It offers information about careers in P&G India
and other related information. Another web-based application helps
senior managers at P&G to plan careers and succession and nurture
talent among subordinates. Yet another portal helps managers
identify the right candidates and employees to apply for the right jobs
within the company.
Oracle has implemented e-HRM as two distinct groups. One is
employee self-service, in which employees handle such matters as
addresses and dependent changes, benefits and tracking vacation
days. The other is managerial self-service; in which managers
conduct performance reviews, salary adjustments, project staffing,
164
and promotions through the portal. The benefits are visible in many
forms- fast and direct communications with a large number of people,
faster turnaround times and a support tool for employees where they
can query for information that’s accurate and available 24/7.
Technology in the HR field has enabled HR managers to pay more
attention to the ‘true HR issues’ and focusing on the soft skills rather
being weighed down by load of routine and mundane requirements
and formalities. Now e-HR encompasses each phase of the employee
life cycle - from recruitments, compensation and appraisals to exits.
Glaxo Smithkline Consumer Healthcare Limited (GSKCH), India has a
‘Training Management System,’ which takes care of the training
requirements of employees and helps HR in planning and monitoring
various learning modules. Besides this, the company also has a
comprehensive ‘payroll system’ in place that manages
salaries/loans/PF, etc, for all employees. The company also conducts
online employee satisfaction surveys. Soon a ‘Human Resources
Management System’ (HRMS) will be implemented, which will
automate all HR processes (from recruitment to retirement). All
processes like recruitment, appraisal, training, compensation;
benefits, employee profile and retirement would be covered.
Presently, the company’s intranet provides e-learning modules, HR
policies, online facilities (booking guest house/meeting rooms),
telephone directory, holiday list, etc.
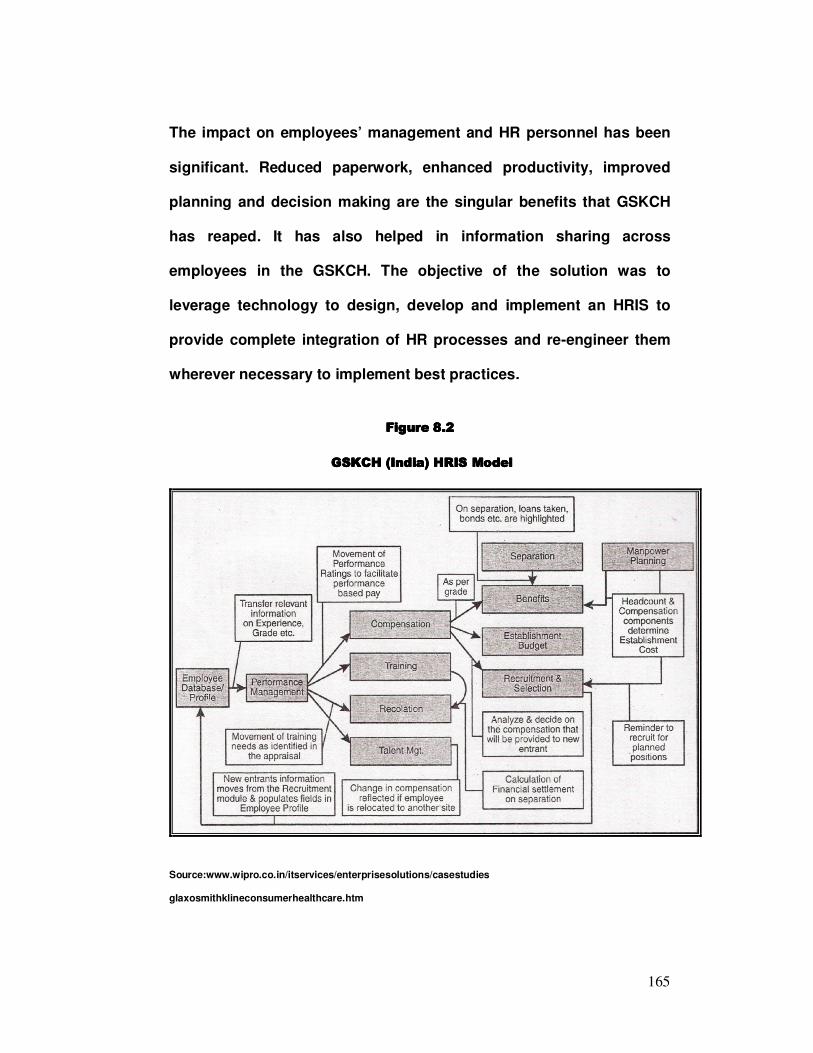
165
The impact on employees’ management and HR personnel has been
significant. Reduced paperwork, enhanced productivity, improved
planning and decision making are the singular benefits that GSKCH
has reaped. It has also helped in information sharing across
employees in the GSKCH. The objective of the solution was to
leverage technology to design, develop and implement an HRIS to
provide complete integration of HR processes and re-engineer them
wherever necessary to implement best practices.
FigureFigureFigureFigure 8.2 8.2 8.2 8.2
GSKCH (India) HRIS ModelGSKCH (India) HRIS ModelGSKCH (India) HRIS ModelGSKCH (India) HRIS Model
Source:www.wipro.co.in/itservices/enterprisesolutions/casestudies
glaxosmithklineconsumerhealthcare.htm

166
As shown in figure 8.2, at GSKCH the integrated architecture of the
solution as provided by Wipro has clearly delivered the benefits of
automation-giving employee and HR productivity a tangible boost.
Dabur has set up an ‘Employee Management System’ on its intranet
platform. Basically a payroll application, EMS is integrated with all the
sites across the country. This helps in making employees more self-
sufficient. Managers are able to assess an employee’s past history,
education qualifications, loans, payroll, taxation details, gratuity and
superannuation, providing a perfect combination of both HR and the
financial department. Presently offered at the managerial level, the
company would soon be extending it to their other employees too.
Hero Honda is in the process of starting an ESS system which will
enable employees to assess all information about their salary, tax,
leave, loan, etc. For its knowledge management requirements, the
company is planning to set up a portal where employees can access
information, exchange ideas freely and read articles compiled by the-
HR department and all employees. Later, they also plan to use the
intranet for external and internal recruitment, assessment and
appraisal purposes.
Samsung India has devised an ‘Electronic Approval System,’ which
has been set up on a SAP system and takes care of all approvals,
apart from the financial ones. This initiative has resulted in onsite
decision-making and avoiding any delays that would occur in case
the concerned people are traveling, since they can access their
167
mailbox sitting in any office in India. Some of the other features that
are being used on SAP for electronic approval include—leave
application, travel approvals, tax computation, etc.
Steel Authority of India Limited is providing its employees with the
option of activities like accessing information about salary, leave, tax,
loan and enabling them to make the necessary changes. The
company is in the process of devising an ‘Employee Information
System’, which addresses the basic information requirement of an
individual. Later, the intranet will be expanded with more employee
related information.
All these initiatives have helped in increasing the employee
satisfaction level index. Most HR managers reiterate that all these
initiatives are part of the corporate strategy to have a satisfied and
profiTable workforce. Companies are coming with new e-HR
innovations every day. Infosys plans to start a 24-hour standardized
help desk that will be accessible to all of Infosys’s employees across
the world. PepsiCo India is in the process of introducing a concept
called the Learn Smart Card, which operates like a credit card and has
a cash budget or credit limit that the employee can spend from. With
this budget the employee can buy books in his or her subject area
and nominate himself/herself for training programs. Accenture is also
rolling out an alumni portal where former employees can refer
candidates make job postings or simply stay in touch.

168
8.38.38.38.3 Sourcing Sourcing Sourcing Sourcing
Indian organizations are much further along than any other country in
their adoption of the HR-oriented help desk. As leading outsourcing
firms serving the rest of the world, many of these organizations use
this technology to serve customers, and are also applying it to their
own employee base. (Cedar Crestone 2008-2009 HR Systems Survey
focused on APAC countries). The HR outsourcing business
opportunity is large and India is likely to garner a larger and larger
piece of this pie in the future. India, with its intrinsic geographic
positioning, is emerging as a viable destination for HR outsourcing
companies to set up their businesses.
However people are still not very clear about what exactly is HR
outsourcing all about, and issues like quality and trust needs to be
addressed properly. Experts say the basic reasons hampering the
growth of HR outsourcing in India are confidentiality and cost factors.
Moreover, the fear of losing jobs, losing control over confidential
data, ethics and quality of outsourcing vendors, security breaches
and overall confidence in the vendors deters many organizations. The
biggest problem - and this is why the HR outsourcing industry in India
is on the back foot - is the government and the industry's failure to
tackle issues like data security and data privacy. This is where Indian
HR outsourcing companies face a major handicap. The Indian
government is still grappling with drafting a data protection law

169
designed to quell growing privacy concerns from their offshore
clients.
However, the future seems to be very promising. It's set to become a
$ 51 billion market worldwide in 2005, representing 39 per cent of the
total business process outsourcing revenue. Estimates show that the
latent size of HR outsourcing in India is about $ 2 billion with a
current market of $ 27 million and it is growing at an alarming rate of
about 50 per cent. India has immense potential as more than 80% of
fortune 1,000 companies are discussing HR outsourcing as a way to
cut costs and increase productivity.
Right now, India is barely skimming the surface of the HR outsourcing
market potential. Indian life Hewitt (ILH), FIDELITY, EXULT and MAFOI
are some of the prominent HR outsourcing services providers in India
and the clients include giants of manufacturing, software and service
industries like GE Capital, Ford Motors, Hyundai Motors, Satyam
Group, Infosys, Enron, Haldia Petrochemicals and HSBC, to name a
few, but many more needs to be added to that list.
Some established service providers like SAP have also adopted a
phased approach to introducing the on-demand software as a service
(SaaS) model. SAP has been working closely with its customers to
tailor the value derived from the SaaS offerings and has a clear on
demand strategy for all categories of customers. (Gartenberg, MD-
SAP India, 2010). India will take some time to move to the on-demand
model.

170
E-HRM has become an inseparable part of the functioning of almost
all the large business players in the Indian scenario. It helps in
integrating the widespread activities of organizations by enabling
connectivity between different organizational functions and providing
accurate and timely personnel information on-line and round the
clock.

171
CHAPTER 9CHAPTER 9CHAPTER 9CHAPTER 9
DATA ANALDATA ANALDATA ANALDATA ANALYYYYSISSISSISSIS AND AND AND AND
FINDINGSFINDINGSFINDINGSFINDINGS

172
CHAPTER 9
DATA ANALYSIS AND FINDINGSDATA ANALYSIS AND FINDINGSDATA ANALYSIS AND FINDINGSDATA ANALYSIS AND FINDINGS
9.19.19.19.1 Profile of SampleProfile of SampleProfile of SampleProfile of Sample
Tables 9.1a to 9.1k (refer Annexure II) show the profile of the sample -
Percentage of Respondents- City wise; % of Respondents by Type of
Sector (Services/Manufacturing); % of Respondents by Type of
Company (MNC/Non-MNC); % of Respondents (MNC/Non-
MNC)*(Services/Manufacturing); % of Respondents by Size of
Company (Annual Turn-over); % of Respondents by Size of Company
(No. of Employees); City * Type of Sector (Services/Manufacturing);
Size of Company (Annual Turn-over) * Type of Sector
(Services/Manufacturing); Size of Company (No. of Employees) * Type
of Sector (Services/Manufacturing); City * Type of Sector
(Services/Manufacturing); City * Type of Company (MNC/Non-MNC)
respectively.
9.29.29.29.2 Response to the QuestionnaireResponse to the QuestionnaireResponse to the QuestionnaireResponse to the Questionnaire
9.2.19.2.19.2.19.2.1 Response to Question 1Response to Question 1Response to Question 1Response to Question 1 ----
9.2.1.19.2.1.19.2.1.19.2.1.1 Mean ranks for the considered drivers for introducing Mean ranks for the considered drivers for introducing Mean ranks for the considered drivers for introducing Mean ranks for the considered drivers for introducing
eeee----HRM systems in companies HRM systems in companies HRM systems in companies HRM systems in companies ((((Services vs ManufacturiServices vs ManufacturiServices vs ManufacturiServices vs Manufacturingngngng
groupsgroupsgroupsgroups))))
The mean ranks by Type of Sector (Services vs Manufacturing) are
shown in Table 9.2a (refer Annexure II). Based on this the rank order

173
for the considered drivers for introducing e-HRM systems in the
companies are given in Table 9.2b (refer Annexure II).
TableTableTableTable 9.2c9.2c9.2c9.2c
The top five drivers for Services vs Manufacturing groupsThe top five drivers for Services vs Manufacturing groupsThe top five drivers for Services vs Manufacturing groupsThe top five drivers for Services vs Manufacturing groups
RankRankRankRank ServicesServicesServicesServices ManufacturingManufacturingManufacturingManufacturing
1 Enable HR cost saving and control Enable HR cost saving and control
2 Improve HR transactions accuracy/speed/Integrity
Standardize Systems and Procedures
3 Reduce time spent on routine administrative tasks by HR staff
Reduce paper transactions
4 Reduce paper transactions Reduce time spent on routine administrative tasks by HR staff
5 Encourage open communication and sharing of Information
Increase overall productivity
1: Most Important; 10:Least Important
Table 9.2c shows the top five drivers for introducing e-HRM systems
in companies by Type of Sector (Services vs Manufacturing). It can be
observed from the table that-
• The topmost driver for introducing e-HRM systems to
companies for both the Services and Manufacturing groups is-
to enable HR cost saving and control.
• Reducing time spent on routine administrative tasks by HR
staff and reducing paper transactions are common drivers for
both the groups.
• For the Services group another major driver is – to improve HR
transactions accuracy/speed/Integrity.

174
9.2.1.29.2.1.29.2.1.29.2.1.2 Mean ranks for the considered drivers for Mean ranks for the considered drivers for Mean ranks for the considered drivers for Mean ranks for the considered drivers for
introducing eintroducing eintroducing eintroducing e----HRM systems in companiesHRM systems in companiesHRM systems in companiesHRM systems in companies ( ( ( (MNC vs NonMNC vs NonMNC vs NonMNC vs Non----
MNCMNCMNCMNCgroupsgroupsgroupsgroups))))
Table 9.3a (refer Annexure II) shows the mean ranks by type of
Company (MNC/Non-MNC). Based on this the rank order for the
considered drivers for introducing e-HRM systems in the companies
are given in Table 9.3b (refer Annexure II).
TableTableTableTable 9.3c 9.3c 9.3c 9.3c
The top five drivers for MNC vs NonThe top five drivers for MNC vs NonThe top five drivers for MNC vs NonThe top five drivers for MNC vs Non----MNC groupsMNC groupsMNC groupsMNC groups
RankRankRankRank MNCMNCMNCMNC NonNonNonNon----MNCMNCMNCMNC
1 Enable HR cost saving and control Enable HR cost saving and control
2 Increase overall productivity Reduce paper transactions
3 Improve HR transactions accuracy/speed/Integrity
Reduce time spent on routine administrative tasks by HR staff
4 Encourage open communication and sharing of Information
Standardize Systems and Procedures
5 Reduce paper transactions Improve HR transactions accuracy/speed/Integrity
1: Most Important; 10:Least Important
Table 9.3c shows the top five drivers for introducing e-HRM systems
in companies by Type of Company (MNC vs Non-MNC). It can be
observed from the table that-
• The topmost driver for introducing e-HRM systems in
companies for both the MNC and Non-MNC groups is- to enable
HR cost saving and control.
• Reducing paper transactions is common to both the groups.

175
9.2.1.39.2.1.39.2.1.39.2.1.3 Considered drivers for introducing eConsidered drivers for introducing eConsidered drivers for introducing eConsidered drivers for introducing e----HRMHRMHRMHRM
systems in companiessystems in companiessystems in companiessystems in companies ((((Significant difference bSignificant difference bSignificant difference bSignificant difference between etween etween etween
groups and within groupsgroups and within groupsgroups and within groupsgroups and within groups ---- ANOVAANOVAANOVAANOVA))))
HHHHypothesisypothesisypothesisypothesis 1 1 1 1
H01111: There is no significant difference between groups and within
groups w.r.t. the considered driver for introducing e-HRM systems in
companies.
The hypothesis is tested w.r.t each of the considered driver (a to j) for
introducing e-HRM systems in companies (refer Annexure II - Tables
9.4a and 9.4b).
H01111 is rejected w.r.t. the following drivers - Increase Integration within
the HR function; Encourage open communication and sharing of
Information; Standardize Systems and Procedures; Improve HR
transactions accuracy/speed/Integrity; Reduce paper transactions;
Refocus HR staff on strategic activities; Increase overall productivity
and Reduce time spent on routine administrative tasks by HR staff.
W.r.t. these drivers there is a significant difference between groups
and within groups – Services vs Non-MNC, Services vs MNC,
Manufacturing vs Non-MNC and Manufacturing vs MNC.
H01111 is accepted w.r.t. the following drivers- Enable HR cost saving and
control and Better management of data and information. W.r.t. these
drivers there is no significant difference between groups and within
groups – Services vs Non-MNC, Services vs MNC, Manufacturing vs
Non-MNC and Manufacturing vs MNC. (Refer Annexure II - Tables
9.4a and 9.4b).

176
9.2.29.2.29.2.29.2.2 Response to Question 2Response to Question 2Response to Question 2Response to Question 2
9.2.2.19.2.2.19.2.2.19.2.2.1 Usage of eUsage of eUsage of eUsage of e----technology for each of the considered technology for each of the considered technology for each of the considered technology for each of the considered
Human ResHuman ResHuman ResHuman Resource Functionsource Functionsource Functionsource Functions ( ( ( (Services vs ManufacturingServices vs ManufacturingServices vs ManufacturingServices vs Manufacturing
groupsgroupsgroupsgroups))))
Table 9.5a (refer Annexure II) shows the usage of e-technology for
each of the considered Human Resource Functions by Type of Sector
(Services vs Manufacturing).
HHHHypothesisypothesisypothesisypothesis 2 2 2 2
H02222: There is no significant difference in usage of e-technology for the
considered HR function between Services vs Manufacturing groups.
The hypothesis is tested w.r.t. each of the considered HR functions- a
to r (Refer Annexure II - Table 9.5a).
H02222 is rejected for the following HR functions- Recruitment and
Selection; Manpower Planning; Communication; Training and
Development; Performance Management; Induction; Maintaining
Employee Records; Compensation Planning; Competency Mapping;
Career Planning; Succession Planning; Employee Transition; Travel
Management; Exit Management; Selecting Benefits. There is a
significant difference in the usage of e-technology between Services
vs Manufacturing groups for these HR functions. The usage of e-
technology is comparatively higher in the Services group viz-a-viz the
Manufacturing group for these HR functions. (Refer Table 9.5b)

177
H02222 is accepted for the following HR functions- Payroll Management;
Attendance Management; Leave Management. There is no significant
difference in the usage of e-technology between Services vs
Manufacturing groups for these HR functions. A very high percentage
of respondents in both groups use e-technology for these HR
functions. (Refer Table 9.5b)
TableTableTableTable 9.5b 9.5b 9.5b 9.5b
Usage of eUsage of eUsage of eUsage of e----technology for HR Functions by Type of Sector technology for HR Functions by Type of Sector technology for HR Functions by Type of Sector technology for HR Functions by Type of Sector
(Services vs Manufacturing)(Services vs Manufacturing)(Services vs Manufacturing)(Services vs Manufacturing) –––– A Comparison A Comparison A Comparison A Comparison
Approx. % of Approx. % of Approx. % of Approx. % of
respondents using erespondents using erespondents using erespondents using e----
technologytechnologytechnologytechnology
HR FunctionsHR FunctionsHR FunctionsHR Functions
ServicesServicesServicesServices ManufacturingManufacturingManufacturingManufacturing
Very High (about 100%)
Recruitment and Selection, Manpower Planning, Payroll Management, Leave Management, Attendance Management Communication, Training and Development, Performance Management, Compensation Planning, Travel Management and Maintaining Employee Records
Payroll Management, Leave Management and Attendance Management
High (about 85%)
Recruitment and Selection, Manpower Planning, Communication, Training and Development, Performance Management, and Maintaining Employee Records.
Reasonably High (about 60%)
Induction
Low (about 20-30%)
Selecting Benefits, Competency Mapping, Career Planning and Employee Transition.
Employee Transition, Travel Management
Very Low (about 8%) Succession Planning and Exit Management.
Induction, Selecting Benefits, Compensation Planning, Competency Mapping and Career Planning.
Negligible (about 1%) Succession Planning and Exit Management.
Table 9.5b shows that the usage of e-technology is comparatively
higher in the Services group viz-a-viz the Manufacturing group.

178
9.2.2.29.2.2.29.2.2.29.2.2.2 Usage of eUsage of eUsage of eUsage of e----technology for each of the considered technology for each of the considered technology for each of the considered technology for each of the considered
Human Resource FunctionsHuman Resource FunctionsHuman Resource FunctionsHuman Resource Functions ( ( ( (MNC vs NonMNC vs NonMNC vs NonMNC vs Non----MNCMNCMNCMNC groups groups groups groups))))
Table 9.6a (refer Annexure II) shows the usage of e-technology for
each of the considered Human Resource Functions by type of
company (MNC vs Non-MNC).
HHHHypothesisypothesisypothesisypothesis 3 3 3 3
H03333: There is no significant difference in the usage of e-technology for
the considered HR function between MNC vs Non-MNC groups.
The hypothesis is tested w.r.t. each of the considered HR functions- a
to r (Refer Annexure II- Table 9.6a)
H03 3 3 3 is rejected for the following HR functions- Recruitment and
Selection; Manpower Planning; Communication; Training and
Development; Performance Management; Induction; Maintaining
Employee Records; Compensation Planning; Competency Mapping;
Career Planning; Succession Planning; Employee Transition; Travel
Management; Exit Management; Selecting Benefits. There is a
significant difference in the usage of e-technology between MNC vs
Non-MNC groups for these HR functions. The usage of e-technology
is comparatively higher in the MNC group viz-a-viz the Non-MNC
group. (Refer Table 9.6b)

179
H03 3 3 3 is accepted for the following HR functions- Payroll Management;
Attendance Management; Leave Management. There is no significant
difference in the usage of e-technology between MNC vs Non-MNC
groups for these HR functions. A very high percentage of
respondents in both groups use e-technology for these HR functions.
(Refer Table 9.6b)
TableTableTableTable 9.6b 9.6b 9.6b 9.6b
Usage of eUsage of eUsage of eUsage of e----technology for HR Functions by Type of technology for HR Functions by Type of technology for HR Functions by Type of technology for HR Functions by Type of
CompanyCompanyCompanyCompany
(MNC vs Non(MNC vs Non(MNC vs Non(MNC vs Non----MNC)MNC)MNC)MNC) –––– A Comparison A Comparison A Comparison A Comparison
Table 9.6b shows that the usage of e-technology is comparatively
higher in the MNC group viz-a-viz the Non-MNC group.
Approx. % of Approx. % of Approx. % of Approx. % of
respondents using erespondents using erespondents using erespondents using e----
technologytechnologytechnologytechnology
HR FunctionsHR FunctionsHR FunctionsHR Functions
MNCMNCMNCMNC NonNonNonNon----MNCMNCMNCMNC
Very High (100%)
Recruitment and Selection, Payroll Management, Leave Management, Attendance Management Manpower Planning, Communication, Training and Development, Performance Management, Compensation Planning, Travel Management and Maintaining Employee Records
Payroll Management, Leave Management and Attendance Management
High (about 95%) Selecting Benefits, Competency Mapping and Career Planning
Reasonably high (About 80 -90%)
Induction
Recruitment and Selection, Manpower Planning, Communication, Training and Development, Performance Management and Maintaining Employee Records
Low (about 35-40%) Succession Planning, Employee Transition and Exit Management
Travel Management
Very Low (about 15-25%)
Induction, Compensation Planning and Employee Transition
Negligible (about 1%)
Selecting Benefits, Competency Mapping, Career Planning, Succession Planning and Exit Management

180
9.2.39.2.39.2.39.2.3 Response to Q3Response to Q3Response to Q3Response to Q3
9.2.3.19.2.3.19.2.3.19.2.3.1 Usage of HR Service Usage of HR Service Usage of HR Service Usage of HR Service Delivery ToolsDelivery ToolsDelivery ToolsDelivery Tools ( ( ( (Services vs Services vs Services vs Services vs
ManufacturingManufacturingManufacturingManufacturing groups groups groups groups))))
Table 9.7 (refer Annexure II) shows the usage of HR Service Delivery
Tools by Type of Sector- (Services vs Manufacturing).
HHHHypothesisypothesisypothesisypothesis 4 4 4 4
H04444: There is no significant difference in the usage of the considered
HR Service Delivery Tool between Services vs Manufacturing groups.
The hypothesis is tested w.r.t each of the considered HR Service
Delivery Tools- a. to e. (refer Annexure II- Table 9.7).
H04 4 4 4 is rejected i.e. there is a significant difference in the usage of HR
Service Delivery Tools between Services vs Manufacturing groups
w.r.t. each of the considered HR Service Delivery Tools - Employee
Self Service; Management Self Service; E-Learning Portal; Intranet;
Web 2.0 Technology. The usage of HR Service Delivery Tools is
comparatively higher in the Services group viz-a-viz the
Manufacturing group.
• In the Services group more than 90% of all the respondents
have reported the usage of all the given HR Service Delivery
Tools.
• In the Manufacturing group, the highest percentage of
respondents has reported the usage of Intranet (75%) followed
by ESS (60%), E-learning Portal (41%), MSS (30%) and Web 2.0
only 13%.

181
9.2.3.29.2.3.29.2.3.29.2.3.2 Usage of HR Service Delivery ToolsUsage of HR Service Delivery ToolsUsage of HR Service Delivery ToolsUsage of HR Service Delivery Tools ( ( ( (MNC vs NonMNC vs NonMNC vs NonMNC vs Non----
MNCMNCMNCMNC groups groups groups groups))))
Table 9.8 (refer Annexure II) shows the usage of HR Service Delivery
Tools by type of Company (MNC vs Non-MNC).
HHHHypothesisypothesisypothesisypothesis 5 5 5 5
H05555: There is no significant difference in the usage of the considered
HR Service Delivery Tool between MNC vs Non-MNC groups.
The hypothesis is tested w.r.t. each of the considered HR Service
Delivery Tool- a. to e. (refer Annexure II - Table 9.8).
H05 5 5 5 is rejected i.e. there is a significant difference in the usage of HR
Service Delivery Tools between MNC vs Non-MNC groups w.r.t. each
of the considered HR Service Delivery Tools - Employee Self Service;
Management Self Service; E-Learning Portal; Intranet; Web 2.0
Technology. The usage of HR Service Delivery Tools is comparatively
higher in the MNC group viz-a-viz the Non-MNC group.
• In the MNC group more than almost 100% of all the
respondents have reported the usage of all the given HR
Service Delivery Tools.
• In the Non-MNC group, the highest percentage of respondents
has reported the usage of Intranet (82%) followed by ESS (78%),
E-learning Portal (57%), MSS (50%) and Web 2.0 (37%).

182
9.2.4 Response to Question 49.2.4 Response to Question 49.2.4 Response to Question 49.2.4 Response to Question 4 –––– Sourcing Solutions Sourcing Solutions Sourcing Solutions Sourcing Solutions
Response to this question is covered under Chapter 8: The Indian e-
HRM scenario.
9.2.5 9.2.5 9.2.5 9.2.5 Response to Question 5Response to Question 5Response to Question 5Response to Question 5
9.2.59.2.59.2.59.2.5.1.1.1.1 Perception of Respondents regarding their Perception of Respondents regarding their Perception of Respondents regarding their Perception of Respondents regarding their
company’s position in the ecompany’s position in the ecompany’s position in the ecompany’s position in the e----HHHHRM journey todayRM journey todayRM journey todayRM journey today ( ( ( (Services vs Services vs Services vs Services vs
ManufacturingManufacturingManufacturingManufacturing groups groups groups groups))))
Table 9.9 (refer Annexure II) shows the perception of respondents
regarding their company’s position in the e-HRM journey today by
Type of Sector (Services vs. Manufacturing).
HHHHypothesisypothesisypothesisypothesis 6 6 6 6
H06666: There is no significant difference between Services vs
Manufacturing groups regarding their perception of their company’s
position in the e-HRM journey today.
H06 6 6 6 is rejected i.e. there is a significant difference between Services
vs Manufacturing groups regarding their perception of their
company’s position in the e-HRM journey today. On a five-point scale
ranging from ‘1: Neither understand nor value e-HRM’ to ‘5: Complete
incorporation of e-HRM strategy into the business model’ the
Services group as compared to the Manufacturing group perceives
itself to be closer towards complete incorporation of e-HRM strategy
into the business model. (Refer Annexure II – Table 9.9).
183
9.2.5.29.2.5.29.2.5.29.2.5.2 Perception of Respondents regarding their Perception of Respondents regarding their Perception of Respondents regarding their Perception of Respondents regarding their
company’s position in the ecompany’s position in the ecompany’s position in the ecompany’s position in the e----HRM journey todayHRM journey todayHRM journey todayHRM journey today ( ( ( ( MNC MNC MNC MNC vs vs vs vs
NonNonNonNon----MNCMNCMNCMNC groups groups groups groups))))
Table 9.10 (refer Annexure II) shows the perception of respondents
regarding their company’s position in the e-HRM journey now by Type
of Company (MNC vs. Non-MNC)
HHHHypothesisypothesisypothesisypothesis 7 7 7 7
H07777: There is no significant difference between MNC vs Non-MNC
groups regarding their perception of their company’s position in the
e-HRM journey today.
H07 7 7 7 is rejected i.e. there is a significant difference between MNC vs
Non-MNC groups regarding their perception of their company’s
position in the e-HRM journey today. On a five-point scale ranging
from ‘1: Neither understand nor value e-HRM’ to ‘5: Complete
incorporation of e-HRM strategy into the business model’ the MNC
group as compared to the Non-MNC perceives itself to be closer
towards complete incorporation of e-HRM strategy into the business
model. (Refer Annexure II – Table 9.10).

184
9.2.5.39.2.5.39.2.5.39.2.5.3 Perception of Respondents regarding their Perception of Respondents regarding their Perception of Respondents regarding their Perception of Respondents regarding their
company’s position in the ecompany’s position in the ecompany’s position in the ecompany’s position in the e----HRM journey todayHRM journey todayHRM journey todayHRM journey today ((((Significant Significant Significant Significant
difference bdifference bdifference bdifference between groups and within groupsetween groups and within groupsetween groups and within groupsetween groups and within groups ---- ANOVA ANOVA ANOVA ANOVA))))
(Refer Annexure II – Table 9.11)
HHHHypothesisypothesisypothesisypothesis 8 8 8 8
H08888: There is no significant difference between groups and within
groups w.r.t. perception of respondents regarding their company’s
position in the e-HRM journey today.
H08 8 8 8 rejected i.e. there is a significant difference w.r.t. perception of
respondents regarding their company’s position in the e-HRM journey
today, between groups and within groups – Services vs Non-MNC,
Services vs MNC, Manufacturing vs Non-MNC and Manufacturing vs
MNC.
(Refer Annexure II – Table 9.11).

185
9.2.69.2.69.2.69.2.6 Response to Question 6Response to Question 6Response to Question 6Response to Question 6
9.2.6.19.2.6.19.2.6.19.2.6.1 Perception of Respondents regarding their Perception of Respondents regarding their Perception of Respondents regarding their Perception of Respondents regarding their
company’s position in the ecompany’s position in the ecompany’s position in the ecompany’s position in the e----HRM journey after five yearsHRM journey after five yearsHRM journey after five yearsHRM journey after five years
((((Services vs ManufacturingServices vs ManufacturingServices vs ManufacturingServices vs Manufacturing groups) groups) groups) groups)
Table 9.12 (refer Annexure II) shows the opinion of respondents
regarding their perception of their company’s position in the e-HRM
journey after five years by Type of Sector (Services vs.
Manufacturing)
HHHHypothesisypothesisypothesisypothesis 9 9 9 9
H09999: There is no significant difference between Services vs
Manufacturing groups regarding their perception of their company’s
position in the e-HRM journey after five years.
H09 9 9 9 is accepted i.e. there is no significant difference between
Services vs Manufacturing groups regarding their perception of their
company’s position in the e-HRM journey after 5 years. On a five-
point scale ranging from ‘1: Neither understand nor value e-HRM’ to
‘5: Complete incorporation of e-HRM strategy into the business
model’ both the Services group and the Manufacturing group perceive
themselves to be at a similar level after five years.
(Refer Annexure II – Table 9.12)

186
9.2.6.29.2.6.29.2.6.29.2.6.2 Perception of Respondents regarding their Perception of Respondents regarding their Perception of Respondents regarding their Perception of Respondents regarding their
company’s position in the ecompany’s position in the ecompany’s position in the ecompany’s position in the e----HRM journey after five yearsHRM journey after five yearsHRM journey after five yearsHRM journey after five years
((((MNC vs NonMNC vs NonMNC vs NonMNC vs Non----MNCMNCMNCMNC groups) groups) groups) groups)
Table 9.13 (refer Annexure II) shows the opinion of respondents
regarding their perception of their company’s position in the e-HRM
journey after five years by Type of Company (MNC vs. Non-MNC).
HHHHypothesisypothesisypothesisypothesis 10 10 10 10
H010101010: There is no significant difference between MNC vs Non-MNC
groups regarding their perception of their company’s position in the
e-HRM journey after five years.
H010 10 10 10 is rejected i.e. there is a significant difference between MNC vs
Non-MNC groups regarding their perception of their company’s
position in the e-HRM journey after five years. On a five-point scale
ranging from ‘1: Neither understand nor value e-HRM’ to ‘5: Complete
incorporation of e-HRM strategy into the business model’ the MNC
group perceives itself to be near complete incorporation of e-HRM
strategy as compared to the Non-MNC group which is way behind.
(Refer Annexure II – Table 9.13)

187
9.2.6.39.2.6.39.2.6.39.2.6.3 Perception of Respondents regarding their Perception of Respondents regarding their Perception of Respondents regarding their Perception of Respondents regarding their
company’s position in the ecompany’s position in the ecompany’s position in the ecompany’s position in the e----HRM journey after five yearsHRM journey after five yearsHRM journey after five yearsHRM journey after five years
((((Significant difference bSignificant difference bSignificant difference bSignificant difference between groups and within groups)etween groups and within groups)etween groups and within groups)etween groups and within groups)
(Refer Annexure II – Table 9.14)
HHHHypothesisypothesisypothesisypothesis 11 11 11 11
H011111111: There is no significant difference between groups and within
groups w.r.t. perception of respondents regarding their company’s
position in the e-HRM journey after five years.
H011 11 11 11 is rejected i.e. there is a significant difference w.r.t. perception of
respondents regarding their company’s position in the e-HRM journey
after five years, between groups and within groups - Services vs Non-
MNC, Services vs MNC, Manufacturing vs Non-MNC and
Manufacturing vs MNC.
(Refer Annexure II – Table 9.14)

188
9.2.6.49.2.6.49.2.6.49.2.6.4 Perception of Respondents regarding theirPerception of Respondents regarding theirPerception of Respondents regarding theirPerception of Respondents regarding their
company’s position in the ecompany’s position in the ecompany’s position in the ecompany’s position in the e----HRM journey HRM journey HRM journey HRM journey today vs ‘after five today vs ‘after five today vs ‘after five today vs ‘after five
years’ years’ years’ years’ (group(group(group(group----wise)wise)wise)wise)
9.2.6.4.19.2.6.4.19.2.6.4.19.2.6.4.1 Perception of Respondents regarding their Perception of Respondents regarding their Perception of Respondents regarding their Perception of Respondents regarding their
company’s position in the ecompany’s position in the ecompany’s position in the ecompany’s position in the e----HRM journey HRM journey HRM journey HRM journey today vs ‘after five today vs ‘after five today vs ‘after five today vs ‘after five
years’ (years’ (years’ (years’ (Services groupServices groupServices groupServices group))))
(Refer Annexure II - Table 9.15a)
HHHHypothesisypothesisypothesisypothesis 12 12 12 12
H012121212: There is no significant difference in the perception of the
Services group regarding their company’s position in the e-HRM
journey today vs ‘after 5 years’.
H012121212 is rejected i.e. there is a significant difference in the perception of
the Services group regarding their company’s position in the e-HRM
journey today vs ‘after 5 years’. On a five-point scale ranging from ‘1:
Neither understand nor value e-HRM’ to ‘5: Complete incorporation of
e-HRM strategy into the business model’ there is a significant shift
from a lower level today to a higher level after five years.
(Refer Annexure II - Table 9.15a)

189
9.2.6.4.29.2.6.4.29.2.6.4.29.2.6.4.2 Perception of Respondents regarding their Perception of Respondents regarding their Perception of Respondents regarding their Perception of Respondents regarding their
company’s position in the ecompany’s position in the ecompany’s position in the ecompany’s position in the e----HRM journey HRM journey HRM journey HRM journey today vs ‘after five today vs ‘after five today vs ‘after five today vs ‘after five
years’ (years’ (years’ (years’ (Manufacturing groupManufacturing groupManufacturing groupManufacturing group))))
(Refer Annexure II - Table 9.15b)
HHHHypothesisypothesisypothesisypothesis 13 13 13 13
H013131313: There is no significant difference in the perception of the
Manufacturing group regarding their company’s position in the e-HRM
journey today vs ‘after 5 years’.
H013131313 is rejected i.e. there is a significant difference in the perception of
the Manufacturing group regarding their company’s position in the e-
HRM journey today vs ‘after 5 years’. On a five-point scale ranging
from ‘1: Neither understand nor value e-HRM’ to ‘5: Complete
incorporation of e-HRM strategy into the business model’ there is a
significant shift from a lower level today to a higher level after five
years.
(Refer Annexure II - Table 9.15b)

190
9.2.6.4.39.2.6.4.39.2.6.4.39.2.6.4.3 Perception of Respondents regarding their Perception of Respondents regarding their Perception of Respondents regarding their Perception of Respondents regarding their
company’s position in the ecompany’s position in the ecompany’s position in the ecompany’s position in the e----HRM journey HRM journey HRM journey HRM journey ttttoday vs ‘after five oday vs ‘after five oday vs ‘after five oday vs ‘after five
years’ (years’ (years’ (years’ (MNC groupMNC groupMNC groupMNC group))))
(Refer Annexure II - Table 9.15c)
HHHHypothesisypothesisypothesisypothesis 14 14 14 14
H014141414: There is no significant difference in the perception of the ‘MNC’
group regarding their company’s position in the e-HRM journey today
vs ‘after 5 years’.
H014141414 is rejected i.e. there is a significant difference in the perception
of the ‘MNC’ group regarding their company’s position in the e-HRM
journey today vs ‘after 5 years’. On a five-point scale ranging from ‘1:
Neither understand nor value e-HRM’ to ‘5: Complete incorporation of
e-HRM strategy into the business model’ there is a significant shift
from a lower level today to a higher level after five years.
(Refer Annexure II - Table 9.15c)

191
9.2.6.4.49.2.6.4.49.2.6.4.49.2.6.4.4 Perception of Respondents regarding their Perception of Respondents regarding their Perception of Respondents regarding their Perception of Respondents regarding their
company’s position company’s position company’s position company’s position in the ein the ein the ein the e----HRM journey HRM journey HRM journey HRM journey today vs ‘after five today vs ‘after five today vs ‘after five today vs ‘after five
years’ (years’ (years’ (years’ (NonNonNonNon----MNC groupMNC groupMNC groupMNC group))))
(Refer Annexure II - Table 9.15d)
HHHHypothesisypothesisypothesisypothesis 15 15 15 15
H015151515: There is no significant difference in the perception of the ‘Non-
MNC’ group regarding their company’s position in the e-HRM journey
today vs ‘after 5 years’.
H015151515 is rejected i.e. there is a significant difference in the perception of
the ‘Non-MNC’ group regarding their company’s position in the e-HRM
journey today vs ‘after 5 years’. On a five-point scale ranging from ‘1:
Neither understand nor value e-HRM’ to ‘5: Complete incorporation of
e-HRM strategy into the business model’ there is a significant shift
from a lower level today to a higher level after five years.
(Refer Annexure II - Table 9.15d)

192
9.2.79.2.79.2.79.2.7 Response to Question 7Response to Question 7Response to Question 7Response to Question 7
9.2.7.19.2.7.19.2.7.19.2.7.1 Mean ranks for the considered barriers to Mean ranks for the considered barriers to Mean ranks for the considered barriers to Mean ranks for the considered barriers to
progress in the eprogress in the eprogress in the eprogress in the e----HRM journeyHRM journeyHRM journeyHRM journey (Services(Services(Services(Services vs Manufacturing vs Manufacturing vs Manufacturing vs Manufacturing
groups)groups)groups)groups)
Table 9.16a (refer Annexure II) shows the mean ranks by Type of
Sector (Services vs Manufacturing). Based on these the rank order for
the considered barriers to the progress in the e-HRM journey in the
companies is given in Table 9.16b (Refer Annexure II).
TableTableTableTable 9.16c 9.16c 9.16c 9.16c
The top five Barriers for Services vs Manufacturing groupsThe top five Barriers for Services vs Manufacturing groupsThe top five Barriers for Services vs Manufacturing groupsThe top five Barriers for Services vs Manufacturing groups
RankRankRankRank ServicesServicesServicesServices ManufacturingManufacturingManufacturingManufacturing
1 Difficulty in converting standardized packages into customized and user friendly modules
Inadequate Financial Resources
2 Inadequate Financial Resources Resistance to change
3 Lack of innovation Inadequate Training
4 Insufficient tangible benefits Poor technical infrastructure
5 Issues w.r.t. Security of data Inability to convert standardized packages into customized and user friendly modules
1: Most Important; 10:Least Important
Table 9.16c shows the top five barriers to progress in the e-HRM
journey by Type of Sector (Services vs Manufacturing).

193
It can be observed from Table 9.16c that-
• Inadequate Financial Resources is amongst the top two
barriers for both the Services and Manufacturing groups.
• In the Services group the topmost cause of concern is –
Difficulty in converting standardized packages into customized
and user friendly modules, other concerns being Lack of
innovation, Insufficient tangible benefits and Issues w.r.t.
security of data.
• In the manufacturing group the in addition to Inadequate
Financial Resources, other issues of concern are – Resistance
to change, Inadequate training, Poor technical infrastructure
and Inability to convert standardized packages into customized
and user friendly modules.
9.2.7.29.2.7.29.2.7.29.2.7.2 Mean ranks for the considered barriers to Mean ranks for the considered barriers to Mean ranks for the considered barriers to Mean ranks for the considered barriers to
progress in the eprogress in the eprogress in the eprogress in the e----HRM journeyHRM journeyHRM journeyHRM journey ( ( ( (MNMNMNMNC vs NonC vs NonC vs NonC vs Non----MNCMNCMNCMNC groups) groups) groups) groups)
Table 9.17a shows mean ranks by type of Company (MNC vs Non-
MNC). Based on these the rank order for the considered barriers to
progress in the e-HRM journey in the companies is given in Table
9.17b
(Refer Annexure II).

194
TableTableTableTable 9.17c 9.17c 9.17c 9.17c
ThThThThe top five Barriers for the MNC vs None top five Barriers for the MNC vs None top five Barriers for the MNC vs None top five Barriers for the MNC vs Non----MNC groupsMNC groupsMNC groupsMNC groups
RankRankRankRank MNCMNCMNCMNC NonNonNonNon----MNCMNCMNCMNC
1 Difficulty in converting standardized packages into customized and user friendly modules
Inadequate Financial Resources
2 Issues w.r.t. Security of data Resistance to change
3 Lack of innovation Inadequate Training
4 Inadequate Training Poor technical infrastructure
5 Insufficient tangible benefits Insufficient tangible benefits
1: Most Important; 10:Least Important
Table 9.17c shows the top five barriers to progress in the e-HRM
journey by Type of Company (MNC vs Non-MNC). It can be observed
from the Table that-
• For both the groups Insufficient tangible benefits is one of the
top five concerns.
• For the MNC group the topmost concern is Difficulty in
converting standardized packages into user friendly modules
followed by Issues w.r.t. Security of data, Lack of innovation
and Inadequate Training.
• For the Non-MNC group the topmost barrier is Inadequate
financial resources followed by Resistance to change,
Inadequate Training and Poor technical infrastructure.

195
9.2.7.39.2.7.39.2.7.39.2.7.3 Considered barriers to progress in the eConsidered barriers to progress in the eConsidered barriers to progress in the eConsidered barriers to progress in the e----HRM HRM HRM HRM
journey in companiesjourney in companiesjourney in companiesjourney in companies ((((Significant difference bSignificant difference bSignificant difference bSignificant difference between etween etween etween
groups and within groupsgroups and within groupsgroups and within groupsgroups and within groups ---- ANOVA ANOVA ANOVA ANOVA))))
HHHHypothesisypothesisypothesisypothesis 16 16 16 16
H016161616: There is no significant difference between groups and within
groups w.r.t the considered barrier to progress in the e-HRM journey.
The hypothesis is tested w.r.t each of the considered barrier (a to j) to
progress in the e-HRM journey in companies.
(Refer Annexure II – Tables 9.18a and 9.18b).
H016 16 16 16 is rejected w.r.t. the following barriers - Inadequate Financial
Resources; Resistance to change; Lack of top management support;
Inadequate Training; Poor technical infrastructure; Issues w.r.t.
Security of data; Insufficient tangible benefits; Lack of innovation;
Inability to convert standardized packages into customized and user
friendly modules. W.r.t. these barriers there is a significant difference
between groups and within groups - Services vs Non-MNC, Services
vs MNC, Manufacturing vs Non-MNC and Manufacturing vs MNC.
H011116 6 6 6 is accepted for the barrier - Inability to overcome bureaucratic
hurdles. W.r.t this barrier there is no significant difference between
groups and within groups - Services vs Non-MNC, Services vs MNC,
Manufacturing vs Non-MNC and Manufacturing vs MNC.

196
Response to Questions 8, 9 & 10Response to Questions 8, 9 & 10Response to Questions 8, 9 & 10Response to Questions 8, 9 & 10 are are are are covered in Chapter 10covered in Chapter 10covered in Chapter 10covered in Chapter 10: : : :
‘‘‘‘PrePrePrePre----requisites and Challenges of erequisites and Challenges of erequisites and Challenges of erequisites and Challenges of e----HRMHRMHRMHRM’ ’ ’ ’
Response to Question 11Response to Question 11Response to Question 11Response to Question 11 is is is is covered in Chapter 11 covered in Chapter 11 covered in Chapter 11 covered in Chapter 11: : : :
‘Recommendations‘Recommendations‘Recommendations‘Recommendations and Suggestions and Suggestions and Suggestions and Suggestions’’’’

197
9.2.89.2.89.2.89.2.8 Response to Question 12Response to Question 12Response to Question 12Response to Question 12
9.2.8.19.2.8.19.2.8.19.2.8.1 Expectation of respondents w.r.Expectation of respondents w.r.Expectation of respondents w.r.Expectation of respondents w.r.t. et. et. et. e----HRM being HRM being HRM being HRM being
successful in satisfying employees in their HR needssuccessful in satisfying employees in their HR needssuccessful in satisfying employees in their HR needssuccessful in satisfying employees in their HR needs
((((Services vs ManufacturingServices vs ManufacturingServices vs ManufacturingServices vs Manufacturing groups) groups) groups) groups)
Table 9.19 (refer Annexure II) shows the expectation of respondents
w.r.t. e-HRM being successful in satisfying employees in their HR
needs – Services vs Manufacturing groups.
HHHHypothesisypothesisypothesisypothesis 17 17 17 17
H017171717: There is no significant difference in the expectation of
respondents w.r.t. e-HRM being successful in satisfying employees in
their HR needs between Services vs Manufacturing groups.
H017171717 is rejected i.e. there is a significant difference in the expectation
of respondents w.r.t. e-HRM being successful in satisfying employees
in their HR needs between Services vs Manufacturing groups. On
being asked whether e-HRM will be successful in satisfying
employees in their HR needs, a substantially large proportion (89%) of
respondents in the Services group gave a reply in the affirmative
(Yes), as compared to the Manufacturing group for whom the
proportion was 71%. Almost an equal proportion (5%) gave a reply in
the negative (No) in both the groups. In the services group a very
small proportion (6%) were undecided, whereas in the Manufacturing
group a substantial proportion (23%) gave the reply as ‘Can’t Say’.
There is a significant difference in the expectation levels of the two
groups.
(Refer Annexure II – Table 9.19).

198
9.2.8.29.2.8.29.2.8.29.2.8.2 Expectation of respondents w.r.t. eExpectation of respondents w.r.t. eExpectation of respondents w.r.t. eExpectation of respondents w.r.t. e----HRM being HRM being HRM being HRM being
successful in satisfysuccessful in satisfysuccessful in satisfysuccessful in satisfying employees in their HR needs (ing employees in their HR needs (ing employees in their HR needs (ing employees in their HR needs (MNC MNC MNC MNC
vs Nonvs Nonvs Nonvs Non----MNCMNCMNCMNC groups) groups) groups) groups)
Table 9.20 (Refer Annexure II) shows the expectation of respondents
w.r.t. e-HRM being successful in satisfying employees in their HR
needs – MNC vs Non-MNC groups.
HHHHypothesisypothesisypothesisypothesis 18 18 18 18
H018181818: There is no significant difference in the expectation of
respondents w.r.t. e-HRM being successful in satisfying employees in
their HR needs between MNC vs Non-MNC groups.
H018181818 is rejected i.e. there is a significant difference in the expectation
of respondents w.r.t. e-HRM being successful in satisfying employees
in their HR needs between MNC vs Non-MNC groups. On being asked
whether e-HRM will be successful in satisfying employees in their HR
needs, all respondents (100%) in the MNC group replied in the
affirmative (Yes) as compared to the Non-MNC group for whom the
proportion was 73%. In the Non-MNC group a small proportion (6%)
gave a reply in the negative (No) whereas a substantial proportion
(21%) gave the reply as ‘Can’t Say’. There is a significant difference
in the expectation levels of the two groups.
(Refer Annexure II – Table 9.20).

199
9.2.99.2.99.2.99.2.9 Response to Question 13Response to Question 13Response to Question 13Response to Question 13
9.2.9.19.2.9.19.2.9.19.2.9.1 Expectation of respondents Expectation of respondents Expectation of respondents Expectation of respondents w.r.t. the benefits w.r.t. the benefits w.r.t. the benefits w.r.t. the benefits
from efrom efrom efrom e----HRM justifying the expenditure on the sameHRM justifying the expenditure on the sameHRM justifying the expenditure on the sameHRM justifying the expenditure on the same ( ( ( (Services Services Services Services
vs Manufacturingvs Manufacturingvs Manufacturingvs Manufacturing groups) groups) groups) groups)
Table 9.21(Refer Annexure II) shows the expectation of respondents
w.r.t. the benefits from e-HRM justifying the expenditure on the same
– Services vs Manufacturing groups.
HHHHypothesisypothesisypothesisypothesis 19 19 19 19
H0: There is no significant difference in the expectation of
respondents w.r.t. the benefits from e-HRM justifying the expenditure
on the same between Services vs Manufacturing groups.
H019191919 is rejected i.e. there is a significant difference in the expectation
of respondents w.r.t. the benefits from e-HRM justifying the
expenditure on the same between Services vs Manufacturing groups.
On being asked whether the benefits from e-HRM will justify the
expenditure on the same a very large proportion (96%) of the
respondents in the Services group in comparison to only 50% in the
Manufacturing replied in the affirmative (Yes). Only 2% in the Services
group as compared to 31% in the Manufacturing group replied in the
negative (No). A negligible proportion (1%) in the Services group were
undecided in their opinion as compared to 21% in the Manufacturing
group. There is a significant difference in the expectation levels of the
two groups. (Refer Annexure II – Table 9.21).

200
9.2.9.29.2.9.29.2.9.29.2.9.2 ExpectatiExpectatiExpectatiExpectation of respondents w.r.t. the benefits on of respondents w.r.t. the benefits on of respondents w.r.t. the benefits on of respondents w.r.t. the benefits
from efrom efrom efrom e----HRM justifying the expenditure on the sameHRM justifying the expenditure on the sameHRM justifying the expenditure on the sameHRM justifying the expenditure on the same ( ( ( (MNC vs MNC vs MNC vs MNC vs
NonNonNonNon----MNCMNCMNCMNC groups) groups) groups) groups)
Table 9.22 (refer Annexure II) shows the opinion of respondents on –
whether the benefits from e-HRM justify the expenditure on the same
– MNC vs Non-MNC groups.
HHHHypothesisypothesisypothesisypothesis 20 20 20 20
H020202020: There is no significant difference in the expectation of
respondents w.r.t. the benefits from e-HRM justifying the expenditure
on the same between MNC vs Non-MNC groups.
H020202020 is rejected i.e. there is a significant difference in the expectation
of respondents w.r.t. the benefits from e-HRM justifying the
expenditure on the same between MNC vs Non-MNC groups. On being
asked whether the benefits from e-HRM will justify the expenditure on
the same all respondents in the MNC group gave a reply in the
affirmative (Yes) as compared to 58% in the Non-MNC group. About
25% in the Non-MNC group gave the reply as ‘No’ and about 17% as
‘Can’t Say’. There is a significant difference in the expectation levels
of the two groups.
(Refer Annexure II – Table 9.22).

201
9.2.109.2.109.2.109.2.10 Response to Question 15.Response to Question 15.Response to Question 15.Response to Question 15.
9.2.10.19.2.10.19.2.10.19.2.10.1 Opinion of respondents on various aspects of Opinion of respondents on various aspects of Opinion of respondents on various aspects of Opinion of respondents on various aspects of the the the the
eeee----HRM functioningHRM functioningHRM functioningHRM functioning ( ( ( (Services vs ManufacturingServices vs ManufacturingServices vs ManufacturingServices vs Manufacturing groups) groups) groups) groups)
Table 9.23 (refer Annexure II) shows the mean ratings on Statements 1
to 30 by Type of Sector (Services vs Manufacturing)
HHHHypothesisypothesisypothesisypothesis 21 21 21 21
H021212121: There is no significant difference in overall opinion on the
considered aspects of e-HRM between Services vs Manufacturing
groups.
H021212121 is rejected i.e. there is a significant difference of overall opinion
on statements 1 to 30 between Services vs Manufacturing groups.
(Refer Annexure II – Table 9.23)
W.r.t the Services vs Manufacturing groups the findings show that
the Manufacturing group is moving towards achieving Administrative
excellence (routine HR tasks being e-enabled) whereas the Services
group has moved beyond administrative excellence and is now in the
process of achieving Service excellence (high usage of HR Service
Delivery Tools). The gap between the Manufacturing and Services
group is likely to be bridged in about a time-span of 5-6 years.
However, it is yet to be seen how fast both the sectors move towards
Performance Excellence (HR metrics and Business Intelligence).

202
9.2.10.29.2.10.29.2.10.29.2.10.2 Opinion of respondents on various aspects of the Opinion of respondents on various aspects of the Opinion of respondents on various aspects of the Opinion of respondents on various aspects of the
eeee----HRM functioningHRM functioningHRM functioningHRM functioning (M (M (M (MNC vs NonNC vs NonNC vs NonNC vs Non----MNCMNCMNCMNC groups) groups) groups) groups)
Table 9.24 (refer Annexure II) shows the mean ratings on Statements 1
to 30 by type of Company (MNC vs Non-MNC).
HHHHypothesisypothesisypothesisypothesis 22 22 22 22
H022222222: There is no significant difference in overall opinion on the
considered aspects of e-HRM between MNC vs Non-MNC groups.
H022222222 is rejected i.e. there is a significant difference of overall opinion
on statements 1 to 30 between MNC vs Non-MNC groups
(Refer Annexure II – Table 9.24).
W.r.t. MNC vs Non-MNC groups the findings point out that the MNC
group has already moved from Service Excellence towards
Performance Excellence (HR metrics and Business Intelligence)
whereas the Non-MNC group has yet to achieve Service Excellence.
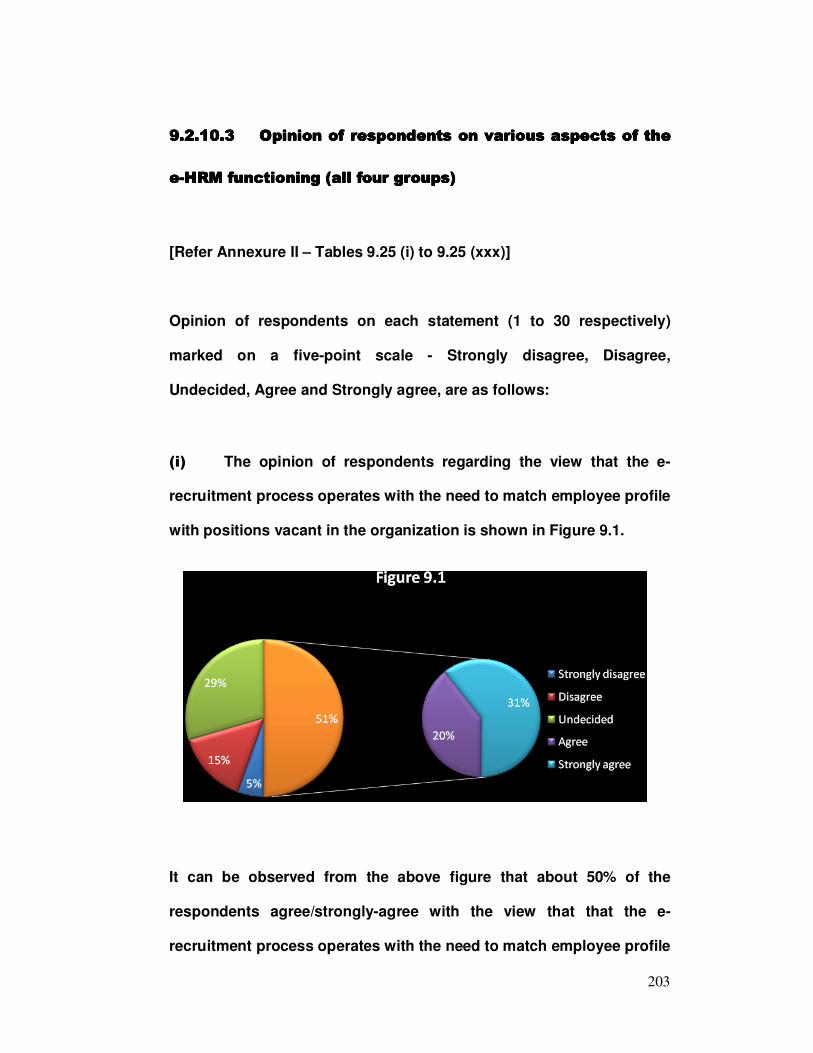
203
9.2.10.39.2.10.39.2.10.39.2.10.3 Opinion of respondents on various aspects of the Opinion of respondents on various aspects of the Opinion of respondents on various aspects of the Opinion of respondents on various aspects of the
eeee----HRM functioning (aHRM functioning (aHRM functioning (aHRM functioning (all four groupll four groupll four groupll four groupssss))))
[Refer Annexure II – Tables 9.25 (i) to 9.25 (xxx)]
Opinion of respondents on each statement (1 to 30 respectively)
marked on a five-point scale - Strongly disagree, Disagree,
Undecided, Agree and Strongly agree, are as follows:
(i) The opinion of respondents regarding the view that the e-
recruitment process operates with the need to match employee profile
with positions vacant in the organization is shown in Figure 9.1.
It can be observed from the above figure that about 50% of the
respondents agree/strongly-agree with the view that that the e-
recruitment process operates with the need to match employee profile

204
with positions vacant in the organization. Only about 20%
disagree/strongly-disagree with the view and about 30% remain
undecided.
(ii) About 50% of the respondents agree/strongly-agree with the
view that e-HRM technology has helped in reducing the time and
effort in preparing the job-description and job-specification whereas
32% disagree/strongly-disagree. About 20% remain undecided.
(iii) About 44% of the respondents agree/strongly-agree with the
view that the candidate application maintained and recorded online
has made the applicant tracking system easily accessible. About 30%
disagree/strongly-disagree and about 26% remain undecided.
(iv) Regarding the view that the e-HRM technology has ensured an
effective salary administration system, about 61% of the respondents
agree/strongly-agree and only 7% disagree. About 32% of the
respondents are undecided, whereas none of the respondents
strongly- disagree with the view.

205
(v) Opinion of respondents regarding the view that the pay
structure has been clearly defined in the e-HRM system is shown in
Figure 9.2.
The above figure shows that a majority of the respondents (about
93%) agree/strongly-agree with the view that the pay structure has
been clearly defined in the e-HRM system. About 1% remain
undecided on the issue and only 5% disagree. None of the
respondents strongly-disagree with the view.
(vi) W.r.t. timeliness of pay-cheques in reaching the employees
since the implementation of e-HRM, about 56% of the respondents
agree/strongly-agree and 29% disagree with the view. About 15% are
undecided and none of the respondents strongly-disagree with the
view.

206
(vii) About 24% of the respondents strongly-disagree with the
statement that the recording of employee absence, vacation, sickness
etc via e-HRM technology reflects in the pay roll system whereas
about 17% disagree. Of the total respondents about 41%
agree/strongly-agree with the statement and about 18% of the
respondents remain undecided.
(viii) Figure 9.3 shows the opinion of respondents on the issue that
the e-HRM process has enabled employees to enroll for flexible
benefits administration effectively.
A substantial proportion of respondents i.e. about 31% remain
undecided on the issue that the e-HRM process has enabled
employees to enroll for flexible benefits administration effectively.

207
Also, a substantial proportion i.e. 41% disagree/strongly- disagrees
on the statement. Only about 28% agree/strongly-agree on the issue.
(ix) A substantial proportion i.e. 37% of the respondents remains
undecided on the view that the compensation frame work
implemented by the e- HRM allows managers to calculate incentives
and rewards for the employees online and very small proportion (4%)
disagree/strongly-disagree with the statement. More than ½ of the
respondents (58%) agree/strongly-agree with the view.
(x) More than ½ of the respondents (52%) agree/strongly-agree
with the opinion that the assessment of employee performance online
helps to calculate performance related pay effectively. A relatively
small proportion of 7% remain undecided on the issue. About 41% of
the respondents disagree/strongly-disagree.

208
(xi) Figure 9.4 shows the opinion of respondents on the view that e-
HRM process has been effective in providing clear role definitions.
The above figure shows that several respondents i.e. about 25% are
undecided on the view that e-HRM process has been effective in
providing clear role definitions. A substantial proportion (50%)
disagree/strongly-disagree with the view. Of all the respondents
25.38% agree/strongly-agree with the view.
(xii) A substantially large proportion of respondents (34.90%)
strongly-disagree with the view that the e-HRM process has enabled
to identify and nurture individual talents and help to raise their
performance. About 7% disagree with the view whereas about 26%
remain undecided. Of the total respondents about 33%
agree/strongly-agree with the view.

209
(xiii) About 56% of the respondents agree/strongly-agree with the
view that the self service e-learning opportunities have supported
employees to keep their knowledge and skills up-to-date. A
substantial proportion i.e. about 35% remain undecided on the issue
whereas a relatively small proportion i.e. 9% disagree/strongly-
disagree with the view.
(xiv) About 41% of the respondents agree/strongly-agree with the
view that the e-learning strategies have brought about an effective
change in leadership development and almost an equal proportion
disagree/strongly-disagree with the view. Of the total respondents
18% remain undecided on the issue.
(xv) About 43% of the respondents agree/strongly-agree with the
opinion that e-HRM has provided sufficient opportunities for
employees’ career planning and development. Of the total
respondents 36% disagree/strongly-disagree with the view whereas
21% remain undecided.
(xvi) W.r.t. the view that training through e- HRM helps in
recommending candidates for promotion and individual
compensation awards about 46% of the respondents agree/strongly-
agree. A substantial proportion (45%) disagrees and only 5% strongly
disgrees with the view. About 10% remain undecided.

210
(xvii) The opinion that the employees have been provided with
necessary resources and sufficient training to be able to use e- HRM
technology is shown in Figure 9.5
From the above figure it can be seen that more than ½ of the
respondents (52%) disagree/strongly-disagree with the opinion that
the employees have been provided with necessary resources and
sufficient training to be able to use e- HRM technology. About 32% of
the respondents agree/strongly-agree with the view and about 16%
remain undecided.
(xviii) Regarding the opinion that the intranet delivered
communication system has provided opportunity for employees to
participate in communication and consultation activities
approximately 50% of the total respondents remain undecided on the
issue and about the same proportion agree/strongly-agree on the

211
issue. None of the respondents disagree/strongly-disagree with the
view.
(xix) A substantial proportion of the respondents( 41%) disagree
with the view that the e-HRM system is geared to understanding and
following grievance, disciplinary and poor performance issues in a
timely and compliant manner. Also, about 33% are undecided on the
issue. Of the total respondents about 26% agree/strongly-agree with
the view.
(xx) The opinion of respondents on the view that the e-HRM system
has increased employee commitment with the organization by
boosting their motivation and confidence levels is shown in Figure
9.6.
Figure 9.6 shows the opinion of respondents w.r.t. the view that the e-
HRM system has increased employee commitment with the

212
organization by boosting their motivation and confidence levels about
46% of the respondents agree/strongly-agree and 35%
disagree/strongly-disagree with the view. Of the total respondents
about 18% remain undecided.
(xxi) A substantial proportion of the respondents (42%) remain
undecided on the opinion that the e-HRM process ensures
compliance with policy and procedures and equal proportion
agree/strongly-agree with the view. Of the total respondents about
15% of the respondents disagree with the view whereas none of the
respondents strongly- disagree.
(xxii) On the opinion that working with e-HRM is clear and
understandable a substantially large proportion (42%) remains
undecided on the issue, about 46% agree/strongly-agree and about
12% disagree with the view. None of the respondents strongly-
disagree with the view.
(xxiii) W.r.t. the view that policies formulated under e-HRM
technology are easy to comprehend, credible and are user friendly, a
substantial proportion (45%) of the respondents remain undecided.
About 47% agree/strongly-agree and a relatively small proportion of
respondents i.e. about 8% disagree/strongly-disagree with the view.

213
(xxiv) About 35% of the respondents disagree with the view
that since the implementation of e-HRM technology the HR
department is increasingly involved in strategic HR activities. A very
small proportion i.e. about 1% strongly- disagree with the view. About
29% remain undecided whereas about 35% agree/strongly-agree with
the view.
(xxv) Figure 9.7 depicts the opinion of respondents on the view
that e-HRM technology is compatible with other systems.
The above figure shows that w.r.t. the view regarding the e-HRM
technology being compatible with other systems in use, 43% of the

214
respondents agree/strongly-agree with the view and about 46%
disagree/strongly-disagree. Of the total respondents about 11%
remain undecided on this issue.
(xxvi) The opinion of respondents on the view that e-HRM
system is user friendly is shown in Figure 9.8
The above figure shows that regarding the view that e-HRM system is
user friendly, more than ½ i.e. about 51% of the respondents
agree/strongly-agree with the view whereas about 31% disagree. Of
the total respondents about 18% remain undecided and none of the
respondents strongly-disagree.
(xxvii) In the opinion of respondents regarding the timely
availability of information through the e-HRM system, about 54% of

215
the respondents agree/strongly- agree with the view whereas only
19% disagree. Of the total respondents about 27% remain undecided.
(xxviii) Figure 9.9. shows the opinion of respondents on the view
that the e-HRM system provides up-to-date information.
A very large proportion of respondents i.e. about 88% agree/strongly-
agree with the view that the e-HRM system provides up-to-date
information. None of the respondents disagree/strongly- disagree
with the view whereas about 12% remain undecided.

216
(xxix) The opinion of respondents on the statement that the e-
HRM system has ensured a clear fit between business and HR
strategy is shown in figure 9.10
The above figure shows that w.r.t the opinion of respondents on the
view that the e-HRM system has ensured a clear fit between business
and HR strategy about 52% of the respondents agree/strongly-agree
and 25% disagree. None of the respondents strongly disagree
whereas about 23% remain undecided.
(xxx) W.r.t. the view that e-HRM has been an effective change agent
for positively molding the employees' attitudes towards the use of
technology more than ½ i.e. about 56% of the respondents
agree/strongly-agree whereas about 30% disagree. None of the

217
respondents strongly-disagree with the view and about 14% remain
undecided.
A majority (more than half) of the respondents agrees with the views
that - e-recruitment process operates with the need to match
employee profile with positions vacant in the organization; pay
structure has been clearly defined in the e-HRM system; the
assessment of employee performance online helps to calculate
performance related pay effectively; self service e-learning
opportunities have supported employees to keep their knowledge and
skills up-to-date; e-HRM system is user friendly; e-HRM system
provides up-to-date information and e-HRM has been an effective
change agent for positively moulding the employees' attitudes
towards the use of technology.
However, as per the respondents’ view the e-HRM system needs to
gear up w.r.t. the following areas - enabling employees to enroll for
flexible benefits administration; providing employees with necessary
resources and sufficient training to be able to use e-HRM technology
and enabling the HR department to be increasingly involved in
strategic HR activities.
The analysis of results also helped in identifying the issues and
challenges involved in the implementation and maintenance of e-HRM
systems. These are enumerated in the next chapter.

218
CHAPTER 10
The Pre-requisites and
Challenges of e-HRM

219
CHAPTER 10
The Pre-requisites and Challenges of e-HRM
As always, technology comes with its inherent risk- that of huge set up
costs, overkill and loss of the “human touch”, security of information
generated, managing the data, monitoring and feedback, etc. The
decision to go in for e-HRM involves a lot of brain racking sessions and
utmost care and caution. It would not at all be proper to deduce that
simply installing e-HRM software will work as a magic wand for the
company. Hence, first and foremost it is very important for the HR
professionals to get comforTable with the technology before they make
other people see the value of such tools.
A careful analysis and interpretation of the information collected helped
in identifying the following pre-requisites and challenges w.r.t. any e-
HRM venture:-
10.110.110.110.1 The PreThe PreThe PreThe Pre----requisites of erequisites of erequisites of erequisites of e----HRMHRMHRMHRM
10.1.110.1.110.1.110.1.1 Commitment to change management from the start Commitment to change management from the start Commitment to change management from the start Commitment to change management from the start
of the projectof the projectof the projectof the project
Change management is mandatory. There are too many horror stories of
technology initiatives that did not work when they are treated totally as a
technology implementation. Many organizations develop special change
management teams. Involvement of the change management team is

220
necessary from the start to ensure that adequate documentation and
communication occurs early in the project and continues throughout the
project.
10.1.210.1.210.1.210.1.2 Presence of an IT Culture an important pre Presence of an IT Culture an important pre Presence of an IT Culture an important pre Presence of an IT Culture an important pre ––––
conditionconditionconditioncondition
Companies must first figure out whether they need e-HRM before
calling in consultants to implement solutions. Organizations seeking
enhanced transparency go for e-HRM. The software provided by
vendors needs to be tailored to organizational requirements. A lot of
research and in-depth study and analysis need to be done to ascertain
the feasibility of the project especially in terms of the cost factor and
the sustainability of the project. Only those firms, which are thoroughly
prepared for e-enabling HR, should go for it. This presupposes the
presence of an IT culture, the HR department as a process owner, being
clear about the objectives of e-HRM, choosing the right design and
implementation partners and a willingness to spend hours training
employees on the optimum use of the portal.
10.1.310.1.310.1.310.1.3 Culture of Knowledge managementCulture of Knowledge managementCulture of Knowledge managementCulture of Knowledge management
A point to make note of is that Knowledge management (KM) and e-
HRM go hand in hand. Tacit knowledge without e-HRM will tend to
reside within people and manuals, making learning difficult. Godrej
currently has an MS Share-Point knowledge portal, which serves as KM
system among cross-functional teams. Knowledge management at P&G

221
is all about “Team spaces” provided to all teams to capture and
integrate learnings by each individual in a team. It also has “functional
websites” where information about each functional area is shared on a
website to capture learnings and share it.
10.1.410.1.410.1.410.1.4 Involvement of all the stakeholders early on to gain Involvement of all the stakeholders early on to gain Involvement of all the stakeholders early on to gain Involvement of all the stakeholders early on to gain
their buytheir buytheir buytheir buy----inininin
This is an important pre-condition for any e-HRM venture to be initiated
and to be implemented successfully.
10.1.510.1.510.1.510.1.5 CommuniCommuniCommuniCommunication of the value of any technology cation of the value of any technology cation of the value of any technology cation of the value of any technology
solution to the userssolution to the userssolution to the userssolution to the users
Communicating the value of any technology solution for both the
organization and more importantly for the people who will use the
solution is necessary. This communication must be in the users’
language.
10.1.6 10.1.6 10.1.6 10.1.6 Clarity on the part of all users regarding the Clarity on the part of all users regarding the Clarity on the part of all users regarding the Clarity on the part of all users regarding the
questionquestionquestionquestion---- “What’s in “What’s in “What’s in “What’s in it for me?”it for me?”it for me?”it for me?”
Managing the venture successfully requires not just implementing the
technology but also managing the expectations of all to be affected.

222
10.1.710.1.710.1.710.1.7 Adequate traiAdequate traiAdequate traiAdequate training to the usersning to the usersning to the usersning to the users
Assuming that self service is supposed to be so easy to use that no
training is required would be to a major blunder. The process changes
typically need to be absorbed into the organization’s way of doing
business and training is the way to make that acculturation. Training
each target audience is a necessary pre-condition.
Allocating at least 15% of the overall project budget to change
management, training and communication can make a substantial
difference toward the organization’s perception of success. Allocating
adequate time, resources, and budget to training, communications, and
change management will make the difference toward achieving a
positive user community perception of a successful HR technology
project.
10.210.210.210.2 The Challenges of eThe Challenges of eThe Challenges of eThe Challenges of e----HRMHRMHRMHRM
Among the most prevalent issues facing management are control,
business requirements, and best practices (Ptak 2000). Some of the
major challenges that have been identified are-
10.2.110.2.110.2.110.2.1 Cost ImplicationsCost ImplicationsCost ImplicationsCost Implications
Costs tend to be proportional to requirements and the type of
organisation. Given the costs, companies must e-enable only those
operations that are vital, essential or desirable. IDBI Bank invested
about Rs.32 lakh in an Oracle HRIS (HR information system) and Rs. 3

223
lakh in an e Learning portal. It further invested about Rs. 10-12 lakh for
developing an e-Training module. Thanks to a clear set of objectives
and detailed planning the bank expected a payback on its investment in
three years for the HRIS and six months for the e-Learning venture.
10.2.210.2.210.2.210.2.2 Aligning the eAligning the eAligning the eAligning the e----HRM system with the business HRM system with the business HRM system with the business HRM system with the business
requirementsrequirementsrequirementsrequirements
ERP applications vary widely in their allowance for control, typically
assuming either a corporate or business-unit locus of control. Hence
management must consider the ERP’s stance on control to ensure it
will meet the business requirements of the company. Also, it is critical
for managers to understand the vendors’ naming conventions and
software modules to gain an understanding of how these features can
be implemented to meet the requirements of the business’s activities.
10.2.310.2.310.2.310.2.3 Security of the information generatedSecurity of the information generatedSecurity of the information generatedSecurity of the information generated
A related issue of concern is the security of the information generated
through the e-HRM system. A company needs to ensure that outsiders
or competitors should not access the information. Quite clearly,
security is an important area of concern in e-HRM. In this context
proper vendor selection is a critical condition to ensure confidentiality
by avoiding goofups and being misled. At godrejite.com the site opens
only when an employee logs on with a password. Employees are asked
to keep changing passwords and those who forget are penalized.

224
Oracle has multi-level data protection facilities. There is restricted
access to business processes by limiting menu options for different
user types, known as responsibilities. Examples might be a UK
recruitment manager or a US compensation manager. There may be
limited access to different self-service functions in the same way. For
instance, certain users may be restricted to see only (job) applicants
and not the entire list of employees through a form.
10.2.410.2.410.2.410.2.4 Managing the dataManaging the dataManaging the dataManaging the data
Managing the huge amount of data generated through HRMS is a
relatively new challenge for companies. Some companies like Infosys,
L&T, Godrej, etc. are mining this data to understand patterns like
workforce utilization levels, tracking employee attrition rates etc.
10.2.510.2.510.2.510.2.5 ‘Overkill’ and loss of the ‘human touch’‘Overkill’ and loss of the ‘human touch’‘Overkill’ and loss of the ‘human touch’‘Overkill’ and loss of the ‘human touch’
Another challenge is the avoidance of ‘overkill’ and loss of the ‘human
touch’. It should not be the case that in a bid to be techno-savvy we
neglect the human side. No one likes to interact constantly with face-
less names answering queries on the phone or replying to questions
through the system network. While broadcast messages, regular
updates as well as routine personnel administration can be
technologically enabled, group meetings, counseling and other human
interventions are critical to augment employee engagement levels.

225
10.2.610.2.610.2.610.2.6 For traditional companies the task is more so For traditional companies the task is more so For traditional companies the task is more so For traditional companies the task is more so
difficultdifficultdifficultdifficult
E-HRM is more so a challenge for the traditional companies which need
to bring about a change in the mindsets to a large extent. These
companies as compared to those in the IT sector, BPOs etc. are having
a tougher time getting people to speed up on these e-HR tools. It is very
important first for the e-HRM professionals to get comforTable with the
technology before they make other people see the value of such tools.
10.2.710.2.710.2.710.2.7 Customization to be taken up in the right Customization to be taken up in the right Customization to be taken up in the right Customization to be taken up in the right
perspectiveperspectiveperspectiveperspective
Most of the packages are of international standards and based on best
practices. Hence customization is huge in the Indian context and needs
to be taken up in the right perspective. Customizations can also be
costly and maintaining and upgrading customizations can be
cumbersome. As rightly commented by a senior SAP HR executive in
an Indian giant – “Content is most important. Without content even the
best of package is as good as a Ferrari parked in garage without
petrol.” A high degree of technical finesse is required by people who
handle these packages so much so that many a times function takes a
backseat.

226
10.2.810.2.810.2.810.2.8 Training the users a crucial issueTraining the users a crucial issueTraining the users a crucial issueTraining the users a crucial issue
It is said that ERP packages are integrated but in the true sense this is
not the case because of non-translation of business model. Training the
users is many a time a long drawn out process, as many people do not
find them to be user friendly. Business Process Re-engineering is a
must wherever any ERP program is introduced and a Change
Management program should go hand in hand with implementation.
Data has to be complete, accurate and relevant to take maximum
leverage of the solution.
10.2.910.2.910.2.910.2.9 The Return On Investment on an eThe Return On Investment on an eThe Return On Investment on an eThe Return On Investment on an e----HRM project to HRM project to HRM project to HRM project to
be justifiebe justifiebe justifiebe justifiedddd
How does one ensure a return on e-HRM investment? The ROI on an e-
HRM project is the projected cost reduction brought about by the
system and its impact on revenue/profits over time. The e-HRM
initiative should align itself with the overall HR and IT strategy and
ultimately, with the business strategy to ensure ROI.
10.2.1010.2.1010.2.1010.2.10 ERP to function along with other systems to be ERP to function along with other systems to be ERP to function along with other systems to be ERP to function along with other systems to be
successful successful successful successful
Another aspect which needs to be looked into is that while ERP helps
companies to integrate systems across the organization, it falls short in
communicating across organizational boundaries. Companies wanting
to integrate their value chains with the business activities of their

227
suppliers, business partners and customers typically have to
implement systems other than ERP like Customer Relationship
Management (CRM), etc.
10.2.1110.2.1110.2.1110.2.11 Continuous monitoring and feedbackContinuous monitoring and feedbackContinuous monitoring and feedbackContinuous monitoring and feedback
Continuous monitoring and feedback are critical for the success of any
e-HRM effort in an organization.
A careful consideration of all the outlined issues is imperative before
undertaking any e-HRM venture.

228
CHAPTER 11
RECOMMENDATIONS AND
SUGGESTIONS
229
CHAPTER 11
RECOMMENDATIONS AND SUGGESTIONS
All information systems can be described as organizational and
management solutions to challenges posed by the environment that will
help create value for the firm. Information systems are more than
computers. Using information systems effectively requires an
understanding of the organization, management, and information
technology shaping the systems.
E-HRM has become an inseparable part of the functioning of almost all
the large business players in the current scenario. However, as always
technology comes with its inherent risks. Hence, it is very important for
the HR professionals to get comfortable with the technology before they
make other people see the value of such tools.
Some of the important factors to be considered before going in for any
e-HRM venture are highlighted in this Chapter.
11.111.111.111.1 PPPPlanlanlanlanningningningning for employee and organizational issues from the for employee and organizational issues from the for employee and organizational issues from the for employee and organizational issues from the
outsetoutsetoutsetoutset
Launching a new technology that changes a company process is not as
simple as flipping a switch. To successfully initiate a new process -- and
realize the full value of the investment -- companies must address
possible employee and organizational issues from the outset. Most

230
companies understand the need to address potential issues when
implementing large-scale, cutting-edge initiatives. But many companies
may underestimate the importance of preparing their organizations for
small to mid-sized projects too.
Consider the case of a company adding online enrollment to its benefits
administration system. Of course, the company must upgrade its
technical capabilities, but the organization also must anticipate how the
change will impact its employees and processes. The company should
start by educating its employees about the advantages of online
enrollment, e.g., the system will be faster, more accurate and allow
workers to enroll at their convenience. Access issues -- where, how and
when employees can use the system -- must be addressed. Also,
employees need to know that their access to plan descriptions and other
helpful information will be enhanced.
At the same time, HR personnel must gear up for the changes
associated with abandoning the labor-intensive, time-consuming paper
enrollment process. New job descriptions may be necessary, and the e-
HR staff must be trained to help employees navigate the new system.
The organization also must establish the processes needed to ensure
timely, accurate transfers of electronic enrollment information to the
vendors.
The Key to Success lies in seeking stakeholder engagement and buy-in,
assessing organizational impact and creating communication and
training plans

231
11.211.211.211.2 Assessing the Flexibility of the HR TechnologyAssessing the Flexibility of the HR TechnologyAssessing the Flexibility of the HR TechnologyAssessing the Flexibility of the HR Technology
Reduce the risk of technology obsolescence by assessing the flexibility
of the solution prior to implementation. A technology project as
seemingly straightforward as a new HRIS or benefits enrollment system
can take several years to implement. If the technology is obsolete by the
time it is implemented, then its long-term value will be limited. One way
to reduce this risk is to shorten the project timeline. Another is to ensure
that the solution is flexible enough to adapt to changing needs in the
future. The same is true for the organization's HR technology strategy.
In order to be flexible the technology should be capable ofIn order to be flexible the technology should be capable ofIn order to be flexible the technology should be capable ofIn order to be flexible the technology should be capable of----
• being adapted to a change in business strategy
• serving a changing audience
• being deployed across multiple functions
• providing needed support for non-HR systems
• being used for multiple tasks with few modifications
• being deployed globally
• accommodating growth
Most important is that the technology must adapt to significant growth
in the organization. Explore this question in terms of both technical
feasibility and functional use. Each can cause a bottleneck as the
organization grows.

232
11.3 11.3 11.3 11.3 Service Delivery ApplicationsService Delivery ApplicationsService Delivery ApplicationsService Delivery Applications
To serve more employees, companies should move to manager self
service and a service center approach or outsource their processes and
systems.
• To keep the processes and systems in-house, implement help
desk for HR.
• To outsource, partner with a vendor with state-of-the-art self
service offerings.
11.411.411.411.4 HR Service Centers: Investments to ConsiHR Service Centers: Investments to ConsiHR Service Centers: Investments to ConsiHR Service Centers: Investments to Considerderderder
One needs to consider the advantages of separating out HR
administration from more strategic work and of standardising and
centralising this activity in an in-house HR service centre. In this context
the issues that need to be addressed are managing the transition,
staffing the service centre and the role of technology.
Many employers have sought to streamline and centralize their routine
HR transactions and processes in an HR service centre. The service
centre is often the lynchpin of a company’s efforts to move towards a
more efficient HR function. It also tends to act as the focal point for
handling HR enquiries from line managers and employees. The service
centre often operates alongside an HR intranet and employee self-
service. Among the benefits of this model are cost savings from lower
transaction costs and the need for fewer staff, a greater consistency of

233
approach across a company to HR matters, and a more responsive
service from HR that is better aligned to overall business goals.
Setting up an HR service centre can be a complex and time-consuming
undertaking, particularly in organizations where many different HR
practices have hitherto been the norm. The concept needs to be clearly
defined and communicated and the transition process carefully planned.
As budgets grow for HR technology investments, companies are
capturing more value by using their shared service centers to handle the
simple tasks that comprise their more complex HR service delivery
processes. Companies are studying their HR service delivery processes,
their shared service centers and the basic HR functions they handle.
Shared service centers have already been shown to reduce costs and
improve basic HR service delivery. As a result, smart companies are
looking beyond the basic processes and are capturing more value by
examining three areas of potential value: middle-tier processes,
business event management and service center performance
measurement. Because the service center infrastructure already exists,
the financial commitment needed to invest in these areas is well within
the reach of many expanding HR budgets.
MiddleMiddleMiddleMiddle----tier process improvementstier process improvementstier process improvementstier process improvements: : : : Typical HR shared service
center representatives spend their time answering simple questions
about benefits, payroll and compensation. They also process
transactions such as address changes and benefits enrollment for
employees who don't have web access. The goal is to quickly address

234
individual employees' questions or transaction needs and mark their
cases closed.
By directing managers to the e-HR shared service center, companies
reduce the time e-HR generalists spend on the performance review
process and give managers the help they need. Companies also more
easily capture effectiveness data by using service center tools that track
questions and issues. For example, if call data shows 70 percent of
managers asked for assistance with an online review tool, its clear more
training and/or system changes are needed to make the tool easier to
use.
Business event managementBusiness event managementBusiness event managementBusiness event management: : : : Also consider event management for
the shared service center. Why maintain additional administrative staff
in a training unit to handle course questions or class registrations when
the shared services group can do the work? During an acquisition, why
create a separate team to answer policy questions or process selection
and retention changes? This task can be handled by the shared services
group.
Performance measurementPerformance measurementPerformance measurementPerformance measurement: : : : Measuring service center performance
is another area of overlooked potential. While most companies
adequately measure the basics -- the number of calls or transactions,
talk time, abandon rate, case rates and whether service-level
commitments are being met -- far fewer focus on actionable measures
that drive business decisions.

235
Actionable measures give companies information that can be used to
determine future strategies. By analyzing call patterns and topics,
companies gain insight into employees' top concerns. This information
can then be used to develop targeted programs to resolve problems
before they cause harm.
11.511.511.511.5 Outsourcing HR administrationOutsourcing HR administrationOutsourcing HR administrationOutsourcing HR administration
The business case for outsourcing HR administration centers on the
potential for cost savings to be delivered by investment in e-enabling HR
transactions and processes. The delivery channels for such
arrangements typically include e-HR self-service routes and HR service
centers. Through this web-enabled technology, the cost of HR
transactions can be dramatically reduced by standardization and
automation of processes. Outsourcing to an external supplier is often
the best way for an employer to gain access to the technology that
enables it to achieve a step change in HR service delivery.
Outsourcing HR administration is a major project for any organization
and requires careful planning. The starting point is usually a feasibility
study where compatibility with the preferred partner can be assessed
and any potentially difficult issues anticipated. The complex
implementation phase that follows often sees the transfer of some HR
staff to the supplier and usually requires personnel data to be verified.
Once the service is up and running, progress towards the partners'

236
objectives can be monitored through service level agreements and key
performance indicators.
Freed from the HR administrative workload, a company's newly
streamlined HR function can act more strategically both in policy
formulation and in business partner roles. Although growth in
outsourced HR administration contracts is steady rather than
spectacular, more suppliers are entering the market with some targeting
small to medium-sized companies rather than the big multinationals.
11.611.611.611.6 Creating an Effective eStatement: a PrimerCreating an Effective eStatement: a PrimerCreating an Effective eStatement: a PrimerCreating an Effective eStatement: a Primer
Communicating the value of investment in employee compensation,
health insurance, pension plans and other benefits is crucial for
engaging and motivating employees. Chances are employee
compensation, bonuses, health insurance, pension plans, vacation time,
sick leave and other benefits add up to the single largest expense in the
budget. Communicating the value of these investments is crucial for
employee engagement. According to the most recent Watson Wyatt
Work USA(R) research, employees who know the value of their total
compensation package are twice as likely to be engaged in their work as
employees who don't.
Web-based total compensation statements, or eStatements, are
important tools for increasing employees' benefits awareness. Important
features include 24/7 accessibility, real-time data and easy integration
with external vendors, HRIS systems and other data sources. As with
237
any technology tool, getting the most out of eStatements requires
thoughtful design and planning.
The following five steps can help:
• Focus on integration by providing quick, up-to-date access to
plans and flexible spending account balances, pension
projections, stock prices, payroll and other dynamic data -- all
from one location.
• Encourage interactivity by linking with pension or health and
welfare benefits modelers and showing the impact of different
scenarios on the total compensation.
• Promote ease-of-use by making eStatements should be attractive,
easy-to-navigate and accessible from anywhere via a single sign-
on over a secure server.
• Communicate early and often to let employees know why the
statements are important, where they can be found and how they
should be used.
• Periodically solicit feedback from employees.
eStatements are valuable tools for improving employees' awareness of
compensation and benefits. When properly designed and implemented,
they improve employees' knowledge and satisfaction while reducing
HR's administrative workload and costs.

238
11.711.711.711.7 Use of Use of Use of Use of Case MCase MCase MCase Management Toolsanagement Toolsanagement Toolsanagement Tools for Compensation for Compensation for Compensation for Compensation
PlanningPlanningPlanningPlanning
Simple to use and relatively low-cost, case management tools help to
reduce call volume, improve response times and better manage large-
scale employee events. But for greater control over service center
performance one should take advantage of the advanced functionality
available with many case management systems.
• Effective case management tools provide a comprehensive view
of individuals' transaction histories, allowing representatives to
see both past and current inquiries for an employee and to take a
proactive approach to resolving employee questions.
• Good case management tools integrate with databases across the
organization to automatically populate forms with required data.
When an employee's ID number is entered into the form,
information such as the employee's name, location, date of birth,
position and cost center can be automatically retrieved and
displayed. Both employees and center representatives save time
with this auto-update feature.
• Sound case management systems provide center managers and
executives with reports that compare response times, case
closure rates and other measures against service targets. These
metrics allow the manager to generate these reports at any time,
to determine whether his center is performing as expected.

239
• Evolving corporate objectives and volatile economic conditions
can mean that HR must frequently deal with events, such as
mergers and workforce reductions that affect only some
employees. A good case management tool can automatically set
up cases for all affected employees and track their progress
through the event.
Adding advanced case management tools or upgrading the existing
system can considerably add to the capability to track and manage
individual and group transactions from start to finish. The result:
Continuity across the service center operations and reliable
performance measurement.
11.811.811.811.8 EEEE----RecruitmentRecruitmentRecruitmentRecruitment
With the advent of the World Wide Web, there has been a paradigm shift
in the ways companies recruit the world over.
Some of the advantages of Internet Recruiting are as follows:-
• Hires Top Talent
• Lowers Recruiting Costs
• Telescoping Recruiting Lead Time
• Enlarged Candidate Pool
• Phenomenal Geographical Reach
• A Unique two-way Communication Medium
240
• Streamlines Hiring Process
• Create One’s Very Own Employment Site
• Choosing Job-Sites and Managing Job Postings
• Creating a ‘Killer’ Job Posting
• Multi-site Resume Harvesting
It can be said that it is very significant area which is leading to the
growth of the e-recruitment market, is its increasing usage by placement
agencies. Besides this, the e-recruitment is also concentrating on areas
like heavy industries, the public sector and even entertainment, where
traditionally not many placement agencies have touched base upon.
11.911.911.911.9 EEEE---- Retirement Retirement Retirement Retirement
While employees' awareness of the value — and costs — of health care
benefits has grown in the past several years, their understanding of the
full value of pension benefits often lags behind. A company can improve
the perceived value of pension benefits so that the costs are aligned
with that value in the eyes of employees. The best bet is to help
employees calculate today's value of their pension benefit so they have
an informed view of their future benefits.
The following may be considered:
• Offer an online pension "estimator" delivered from a web site with
simple, easy-to-use navigation.

241
• Provide online retirement income statements that make multiple sources
of retirement funding seem more "real" to employees. The best
examples include projections for pension plans, profit-sharing plans,
personal savings and Social Security income.
• Establish periodic retirement communication through links on a
corporate intranet or portal. Even better, employees can receive
retirement-related reminders in response to life events or visit financial
planning portals that provide pension and retirement information.
• Consider starting small and scaling up as resources permit and retiree
needs increase. For retiree health care benefits, begin by extending
online enrollment and benefit change capabilities to retirees either
through an existing web site developed for active employees or through
a stand-alone retiree site.
• To scale up, a tiered approach to managing retiree inquiries can be
adopted. In the first tier, retirees use self- service tools to handle simple
transactions and information requests. To solve complex situations,
such as Medicare integration, retirees advance through additional tiers
of service until the problem is resolved by individuals with the
appropriate expertise.
• Adding web-based modeling tools is another way to scale up. These
modelers demonstrate the impact different choices have on out-of-
pocket costs incurred by individual retirees. In addition, such models
show how company-sponsored retiree medical benefits interact with
Medicare entitlements. To help the retirees make more informed — and

242
more cost-effective — decisions, one can offer them health management
information via a designated Intranet site.
11.1011.1011.1011.10 Data mining toolsData mining toolsData mining toolsData mining tools
With the introduction of technology into virtually every HR process,
organizations are capturing thousands of pieces of potentially useful
employee information every day. However, this data can be useless
unless data mining tools are used to put the information to work. Data
mining tools use regression and other analytic techniques to discover
and report correlations and trends among sets of data. In directed data
mining, automated tools apply specific questions to specific sets of
data. Undirected data mining uses automated tools to scan volumes of
data looking for otherwise undetecTable patterns and relationships.
To get the most from data mining processes, organizations should:
• Improve data accuracy
• Establish global standards
• Emphasize actionable insight
11.1111.1111.1111.11 Investing in Portal TechnologyInvesting in Portal TechnologyInvesting in Portal TechnologyInvesting in Portal Technology
While the potential expansion of employee portal and intranet budgets is
welcome news, capitalizing on it requires careful prioritization of
resources. Personalization and smart search capabilities are two

243
investments that companies should consider. Since the economy has
improved, the budget for employee portals is finally expanding.
PersonalizationPersonalizationPersonalizationPersonalization: : : : Portals use role-based personalization to display
information based on a user's identity. Personalization tools pull from
the company's HR information system, IT network log-in database and
other data sources to identify users and determine which content and
applications should be displayed. By acting as both filters and routers,
the personalization tools ensure portal users see only the information
and applications that are relevant to their specific jobs, departments,
business units, locations or personal circumstances.
The benefits of personalization are three-fold. First, it gives employees
the information they need without requiring them to sift through
materials they don't. Second, it helps companies’ direct
communications and messaging to specific employee groups. And third,
it reduces the number of redundant, independent websites set up to
serve separate audiences, producing tangible labor and cost savings.
Smart searchingSmart searchingSmart searchingSmart searching: : : : Smart searching is another important tool to
consider. The most frequent complaint from employees about their
organization's portal is, "I can't find what I'm looking for." By putting
strong, "smart" search engines in place, companies help employees find
the information they need, when they need it, with a minimum of effort.
Smart searching capabilities also give employees access to related
information.

244
The bottom line is that companies should approach portal expansion
strategically and focus on tools that create efficiencies and help align
employees with organizational objectives.
11.1211.1211.1211.12 Best Practices of HR PortalsBest Practices of HR PortalsBest Practices of HR PortalsBest Practices of HR Portals
Here are some suggestions from companies that have been successful
getting a portal up and running.
• Company site should be designed as an "employee-centric" site,
which means that accessibility and functionality from the end
user’s standpoint are central to all design decisions. New tools
and applications should be user-friendly, easy-to-navigate and
intuitive.
• Facilitate communication between technical and content people.
People who work in close physical proximity tend to get to know
and understand each other better.
• Perform rapid prototyping. Devise a simple prototype of an HR
module, implement it, and then work with end users to expand the
functionality of the system.
• Personalize or customize wherever possible.. Differences in
benefits and policies at different plant locations may also require
customization of content by location.
• Create and follow a clear, step-by-step implementation
approach. First, make sure that the strategic plan for automation

245
aligns with HR goals and the company’s overall strategy. Then,
rather than rolling out everything on the intranet all at once, a
stair-step approach gives employees time to learn the new system
piece-by-piece. Introduction of new tools keeps them coming
back.
• Develop a process for content ownership and updating. If users
detect that the site isn’t being regularly updated, they are unlikely
to continue using the system. There should be a well-defined
process by which content leaders update Web information.
• Evaluate processes before automating them. Instead of
automating an inefficient process, reengineer it and then
automate it.
• Provide "self-service" access for everyone. If employees do not
have access to their own PC or kiosk-based PCs, an IVR
(interactive voice response) system may be necessary. Mobile
employees who do not have network availability and use modems
may need a text-only version of the HR Web that provides relief
from long download times. The option of making it possible for
employees to access the intranet from home could also be
considered.
• "Advertise" new content. Be creative in introducing new
features. One way to do this is to organize a contest with prizes to
raise employee interest. Another way is to let the intranet market

246
itself by spreading announcements throughout Web space with
cross-linked sites.
• "Brand" the company site. Give the HR site a name and identity
to help employees perceive it as the "go to" place. Make the Web
the authoritative source for HR information.
• Develop ways to attract and retain talented Web designers. Web
interface design is a hybrid of communication, industrial design,
and technology.
• Make this the only game in town. For example, if it expected of
employees to enroll in benefits online, take away the traditional
paper enrolment process.
• Create a fallback resource. For employees experiencing
difficulty using the Intranet, set up a "help desk" to answer
questions about Web tools and features and to direct them to
needed Web information.
11111.131.131.131.13 EEEE----learninglearninglearninglearning
E-learning is increasingly being used by employers to complement
more traditional training methods. As e-learning materials have become
more widely accessible, organizations have developed a better
understanding of what can realistically be achieved. While increasingly
sophisticated software packages are now available, employers are now

247
designing e-learning resources on the basis of what should be
implemented.
Many organizations are now adopting a ‘blended’ approach to learning
and development. This is based on the recognition that e-learning is just
one of many forms of training delivery, all of which have a role to play in
providing employees with essential knowledge and understanding. The
greatest strength of e-learning lies in its potential to provide a
consistent level of training when and wherever it is needed.
Benefits of e-learning
The main benefits of e-learning as a training medium can be summarized
as follows:
• improved accessibility of training materials
• increased flexibility, with training delivered to staff in ‘bite size’
chunks
• greater consistency – all staff receive the same information at the
same level
• sustainability of content and learning
• value for money – the potential for significant savings in the cost
of travel and associated expenses.

248
11.1411.1411.1411.14 HR intranetsHR intranetsHR intranetsHR intranets
HR intranets are playing an important role in reshaping the e-HR
function. They play a pivotal role in providing Business-to-employee
services. They provide their three main target groups - employees, line
managers and the HR function itself - with a single point of access to a
suite of online HR applications and to an authoritative source of HR
policy and guidance. They also offer the HR function a new channel for
communication with employee and line managers, enabling it to
disseminate a consistent message to a dispersed workforce.
Increasingly, HR intranets provide links to self-service applications.
These enable employees and managers to carry out, or at least initiate,
basic HR transactions online and thereby relieve the administrative
pressure on HR. One also needs to consider the impact of self-service
on working culture. While self-service offers a means of empowering
staff by giving them greater control over their personal data, it is also an
environment in which employee and managers are expected to take on
greater responsibility. For this reason, winning support for e-HR is
critical.
11.1511.1511.1511.15 Internet & eInternet & eInternet & eInternet & e----mail policiesmail policiesmail policiesmail policies
The Internet and e-mail have rapidly become an essential part of
business life. But as organizations become more reliant on workplace
information systems, their vulnerability to serious commercial damage
caused by careless or deliberate employee actions increases. It is
essential, therefore, for employers to develop robust security

249
procedures for their IT systems and to spell out to employees what is
considered acceptable and unacceptable in terms of their e-mail and
Internet use at work, whether this is for business or personal reasons.
Company information is at risk both from data corruption and also from
breach of security. Employers therefore must draw up a clear policy
establishing the boundaries of acceptable use and warning employees
of the potential disciplinary consequences of failure to observe the
rules.
Many employers now install specialist software to monitor their IT
systems to block access to inappropriate websites and to filter e-mail
for excessively large files or dubious attachments. However, employers
need to bear in mind that monitoring has implications for the privacy
rights of employees and the lawfulness of processing personal data.
11111.161.161.161.16 WWWWeb 2.0 and Social Networking Applicationseb 2.0 and Social Networking Applicationseb 2.0 and Social Networking Applicationseb 2.0 and Social Networking Applications
Best practice organizations continuously explore new technologies and
apply when warranted. Studies have shown that early adopters using
social networking for recruiting and branding had double the Sales
Growth of those without.
11.1711.1711.1711.17 Strategic HCM ApplicationsStrategic HCM ApplicationsStrategic HCM ApplicationsStrategic HCM Applications
Focus new implementation work on strategic HCM applications to
improve financial performance. This can be done in the following ways-
• Deploying an integrated talent management solution to
achieve the lowest total cost of ownership possible.

250
• Implementing competency management should be at the
heart of any talent management strategy as this will enable the
most effective workforce planning, recruiting, development, and
compensation management.
• Ensuring that the scope of succession planning is not just
the top management tier but middle management if not ALL
employees. Such a scope tells managers and employees that they
matter and that there is a place for them in the organization's
future. This ensures their engagement and subsequent improved
productivity.
• When it comes to business intelligence, first start with a metrics
and analytics strategy and then move quickly to implement a
solution—middleware to extract, transform, and load data into
dashboards usable by decision makers—at the very minimum.
• Consider adoption of Web 2.0 technologies to increase
collaboration within the workforce and increase engagement with
remote and Generation Y employees.
A careful analysis and evaluation of the various options available, by an
organization planning to introduce e-technology based HR systems, can
go a long way in enhancing the effectiveness of such systems. Any e-
HRM exercise when taken up in the proper perspective will ultimately
result is a substantial elimination and cutting down of redundant
activities and a boost to the profit margins of the organizations.

251
CHAPTER 12
CONCLUSION

252
CHAPTER 12
CONCLUSION
E-HRM has become an inseparable part of the functioning of almost all the
large business players in the current scenario. It helps in integrating the
widespread activities of organizations by enabling connectivity between
different organizational functions and providing accurate and timely
personnel information on-line and round the clock. The ultimate result is a
substantial elimination and cutting down of redundant activities and a
boost to the profit margins of the organizations. E-HRM phenomenally
reduces dependence on the time consuming and error-prone Human
Resource paper trail. However, as always, technology comes with its
inherent risk- that of huge set up costs, overkill and loss of the “human
touch.” Hence, first and foremost it is very important for the HR
professionals to get comforTable with the technology before they make
other people see the value of such tools.
Using specialist software helps to automate and streamline Human
Resource processes and to provide a single source of Human Resource
data. A comprehensive analysis of the key areas that companies should
consider when selecting and implementing a human resource management
system must be done. Information on the principal products offered by
software suppliers must be done. A Human Resource Management System
(HRMS) can be used to streamline Human Resource processes and to
provide a single source of all associated employee and organizational data.

253
Today's Human Resource software offers increasingly sophisticated
functionality giving companies the opportunity to automate labour-
intensive processes and devolve routine transactions to line managers and,
in some cases, to employees themselves. The introduction of a Human
Resource Management System can help to ease the administrative burden
for busy Human Resource departments, which stand to gain from increased
access to Human Resource data, streamlined and standardized processes,
greater reporting functionality, more consistent and accurate data and a
higher internal profile.
The process of choosing and rolling out a new Human Resource
Management System can be a major undertaking both in terms of money
and time. It is important that Human Resource takes the lead from the
outset to ensure that the system matches the department's core
requirements. Indeed, the level of functionality of a Human Resource
Management System should be determined by the realistic needs of the
particular company. There is little point paying for features that will not be
used or that are simply not required. Companies must also make suitable
arrangements for communicating the changes and training end-users,
particularly where self-service functionality opens part of the system to line
managers and employees.
Human Resource Management System products typically comprise a series
of modules covering a full range of Human Resource functions that can be
integrated to act as a single system. The process of selecting the most
appropriate module should incorporate project leadership, initial research,
reviewing existing processes, producing a specification, sending out an
254
invitation to tender, product demonstrations, taking up references, and
making objective comparisons. The process must also cover the major
considerations and stages to implementation, including managing the
process, adopting a phased approach, setting up the system, transferring
and validating data, training end-users and communicating the changes.
In a nutshell it can be said that challenges are many and of phenomenal
implications - huge set-up costs to support a robust tech-infrastructure and
limitations in mapping all physical Human Resource processes into e-HR
process, too much focus on aggressive timelines in project execution,
possible conflicts w.r.t. process ownership by Human Resource and
Information Technology departments, etc.
Any e-HRM installation exercise if taken up in the right perspective,
keeping all the challenges in mind can take an organization a long way
towards success. In companies which have successfully tackled these
challenges e-HRM has made life easier for employees. Not to mention the
enhancement in speed and efficiency of Human Resource transactions,
lesser paperwork and cost effectiveness in the long run. Increased
transparency in functions and a total systems approach has facilitated
better control by top management. Some of the considerations for
enhancing the effectiveness of e-HR systems include – Creating an
effective e-Statement, Standardizing and Centralizing HR administration in
an in-house service center, Assessing and ensuring the flexibility of the e-
HR technology, e-Recruitment, e-Retirement, Developing Data-mining tools
and others.

255
The fact remains that e-HRM enables better management of every
enterprise’s most important competitive edge: the thinking, idea-
generating, customer-serving human resource. E-HRM eliminates
redundant activities, provides more accurate and timely personnel
information and – perhaps most important – automates the time-
consuming, error-prone Human Resource paper trail. It leaves Human
Resource professionals with more time to focus on strategic tasks and
manage better the company’s most important resource- its people.

256
REFERENCE
SECTION

257
BIBLIOGRAPHYBIBLIOGRAPHYBIBLIOGRAPHYBIBLIOGRAPHY

258
BIBLIOGRAPHYBIBLIOGRAPHYBIBLIOGRAPHYBIBLIOGRAPHY
• Afuah Allan, 'Redefining Firm Boundaries in the Face of the Internet: Are Firms Really Shrinking?' Academy of Management Review, Jan2003, Vol. 28 Issue 1, p34-53, 20p.
• Aladwani A.M. “Change Management Strategies for Successful ERP Implementation”, Business Process Management Journal, 7, 2001, Pp. 266-275.
• Armstrong Michael, A Handbook Of Human Resource Management Practice, [2003].
• Aswathappa K. Human Resource and Personnel Management, Published By Tata Mcgraw Hill (2006).
• Beer, Michael, et al. Human Resource Management. New York: Free Press, 1985.
• Bell, Bradford S.; Lee, Sae-Won2; Yeung, Sarah K.3, 'The impact of e-HR on professional competence in HRM: Implications for the development of HR professionals', Human Resource Management, Fall2006, Vol. 45 Issue 3, p295-308.
• Boudreau J., Ramstad P, “Beyond Cost per Hire and Time to Fill: Supply — Chain Measurement for Staffing”, Working Paper 01-16, Centre for Advanced Human Resource Studies, Cornell University, 2001.
• Broderick, R., Boudreau, J. W. (1992). Human resource management, information technology, and the competitive edge. Academy of Management Executive, 7-17.
• Business Line, eWorld, ‘Leading from the India sTable’, July 7, 2008.
• Business Line, ‘On a Net Drive’, eWorld, February 18, 2008.
• Business Line, ‘Using the Web to find Talent’, July 7, 2008.
• Business Line, eWorld, ‘Bring threads of Security Together’, July 14, 2008.
• Business Line, eWorld, ‘A head for figures – and IT’, August 4, 2008.
• Business Line, eWorld, ‘Goodbye, passwords’, August 18, 2008. • Business Line, eWorld, ‘When today’s Devices become ‘glorified typewriters’,
October 12 2009. • Cappeli P. ‘Making the Most of Online Recruiting’, Harvard Business Review, Vol.
70(3), 2001.
• CedarCrestone 2008-2009 HR Systems Survey: HR Technologies, Service Delivery Approaches and Metrics - 1
st Survey focused on Asia and Australia (APAC).
• CedarCrestone 2008-2009 HR Systems Survey: HR Technologies, Service Delivery Approaches and Metrics (11
th Annual Edition).
• Chung S.H. and Snyder C.A. “ERP Adoption: A Technological Evolution Approach, International Journal of Agile Management Systems”, 2, 2000 Pp. 24-32.
• cio.com- http://www.cio.com/research/erp/edit/erpbasics.html (10.01.07)
• citehr.com- http://www.citehr.com/34539-best-practices-hr-portals.html (21.12.09)
• ckc-seminars- http://www.ckc-seminars.nl/ehrm/, retrieved 21 March 2006
• coolavenues.com- www.coolavenues.com/res/taf_know.php (30.01.2010) • Curtin Dennis P. “Information Technology: The Breaking Wave”, IRWIN McGraw
Hill, 1997.
• Dataquest- http://dqindia.ciol.com/content/special/default.asp. (30.01.2010)
• Davis and Olson, “Management Information Systems- Conceptual Foundations, Structure and Development”, Tata Mc-Graw- Hill, 2002.
• Dessler Garry, “Human Resource Management”, Florida International University, 2004.
• Doughty Mark , The Role Of E-HR And Organisation, [2000], Www.Brite-HR.Com • Dr.Aravind.S. & Dr.P.Paramashivaiah, “E-Recruitment: Tool to Hire Whom You
Desire”, Research Paper submitted at the 3rd
Annual HR Conference at ITM, Navi Mumbai, 2006.
• Economic Times ‘Data Processing for Dairies’, October 6, 2009.

259
• Economic Times, ‘Defining Moments’, Corporate Dossier, January 22, 2010.
• Economic Times, ‘From notebooks to the Web’, February 9, 2010.
• Economic Times, ‘Hey! It’s time to Plug and Play’, October 2, 2009.
• Economic Times, “IT companies put training in turbo mode”, July 13, 2007. • Economic Times, “Tech companies log in to community networking platform for
hiring”, June 8, 2007.
• Economic Times, “The Man Machine”, Corporate Dossier, February 10, 2006.
• Economic Times, “When Learning goes the Soft Way”, June 19, 2009. • Economic Times, ‘SAP plans to get more Customer-centric, realign Indian Team’,
February 9, 2010. • Edwards Perry, “System Analysis and Design”, International Edition, Mc Graw Hill,
2001.
• e-HR.com- http://www.e-HR.com/articles/research.asp?id=394 (21.08.06) • Elias M. Anand, “System Analysis and Design”, Galgotia Publications (P) Ltd.,
2001.
• Elkington T. ‘Bright future for online recruitment’, Personnel Today, 1/18/05, p.9. • enotes.com- http://www.enotes.com/biz-encyclopedia/human-resource-
management-hrm
• Erik Brynjolfsson and Brian Kahin (edited by) 'Understanding the Digital Economy: Data Tools, and Research', Cambridge, MA: MIT Press, 2000.
• Ernst Biesalski, Knowledge Management And E-Human Resource Management, [1991]-Http//www.Wikipedia.Org-Human Resource Management Systems//
• Farooq Ayesha and Khan Nazia , “Human Resource Information System: An Analytical Study” Indian Journal of Training and Development, 35(4), Oct-Dec, 2005, Pp 62-78.
• Forster, Steve, 'Getting greater return from e-HR investment', IRS Employment Review, 11/26/2004 Issue 812, p2.
• Freeman Chris and Louca Francisco, 'As Time Goes By: From the Industrial Revolutions to the Information Revolution', New York: Oxford University Press, 2001.
• Ghosh Biswanath, “Human Resource Management” Published By Vikas Publishing, 2002.
• Gowan Mary, ‘eHRM: An Internet Guide to Human Resource Management, Prentice Hall India, 2001.
• Greenlaw, Paul S., and John P. Kohl. Personnel Management: Managing Human Resources. New York: Harper & Row, 1986.
• Gueutal Hal (Editor), Stone Dianna L. (Editor), Salas Eduardo (Foreword by), ‘The Brave New World of e-HR: Human Resources in the Digital Age’, Pfeiffer, 2005.
• Gupta A.K, Management Information Systems Published By Sultan Chand and Sons.
• Gupta and Chhabra, “Human Resource Information Systems”, Himalaya Publishing House, 2004.
• Hawking Paul, Stein Andrew, Foster Susan, "e-HR and Employee Self Service: A Case Study", 2004.
• Hempel P.S., Preparing the HR Profession for Technology and Information Work, Human Resource Management Review, Vol. 43, No. 2/3, Pg 163-167,[2004].
• Hempel, Paul S, 'Preparing the HR Profession for Technology and Information Work, Human Resource Management, Summer / Fall2004, Vol. 43 Issue 2/3, p163-177.
• Hill, Charles W. L.; Rothaermel, Frank T. 'The Performance Of Incumbent Firms In The Face of Radical Technological Innovation', Academy of Management Review, Apr2003, Vol. 28 Issue 2, p257-274, 18p.
• Hogg C.” Internet and E-mail Use and Abuse”, London: Chartered Institute of Personnel and Development, 2000.

260
• HR Focus, Anonymous, 'Forging New Employee Relationships Via e-HR', Dec2000, Vol. 77 Issue 12, p13.
• HR Focus, Anonymous, 'Here's a Compelling Reason to Move to Electronic Payroll Checks', Mar2007, Vol. 84 Issue 3, p9.
• HR Focus, Anonymous, 'Make Online Systems Offer More Than 'Just' Benefits to Employees', Oct 2007, Vol. 84 Issue 10, p11.
• HR Focus, Anonymous, 'Recruiting Success with Technology & Updated Processes', Aug 2007, Vol. 84 Issue 8, p5-6.
• HR Focus, Anonymous, 'Technology Is Challenging Everyone but Holds Great Promise for HR Professionals', Sep 2007, Vol. 84 Issue 9, p8-9.
• HR Focus, Anonymous, 'Technology: One Answer to Workforce Management Challenges', Jan2007, Vol. 84 Issue 1, p8.
• HR Focus, Anonymous, 'Three New Surveys Track the Growth of e-HR', Apr2002, Vol. 79 Issue 4, p4.
• HR Focus, Anonymous, Using Social Networking Sites for Recruitment: Pros & Cons, Apr2007, Vol. 84 Issue 4, p8-9.
• HR Focus, Anonymous, 'Internet Continues to Draw Job Seekers, Advertised Positions', Jan2008, Vol. 85 Issue 1, p9.
• hrmantra.com- http://www.hrmantra.com/ (15.12.06) • hrmguide.co.uk-
www.hrmguide.co.uk/recruitment/introduction_to_online_recruitment.htm. (18.05.06)
• Huselid, Mark A, 'Editor's Note: Special Issue on e-HR: The Intersection of Technology and Human Resource Management, Human Resource Management, Summer / Fall2004, Vol. 43 Issue 2/3, p119.
• ilr.cornell.edu- www.ilr.cornell.edu/CAHRS. (18.05.06) • incomesdata.co.uk- http://www.incomesdata.co.uk/studies/e-HRstudies.htm
(27.06.06) • IRS Employment Review, Anonymous, Cutting administration, 3/5/2004 Issue 795,
p4. • IRS Employment Review, Anonymous, 'E-HR: evolution or revolution?' 11/25/2002
Issue 764, p8. • IRS Employment Review, Anonymous, 'E-HR: personnel tomorrow', Feb2001 Issue
721, p6. • IRS Employment Review, Anonymous, 'Still waiting for the e-HR revolution',
11/11/2002 Issue 763, p5.
• Jawadekar W.S. “Management Information Systems”, Tata McGraw Hill Publishing Company Limited, 2005.
• Jessup and Valacich, “Information Systems Today”, Prentice Hall India, 2004. • Jossi, Frank, 'Taking the e-HR Plunge', HR Magazine, Sep2001, Vol. 46 Issue 9, p96,
6p.
• Kearney, Vance, 'Don't Leave the HR out of E-HR', People Management, 02/07/2002, Vol. 8 Issue 3, p25.
• Keebler, Thomas J.; Rhodes, David W, 'E-HR: Becoming the 'Path of Least Resistance, 'Employment Relations Today, Summer2002, Vol. 29 Issue 2, p57-66, 10p.
• Kelkar S.A. “Management Information Systems - A Concise Study”, Prentice Hall India, 2003.
• Kettley, P. and Reilly, P. e-HR: An Introduction, IES Report 398; 2003. • Khirallah, D. (2000). Picture this: self-service HR at Sony-
http://www.informationweek.com/811/sony.htm
• Laudon & Laudon, “Management Information Systems”, Prentice Hall India, 2004.
• Lawler III, E.E. (2005), From Human Resource Management to organizational effectiveness, Human Resource Management, Vol. 44, No. 2, P. 165-169.

261
• Lengnick-Hall, Mark L.; Moritz, Steve, 'The Impact of e-HR on the Human Resource Management Function', Journal of Labour Research, Summer2003, Vol. 24 Issue 3, p365-379.
• Leonard, Bill, 'Survey Shows e-HR Is Catching On', HR Magazine, Oct2001, Vol. 46 Issue 10, p31.
• Lepak D and S.A.Snell Virtual HR: Strategic Human Resource Management In The 21
st Century, Human Resource Management Review, Vol. 8, No. 3, Pg 215-234,
[1998].
• Linda Jovita A, ‘A Study on Electronic Human Resource Management (e-HRM) with reference to Cognizant Technology Solutions Private Ltd.’, 2008.
• Lorrie Faith Cranorand Shane Greenstein (edited by), 'Communications Policy and Information Technology: Promises, Problems and Prospects', Cambridge, MA: MIT Press, 2002.
• Lucas Henry C. Jr. 'Strategies for Electronic Commerce and the Internet', Cambridge, MA: MIT Press, 2002.
• Maatman Marco, ‘Measuring the effectiveness of e-HRM - The development of an analytical framework for the measurement of e-HRM and its application within a Dutch Ministry’, December 2006.
• Mello Jeffery A. “Strategic Human Resource Management”, South Western College Publishing, 2002.
• Murthy C.S.V. “Management Information Systems”, Himalaya Publishing House, 2004.
• Noe, Hollenbeck, Gerhart and Wright (2000), Human resources management: Gaining competitive advantage, 3rd ed, McGraw-Hill Higher Education, USA.
• Norton Peter, “Introduction to Computers”, Tata McGraw Hill, 1998.
• O’Brien James A. “Managing Information Technology in the Business Enterprise”, Tata McGraw-Hill Pub. Co. Ltd., 2004.
• onrec.com- http://www.onrec.com/content2/news.asp?ID=1104 ( 25.01.07)
• Panayotopoulou, Leda; Vakola, Maria; Galanaki, Eleanna, 'E-HR adoption and the role of HRM', Personnel Review, 2007, Vol. 36 Issue 1/2, p277-294.
• Pattanayak Biswajeet, Human Resources Management, Published By Prentice – Hall of India Private Limited [2005].
• People Management, Anonymous, 'E-HR can alienate managers', 2/23/2006, Vol. 12 Issue 4, p16.
• Poole M. and Warner M. (Edited by): ‘The IEBM Handbook of Human Resource Management, International Encyclopedia of Business and Management, 2001.
• Prasad L. M, Human Resource Management, Published By Sultan Chand and Sons, [2003].
• Ramasubramanian P. & Dr. Periasamy D., “ERP System in Educational Institution-A Survey”, Indian Journal of Training and Development, 36(1), Jan-March, 2006, Pp 106-107.
• Rao K. Raghavendra, ‘Automating Employee Interactions,’ Indian Management, June 2003.Pp. 195-199.
• Reddington Martin, Williamson Mark and Withers Mark, Transforming HR: Creating Value Through People, Elsevier, Oxford [2005].
• Ruel H, T.Bondarouk and J.K.Looise, E-HRM: Innovation Or Irritation: An Explorative Empirical Study In Five Large Companies On Web-Based HRM, Management Review,Vol 15, No.3, Pg 364-380, [2004].
• Sacht Jeff , E-HR Strategy: An Electronic Human Resource Strategy Is Attainable by Small and Medium Sized Business, [2007]; http://www.workinfo.com/Free/Downloads/58.htm.
• Sadagopalan S. “Management Information Systems”, Prentice Hall India, 2004. • Santora, Joseph C. 'Crossing the Digital Divide: Do All Global Citizens Have Their
Passports?’ Academy of Management Perspectives, November 2006, Vol. 20 Issue 4, p118-119, 2p.

262
• Scarpello, Vida G., James Ledvinka, and Thomas J. Bergmann. Human Resource Management. Cincinnati: South-Western, 1995.
• Schilling, Melissa A. 'Technological Lockout: An Integrative Model of the Economic and Strategic Factors Driving Technology Success and Failure', Academy of Management Review, April 98, Vol. 23 Issue 2, p267-284, 18p.
• Scott Rob , HR Technology needs to be thought of as Strategic; http://robertscott.wordpress.com/2008/10/09/hr-technology-needs-to-be-thought-of-as-strategic/
• shrm.org - www.shrm.org (16.01.06)
• Snell A.S., Pedigo P.R. And G.M.Krawiec, Hand Book Of Human Resource Management, Published By Blackwell Publishers, [1996]
• Towers Perrin 2009 Research Report on - Evolving Priorities and the Future of HR Service Delivery.
• Towers Perrin Research Study 2009 on - Progress and Performance: The Continuing Evolution of HR Outsourcing Effectiveness.
• Wagner, M. (2002). Saving trees and serving up benefits. Internet Retailer. http://www.internetretailer.com/dailynews.asp?id=6688
• Walker Alfred J, Web-Based Human Resources: The Technologies and Trends That Are Transforming HR, Published By Tata Mcgraw Hill [2001].
• Wallace Patricia, "The Internet in the Workplace: How New Technology Is Transforming Work”, Cambridge University Press, 2004.
• Waltke, Leslie, 'How One Company Has Embraced E-HR', HR Focus, Jan2002, Vol. 79 Issue 1, p1.
• Watkins, Jon; Higginbottom, Karen, 'E-HR can improve staff retention', People Management, 7/11/2002, Vol. 8 Issue 14, p10.
• watsonwyatt.com- http://www.watsonwyatt.com/research/resrender.asp?id=W-524&page=5, E-HR: Getting results along the Journey-2002 Survey Report; retrieved 12 April 2006.
• Wayne F. Cascis, “Managing Human Resources Productivity, Quality of work life, profits”, Tata McGraw Hill Publishing Co. Ltd., 2003.
• wipro.co.in- www.wipro.co.in/itservices/enterprisesolutions/casestudies glaxosmithklineconsumerhealthcare.htm (15.04.06)
• Wright, P. M. & Dyer, L. (2000). People in the E-Business: New challenges, new solutions (CAHRS Working Paper #00-11). Ithaca, NY: Cornell University, School of Industrial and Labor Relations, Center for Advanced Human Resource Studies.

263
QUESTIONNAIRE

264
QuestionnaireQuestionnaireQuestionnaireQuestionnaire
A Survey on the Implications of Implementing
Electronic-Human Resource Management (E-HRM)
Systems in Companies
1. The following is a list of possible drivers for introducing e-technology to the HR
systems in your company. Please rank them from 1 to 10 in order of importance.
(1: most important; 10: least important)
Driver Rank
a. Increase Integration within the HR function
b. Encourage open communication and sharing of Information
c. Standardize Systems and Procedures
d. Enable HR cost saving and control
e. Reduce time spent on routine administrative tasks by HR staff
f. Better management of data and information
g. Reduce paper transactions
h. Refocus HR staff on strategic activities
i. Increase overall productivity
j. Improve HR transactions accuracy/speed/Integrity

265
2. W.r.t. the following list of Human Resource Functions please tick against the ones
for which e-technology is being used in your company?
HR Functions √√√√
a. Recruitment and Selection
b. Payroll Management
c. Leave Management
d. Attendance Management
e. Manpower Planning
f. Communication
g. Training and Development
h. Performance Management
i. Induction
j. Selecting Benefits
k. Compensation Planning
l. Competency Mapping
m. Career Planning
n. Succession Planning
o. Employee Transition
p. Travel Management
q. Exit Management
r. Maintaining Employee Records
Others (Please specify)

266
3. Which HR Service delivery tools are used for delivering HR related services to
employees and managers in your company?
√√√√
a. Employee Self Service (ESS)
b. Management Self Service (MSS)
c. Web 2.0 technology (Blogs/Forums/Social Networking)
d. Intranet
e. e-Learning Portal
Others (Please Specify)
4. Describe the nature of Sourcing solution/s your company has adopted for enabling
e-technology to HR systems?
(In-house/Outsourced/Software-as-a-service/Any other)
5. Where do you perceive your company today on the e-HRM journey?
(Mark with a √√√√ )
Niether understand nor value e-HRM
1
2
3
4
5
Complete incorporation of e-HRM strategy into the business model
6. Where do you think your company will be in the e-HRM journey after 5 years?
(Mark with a √√√√ )
Niether understand nor value e-HRM
1
2
3
4
5
Complete incorporation of e-HRM strategy into the business model

267
7. What do you think are the barriers to progress in the e-HRM journey? Please rank
them from 1 to 10 in the order of importance.
(1: most important; 10: least important)
Barriers Rank
a. Inadequate Financial Resources
b. Resistance to change
c. Lack of top management support
d. Inadequate Training
e. Poor technical infrastructure
f. Issues w.r.t. Security of data
g. Insufficient tangible benefits
h. Lack of innovation
i. Inability to overcome bureaucratic hurdles
j. Difficulty in converting standardized packages into customized and user friendly modules
8. Please elaborate on the biggest barrier to progress in the e-HRM journey marked as
No.1 in Question No. 7 by you.
9. What measures were taken by the organization to ensure a smooth transition to
e-HRM based systems?

268
10. What are the issues and challenges in the implementation and maintenance of e-
HRM systems?
11. How can the effectiveness of e-HRM systems be enhanced?
12. According to you will e-HRM be successful in satisfying employees in their HR
needs? (Mark with a √√√√ )
YES: ________
NO: ________
Can’t Say: ________
13. According to you will the benefits from e-HRM justify the expenditure incurred on
the same? (Mark with a √√√√ )
YES: ________
NO: ________
Can’t Say ________
14. Any other information w.r.t. e-HRM that you would like to share?

269
15. Please indicate with a tick mark (√√√√) the extent to which you agree or disagree with the following statements:
1. Strongly disagree; 2. Disagree; 3. Undecided; 4. Agree; 5. Strongly agree
S.N. STATEMENTS 1 2 3 4 5
1
The e-recruitment process operates with the need to match employee profile
with positions vacant in the organisation.
2
The e-HRM technology has helped in reducing the time and effort in preparing
the job-description and job-specification.
3
The candidate application maintained and recorded online has made the
applicant tracking system easily accessible.
4 The e-HRM technology has ensured an effective salary administration system.
5 The pay structure has been clearly defined in the e-HRM.
6
The pay cheques reach on time to the employees since implementation of e-
HRM technology.
7
The recording of employee absence, vacation, sickness etc via e-HRM
technology reflects in the pay roll system.
8
The e-HRM process has enabled employees to enrol for flexible benefit
administration effectively.
9
The compensation frame work implemented by the e- HRM allows managers to
calculate incentives and rewards for the employees online.
10
The assessment of employee performance online helps to calculate
performance related pay effectively.
11 The e-HRM process has been effective in providing clear role definitions.
12
The e-HRM process has enabled to identify and nurture individual talents and
help to raise their performance.

270
S.N. STATEMENTS 1 2 3 4 5
13 The self service e-learning opportunities have supported employees to keep their knowledge and skills up-to-date.
14 The e-learning strategies have brought about effective change in leadership development.
15 E-HRM has provided sufficient opportunities for employees' career planning and development.
16 Training through e- HRM helps in recommending candidates for promotion and individual compensation awards.
17 The employees have been provided with necessary resources and sufficient training to be able to use e- HRM technology.
18 The intranet delivered communication system has provided opportunity for employees to participate in communication and consultation activities.
19 The e-HRM system is geared to understanding and following grievance, disciplinary and poor performance issues in a timely and compliant manner.
20 The e-HRM has increased employee commitment with the organisation by boosting their motivation and confidence levels.
21 The e-HRM process ensures compliance with policy and procedures.
22 Working with e-HRM is clear and understandable.
23 Policies formulated under e-HRM technology are easy to comprehend, credible and are user friendly.
24 Since the implementation of e-HRM technology the HR department is increasingly involved in strategic HR activities.
25 E-HRM technology is compatible with other systems in use.
26 The e-HRM system is user friendly.
27 The e-HRM system provides timely information.
28 The e-HRM system provides up-to-date information.
29 The e-HRM system has ensured a clear fit between business and HR strategy.
30 E-HRM has been an effective change agent for positively moulding the employees' attitudes towards the use of technology.
271
Other Information
Designation
Educational Qualification
Total No. of years of service
No. of years of service with the current
company
Name of Company
Industry/Product
Total Turnover
Total No. of employees
Nature of Company:
SME/MNC/Other-Specify

272
AAAANNEXURESNNEXURESNNEXURESNNEXURES

273
ANNEXURE IANNEXURE IANNEXURE IANNEXURE I
Sample Size: based on assumption of infinite populationSample Size: based on assumption of infinite populationSample Size: based on assumption of infinite populationSample Size: based on assumption of infinite population
Since the total population (N) i.e. the number of companies in
Maharashtra was not known the following formula was used to calculate
the sample size:
Assuming the percentage of companies using e-HRM to be 30% (based
on estimates by Industry sources) the sample size n required to
estimate this percentage is:-
n = z2 PQ assuming N ∞
d2
where Z = 1.96 for 95% confidence
P = % of users of e-HRM
Q = (100-P)
d = 10% of P = 3.0
(10% error)
Calculating sample size n,
n = (1.96)2(30*70) = 896
(3)2
Hence, sample size, assuming N ∞
n = 896 i.e. approximately 1000

274
ANNEXURE IIANNEXURE IIANNEXURE IIANNEXURE II
TableTableTableTable 9.1a 9.1a 9.1a 9.1a
Percentage of RespondentsPercentage of RespondentsPercentage of RespondentsPercentage of Respondents---- Citywise Citywise Citywise Citywise
Citywise Percent Cumulative
Percent
Ahemadnagar 0.20 0.20
Aurangabad 2.50 2.70
Jalgaon 0.30 3.00
Jalna 0.10 3.10
Kolhapur 0.60 3.70
Mumbai 67.20 70.90
Nagpur 1.70 72.60
Nasik 1.70 74.30
Navi Mumbai 0.50 74.80
Pune 24.10 98.90
Raigad 0.10 99.00
Sangli 0.10 99.10
Satara 0.20 99.30
Solapur 0.30 99.60
Thane 0.40 100.00
TOTAL 100.00 100.00
TableTableTableTable 9.1b 9.1b 9.1b 9.1b
% of Respondents by Type of Sector % of Respondents by Type of Sector % of Respondents by Type of Sector % of Respondents by Type of Sector
(Services/Manufacturing)(Services/Manufacturing)(Services/Manufacturing)(Services/Manufacturing)
Frequency Percent Services
344 34.40 Manufacturing 656 65.60
TOTAL 1000 100.00
TableTableTableTable 9.1c 9.1c 9.1c 9.1c
% of Respondents by Type of Company % of Respondents by Type of Company % of Respondents by Type of Company % of Respondents by Type of Company
(MNC/Non(MNC/Non(MNC/Non(MNC/Non----MNC)MNC)MNC)MNC)
Frequency Percent MNC 170 17.00
Non-MNC 830 83.00
TOTAL 1000 100.00

275
TableTableTableTable 9.1d 9.1d 9.1d 9.1d
% of Respondents (MNC/Non% of Respondents (MNC/Non% of Respondents (MNC/Non% of Respondents (MNC/Non----MNC)*(Services/Manufacturing) MNC)*(Services/Manufacturing) MNC)*(Services/Manufacturing) MNC)*(Services/Manufacturing)
Type of Sector Total Type of Company Services Manufacturing
Count 110 60 170
MNC % within Type of Sector 31.98% 9.15% 17.00%
Count 234 596 830
Non-MNC % within Type of Sector 68.02% 90.85% 83.00%
Count 344 656 1000
Total % within Type of Sector 100.00% 100.00% 100.00%
TableTableTableTable 9.1e 9.1e 9.1e 9.1e
% of Respondents by Size of Company % of Respondents by Size of Company % of Respondents by Size of Company % of Respondents by Size of Company
(Annual Turn(Annual Turn(Annual Turn(Annual Turn----over)over)over)over)
Annual Turnover (Rs. Cr.) Frequency Percent
<= 10 Crores 92 9.20
10-100 Crores 367 36.70
100-250 Crores 187 18.70
250-500 Crores 105 10.50
500- 1000 Crores 109 10.90
1000-2500 Crores 77 7.70
2500-5000 Crores 34 3.40
> 5000 Crores 29 2.90
Total 1000 100.00
TableTableTableTable 9.1f 9.1f 9.1f 9.1f
% of Respondent% of Respondent% of Respondent% of Respondents by Size of Company s by Size of Company s by Size of Company s by Size of Company
(No. of Employees)(No. of Employees)(No. of Employees)(No. of Employees)
No. of Employees Frequency Percent
101-250 172 17.20
251-500 166 16.60
501-1000 340 34.00
1001-2500 172 17.20
2501-5000 68 6.80
> 5000 82 8.20
Total 1000 100.00

276
TableTableTableTable 9.1g 9.1g 9.1g 9.1g
City * Type of SectoCity * Type of SectoCity * Type of SectoCity * Type of Sector (Services/Manufacturing)r (Services/Manufacturing)r (Services/Manufacturing)r (Services/Manufacturing)
Type of Sector
CITY Services Manufacturing Total
Count 0 2 2 Ahemadnagar
% within Type of Sector 0.00% 0.30% 0.20%
Count 5 20 25 Aurangabad
% within Type of Sector 1.50% 3.10% 2.50%
Count 0 3 3 Jalgaon
% within Type of Sector 0.00% 0.50% 0.30%
Count 0 1 1 Jalna
% within Type of Sector 0.00% 0.20% 0.10%
Count 0 6 6 Kolhapur
% within Type of Sector 0.00% 0.90% 0.60%
Count 229 443 672 Mumbai
% within Type of Sector 66.60% 67.60% 67.20%
Count 6 11 17 Nagpur
% within Type of Sector 1.70% 1.70% 1.70%
Count 1 16 17 Nasik
% within Type of Sector 0.30% 2.40% 1.70%
Count 3 2 5 Navi Mumbai
% within Type of Sector 0.90% 0.30% 0.50%
Count 98 143 241 Pune
% within Type of Sector 28.50% 21.80% 24.10%
Count 0 1 1 Raigad
% within Type of Sector 0.00% 0.20% 0.10%
Count 1 0 1 Sangli
% within Type of Sector 0.30% 0.00% 0.10%
Count 0 2 2 Satara
% within Type of Sector 0.00% 0.30% 0.20%
Count 0 3 3 Solapur
% within Type of Sector 0.00% 0.50% 0.30%
Count 1 3 4 Thane
% within Type of Sector 0.30% 0.50% 0.40%
Count 344 656 1000 TOTAL
% within Type of Sector 100.00% 100.00% 100.00%

277
TableTableTableTable 9.1h 9.1h 9.1h 9.1h
Size of Company (Annual TurnSize of Company (Annual TurnSize of Company (Annual TurnSize of Company (Annual Turn----over) * Type of Sector over) * Type of Sector over) * Type of Sector over) * Type of Sector
(Services/Manufacturing) (Services/Manufacturing) (Services/Manufacturing) (Services/Manufacturing)
Type of Sector Annual Turn-over
(Rs. Cr.) Services Manufacturing Total
Count 81 11 92 <= 10 Crores
% within Type of Sector 23.50% 1.70% 9.20%
Count 170 197 367 10-100 Crores
% within Type of Sector 49.40% 30.10% 36.70%
Count 39 148 187 100-250 Crores
% within Type of Sector 11.30% 22.60% 18.70%
Count 14 91 105 250-500 Crores
% within Type of Sector 4.10% 13.90% 10.50%
Count 20 89 109 500- 1000 Crores
% within Type of Sector 5.80% 13.60% 10.90%
Count 12 65 77 1000-2500 Crores
% within Type of Sector 3.50% 9.90% 7.70%
Count 5 29 34 2500-5000 Crores
% within Type of Sector 1.50% 4.40% 3.40%
Count 3 26 29 > 5000 Crores
% within Type of Sector 0.90% 4.00% 2.90%
Count 344 656 1000 Total
% within Type of Sector 100.00% 100.00% 100.00%
TabTabTabTablelelele 9.1i 9.1i 9.1i 9.1i
Size of Company (No. of Employees) * Type of Sector Size of Company (No. of Employees) * Type of Sector Size of Company (No. of Employees) * Type of Sector Size of Company (No. of Employees) * Type of Sector
(Services/Manufacturing) (Services/Manufacturing) (Services/Manufacturing) (Services/Manufacturing)
Type of Sector
No. of Employees Services Manufacturing Total
Count 151 21 172
101-250 % within Type of Sector
43.90% 3.20% 17.20%
Count 70 96 166
251-500
% within Type of Sector 20.30% 14.70% 16.60%
Count 60 280 340
501-1000
% within Type of Sector 17.40% 42.70% 34.00% Count
32 140 172 1001-2500
% within Type of Sector 9.30% 21.40% 17.20% Count
19 49 68 2501-5000
% within Type of Sector 5.50% 7.50% 6.80%
Count 12 70 82
> 5000
% within Type of Sector 3.50% 10.50% 8.20%
Count 344 656 1000
Total
% within Type of Sector 100.00% 100.00% 100.00%

278
TableTableTableTable 9.1j 9.1j 9.1j 9.1j
City * Type of Sector (Services/Manufacturing) City * Type of Sector (Services/Manufacturing) City * Type of Sector (Services/Manufacturing) City * Type of Sector (Services/Manufacturing)
Type of Sector
City Services Manufacturing Total
Count 0 2 2 Ahemadnagar
% within City 0.00% 100.00% 100.00%
Count 5 20 25 Aurangabad
% within City 20.00% 80.00% 100.00%
Count 0 3 3 Jalgaon
% within City 0.00% 100.00% 100.00%
Count 0 1 1 Jalna
% within City 0.00% 100.00% 100.00%
Count 0 6 6 Kolhapur
% within City 0.00% 100.00% 100.00%
Count 229 443 672 Mumbai
% within City 34.10% 65.90% 100.00%
Count 6 11 17 Nagpur
% within City 35.30% 64.70% 100.00%
Count 1 16 16 Nasik
% within City 5.90% 94.10% 100.00%
Count 3 2 5 Navi Mumbai
% within City 60.00% 40.00% 100.00%
Count 98 143 241 Pune
% within City 40.70% 59.30% 100.00%
Count 0 1 1 Raigad
% within City 0.00% 100.00% 100.00%
Count 1 0 1 Sangli
% within City 100.00% 0.00% 100.00%
Count 0 2 2 Satara
% within City 0.00% 100.00% 100.00%
Count 0 3 3 Solapur
% within City 0.00% 100.00% 100.00%
Count 1 3 4 Thane
% within City 25.00% 75.00% 100.00%
Count 344 656 1000
Total % within City 34.40% 65.60% 100.00%

279
TableTableTableTable 9.1k 9.1k 9.1k 9.1k
City * Type of Company (MNC/NonCity * Type of Company (MNC/NonCity * Type of Company (MNC/NonCity * Type of Company (MNC/Non----MNC) MNC) MNC) MNC)
Type of Company
City MNC Non-MNC Total
Count 0 2 2 Ahemadnagar
% within City 0.00% 100.00% 100.00%
Count 2 23 25 Aurangabad
% within City 8.00% 92.00% 100.00%
Count 0 3 3 Jalgaon
% within City 0.00% 100.00% 100.00%
Count 0 1 1 Jalna
% within City 0.00% 100.00% 100.00%
Count 0 6 6 Kolhapur
% within City 0.00% 100.00% 100.00%
Count 110 562 672 Mumbai
% within City 16.40% 83.60% 100.00%
Count 1 16 17 Nagpur
% within City 5.90% 94.10% 100.00%
Count 2 15 16 Nasik
% within City 6.30% 93.80% 100.00%
Count 1 4 5 Navi Mumbai
% within City 20.00% 80.00% 100.00%
Count 53 188 241 Pune
% within City 22.00% 78.00% 100.00%
Count 0 1 1 Raigad
% within City 0.00% 100.00% 100.00%
Count 0 1 1 Sangli
% within City 0.00% 100.00% 100.00%
Count 0 2 2 Satara
% within City 0.00% 100.00% 100.00%
Count 0 3 3 Solapur
% within City 0.00% 100.00% 100.00%
Count 1 3 4 Thane
% within City 25.00% 75.00% 100.00%
Count 170 830 1000
Total % within City 17.00% 83.00% 100.00%

280
TableTableTableTable 9.2a 9.2a 9.2a 9.2a
Drivers for introducing eDrivers for introducing eDrivers for introducing eDrivers for introducing e----HRM Systems in companies : Mean Ranks by HRM Systems in companies : Mean Ranks by HRM Systems in companies : Mean Ranks by HRM Systems in companies : Mean Ranks by
Type of Sector ( Services/ Manufacturing)Type of Sector ( Services/ Manufacturing)Type of Sector ( Services/ Manufacturing)Type of Sector ( Services/ Manufacturing) Type of Sector
Services Manufacturing Total CONSIDERED DRIVERS
Mean Std. Dev. Mean
Std. Dev. Mean
Std. Dev.
a. Increase Integration within the HR function 7.36 2.02 8.54 1.64 8.14 1.86
b. Encourage open communication and sharing of Information 5.42 2.87 7.29 1.82 6.65 2.40
c. Standardize Systems and Procedures 8.15 1.80 3.08 2.26 4.82 3.20
d. Enable HR cost saving and control 1.54 0.92 1.47 0.84 1.50 0.87
e. Reduce time spent on routine administrative tasks by HR staff 4.37 2.11 3.97 1.61 4.11 1.81
f. Better management of data and information 7.04 1.72 6.78 2.36 6.87 2.17
g. Reduce paper transactions 5.27 2.73 3.13 1.05 3.87 2.08
h. Refocus HR staff on strategic activities 7.13 1.85 7.22 1.58 7.19 1.68
i. Increase overall productivity 5.88 2.45 6.70 2.08 6.42 2.25
j. Improve HR transactions accuracy/speed/Integrity 2.79 1.45 6.81 2.11 5.43 2.68
TableTableTableTable 9.2b 9.2b 9.2b 9.2b
Drivers for introducing Drivers for introducing Drivers for introducing Drivers for introducing eeee----HRM Systems in companiesHRM Systems in companiesHRM Systems in companiesHRM Systems in companies: Mean Rank Order by : Mean Rank Order by : Mean Rank Order by : Mean Rank Order by
Type of Sector (Services/ Manufacturing)Type of Sector (Services/ Manufacturing)Type of Sector (Services/ Manufacturing)Type of Sector (Services/ Manufacturing)
MEAN RANK ORDER
CONSIDERED DRIVERS Services Manufacturing TOTAL
a Increase Integration within the HR function 9 10 10
b Encourage open communication and sharing of Information 5 9 7
c Standardize Systems and Procedures 10 2 4
d Enable HR cost saving and control 1 1 1
e Reduce time spent on routine administrative tasks by HR staff 3 4 3
f Better management of data and information 7 6 8
g Reduce paper transactions 4 3 2
h Refocus HR staff on strategic activities 8 8 9
i Increase overall productivities 6 5 6
j Improve HR transactions accuracy/speed/Integrity 2 7 5
1: Most Important; 10: Least Important

281
TableTableTableTable 9.3a 9.3a 9.3a 9.3a
Drivers for introducing eDrivers for introducing eDrivers for introducing eDrivers for introducing e----HRM Systems iHRM Systems iHRM Systems iHRM Systems in companies: Mean Ranks by n companies: Mean Ranks by n companies: Mean Ranks by n companies: Mean Ranks by
Type of Company (MNC/ NonType of Company (MNC/ NonType of Company (MNC/ NonType of Company (MNC/ Non----MNC)MNC)MNC)MNC)
Type of Company MNC Non-MNC Total
CONSIDERED DRIVERS
Mean Std. Dev. Mean
Std. Dev. Mean
Std. Dev.
a. Increase Integration within the HR function 7.37 1.88 8.29 1.82 8.14 1.86
b. Encourage open communication and sharing of Information 3.93 2.58 7.19 1.95 6.65 2.40
c. Standardize Systems and Procedures 7.57 2.05 4.26 3.10 4.82 3.20
d. Enable HR cost saving and control 1.49 0.83 1.50 0.88 1.50 0.87
e. Reduce time spent on routine administrative tasks by HR staff 6.77 2.04 3.57 1.17 4.11 1.81
f. Better management of data and information 7.22 1.53 6.80 2.27 6.87 2.17
g. Reduce paper transactions 6.60 3.29 3.32 1.09 3.87 2.08
h. Refocus HR staff on strategic activities 7.09 2.27 7.21 1.53 7.19 1.68
i. Increase overall productivity 3.37 1.09 7.03 1.90 6.42 2.25
j. Improve HR transactions accuracy/speed/Integrity 3.63 1.13 5.79 2.76 5.43 2.68
TableTableTableTable 9.3b 9.3b 9.3b 9.3b
Drivers for introducing eDrivers for introducing eDrivers for introducing eDrivers for introducing e----HRM Systems in companiesHRM Systems in companiesHRM Systems in companiesHRM Systems in companies: Mean Rank Order by : Mean Rank Order by : Mean Rank Order by : Mean Rank Order by
type of Comtype of Comtype of Comtype of Company (MNC/ Nonpany (MNC/ Nonpany (MNC/ Nonpany (MNC/ Non----MNC)MNC)MNC)MNC)
MEAN RANK
DRIVERS MNC Non-MNC TOTAL
a Increase Integration within the HR function 9 10 10
b Encourage open communication and sharing of Information 4 8 7
c Standardize Systems and Procedures 10 4 4
d Enable HR cost saving and control 1 1 1
e Reduce time spent on routine administrative tasks by HR staff 6 3 3
f Better management of data and information 8 6 8
g Reduce paper transactions 5 2 2
h Refocus HR staff on strategic activities 7 9 9
i Increase overall productivity 2 7 6
j Improve HR transactions accuracy/speed/Integrity 3 5 5 1: Most Important; 10: Least Important

282
TableTableTableTable 9.4a 9.4a 9.4a 9.4a
DriversDriversDriversDrivers for introducing e for introducing e for introducing e for introducing e----HRM systems in companiesHRM systems in companiesHRM systems in companiesHRM systems in companies: ANOVA (One: ANOVA (One: ANOVA (One: ANOVA (One----way) way) way) way) ––––
DescriptiveDescriptiveDescriptiveDescriptive StatisticsStatisticsStatisticsStatistics
Driver Groups Mean Std. Deviation Std. Error
Services Non-MNC 7.29 2.080 .136
Services MNC 7.53 1.877 .181
Manufacturing Non-MNC 8.68 1.539 .063
Manufacturing MNC 7.08 1.896 .247
a. Increase Integration
within the HR function
Total
8.14 1.863 .059
Services Non-MNC 6.84 2.227 .146
Services MNC 2.33 1.200 .115
Manufacturing Non-MNC 7.33 1.820 .075
Manufacturing MNC 6.85 1.770 .230
b. Encourage open
communication and
sharing of Information
Total 6.65 2.405 .076
Services Non-MNC 8.72 1.452 .095
Services MNC 6.92 1.885 .181
Manufacturing Non-MNC 2.52 1.325 .054
Manufacturing MNC 8.78 1.811 .236
c. Standardize Systems
and Procedures
Total
4.82 3.205 .101
Services Non-MNC 1.56 .944 .062
Services MNC 1.52 .859 .083
Manufacturing Non-MNC 1.48 .851 .035
Manufacturing MNC 1.42 .770 .100
d. Enable HR cost
saving and control
Total
1.50 .870 .028
Services Non-MNC 3.28 1.095 .072
Services MNC 6.71 1.870 .180
Manufacturing Non-MNC 3.69 1.184 .049
Manufacturing MNC 6.88 2.342 .305
e. Reduce time spent on
routine administrative
tasks by HR staff
Total 4.11 1.809 .057

283
Services Non-MNC 6.92 1.783 .117
Services MNC 7.30 1.554 .150
Manufacturing Non-MNC 6.75 2.432 .100
Manufacturing MNC 7.08 1.489 .194
f. Better management of
data and information
Total
6.87 2.167 .069
Services Non-MNC 3.63 1.226 .080
Services MNC 8.83 1.350 .130
Manufacturing Non-MNC 3.19 1.013 .042
Manufacturing MNC 2.51 1.223 .159
g. Reduce paper
transactions
Total
3.87 2.078 .066
Services Non-MNC 7.28 1.484 .097
Services MNC 6.81 2.444 .235
Manufacturing Non-MNC 7.19 1.549 .063
Manufacturing MNC 7.61 1.838 .239
h. Refocus HR staff on
strategic activities
Total
7.19 1.678 .053
Services Non-MNC 7.06 1.969 .129
Services MNC 3.32 1.031 .099
Manufacturing Non-MNC 7.02 1.869 .077
Manufacturing MNC 3.46 1.194 .155
i. Increase overall
productivity
Total
6.42 2.250 .071
Services Non-MNC 2.36 1.212 .079
Services MNC 3.72 1.183 .114
Manufacturing Non-MNC 7.14 1.890 .077
Manufacturing MNC 3.47 1.023 .133
j. Improve HR
transactions
accuracy/speed/Integrity
Total 5.43 2.681 .085

284
TableTableTableTable 9.4b 9.4b 9.4b 9.4b
Drivers for introducing eDrivers for introducing eDrivers for introducing eDrivers for introducing e----HRM systems in companies (ANOVA)HRM systems in companies (ANOVA)HRM systems in companies (ANOVA)HRM systems in companies (ANOVA)
Driver df F Sig.
Null
Hypothesis
Between Groups 3 a. Increase Integration within the
HR function
Within Groups 996
49.996
.000
Rejected
Between Groups 3
b. Encourage open
communication and sharing of
Information
Within Groups 996
219.798
.000
Rejected
Between Groups 3 c. Standardize Systems and
Procedures
Within Groups 996
1276.073
.000
Rejected
Between Groups 3 d. Enable HR cost saving and
control
Within Groups 996
.607
.610
Accepted
Between Groups 3
e. Reduce time spent on routine
administrative tasks by HR staff
Within Groups 996
266.180
.000
Rejected
Between Groups 3 f. Better management of data and
information
Within Groups 996
2.285
.077
Accepted
Between Groups 3 g. Reduce paper transactions
Within Groups 996
813.901
.000
Rejected
Between Groups 3 h. Refocus HR staff on strategic
activities
Within Groups 996
3.361
.018
Rejected
Between Groups 3 i. Increase overall productivity
Within Groups 996
194.124
.000
Rejected
Between Groups 3 j. Improve HR transactions
accuracy/speed/Integrity
Within Groups 996
554.060
.000
Rejected
The mean difference is significant at the .05 level

285
TableTableTableTable 9.5 9.5 9.5 9.5aaaa
Usage of eUsage of eUsage of eUsage of e----technology for Human Resource Functions by Type oftechnology for Human Resource Functions by Type oftechnology for Human Resource Functions by Type oftechnology for Human Resource Functions by Type of Sector Sector Sector Sector
(Services/Manufacturing)(Services/Manufacturing)(Services/Manufacturing)(Services/Manufacturing)
HR Function Type of Sector Percent Implementing the Function
Chi-square
Significance (P-value)
Null Hypothesis
Services 99.5 a. Recruitment and Selection Manufacturing 83.8 61.931 0.000
Rejected
Services 100.0 b. Payroll Management Manufacturing 100.0
0.000 1.000 Accepted
Services 100.0 c. Leave Management Manufacturing 100.0
0.000 1.000 Accepted
Services 100.0 d. Attendance Management Manufacturing 100.0
0.000 1.000 Accepted
Services 99.5 e. Manpower Planning Manufacturing 83.1 65.218 0.000
Rejected
Services 99.1 f. Communication
Manufacturing 82.4 67.875 0.000 Rejected
Services 100.0 g. Training and Development Manufacturing 82.3 68.543 0.000
Rejected
Services 98.0 h. Performance Management Manufacturing 82.3 68.543 0.000
Rejected
Services 60.2 i. Induction
Manufacturing 7.8 323.035 0.000 Rejected
Services 31.9 j. Selecting Benefits Manufacturing 7.5 96.742 0.000
Rejected
Services 98.2 k. Compensation Planning Manufacturing 8.0 800.063 0.000
Rejected
Services 32.0 l. Competency Mapping Manufacturing 7.8 96.742 0.000
Rejected
Services 31.9 m. Career Planning Manufacturing 7.5 96.742 0.000
Rejected
Services 7.0 n. Succession Planning Manufacturing 1.2 18.872 0.000
Rejected
Services 25.0 o. Employee Transition Manufacturing 17.8 5.904 0.009
Rejected
Services 100.0 p. Travel Management Manufacturing 24.6 511.257 0.000
Rejected
Services 7.8 q. Exit Management Manufacturing 1.2 18.872 0.000
Rejected
Services 100.0 r. Maintaining Employee Records
Manufacturing 83.7 62.586 0.000
Rejected

286
TableTableTableTable 9.6 9.6 9.6 9.6aaaa
Usage of eUsage of eUsage of eUsage of e----technology for Human Resource Functions by Type of Company technology for Human Resource Functions by Type of Company technology for Human Resource Functions by Type of Company technology for Human Resource Functions by Type of Company
(MNC/Non(MNC/Non(MNC/Non(MNC/Non----MNC)MNC)MNC)MNC)
HR Function
Type of Company
Percent Implementing the Function
Chi-square
Significance (P-value)
Null Hypothesis
MNC 100.0 a. Recruitment and Selection Non-MNC 87.8 12.316 0.000
Rejected
MNC 100.0 b. Payroll Management Non-MNC 100.0 0.000 1.000
Accepted
MNC 100.0 c. Leave Management Non-MNC 100.0 0.000 1.000
Accepted
MNC 100.0 d. Attendance Management Non-MNC 100.0 0.000 1.000
Accepted
MNC 100.0 e. Manpower Planning Non-MNC 87.5 9.770 0.001
Rejected
MNC 100.0 f. Communication
Non-MNC 87.0 10.600 0.000 Rejected
MNC 100.0 g. Training and Development Non-MNC 88.0 9.141 0.001
Rejected
MNC 100.0 h. Performance Management Non-MNC 87.0 9.141 0.001
Rejected
MNC 77.2 i. Induction
Non-MNC 15.4 277.739 0.000 Rejected
MNC 94.6 j. Selecting Benefits Non-MNC 0.2 918.989 0.000
Rejected
MNC 100.0 k. Compensation Planning Non-MNC 28.3 255.891 0.000
Rejected
MNC 94.6 l. Competency Mapping Non-MNC 0.3 918.989 0.000
Rejected
MNC 94.6 m. Career Planning Non-MNC 0.2 918.989 0.000
Rejected
MNC 31.7 n. Succession Planning Non-MNC 0.1 264.591 0.000
Rejected
MNC 38.3 o. Employee Transition Non-MNC 19.0 29.880 0.000
Rejected
MNC 100.0 p. Travel Management Non-MNC 41.6 156.486 0.000
Rejected
MNC 31.7 q. Exit Management Non-MNC 0.2 264.591 0.000
Rejected
MNC 100.0 r. Maintaining Employee Records Non-MNC 87.7 1.538 0.000
Rejected

287
TableTableTableTable 9.7 9.7 9.7 9.7
Usage of HR Service Delivery Tools by Type of Sector Usage of HR Service Delivery Tools by Type of Sector Usage of HR Service Delivery Tools by Type of Sector Usage of HR Service Delivery Tools by Type of Sector
(Services/Manufacturing) (Services/Manufacturing) (Services/Manufacturing) (Services/Manufacturing) HR Service Delivery
Tool Type of
Company Percent
using the Tool
Chi-square Significance P-value
Null Hypothesis
Services 98.50% a. Employee Self Service Manufacturing 60.30%
183.648 0.000 Rejected
Services 95.00% b. Management Self Service Manufacturing 29.90%
444.130 0.000 Rejected
Services 90.70% c. Web 2.0 Technology Manufacturing 13.30%
689.241 0.000 Rejected
Services 100.00%
d. Intranet Manufacturing 75.10%
101.742 0.000 Rejected
Services 98.10%
e. E-Learning Portal Manufacturing 41.10%
325.307 0.000 Rejected
TableTableTableTable 9.8 9.8 9.8 9.8
Usage of HR Service Delivery Tools by Type of Company Usage of HR Service Delivery Tools by Type of Company Usage of HR Service Delivery Tools by Type of Company Usage of HR Service Delivery Tools by Type of Company
(MNC/Non(MNC/Non(MNC/Non(MNC/Non----MNC) MNC) MNC) MNC) HR Service Delivery
Tool Type of
Company Percent
using the Tool
Chi-square Significance P-value
Null Hypothesis
MNC 100.00% a. Employee Self Service Non-MNC 71.70%
12.840 0.000 Rejected
MNC 100.00% b. Management Self Service Non-MNC 49.40%
41.553 0.000 Rejected
MNC 98.50%
c. Web 2.0 Technology Non-MNC 36.50%
86.009 0.000 Rejected
MNC 100.00%
d. Intranet Non-MNC 82.30%
6.719 0.005 Rejected
MNC 100.00%
e. E-Learning Portal Non-MNC 57.00%
36.728 0.000 Rejected

288
TableTableTableTable 9.9 9.9 9.9 9.9
Perception of Respondents Perception of Respondents Perception of Respondents Perception of Respondents regarding their company’s regarding their company’s regarding their company’s regarding their company’s
position in the eposition in the eposition in the eposition in the e----HRM journey todayHRM journey todayHRM journey todayHRM journey today---- by Type of by Type of by Type of by Type of
Sector (Services/Manufacturing)Sector (Services/Manufacturing)Sector (Services/Manufacturing)Sector (Services/Manufacturing)
Rating Scale Services Manufacturing Total
Neither understand nor value e-HRM % of Respondents
1 0.00% 3.20% 2.10%
2 0.00% 14.70% 9.60%
3 68.10% 82.10% 77.30%
4 31.90% 0.00% 10.90%
5 0.00% 0.00% 0.00%
Complete incorporation of e-HRM strategy into the business model
Group Statistics
Type of Sector N Mean Std.
Deviation
Std. Error Mean
Services 344 3.32 .467 .025
Where do you perceive your company on the e-HRM journey today?
Manufacturing 656 2.79 .480 .019
Independent Samples Test
t-test for Equality of Means
t df Sig. (2-tailed)
Where do you perceive your company on the e-HRM journey today? 16.833 709.497 .000

289
TableTableTableTable 9.109.109.109.10
Perception of Respondents regarding their company’s Perception of Respondents regarding their company’s Perception of Respondents regarding their company’s Perception of Respondents regarding their company’s
position in the eposition in the eposition in the eposition in the e----HRM journey todayHRM journey todayHRM journey todayHRM journey today---- by Type of by Type of by Type of by Type of
Company (MNC/NonCompany (MNC/NonCompany (MNC/NonCompany (MNC/Non----MNC)MNC)MNC)MNC)
Rating Scale MNC Non-MNC Total
Niether understand nor value e-HRM % of Respondents
1 0.00% 2.50% 2.10%
2 0.00% 10.50% 8.72%
3 72.50% 78.30% 77.30%
4 22.20% 8.70% 10.90%
5 5.30% 0.00% 0.90%
Complete incorporation of e-HRM strategy into the business model
Group Statistics
Type of Company N Mean
Std. Deviat
ion
Std. Error Mean
MNC
170 3.17 .499 .039
Where do you perceive your company in the e-HRM journey today? Non-MNC 830 2.93 .537 .019
Independent Samples Test
t-test for Equality of Means
t df Sig. (2-tailed) Where do you perceive your company in the e-HRM journey today?
5.513 249.732 .000

290
TableTableTableTable 9.11 9.11 9.11 9.11
Perception of Respondents regarding their company’s position in the ePerception of Respondents regarding their company’s position in the ePerception of Respondents regarding their company’s position in the ePerception of Respondents regarding their company’s position in the e----HRM HRM HRM HRM
journey today journey today journey today journey today –––– ANOVA (one ANOVA (one ANOVA (one ANOVA (one----way) way) way) way)
Descriptive Statistics
Mean
Std.
Deviation Std. Error
Services
Non-MNC 3.31 .463 .030
Services MNC 3.34 .477 .046
Manufacturing
Non-MNC 2.78 .490 .020
Manufacturing
MNC 2.85 .363 .047
Where do you perceive your
company in the e-HRM journey
today?
Total 2.97 .538 .017
ANOVA
df F
Significan
ce Level
Between Groups 3 Where do you perceive your
company in the e-HRM journey
today?
Within Groups 996
93.144
.000
The mean difference is significant at the .05 level
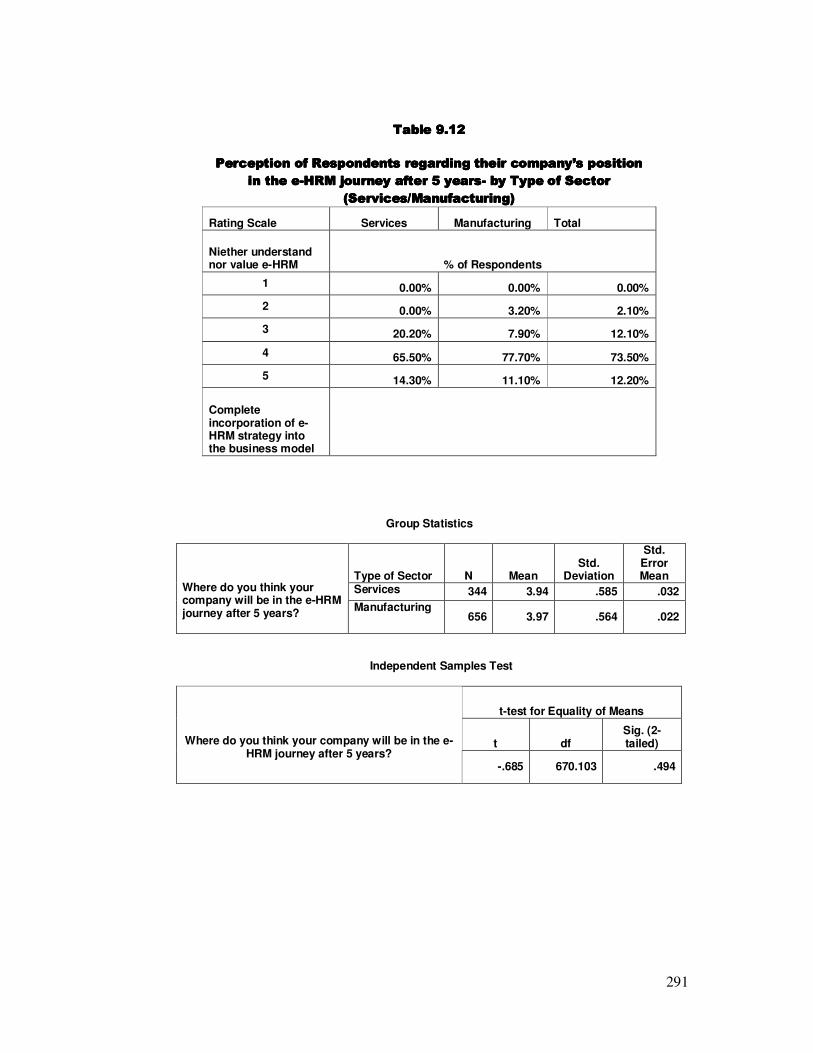
291
TableTableTableTable 9.12 9.12 9.12 9.12
Perception of Respondents regarding their company’s position Perception of Respondents regarding their company’s position Perception of Respondents regarding their company’s position Perception of Respondents regarding their company’s position
in the ein the ein the ein the e----HRM journey after 5 yearsHRM journey after 5 yearsHRM journey after 5 yearsHRM journey after 5 years---- by Type of Sector by Type of Sector by Type of Sector by Type of Sector
(Servic(Servic(Servic(Services/Manufacturing)es/Manufacturing)es/Manufacturing)es/Manufacturing)
Rating Scale Services Manufacturing Total
Niether understand nor value e-HRM % of Respondents
1 0.00% 0.00% 0.00%
2 0.00% 3.20% 2.10%
3 20.20% 7.90% 12.10%
4 65.50% 77.70% 73.50%
5 14.30% 11.10% 12.20%
Complete incorporation of e-HRM strategy into the business model
Group Statistics
Type of Sector N Mean Std.
Deviation
Std. Error Mean
Services 344 3.94 .585 .032 Where do you think your company will be in the e-HRM journey after 5 years?
Manufacturing 656 3.97 .564 .022
Independent Samples Test
t-test for Equality of Means
t df Sig. (2-tailed)
Where do you think your company will be in the e-HRM journey after 5 years?
-.685 670.103 .494

292
TableTableTableTable 9.13 9.13 9.13 9.13
Perception of Respondents regarding their company’s posPerception of Respondents regarding their company’s posPerception of Respondents regarding their company’s posPerception of Respondents regarding their company’s position ition ition ition
in the ein the ein the ein the e----HRM journey after 5 yearsHRM journey after 5 yearsHRM journey after 5 yearsHRM journey after 5 years---- by Type of Company by Type of Company by Type of Company by Type of Company
(MNC/Non(MNC/Non(MNC/Non(MNC/Non----MNC)MNC)MNC)MNC)
Rating Scale MNC Non-MNC Total
Neither understand nor value e-HRM % of Respondents
1 0.00% 0.00% 0.00%
2 0.00% 2.50% 2.10%
3 0.60% 14.50% 12.10%
4 71.30% 74.00% 73.50%
5 28.10% 9.00% 12.20%
Complete incorporation of e-HRM strategy into the business model
Group Statistics
Type of Company N Mean Std.
Deviation
Std. Error Mean
MNC 170 4.28 .461 .036
Where do you think your company will be in the e-HRM journey after 5 years?
Non-MNC 830 3.90 .571 .020
Independent Samples Test
t-test for Equality of Means
t df Sig. (2-tailed)
Where do you think your company will be in the e-HRM journey after 5 years?
8.096 995 .000

293
TableTableTableTable 9.14 9.14 9.14 9.14
Perception of RespoPerception of RespoPerception of RespoPerception of Respondents regarding their company’s position in the endents regarding their company’s position in the endents regarding their company’s position in the endents regarding their company’s position in the e----HRM HRM HRM HRM
journey after 5 years journey after 5 years journey after 5 years journey after 5 years –––– ANOVA (one ANOVA (one ANOVA (one ANOVA (one----way) way) way) way)
Descriptive Statistics
Mean Std. Deviation Std. Error
Services
Non-MNC 3.74 .518 .034
Services MNC 4.37 .485 .047
Manufacturing
Non-MNC 3.95 .579 .024
Manufacturing
MNC 4.10 .357 .046
Where do you think your company
will be in the e-HRM journey after
5 years?
Total 3.96 .572 .018
ANOVA
df F Sig.
Between Groups 3 Where do you think your company
will be in the e-HRM journey after 5
years?
Within Groups 996
34.054
.000
The mean difference is significant at the .05 level

294
TableTableTableTable 9.15a 9.15a 9.15a 9.15a
Perception of Respondents regarding their company’s position in the ePerception of Respondents regarding their company’s position in the ePerception of Respondents regarding their company’s position in the ePerception of Respondents regarding their company’s position in the e----HRM HRM HRM HRM
journey today vs ‘after five years’ journey today vs ‘after five years’ journey today vs ‘after five years’ journey today vs ‘after five years’ –––– Services group Services group Services group Services group
Paired Samples Statistics
Mean N Std.
Deviation
Std. Error Mean
Pair 1
Where do you perceive your company in the e-HRM journey today? 3.32 344 .467 .025
Where do you think your company will be in the e-HRM journey after 5 years? 3.94 344 .585 .032
Paired Samples Test
t df Sig. (2-tailed) Pair 1 Where do you perceive your company in
the e-HRM journey today? - Where do you think your company will be in the e-HRM journey after 5 years?
-14.014 341 .000
TableTableTableTable 9.15b 9.15b 9.15b 9.15b
Perception of Respondents regardingPerception of Respondents regardingPerception of Respondents regardingPerception of Respondents regarding their company’s position in the e their company’s position in the e their company’s position in the e their company’s position in the e----HRM HRM HRM HRM
journey today vs ‘after five years’ journey today vs ‘after five years’ journey today vs ‘after five years’ journey today vs ‘after five years’ –––– Manufacturing group Manufacturing group Manufacturing group Manufacturing group
Paired Samples Statistics
Mean N Std.
Deviation Std. Error
Mean Pair 1 Where do you perceive your company
in the e-HRM journey today? 2.79 656 .480 .019
Where do you think your company will be in the e-HRM journey after 5 years? 3.97 656 .564 .022
Paired Samples Test
t df Sig. (2-tailed) Pair 1 Where do you perceive your company in the
e-HRM journey today? - Where do you think your company will be in the e-HRM journey after 5 years?
-55.657 654 .000

295
TableTableTableTable 9.15c 9.15c 9.15c 9.15c
Perception of Respondents regarding their company’s position in the ePerception of Respondents regarding their company’s position in the ePerception of Respondents regarding their company’s position in the ePerception of Respondents regarding their company’s position in the e----HRM HRM HRM HRM
journey today vs ‘after five years’ journey today vs ‘after five years’ journey today vs ‘after five years’ journey today vs ‘after five years’ –––– MNC group MNC group MNC group MNC group
Paired Samples Statistics
Mean N Std.
Deviation Std. Error
Mean Pair 1 Where do you perceive your
today in the e-HRM journey today?
3.17 170 .499 .039
Where do you think your company will be in the e-HRM journey after 5 years?
4.28 170 .461 .036
Paired Samples Test
t df Sig. (2-tailed) Pair 1 Where do you perceive your company in
the e-HRM journey today? - Where do you think your company will be in the e-HRM journey after 5 years?
-43.402 166 .000
TableTableTableTable 9.15d 9.15d 9.15d 9.15d
Perception of Respondents regarding their company’s position in the ePerception of Respondents regarding their company’s position in the ePerception of Respondents regarding their company’s position in the ePerception of Respondents regarding their company’s position in the e----HRM HRM HRM HRM
journey today vs ‘afjourney today vs ‘afjourney today vs ‘afjourney today vs ‘after five years’ ter five years’ ter five years’ ter five years’ –––– Non Non Non Non----MNC groupMNC groupMNC groupMNC group
Paired Samples Statistics
Mean N Std.
Deviation Std. Error
Mean Pair 1 Where do you perceive your
company in the e-HRM journey today?
2.93 830 .537 .019
Where do you think your company will be in the e-HRM journey after 5 years?
3.90 830 .571 .020
Paired Samples Test
t df Sig. (2-tailed) Pair 1 Where do you perceive your company
in the e-HRM journey today? - Where do you think your company will be in the e-HRM journey after 5 years?
-36.843 829 .000

296
TableTableTableTable 9. 9. 9. 9.16a16a16a16a
Barriers to progress in the eBarriers to progress in the eBarriers to progress in the eBarriers to progress in the e----HRM journey: Mean Ranks by Type of Sector HRM journey: Mean Ranks by Type of Sector HRM journey: Mean Ranks by Type of Sector HRM journey: Mean Ranks by Type of Sector
(Services/Manufacturing)(Services/Manufacturing)(Services/Manufacturing)(Services/Manufacturing)
Type of Sector (Services/Manufacturing) Services Manufacturing Total
CONSIDERED BARRIERS Mean
Std. Dev.
Mean Std. Dev.
Mean Std. Dev.
a. Inadequate Financial Resources 3.20 2.73 2.00 1.89 2.41 2.28
b. Resistance to change 7.17 1.85 2.95 1.88 4.40 2.74
c. Lack of top management support 7.13 1.83 7.36 1.81 7.28 1.82
d. Inadequate Training 5.87 2.43 3.18 1.03 4.10 2.09
e. Poor technical infrastructure 7.17 1.63 3.97 1.55 5.07 2.19
f. Issues w.r.t. Security of data 5.72 2.91 6.71 2.27 6.37 2.56
g. Insufficient tangible benefits 3.75 2.64 6.72 2.41 5.70 2.86
h. Lack of innovation 3.27 1.09 6.87 1.86 5.63 2.37
i. Inability to overcome bureaucratic hurdles 8.73 1.44 8.67 1.57 8.70 1.53 j. Difficulty in converting standardized packages into customized and user friendly modules 2.96 1.49 6.55 2.41 5.32 2.74
TableTableTableTable 9.16b 9.16b 9.16b 9.16b
Barriers to progress in the eBarriers to progress in the eBarriers to progress in the eBarriers to progress in the e----HRM journey: Mean Rank Order by Type of HRM journey: Mean Rank Order by Type of HRM journey: Mean Rank Order by Type of HRM journey: Mean Rank Order by Type of
Sector (ServSector (ServSector (ServSector (Services/Manufacturing)ices/Manufacturing)ices/Manufacturing)ices/Manufacturing)
MEAN RANK ORDER CONSIDERED BARRIERS
Services Manufacturing TOTAL
a Inadequate Financial Resources 2 1 1
b Resistance to change 8 2 3
c Lack of top management support 7 9 9
d Inadequate Training 6 3 2
e Poor technical infrastructure 8 4 4
f Issues w.r.t. Security of data 5 6 8
g Insufficient tangible benefits 4 7 7
h Lack of innovation 3 8 6
i Inability to overcome bureaucratic hurdles 9 10 10
j Difficulty in converting standardized packages into customized and user friendly modules 1 5 5
1: Most Important; 2: Least Important

297
TableTableTableTable 9.17a 9.17a 9.17a 9.17a
Barriers to progress in the eBarriers to progress in the eBarriers to progress in the eBarriers to progress in the e----HRM journey: Mean ranks by Type of HRM journey: Mean ranks by Type of HRM journey: Mean ranks by Type of HRM journey: Mean ranks by Type of
Company (MNC/NonCompany (MNC/NonCompany (MNC/NonCompany (MNC/Non----MNC)MNC)MNC)MNC) Type of Company (MNC/Non-MNC)
MNC Non-MNC Total CONSIDERED BARRIERS
Mean Std. Dev. Mean
Std. Dev. Mean
Std. Dev.
a. Inadequate Financial Resources 6.84 1.88 1.51 0.89 2.41 2.28
b. Resistance to change 7.25 1.52 3.83 2.57 4.4 2.74
c.Lack of top management support 7.57 1.85 7.22 1.81 7.28 1.82
d. Inadequate Training 3.67 1.28 4.19 2.2 4.1 2.09
e. Poor technical infrastructure 6.88 1.83 4.7 2.07 5.07 2.19
f. Issues w.r.t. Security of data 2.43 1.23 7.17 1.95 6.37 2.56
g. Insufficient tangible benefits 6.79 2.4 5.49 2.9 5.7 2.86
h. Lack of innovation 3.34 1.03 6.09 2.29 5.63 2.37
i. Inability to overcome bureaucratic hurdles 8.79 1.55 8.68 1.53 8.7 1.53 j. Difficulty in converting standardized packages into customized and user friendly modules 1.49 0.83 6.09 2.3 5.32 2.74
TableTableTableTable 9.17b 9.17b 9.17b 9.17b
Barriers to progress in the eBarriers to progress in the eBarriers to progress in the eBarriers to progress in the e----HRM journey: Mean RankHRM journey: Mean RankHRM journey: Mean RankHRM journey: Mean Rank Order by type of Order by type of Order by type of Order by type of
Company (MNC/NonCompany (MNC/NonCompany (MNC/NonCompany (MNC/Non----MNC)MNC)MNC)MNC)
MEAN RANK ORDER CONSIDERED BARRIERS
MNC Non-MNC TOTAL
a Inadequate Financial Resources 6 1 1
b Resistance to change 8 2 3
c Lack of top management support 9 9 9
d Inadequate Training 4 3 2
e Poor technical infrastructure 7 4 4
f Issues w.r.t. Security of data 2 8 8
g Insufficient tangible benefits 5 5 7
h Lack of innovation 3 7 6
i Inability to overcome bureaucratic hurdles 10 10 10
j
Difficulty in converting standardized packages into customized and user friendly modules 1 6 5
1: Most Important; 2: Least Important

298
TableTableTableTable 9.18a 9.18a 9.18a 9.18a
Barriers to progress in the eBarriers to progress in the eBarriers to progress in the eBarriers to progress in the e----HRM journey: ANOVA (oneHRM journey: ANOVA (oneHRM journey: ANOVA (oneHRM journey: ANOVA (one----way) way) way) way) ––––
Descriptive StatisticsDescriptive StatisticsDescriptive StatisticsDescriptive Statistics
Mean Std. Deviation Std. Error
a. Inadequate Financial
Resources
Services Non-MNC 1.57 .974 .064
Services MNC 6.71 1.870 .180
Manufacturing Non-MNC 1.49 .861 .035
Manufacturing MNC 7.08 1.896 .247
Total 2.41 2.285 .072
b. Resistance to change Services Non-MNC 7.09 1.982 .130
Services MNC 7.33 1.547 .149
Manufacturing Non-MNC 2.54 1.350 .055
Manufacturing MNC 7.08 1.489 .194
Total 4.40 2.741 .087
c. Lack of top management
support
Services Non-MNC 6.94 1.787 .117
Services MNC 7.55 1.871 .180
Manufacturing Non-MNC 7.34 1.813 .074
Manufacturing MNC 7.61 1.838 .239
Total 7.28 1.824 .058
d. Inadequate Training Services Non-MNC 6.83 2.223 .145
Services MNC 3.79 1.326 .128
Manufacturing Non-MNC 3.15 1.009 .041
Manufacturing MNC 3.46 1.194 .155
Total 4.10 2.087 .066
e. Poor technical
infrastructure
Services Non-MNC 7.29 1.486 .097
Services MNC 6.90 1.884 .181
Manufacturing Non-MNC 3.69 1.204 .049
Manufacturing MNC 6.85 1.770 .230
Total 5.07 2.190 .069

299
f. Issues w.r.t. Security of
data
Services Non-MNC 7.26 2.070 .135
Services MNC 2.40 1.222 .118
Manufacturing Non-MNC 7.13 1.897 .078
Manufacturing MNC 2.49 1.251 .163
Total 6.37 2.557 .081
g. Insufficient tangible
benefits
Services Non-MNC 2.37 1.198 .078
Services MNC 6.74 2.451 .236
Manufacturing Non-MNC 6.71 2.422 .099
Manufacturing MNC 6.88 2.342 .305
Total 5.70 2.866 .091
h. Lack of innovation Services Non-MNC 3.26 1.117 .073
Services MNC 3.29 1.042 .100
Manufacturing Non-MNC 7.21 1.555 .064
Manufacturing MNC 3.44 1.022 .133
Total 5.63 2.367 .075
i. Inability to overcome
bureaucratic hurdles
Services Non-MNC 8.71 1.463 .096
Services MNC 8.80 1.399 .135
Manufacturing Non-MNC 8.66 1.552 .064
Manufacturing MNC 8.78 1.811 .236
Total 8.70 1.531 .048
j. Inability to convert
standardized packages into
customized and user friendly
modules
Services Non-MNC
3.63 1.226 .080
Services MNC 1.49 .826 .079
Manufacturing Non-MNC 7.05 1.875 .077
Manufacturing MNC 1.47 .838 .109
Total 5.32 2.739 .087

300
TableTableTableTable 9.18b 9.18b 9.18b 9.18b
Barriers to progress in thBarriers to progress in thBarriers to progress in thBarriers to progress in the ee ee ee e----HRM journey HRM journey HRM journey HRM journey ---- ANOVA ANOVA ANOVA ANOVA
df F Sig.
Null
Hypothesis
Between Groups 3 a. Inadequate Financial
Resources
Within Groups 996
1051.777
.000
Rejected
Between Groups 3 b. Resistance to change
Within Groups 996
708.416
.000
Rejected
Between Groups 3 c. Lack of top
management support
Within Groups 996
4.428
.004
Rejected
Between Groups 3 d. Inadequate Training
Within Groups 996
377.188
.000
Rejected
Between Groups 3 e. Poor technical
infrastructure
Within Groups 996
485.075
.000
Rejected
Between Groups 3 f. Issues w.r.t. Security
of data
Within Groups 996
304.822
.000
Rejected
Between Groups 3 g. Insufficient tangible
benefits
Within Groups 996
234.994
.000
Rejected
Between Groups 3 h. Lack of innovation
Within Groups 996
637.921
.000
Rejected
Between Groups 3 i. Inability to overcome
bureaucratic hurdles
Within Groups 996
.300
.826
Accepted
Between Groups 3 j. Inability to convert
standardized packages
into customized and
user friendly modules
Within Groups
996
636.243
.000
Rejected
The mean difference is significant at the .05 level

301
TableTableTableTable 9.19 9.19 9.19 9.19
Expectation of respondents w.r.t. eExpectation of respondents w.r.t. eExpectation of respondents w.r.t. eExpectation of respondents w.r.t. e----HRM being HRM being HRM being HRM being
successful in satisfying employees in their HR needssuccessful in satisfying employees in their HR needssuccessful in satisfying employees in their HR needssuccessful in satisfying employees in their HR needs----
Services vs ManufacturingServices vs ManufacturingServices vs ManufacturingServices vs Manufacturing
Services Manufacturing Total Opinion % of Respondents
YES 89.18 71.30 77.43
NO 4.68 5.34 5.12
Can't Say 6.14 23.36 17.45
Chi-square= 47.64 df=2 P<0.0001
TableTableTableTable 9.20 9.20 9.20 9.20
Expectation of respondents w.r.t. eExpectation of respondents w.r.t. eExpectation of respondents w.r.t. eExpectation of respondents w.r.t. e----HRM beinHRM beinHRM beinHRM being g g g
successful in satisfying employees in their HR successful in satisfying employees in their HR successful in satisfying employees in their HR successful in satisfying employees in their HR
needsneedsneedsneeds---- MNC vs Non MNC vs Non MNC vs Non MNC vs Non----MNCMNCMNCMNC
MNC Non-MNC Total Opinion % of Respondents
YES 100.00 72.90 77.43
NO 0.00 6.14 5.12
Can't Say 0.00 20.96 17.45
Chi-square= 58.47 df=2 P<0.0001
TableTableTableTable 9.21 9.21 9.21 9.21
Expectation of respondExpectation of respondExpectation of respondExpectation of respondents w.r.t. the benefits from eents w.r.t. the benefits from eents w.r.t. the benefits from eents w.r.t. the benefits from e----
HRM justifying the expenditure on the sameHRM justifying the expenditure on the sameHRM justifying the expenditure on the sameHRM justifying the expenditure on the same----
Services vs ManufacturingServices vs ManufacturingServices vs ManufacturingServices vs Manufacturing
Services Manufacturing Total Opinion
% of Respondents
YES 96.2 49.31 65.4
NO 2.34 30.08 20.56
Can't Say 1.46 20.61 14.04
Chi-square= 218.27 df=2 P<0.0001
TableTableTableTable 9.22 9.22 9.22 9.22
Expectation of respondents w.r.t the benefits from Expectation of respondents w.r.t the benefits from Expectation of respondents w.r.t the benefits from Expectation of respondents w.r.t the benefits from
eeee----HRM justifyiHRM justifyiHRM justifyiHRM justifying the expenditure on the sameng the expenditure on the sameng the expenditure on the sameng the expenditure on the same----
MNC vs NonMNC vs NonMNC vs NonMNC vs Non----MNCMNCMNCMNC
MNC Non-MNC Total Opinion % of Respondents
YES 100.00 58.44 65.40
NO 0.00 24.70 20.56
Can't Say 0.00 16.86 14.04
Chi-square= 106.15 df=2
P<0.0001

302
TableTableTableTable 9.23 9.23 9.23 9.23
Opinion of respondents on various aspects of the Opinion of respondents on various aspects of the Opinion of respondents on various aspects of the Opinion of respondents on various aspects of the
eeee----HRM functioning HRM functioning HRM functioning HRM functioning ---- Mean Ratings by Type of Mean Ratings by Type of Mean Ratings by Type of Mean Ratings by Type of
SectSectSectSector (Services/Manufacturing)or (Services/Manufacturing)or (Services/Manufacturing)or (Services/Manufacturing)
Statements Services Manufacturing Total
1 4.46 3.07 3.55
2 4.51 2.73 3.34
3 3.92 2.86 3.22
4 4.91 3.39 3.91
5 4.94 3.90 4.26
6 4.90 2.97 3.63
7 4.29 2.18 2.90
8 3.91 2.01 2.66
9 4.96 3.37 3.92
10 4.63 2.47 3.21
11 3.62 1.98 2.54
12 4.00 1.99 2.68
13 4.93 3.27 3.84
14 4.00 2.50 3.02
15 4.30 2.37 3.03
16 4.45 2.51 3.17
17 3.81 1.81 2.49
18 4.76 3.31 3.80
19 3.63 2.48 2.87
20 4.35 2.56 3.18
21 4.32 3.02 3.47
22 4.70 3.08 3.64
23 4.66 3.07 3.61
24 4.04 2.61 3.10
25 4.25 2.08 2.83
26 4.86 2.89 3.56
27 4.64 3.12 3.64
28 4.87 3.91 4.24
29 4.17 3.04 3.42
30 4.66 2.97 3.55
Group Statistics
Type of Sector N Mean Std. Deviation Std. Error
Mean
Total Services 344 132.46 6.968 .377
Manufacturing 656 83.53 24.238 .947
Independent Samples Test
t-test for Equality of Means
t df Sig. (2-tailed) Total 48.007 837.178 .000

303
TableTableTableTable 9.24 9.24 9.24 9.24
Opinion of respondents on various aspects of Opinion of respondents on various aspects of Opinion of respondents on various aspects of Opinion of respondents on various aspects of
the ethe ethe ethe e----HRM functioning HRM functioning HRM functioning HRM functioning ---- Mean Ratings by Type Mean Ratings by Type Mean Ratings by Type Mean Ratings by Type
of Company (MNC/Nonof Company (MNC/Nonof Company (MNC/Nonof Company (MNC/Non----MNC)MNC)MNC)MNC)
Statements MNC Non-MNC Total
1 4.68 3.32 3.55
2 4.59 3.09 3.34
3 4.34 3.00 3.22
4 4.79 3.73 3.91
5 4.86 4.14 4.26
6 4.77 3.41 3.63
7 4.77 2.53 2.90
8 4.75 2.24 2.66
9 4.81 3.74 3.92
10 4.96 2.86 3.21
11 4.55 2.14 2.54
12 4.63 2.29 2.68
13 4.83 3.64 3.84
14 4.49 2.72 3.02
15 4.66 2.70 3.03
16 4.87 2.83 3.17
17 4.23 2.14 2.49
18 4.75 3.61 3.80
19 4.14 2.62 2.87
20 4.64 2.88 3.18
21 4.84 3.19 3.47
22 4.87 3.39 3.64
23 4.80 3.38 3.61
24 4.60 2.80 3.10
25 4.44 2.50 2.83
26 4.71 3.33 3.56
27 4.74 3.42 3.64
28 4.72 4.14 4.24
29 4.70 3.17 3.42
30 4.69 3.32 3.55
Group Statistics
Type of Company N Mean Std. Deviation
Std. Error Mean
Total MNC 170 140.25 6.407 .496
Non-MNC 830 92.27 27.170 .943
Independent Samples Test
t-test for Equality of Means
t df Sig. (2-tailed) Total 45.023 977.618 .000

304
TableTableTableTable 9.25 9.25 9.25 9.25
Opinion of respondents on various aspects of the eOpinion of respondents on various aspects of the eOpinion of respondents on various aspects of the eOpinion of respondents on various aspects of the e----HRM functioning HRM functioning HRM functioning HRM functioning
(Statements 1 to 30 respectively(Statements 1 to 30 respectively(Statements 1 to 30 respectively(Statements 1 to 30 respectively)
TableTableTableTable 9.25 (i) 9.25 (i) 9.25 (i) 9.25 (i)
The e-recruitment process operates with the need to match employee profile with positions vacant
Rating Opinion % of Respondents
1 Strongly disagree 5.42
2 Disagree 14.94
3 Undecided 29.39 4 Agree 19.76 5 Strongly agree 30.49
TableTableTableTable 9.25 (ii) 9.25 (ii) 9.25 (ii) 9.25 (ii)
The e-HRM technology has helped in reducing the time and effort in preparing the job-description and job-specification
Rating Opinion % of Respondents
1 Strongly disagree 5.42
2 Disagree 26.58
3 Undecided 19.86
4 Agree 24.87
5 Strongly agree 23.27
TableTableTableTable 9.25 (iii) 9.25 (iii) 9.25 (iii) 9.25 (iii)
The candidate application maintained and recorded online has made the applicant tracking system easily accessible
Rating Opinion % of Respondents
1 Strongly disagree 0.60
2 Disagree 29.79
3 Undecided 25.88
4 Agree 34.40
5 Strongly agree 9.33
TableTableTableTable 9.25 (iv) 9.25 (iv) 9.25 (iv) 9.25 (iv)
The e-HRM technology has ensured an effective salary administration system
Rating Opinion % of Respondents
1 Strongly disagree 0.00
2 Disagree 7.32
3 Undecided 31.59
4 Agree 24.07 5 Strongly agree 37.01
TableTableTableTable 9.25 (v) 9.25 (v) 9.25 (v) 9.25 (v)
The pay structure has been clearly defined in the e-HRM System
Rating Opinion % of Respondents
1 Strongly disagree 0.00
2 Disagree 5.42
3 Undecided 1.20
4 Agree 55.27
5 Strongly agree 38.11

305
TableTableTableTable 9.25 (vi) 9.25 (vi) 9.25 (vi) 9.25 (vi)
The pay cheques reach on time to the employees since the implementation of e-HRM technology
Rating Opinion % of Respondents
1 Strongly disagree 0.00
2 Disagree 28.99
3 Undecided 15.35
4 Agree 18.86
5 Strongly agree 36.81
TableTableTableTable 9.25 (vii) 9.25 (vii) 9.25 (vii) 9.25 (vii)
The recording of employee absence, vacation, sickness etc via e-HRM technology reflects in the pay roll system
Rating Opinion % of Respondents
1 Strongly disagree 24.07
2 Disagree 16.85
3 Undecided 18.15 4 Agree 26.38
5 Strongly agree 14.54
TableTableTableTable 9.25 (viii) 9.25 (viii) 9.25 (viii) 9.25 (viii)
The e-HRM process has enabled employees to enroll for flexible benefits administration effectively
Rating Opinion % of Respondents
1 Strongly disagree 34.40
2 Disagree 6.62
3 Undecided 31.39
4 Agree 13.34 5 Strongly agree 14.24
TableTableTableTable 9.25 (ix) 9.25 (ix) 9.25 (ix) 9.25 (ix)
The compensation frame work implemented by the e- HRM allows managers to calculate incentives and rewards for the employees online
Rating Opinion % of Respondents
1 Strongly disagree 0.00
2 Disagree 4.31
3 Undecided 37.21
4 Agree 20.96 5 Strongly agree 37.51
TableTableTableTable 9.25 (x) 9.25 (x) 9.25 (x) 9.25 (x)
The assessment of employee performance online helps to calculate performance related pay effectively
Rating Opinion % of Respondents
1 Strongly disagree 17.75
2 Disagree 23.17
3 Undecided 7.32
4 Agree 23.67 5 Strongly agree 28.08

306
TableTableTableTable 9.25 (xi) 9.25 (xi) 9.25 (xi) 9.25 (xi)
The e-HRM process has been effective in providing clear role definitions
Rating Opinion % of Respondents
1 Strongly disagree 31.29
2 Disagree 18.46
3 Undecided 24.87
4 Agree 15.35 5 Strongly agree 10.03
TableTableTableTable 9.25 (xii) 9.25 (xii) 9.25 (xii) 9.25 (xii)
The e-HRM process has enabled to identify and nurture individual talents and help to raise their performance
Rating Opinion % of Respondents
1 Strongly disagree 34.90
2 Disagree 6.62
3 Undecided 25.98
4 Agree 20.46
5 Strongly agree 12.04
TableTableTableTable 9.25 (xiii) 9.25 (xiii) 9.25 (xiii) 9.25 (xiii)
The self service e-learning opportunities have supported employees to keep their knowledge and skills up-to-date
Rating Opinion % of Respondents
1 Strongly disagree 1.20
2 Disagree 7.32
3 Undecided 35.21
4 Agree 18.46
5 Strongly agree 37.81
TableTableTableTable 9.25 (xiv) 9.25 (xiv) 9.25 (xiv) 9.25 (xiv)
The e-learning strategies have brought about an effective change in leadership development
Rating Opinion % of Respondents
1 Strongly disagree 6.62
2 Disagree 34.40
3 Undecided 18.25
4 Agree 32.20
5 Strongly agree 8.53
TableTableTableTable 9.25 (xv) 9.25 (xv) 9.25 (xv) 9.25 (xv)
E-HRM has provided sufficient opportunities for employees' career planning and development
Rating Opinion % of Respondents
1 Strongly disagree 19.46
2 Disagree 16.15
3 Undecided 21.16
4 Agree 28.39
5 Strongly agree 14.84

307
TableTableTableTable 9.25 (xvi) 9.25 (xvi) 9.25 (xvi) 9.25 (xvi)
Training through e- HRM helps in recommending candidates for promotion and individual compensation awards
Rating Opinion % of Respondents
1 Strongly disagree 5.22
2 Disagree 39.72
3 Undecided 9.53
4 Agree 23.67 5 Strongly agree 21.87
TableTableTableTable 9.25 (xvii) 9.25 (xvii) 9.25 (xvii) 9.25 (xvii)
The employees have been provided with necessary resources and sufficient training to be able to use e- HRM technology
Rating Opinion % of Respondents
1 Strongly disagree 34.20
2 Disagree 18.15
3 Undecided 15.85
4 Agree 27.58 5 Strongly agree 4.21
TableTableTableTable 9.25 (xviii) 9.25 (xviii) 9.25 (xviii) 9.25 (xviii)
The intranet delivered communication system has provided opportunity for employees to participate in communication and consultation activities
Rating Opinion % of Respondents
1 Strongly disagree 0.00
2 Disagree 0.00
3 Undecided 50.35
4 Agree 18.86
5 Strongly agree 30.79
TableTableTableTable 9.25 (xix) 9.25 (xix) 9.25 (xix) 9.25 (xix)
The e-HRM system is geared to understanding and following grievance, disciplinary and poor performance issues in a timely and compliant manner
Rating Opinion % of Respondents
1 Strongly disagree 0.00
2 Disagree 41.02
3 Undecided 33.40
4 Agree 22.77
5 Strongly agree 2.81
TableTableTableTable 9.25 (xx) 9.25 (xx) 9.25 (xx) 9.25 (xx)
The e-HRM system has increased employee commitment with the organization by boosting their motivation and confidence levels
Rating Opinion % of Respondents
1 Strongly disagree 9.43
2 Disagree 26.38
3 Undecided 17.95
4 Agree 29.59 5 Strongly agree 16.65

308
TableTableTableTable 9.25 (xxi) 9.25 (xxi) 9.25 (xxi) 9.25 (xxi)
The e-HRM process ensures compliance with policy and procedures
Rating Opinion % of Respondents
1 Strongly disagree 0.00
2 Disagree 15.35
3 Undecided 42.23
4 Agree 22.77
5 Strongly agree 19.66
TableTableTableTable 9.25 (xxii) 9.25 (xxii) 9.25 (xxii) 9.25 (xxii)
Working with e-HRM is clear and understandable.
Rating Opinion % of Respondents
1 Strongly disagree 0.00
2 Disagree 11.84
3 Undecided 42.43
4 Agree 15.75 5 Strongly agree 29.99
TableTableTableTable 9.25 (xxiii) 9.25 (xxiii) 9.25 (xxiii) 9.25 (xxiii)
Policies formulated under e-HRM technology are easy to comprehend, credible and are user friendly
Rating Opinion % of Respondents
1 Strongly disagree 4.11
2 Disagree 4.31
3 Undecided 44.73
4 Agree 19.66
5 Strongly agree 27.18
TableTableTableTable 9.25 (xxiv) 9.25 (xxiv) 9.25 (xxiv) 9.25 (xxiv)
Since the implementation of e-HRM technology the HR department is increasingly involved in strategic HR activities
Rating Opinion % of Respondents
1 Strongly disagree 1.20
2 Disagree 34.60
3 Undecided 28.79
4 Agree 24.07
5 Strongly agree 11.33
TableTableTableTable 9.25 (xxv) 9.25 (xxv) 9.25 (xxv) 9.25 (xxv)
E-HRM technology is compatible with other systems in use
Rating Opinion % of Respondents
1 Strongly disagree 27.08
2 Disagree 18.56
3 Undecided 11.13
4 Agree 31.19
5 Strongly agree 12.04

309
TableTableTableTable 9.25 (xxvi) 9.25 (xxvi) 9.25 (xxvi) 9.25 (xxvi)
The e-HRM system is user friendly
Rating Opinion % of Respondents
1 Strongly disagree 0.00
2 Disagree 30.69
3 Undecided 17.95
4 Agree 15.55
5 Strongly agree 35.81
TableTableTableTable 9.25 (xxvii) 9.25 (xxvii) 9.25 (xxvii) 9.25 (xxvii)
The e-HRM system provides timely information
Rating Opinion % of Respondents
1 Strongly disagree 0.00
2 Disagree 18.76
3 Undecided 26.98
4 Agree 25.58
5 Strongly agree 28.69
TableTableTableTable 9.25 (xxviii) 9.25 (xxviii) 9.25 (xxviii) 9.25 (xxviii)
The e-HRM system provides up-to-date information
Rating Opinion % of Respondents
1 Strongly disagree 0.00
2 Disagree 0.00
3 Undecided 12.04
4 Agree 52.06
5 Strongly agree 35.91
TableTableTableTable 9.25 (xxix) 9.25 (xxix) 9.25 (xxix) 9.25 (xxix)
The e-HRM system has ensured a clear fit between business and HR strategy
Rating Opinion % of Respondents
1 Strongly disagree 0.00
2 Disagree 24.97
3 Undecided 23.07
4 Agree 36.51
5 Strongly agree 15.45
TableTableTableTable 9.25 (xxx) 9.25 (xxx) 9.25 (xxx) 9.25 (xxx)
E-HRM has been an effective change agent for positively molding the employees' attitudes towards the use
of technology
Rating Opinion % of Respondents
1 Strongly disagree 0.00
2 Disagree 30.29
3 Undecided 14.04
4 Agree 26.08
5 Strongly agree 29.59
Related Documents