THE IMPLICATIONS OF AGRICULTURAL MARKET LIBERALISATION FOR MARKET EFFICIENCY AND AGRICULTURAL POLICY IN KENYA: THE CASE OF A THESIS SUBMITTED TO THE FACULTY OF AGRICULTURE IN PARTIAL FULFILMENT OF THE REQUIREMENTS FOR THE DEGREE OF MASTER OF SCIENCE IN AGRICULTURAL ECONOMICS UNIVERSITY OF MALAWI BUNDA COLLEGE OF AGRICULTURE MAIZE B.Sc. Range Management (Nairobi DANIEL M. G. NGUGI SEPTEMBER, 1997

Welcome message from author
This document is posted to help you gain knowledge. Please leave a comment to let me know what you think about it! Share it to your friends and learn new things together.
Transcript

THE IMPLICATIONS OF AGRICULTURAL MARKET LIBERALISATION FOR MARKET EFFICIENCY AND AGRICULTURAL POLICY IN KENYA: THE CASE OF
A THESIS SUBMITTED TO THE FACULTY OF AGRICULTURE IN PARTIAL FULFILMENT OF THE
REQUIREMENTS FOR THE DEGREE OF MASTER OF SCIENCE IN AGRICULTURAL ECONOMICS
UNIVERSITY OF MALAWI BUNDA COLLEGE OF AGRICULTURE
MAIZE
B.Sc. Range Management (NairobiDANIEL M. G. NGUGI
SEPTEMBER, 1997

ft
I

DECLARATION BY THE CANDIDATE
I declare that this thesis is my own work and effort and that it has not been
submitted anywhere for any other award. Where other sources of information
have been used, they have been acknowledged.
I W .
Signature:
Date © J?.
i

CERTIFICATE OF APPROVAL
We declare that this thesis is from the student's own work and effort and where
he has used other sources of information, they have been acknowledged. This
thesis has been submitted with our approval.
Supervisor:
Dr Charles Mat&ya
Date : ^ ^
Supervisor : _______
Dr Davies Ng’ong’ola
Date : lo
Supervisor:
(^ d r Abdi Edri’ss
^ rmDate

TABLE OF CONTENTS
Contents Page
LIST O F T A B L E S .............................................................................................vii
ACKNOWLEDGEMENTS ........................................................................... viii
D E D IC A T IO N .................................................................................................. xi
ABSTRACT ................................................................................... xii
LIST O F A C R O N Y M S................................................................................... xiv
CHAPTER I IN T R O D U C T IO N .....................................................................1
1.1 Background .................................................................................7
1.2 Ju stifica tio n .................................................................................9
1.3 Objectives of the S tu d y ...............................................................9
1.3.1 Specific O bjectives................................................... 10
1.4 The H ypotheses...................................................................... 10
1.5 Thesis O u tlin e ............................................................................ 11
CHAPTER II KENYA’S MAIZE SUB-SECTOR ....................................11
2.1 The Structure of Kenya's A g ric u ltu re .............................. 12
2.1.1 The Role of Agriculture in the E c o n o m y .............14
2.2 Maize Utilisation in Kenya .....................................................14
2.2.1 Maize Production Trends and Productivity . . . 14
2.2.2 Maize Production Patterns and Calendars . . . . 16
2.2.3 Regional Maize Sufficiency .................. 19
2.3 Organisation of the Kenyan Maize Market .......................20
i i i

2.3.1 M arket S tru c tu re ..........................................................20
2.3.2 Maize M arketing Flows and Channels . . . 21
2.3.3 International Trade in M a iz e ....................................22
2.3.4 Maize S to ra g e ............................................................... 24
2.3.5 M arket Information ..................................................26
CHAPTER III LITERATURE REVIEW ................................................. 30
3.1 Structural Adjustment Program s and their Relation to
M arket Liberalisation .............................................................30
3.2 Maize M arket Regulation and Reform ...............................33
3.2.1 Maize Market Regulation ......................................... 33
3.2.2 Implications of M arket Regulation for M arket
Efficiency and National Resource allocation . . . 36
3.2.3 Maize Market Reform ...............................................40
3.3 M arket Liberalisation and its Policy Implications . . . 44
3.4 Review of Past Methodologies and Theoretical
Underpinnings of the M o d e ls ..................................................48
3.4.1 Market Integration Analysis ................................... 48
3.4.1.1 Correlation of Price L e v e ls ......................................................49
3.4.1.2 Correlation of Price D ifferences............................................. 51
3.4.1.3 Cointegration A n a ly sis ..............................................................52
4.1.2 Causality Testing: The Central Market Hypothesis
55
IV

3.4.3 Assessing Structural Determinants of M arket
In te g ra t io n .....................................................................58
CHAPTER IV M ETH O D O LO G Y .................................................................. 62
4.2 The Models ............................................................................... 62
4.2.1 The Cointegration Model ......................................... 62
4.2.2 The Causality E rro r Correction M o d e l ................. 64
4.2.3 The Structural Determinants Model .......................65
4.3 Data Description and Sources ...............................................68
4.3.1 Maize Price D a ta ....................................................................... 68
4.3.2 Data on Determinants of M arket Integration . . 69
4.3.3 Data Limitations ..........................................................71
4.4 Empirical E s tim a tio n ............................................................... 72
CHAPTER V RESULTS AND DISCUSSIONS ......................................... 73
5.1 M arket Integration .................................................................. 75
5.1.1 Correlation of Price Levels .......................................75
5.1.2 Correlation of Price D ifferences...............................78
5.1.3 Cointegration Analysis ...............................................80
5.1.4 Comparison of the M easures of M arket Integration
..........................................................................................84
5.2 Causality Testing .................................................................... 87
5.3 Determinants of Market In teg ra tio n ................ '................. 90
CHAPTER VI CONCLUSIONS, IMPLICATIONS AND POLICY
RECO M M EN D A TIO N S.................................................................................. 95
v

REFERENCES 101
APPENDICES 112
v i

LIST OF TABLES
Table Page
Table 2.1: National maize area, production and y ie ld ............................... 17
Table 2.2: International trade in maize; exports by NCPB ....................23
Table 5.1: Stationarity tests for pre-liberalisation p e rio d ......................... 81
Table 5.2: Stationarity tests for post-liberalisation p e r io d ...................... 81
Table 5.3: Integrated m arket links; pre-liberalisation period3 ...............82
Table 5.4: Integrated m arket links; post-liberalisation period3 . . . . 83
Table 5.5: Comparison of the various measures of m arket integration by
liberalisation period: Percentage of Integrated l i n k s .................85
Table 5.6: Summary of causality testing4 ................................................. 88
Table 5.7: Determinants of market integration ...................................... 92
VI1

ACKNOWLEDGEMENTS
This thesis would be incomplete without the mention of many persons and
institutions who have contributed in one way or another towards making my
studies at Bunda College a success. Space can not allow me to mention every
one of them by name - The list is endless. Nevertheless, I wish in appreciation
to acknowledge the following:
The German Academic Exchange Service (DAAD) for giving me the study
scholarship and the African Faculties of Agriculture Association (AFAA)
through which the sholarship was given. The University of Malawi. Bunda
College of Agriculture for offering me a college vacancy to pursue an M.Sc.
degree in Agricultural Economics. Prof. C.N. Karue of the University of
Nairobi, for his efforts in coordinating the scholarship plus his fatherly counsel
and assistance during the entire study period - he went many miles beyond his
obligation as a coordinator to make my studies a success.
The members of my thesis advisory committee, Drs. Charles Mataya
(chairman) and Davies Ng’ong’ola and Mr. Abdi Edriss for their tireless efforts
in giving much needed counsel, and encouragement throughout the entire thesis
research period. The Central Bureau of Statistics (CBS) staff in Nairobi
particularly Messrs Kirimi; Muthee; Kamunya; the Marketing Information
Branch of the Ministry of Agriculture Livestock Development and Marketing
v i i i

(MIB/MoALDM) staff particulary Mungai; friends - Gituka; Phaita; Muthoni-
Wa-Njau; sisters - Eunice; Mary; and all other persons who assisted in one
way or another with data collection in Nairobi. Sister Leah who for several
years before the commencement of this course dreamt with me about it and
inspired me on.
My parents, and brethren for their prayers, moral support and encouragement
throughout the period of my study away from home - their sheer confidence in
me was great inspiration even when the going got tough. Scores of friends and
relatives, who cared enough to write and/or pray for my well being; and the
FOCUS office that kept me in touch with home through Home News. Special
thanks go to my neighbour, Silayo; my final year house mate Chimphero; the
Mwendas; the Juwayeyis; the Sam Samus for their friendship - the three
families kept their home doors wide open for me and gave me support in
uncountable ways.
The entire SCOM, Bunda College family for fellowship/friendship; the Kenyan
fraternity who made me feel at home away from home; my class mates -
Emma, George. Dzanja, Tchale, and the late Luhana, who were real comrades
in the academic struggle. Tchale also provided much required orientation to
Malawi. All the Bunda College Library staff with Mrs. Ngwira and Mr. Nyali
in the lead who took great pains to assist in accessing relevant information.
Rural Development Department staff; Messrs Lamba, Banda, Karid and Ms.
IX

Kajadza, for their assistance in innumerable ways and Ms. Lupanga who inter
alia typed most of the proposal under great pressure.
Others who can not escape mention include Fanny who lent me her bicycle for
the greater part of my second year and beyond when I had to commute to
college; Mrs. Mgaya for her moral and spiritual support; and Banyiyereka for
providing orientation to Malawi. Mrs. Beatrice James Banda who always
quickly typed clearance letters for me whenever I had to get out of the country
- she will linger in memory for having invited me to share dinner with her
family on that first and lonely Christmas day in Malawi, in 1994. To all of you
and countless others not mentioned here, my prayer is for your continued thrive
and prosperity in all your honorable endeavours in the times ahead. Finally,
1 thank the Almighty God for being ever gracious, ever faithful, and ever near,
from as far back as memory can go - surely ‘its not by might nor by power,
but by (his) spirit’, that these mountains, have thus far been removed.
x

DEDICATION
To my father George Gatundu, who first taught me the value of education
and hard work and my mother Peninah Wairimu, who first taught me the
value trusting in the Lord and leading a godly life - ndingihota kumucokeria
ngatho kuigana, no njugire Ngai witu aroTwika wakumurathima, tene na
tena.
x i

ABSTRACT
Liberalisation of food and agricultural markets has been a major component of
the Strucmral Adjustment Programs (SAP) in many African countries. In
Kenya, liberalisation of the maize market, a process that was completed about
three years ago, was one of the conditionalities for SAP funding. The motive
for liberalisation is to promote market efficiency. But there is no sufficient
quantitative evidence as to whether this goal has been realised or not. There is
need for research not only to assess this program, but also to provide
information for future policy formulation.
This study was carried out to examine the implications of market liberalisations
for market efficiency and agricultural policy in Kenya and to make
reccommendations for the future. The study looked specifically at liberalisation
of the maize market in Kenya. Market integration was used as an indicator of
market efficiency. The study employed correlation and cointegration analysis
to determine market integration. An Error Correction Model was used to test
for causality among markets and examine the occurence of central markets.
However, markets are complex institutions, affected by many factors besides
market integration. The study therefore also employed regression analysis to
determine structural factors that affect market integration.
XI1

The main data used is on retail prices from 13 markets in Kenya. Data spans
the period between 1992 and early 1996, thus covering both the pre and post
full liberalisation period. Data on determinants of market integration covers a
number of factors including distance between markets, transport and
communication network, price stabilisation policy and social disturbances.
The main lesson that emerges from this study is that market liberalisation has
increased the efficiency of maize markets in Kenya. Nevertheless liberalisation
on its own can not guarantee continued and increased market efficiency. There
are needs such as social tranquility, reliable transport networks and information
systems that need to be addressed if these efficiency gains are to be maintained
and furthered.
The main implications of the study include first that the private sector has
responded positively to maize market liberalisation and is running the market
towards greater market efficiency, contrary to past fears that it would be unable
to do so with negative implications particulary for food security. Secondly
efforts should always be made to curb social disturbances and improve
transport and market information systems to enhance efficiency of food and
agricultural markets in Kenya.
X I11

LIST OF ACRONYMS
ADF Augmented Dickey-Fuller Test
AFAA African Faculties of Agriculture Association
ASS Agricultural Statistics Section
BLUE Best Linear Unbiased Estimators
CBS Central Bureau of Statistics
CPI Consumer Price Index
CSRP Cereal Sector Reform Programm
DAAD German Academic Exchange Service
DF Dickey-Fuller Test
ECM Error Correction Mechanism
EEC European Economic Community
GDP Gross domestic Product
GOK Government of Kenya
IMF International Monetary Fund
KARI Kenya Agricultural Research Institute
KBC Kenya Broadcasting Corporation
KSC Kenya Seed Company
MIB Marketing Information Branch
MIS Marketing Information Services
MoALDM Ministry of Agriculture Livestock Development and Marketing
MoTCOM Ministry of Transport and Communication
x i v

NCPB
OLS
SAP
SPSS
USAID
National Cereals and Produce Board
Ordinary Least Squares
Structural Adjustment program
Statistical Package for Social Scientists
United States Agency for International Development
xv

CHAPTER I
INTRODUCTION
1.1 Background
Many African countries embarked on a series of adjustment policies beginning
mid 1980s to restore economic growth after years of economic stagnation that
had been brought about by external factors and internal policy distortions. In
Kenya as in many of her counterparts, liberalisation of input and produce
marketing has been a major component of the structural adjustment program.
Several policy distortions, most notably over-expansion of the public sector,
excessive public borrowing, heavy consumer and producer subsidies, in the late
1970s and the 1980s led to poor performance of Kenyas' economy during those
and later years (Swamy, 1994). The resulting economic scenario was one of
high current account deficits, high inflation, and a high debt service ratio,
among other things (Swamy, 1994). The situation required external funding to
correct such anomalies and retrace the path of economic development.
In the food and agricultural sector, price control was the norm and marketing
of major food commodities including maize, rice and wheat was the monopoly
of a parastatal, the National Cereals and Produce Board(NCPB). In the maize
sub-sector, prices of both maize and maize meal were controlled and movement
1

of maize across district borders was restricted. Maize milling was licensed by
the NCPB, which was also mandated with allocating milling quotas (Mukumbu,
1992).
Market liberalisation was a condition that was tied to the World Bank's
structural adjustment loans. In 1988 grain market liberalisation began and grain
movement controls were reduced and towards the end of 1993, all controls to
the domestic maize market were removed. International trade in maize is still
restricted to-date.
Several authors including most notably Mukumbu (1994), Sasaki (1995), NCPB
(1995), Mukumbu and Jayne (1995) have looked at issues relating to market
liberalisation in Kenya. Their findings generally point towards change in
consumer preference from the more costly sifted maize meal to the cheaper
whole grain meal, a drop in consumer prices, and entry of more millers and
traders. However the implications of this market liberalisation on the
performance of agricultural markets have not been sufficiently quantified. This
thesis examines liberalisation of the maize market in Kenya and provides
empirical evidence on its implications for market efficiency and agricultural
policy.
Kenya's economy grew fast in the first two decades of independence but slowed
down in later years. In 1970-1980 average annual growth rate of GDP was
2

6.4% but in 1980-1992, GDP grew at a slower rate of 4.0% (World Bank,
1994). Growth of the agricultural sector, the single most contributor to GDP,
seems to have followed a similar trend to that of the entire economy. In 1980-
1992 agriculture grew at a rate of 2.9% per annum down from 4.8% in 1970-
1980 (Swamy, 1994).
The problems that led to the aforesaid Kenya’s economic decline are many and
diverse. The two oil shocks of 1973 and 1979 contributed to the decline, but
macroeconomic policy distortions in the late 1970s and the 1980s are the
greatest cause. Swamy (1994) observes that by early 1980s the public sector
was over-extended. The author further observes that 'Kenyanisation' of
industries and the desire to industrialize rapidly created massive public sector
ownership. Marketing parastatals, most notably NCPB supported high
producer prices at all times and facilitated low consumer prices too. The
resulting deficits were paid by the banking system and led to over-borrowing
from international donor institutions.
Controls on grain movement generated rents for those who granted and
obtained licenses according to (Maritim, 1982; Swamy, 1994). Swamy argues
that other factors that worked to the detriment of the economy are a perverse
import licensing system and regulation on the business activities including over-
protection of some industries that were not only a great opportunity for rent
seeking but also strangled investment and growth.
3

The implications of these distortions were many and diverse. For one, the over
extended public sector became highly inefficient. Swamy (1994) argues that the
government had changed in the early 1980s from being a net provider of
investment to a net user of private savings to finance its investment and
consumption expenditure. The author observes that the current budget dwindled
to zero and that the current account deficit as a percentage of GDP increased
from 4% in the 1970s to 14% in 1980. Swamy further points out that:
‘Inflation which had averaged 3% in the first 10 years of independence
(in 1963), accelerated to 13% in 1981 and 22% in 1982... Borrowing
on relatively hard commercial terms expanded sharply, thereby
increasing the debt service ratio from less than 4% in 1977 to 13.2% in
1980'.
It is under this kind of economic scenario that the Kenya government sought for
structural adjustment funds. Liberalisation of input and produce marketing was
one of the components .of the structural adjustment program.
The process of market liberalisation, inclusive of price decontrol, has been on
in Kenya since the early 1980s. But it was not until 1988 when grain movement
controls were reduced that private traders were able to enter the maize market.
Movement controls of the level that existed before removal in 1988 were
reimposed in 1992 before final and complete removal in December 1993. This
tendency to occilate between divergent reform stands reflects the government’s
shaky stance on liberalisation. In this thesis, the terms pre and post
4

liberalisation are used to refer to the periods prior to and after full domestic
maize market liberalisation in December 1993 respectively.
The motive for liberalisation in general is to promote marketing efficiency. A
commodity market is said to be efficient when it satisfies a set of conditions
including: presence of many buyers and sellers; perfect flow of information;
homogeneity of product; and absence of barriers to entry and exit o f market
participants. But just how far this kind of situation has been realized in the case
of Kenya’s maize market is a question that requires to be addressed not only
to enable assessment of the liberalisation program, but also to provide
information that would be useful for policy formulation in the future.
This research provides the said information by performing an analysis on
integration of maize markets. In a nutshell, markets could be said integrated if
their prices are determined inter-dependently. Thus price changes in one market
will be fully transmitted to the other markets and prices will fluctuate together
in the long-run. A well integrated market is said to be efficient. A more
detailed discussion of the concept of market integration and its use in analysis
of market performance is given in the methodology. In this thesis, spatial
market integration as opposed to inter-temporal and vertical price integration
is referred to as market integration.
5

The scenario before price decontrol, removal o f grain movement restrictions
and the monopoly of NCPB in grain marketing was one of substantial spatial
price variations and inefficiency (Meilink, 1987; Maritim,1982). By examining
market integration before and after liberalisation, this study seeks to assess
whether or not the market is more efficient than before or not.
Information on market integration would also be useful to policy makers in
identifying central markets that could be targeted in formulating intervention
strategies to ensure food security particularly in times of national food
shortages. A central market is one whose prices can be used to forecast the
prices of a number of other markets. The concept of central markets is
discussed further in the methodology. This study examines the maize market
to find out whether there are any central markets, where they are located and
how market liberalisation has affected the occurrence of such markets.
However, markets are complex institutions, and market integration would be
affected by factors other than liberalisation which include marketing
infrastructure and production. The extent to which roads are passable for
instance will determine whether two markets are linked or not and so does the
physical distance between them. Dissimilar markets in terms of production are
likely to trade more than similar ones. All these and other factors affect market
integration and hence market efficiency. This research therefore, also examines
structural factors that determine the level of integration among maize markets
6

in Kenya.
1.2 Justification
There has been a general consensus that structural adjustments in ailing African
economies are necessary. But just how to implement them without sacrificing
key policy areas particularly with regard to food security and self-sufficiency
has been an issue. Skepticism and suspicion on the workability-of Structural
Adjustment Programs (SAPs) has been prevalent. It is no wonder that the
Kenya government's behaviour towards the SAPs particularly with regard to
maize market liberalisation has been one of intermittent commitment. It is
necessary therefore to quantify the implications of market liberalisation for
guiding further policy forrtiulation particularly with respect to SAPs.
Market segmentation is considered to be a reflection of an imperfect and
inefficient market. Market integration has for long been used as a measure for
market efficiency. Determining the extent to which markets in Kenya are
integrated or segmented would tell us the extent to which they are efficient or
inefficient.
Market liberalisation has the motive of increasing market efficiency. Policy
makers, donors, economists and market participants would want to know if and
to what extent this goal has been realised with respect to agricultural markets
7

in Kenya. Policy makers would also be interested in identifying central
markets that could be targeted in formulating intervention strategies to ensure
food security. Information on the same could be used to justify measures that
society may require to take to promote market performance.
Structural factors such as marketing infrastructure have been looked at as
determinants of market integration. The question that often arises is whether
liberalisation is enough to bring about marketing efficiency or there are other
factors that need to be addressed. There is need to examine factors that may
determine market integration in Kenya. This would give policy markers
guidance in targeting areas of resource allocation to enhance market efficiency.
Maize has been chosen for this study because of several reasons. For one,
maize is the staple food for the country and it is produced widely eve n in areas
that are ecologically unsuitable for production. Liberalisation of the maize
market has been a controversial issue and this would be understood since it is
a staple food commodity. It is therefore important to quantify its effects on the
market, not only to assess the policy but also to provide guidance for future
policy formulation.
8

1.3 Objectives of the Study
The general objective of the study is to examine the implications o f maize
marketing liberalisation on market efficiency and food/agricultural policy in
Kenya and to make recommendations for the future.
1.3.1 Specific Objectives
(1) To examine the effects of maize marketing liberalisation on market
integration and segmentation.
(2) To determine causality among maize markets and provide information on
central markets for maize in Kenya.
(3) To examine structural determinants of the integration of maize markets in
Kenya and,
(4) To discuss the implications of maize marketing liberalisation for
food/agricultural policy and to make recommendations for policy
formulation.
9

1.4 The Hypotheses .
The following hypotheses were tested:
(1) Market liberalisation has increased the efficiency of maize marketing in
Kenya;
(2) central markets for maize in Kenya are located in the major consumption
zones.
1.5 Thesis Outline
This thesis has six chapters. The chapter that follows gives an overview of the
agricultural sector and then delves into a more detailed discussion of the maize
sub-sector. The third chapter includes a review of literature on the Kenyan
maize market regulation and reform, market liberalisation and its policy
implications and structural adjustments as they relate to market integration. The
chapter also covers a review of studies on use of maket integration as a measure
of market efficiency, the concept of causality, determinants o f market
integration and the theoretical underpinnings of the various models used in the
study. Chapter four describes the analytical methodology used in this study.
Chapter five provides a presentation of the results and their discussion. The
thesis closes with conclusions, implications and policy recommendations in the
sixth chapter.
10

CHAPTER II
KENYA’S MAIZE SUB-SECTOR
This section provides a brief overview of the entire agricultural sector - first,
its structure and then its contribution to the economy. The greater part of the
section is however devoted to a discussion of the maize sub-sector, with
emphasis on organization of the maize market.
2.1 The Structure of Kenya's Agriculture
About 80% of Kenya’s dry land mass is range land, often referred to as arid
and semi arid lands (ASAL). This portion of the country is unsuitable for arable
farming mainly because of low and unreliable rainfall. These range lands
support about one quarter of the total human population, slightly over half of
the livestock population, and the bulk of the country's wildlife.
Within the country there is a great variety of modes of production, varying
from large plantation operation to small holder subsistence farming. But
generally, the structure of the agricultural sector can be described as being
dualistic with small-scale farmers/farms on the one hand and large-scale
11

farmers/farms on the other1. Most of the arable land is under smallholders.
Swamy (1994) observes that there were 3500 large farms accounting for 39%
of cultivable area in 1979. Large scale farmers keep cattle under ranching,
grow wheat, maize, horticultural produce, sisal, tea and coffee. The small
holders keep small numbers of livestock and grow crops mainly maize and
beans for subsistence and tea and coffee among other cash and food crops. An
interesting thing is that, except in the ASAL, virtually all smallholders grow
maize (Odhiambo, 1994) and this underscores the place of this crop in the
economy.
2.1.1 The Role of Agriculture in the Economy
Agriculture has been called the backbone of Kenya's economy and over the
years, agriculture has been the single most contributor to the country's Gross
Domestic Product(GDP). Kenya's agricultural policy has encompassed the
broad objective of ‘attaining food security and a nutritionally adequate diet for
every member of the population’ (Government o f Kenya 1981, quoted by
Meilink 1987). Meilink notes that the specific objectives under this broad
objective outlined in the governments ’Sessional Paper Number 4' on national
food security were as follows:
1 CBS categorises small-holdings as tracts of land less than or equal to 30 acres (Sasaki, 1995). This of course does not apply in most range lands where land is communally owned.
f12

- Maintain a position of broad self sufficiency in the main
foodstuffs in order to enable the nation to be fed without
using scarce foreign exchange on food imports;
- Achieve a calculated degree of security of food supply for each
area of the country;
- Ensure that these foodstuffs are distributed in such a manner that every
member of the population has a nutritionally adequate diet.
Stringent control of the food market was considered to be one o f ways of
ensuring that these objectives were realised.
Although the contribution o f agriculture to GDP has been declining over the
years from 45% in 1963 to 28% in 1992 (Government of Kenya (GOK). 1993),
agriculture is still the single most contributor. Moreover, 75% of the
population is dependant on agriculture for employment (Egerton University,
1995) and the bulk of household food needs are met from domestic production.
A more productive agricultural sector will no doubt imply higher incomes, food
security and contribute to other aspects of economic development.
13

2.2 Maize Utilisation in Kenya
Maize is a staple food in Kenya. It is consumed in all parts of the country and
comprises about 24 percent of total value of food consumed in rural households
and about 8 percent in urban households (Ephanto, 1992). Ephanto estimates
per capita consumption of maize at 98 kgs and 111 kgs for rural and urban
areas, respectively. Odhiambo estimates that 70-75% is consumed in flour form
either cooked as ugali (a thick porridge) or uji (ordinary porridge). Other than
in flour form, maize is consumed in mixtures with various pulses including
beans and peas.
Maize is also used in making local brews, cooking oils and animal feeds. The
country has quite often been self-sufficient in maize and has sometimes sold to
the international market although the latter may not be foreseeable in the near
future as consumption is increasing with rise in population. This becomes clear
as one looks at past trends in maize production.
2.2.1 Maize Production Trends and Productivity2
Maize is grown in almost all agro-ecological zones in Kenya with production
taking place under smallholder and large scale farming systems. About 75-80%
of national maize production comes from smallholder farms while the
2 This sub-section draws a lot from Odhiambo (1994).
14

remainder is attributed to the large scale sector (Odhiambo, 1994). Odhiambo
further observes that smallholder production is largely consumed with only
about 30% marketed surplus as compared to large scale production with about
80-90%. However, since smallholders occupy the bulk (about 85%) of total
land under maize, they contribute the larger proportion of national marketed
output estimated at 60% or more (Sasaki, 1995).
Maize acreage and production have generally been increasing since 1970
reaching a peak around 1.5 million hectares in 1994 (Table 2.1). Nevertheless
acreage seems to have been declining since 1989 and production since 1986.
Production has been increasing mainly due to increase in acreage and higher
yields related to adoption of high yielding varieties. National output has
expanded reaching about 2.9 million tons in 1986 then declining for a number
of years. However production seems to be recovering since 1994 when it was
about 3.1 million metric tons (Table 2.1). Productivity has been low with
yields averaging at about 2 tons/hectare. Since 1970 yields have fluctuated
between 1.5 and 2.42 tons per hectare, while generally declining from 1986
onwards.
Improved varieties of maize suitable for different agro-ecological zones have
been developed at the Kenya Agricultural Research Institute (KARI) stations
notably in Kitale, Embu, Katumani and Mtwapa. It is estimated that about 71 %
of the farmers in Kenya have adopted high yielding hybrid and composite
15

varieties (Odhiambo, 1994).
A parastatal known as The Kenya Seed Company (KSC) is responsible for
production of the maize seeds with KARI being in charge of quality testing and
control. Over the last few years, farmers and extension workers have accused
the KCS of producing seed of low viability and if unchecked this could erode
farmers confidence in the parastatal and affect maize production adversely, as
this could force farmers to select their own maize seed from past harvests.
It is surprising to note that whereas hybrid variety adoption rates are relatively
high, yields remain rather low. Several factors may have contributed to this
scenario and the decline in output and acreage. These factors include low
rainfall, poor husbandry practices, rising costs of inputs resulting in their
decreased use among farmers, disincentives arising from poor policy
formulations and delays in payment by NCPB (Schluter, 1984; Odhiambo,
1994).
2.2.2 Maize Production Patterns and Calendars
Although maize acreage and production have generally been increasing as
pointed out earlier, this has been more of the case in the surplus Western zone
than in the rest of the country which is largely a deficit zone (Gitu, 1992).
16

Table 2.1: National maize area, production and yield
Y e a r A re a(0 0 0 s H e c ta re s )
P ro d u c tio n (0 0 0 s T o n s )
Y ield(Ton/Ha)®
1 9 7 0 7 3 9 .0 1 1 0 7 1.50
1971 7 0 8 .0 149 4 2.11
19 7 2 7 6 8 .2 1 3 3 2 1.73
197 3 7 8 0 .0 1 2 9 6 1.66
1 9 7 4 7 6 3 .7 1413 1.85
197 5 7 7 9 .0 1 6 9 2 2 .1 7
1 9 7 6 8 5 3 .0 174 6 2 .05
1 9 7 7 1 0 0 2 .0 2 0 7 9 2 .1 0
1 9 7 8 8 7 5 .0 1 7 3 7 2 .0 0
1 9 7 9 9 3 8 .0 160 2 1.71
1 9 8 0 1 1 2 0 .0 1773 1.58
1981 1 2 0 3 .0 2 5 0 2 2 .08
1 ,9 8 2 1 2 3 6 .0 2 3 4 0 1.89
1983 1 2 0 0 .0 2 1 3 3 1.78
198 4 1 1 3 0 .0 1422 1.26
19 8 5 1 2 4 0 .0 2 4 3 0 .1 .9 6
1 9 8 6 1 2 0 0 .0 2 8 9 8 2 .42
19 8 7 1 2 0 0 .0 2 4 1 6 2.01
19 8 8 1 2 3 0 .0 2761 2 .2 4
1 9 8 9 1 4 2 0 .0 2 6 1 0 1.84
1 9 9 0 1 3 8 0 .0 2 2 5 0 1.63
1991 1 3 1 0 .0 2 3 4 0 1.79
199 2 1 4 0 7 .0 2 4 3 0 1.73
1993 1 3 4 3 .5 1755 1.31
1 9 9 4 1 5 0 0 .0 3 0 6 0 2 .04
1995 1 4 3 8 .7 0 2 6 9 9 1.88
Note: Source; Gitu (1992) for 1970 to 1988; Government of Kenya MOALDM (1996) for 1989 to 1995; a - Yield figures are own estimates.
17
Maize production and yield in Kenya varies with agro-ecological zones which
differ due to diversities of altitude, rainfall, temperature and soils. With respect
to maize production, Kenya can be divided into Eastern and Western
regions/zones. Odhiambo (1994) observes that the Western region comprising
the Rift-Valley, Western and Nyanza Provinces produces over 60% of the
country’s maize while the rest of the country produces about 40% or less.
Estimates show that the Rift-Valley Province leads the rest of the provinces
with 45-50% of the national maize output, followed by Western Province with
about 15%, Nyanza (12-15 %), Eastern (8-14%), Central (8-10%) and Coast
(2-5%) (Odhiambo, 1994 citing Ackello-Ogutu and Odhiambo, 1986 and Gitu,
1992).
Due to agro-ecological diversity, some parts of the country have two growing
seasons whereas others have one related to bimodal and monomodal patterns
of rainfall. The lengths of growing seasons also differ. With the exception of
Rift-Valley and parts of the Coast province, all other areas have at least two
harvests in an year (Maritim, 1982: Kliest, 1985).
Unreliability and poor distribution of rainfall greatly affects the crop in some
arid and semi-arid pans of Eastern. Coast and the Rift-Valley Provinces to the
extent that some seasonal harvests fail altogether. North Eastern Province is too
arid to be suitable for rain fed agriculture. In most of the Rift-Valley Province,
maize is normally planted once during the long rains beginning in March
18

through April and harvested in September through October. Virtually all
smallholders in maize growing areas plant some maize in the long rains and
harvest in July through September. During the short rains beginning in
October (essentially the long and more reliable rains for most of Eastern
Province) about 65% of farmers plant maize (Odhiambo, 1994 citing Ackello-
Ogutu and Odhiambo, 1986). Harvest then occurs in December through
February for this short rains crop.
2.2.3 Regional Maize Sufficiency
The Western surplus zone comprises of the Rift-Valley districts of Trans-Nzoia,
Uasin-Gishu, Nandi, Nakuru, Kericho, and part of Kajiado district
(Oloitokitok) which is an occasional surplus area, Western province districts of
Kakamega and Bungoma, and Nyanza province districts of South-Nyanza and
Kisii (Odhiambo, 1994; Argwings-Khodek, 1992; Mukumbu and Monke,
1993). With the exception of Nyandarua district in Central province which is
a maize surplus area, and Meru and Embu in Eastern province that are
occasional surplus districts, the Eastern maize zone is a deficit region (Ephanto,
1992; Odhiambo, 1994; Maritim, 1982; Kliest, 1985).
19

2.3 Organisation of the Kenyan Maize M arket
On average, rural households (which make up 75% of the population), procure
40% of their maize requirements from the market and the rest from their own
production (Ephanto 1992; Maritim, 1982). Given the variations in maize
production and sufficiency in Kenya, it is necessary that a continuous flow of
grain from the western surplus to the eastern deficit zone and major urban areas
be maintained, to ensure availability.
2.3.1 M arket Structure
As mentioned earlier the Kenyan maize market is characterised by duality with
NCPB serving mainly the large scale producers and millers and the informal
market serving the bulk of small scale farmers and rural consumers. There is
evidence that with market liberalisation the market share of NCPB has been
gradually declining from 40% of marketed output before the liberalisation
program began to 30% in 1991-1992 partial liberalisation period
(Odhiambo,1994). It is expected that the market share of NCPB will shrink
even further with full liberalisation.
Odhiambo (1994) estimates that 70% of the smallholders sell their maize
through the informal system and only 30% have access to NCPB. On the other
hand large scale farmers sell 70% of their marketed output to NCPB. The
20

board was meant to handle all marketed maize but even in the strict control
period it was unable to do so. The task of NCPB of providing maize to deficit
areas and stabilizing prices was left to the informal market as 90% of all
quantities sold to NCPB went to maize millers (Meilink, 1987; Maritim,
1982).
2.3.2 Maize Marketing Flows and Channels3
Generally maize flows from the Western surplus to the surrounding deficit
areas and to the Eastern deficit zone. Other than that flow of maize occurs from
the occasional surplus areas of the (otherwise) Eastern deficit zone to the
chronic (or near chronic) deficit areas of the same zone.
The NCPB buys maize from surplus areas and stores it in (the boards) stores
in those areas or transpons it by rail or by road using its appointed agents, to
stores in deficit areas (NCPB, 1996). The stores are open to purchase of small
volumes of maize by the public although the main buyers are millers. The
NCPB’s appointed agents also operate stores where they are supposed to buy
maize from small scale producers in surplus areas and sell to consumers in
deficit areas. Maritim (1982) however observes that this channel has been very
unreliable and some consumers in deficit areas did not know of any NCPB
agents.
3For a detailed description of the marketing channels, see Odhiambo (1994).
21
In the informal system the key participants are small scale market traders and
medium to large scale lorry traders or wholesalers (Maritim; 1982; Argwings-
Kodhek, 1992). The lorry traders and wholesalers buy maize from surplus
areas both near and far. Argwings-Kodhek observes that lorry traders move
maize between areas as far apart as Oloitokitok and Kitale (a distance of about
720 km) so long as a profit margin exists. The author also shows that there is
a lot of movement between the Western surplus zone and the Eastern deficit
zone. In the wholesale trade, maize is sold in 90 Kilogram bags. In the retail
setting 2 kilogram Kimbo or Cowboy tins commonly known as gorogoros seem
to be universal units of measure although 1 kilogram such tins are also used in
some parts of the country (Odhiambo. 1994).
2.3.3 International Trade in Maize
Kenya is about self-sufficient in maize in most years. Over the years occasional
surpluses have called for exports and deficits have necessitated imports. Such
international trade has been solely in the hands of the NCPB until full domestic
market liberalisation in December 1993. Table 2.2 shows the volume of the
NCPB’s exports between 1984 and 1995. Unfortunately imports data were not
available.
22

Table 2.2: International trade in maize; exports by
NCPB
Year Expons (90 kg bags)
1984/85 0
1985/86 1120
1986/87 239259
1987/88 105731
1988/89 269964
1989/90 170694
1990/91 75653
1991/92 0
1992/93 0
1993/94 0
1994/95 0Source: NCPB (1996)
In the post-liberalisation period the private sector (mainly millers and
middlemen), has joined in the international trade. However, intermittent bans
to private sector participation in this trade have been the norm, eroding the
sectors confidence in the state’s handling of this trade and contributing to
domestic market inefficiency. Nevertheles millers imported 905,000 metric
tons of maize in 1994 (NCPB, 1996) mainly from South Africa and Zimbabwe
albeit with heavy dumping duty.
Kenya's past participation in international trade not withstanding the possibility
of the country becoming a regular maize exporter are slim. The nation's maize
23

requirements are increasing with increase in population. Although acreage is
unlikely to increase significantly given current pressure on land, yields may
increase with new technology. However, this increase is unlikely to overcome
the increasing requirements in normal years. Moreover Kenya's maize
producing districts are at least about 500 km from the coast and high transport
and production costs coupled with fluemating production levels offset its
participation in international maize trade (Odhiambo. 1994; Shlutter, 1984).
2.3.4 Maize Storage
Both in the pre and post-liberalisation periods, the NCPB has operated more
than 100 depots scattered all over the country (Odhiambo, 1994) with a total
storage capacity of 20 million bags equivalent to about 1.8 million tons (NCPB,
1996). This storage network of silos, conventional stores and Cyprus bins has
been used largely for storage of maize and wheat. According to NCPB sources,
quite often only half of the capacity is in use, the rest being idle or being
utilised by relief institutions.
In the pre-liberalisation period the private sector in general including millers
was not allowed to store Maize. The government viewed storage by middlemen
including millers as maize stored in unsafe hands which could be smuggled out
of the country or used for purposes other than human consumption (Argwings-
Kodhek, 1994; Maritim, 1982). This kind of policy undercuts the ability of the
24

millers and the informal market to store maize. Paradoxically, one of the
arguments against market liberalisation has been that the private sector does not
have the capacity (including enough storage) and commitment for the trade in
maize.
Nevertheless, there is plenty of storage capacity in the hands of farmers and
traders and the potential for creation of more capacity exists. Sasaki
(1995)observes that physical capacity is not a binding constraint for farmers in
storing maize on the farm and shows that small scale farmers have the capacity
and large scale farmers would probably be able to finance building stores if
necessary. He further observes that some farmers are setting up new stores.
Indeed small scale farmers have always stored their maize both for domestic
consumption and for sale (Maritim, 1982; Argwings-Kodhek, 1994;
Mukumbu, and Monke, 1993).
Traders on the other hand have tended to store maize for spatial arbitrage other
than temporal arbitrage that would be more of the case in the free market
(Argwings-Kodhek, 1992: Mukumhu and Monke, 1993). The reasons for this
are obvious given the market restrictions prevalent before full liberalisation and
the risks and uncertainties involved in storing large quantities of maize for long
periods. But it is definitely a pointer to the potential among traders for even
greater storage levels for temporal arbitrage.
25

Currently, NCPB has been under pressure to release some of its stores to the
private sector. The board has actually hired out some 11 depots, 5 to famine
relief agencies the rest to third parties particularly farmers and is re-adyertising
more (NCPB, 1996). However the board is not offering strategically placed
facilities particularly in surplus areas to the private sector but is only offering
facilities in deficit areas (NCPB. 1996; Ojiambo, 1996). Such depots may not
be very suitable for trade and may explain why the private sector is not taking
the offer seriously.
2.3.5 M arket Information4 •
One of the assumptions of a perfectly competitive market is that there is perfect
flow of information. This underscores the role of information in marketing. In
maize marketing, farmers need information on prices and supply of inputs,
expected produce prices, and government regulations relating to production and
marketing. Traders require information on prices of maize, demand and supply
situation, spatial and seasonal price variations both in the current and the future
periods and government regulations related particularly to procurement and
movement of maize. Consumers and millers require information on prices and
their variation in space and time and any regulations governing the market.
1 This sub-section draws mainly from discussions made with staff at both Central Bureau of Statistics (CBS) and the Marketing Information Branch (MIB) of the Ministry of Agriculture, Livestock Development and Marketing (MoALDM) during the period of data collection for this thesis.
26

There are several sources of information about maize marketing in Kenya.
Odhiambo (1994) outlines them as follows:
(i) The mass media.
- Radio and Television.
- Daily Newspapers.
(ii) Extension Workers.
(iii) Provincial administration - Provincial Commissioners, District
Commissioners, District Officers, chiefs etc.
(iv) Market Participants.
(v) Transporters.
(vi) Superintendents and Supervisors in local government market places.
(vii) Special government publications such as:
- MIB/CBS monthly market Bulletin.
- The Kenya gazette.
The Marketing Information Branch (MIB) of the Ministry of Agriculture
Livestock Development and Marketing (MoALDM) and the Agricultural
Statistics Section of Central Bureau of Statistics (CBS/ASS) are the major
sources of market information. The two bodies collaborate through the Market
Information System (MIS) co-sponsored for the last few years by USAID and
the government.
27

The MIB collects early morning wholesale prices of about 40 commodities in
the major markets in Kenya during the week days. These prices are then faxed
to the MIB headquarters in Nairobi where they are entered into a computer
data base. The same prices are tabulated and faxed by noon to the 2 major
newspapers ‘The Nation’ and ‘The Standard’ and the Kgnya Broadcasting
corporation (KBC).
The newspapers (particularly The Nation) print out the tables from Tuesday
through Saturday. The state owned radio station, Kenya Broadcasting
Corporation (KBC) announces the prices after the 1300 hours news bulletin
and sometimes after the 1900 hours bulletin too. But KBC price broadcasts are
on and off and sometimes disappear for many months before resuming.
The CBS/ASS collects weekly retail prices of about 9 crops including maize,
beans, irish-potatoes, cabbages and tomatoes. The information is mainly used
for calculation of consumer price indexes. The MIS a joint venture of
CBS/ASS and MIB began publishing a 'Monthly Market Bulletin' in mid 1993.
The Bulletin carries an overview of the past months market situation for major
crops, a brief description of price collection methodology together with graphs
and tables showing price trends for a few crops. The bulletin concentrates on
urban market prices and is distributed mainly to personnel in the MOALDM,
CBS, Marketing and Statistics Staff at district level (Odhiambo, 1994). The
MIS bulletin which was issued free of charge was supposed to begin selling at
28

Ksh 100 early in 1994 to meet production costs (GOK/MIS, 1993). During
collection o f data for this thesis early 1996 the bulletin was not being published
and had not been released for several months.
It seems that market information available in Kenya is insufficient as a
backbone for informed decision making among maize market participants.
Quite often information is availed intermitently and covers major urban markets
only. Most o f the market information available in Kenya has to do with prices.
Very little information on forecasts, or market regulations is disseminated. The
information system certainly requires improvement if it is to contribute
effectively to increasing the efficiency of food/agricultural marketing in Kenya.
29

CHAPTER III
LITERATURE REVIEW
This chapter provides a review of literature on the Kenyan maize market
regulation and reform plus market liberalisation and its policy implications
mainly in Kenya. Also reviewed is the use of market integration as a measure
of market efficiency, and existing literature on causality among commodity
markets. The review also explores studies on structural factors that affect
market integration. But before discussing these issues, a review of the well
known structural adjustment programs as they relate to market liberalisation in
Sub-Saharan Africa is needed.
3.1 S tructural Adjustment Programs and their Relation to M arket
Liberalisation
As pointed out earlier economic stagnation in many African countries led to the
adoption of the World Bank sponsored Structural Adjustment Programs (SAPs)
beginning mid 1980s. Grain market liberalisation has often been one of the
conditionalities tied to structural adjustment funding.
30

Structural adjustment refers to reforms of policies and institutions covering
microeconomic (such as taxes and tariffs), macroeconomic (fiscal policy), and
institutional interventions; these changes are designed to improve resource
allocation, increase economic efficiency, expand growth potential, and increase
resilience to shocks (World bank, 1988). These adjustments which have been
mainly the World Bank and IMF’s solutions to economic problems of
developing countries (World Bank. 1992), have been necessary both to respond
to various shocks (external or internal) and to rectify inappropriate policies that
have hampered economic performance of the said countries (World Bank,
1990). Structural adjustments have invariably involved lending from the said
institutions generally to support import financing and sectoral changes (World
Bank. 1990).
Short term adjustments are associated with stabilization programs usually
identified with the IMF and operate mostly upon demand, while medium to
long-term adjustments are associated with structural adjustment programs of the
World Bank which typically operate on the supply side (Green and Faber,
1994; and Mule. n.d). The World Banks programs initially concentrated on the
production structure but later spread its conditionalities into institutional reform
(Green and Faber, 1994). Reviewing adjustment in seven African countries
including Kenya, World Bank staff Faruqee and Husain (1994) observe that in
the said countries, ‘adjustment programmes generally included reforms to:
31

- establish a market determined exchange rate.
- bring fiscal deficit under control and privatise public investment.
- liberalise trade and tariff policy, liberalise agricultural price and marketing,
deregulate internal prices, and similar measures.
- improve financial sector policy.
- improve the efficiency of public enterprises and labour markets.
- improve the coverage and quality of social services’.
The conditions that led Kenya to go for structural adjustment loans have been
outlined elsewhere in this thesis. In Kenya, SAPs began being implemented
around 1986 and liberalisation o f the maize market began in 1988. In most
cases, structural and sectoral adjustment lending has been tied to
conditionalities that the recepient governments have been required to fulfill
before the funds are disbursed. On liberalisation of agricultural prices and
marketing, SAP reforms sought to disengage the government from marketing
and processing activities (Swamy, 1994). Swamy further observes that in the
grain market, reforms had the stated aim of having all trade managed by the
private sector with deregulated prices, in which case the NCPB would maintain
a limited stock for price stabilization and floor prices as the farmers’ buyer of
last resort. But as pointed out earlier, the governments commitment to this and
other reforms was at best intermittent.
32

3.2 Maize M arket Regulation and Reform
This sub-section covers a brief discussion on the maize market regulation along
with the implications of the same, before delving into the recent reform.
3.2.1 Maize M arket Regulation
In Kenya, food and agricultural prices were for a long time set by the ‘price
controller’ in the treasury until 1986 when a price decontrol programme began
to be implemented (Meilink, 1987). Controlled commodities included maize,
wheat flour, milk, rice, sugar, cooking oil, and beef. Government interventions
in the maize market predate World War II. They can be traced back to the
‘Defence Regulations’ of 1944 and the ‘Maize Marketing Bill’ of 1958
(Hesselmark, 1977). The Marketing Bill led to the formation of the Maize
Marketing Board now the National Cereals and Produce Board. The original
(1944) maize market regulations had the clear objective to produce and export
surplus for the allied war effort (Hesselmark, 1977). After the war however,
the maize control organisation continued to exist and has existed to the present
day albeit under different names.
The Kenya government had for many years argued for continued market
control based on fears that price instability would lead to a decline in
production and that market failures would lead to exploitation of the producers
33

and consumers by middlemen. Market control of maize was a major component
of risk sharing arrangement between European maize farmers and the colonial
government in the pre-independence era, and a means of securing and resettling
loans in post independence era (Argwings-Kodhek, 1994; Hesselmark, 1977).V
With time however, some policy changes took place but until the start of the
Cereal Sector Reform program (CSRP) in 1986, the maize market had been
under diverse restrictions. The most notable of these restrictions are movement
controls, price controls and in the milling front issuing of milling quotas.
Movement controls restricted private transfer of maize across district and
provincial boundaries without a permit from the NCPB. Pan-territorial and pan-
seasonal prices were established annually by a price review committee for every
level of the marketing chain (Argwings-Kodhek, Mukumbu and Monke, 1993).
Such price controls provided very narrow profit margins and served as dis
incentives for private traders. Registration of mills and allocation of milling
quotas was the mandate of NCPB. The main constraint to entry into large scale
Maize milling was the license from NCPB required for construction and
operation. This license could take four or more years to acquire (Mukumbu,
1992), definitely posing an indirect barrier to entry.
By and large the situation under maize market control was one of monopoly
under the NCPB. The board purchased about 25% of total maize annual
national production and 45% of total marketed output (Mukumbu, 1992;
34

NCPB. 1996).
The original stipulated role of the NCPB was to hold minimum stocks of grain
for smoothing sharp price increases in consumer prices in poor harvest years
and to be a buyer of last resort for producers. In practice, however, the NCPB
was a buyer of first resort operating at prices close to and sometimes higher
than import parity (Meilink, 1987; Swamy, 1994) and pushing out possible
private trade contenders. Yet the board was unable to implement its pan
territorial and pan-seasonal maize prices and to supply particularly the rural
population with maize despite its favoured position. Thus it left 55% of maize
marketed output to the informal and ‘illegal’ market operated by private traders
albeit under very restrictive and implicitly very high cost circumstances.
International trade in maize was also in the hands o f the NCPB, which alone
had the mandate to either export or import this commodity. Until December
1993 the private sector was not allowed to enter the international maize market.
To this day the governments comitment to allowing private sector participation
in International trade in maize has at best been on and off.
The NCPB’s high deficits would be largely attributed to losses in international
trade, not to mention national inconveniences when the board exported maize
just prior to famine imports and food aid periods (Argwings-Kodhek, 1994;
shlutter, 1984). Paradoxically even in the post-liberation period the NCPB has
35
continued this practice. In March 1996 for instance the board was still
exporting four million bags of maize (NCPB, 1996; Ojiambo, 1996) even after
a national alarm on impeding maize deficit due to poor harvest in 1995 and a
subsequent ban on exports in January 1996. Incidentally even after freeing the
market of controls government interventions in international trade remains to
this day. The aforementioned ban on private sector exports coupled with the
fact that the NCPB was allowed to continue exporting maize during the same
period is sufficient testimony to this.
3.2.2 Implications of M arket Regulation for M arket Efficiency and
National Resource allocation
The end result of state market interventions has been the existence of a dual
marketing arrangement composed of the official market supported by NCPB
and with its official (subsidised) prices that reach the urban consumer
population and the informal arrangement with prices set by market forces that
has prevailed for the majority of Kenyans - the rural folk. This has implied
induced food insecurity for the rural populace. Several authors most notably
Argwings-Kodhek (1992). Maritim (1982) and Meilink (1987) highlight on this
duality.
Restricted maize movement has resulted in substantial price variations even
between adjacent rural markets (Meilink. 1987; Maritim, 1994). Such price
36

differentials could be attributed not only to the distance between such markets
but also to the permit costs which were sometimes as high as 32% of transport
costs (Argwings-Kodhek, 1992).
The transport permits were not only expensive but rarely issued and the ris k of
bribes, jail or fine for carrying more than the legal capacity or offering bribes
to some incorruptible policemen raised the price differentials even further. Thus
policy driven market inefficiency led to some degree of food insecurity
particularly in pre-harvest periods when the rural populace could not acquire
grain at affordable prices, mis-allocation of public resources and loss of (social)
welfare particularly for the majority of the rural poor.
On the milling front the board sold more than 80% of its stocks to large-scale
sifted maize millers and provided more than 70% of the mills’ maize grain
requirements (Mukumbu. 1994). The board was mandated to license any new
milling company and through its set prices implicitly dictated the situation of
mills in the consumption zones adjacent to NCPB silos. Pan-territorial and pan-
seasonal prices and small trade margins meant that locating firms away from
consumers would be impeded by too high transport costs. Mukumbu (1992) for
example shows that 76.5% of the large-scale milling capacity is located in the
maize deficit zones.
37

This has resulted in excess (and idle) milling capacity due to spacial monopolies
created by uniform prices. It is estimated that the current sifted maize meal
production capacity is 1,135,884 tons, which is more than five times the
national requirement estimated at 255,103 tons (Mukumbu, 1992). The funds
used to create this kind of capacity have in essence gone to waste.
Millers faced problems of delay in registration and procurement of maize from
the boards stores. The latter would often result in loss of consumer confidence
and market share (Mukumbu, 1992). Mukumbu also points out that the poor
quality of maize delivered to the mills and long delays in payment of millers
underweight implied high costs to the millers.
Post-liberalisation studies (Mukumbu, 1994; NCPB, 1995) point out that
consumer preference is shifting from the refined sifted maize meal to the whole
meal, locally referred to as posho. Indeed Mukumbu and Jayne (1995) view the
assumed preference for the former to have been policy driven rather than real.
Past policy particularly the low consumer prices of sifted maize meal rendered
it more affordable and an obvious option particularly for the urban consumers.
In essence the implied consumer subsidies were a mis-allocation of public funds
as they hindered free articulation of consumer preference which seems to be for
the lower cost posho.
38

On the macroeconomic front the implications of NCPB's monopoly and
subsequent market distortions have been wide and far reaching. The board has
been a major drain on government budget and the economy as a whole. All
along, the high producer prices and low consumer prices (Meilink, 1987), high
transport and other operational costs have been met by the government
(Swamy, 1994; Maritim, 1982) with a big drain on the budget.
In international trade, the board has experienced problems too, and often
incurred heavy losses in subsidising the international trade. By the end o f 1988
financial year Ksh 2.538 billion (75%) of the Ksh 3.394 billion total
accumulated deficit of NCPB for the previous 3 years could be attributed to
international trade (Argwings-Kodhek, 1994. citing Koitaba 1989). Besides
such losses NCPB has been blamed quite often for miss-timing exports that take
place just prior to heavy imports and food aid (Argwings-Kodhek, 1994;
shlutter. 1984).
Swamy (1994) estimates that NCPB's deficit as a percentage of government
expenditure was 1.3 in 1983-1984 and grew to 2.3 in 1991-92. He observes
that by 1987, the board had an accumulated debt exceeding 5% of GDP which
was ' written o ff or taken over and paid by the government. Argwings-Kodhek
(1994) observes that subsidies to the board had grown to account for 20% of
the public sector budget deficit in the last decade.
39

It is no wonder then that external donors notably the World Bank, EEC,
USAID and the IMF have been concerned with the cereal sector reform. This
is evident from the conditionalities for disbursement of their funds that were
actually related to the sectoral reform (Argwings Kodhek, 1994). Most of these
funds were structural adjustment loans and it is understandable that the
international community was tired of seeing their funds sinking to the sustaining
of recurrent expenditures of a marketing board whose efficiency was going
downhill daily.
3.2.3 Maize M arket Reform
Donor institutions were not the first to point out the need for reform of the
maize market. Demands for a free market date back to the 1960s, as do
recommendations for reduced role of the NCPB (Hesselmerk, 1977). Swamy
(1994) observes that the presence of the NCPB continued to be pervasive,
despite recommendations of at least seven commissions since 1942, to reduce
the role of the state in grain marketing.
In 1985 the Cereal Sector Reform Program (CSRP) was launched aimed at
gradually increasing the private sector's participation in the cereals market and
later freeing the market altogether (Mukumbu, 1994). The cereal board s role
was to be reduced to holding strategic reserves to smooth out sharp consumer
price rises in poor harvest years and to be a buyer of last resort, maintaining
40

floor prices for producers (Swamy, 1994).
Swamy(1994) cites design flaws and lack of commitment as having been
impediments to this reform. The board continued to buy maize at prices close
to import parity and subsequently it remained the buyer of first resort for
farmers. Proponents of market reform may have underestimated the role of
various interest groups that would opt for marketing board's monopoly.
Argwings-Kodhek (1994): Mukumbu and Monke (1993) observe that most
often urban consumers will be well cared for by state marketing board. They
further add that some members of the government benefit from the boards in
the form of employment opportunities or transfers associated with rent seeking.
In the Kenyan situation where NCPB got 70% of its maize supply from large
scale farms (Odhiambo, 1994), any turn of events in the maize market would
be carefully watched by the rich (and almost always politically well connected)
large-farm owners. For instance, in October 1992 just two months to the
multiparty elections, the maize movement controls were fully reimposed after
years of gradual removal, only to be removed again a year later. Mukumbu
(1994) observes that this reimposition may reflect concerns about the loss of a
powerful political and economic tool that has been used to gain and repay
political favours.
41

According to the GOK/EEC five year action plan which started in 1988, partial
liberalisation was to progress gradually to full grain market liberalisation by
1993 (Odhiambo, 1994). The EEC sponsored Cereal Sector Reform Program
(CSRP) went on well for beans and wheat markets which were fully liberalised
by the end of 1992. However the maize market reform has been very slow and
controversial involving deviations from the program and opposition from
powerful political groups (Argwings-Kodhek, 1994; Mukumbu, 1992;
Odhiambo, 1994; Swamy, 1994).
Before the start of the CSRP, individuals were allowed to move only two-90
kilogram bags of maize per trip. This was raised to 4 bags in 1988, under the
CSRP. The limit of maize movement without a permit was raised to 40 bags in
1988/89 and later to 44 bags in February 1991. In April 1992. the restriction
limit was raised to 88 bags but the 2 bag rule of pre-CSRP was reimposed in
October 1992 just prior to the multiparty elections two months later. The
scenario persisted up to October 1993 when the limit was raised again to 88
bags before a final full market liberalisation was instituted on 27th December
1993. In the milling industry, millers were allowed to procure up to 20% of
their maize requirements directly from farmers or traders and the remaining
80% from the NCPB in 1988/89 (Odhiambo, 1994). This was raised to 30%
and 70% respectively in 1990/91 (Mukumbu, 1992) before a final decontrol in
December 1993.
42

The World Bank, USAID and EEC through CSRP had over US $ 300 million
in aid earmarked for Kenya, but this was tied to grain market liberalisation
(Argwings-Kodhek, 1994). In 1991 the donor institutions suspended aid
disbursement to Kenya for failing to meet aid-related conditionalities among
them being market liberalisation.
By the end of the day the donors seem to have prevailed and the maize market
was freed o f all controls. The questions that need to be addressed now relate
to the implications of this reform not only on the maize market but also on
policy - this practice could have far reaching effects not only on the maize
market but also on other sectors of the economy.
At the beginning of 1996, NCPB was going through restructuring to enable it
carry out the new role of being the buyer and seller of last resort, and keeping
a strategic grain reserve of 3 million bags (NCPB, 1996). The same source
observed that government intentions were to fully commercialise the NCPB by
the end o f the year and it is in this respect that the board was reducing its
storage capacity and had reduced its staff from 4150 to 3000 by the end of
March 1996. How the NCPB could be fully commercialised and at the same
time remain a buyer and seller of last resort is not clear.
43

Various studies have been carried out to assess the effects of maize market
liberalisation in Kenya. Prior to full market liberalisation, Mukumbu (1992) in
a literature review of the maize milling industry’s structure, costs and trading
margins to evaluate the costs and efficiency implications of market
liberalisation on the industry. The author concluded that market regulations has
resulted in excess investment (capacity) in the sifted maize milling industry,
that transportation and storage costs under a liberalised market were likely to
favour location of large-scale mills in surplus regions, increased capacity
utilisation and lower maize meal prices.
In a follow up study, Mukumbu (1994) examined the maize consumer and
milling industry response to maize market reform in Kenya using cross-
sectional data from a Nairobi maize consumption survey (done in October
1993) and an updated millers data base of his 1992 study. The results showed
that only 20% of the consumers had a strong preference for the (then) state
subsidised but more expensive sifted maize meal, and that in'a liberalised
market scenario posho mills would be able to supply (more preferred) maize
meal at prices far below those charged by sifted maize millers and pose enough
competition to prevent maize meal prices from rising much due to large scale
firms cartels. Mukumbu further observed that expected expansion of small
maize mills would increase employment and incomes and that during transitory
3.3 Market Liberalisation and its Policy Implications
44

food crisis, food subsidies targeting posho consumers would allow less leakages
to food secure households, hence be a more cost-effective way of addressing
food security problems of low income urban households than was the case
under market regulation.
Mukumbu and Jayne (1995) used the Mukumbu (1994) data and estimated a4
logit model to quantify the importance of factors likely to affect a Nairobi
household’s decision to consume posho meal. Revelations of their study are
similar to those realised by Mukumbu (1992 and 1994). Among other things the
authors observed that only a very small proportion of the urban consumers in
Nairobi had a preference for sifted maize meal and argued that an increased
demand for posho would reduce the volume of imported maize required to meet
domestic needs.
The National Cereals and Produce Board carried out a survey in November
1995 to find out why the board was experiencing a maize glut and large millers
were experiencing low stock turn overs despite low imports. The findings of
NCPB’s study seem to support the observations made earlier. The survey
covered 40 percent of posho millers, about 3/4 of sifted maize millers and a
random sample of urban maize meal consumers. The study revealed that 90%
of the consumers preferred posho to other forms of maize meal and that market
liberalisation had caused the capacity of large sifted maize millers to drop by
80-90% primarily due to the competition offered by small emerging posho
45

(hammer) millers, 36% of which had come up in the last 3 years.
A number of studies have been carried out that assess the efficiency of the
maize market both in the pre and post-liberalisation periods based on market
integration. Maritim (1982) studied the structure and performance of the maize
marketing system on the basis o f a 1976/77 market survey done by the Market
Development Project of the then Ministry of Agriculture and a 1977/78 price
information survey by CBS. Maritim used wholesale price correlations among
rural markets and concluded that the markets were poorly integrated implying
an inefficient pricing mechanism. He observed higher segmentation among
regions where (NCPB) licensed traders had a huge market power. Maritim
suggested that the market structure was such that where the licensed traders
wielded great power they could have been colluding thereby contributing to
market inefficiency. Apart from collusion, the author attributed inefficiency to
the tight movements controls.
Odhiambo (1994) used correlation coefficients of weekly wholesale prices from
MIB/MIS covering 1992 and 1993, to evaluate performance of the maize
market on the basis of spatial integration5. The analysis showed high correlation
coefficients between markets which would imply high market integration and
market efficiency even during market control. This anomaly (that markets could
;The section that carries this analysis is attributed to Phillip Steffen of the Kenya Marketing Development Program.
46
be integrated even during market control) can be attributed to the limitations of
the methodology used, which are outlined elsewhere in this thesis.
Sasaki (1995) used monthly wholesale prices, and compared 1992 pre-
liberalisation period with 1994 post-liberalisation period based on absolute
values of the differences between each 2 markets. The author observed that in
182 out of 231 cases, there were lower price differences in 1994 than in 1992.
A non-parametric signs test gave strong evidence that price differences had
narrowed and Sasaki viewed liberalisation as one of the possible causes for this
positive change.
In Malawi, Goletti and Babu (1994) used correlation coefficients of monthly
retail price levels, differences and cointegration techniques to measure market
integration. Comparing results in the period before and after liberalisation of
the maize market, the authors concluded that liberalisation has increased market
integration. There were more markets that were highly correlated (using levels
and first differences) and cointegrated (from the cointegration model) in the
post-liberalisation period.
47

3.4 Review of Past Methodologies and Theoretical Underpinnings of the
Models
3.4.1 M arket Integration Analysis
Spatial market integration refers to the extent to which prices in one market
respond to price fluctuations in other markets. The concept of market
integration derives from the idea of a perfectly competitive market. A
perfectly competitive market is one which has a large number of buyers and
sellers, perfect flow of information particularly on prices, homogeneity of
product, and no barriers to entry of market participants. Such a market is said
to be efficient and a ‘single price’ will prevail in all spatially separated markets.
Prices will only differ in relation to storage and transfer costs incurred as
commodity moves from one market to another. That being the case, changes
in commodity prices will be transmitted from one local market to the other, so
that in the long-run prices fluctuate together. Thus co-movement of prices is the
intuition behind market integration. Various methods have been used to
determine market integration in the past most notably correlation of price
levels, correlation of price differences, and cointegration analysis.
48

3 . 4 . 1.1 Correlation of Price Levels
The coefficients of bivariate correlation of prices in spatially separated markets
provide the classical tool for measuring market integration ( for example Lele,
1971 for India: Farruk, 1970 for Bangladesh; Maritim. 1982 for Kenya ). The
magnitude and significance of the correlation coefficients have been used to
indicate the level of market integration.
Correlation coefficients range between +1.00 and -1.00. The higher the
coefficient the higher the degree of integration. A correlation coefficient of
1.00 could imply perfect market integration resulting for perfectly competitive
markets, unless a priori knowledge provides reasons for suspecting a
monopolists dominance and/or manipulation of the market. Own and other
peoples (Odhiambo. 1994) observation of the market in the post-liberalisation
period, already discussed earlier, provide no basis for suspecting this.
Moreover even in the pre-liberalisation period, the gross inability of the NCPB
to maintain pan-territorial and pan-seasonal prices (Maritim, 1982; Meilink,
1987; Argwings-Khodek, 1992) would imply a more segmented than integrated
market. A negative coefficient indicating a negative linear relationship between
markets, would imply some degree of segmentation and the absence o f market
integration.
Several authors have used correlation of price levels as a measure o f market
49

integration including: Goletti and Babu (1994) in Malawi; Odhiambo(1994) in
Kenya; and Maritim (1982) in Kenya too. Except in the last study, authors
report quite high coefficients which would imply high market integration.
Nevertheless, use of correlation coefficients has been challenged the most
prominent concern being that price levels, like most economic time series are
usually non-stationary, that is, they have non-constant variance, mean and
covariance. Other arguments against use of the coefficients are that they mask
the presence of synchronous factors such as inflation, seasonality, population
growth and public policy (Goletti, 1994; Odhiambo; 1994; Baharumshah and
Habibulah, 1994). This being the case, coefficients derived from such
correlations would simply be spurious and any conclusions drawn from such
analysis would be baseless.
Various studies have suggested ways to overcome the said shortcomings of
correlation of price levels. Maritim (1982) suggests using only coefficients of
0.7 or above, Odhiambo (1994) suggests that coefficients below 0.9 may be
suspect and others suggest use of price differences instead (Goletti, 1994;
Goletti and Babu, 1994). The aforesaid limitations and suggestions
notwithstanding, bivariate correlation coefficients continue to be used as a
measure of market integration. This study employed the same method not so
much as a tool for examining market efficiency but with the aim of comparing
the results with those of other methods.
50

3.4.1.2 Correlation of Price Differences
Besides correlation of price levels, correlation of first price differences has
also been used to examine market integration in past studies. Goletti (1994) has
applied correlation of first price differences to examine integration o f rice
markets in Bangladesh. The author’s findings are that 50% of the markets are
integrated indicating a moderate degree of integration among the rice markets.
Goletti and Babu (1994) use the same technique to measure integration among
maize markets in Malawi. In their study, correlation coefficients are quite low,
a thing which as they observed suggests low degree of integration.
In Egypt, Goletti, Badiane and Sil (1994), assess the impact of market reform
on integration for wheat, rice and maize using correlation of first price
differences. They observe that coefficients are generally higher in the period
after reform than they are in the period before showing that reform has
increased market integration and had a positive impact on market efficiency.
Besides correlation of price levels, bivariate correlation of price differences was
used in this current study to measure market integration. Price differences help
to interpret market integration as interdependence of price changes. Besides,
differencing removes trends and quite often induces stationarity in an otherwise
non-stationary series hence solves problems of spurious • correlations.
Correlation of price differences is therefore undoubtedly a superior technique
51

to correlation of price levels.
3.4.1.3 Cointegration Analysis
Time series methods of measuring market integration have been introduced and
used in recent studies. Cointegration techniques developed by Engle and
Granger in the 1980s’ have been used extensively in the study of market
integration for instance by Goodwin and Schroeder (1991), Goletti Ahmed and
Farid (1995), and Baharumshah and Habibulah (1994).
Cointegration implies the co-movement of two time series so that in the long-
run there is a constant linear relation between the two (Engle and Granger,
1991). Use of cointegration in market integration is based on the idea of
stationarity. If a time series is stationary, its mean, variance and covariance are
independent of time (Gujarati, 1995). Regressions done using non-stationary
time series give spurious results and t and F statistics that can not be relied on
for inference.
Time series data usually exhibit non-stationarity. Cointegration techniques not
only provide measures of market integration, they also overcome the problem
of non-stationarity among economic time series. Two economic series are said
to be cointegrated if there is some linear combination of them that is stationary.
52

The concept of cointegration may be presented as follows:
If a series X, is non-stationary but its first difference is stationary, then it is said
to be integrated of order one or simply integrated, and could be represented as
X, — I(l)6. Otherwise if X, is stationary it is said to be integrated of order zero
and denoted as X, ~ 1(0).
If two time series Xt and Yt are both 1(1) then in most cases the linear
combination Yt - a - ftX , = e, is also 1(1). But, it is possible that et is
stationary, or 1(0). This will only happen if the ‘trends’ in X, and Y, cancel out
when et = Yt - a - ftX , is formed. If and only if this is the case then X, and Y,
are said to be cointegrated with f t as the cointegrating parameter /coefficient 7.
In general a pair of series X, and Y, are said to be cointegrated if they are
individually 1(d) (where d is the order of integration), but there exists a linear
combination of them, e, = Y, - a-fiX „ that is 1(0).
The task in cointegration analysis is therefore two fold. The first part is to find
out if each of a pair o f time series is stationary and if either or both are not
stationary, to difference the series until stationarity is achieved. Secondly, if
and only if, the two series have the same order of integration (whether or not
they are individually 1(0)), to regress one on the other and find out if the error
6 Integration or economic integration here means the number o f times the series needs to be differenced before attaining stationarity.
7See Griffith, Hill and Judge (1992) and Gujarati (1995) for further discussion of this concept.
53

term is stationary or 1(0).
A number of authors have used cointegration analysis in the study of market
integration. Goletti and Babu (1994) use cointegration techniques in their
analysis of maize market integration in Malawi. The authors worked with data
that covered both the period before and after market reforms. The Augmented
Dickey-Fuller (ADF) test revealed that all series were 1(1), and that most of the
markets were integrated with the period after reform having more integrated
markets than the period before.
Goletti, Badiane and Sil (1994) employed the same techniques on wheat, maize
and rice data across Egyptian markets. All the series were 1(1), and most of
them had a long term stable relationship showing that the market had little
segmentation.
Cointegration techniques have also been used to determine economic integration
in studies with no marketing aspects. Abdulai and Rieder (1996) used Dickey
Fuller (DF) and Augmented Dickey-Fuller (ADF) procedures to examine the
order of economic integration in their study of price policy and cocoa supply
in Ghana. Their data gave mixed results with some series being 1(0) and others
1( 1).
54

Literature provides several techniques that could be used in examining the
above. These include: the autocorrelation functions (correlogram); several
Unit-root tests such as the Dickey-Fuller(DF) te s t , the Phillips-Perron test, the
Johannsen and Juselius, and the cointegrating Regression Durbin-Watson test8.
This study used the Dickey-Fuller tests and specifically a latter version of the
same the Augmented Dickey-Fuller tests for analysis. This test was chosen for
its straight forwardness, widespread usage, and availability of the relevant
critical values.
4.1.2 Causality Testing: The Central M arket Hypothesis
The central market hypothesis derives from the concept of causality which
means contributing to predictability (Goletti and Babu, 1994) or simply
precedence (Madalla, 1988) If past prices of one market A can be used to
forecast the prices in an other market B, then market A prices are said to cause
market B prices. If market A prices cause prices of several markets, then
market A can be interpreted to be a central market. Thus a central market is
one whose past prices can be used to forecast prices in other markets. A
weaker version of centrality exists where price changes are restricted to a
region, so that there are regional centres (Goletti and Babu, 1994).
8See Gujarati (1995) and White (1993) for further discussion.
55

Causality could be unidirectional where A causes B (or vice versa) without the
reverse being true, it could be bidirectional where A causes B and the reverse
is true or there could be independence where no series Granger causes the other
(Gujarati, 1995). There is a central market if prices in that market Granger
cause prices in other markets in a unidirectional way. The presence of central
markets would invariably mean that there is radial transmission of prices (and
price changes). Central markets could be targeted in times of food shortage to
transmit price signals to other locations.
Several tests have been developed and used to test for causality among
economic time series including the Granger test, and Sims' test (Madalla,
1988). The Granger causality test is based on the assumption that the past is
key to the present. Thus considering two series (Y,) and (Xt), the series X, fails
to Granger Cause Y, if in a regression of Y, on lagged X’s and lagged Y s, the
coefficients of the latter are zero (Madalla. 1988). On the other hand Sim’s test
is based on the assumption that the future can not cause the present, so that
regressing Y on lagged, current and lead values of X, if X is to cause Y , then
the sum of the coefficients of the lead X terms must be statistically equal to
zero(Gujarati, 1995). As Gujarati observes, the choice between Sim’s and
Granger causality tests is not clear. However, the Granger test is more widely
used, and is simpler.
56

The traditional Granger and Sim’s tests seem rather lenient. In recent past
error correction representations have been used to test for causality for instance
by Goletti and Babu (1994); Goletti, Badiane and Sil (1994). Goletti and Babu
(1994) using an error correction mechanism(ECM) in studying the maize in
Malawi observe central markets in major cities. Goletti, Badiane and Sil (1994)
use a similar approach in their study of Egyptian maize and wheat market s and
get similar results - central markets are located in major urban areas although
the capital, Cairo is not central. The later observation is explained by the fact
that the capital is very close to two other markets that overshadow its
importance. Mendoza and Rosegrant (1992) use the traditional Granger
causality test for determining central markets for corn in the Phillipines. The
authors observe Manila, the capital to be central.
The link between cointegration and error correction is that two cointegrated
series can be represented using an error correction mechanism - the (short term)
disequilibrium in one period is corrected in the next period. Cointegration
implies that the system follows an error correction representation and
conversely an error correction system has cointegrated variables (Engle and
Granger, 1991).
The error correction mechanisms (ECMs) are more stringent as compared to
Granger and Sim’s tests, because they include use of longer lags to capture the
dynamics of short-run adjustment towards long-run equilibrium. The Error
57

correction representation of the Granger test was used in this study, to test
whether there are any central markets for maize in Kenya, find out where they
are located and shed light on how liberalisation has affected location o f these
central markets.
3.4,3 Assessing S tructural Determinants of M arket Integration
Market integration is the result of the actions of traders as well as the operating
environment determined by the infrastructure available for trading and the
policies affecting price transmission. Because markets are complex institutions,
it is not enough to rely solely on price information to assess market integration
and subsequently market performance.
The impact of the Kenyan Rural Access Road Program (Rhodes, 1993) is a
case that shows how some factors may affect market integration. Rhodes
observes that evaluation of this programm showed a 51% rise in sale of farm
produce in the areas sorrounding the rehabilitated access roads. The same
author predicts improved movement of commodities between markets linked by
rural roads under rehabilitation by the Kenya Marketing Development Program.
The author observes increased traffic on roads already rehabilitated and
expansion of cultivated land in areas across which the roads pass.
58

Market integration and performance are a result of numerous factors including
marketing infrastructure, policy and production characteristics. Marketing
infrastructure relates to transportation, storage and communication (as these
contribute to lowering transaction costs), and credit. Policy relates to such
things as price stabilization and grain movement control. Production affects
market integration through the degree of dissimilarity in commodity self-
sufficiency among markets. High transport costs may be due to long distances
between two localities or due to poor roads that call for high vehicle
maintenance and time costs or even due to social disturbances that cause undue
delays and risks hence increase costs.
Price stabilization policy (storage and subsequent release) affects market
integration in a complex way. If may either enhance price co-movement as
grain releases offset seasonal and annual fluctuations or it may hinder price
transmission by obscuring price signals, particularly so if it is unpredictable.
Distribution of maize stores and more so stocking practices that polarise regions
into deficit and surplus zones, could even enhance trade between these
‘dissimilar’ areas and enhance market integration so long as there are no
commodity movement restrictions.
Production affects market integration in that, dissimilar markets are likely to
be more integrated than similar markets. By creating deficit and surplus regions
albeit for short periods, production shocks may enhance market integration. But
59

severe and longer term production shocks like floods that disrupt other factors
e.g., transportation could also cut off deficit and surplus regions hence hinder
price transmission. Social disturbances affect market integration as they disrupt
transportation and trade thus segmenting the markets. Serious social
disturbances could even de-link two markets one from the other.
Thus although the market may be liberalised, such factors as unusable roads,
poor telephone facilities, social unrests and intermittent policy changes may
hinder effective transmission of price signals among spatially separated
markets. It is important to find out what factors besides liberalisation affect
market efficiency. Implementing corrective measures on factors with negative
effects and enhancing factors with positive effect, would go a long way in
enhancing market efficiency and society welfare.
Very few studies have focused on this vital aspect of market integration. Goletti
(1994) and Goletti, Ahmed and Farid (1995) use a linear regression model to
assess the contribution of various structural factors to the integration of the rice
market in Bangladesh. In both studies, the coefficient of correlation of price
differences, the cointegration coefficient, a long-term measure of market
integration, and a composite measure of market integration involving magnitude
and speed of adjustment, were regressed on the various factors thought to
influence market integration. These factors were distance between markets,
density of road network, density of rail network, number of strikes, telephone
60

line density, density of bank network, price stabilisation policy measured by the
absolute value of correlation of prices and end-of-period public grain stocks in
each district, production dissimilarity between districts, and number of
production shocks such as floods drought and cyclones. Both studies observed
that road infrastructure, production dissimilarity and production shocks affected
market integration positively; distance between markets and strikes had a
negative effect: stabilization policy had positive effects with some measures of
market integration and a negative effects with others; railway density, bank
branches and telephone density gave dubious results.
This study used an approach that is similar to that used by Goletti(1994) and
Goletti. Ahmed and Farid (1995) but with some modifications in the variables.
Multiple regression and bivariate correlation were used to model and represent
structural determinants of market integration. The coefficient of correlation of
price differences and the cointegration coefficients were regressed (separately)
on the various factors thought to affect market integration as outlined later in
the methodology. This was only done for the period after full liberalisation.
61

CHAPTER IV
METHODOLOGY
This chapter describes the methodology used to meet the objectives of the study
and test the stated hypotheses. It begins with a discussion of the theoretical
underpinnings of the models and then goes on to a description of the analytical
models. The section goes on to description of the data and data limitations,
before closing with discussion of the analytical procedures involved.
4.2 The Models
4.2.1 The Cointegration Model
A cointegration model was used to study long run relationships among price
series, to pursue the first objective of the study and to test the hypothesis that
market liberalisation has increased the efficiency o f maize marketing in Kenya.
The model is based on a linear relationship among time series commodity prices:
(1) p u = a + Pp ,.r +
where P,, denotes the retail commodity price at time t and location i, Pja denotes
the retail commodity price at time t and location j, a and B are parameters to be
estimated (P is the cointegration parameter), and p, is the error term.
62

Commodity prices are usually non-stationary. However, this does not pose a
problem as long as the error term p, is stationary for this implies that price
changes in a market / do not drift far apart in the long run from another market
j , or are cointegrated.
A two step procedure for evaluating the properties o f a pair o f non-stationary
economic time series data following Engle and Granger (1991) is used. The first
step - the unit root test, separates and tests for order o f economic integration, i.e.,
the number o f times the series needs to be differenced before transforming it into
a stationary series. The finding o f a unit root in time series data indicates non-
stationarity. This test uses the Augmented Dickey-Fuller procedure.
For a price series P, „ two forms of the augmented Dickey-Fuller regression
equations can be estimated to test for a unit root;
m(2) A P , = 60 + 6 + £ 4>„APit_h * fr
h = 1
m(3) AP , = 60 + 6jP. x_t + 62t * £<|)*APlt .H * 0,
*=i
where u, for t = 1, . . . . , n is assumed to be Gaussian white noise, A is the
difference operator; m is the number of lags; and the 6's, and (J)’s are
parameters to be estimated. Equation (2) is with-constant, no trend and (3) is
with-constant and trend. The number of lagged terms m is chosen to ensure the
errors are uncorrelated. The null hypothesis is that cointegration coefficient,
63

6, = 0, that is, there is a unit root in P, ( P, is non-stationary).
The second step involves testing the error term p, o f the OLS regression (1)
between two series (of the same order of economic integration) for stationarity.
This follows the same ADF procedure as in equation 3. If the null hypothesis that
the two series are not cointegrated is not accepted it implies that the series are
interdependent or that there is non-segmentation between the two.
4.2.2 The Causality E rror Correction Model
The hypothesis of cointegration implies existence of an error correction
representation. Such a representation can be used to test for causality. The model
outlined hereafter was used to fulfil the second objective of the study and to test
the hypothesis that central markets for maize in Kenya are located in the major
consumption zones. According to Engle and Granger (1991), .the following
modified Error Correction Mechanism (ECM) can be used to represent two series
that are cointegrated:
k =m,
(4)t* iV., = Po + Pi P i,,-1 + P‘i P j j - i + 2 YiAP u -
2 b‘̂ Pj.,-H + P,h 0̂
where: A is the difference operator; m, and n, are the number o f lags; the P's, 6
and y are parameters to be estimated and p, is the error term. The error
64

correction mechanism is provided by the sum of the third and fourth terms with
their joint coefficient representing the error correction term (Engle and Granger,
1991; Abdulai and Rieder, 1996). The length o f the lags is chosen so as to
minimise the Schwarz criteria (Gujarati, 1995). Following Goletti and Babu
(1994), the null hypothesis of causality from market j to market i can be tested
as follows:
H0 : p'2 * 0 5 ^ = 0 h = 0, 1........... n
4.2.3 The Structural Determinants Model
As said earlier, analysis of the determinants of market integration was done
using bivariate correlation and a multiple regression model. This model was
used to pursue the third objective of the study. The various components of the
regression model are outlined hereafter.
Transportation infrastructure and costs were incorporated in the model by
introducing the road distance between markets denoted by ROAD,y, density of
tarmac roads per square kilometre in the districts of the markets that were being
compared denoted by TAR,r Communication was measured by the per capita
density of post offices offering telegraph services (as a proxy) denoted by
POSTr . It was intended that density of telephone lines be used but this data
was not available.
65

Credit availability was measured by the density per square kilometre of
commercial bank branches and denoted by CREDIT\J. Policy with regard to
price stabilization storage was measured by the absolute value of the per cent
difference of year end (an average between 1993/94 and 1994/95) NCPB maize
stocks in the districts of the markets. This is denoted by POLICY
As stated earlier, dissimilar markets in terms of levels of production are likely
to be more integrated than similar markets. Dissimilarity was captured by the
absolute value of the percentage difference in production per capita between the
market districts, denoted by PRODNtj. Unfortunately data covering the post
liberalisation period was not available and averages for the period between
1987/88 and 1990/91 were used with the assumption that the differences
between districts have generally been maintained in later years.
Production shocks were not captured due to lack of sufficient data. Social
unrest was captured as the number of strikes in the districts of the market link
and along the main roads connecting the two markets. This is denoted by
SOCIAL... Market structure has often been viewed as a determinant of market
integration and would have been represented in this model. However, data on
this would be variable was not available.
The model can be represented as follows:
For each pair of markets, / and j , let INT^ denote a measure o f market
66

integration that is either correlation of price differences a,,, or the cointegration
coefficient b,r
Then the equation estimated can be expressed as:
(5) INT,, = f(TAR„, ROAD,,, POLICY,), CREDIT,,, PRODN,,, POST;,, SOCIAL,,)
The expected signs are as follows:
Variable____________________________ Expected sign__________Distance between marketsTar road density +Credit availability ‘ +Policy + /-Production dissimilarity +Post office density +Social unrest_________________________2_____________________
As with most cross-sectional data, problems of heteroscedasticity and
multicollinearity and were expected. Heteroscedasticity would imply that the
estimators though not biased would no longer be minimum (or efficient) and
therefore not BLUE, according to Gujarati (1995, pp.389). Problems of
heteroscedasticity would be solved by logarithm transformations or even use of
generalised least square techniques. Multicollinearlity would result in
estimators that have large variances and covariances and therefore make
estimation difficult. Although the estimators would be BLUE, there would be
no unique solution. Multicollinearity would be solved by dropping the
variable(s) causing it, collecting more data, or using transformations such as
differences among other approaches.
67

4.3 Data Description and Sources
4.3.1 M aize Price Data
Weekly retail price data for 13 markets covering 5 out of the 8 provinces of
Kenya have been used in this analysis. The price data were collected from
CBS/ASS in Nairobi. It was intended that at least 16 markets, 2 from each
province be used but most price series had too large gaps such that usable series
covered by 5 provinces.
The CBS has been collecting retail price data since around 1976 mainly for use
in calculating CPI. Over the years the number and location of markets has been
varied. As at March 1996 the bureau was collecting data from 64 markets
scattered in all the provinces covering urban and rural areas. Price data are
collected on major market days (markets have at least one day in a week).
Enumerators observe 5 to 8 transactions for each crop and record the actual
price in kilograms. Prices are then averaged to arrive at weekly prices and sent
to Nairobi for entry into a computer data base. It was intended that no 2
markets covered should be in the same districts but again due to missing links
in the series this could not be avoided. Even then only 13 markets were
considered useful at last.
68

Data were divided into pre and post-liberalisation periods where liberalisation
stands for full maize market liberalisation. The pre-liberalisation set spans the
period between January 1992 and December 1993. The set covers 100 weeks
but has 35 weeks with missing values thus only the remaining 65 complete 6
weeks have been used in the analysis. The post-liberalisation set covers the
period between February 1994 and March 1996. The series has 109 weeks, 24
with missing values hence 85 observations have been used.
Markets covered include Limuru, Thika, Endarasha (Central Province), Embu,
Ishiara, Kianjai (Eastern Province), Daraja-mbili. Riochanda, Sondu (Nyanza
Province). Kapscibet, Kitale (Rift Valley), Kimilili and Busia (Western
Province). The markets are distributed as follows: Limuru, Thika, and
Endarasha are located in the maize deficit Eastern zone, whereas Embu.
Ishiara, and Kianjai are located in occassional surplus areas of the same zone.
Daraja-mbili. Riochanda, Sondu Kapsabet. Kitale and Kimilili are located in the
maize surplus Western zone and Busia is located in a deficit area of the same
zone.
4.3.2 Data on Determinants of M arket Integration
Data on the structural factors were collected from various sources particularly
government ministries. Most data on district sizes are from Government of
Kenya (1985) w'ith a few are from district development reports. District
69

boundaries used are therefore as at 1985. Data on district roads networks was
collected from the Ministry o f Transport and Communication (MoTCOM)
headquarters (in Nairobi). Data on post offices was compiled from the booklet
‘Post Offices in Kenya’.- a 1995 publication of the Kenya Posts and
Telecommunications Corporation provided from the corporations survey
section. The number of commercial banks per district was arrived at by
compiling data mainly from annual reports of five major banking institutions
namely Commercial, National, Barclays, Standard and Chartered and
Cooperative bank.
District maize production data were compiled from Gitu (1992) and district
public stocks data was collected from NCPB headquarters in Nairobi. District
population figures were compiled from various District development Plans for
the period 1993-1996. The counts of social disturbances, (labour unrests,
market closures socio-political strikes/demonstrations) were compiled from
issues of the three main daily newspapers namely ' The Nation', Kenya Times'
and 'T h e Standard’. Enough care was taken to avoid double counting. Road
and Rail distances between markets were computed from the ' Bartholomew
Kenya and Tanzania World Travel Map’.
70

4.3.3 Data Limitations
The major limitations have to do with data inadequacy which, although it may
not compromise the results of this study limits the extent to which the
objectives can be achieved: First, the price data was lacking in price series for
key areas most notably Mombasa, Nairobi and Garissa, the whole of
Ukambani, Nakuru. The first four are chronic deficit areas, and the last is a key
surplus area. Lack of data for Nairobi is considered to be a big limitation since
the city has in past studies been shown to play a key role in sending price
signals and was expected to be a central market in this study.
A sequel to the aforementioned limitations is that even the other markets for
which price series were available were not well distributed across the various
regions. The result is that markets used include Limuru and Thika in the same
district and hardly 80 kms apart as well as Daraja-mbili and Riochanda.
Secondly, data on number of telephone lines per district, annual district maize
production figures and production shocks that were proposed to be used were
not available. This problem was most prevalent for most of the districts.
71

4.4 Empirical Estimation
Data analysis was done using Statistical Package for Social Scientists (SPSS)and
Shazam. As stated earlier data has been divided into two major periods, i.e. pre
and post-liberalisation periods. Analysis has been done and comparison made
between results for these two periods to capture the effect of market
liberalisation. Regression and correlation analysis was been done for the
structural determinants of market integration.
72

CHAPTER V
RESULTS AND DISCUSSIONS
The purpose of this study was to examine the implications of market
liberalisation on market efficiency and agricultural policy in Kenya and make
relevant policy recommendations. Specifically the study sought:
(1) to examine the effects of maize marketing liberalisation on market
integration and segmentation,
(2) to determine causality among maize markets and provide information on
central markets for maize in Kenya,
(3) to examine structural determinants of the integration of maize markets in
kenya and,
(4) to discuss the implications of maize marketing liberalisation for
food/agricultural policy and to make recommendations for policy
formulation.
The following hypotheses were tested;
(1) Market liberalisation has increased the efficiency of maize marketing in
73

Kenya;
(2) central markets for maize in Kenya are located in the major consumption
zones.
The results presented hereafter tackle each objective in turn while presenting
the results of hypotheses tests at the same time. In examining the implications
o f market integration and segmentation, the traditional bivariate correlation
analysis has been used, and augmented by correlation of price differences.
Besides, the study has moved a step further into cointegration analysis. At
each stage, results cover the pre and post-liberalisation periods except for
analysis of the determinants of integration which covers only the post
liberalisation period.
The coefficient of correlation for price levels and differences are reported in
tables A 1.1 and A 1.2 in the appendix. Table 1.1 and 1.2 provide the results of
stationarity tests for the pre and post-liberalisation periods respectively, and
Table 5.3 and 5.4 show the results for the cointegration regression for the pre
and post-liberalisation period respectively. A comparison of the various
measures of market integration is given in Table 5.5. A summary of the
causality testing for both pre and post-liberalisation periods is given in Table
5.6, the detailed results for the same being provided in tables A3 and A 4 in the
appendix. Results for the analysis of structural determinants o f market
integration are provided in Table 5.7.
74

From the results, we may not reject the hypothesis that market liberalisation has
increased the efficiecy of maize markets in Kenya. However these results do
not allow us to accept the hypothesis that central markets for maize in Kenya
are located in major consumption zones.
5.1 M arket Integration
Correlation and cointegration analysis was done to pursue the first objective
and to test the hypothesis that market liberalisation has increased the efficiency
of maize marketing in Kenya .
5.1.1 Correlation of Price Levels
The coefficients of correlation for (maize) price levels and differences between
the 13 markets of study are reported in Tables A 1.1 and A 1.2 in the
appendix. As said earlier, the strength of the relationship between two markets
is portrayed by the size of the correlation coefficient - the larger the coefficient
the stronger the relationship. Negative coefficients indicate a certain degree of
segmentation among markets. The correlation coefficients for price levels
were quite high and as said in the literature review this may be due to such
factors as time trend, seasonality, and inflation which may cause the
correlations to be dubious. These results have to be viewed with this in mind.
75

The coefficients for price levels were higher for the post-liberalisation period
than for the pre-liberalisation period. Whereas in the post-liberalisation period
all (78) coefficients were significant (at both 1% and 5%), 58 (73%) and 69
(91%) of the coefficients were significant at 1 % and 5% respectively in the pre
liberalisation period.
The coefficients ranged from 0.8678 for the Kimilili-Kitale link to 0.0211 for
the Busia-Embu link, in the pre-liberalisation period, and from 0.9778 for the
Daraja-mbili-Sondu link to 0.2941 for the Kimilili-Kianjai link in the post-
liberalisation period.
Based on the magnitude of positive coefficients, Ishiara had the strongest links
with other markets implying the most integrated, while Kapsabet had the
weakest links implying the least integrated in the pre-liberalisation period.
Conversely, Limuru and Embu had the strongest links implying the most
integrated while Kianjai had the weakest links, implying the least integrated in
the post-liberalisation period. An interesting observation is that the links of
Busia-Kianjai and Busia-Embu that had small and insignificant coefficients in
the pre-liberalisation period, had quite larger and significant coefficients in the
post-liberalisation period. Even the weak links with Kapsabet improved a great
deal in the post-liberalisation period as evidenced by the higher coefficients.
76

The coefficients for price levels were higher for the post-liberalisation period
than for the pre-liberalisation period. Whereas in the post-liberalisation period
all (78) coefficients were significant (at both 1% and 5%), 58 (73%) and 69
(91 %) of the coefficients were significant at 1 % and 5% respectively in the pre
liberalisation period.
The coefficients ranged from 0.8678 for the Kimilili-Kitale link to 0.0211 for
the Busia-Embu link, in the pre-liberalisation period, and from 0.9778 for the
Daraja-mbili-Sondu link to 0.2941 for the Kimilili-Kianjai link in the post
liberalisation period.
Based on the magnitude of positive coefficients, Ishiara had the strongest links
with other markets implying the most integrated, while Kapsabet had the
weakest links implying the least integrated in the pre-liberalisation period.
Conversely. Limuru and Embu had the strongest links implying the most
integrated while Kianjai had the weakest links, implying the least integrated in
the post-liberalisation period. An interesting observation is that the links of
Busia-Kianjai and Busia-Embu that had small and insignificant coefficients in
the pre-liberalisation period, had quite larger and significant coefficients in the
post-liberalisation period. Even the weak links with Kapsabet improved a great
deal in the post-liberalisation period as evidenced by the higher coefficients.
77

The correlation coefficients for both the pre and post-liberalisation periods had
positive signs indicating that, as the prices in one market increase, prices in the
other market(s) increase too and the reverse is true. One may consider this to
be an indicator of inflation or even market integration. But this may not
necessarily be the case given the non-stationary nature of price series.
While bearing in mind the aforementioned limitations of using correlation
coefficients, the results seemed to point to greater market integration in the
post-liberalisation period as compared to the period before. This may imply that
maize market liberalisation has increased market integration in the post
liberalisation period. Thus we may not reject the hypothesis that market
liberalisation has increased the efficiency of maize marketing in Kenya
efficiency.
5.1.2 Correlation of Price Differences
Differencing is meant to remove stochastic trend, non-stationarity, and related
problems. Thus the correlation coefficients of the price differences are
considered to be better indicators of market integration than the coefficients of
the price levels. Results for the correlation of first differences are provided in
Table A 1.2 in the appendix.
78

The correlation coefficients for the first price differences like those of the levels
were higher for the post-liberalisation period than for the pre-liberalisation
period. In the post-liberalisation period 13 (17%) and 20 (-26%) of the
coefficients were significant at both 1% and 5% respectively. Whereas in the
pre-liberalisation period 9 (12%) and 17 (22%) of the coefficients were
significant at 1% and 5% respectively.
The coefficients were as expected smaller than those of correlation of price
levels ranging from -0.3879 for the Busia-Kitale link to 0.4701 for the Ishiara
Limuru-link, in the pre-liberalisation period, and from -0.1475 for the Kapsabet
-kianjai link to 0.5577 for the Kimilili-Sondu link in the post-liberalisation
period.
The magnitude of the average value of the coefficients indicates that Limuru
had the strongest links with other markets, which may imply that it was the
most integrated, while Riochanda had the weakest links implying the least
integrated in the pre-liberalisation period. In the post-liberalisation period,
Sondu had the strongest links implying the most integrated, while Kianjai had
the weakest links, implying the least integrated in the post-liberalisation period.
Generally, both the number of significant links and the magnitude of the
coefficients increased in the post-liberalisation period. This may suggest greater
market integration in the post-liberalisation period as compared to the pre-
79

liberalisation period, implying that maize market liberalisation has increased
market efficiency.
5.1.3 Cointegration Analysis
It is important to define the criteria used to label a market link as segmented or
integrated, using the cointegration model. A link between markets A and B is
said segmented if there is no cointegration in either direction or rather if
regressing series A on series B and regressing B on A, both yield non-
stationarv error terms. This implies that if there is cointegration in at least one
direction, then the link is considered to be integrated. This argument follows
Engle and Granger (1991). Following this definition, results from the
cointegration model were quite similar to those from correlation of price
differences, but differed a great deal than those from the correlation of price
levels.
The first step in cointegration analysis, the unit root test, showed that all price
(levels) series had coefficients that were smaller than the critical value (in
absolute terms). Thus the unit root hypothesis may not be rejected and this
indicates that both pre and post-liberalisation data had non-stationary series
(Tables 5.1/5.2). However, all the series attained stationarity after the first
differencing or they were 1(1) - the coefficients were larger than the critical
values at both 5% and 10% levels of significance and so they could be
80

T a b le 5 .1 : S ta tio n a r ity te s ts fo r p re - lib e ra lis a tio n p e r io d
I Price Levels First Differences
Maitct Cot meg ration No of Coirceg ration No ofCoefficient lap Coefficient lags
I Umuru •1.19 0 -5 99 l
Thika -1.78 2 -5 98 2
Endarasha -1.84 6 -6 54 1
Embu •1.17 5 3 85 5
Lshura -2.07 0 3.33 4
Kaanjai -2.21 0 -4 96 2
Daraja-mbili -0 29 1 -6.32 1
Sondu -2.24 2 •5.71 2
Riochanda -1.94 1 ■4.50 3
Kapsabet -0.08 0 -6 65 1
Kitale -2.19 1 -6.72 2
Kimiltli -2.24 0 -4.22 1
Busia -1.75 ' -6.63 2
Note The Augmented Dickcy-Fuller test was done for each price senes The 5% and 10% critical values axe -2.86 and -2.57 respa.tively
T ab le 5 .2 : S ta tio n a rity te s ts fo r p o s t- l ib e ra lis a tio n p e rio d
Price levels First differences
Market Cointegration No.of Cointcg ration No.oftoe ffic lent la8s co e ffic ien t lags
Umuru •1 .0 8 1 -9 23 i !
Thika -1 .5 5 3 -1 0 27 i
Endarasha -1 .4 5 8 -15 68 0
Embu -1 .21 2 - 1 9 2 5 o 1
lshura -1 .0 4 8 -6 43 1
Kianjai -2 .4 3 0 -2 2 20 0
Daraja-mbili -1 .0 6 0 - 1 8 8 2 0
Sondu •1 86 8 -2 2 .5 2 0
Riochanda •1 .3 8 1 •1 3 .38 0
Kipubct -1 .28 3 -1 6 11 0
Kitale -1 .8 0 0 -1 8 49 0
Kimiltli -1 .2 9 0 -15 76 0
Busia -1 49 0 •18 68 0
Note The Augmented Dickey-Fuller test was done for each pace senes The 5% and 10% cntical values are -2 86 and -2 57 respectively.
81

cointegrated.
In the second step involving cointegration regression, all the series were
tested, since they all had the same order of integration, 1(1). The test results
(Tables 5.3 and 5.4) show that most markets are not integrated in either period.
However, there are more links that are cointegrated in the post-liberalisation
period than in the former.
Table 5.3: Integrated market links; pre-liberalisation period*
Link M arket/ Market j Coefficient
(A )
Coefficient( fij
1 Lunuru Thika -3.44 -3 69*
2 Limum Endarasha -3 7 9 -3.50
3 Thika Endarasha -1.92 -4.00*
4 Thika Ishiara -393 -3.88
5 Thika Daraja-mbili -3 39* -1.41
6 Thika Riochanda -186 -3.37
7 Thika Kitale •3.18 -2.41
8 Endarasha Ishiara -4 16 -5.19
9 Embu Ishiara -2.98 -3.48
10 Embu Kianjai -3.20 -3.04
11 tshiara Kianjai -2.56 •3.72
12 Ishiara Daraja-mbili -3.05 -0.80
13 Kianjai Kapsabet -2.47 -1.25
14 Sondu Daraja-mbili •3.54 •0.77
15 Sondu Busia -3.13 -2.83
16 Riochanda Daraja-mbili -361 -2 56
17 Riochanda Kapsabet -3.73 -3.22
18 Riochanda Busia -3.15 -2.18
19 Kapsabet Daraja-mbili •4.25 -3.17
■ An integrated link between rturliet t and market / ia one for which either of the (cointegration) coefficients ff, or 15 above the critical value Where trend variable a required id induce stationanty. the values are marked with asaenlt The critical values (for PsO.Ol) are -4.32 and -3 9 with and without trend respectively. -3 78 and -3 34 (for PsO 05) with and without trend respectively
82

Table 5.4: Integrated market links; post-liberalisation period*
Link Market 1 Market j Coefficient<f>j
Coefficient<Aj
1 Limuru Thika -289 -309
2 Limuru Ishiara •1 84 -3 58
3 Limuru Kianjai •1.01 -305
4 Limuru Riothindj -298 -3.42
5 Limuru Kiule •2.21 -363
6 Limuru Busia -306* -2.08
7 Thxka Embu -346 -295
s Thika Ishiara •3.52 -2.96
9 Thika Daraja-mbtli -3.26 -3.10
10 Thika Sondu •330 -3 30
11 Thika Riochanda -3.16 -2.49
12 Endarasha Embu -2.66 -3.37
13 Endarasha Kiule -2.47 -3.10
14 Embu Ishiara ■3.23 -2.50
IS Embu Daraja-mbili -3.35 -4 14
16 Embu Riochanda -3.38 -3.37
17 Ishiara Sondu -332 -3.07
18 Ishiara Riochanda -326 -2.91
19 Ishiara Kapsabei -3.31 -2.78
20 Kianjai Daraja-mbili •305 -106
21 Kianjai Sondu -4.02- -1.07
22 Daraja-mbtli Riochanda -4 86 -4.79
23 Daraja-mbtli Kapsabet -3.50 -2.72
24 Sondu Riochanda •549 -5 33
25 Sondu Busu •3.78* -3.66*
26 Riochanda Kapsabet -3.09 2.75
27 Riochanda Kimilili -359* -290
2S Riochanda Busia -S-I2* -4.76*
• An integrated link between market i and market j is one tor which either of the (comtegranon) coefficient or PM is above the critical value Where trend variable is required to induce stationary. the values are marked with astenk The critical values (for PsO Ol) are -4 32 and -3.9 with and without trend respectively. -3 78 and -3.34 (for Ps0.05) with and without trend respectively
At a liberal 10% level of significance, there were 28 (or 36%) integrated links
in the period after full liberalisation as compared to 19 (24%) links in the
former period. At the more strict 5% level 15 (24%) links were integrated in
the post-liberalisation period as compared to 11 (or 14%) links in the pre
liberalisation period. Markets differ in the number of links that were
83

cointegrated. In the pre-liberalisation period Ishiara and Thika took the lead
with six integrated links each, while Kitale and Kimilili had none. In the post
liberalisation period Riochanda with eight had the most, followed by Limuru,
Thika and Ishiara with six cointegrated links each. Kimilili with one and
Kitale with two had the smallest number of integrated links.
An important observation is that markets with the largest number of integrated
links in the pre-liberalisation period also had the largest number in the post-
liberalisation period, and the reverse was true. Limuru was an odd market in
this case - the number of integrated links rises from two in the pre-liberalisation
period to six in the post-liberalisation period. There was a common
denominator for all the markets however, namely, that the number of integrated
links increased with market liberalisation. These results seem to indicate that
market liberalisation has increased market integration hence also market
efficiency. A summary of the results is presented in Table 5.5, together with
results from the bivariate correlations for comparison purposes.
5.1.4 Comparison of the Measures of M arket Integration
A comparison of the various measures of market integration is provided inTable
5.5. Whereas it may be considered acceptable to compare results from the
correlation of price differences with those from the cointegration model, it may
not be the case in comparing the results from these two methods with those
84

from correlation of price levels. The price differences were stationary, as were
the error terms that were used in classifying a link as integrated in the
cointegration model, but the price levels were non-stationary and their
correlations gave results that are considered to be suspect as observed earlier.
Nevertheless, as mentioned in the literature review, correlation of price
differences has been used in measuring market integration in the past and it is
for this reason results from this method are included here.
T a b le 5 .5 : C o m p a r i s o n o f th e v a r io u s m e a s u r e s o f m a r k e t i n te g r a t io n by l ib e r a l i s a t io n
p e r io d : P e r c e n t a g e o f I n t e g r a t e d l in k s
M e a su re P ro b a b ility P re -L ib e ra lisa tio n P o s t- L ib e ra lis a tio n
C o r re la t io n o f L ev e ls 0 .0 1 73 100
0 .0 5 91 100
0 .1 0 96 100
C o r re la t io n o f D if fe re n c e s 0 .0 1 12 17
0 .0 5 22 26
0 .1 0 27 35
C o in te g ra t io n C o e ff ic ie n t 0 . 0 1 4 5
0 .0 5 14 19
0 .1 0 24 36
Irrespective of the period, the coefficients of correlation for the (stationary)
price differences were lower than those for the (non-stationary) price levels. On
the other hand results from the cointegration analysis seemed to be more similar
to those from the correlation of price differences with respect to the proportion
of significant links, but quite different from the correlation of price levels as
depicted in Table 5.5. This may be related to the similarities of the first two
methods mentioned earlier.
85
Whereas all the correlation coefficients for the price levels had positive signs,
the signs for the coefficients of price differences were mixed, i.e, either
positive or negative. As said earlier the negative signs for correlation of price
differences indicate market segmentation. There was very little similarity
between the various measures o f market integration insofar as their indication
o f the particular markets that were integrated is concerned. There was no
common factor for all the three measures in this regard. Both the correlation
o f price levels and the correlation of price differences indicate that Kianjai had
the least integrated links in the post-liberalisation period whereas both the
correlation of price levels and cointegration analysis indicated that Ishiara and
Limuru had some of the most integrated links in the pre and post-liberalisation
periods respectively.
In comparing the various measures of integration, the number of integrated
links varies with the level of significance, as the summary of results (Table 5.5)
shows. The post-liberalisation period seems to have had more integrated links
at higher confidence intervals. However, taking the moderate significant level
of 5%, correlation coefficients of price levels showed that all the market links
were integrated in the post-liberalisation period as compared to 91% in the
period prior to (full) liberalisation. Correlation of price differences on the other
hand showed about 22% non-segmented market links in the prediberalisation
period and 26% in the post-liberalisation period.
86

Conversely, cointegration analysis showed about 19% integrated links in the
post-liberalisation period as compared to 14% in the former. In both periods,
the proportion of integrated markets seemed to diminish as more stringent
measures of market integration are applied to the data. Thus correlation of the
levels showed the highest followed by correlation of differences and then
cointegration regression. However, the results from correlation of price levels
should be taken with the caution raised earlier - the non-stationary nature of
price levels makes their correlations to be suspect. These results put into
question exclusive reliance on one measure of market integration and particular
if that measure is correlation coefficients of price levels (given that most price
series are non-stationary).
5.2 Causality Testing
To fulfil the second objective of the study and to test the hypothesis that central
markets for maize in kenya are located in the major consumption areas,
causality testing was carried out. This was only done for cointegrated markets -
the assumption is that only cointegrated markets can have a causal relationship.
Once more, most market that were tested for causality passed the test. A
summary of the results is presented in Tables 5.6 and a broader form in the
appendix (Tables A3 and A4 ).
87

Table 5.6: Summary of causality testing*
Link Market / Market J Direction of causality
Pre-liberalisation period
1 Limuru Thika -
2 Lunuru Endarasha -
3 Thika Endarasha
4 Thika Ishiara
5 Thika Daraja-mbili
8 Endarasha Ishiara
7 Embu Ishiara -
8 Embu Kianjai
9 lshiara Kianjai -
10 Ishiara Daraja-mbili -
11 Kianjai Kapsabet -
12 Sondu Daraja-mbili
13 Sondu Busia
14 Riochanda Kapsabet -
15 Riochanda Busia -
16 Kapsabet Daraja-mbili -
Post-liberalisation period
1 Limuru Ishiara -
2 Limuru Riochanda -
3 Limuru Kitale -
4 Limuru Busia -
5 Thika Embu -
6 Thika Ishiara -
7 Thika Daraja-mbili -
8 Thika Sondu
9 Thika Riochanda -
10 Endarasha Embu -
11 Endarasha Kitale -
12 Embu Ishiara -
13 Embu Daraja-mbili -
14 Embu Riochanda -
15 Ishiara Riochanda -
16 Ishiara Kapsabet -
17 Daraja-mbili Riochanda -
18 Daraja-mhili Kapsabet
19 Sondu Riochanda -
20 Riochanda Kapsabet -
21 Riochanda Busia -
b Ttw direction of ar*ow indicates direction ol causality Arrows in both directions indicate bidirectional causality.
Only links with significant causality have been tabulated
88

Causality in the pre-liberalisation period was more bi-directional than in the
post-liberalisation period, indicating a greater tendency towards the emergence
of strong central markets in the post-liberalisation period. This may be viewed
as a positive effect of liberalisation on market integration.
In the pre-liberalisation period there was no distinct central market that
unidirectionally causes many markets. However Daraja-mbili was central to two
markets while Thika. Endarasha, Ishiara, Riochanda and Kapsabet were central
to one market each. Causality tests showed Riochanda as a central market
during the period after full market liberalisation. The market Granger caused
six markets namely, Limuru. Thika. Embu and Ishiara in the Eastern zone and
Daraja-mbili and Sondu in the Western zone. Other 'influential' markets
included Embu. Daraja-mbili. Kapsabet. Kitale and Busia each of which were
central to two markets, and Limuru which was central to one market.
Although there were central markets in both production and consumption
zones, the surprise may be that the distinctly central market of Riochanda is
located in the production zone. This is contrary to the findings of Mendoza and
Rosegrant (1992) in Philippines and Goletti and Babu (1994) in Malawi who
showed central markets in major urban centres which are essentially
consumption areas. But again the limitations of the data used, particularly the
fact that major urban markets were missed out. must be borne in mind when
viewing these results. Nonetheless, the results showed that we can not reject the
89
null hypothesis that central markets for maize in Kenya are not located in
consumption zones.
5.3 Determinants of M arket Integration
Markets are complex institutions and as such integration and performance of
maize markets is a result o f not just the regulation of the market or the
activities of traders, but also by other factors in the market environment. So far
we have attempted to look at market liberalisation as it affects market efficiency
measuring this by market integration. The analysis thus far has been based
only on prices of maize in various local markets in the country. This part of the
discussion focuses on factors of market integration other than liberalisation that
have a bearing on market integration and market efficiency.
To fulfil the third objective o f the study, analysis of determinants of market
integration was done. Analysis of the said factors was done using bivariate
correlation and a multiple regression model (equation 5). The regression
analysis involved regressing the coefficient of correlation of price differences
(a,j), and the cointegration coefficient (btj), separately, on the structural
determinant, as represented in equation 5. The results are presented in Table
5.7.
90

The problem of multicollinearity among the independent variables was
encountered during analysis. This was taken care of by transformation of
variables, basically by dividing all the variables except the dependant variable
by CREDITir the variable that was responsible for most of the collinearity and
using the reciprocal of the same variable (CREDIT^) instead of the variable
itself.
It is notable that the equation had rather small R: (and adjusted R2) - a measure
o f goodness of fit. Despite this limitation, the model is considered useful
because it explains the effect o f some important factors on market integration
and provides empirical evidence that is lacking for agricultural markets in
Kenya. This particular model on the structural determinants of market
integration is not unique in having the said limitation. Goletti, Ahmed and
Farid (1995) in their regression model for the determinants of market
integration get an R: of 0.29 and 0.37 with correlation coefficients of first
differences and coefficients of cointegraion as dependant variables respectively.
This may imply that either structural determinants of market integration are not
well understood so that many useful factors are often left out of the models, or
that the said factors are difficult to model.
The signs of the various factors did not differ among the measures of market
integration. This is an interesting coincidence and one which may not always
be the case. For instance Goletti, Ahmed and Farid (1995), showed differing
91

signs for the various measures in their study of the rice market in Bangladesh.
As shown in Table 5.7 the variable post office was significantly positive at
10% as measured by the correlation of price differences. Although the number
of post offices offering telegraphic services may not be a very good proxy for
information access, it is interesting to see that this could positively affect
market efficiency.
Table 5.7: Determinants of market integrationCorrelation Cointegration
Dependant variable Coefficient Coefficient
IndependentVariable Estimate t-value p Estimate l-value PPost offices 0.1427 2.055* 0.3906* 0.6190 1.250 0.1324Social disturbances -0.0001 -0.204 -0.3647** - 0.0000 -0.613 -0.2817 •Tar road density 0.0001 0.057 -0.2474 0.0092 0.522 -0.1046Credit availability -0.0005 -1.668 -0.2959* -0.0055 -2.487** -0.3327*DistanceProduction
0.0000 0.175 -0.2515 0.0000 1.018 -0.2302
dissimilarity Public stock
0.0000 1.186 -0.1149 0.0000 1.049 -0.0772
dissimilarity 0.0000 1.264 -0.1415 0.0000 1.956 -0.1154Constant 0.0062 0.039 2.2425 2.098**
N 24 24R2 0.4348 0.3676Adjusted R2 0.1520 0.0909DW 2.4184 2.1479
Note: p - correlation with the dependent variable. Figures marked with asterik are significance levels: * at 10%. ** - at 5%.
Price stabilisation policy (entailing public stocks) measured by public stocks
dissimilarity had zero effect on market integration - neither positive nor
negative. This is in line with the mixed expectations expressed in literature
review. It shows that the activities of NCPB in stabilising prices by storage may
not have been a hindrance or a help to market integration.
92

Credit availability as represented by the number of banks had a significant and
negative effect on market integration contrary to expectation. Attempts to drop
the variable from the model proved futile, as this drastically reduced the R:
showing that the variable belonged to the model. These results seem to agree
with the observations of Goletti (1994) in his analysis of the determinants of
market integration for the rice market in Bangladesh. The author used banks as
a proxy for credit and got a negative sign on the variable as well. Goletti (1994)
suggests using total amount of bank loans by district as an indicator o f credit
avalability. Banks may be there but they may fail to give credit to maize traders
for diverse reasons. On the other hand maize traders may be relying on own
funds and/or on informal sources of credit. Further research may be required
to solve the puzzle that these results create with respect to this variable.
The number of strikes representing social unrest had a negative impact on
market integration as expected. Social disturbances disrupt marketing activities
and de-link markets. Tarmac road density was positive though insignificant and
this was expected since improved market physical connections enhance market
integration.
Production dissimilarity though insignificant was positive. As said earlier,
dissimilar areas are thought to be in a better position to trade than similar
zones, hence the positive impact. One interesting variable is distance which
though expected to be negative, was actually positive though very small. Long
93

distances de-link spatially separated markets as transportation costs become too
high. The positive sign on this variable may be due to the correlation between
dissimilarity in production and distance. For instance, the eastern deficit
markets depend so heavily on western surplus markets than on neighbouring
deficit markets. So it may not be surprising that distance seems to enhance
market integration contrary to expectations and common theory.
94

CHAPTER VI
CONCLUSIONS, IMPLICATIONS AND POLICY
RECOMMENDATIONS
The overall objective of this research was to examine the implications of ma ize
marketing liberalisation on market efficiency and agricultural policy in Kenya
and to make recommendations for policy. To this end this thesis has examined
several issues relating to liberalisation of the maize market in Kenya going back
to the period prior to domestic full market decontrol in December 1993. The
hypotheses that market liberalisation has increased the efficiency of maize
marketing in Kenya; and that central markets for maize in kenya are located in
the major consumption zones, were tested.
In the literature review, related studies on the liberalisation of the maize
market in Kenya have been explored and an analysis on integration of maize
markets performed. This analysis was based not only on the traditional
correlation of price levels but on more econometrically acceptable correlation
of price differences and use o f cointegration techniques. A search for a central
market(s) for maize was carried out using an error correction mechanism.
However because of the complexity of the market institution, and an
appreciation of the fact that market integration would be affected by factors
95

other than policy, the thesis has also examined structural factors that determine
the level o f integration among maize markets in Kenya.
Generally the lessons that emerge from this research are that market
liberalisation has increased the efficiency of the maize market in Kenya and that
liberalisation alone can not guarantee continued and increased efficiency of the
market. There are factors including social unrest and transport infrastructure
(Table 5.7), that need to be looked into if this efficiency gains are going to be
maintained and furthered. Another finding is that central markets for maize in
kenya are located in major production zones contrary to expectations.
Market liberalisation seems to have increased the number and proportion of
markets that are integrated as shown by both the correlation of price
differences and the cointegration analysis (Table 5.5). Thus we may not reject
the hypothesis that liberalisation has enhanced market efficiency. Free trade
may have allowed better articulation of the price mechanism and unhindered
transmission of the right signals that enhance market efficiency.
Another result of the liberalisation policy and subsequent free operation of the
price mechanism to set prices has been a tendency to move towards a more
‘organised’ market system. This is evidenced by the apparent drift from the
haphazard multidirectional Granger causality among maize markets towards the
emergence of central markets (Table 5.6).
96

The Causality test (Table 5.6) however does not allow us to accept the
hypothesis of location of central market(s) in consumption zones. The Kisii
district production zone market of Riochanda emerges as a central market,
implying that it transmits price signals to a number of other markets. These
unexpected results may be attributed omission of major consumption zone
markets in the study due to data unavailability as mentioned in chapter five.
The major conclusion that may be drawn from the analysis o f the determinants
of market integration is that there is some agreement between the various
measures of market integration insofar as the response to the determinants of
market integration is concerned. However this may not be the case always.
This analysis shows that social unrests affect market integration negatively
whereas production dissimilarity, availability of market information and good
road networks affect market integration positively.
The main limitations of this research relate to lack of adequate data both for the
maize prices and the determinants of market integration. Very significant urban
markets were left out of the analysis for lack of usable time series. Data on
some structural factors of market integration was either unavailable altogether
or lacking for some districts.
97

Another point to note is that particularly for the period after full liberalisation,
the data covers a rather short time. It would be important to carry out a similar
study two or three years from now when the liberalisation scenario particularly
as regards government policy has stabilised, and more data is available. It is
also possible that monthly time series could yield better results (more integrated
links) than weekly data since averaging may get rid of some of the short term
shocks. Using wholesale prices and comparing the results might also shed more
light on the behaviour of the maize market in Kenya. The said limitations
notwithstanding, a number of conclusions can be drawn from the study.
Given the shortfalls of this research already mentioned, there is need for future
and further research that will hopefully incorporate longer data series and data
of a wider spectrum of markets and structural factors. The implications of this
research should therefore be looked at with that in mind.
These implications include first that the efforts taken so far to liberalise the
maize market have been well utilised by private traders who have made efforts
to run the market towards greater efficiency. With that, the past fears that the
private sector would be unable to run the market to the detriment of consumer s
and producers are unwarranted.
This being the case then, the National Cereals and Produce Board should
relinquish its past role as a maize market monopoly and become the actual
98

buyer and seller of last resort and the maintainer of strategic reserve that it was
meant to be. The current situation where NCPB is playing a lesser role must
have saved and should continue to save the Kenyan taxpayer significantly in
terms of (miss-allocated) subsidies no longer given, and high operation costs
foregone. The NCPBs social function of being the buyer and seller of last
resort and maintainer of strategic reserve is justifiable for a third world
economy like Kenya, that still has a significant proportion of the population
dependant on agriculture and where sudden climatic changes often adversely
affect production of the staple food crop, maize. This often calls for provision
of famine relief. The government will no doubt continue to meet the social
costs associated with this kind of welfare fuctions carried out by the NCPB.
Another implication that is linked to the aforementioned one emerges though
more specifically from the literature review than from this study. International
trade in maize could benefit from liberalisation in the same way as the domestic
market. Preferential treatment of NCPB in international trade will only
continue costing the tax payer heavily instead of rendering him service, as the
loses incurred and the implicit costs of inefficiency outlined in the literature
review are met by the government.
The third implication which emerges mainly form literature is that the
consumer contrary to pre-liberalisation fears is not left to starve but instead he
has a cheaper, more nutritious and preferred source of food from the whole
99

grain meal. The rural folk, formerly subjected poorly available and expensive
food grain, the result of a controlled and inefficient marketing system are now
able to reap the benefits of market liberalisations. These benefits include greater
access to food as movement restrictions have been removed and possibly at
more affordable prices that are supported by a more competitive and efficient
market. This in essence, is increased food security
Several recommendations need to be made. The first one is that the Kenya
government should give continued commitment and support to the liberalisation
program, particularly given its good performance thus far.
Repetition of past practice o f renegading on policy will not help the private
sector to effectively and efficiently run the agricultural marketing system. This
instead creates lack of private sector confidence in the government which
hinders growth in investment and hampers movement towards more efficient
agricultural markets. The private trader needs to be assured that he has a future
in whatever agricultural commodity market he may be involved in.
Secondly, efforts should always be made to mediate between and reconcile
disagreeing workers and communities thus reducing the occurrence of social
and/or political unrests which hamper market integration and contribute to
inefficiency of markets. Thirdly, good road networks and information access
systems (particularly to traders) should be put in place and maintained as these
100
enhance market efficiency. In this regard, the Marketing Information System
ought to streamline its operations to ensure reliable data is not only collected
but also relayed to the market participants in time.
Lastly, undue preferential treatment of NCPB particularly with regard to the
international trade in maize, and haphazard bans on the trade are not in the best
interest o f the Kenya maize market and in the case of the later on international
relations. Such practices ought to be discarded completely.
Adopting all or even part of these recommendations will ensure the existence
of a better environment that enables the agricultural and more specifically the
maize marketing system, to move towards greater efficiency.
REFERENCES
Abdulai A, Rieder P. 1996. “The impact of Agricultural Price Policy in Ghana:
An Error Correction Estimation” . Journal o f African Economies 4: 3:
315-35.
Ackello-Ogutu and Odhiambo, M. 0 . 1986. Maize Production in Kenya. A
study of Costs and Technological Constraints with Output Expansion.
Report to USAID/Kenya.
101

Argwings-Kodhek, G., Mukumbu, M., and Monke E. 1993. "The Impacts of
Maize Market Liberalisation in Kenya” . Food Research Institute
Studies, 22(13).
Argwings-Kodhek, G. “Private Sector Maize Marketing in Kenya”. In
Proceedings o f Conference on “Maize Supply and Marketing Under
Market Liberalisation". Egerton University, Policy Analysis Matrix.
June 18-19, 1992. Nairobi.
____ . "Towards a Framework for Maize Sector Policy in Kenya:
Issues, Options and Consequences". In Proceedings o f Conference on
"Market Reforms, Agricultural Production and Food Security". 81-108.
Egerton University, Policy Analysis Matrix. Nairobi, June 22-23, 1994.
Baharumshah, A.Z. and Habibullah, M.S. 1994. "Price Efficiency in Pepper
Markets in Malaysia: A Cointegration Analysis". Ind. Jn. o f Agric.
Econ. 49: 2 : 205-216.
Barclays Bank (Kenya Limited). 1995. Barclays Bank Annual Report and
Accounts, 1994.
102/

Bartholomew World Travel Maps. 1994. Bartholomew Kenya and
Tanzania World Travel Map. Bartholomew, Harper Collins Publishers.
London.
East African Standard Inc. The Standard, 1994-1996 Issues.
The Standard Printers. Nairobi.
Egerton University, Policy Analysis Matrix, 1995. "Food Crop Productivity
Growth, Market Liberalisation, and Food Security". In Proceedings o f
The Conference on "Towards 2000: Improving . Agricultural
Performance". Egerton University, Policy Analysis Matrix. Nairobi.
September 21, 1995.
Engle, R. F. and Granger, C. W. J. 1991. Long-run Economic Relationships:
Readings in Cointegration. Oxford University Press Inc. New York.
Ephanto, R. "Patterns and Trends in Maize Consumption in Kenya". In
Proceedings o f Conference on "Maize Supply and Marketing Under
Market Liberalisation". Egerton University, Policy Analysis Matrix.
June 18-19. 1992. Nairobi.
103

Farruk, M.O. 1970. The Structure and Performance of Rice Marketing System
in Eastern Pakistan. Occas pap. 31., Department of Agricultural
Economics, Cornell University, Ithaca, NY.
Faruqee, R. and Husain, I. 1994. "Adjustment in Seven African Countries".
In Husain, I. and Faruqee, R. (eds). Adjustment in Africa: Lessons from
Country case studies. 1-10. The World Bank. Washington, D.C.
Gitu, K. W. 1992. Agricultural Data Compendium. Technical paper 92-10.
Ministry of Planning and National Development, Nairobi.
Goletti, F, Ahmed, R. and Farid, N. "Structural Determinants o f Market
Integration". The case of Rice Markets in Bangladesh. The Development
Economics, 23 (2). June 1995.
Goletti, F. and Babu, S. "Market Liberalisation and Integration of Maize
Markets in Malawi". Agricultural Economics. 11 (1994): 311-324
Goletti, F, Badiane, O and Sil, J. Food grain market Integration under Market
reforms in Egypt. MSSD Discn. Pap No 1. Markets and Structural
Studies Division, IFPRI. Washington D. C, November 1994.
104

Goletti, F. 1994. The Changing Public Role in a Rice Economy Approaching
Self-Sufficiency: The Case o f Bangladesh. Res. Rep. No. 98.
International Food Policy Research Institute. Washington, D. C.
Goodwin B. and Schroeder T.C. 1991. "Cointegration Tests and Spacial Price
Linkages in Regional Cattle markets". Am. J. Agr. Econ. 73 (1991):
452-462.
Government of Kenya/Marketing Information System. Monthly M a r k e t
Bulletin. November 1993.
Government of Kenya. MoALDM, Crop Production Division: 1996. Work
plan Crop Statistics Data Sheet: 1989-1995. MoALDM. Nairobi.
Government of Kenya. 1993. The National Development Plan fo r the Period
1994-1996. Government Printer. Nairobi.
Government of Kenya. 1985. Women o f Kenya Data Sheet. Womens Bureau,
Ministry of Culture and Social Services. Nairobi.
Government of Kenya. District Development Plan(s). Various issues
105

Granger, C. W. J. 1991. "Development in the Study of Cointegrated
Economic Variables". In Engle, R. F. and Granger, C. W. J. (eds).
Long-run Economic Relationships; Readings in Cointegration. 65-80.
Oxford University Press Inc. New York.
Griffiths, W. E., Hill, R. C, and Judge G. G. 1993. Learning and Practising
Econometrics. John Wiley and Sons, Inc. New York.
Gujarati, D. N. 1995. Basic Econometrics. McGraw-Hill Inc. New York.
Hesselmark. O. "The Marketing of Maize and Beans in Kenya: A Proposal for
Improved Effectiveness". University of Nairobi, Institute for
Development Studies. Work. Pap. No. 300. Feb. 1977.
Kenya Commercial Bank. The Kenya Commercial Bank Annual Report and
Accounts, 1994. February 1995.
Kenya Times Limited. The Kenya Times, 1993-1996 Issues. The Kenya Times
Media Trust. Nairobi.
Kenya Posts and Telecommunications Corporation. 'The Co-operative Bank of
Kenya, Branch Network'. In Kenya Telephone Directory, 1994. The
Kenya Posts and Telecommunications Corporation. Nairobi.
106

Kenya Posts and Telecommunications Corporation. 1995. Post Offices in
Kenya. Kenya Posts and Telecommunications Corporation Nairobi.
Kliest, T. 1985. Regional and Seasonal Food Problems in Kenya. Ministry of
Finance and Planning, Food and Nutrition Planning Unit. Rep. No.
10/1985.
Lele, U. 1971. Food Marketing in India: Private Performance and Public
Policy. Cornell University press Ithaca, NY.
Maddala, G. S. 1988. Introduction to Econometrics. Macmillan Publishing
Company. New York.
Maritim, H. K. 1982. "Maize Marketing in Kenya: An Assessment o f
Interregional Commodity Flow Pattern". PhD Dissertation, Technical
University of Berlin.
Mendoza, M. S and Rosegrant, M. W. "Market Information Efficiency and the
Dynamics of Arbitrage and Spacial Integration". S.E. As. J. Agr. Econ.
1. 2. Dec. 1992.
107

Meilink, H.A. Food Consumption and Food Prices in Kenya: A Review. Food
and Nutrition Studies Programme, Rep. No. 21. 1987. Government of
Kenya. Ministry of Planning and National Development. Nairobi.
Mukumbu, M. "Consumer and Milling Industry Response to Maize Market
Reform, in Kenya". In Proceedings o f The Conference on "Market
Reforms, Agricultural Production and Food S e c u r i t y Egerton
University, Policy Analysis Matrix. Nairobi. June 22-23 1994.
Mukumbu, M. "The Effects of Maize Liberalisation on the Maize Milling
Industry in Kenya". In Proceedings o f Conference on "Maize Supply
and Marketing Under Market Liberalisation". Egerton University,
Policy Analysis Matrix. June, 18-19. 1992. Nairobi.
Mukumbu. M. .and Jayne, T. S. 1995. "Urban Maize Consumption Patterns:
Strategies for Improving Food Access for Vulnerable Urban Households
in Kenya”. SD Publication Series. Technical Pap. No. 8. United States
Agency for International Development. Washington, D. C.
Mule Harris, n.d. Perspectives on Structural Adjustment in Africa.
National Bank of Kenya. 1995. The National Bank o f Kenya Annual Report,
1994.
108

National Cereals and produce Board, Forward Planning Unit. An Assessment
of Short-term Effects of a Liberalised Domestic Grain Market in Kenya:
A case for Posho Millers, Large Sifted Maize Millers and Wheat
Millers. NCPB. Nairobi. Nov. 1995.
National Cereals and Produce Board (NCPB)Personal Communications.
National Cereals and Produce Board. Feb.-March, 1996.
Nation Limited. The Daily Nation, 1994-1996 Issues. Nation Printers. Nairobi.
Nation Limited. The Sunday Nation, 1994-1996 Issues. Nation Printers.
Nairobi.
Odhiambo, M. 0 . The Kenya Maize Sub-sector: A Rapid Appraisal Approach
with emphasis on Market Information Needs and Extension Issues.
Government of Kenya/Market Information System. Rep. No. 94-03.
Nairobi. March, 1994.
Ojiambo Lukas. Personal Communications. World Bank Country
Office, Nairobi. March, 1996.
109

Rhodes Tom. "The Benefits of Public Investment in Rural Road
Rehabilitation". In Proceedings o f The Conference on "Agricultural
Exports and Market Development". Egerton University, Policy
Analysis Matrix. Nairobi. June, 23-24 1993.
Sasaki Noriaki. "Maize Market Liberalisation, Seasonal Price, And Private
Sector Storage". In Proceedings o f the Conference on "Towards 2000;
Improving Agricultural Performance". Egerton University, Policy
Analysis Matrix. September 21, 1995. Nairobi.
Schluter, M. 1984. "Constraints on Kenya’s Food and Beverage Exports”.
University of Nairobi; Institute for Development Studies. Occasional
Pap. No. 43.
Standard and Chartered Bank. Corporate Affairs Department. Personal
Communications. Standard and Chartered Bank. Nairobi. April, 1996.
Swamy, G. 1994. "Kenya; Patchy Intermittent Commitment". In Husain, I. and
Faruqee, R. (eds). Adjustment in Africa: Lessons from country case
studies. 193-237. The World Bank. Washington, D.C. '
White, K. J. 1993. Shazam User’s reference Manual Version 7.0. Mcgraw-
Hill. New York.
110

World Bank. 1990. Making Adjustments Work fo r the Poor: A framework for
Policy Reform in Africa. The World bank. Washington, D. C.
World Bank. 1992. Adjustment Lending Revisited: Policies to Restore Growth.
Corbo, V, Fischer, S and Webb, B.S. (eds.). The World Bank.
Washington, D. C
World Bank. 1994. World Development Rep. 1994: Infrastructure fo r
Development. The World Bank. Washington, D. C
111

APPENDICES
Table A 1.1: Correlation of price levels
Pre-liberalisation period
Limuiu Thika Endaraaha Embu Ishiara Kianjai Daraja-mbili Sondu Riochanda Kapsabd Kaale Kimilili Buna
bmuru : OOOO" +
Thika 6 6 2 6 "+ 1.0000" +
Eadaradu 7 8 3 1 "* 80 2 7 "+ 1 0000" +
Embu 4 8 3 0 - * 6 6 1 2 -> 6849** * 1.0000- *
(stuara 8071 — * 8 1 3 7 -* .8 402 -* 7 4 8 5 -* l 0 0 0 0 -*
Kianjai 5 2 1 6 -* 7 2 2 9 -* 6 4 5 8 -* 7441 — * 7 3 5 8 -* 1.0000—*
Daraja-mbili 6 5 0 0 -* 5 8 3 7 -* 6759—* 4150—*- 5 9 2 8 -* 4 0 38 -* 1 0 0 0 0 -*
Sondu 3 6 3 2 -* 2 8 1 4 - 3 0 3 2 -* 2767- 3 8 6 0 -* 1554 6 2 8 4 -* 1 .0 0 0 0 -*
Riochanda 4 9 2 8 -* 4 4 5 9 -* 5253-4. .2603- 4 3 5 0 -* 2374- 8 0 50 -* 6 8 0 2 -* 1 0 000 -+
Kapsabct 2 3 5 1 - 2568 - 2696- 2 9 2 6 -* .2277 - 1639* 4847— + .2415— 3321 — * 1.0000-*
Kiule 7911— * .4 3 3 1 -+ 6 1 4 7 -* 3 2 4 2 -* 5 6 6 8 -* 3188— * 6050—* 4010—* 4 3 6 5 -* 1647* 1 .0 0 0 0 -*
Kimilili 7 5 3 0 -* 4 1 3 9 -* .5113—+ 1782* 5 2 4 4 -* .2121- 5787- + .3819—* 4 2 2 4 -* 1798* 8 6 7 8 -* 1 0000- *
Busia 5514—* 2891—♦ 2416- 0211 2 793 - 0827 6822—* 6201—* 6541 — * 2522- 5 4 3 5 -* 6 1 4 3 -♦ l 0000- *
Post-liberalisation periodLi mum Thika Endhrasha Embu Ishiara Kianjai Daraja-mbili Sondu Riochanda Kapsabct Kiiale Kimilili Busia
Umufu 1 0000“ • +
Thika 7 5 8 0 - * 1 0 0 0 0 - *
Endamha 8 1 8 6 -* 6 5 0 5 -* 1.0000—+
Embu 9193— + 8 0 0 6 -* 8 2 5 0 -* 1.0000- *
Ishiara .8475— * 8014—* 8136—* .9163—* 1.0000—♦
Kianjai 4041 — + 4 8 7 9 -* 559 8 -* 5 7 3 5 -* 6 3 7 5 -* 1.0000- +
Daraja-mbili 9206— * 7961—* 8 1 0 6 -* 9214—* 8 9 4 4 -* .5371— + 1 o o o o -*
Sondu 9230— * 8 1 2 4 -* 8 2 29 -* 9131” * .8701 — * 5 2 04 -* 9778— + 1.0000— ♦
Riochanda 9186— * 7 8 3 8 -* 7 8 5 3 -* 9 0 8 9 -* 8517—♦ 4439— + 9683- + 9 7 2 8 -* 1.0000— ♦
Kapsabet 9004— + 6 6 8 8 -* 8 7 2 3 -* 8 7 4 8 -* 8 1 7 0 -* 4186—+ 8 0 54-+ 7 9 8 8 -* 7961 —+ 1.0000— ♦
Kiule 9217— + 6 7 6 3 -* 8 3 3 5 -* 8 8 6 7 -+ 8 3 0 8 -+ 3924- + 8 6 2 7 -* .8501 — * 8 4 2 6 -* 8533" + 1 oooo - -
Kimilili 8886* • * 6 8 7 0 -* 6 9 2 8 -* .8243—+ .7400— + 2941—+ 9233- + 9 2 0 3 -* .9 2 2 7 -* 7 0 63 -* 8 4 5 0 -* 1.0000- *
Busia 8310— * .6136—* 7024*** 7963—+ 6 9 2 0 -* 3466- + 8945— + 8928— * .9061—+ 6449* • * 7 9 9 2 -* 9 3 0 2 -* 1.0000—+
Number of cases 92 1-tailed Sifnif —+ +0 01 — -0 05 * -0 .1 0
112

Table A1.2: Correlation of price differences
Pre-lieralisation periodLt muru Thika Endarasha Embu Ishiara Kianjai Daraja-mbili Sondu Riochanda Kapsabet Kitale Kimilili Busia
Limuru 1 oooo—■¥
Thika 1271 1 o o o o - ♦
Endarasha 1523 0984 l oooo - ♦Embu 0244 -0041 - 1354 1 0 0 0 0 - ♦
Ishiara 4701* . 1801- 0067 .2148 1.0000—♦Kianjai 3582- 3012** ♦ 0426 0031 1550 1.0000- ♦
Daraja-mbtli 0867 .0808 2582- ♦ -0919 -.0532 .0170 1 0000- 4-
Sondu -.0151 - 1249 -.1696* 2 9 0 3 - 4-1582 - 0869 -.0539 1 .0000-4
R-ochanda - .1741* .0660 0196 -. 1749* -2349* • -.1605 1134 1166 1.0000-4-
Kapsabet 0633 -0395 -0772 1683- -.0507 -0028 1167 -0069 - 0005 1 0000 -4
Kitale 0793 -.1671- 3092-> - 0338 1108 -.0273 - 0045 - 0679 -.3092-4- -.0172 10000-4-
Kimilili 3131 —♦ 0378 .2912-4- -.1688* . 2369* • 0089 2898- - 0024 -.1325 - 1383 2735** 1 0000— 4
Busia 3 3 2 8 - 4 2023* - 3579-4- 2369- 1898* 2573- • 0513 2655- .2591 - 0181 • 3879 - 4- - 0542 1.0000— 4-
Post-liberalisation periodLimuni Thika Endarasha Embu Ishiara Kianjai Daraja-mbili Sondu Riochanda Kapsabet Kitale Kimilili Busia
Limuru 1 0000— 4
Thika 2368— 1 0 0 0 0 - 4-
Endarasha 0949 1739* 1.0000- 4-
Embu 0406 0320 - 0941 0 0 0 0 -4
Ishiara 0672 0914 1126 .1778- l 0 0 0 0 -4
Kianjai 0312 1118 0287 0756 - 0770 0000- *■
Daraja-mbili .1545* 1026 1360* 0738 0417 1220 l 0 0 0 0 -4
Sondu 2712— 4- 0633 2851-4. 0274 0900 .2154- 4 9 8 0 - - 1 0000— 4
Riochanda 1489* 1349 1259 1347 1646* 00*1 4 9 3 9 -4 5529— 4 1 .0000-4
Kapsabet 0518 - 1001 1230 2056- -.0101 ..1475* .0695 - 1164 -0277 1.0000—4
Kitale 2669—4- 1053 2007- 1095 2 0 9 9 - .0671 •0012 0642 -0514 .1463* 10000
Kimilili 0501 0029 1552* 0969 0379 0688 5226-4 5577— 4- 4839- 4 - 0187 0919 1.0000-4-
Busia 2 0 1 2 - 0449 0618 -0341 - 0804 .0507 .3 326 -4 3986— 4 3353-4 0168 -0520 3 0 5 5 -4
No of cases 64 and 91 for pre-liberalisation and post-liberalisation period respectively 1-tailed Sigmf • 0.01 • • • 0.05 • • 0.10
113

Appendix 2: Coefficients of the Error Correction ModelT a b l e A 2 . 1 : C a u s a l i t y t e s t i n g : P r e - l i b e r a l i s a t i o n p e r i o dLink Market i Market j Estimate Estimate Estimate Estimate Direction
&2i] &2)l i j i of causality
1 Limuru Thika 0.015 (0.193)
0.159(0.124)
0.320+**(3.024)
-0.382 (-1.510)
-
2 Limuru Endarasha 0.004(0.024)
0.072(0.378)
0.256+** (4.180) '
-0.087 (-0.633)
-
3 Thika Endarasha 0.537+** (3.589)
-0.549(-2.082)
0.268+**(3.508)
-0.248(-2.448)
- -
4 Thika Ishiara 0.295** (2.544)
-0.246(-1.098)
0.328**(2.454)
-0.142 (0.856)
- -
5 Thika Daraja-mbili 0.365+**(2.897)
-0.541(-1.866)
0.510+**(3.097)
-2.221(-0.678)
- -
6 Thika Riochanda 0.305+** (3.187)
-0.496**(-2.468)
0.054(-0.590)
-0.062(-0.356)
0
7 Thika Kitale 0.041 (0.644) (
-0.010-0.082)
0.160(1.389)
0.081 (0.201)
0 .
8 Endarasha Ishiara 0.261+**(3.726)
-0.001(-0.009)
0.415**(2.449)
-0.266(-1.093)
- -
9 Em bu Ishiara 0.339+**(3.803)
-0.313(-1.623)
-0.101(-0.099)
0.132(-0.693)
-
10 Embu Kianjai 0.232**(2.091)
0.018(0.095)
0.322+** (2.936)
-2.133(-1.069)
- -
11 Ishiara Kianjai 0.001(0.061)
0.073(0.397)
0.247+**(2.780)
0.033 (0.172)
-
12 Ishiara Daraj a-mbili 0.304** (2.609)
-0.171(-0.674)
0.006(0.040)
0.050 (0.895)
-
13 Kianjai Kapsabet 0.172*(1.908)
-0.222(-1.563)
0.577(0.868)
-0.118 (-0.069)
-
14 Sondu Daraja-mbili 0.431+**(3.111)
0.107(0.361)
0.379+(3.709)
-0.149(-1.120)
- -
15 Sondu Busia 0.277**(2.219)
-0.078(-0.351)
0.304**(2.66)
-0.248(1.330)
- -
114

Table A 2.1 continuedLink Market i Market j Estimate Estimate Estimate Estimate Direction
&2i±_________r<5hiJ_________Bjjj_________ Z5h1i of causal it
16 Riochanda Daraja-mbili 0.324*(1.845)
-0.060(-1.196)
0.543+**(5.518)
-0.367**(-2.819)
0
17 Riochanda Kapsabet -0.049(-0.427)
0.0879 (0.051)
2.404+**(3.055)
-3.045(-1.884)
-
18 Riochanda Busia 0.130(1.032)
-0.323(-1.443)
0.307+**(2.928)
-0.215(-1.181)
-
19 Kapsabet Daraja-mbili 3.452+**(3.639)
-0.203(-0.087)
-0.027(-0.331)
0.028(0.239)
-
Note: Market j is said to Granger cause market i if B2 ij is significant and Z5„ is not significant. The direction of the arrow indicates the direction o causality. Causality is bidirectional where the arrows face bot directions. Lack of causality in either direction is indicated by a zero Significant levels are indicated as: * - 10%, ** - 5% ,**+ - 1%. The 5 level has been used for hypothesis testing in this case. B2 ij and represent the first and second terms in the null hypothesis for equatio 4 respectively. The t-statistics in parentheses.
115
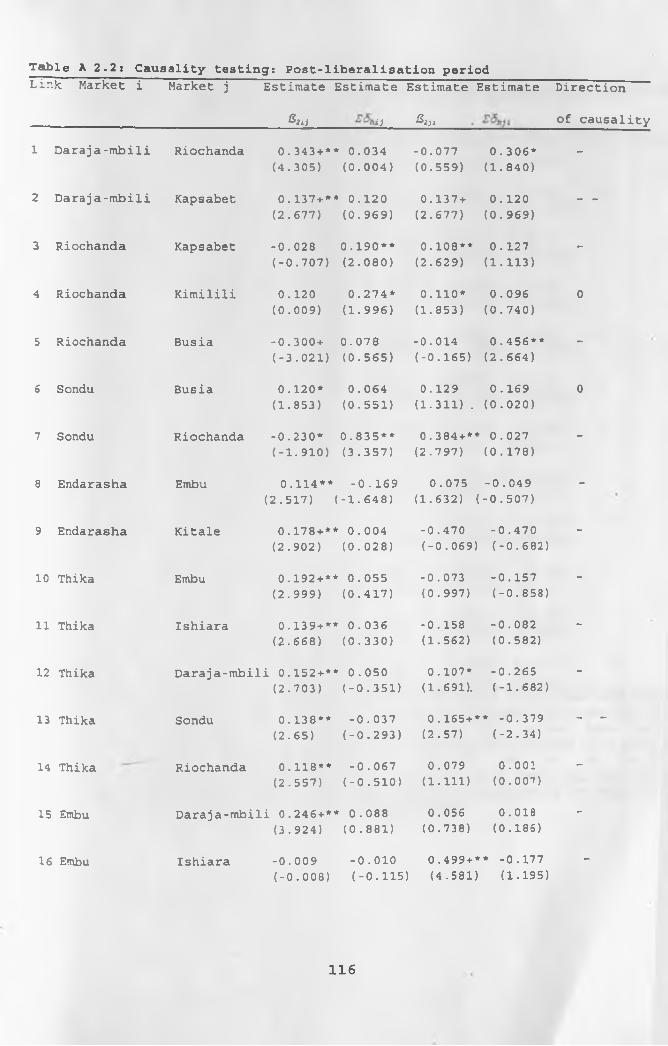
Table A 2.2: Causality testing: Post-liberalisation periodLink Market i Market j Estimate Estimate Estimate Estimate Direction
&2ij i ] &2U of causality
1 Daraja-mbili Riochanda 0.343 + **(4.305)
0.034 (0.004)
-0.077(0.559)
0.306* (1.840)
-
2 Daraja-mbili Kapsabet 0.137+**(2.677)
0.120(0.969)
0.137+(2.677)
0.120 (0.969)
- -
3 Riochanda Kapsabet -0.028(-0.707)
0.190**(2.080)
0.108**(2.629)
0.127 (1.113)
-
4 Riochanda Kimilili 0.120(0.009)
0.274*(1.996)
0.110*(1.853)
0.096(0.740)
0
5 Riochanda Busia -0.300+(-3.021)
0.078(0.565)
-0.014(-0.165)
0.456** (2.664)
-
6 Sondu Busia 0.120*(1.853)
0.064 (0.551)
0.129 (1.311) .
0.169 (0.020)
0
7 Sondu Riochanda -0.230*(-1.910)
0.835**(3.357)
0.384 + ** (2.797)
0.027 (0.178)
-
8 Endarasha Embu 0.114**(2.517) (
-0.169 -1.648)
0.075 (1.632) (
-0.049 -0.507)
-
9 Endarasha Kitale 0.178+**(2.902)
0.004 (0.028)
-0.470(-0.069)
-0.470(-0.682)
-
10 Thika Embu 0.192+**(2.999)
0.055 (0.417)
-0.073 (0.997)
-0.157(-0.858)
-
11 Thika Ishiara 0.139+**(2.668)
0.036 (0.330)
-0.158(1.562)
-0.082(0.582)
-
12 Thika Daraja-mbili 0.152+** (2.703)
0.050 (-0.351)
0.107* (1.691).
-0.265(-1.682)
-
13 Thika Sondu 0.138**(2.65)
-0.037 (-0.293)
0.165+** -0.379 (2.57) (-2.34)
- -
14 Thika Riochanda 0.118**(2.557)
-0.067 (-0.510)
0.079 (1.111)
0.001(0.007)
-
15 Embu Daraja-mbili 0.246+** (3.924)
0.088 (0.881)
0.056(0.738)
0.018(0.185)
-
16 Embu Ishiara -0.009(-0.008)
-0.010 (-0.115)
0.499+** -0.177 (4.581) (1.195)
-
116

Table A 2.2 continuedLink Market i Market j Estimate Estimate Estimate Estimate Direction
&2tj £<5hlj &2ji £5h ji of causality17 Embu Riochanda 0.169+**
(3.428)0.339 (0.033)
-0.008(-0.100)
0.104(0.849)
18 Ishiara Sondu 0.243+**(3.485)
-0.171 (-1.205)
0.006 (0.050)
-0.098(-1.386)
0
19 Ishiara Riochanda 0.208+**(3.323)
-0.298* (-2.004)
0.169(0.334)
0.010(-0.115)
-
20 Ishiara Kapsabet 0.130**(2.305)
0.067(0.564)
0.047 (0.938)
-0.193(-1.241)
21 Kianj ai Daraja-mbili 0.024* (1.741)
-0.096(-0.509)
-0.021(-0.480)
-0.089(-0.826)
0
22 Kianjai Sondu 0.077**(-1.985)
-0.228**(-2.468)
-0.790(-0.033)
-0.113(-0.980)
0
23 Limuru Thika 0.170** (2.258)
-0.678** (-2.474)
0.112*(1.861)
0.007(0.004)
0
24 Limuru Ishiara 0.089*(1.816)
-0.257*(-1.692)
0.241+** -0.026 (2.983) (-0.187)
-
25 Limuru Kianj ai 0.005(0.105)
-0.904 (-0.753)
-0.165(-0.014)
-0.456**(-2.664)
0
26 Limuru Riochanda 0.250+**(4.722)
-0.039(-0.388)
-0.047(-0.574)
0.088(0.746)
-
27 Limuru Kitale 0.235**(2.659)
0.044(0.295)
0.093* (1.675)
0.033(0.382)
-
28 Limuru Busia -0.248+** (4.813)
-0.196*(-1.715)
-0.071*(-1.378)
-0.147 (-1.379)
-
Note: Market j is said to Granger cause market i if S2lj is significant and £5^1is not significant. The direction of the arrow indicates the direction of causality. Causality is bidirectional where the arrows face both directions. Lack of causality in either direction is indicated by a zero. Significant levels are indicated as: * - 10%, ** - 5% , ** + - 1%. The 5% level has been used for hypothesis testing in this case. S2i] and represent the first and second terms in the null hypothesis for equation 4 respectively. The t-statistics in parentheses.
117
Related Documents