HAL Id: pastel-00711971 https://pastel.archives-ouvertes.fr/pastel-00711971 Submitted on 26 Jun 2012 HAL is a multi-disciplinary open access archive for the deposit and dissemination of sci- entific research documents, whether they are pub- lished or not. The documents may come from teaching and research institutions in France or abroad, or from public or private research centers. L’archive ouverte pluridisciplinaire HAL, est destinée au dépôt et à la diffusion de documents scientifiques de niveau recherche, publiés ou non, émanant des établissements d’enseignement et de recherche français ou étrangers, des laboratoires publics ou privés. The impacts of slum policies on households’ welfare: the case of Medellin (Colombia) and Mumbai (India) Paula Restrepo Cadavid To cite this version: Paula Restrepo Cadavid. The impacts of slum policies on households’ welfare: the case of Medellin (Colombia) and Mumbai (India). Economics and Finance. École Nationale Supérieure des Mines de Paris, 2011. English. NNT : 2011ENMP0089. pastel-00711971

Welcome message from author
This document is posted to help you gain knowledge. Please leave a comment to let me know what you think about it! Share it to your friends and learn new things together.
Transcript
HAL Id: pastel-00711971https://pastel.archives-ouvertes.fr/pastel-00711971
Submitted on 26 Jun 2012
HAL is a multi-disciplinary open accessarchive for the deposit and dissemination of sci-entific research documents, whether they are pub-lished or not. The documents may come fromteaching and research institutions in France orabroad, or from public or private research centers.
L’archive ouverte pluridisciplinaire HAL, estdestinée au dépôt et à la diffusion de documentsscientifiques de niveau recherche, publiés ou non,émanant des établissements d’enseignement et derecherche français ou étrangers, des laboratoirespublics ou privés.
The impacts of slum policies on households’ welfare: thecase of Medellin (Colombia) and Mumbai (India)
Paula Restrepo Cadavid
To cite this version:Paula Restrepo Cadavid. The impacts of slum policies on households’ welfare: the case of Medellin(Colombia) and Mumbai (India). Economics and Finance. École Nationale Supérieure des Mines deParis, 2011. English. �NNT : 2011ENMP0089�. �pastel-00711971�
N°: 2009 ENAM XXXX
MINES ParisTech CERNA
60 Boulevard Saint Michel 75272 Paris Cedex 06
Jury
M. Nicolas JACQUEMET, Maître de conférences, Université Paris 1 Panthéon - Paris School of Economics Président du Jury
M. Alan GILBERT, Professeur, Department of Geography, University College London Rapporteur
M. Pierre-Noël GIRAUD, Professeur, CERNA, Mines ParisTech Examinateur
M. Vincent RENARD, Professeur, Directeur de Recherche CNRS - IDDRI, Sciences-Po Examinateur
M. Harris SELOD, Professeur, Paris School of Economics - The World Bank Rapporteur
École doctorale n° 396 : Economie, organisation, société
Spécialité « Economie et finance »
présentée et soutenue publiquement par
Paula RESTREPO CADAVID
le 2 septembre 2011
The impacts of slum policies on households’ welfare: the case of
Medellin (Colombia) and Mumbai (India)
Doctorat ParisTech
T H È S E
pour obtenir le grade de docteur délivré par
l’École nationale supérieure des mines de Paris
Spécialité “ Economie et finance ”
Directeur de thèse : Pierre-Noël GIRAUD
T
H
È
S
E

i
ii
La réalisation de cette thèse a été rendue possible par le soutien financier de l‟Agence de l‟Environnement
et de la Maîtrise de l‟Energie (ADEME) et du Conseil Français de l‟Energie (CFE).
This thesis was made possible through the financial support from l‟Agence de
l‟Environnement et de la Maîtrise de l‟Energie (ADEME) and the Conseil Français de l‟Energie (CFE).

iii
iv
Acknowledgments I would like to express my gratitude to my supervisor, Pierre-Noël Giraud, who introduced me to this
incredible subject and guided me through this adventure during the past three years.
I thank all the PhD and intern students at CERNA who made this journey much fun, especially
Gabrielle Moineville, Justus Baron, Jan Eilhard, Michel Berthelemy and Fabienne Vuanda. I thank Sesaria
Ferreira (Sesa) for making my ‗coffee-breaks‘ very entertaining and helping me tackle all administrative
hurdles. I also thank Ian Cochran and Mathieu Sajout, who accompanied me through the WEC study and
‗groupe ville‟ meetings. I am grateful to Matthieu Glachant and Yann Menière for their support and guidance
and their constant battle to make CERNA a better place to learn.
I would also like to thank Mr. Tragler and Del Desouza from the Slum Rehabilitation Society (SRS) in
Mumbai for kindly welcoming me to their organization and guiding me through Mumbai slums. I
especially thank the wonderful SRS Staff: Laksha (the Chai master), Archana, Pannika, Manohar, Ranjeeta
and Sunita. I also thank Alexandra Janos and Shohei Nakamura, my co-volunteers at the SRS. I am very
grateful to Del Desouza, who not only taught me a lot about her amazing country (India) but who taught
me valuable life lessons of kindness and giving.
I thank the Mars Ltda. team who patiently worked with me preparing and conducting surveys in
Mumbai slums, especially Raghu Roy, Sasmita Sahani and N. C. Patel. I thank Vaibhav Gandhi from the
Municipal Corporation of Greater Mumbai (MCGM), and Amita Bhide and RN Sharma from the Tata Institute of
Social Sciences (TISS) for their invaluable suggestions. I thank Joel Ruet, who always had some thoughts to
share and some time to hear mine, during his two–day layovers in Paris between India and China.
I would also like to thank María Luisa Zapata of the ACI, Carmenza Barriga from the Medellin Solidaria
program, Alexandra Peláez, sub-director of Metroinformación and Martha Ligia Restrepo of the DAP for
providing me invaluable information; and the Gerencia de Moravia team for guiding me through the Moravia
slum.
I would like to thank my family, who always supported my ideas and rarely questioned my choices;
and P.A.T. who during these past three years became a part of it. Without their efforts and unconditional
support during my years of studies, I would not have completed this PhD. I especially thank my sister
who –from a couple of blocks away–was doing her own PhD in Jussieu. These past three years would have
been much more boring without her daily company.
Finally, I am very grateful to all of the families who patiently welcomed me into their homes, those
who gave me some of their sugary tea, coffee or cold drinks, and patiently responded to all of my
sometimes–intimate questions. I thank you immensely for your kindness and hope that this thesis can
somehow help to have a better understanding of your daily lives and the ways in which they can be
improved.

v
vi
Contents
Preface ......................................................................................................................................................... xiv
Introduction .................................................................................................................................................. 1
1. Justification ......................................................................................................................................................... 1
2. Methodology....................................................................................................................................................... 4
3. Structure of the document ............................................................................................................................... 4
Chapter 1: The Challenge of Slums ........................................................................................................... 7
1. Defining slums ................................................................................................................................................... 7
2. Planet of slums .................................................................................................................................................11
3. From slum eviction to slum upgrading ........................................................................................................17
Part I: Understanding slum formation mechanisms
Chapter 2: On the mechanisms of slum formation ............................................................................... 23
1. General ideas ....................................................................................................................................................23
2. Macro–analysis .................................................................................................................................................24
3. Economic Theory ............................................................................................................................................29
4. The link between slum formation and slum absorption policies .............................................................35
5. The mechanisms of slum formation in Medellin (Colombia) and in Mumbai (India) .........................37
Chapter 3: The inclusion of the informal city in the urban territory: a comparison between
Medellin and Mumbai ................................................................................................................................ 39
1. Introduction ......................................................................................................................................................40
2. Conceptual framework ...................................................................................................................................41
3. Urbanization and growth of the informal city ............................................................................................43
4. Urban policies, inclusion policies and the informal city ............................................................................48
5. Social Urbanism vs. Urban Neoliberalism: two answers to a need for action .......................................52
6. Discussion and conclusions ...........................................................................................................................58
Chapter 4 : The informal rental housing market in Medellin: written versus oral contracts........... 63
1. Introduction ......................................................................................................................................................64
2. Medellin: violence, poverty and spatial inequalities....................................................................................67
3. Data and methodology ...................................................................................................................................68
4. Results ...............................................................................................................................................................78
5. Conclusions ......................................................................................................................................................82
vii
Part II: The impacts of slum interventions on households' welfare
Chapter 5: Measuring the effects of slum policie .................................................................................. 89
1. Introduction ......................................................................................................................................................89
2. Methodological concerns for public policies evaluation ...........................................................................90
3. Experimental and quasi–experimental approaches ....................................................................................92
4. Examples of empirical studies of slum upgrading interventions .............................................................98
5. The impacts of slum policies on households welfare: the case of Medellin (Colombia) and Mumbai
(India) .................................................................................................................................................................... 100
Chapter 6: The effects of Urban Renewal Projects on the level of housing consolidation: the case
of Medellin (Colombia) .......................................................................................................................... 103
1. Introduction ................................................................................................................................................... 104
2. Urban Renewal in Medellin ......................................................................................................................... 106
3. Methodology.................................................................................................................................................. 111
4. Results ............................................................................................................................................................ 118
5. Conclusions ................................................................................................................................................... 122
Chapter 7: The Slum Rehabilitation Scheme: What consequences at a city level? ......................... 129
1. Introduction ................................................................................................................................................... 130
2. Mumbai, the Indian megapolis ................................................................................................................... 132
3. Making Mumbai a slum-free city? .............................................................................................................. 134
4. Density changes triggered by the SRS ....................................................................................................... 139
5. Conclusions ................................................................................................................................................... 143
Chapter 8: Moving in, Selling Out: The Outcomes of Slum Rehabilitation in Mumbai .............. 145
1. Introduction ................................................................................................................................................... 146
2. Slum Rehabilitation in Mumbai .................................................................................................................. 148
3. Materials and methods ................................................................................................................................. 150
4. Evidences of residential mobility ............................................................................................................... 152
5. Modeling and assessing the causes of moving out .................................................................................. 154
6. Understanding the reasons for moving out .............................................................................................. 159
7. Conclusions ................................................................................................................................................... 162
Chapter 9: The effects of the Slum Rehabilitation Scheme in Mumbai: on household access to
credit and investment in housing ........................................................................................................... 165
1. Literature review ........................................................................................................................................... 166
2. Methodology.................................................................................................................................................. 168
3. Access to credit ............................................................................................................................................. 168
4. Housing investments .................................................................................................................................... 171
5. Conclusions ................................................................................................................................................... 172
viii
Chapter 10: The effects of the Slum Rehabilitation Scheme in Mumbai: on household access to
improved and modern basic services .................................................................................................... 175
1. Introduction ................................................................................................................................................... 176
2. The Slum Rehabilitation Scheme ............................................................................................................... 177
3. Improving access to modern basic services: formality moving in ........................................................ 179
4. Quality of service provision after the SRS: evidences of possible infrastructure bottlenecks ......... 182
5. Conclusions ................................................................................................................................................... 187
Conclusions and perspectives ................................................................................................................. 190
1. Main results and policy implications.......................................................................................................... 191
2. Perspectives for future research ................................................................................................................. 195
Annex: Summary statistics and other findings, Mumbai SRS Household Survey .......................... 197
References ................................................................................................................................................. 203
ix
List of Figures Introduction
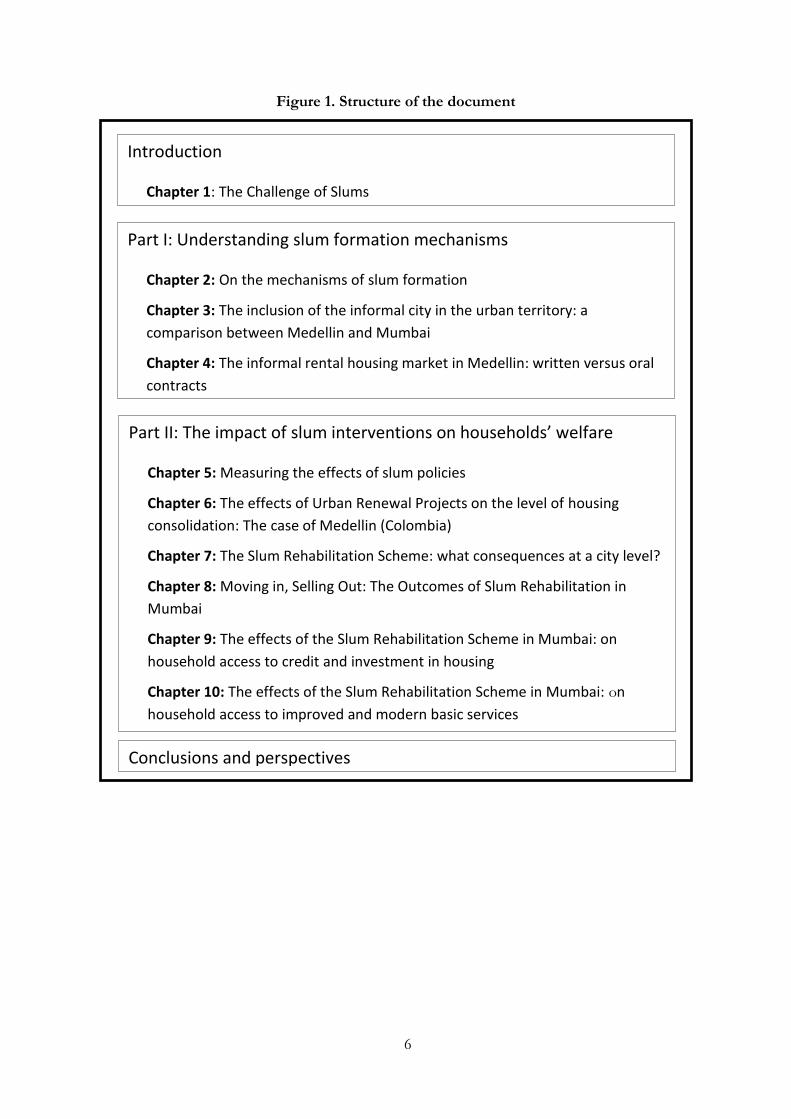
Figure 1. Structure of the document ......................................................................................................... 6
Chapter 1
Figure 1. London (Left, 1880) and Mumbai (Right, 2009) slums ......................................................... 8
Figure 2. Slum population by regions ...................................................................................................... 12
Figure 3. Proportion of the urban population living in slums by regions .......................................... 12
Figure 4. Slum indicators by regions in 2003 ......................................................................................... 14
Figure 5. Evolution of a selected number of slum indicators from 1990 to 2003 ............................ 15
Chapter 2
Figure 1. The mechanisms of slum formation – UN-Habitat ............................................................. 25
Figure 2. Rapid urbanization and slum growth ...................................................................................... 26
Figure 3. Slum growth and city population growth in Brazil (left) and slum growth and formal
housing stock growth in Brazil (right) between 1980 and 2000 .......................................................... 27
Figure 4. Proportion of unauthorized development or infrastructure deficiency according to city
size (1993) .................................................................................................................................................... 28
Figure 5. Proportion of the slum population to the total urban population and proportion of the
urban population living in the capital city ............................................................................................... 28
Figure 6. Modeling the effect of regulation on prices and supply ....................................................... 30
Chapter 3
Figure 1. The dynamics between urban policies, the formal and informal city, and inclusion
policies ......................................................................................................................................................... 42
Figure 2. Growth of the formal and informal city in Mumbai and Medellin .................................... 45
Figure 3. Percentage distribution of barrios by type of settlement in the city of Medellin from 1948
to 1998 ......................................................................................................................................................... 46
Figure 4. Distribution of informal settlements in Medellin (left) and Mumbai (right) .................... 47
Figure 5. Financing mechanisms of the Mumbai SRS policy .............................................................. 57
Figure 6. Housing solutions constructed and proposed under SRS ................................................... 58
Chapter 4
Figure 1. Tenure security of different tenure categories ....................................................................... 66
Figure 2. Distribution of informal settlements in Medellin ................................................................. 68
Figure 3. Medellin Solidaria 2008 and 2009 cohorts ................................................................................ 70
Figure 4. Spatial distribution of households with rental status according to rental arrangement,
and spatial distribution of informal settlements in the city of Medellin ............................................. 74
Figure 5. Box-plot of monthly rental value against type of contract .................................................. 76
Figure 6. Box-plot of monthly income against type of contract ......................................................... 76
Figure 7. Leverage versus normalized residuals for the neighborhood variables regression. ......... 84
x
Chapter 5
Figure 1. Comparison between Before–After (BA), Difference (D) and Difference–in–Difference
(DID) estimators ........................................................................................................................................ 96
Chapter 6
Figure 1. Forms of land occupation in the Santa Cruz and Popular comunas ..................................... 108
Figure 2. Comparison before and after the implementation of UIP (A) ................................... 110
Figure 3. Comparison before and after the implementation of UIP (B) .......................................... 111
Figure 4. UIP direct area of intervention, UIP control and treated groups ..................................... 116
Chapter 7
Figure 1. Greater Mumbai and its slum distribution ........................................................................... 133
Figure 2. Slum Rehabilitation Scheme ......................................................................................................... 136
Figure 3. Slum Rehabilitation Scheme and Relocation and Rehabilitation of Project Affected
Households................................................................................................................................................ 138
Figure 4. Slum Rehabilitation Scheme and Relocation and Rehabilitation of Project Affected
Households................................................................................................................................................ 140
Figure 5. Number of Projects Rehabilitated by Ward and Residential Prices (Rs/ sq.mt.)........... 141
Figure 6. TDR Generation and Consumption by Ward ..................................................................... 142
Chapter 8
Figure 1. Residential mobility before rehabilitation ........................................................................... 154
Figure 2. Original occupants‟ destinations and newcomers‟ origins .......................................................... 161
Chapter 10
Figure 1. Time receiving water connection per day ............................................................................ 183
Figure 2. Water treatment before consumption .................................................................................. 184
Figure 3. Energy sources used for cooking .......................................................................................... 185
Annex
Figure 1. Main income earner daily working hour‘s distribution ...................................................... 198
Figure 2. Total household income distribution .................................................................................... 199
Figure 3. Expenditure by items (mean of percentage expenditure in each item) ........................... 200
Figure 4. Durable goods (percentage of households in each group having durable good) ........... 201
xi
List of Tables Chapter 1
Table 1. UN-Habitat definition of slums .................................................................................................. 9
Table 2. Issues covered in slum definition ............................................................................................. 10
Table 3. Evolution of slums policies ....................................................................................................... 19
Chapter 2
Table 1. Theoretical slum formation models ......................................................................................... 35
Chapter 3
Table 1. Types and levels of informality ................................................................................................ 50
Table 2. Evolution of laws and policies ................................................................................................. 51
Table 3. Urban Integral Projects, UIPs (Proyectos Urbanos Integrales, PUI) ....................................... 55
Table 4. Components of Urban Integral Interventions UIPs .................................................................... 56
Table 5. The informal city and inclusion policies in Medellin and Mumbai .................................... 59
Chapter 4
Table 1. Variables used in the hedonic price regression ....................................................................... 72
Table 2. Summary statistics ....................................................................................................................... 77
Table 3. OLS Results hedonic price models .......................................................................................... 79
Table 4. Contract clauses and expressed perception of risk ................................................................ 81
Table 5. Oral versus written contracts, general results ......................................................................... 82
Chapter 5
Table 1. Literature review and analysis of relevant empirical studies related to slum or housing
upgrading interventions. ............................................................................................................................ 99
Table 2. Methodologies used for the empirical analysis of the Slum Rehabilitation Scheme in
Mumbai and Urban Renewal Intervention in Medellin ...................................................................... 100
Chapter 6
Table 1. Criteria for the identification of treated and control groups or treatment ............................ 115
Table 2. Metrocable‘s effect on housing consolidation .......................................................................... 118
Table 3. Metrocable‘s and UIP‘s effect on housing consolidation ....................................................... 120
Table 4. The effects of URP by tenure security and type of occupation–model [2b] .................... 122
Table 5. Description of variables ........................................................................................................... 124
Table 6. Summary statistics from the 2002-2003 SISBEN database ................................................ 125
Table 7. Metrocable effects using distance to Metrocable line- model [1a] .............................................. 126
Table 8. Metrocable effects for different values of dt‟ - model [1b] ...................................................... 126
Table 9.. The effects of URP by tenure security and type of occupation–model [2a] ................... 126
Chapter 7
Table 1. General Information on the Slum Rehabilitation Scheme ........................................................ 135
xii
Chapter 8
Table 1. Residential mobility post–rehabilitation ................................................................................ 152
Table 2. Changes in housing attributes for treated group following SRS .......................................... 156
Table 3. Differences in mean expenditure between control and treated households ......................... 157
Table 4. Housing valuation ..................................................................................................................... 159
Table 5. Original occupants & Newcomers .................................................................................................. 162
Chapter 9
Table 1. Reasons for not taking loans in the period of analysis ........................................................ 169
Table 2. Reasons for not taking loans in the period of analysis ........................................................ 169
Table 3. Reasons for not taking loans in the period of analysis ........................................................ 170
Table 4. Information required, average monthly interest rate and average amount granted by
source of loan ............................................................................................................................................ 171
Table 5. Housing investments ................................................................................................................ 172
Chapter 10
Table 1. Slum housing deficiencies and SRS provision ...................................................................... 179
Table 2. Improvement of access to basic services ............................................................................... 182
Annex
Table 1. Summary statistics ..................................................................................................................... 197
Table 2. All income members and main income members summary statistics ............................... 198
Table 3. Expenditure by items (mean of percentage expenditure in each item) ............................. 199
Table 4. Savings, durable goods and shortfalls .................................................................................... 200
Table 5. Main reasons for moving to slum ........................................................................................... 201
Table 6. Satisfaction with rehabilitated apartments (only for treated) .............................................. 201
Table 7. Satisfaction with rehabilitated tenements by item (most to least important) ................... 201
Table 8. Dissatisfaction with rehabilitated tenements by item (most to least disliked) ................. 202
Table 9. Satisfaction with the level of cleanliness of the neighborhood and perception of security
in neighborhood ....................................................................................................................................... 202

xiii
xiv
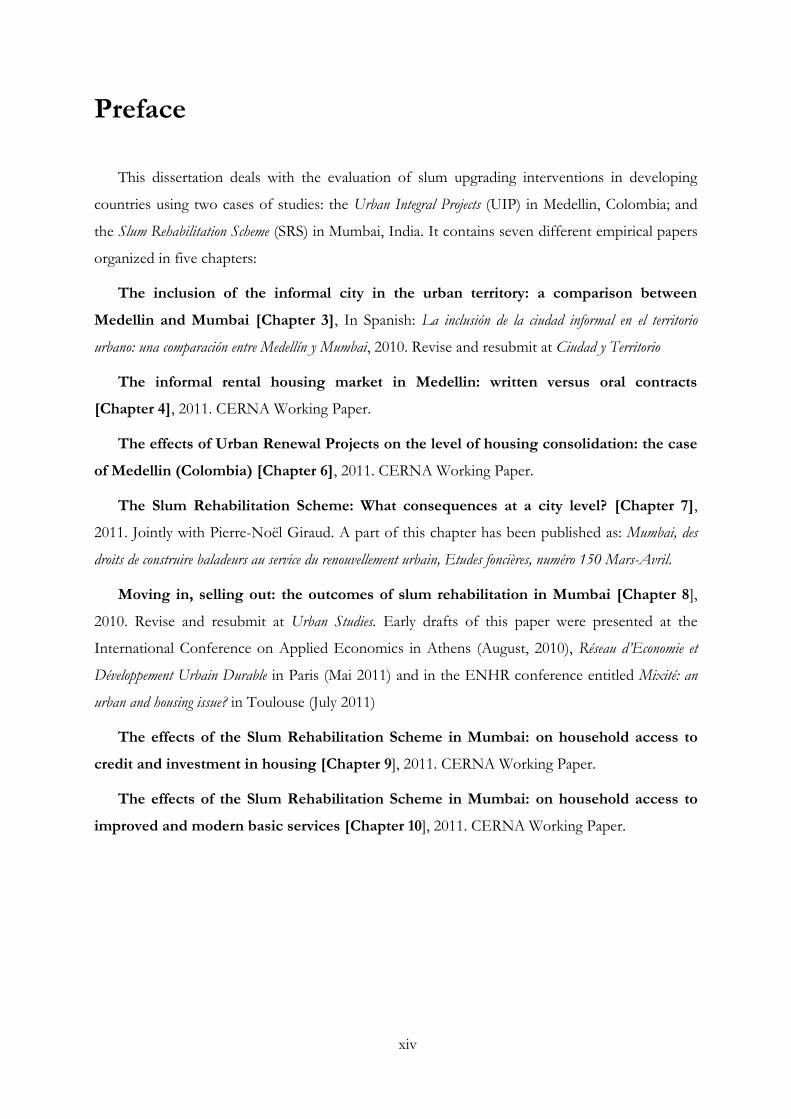
Preface
This dissertation deals with the evaluation of slum upgrading interventions in developing
countries using two cases of studies: the Urban Integral Projects (UIP) in Medellin, Colombia; and
the Slum Rehabilitation Scheme (SRS) in Mumbai, India. It contains seven different empirical papers
organized in five chapters:
The inclusion of the informal city in the urban territory: a comparison between
Medellin and Mumbai [Chapter 3], In Spanish: La inclusión de la ciudad informal en el territorio
urbano: una comparación entre Medellín y Mumbai, 2010. Revise and resubmit at Ciudad y Territorio
The informal rental housing market in Medellin: written versus oral contracts
[Chapter 4], 2011. CERNA Working Paper.
The effects of Urban Renewal Projects on the level of housing consolidation: the case
of Medellin (Colombia) [Chapter 6], 2011. CERNA Working Paper.
The Slum Rehabilitation Scheme: What consequences at a city level? [Chapter 7],
2011. Jointly with Pierre-Noël Giraud. A part of this chapter has been published as: Mumbai, des
droits de construire baladeurs au service du renouvellement urbain, Etudes foncières, numéro 150 Mars-Avril.
Moving in, selling out: the outcomes of slum rehabilitation in Mumbai [Chapter 8],
2010. Revise and resubmit at Urban Studies. Early drafts of this paper were presented at the
International Conference on Applied Economics in Athens (August, 2010), Réseau d‟Economie et
Développement Urbain Durable in Paris (Mai 2011) and in the ENHR conference entitled Mixité: an
urban and housing issue? in Toulouse (July 2011)
The effects of the Slum Rehabilitation Scheme in Mumbai: on household access to
credit and investment in housing [Chapter 9], 2011. CERNA Working Paper.
The effects of the Slum Rehabilitation Scheme in Mumbai: on household access to
improved and modern basic services [Chapter 10], 2011. CERNA Working Paper.

xv
1
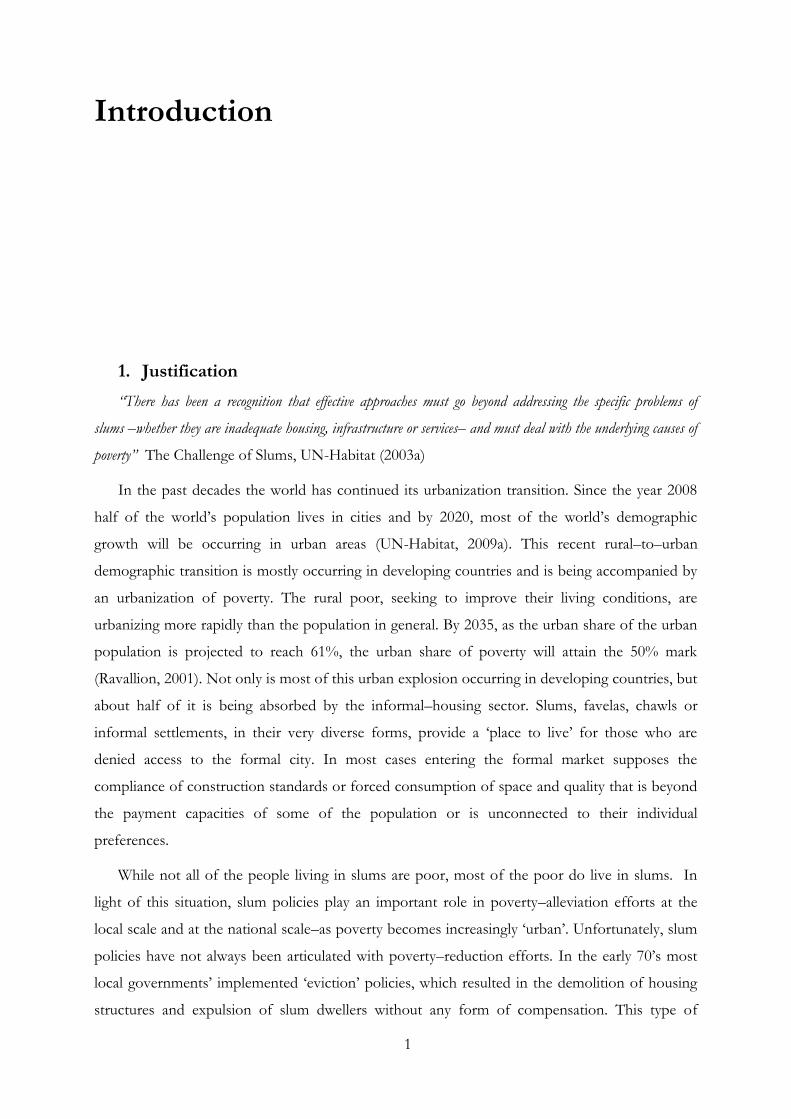
Introduction
1. Justification
“There has been a recognition that effective approaches must go beyond addressing the specific problems of
slums –whether they are inadequate housing, infrastructure or services– and must deal with the underlying causes of
poverty” The Challenge of Slums, UN-Habitat (2003a)
In the past decades the world has continued its urbanization transition. Since the year 2008
half of the world‘s population lives in cities and by 2020, most of the world‘s demographic
growth will be occurring in urban areas (UN-Habitat, 2009a). This recent rural–to–urban
demographic transition is mostly occurring in developing countries and is being accompanied by
an urbanization of poverty. The rural poor, seeking to improve their living conditions, are
urbanizing more rapidly than the population in general. By 2035, as the urban share of the urban
population is projected to reach 61%, the urban share of poverty will attain the 50% mark
(Ravallion, 2001). Not only is most of this urban explosion occurring in developing countries, but
about half of it is being absorbed by the informal–housing sector. Slums, favelas, chawls or
informal settlements, in their very diverse forms, provide a ‗place to live‘ for those who are
denied access to the formal city. In most cases entering the formal market supposes the
compliance of construction standards or forced consumption of space and quality that is beyond
the payment capacities of some of the population or is unconnected to their individual
preferences.
While not all of the people living in slums are poor, most of the poor do live in slums. In
light of this situation, slum policies play an important role in poverty–alleviation efforts at the
local scale and at the national scale–as poverty becomes increasingly ‗urban‘. Unfortunately, slum
policies have not always been articulated with poverty–reduction efforts. In the early 70‘s most
local governments‘ implemented ‗eviction‘ policies, which resulted in the demolition of housing
structures and expulsion of slum dwellers without any form of compensation. This type of
2
policies, while literally resulting in the elimination of slums in the very short term–as communities
sometimes waited for the bulldozes to leave to start reconstructing their huts–lead principally to a
further impoverishment of slum households that lost the little physical capital they had in a blink
of an eye.
The international community has, however, come a long way from the time in which eviction
was the main slum policy implemented. The ‗slum problem‘ has been recognized as one of the
world‘s major development challenges and ‗friendlier‘ slum policies have emerged in many
developing world cities. In 2000, the improvement of the lives of at least 100 million slum
dwellers was set as one the Millennium Development Goals (MDG) targets to be achieved by the
year 2015. However, the emergence of ‗friendlier‘ slum policies does not respond to a sudden
change in the vision of slums, but is the result of a chain of events. On the one hand, local and
national governments began moving away from policies that had proved to be inefficient and
moved towards policies that seemed better. After years of implementation, most Site–and–Services
programs were abandoned and replaced for titling and/or slum upgrading interventions. On the
other hand, the ‗slum problem‘ began to be recognized by policy makers as a strategic component
of cities‘ political economy. The inclusion of slum policies in the political agenda, depending on
the proportion and rights of the slum population in question, allowed some political parties to
access or remain in power. On many occasions, slum policies are designed to target specific areas
of concern (i.e. violent favelas) or strategic zones important to the city‘s competiveness (i.e.
airports, city centers). Because of this, poverty reduction is rarely set as the main objective of
slum policies and, when occurring, is an indirect result of their application.
But how can slum policies affect households‘ welfare? Recent empirical studies have revealed
how some slum policies might have substantial welfare gains while others can lead to a
reinforcement of poverty. Field (2003, 2005, 2007) found a significant increase in housing
investments, a reduction of fertility and an increase in the number of working hours of
beneficiary households‘ in Peru, following a massive titling campaign. The indirect means which
produced these results reveal the complexity of human behavior under insecure tenure rights.
Fertility reduction was associated with the shift in bargaining power inside the household due to
the inclusion of spouses‘ names in ownership documents. As women had on average, lower
preferences for the number of children, titling leaded indirectly to a reduction in fertility. The
increase in the number of working hours was explained through the reallocation of time
previously used to ‗protect‘ dwellings–and the physical capital captured in them–to income–
generating activities. On the contrary, an empirical study–which compared the welfare effects of
two hypothetical slum improvement policies, in-situ upgrading versus upgrading and relocation–
3
suggested that when workplace location is held fixed–meaning that households conserve their
initial jobs–relocation can be welfare reducing (Takeuchi et al. 2008).
This thesis focuses on two aspects within the vast field of policy evaluation. The first aspect,
covered in Part I of this dissertation, comprehends an analysis of slum formation mechanisms in
Medellin and Mumbai. The second aspect, covered here in Part II, comprehends the evaluation
of the welfare effects of slum–upgrading intervention using two slum–upgrading interventions as
cases of studies: the Urban Integral Projects (UIP) in Medellin, Colombia; and the Slum Rehabilitation
Scheme (SRS) in Mumbai, India. The evaluation of these cases of study, as will be discussed in the
Chapters following this introduction, is appealing given that both of these policies have been
recognized by the international community as successful and have introduced substantial
innovations in policy design. The Slum Rehabilitation Scheme (SRS) in Mumbai adapted the use of
Additional Development Rights programs–previously used in developed countries to protect
heritage buildings, avoid urban sprawl and create incentives to provide public goods- to
reconstruct and rehabilitate slum settlements while shifting the burden of financing slum
upgrading to the private sector. In Medellin, Urban Integral Projects (UIP) moved away from
traditionally applied slum policies by concentrating on everything that is outside the house,
instead of targeting one or more of the slum criteria defined by United Nations1. UIP,
implemented in most marginalized areas of the city, involve, among others, the improvement of
public amenities, neighborhood interconnectivity and mobility.
The purpose of this thesis is to try to go further and solve questions that remain unsolved in
the literature related to slum policies, evaluate whether previous empirical findings are confirmed
using different methodologies and analyzing different policy frameworks, and respond to specific
research questions that are relevant to the local context of these two cities (i.e. stakeholders,
policy‘s objectives). The set of questions touched upon in Part I and Part II of this dissertation
includes the following: What are the magnitude and causes of post–rehabilitation residential
mobility in Mumbai? What are the impacts of slum rehabilitation on households‘ access to credit
and housing investments? What are the consequences–at the city level–of the Slum Rehabilitation
Scheme on population density distribution? And, what are the effects of Urban Renewal Projects in
Medellin on the level of housing consolidation?
1 A slum was defined by UN-Habitat (2009a) as an area that combines the following characteristics: inadequate access to water, inadequate access to sanitation and other infrastructure, poor structural quality in housing, overcrowding and insecure residential status.
4
2. Methodology
Since the empirical methodology used to solve each of the questions addressed in this
dissertation is different and is outlined in each of the Chapters following this introduction, only a
general description of the main sources of information is presented here. For more information
on the methodology used for each empirical analysis and a comparison to existent methodologies
applied in literature, please refer to Chapter 5.
In the case of Mumbai, given the difficulties to obtain relevant information in order to
answer the research question delimited, first–hand data was collected by the author in
cooperation with an NGO (the Slum Rehabilitation Society) and a market research company that had
previous experience working in slums (Mars Ltda.). A household survey was carried out in nine
slum pockets, four of which had already been rehabilitated and five that had already started the
rehabilitation administrative procedure, but were still slums. This first–hand data is used for the
analysis of the household level impacts of slum rehabilitation in Mumbai in Chapter 8 and 9. For
the analysis of the effects of slum rehabilitation at a city level, three different sources of
information were used. The first corresponds to a database of all the SRS projects obtained from
the Slum Rehabilitation Authority of Mumbai. The second corresponds to the ‗Transfer
Development Rights‘ database obtained from the Municipal Corporation of Greater Mumbai and
the third corresponds to the World Bank Transport and Urban Poverty Survey–which contained
information on housing prices and surfaces–provided by the World Bank Washington.
In the case of Medellin, given the availability of good quality data at household level and the
possibility of having access to it, no household survey was needed, although a number of
informal meetings with the communities involved and other stakeholders were held. Household–
level information was obtained from three secondary sources: the Quality of Life Survey (2004,
2005, 2006, 2007 & 2008), the Medellin Solidaria Survey (2008-2009) and SISBEN Surveys (2002,
2003, 2004, 2006 & 2010).
3. Structure of the document
This dissertation is organized in two parts (Part I and Part II) and ten Chapters. Figure 1
presents a graphic description of the dissertation structure. Preceding Part I is Chapter 1, which
addresses issues that are essential for the comprehension of the context in which this thesis is
placed, such as the definition of slums, the magnitude and recent evolution of slum settlements
worldwide and a brief description of the historic evolution of slum policies. Part I entitled
‗Understanding slum formation mechanisms‟ is composed of three chapters. Chapter 2 presents the
literature review on slum formation covering the most recurrent myths related to slum formation
5
and the most recent and relevant theoretical and empirical literature related to this subject.
Chapter 3 presents a comparative analysis of slum formation and slum policies in Medellin and
Mumbai. Chapter 4 evaluates the value that informal renters give to different rental contracts in
the city of Medellin, using hedonic prices techniques.
The second part of this thesis (Part II) entitled ‗The impacts of slum interventions on households‟
welfare‟ is composed of five chapters. It covers an evaluation of the effects of two different urban
renewal interventions in Medellin on housing investments and a set of studies on the effects of
the Slum Rehabilitation Scheme in Mumbai at an individual scale and at the city scale. Chapter 5
presents a brief review of the available methodologies to evaluate slum interventions and relevant
examples of slum policies evaluation. Chapter 6 focuses on the effects of Urban Renewal
Projects on the level of housing consolidation in Medellin. Chapter 7 evaluates the
achievements–in terms of slum absorption–of the Slum Rehabilitation Scheme and its
consequences on population–density distribution at the city level. Chapter 8 deals with one of
the possible indirect consequences of slum rehabilitation in Mumbai: policy–induced residential
mobility. Chapter 9 seeks to evaluate one of the most recurrent myths associated to slum and
titling policies: improvement in access to credit and evolution of housing investments. Chapter
10 evaluates if expected improvements in access to modern basic services of the SRS policy were
translated into action. Following Chapter 10, general conclusions and perspectives are outlined.
The Annex at the end of this dissertation contains a set of summary statistics, product of the
SRS household survey that were not included in the other chapters dealing with the policy‘s
impacts but that could be used in future publications
While all of the papers deal with very similar research topics, each paper puts forward distinct
research question and can be read on its own.
6
Figure 1. Structure of the document
Conclusions and perspectives
Part II: The impact of slum interventions on households’ welfare
Chapter 5: Measuring the effects of slum policies
Chapter 6: The effects of Urban Renewal Projects on the level of housing
consolidation: The case of Medellin (Colombia)
Chapter 7: The Slum Rehabilitation Scheme: what consequences at a city level?
Chapter 8: Moving in, Selling Out: The Outcomes of Slum Rehabilitation in
Mumbai
Chapter 9: The effects of the Slum Rehabilitation Scheme in Mumbai: on
household access to credit and investment in housing
Chapter 10: The effects of the Slum Rehabilitation Scheme in Mumbai: on
household access to improved and modern basic services
Part I: Understanding slum formation mechanisms
Chapter 2: On the mechanisms of slum formation
Chapter 3: The inclusion of the informal city in the urban territory: a
comparison between Medellin and Mumbai
Chapter 4: The informal rental housing market in Medellin: written versus oral
contracts
Introduction
Chapter 1: The Challenge of Slums
7
Chapter 1
The Challenge of Slums1
1. Defining slums
Slums, favelas, bidonvilles, shantytowns, villas miseria, aashwa'i are all different names that
describe one of the most common human settlements in developing cities: informal settlements.
But what exactly are slums or informal settlements? The first known definition in the English
language of the word slum appeared in the Vocabulary of Flash Language in 1812, where it is given as
a synonym with ―racket‖ or ―criminal trade‖ (Davis, 2006). At this time slum settlements were
associated with urban areas in which the poor lived under precarious sanitary conditions, an idea
that is still very accurate to describe today‘s slums, but also referred to areas that concentrated a
number of criminal activities. The stigmatization of slums as areas housing criminal populations
persisted; in 1894, the US Department of Labor, in its survey entitled The Slums of Great Cities,
defined slums as “areas of dirty back streets especially when inhabited by a squalid and criminal population”
Davis (2006). Today the Merriam-Webster Dictionary defines slums as ―a densely populated usually
urban area marked by crowding, dirty run-down housing, poverty, and social disorganization” (Webster, 2011).
The last definition evidences how–despite having moved away from the criminal perception of
slums–there are still a number of behavioral characteristics associated with slums (social
disorganization).
London, Manhattan, Tokyo and many of today‘s world–class cities were littered with slums at
the time of the Industrial Revolution and the beginning of the world‘s urbanization (WB, 2009a).
In retrospect, the appearance of slums has almost always been linked to rapid urbanization rates
and early processes of urbanization. This idea has led many to think that slums are a normal step
in the urbanization process, and that a higher level of urbanization and economic growth will lead
to the disappearance of slums in developing cities–as was the case of today‘s developed cities.
1 Expression borrowed from UN-Habitat(2003a) Global Report on Human Settlements 2003 : The Challenge of Slums
8
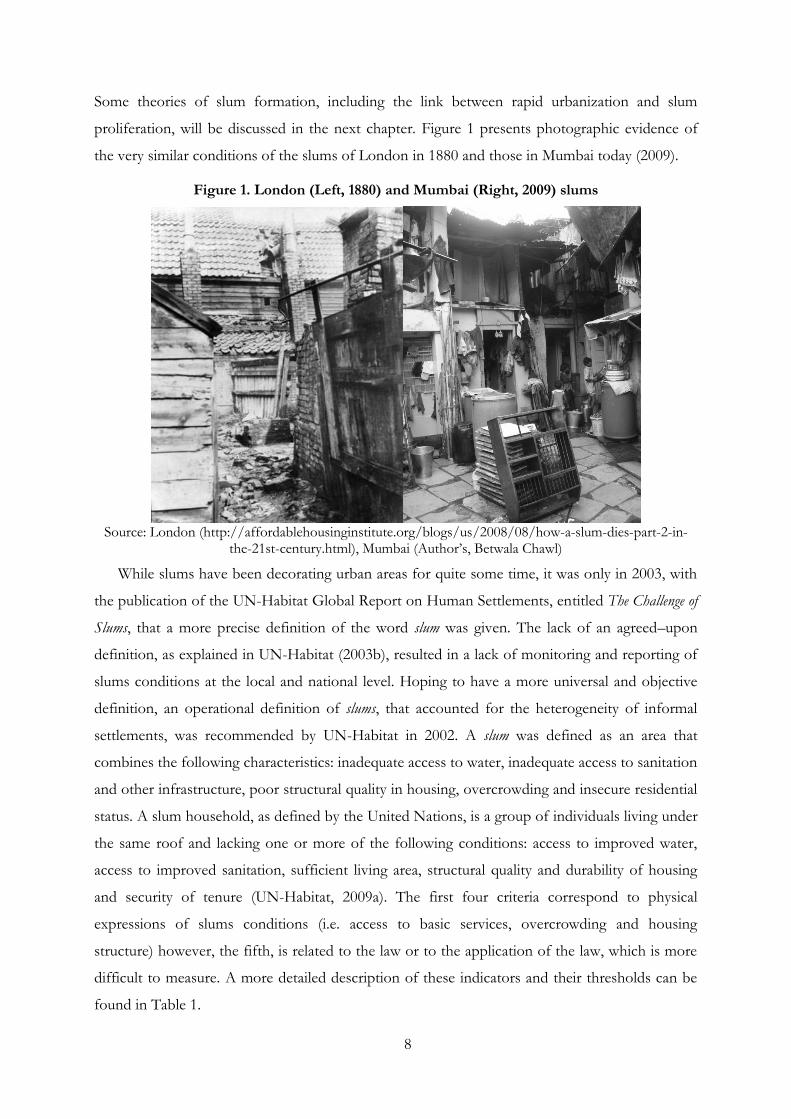
Some theories of slum formation, including the link between rapid urbanization and slum
proliferation, will be discussed in the next chapter. Figure 1 presents photographic evidence of
the very similar conditions of the slums of London in 1880 and those in Mumbai today (2009).
Figure 1. London (Left, 1880) and Mumbai (Right, 2009) slums
Source: London (http://affordablehousinginstitute.org/blogs/us/2008/08/how-a-slum-dies-part-2-in-
the-21st-century.html), Mumbai (Author‘s, Betwala Chawl)
While slums have been decorating urban areas for quite some time, it was only in 2003, with
the publication of the UN-Habitat Global Report on Human Settlements, entitled The Challenge of
Slums, that a more precise definition of the word slum was given. The lack of an agreed–upon
definition, as explained in UN-Habitat (2003b), resulted in a lack of monitoring and reporting of
slums conditions at the local and national level. Hoping to have a more universal and objective
definition, an operational definition of slums, that accounted for the heterogeneity of informal
settlements, was recommended by UN-Habitat in 2002. A slum was defined as an area that
combines the following characteristics: inadequate access to water, inadequate access to sanitation
and other infrastructure, poor structural quality in housing, overcrowding and insecure residential
status. A slum household, as defined by the United Nations, is a group of individuals living under
the same roof and lacking one or more of the following conditions: access to improved water,
access to improved sanitation, sufficient living area, structural quality and durability of housing
and security of tenure (UN-Habitat, 2009a). The first four criteria correspond to physical
expressions of slums conditions (i.e. access to basic services, overcrowding and housing
structure) however, the fifth, is related to the law or to the application of the law, which is more
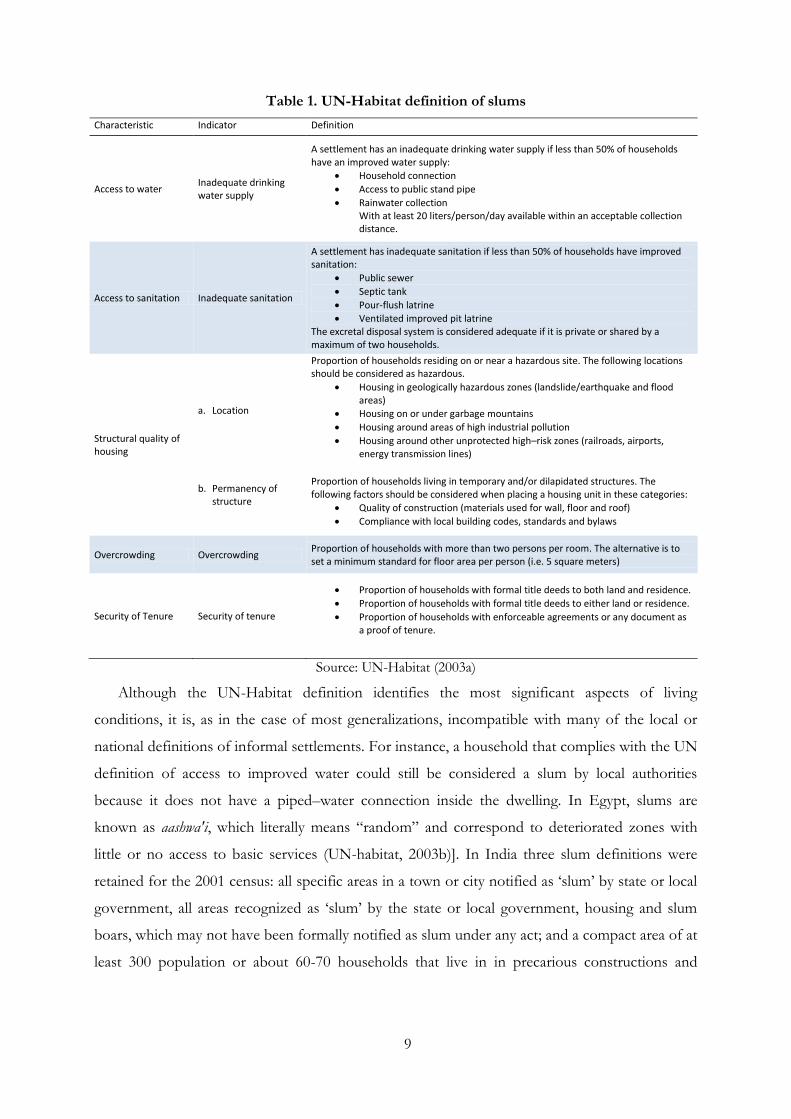
difficult to measure. A more detailed description of these indicators and their thresholds can be
found in Table 1.
9
Table 1. UN-Habitat definition of slums
Characteristic Indicator Definition
Access to water Inadequate drinking water supply
A settlement has an inadequate drinking water supply if less than 50% of households have an improved water supply:
Household connection
Access to public stand pipe
Rainwater collection With at least 20 liters/person/day available within an acceptable collection distance.
Access to sanitation Inadequate sanitation
A settlement has inadequate sanitation if less than 50% of households have improved sanitation:
Public sewer
Septic tank
Pour-flush latrine
Ventilated improved pit latrine The excretal disposal system is considered adequate if it is private or shared by a maximum of two households.
Structural quality of housing
a. Location
Proportion of households residing on or near a hazardous site. The following locations should be considered as hazardous.
Housing in geologically hazardous zones (landslide/earthquake and flood areas)
Housing on or under garbage mountains
Housing around areas of high industrial pollution
Housing around other unprotected high–risk zones (railroads, airports, energy transmission lines)
b. Permanency of structure
Proportion of households living in temporary and/or dilapidated structures. The following factors should be considered when placing a housing unit in these categories:
Quality of construction (materials used for wall, floor and roof)
Compliance with local building codes, standards and bylaws
Overcrowding Overcrowding Proportion of households with more than two persons per room. The alternative is to set a minimum standard for floor area per person (i.e. 5 square meters)
Security of Tenure Security of tenure
Proportion of households with formal title deeds to both land and residence.
Proportion of households with formal title deeds to either land or residence.
Proportion of households with enforceable agreements or any document as a proof of tenure.
Source: UN-Habitat (2003a)
Although the UN-Habitat definition identifies the most significant aspects of living
conditions, it is, as in the case of most generalizations, incompatible with many of the local or
national definitions of informal settlements. For instance, a household that complies with the UN
definition of access to improved water could still be considered a slum by local authorities
because it does not have a piped–water connection inside the dwelling. In Egypt, slums are
known as aashwa'i, which literally means ―random‖ and correspond to deteriorated zones with
little or no access to basic services (UN-habitat, 2003b)]. In India three slum definitions were
retained for the 2001 census: all specific areas in a town or city notified as ‗slum‘ by state or local
government, all areas recognized as ‗slum‘ by the state or local government, housing and slum
boars, which may not have been formally notified as slum under any act; and a compact area of at
least 300 population or about 60-70 households that live in in precarious constructions and
10
overpopulated dwellings, in unhealthy environments and have bad access to infrastructures
(Government of India, 2001).
At the local level, slums are delimited along with national, regional or local definitions of
minimum living standards, national laws and urban planning. For instance, zoning, construction and
land regulations–which are generally defined locally–delimit what belongs to the planned city and
what does not. In some occasions housing solutions located in zones, which are considered
industrial according to Master Plans, could still be considered illegal or informal even when
complying with construction standards. In the same way, at the national level, private property
laws define the rights and duties accorded to private property and in some cases the available
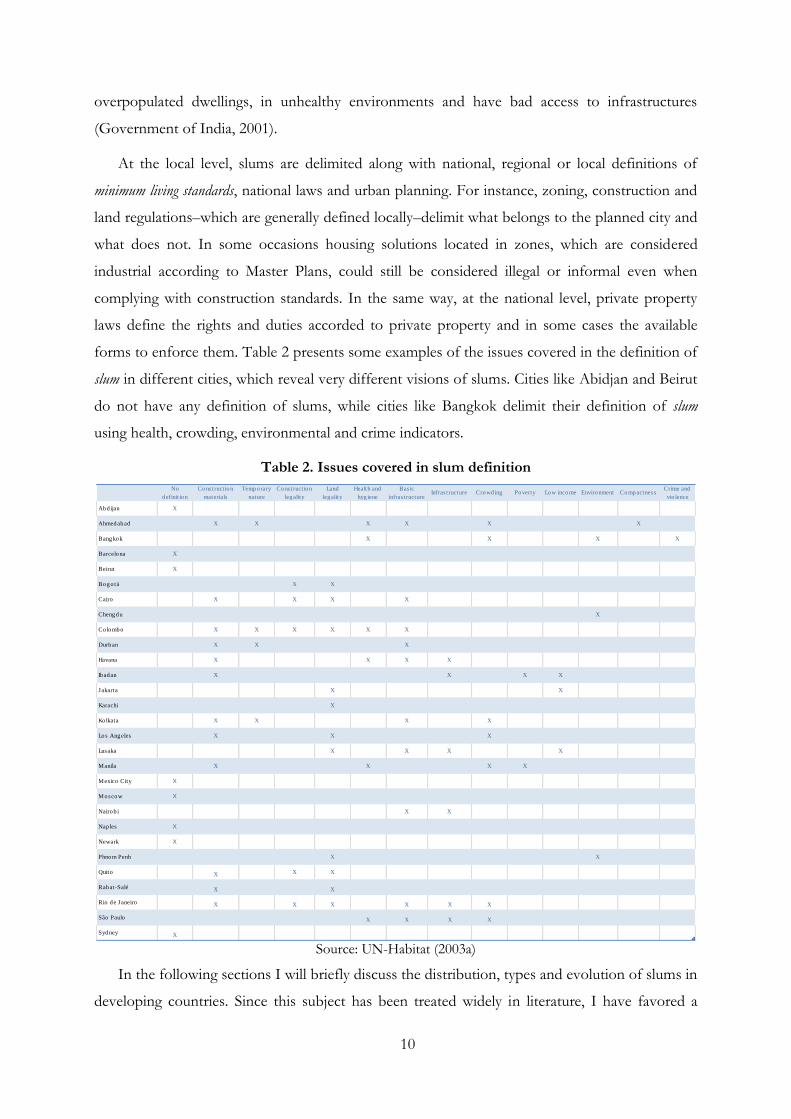
forms to enforce them. Table 2 presents some examples of the issues covered in the definition of
slum in different cities, which reveal very different visions of slums. Cities like Abidjan and Beirut
do not have any definition of slums, while cities like Bangkok delimit their definition of slum
using health, crowding, environmental and crime indicators.
Table 2. Issues covered in slum definition
Source: UN-Habitat (2003a)
In the following sections I will briefly discuss the distribution, types and evolution of slums in
developing countries. Since this subject has been treated widely in literature, I have favored a
No
definit ion
Cons truct ion
materials
Temporary
nature
Cons truct ion
legality
Land
legality
Health and
hyg iene
Bas ic
infras tructureInfras tructure Crowd ing Poverty Low income Environment Compactness
Crime and
vio lence
Abd ijan X
Ahmedabad X X X X X X
Bangkok X X X X
Barcelona X
Beirut X
Bogo tá X X
Cairo X X X X
Chengdu X
Colombo X X X X X X
Durban X X X
Havana X X X X
Ibadan X X X X
Jakarta X X
Karachi X
Kolkata X X X X
Los Angeles X X X
Lusaka X X X X
Manila X X X X
Mexico City X
Moscow X
Nairob i X X
Nap les X
Newark X
Phnom Penh X X
Quito X X X
Rabat-Salé X X
Rio de Janeiro X X X X X X
São Paulo X X X X
Sydney X
11
more compact description of the challenge of slums that will help understand the context in
which the research questions developed in this dissertation are situated. For a more detailed
analysis, please refer to the bibliography mentioned, especially to UN-Habitat (2003a). In Section
2 a concise description of the state of the world‘s slums is presented along with an analysis of the
evolution of slums indicators in a set of cities between 1993 and 2003. In Section 3 the evolution
of the vision of slums and slum policies is presented.
2. Planet of slums2
Based on the slum definition previously discussed and a set of urban indicators, UN-Habitat
estimated the slum population in 2001 at 924 million (UN-Habitat, 2003b). With most of the
urbanization occurring in developing countries, between 2000 and 2010 the urban population in
the developing world increased by an average of 58 million per year and the number of slum
dwellers by 28 million per year; therefore, about half of the developing world‘s urbanization is
being absorbed by the informal–housing sector (UN-Habitat, 2010). At this pace, projections
suggest that the slum population will double its size to reach the two billion mark between 2030
and 2040 (UN, 2007). While, as previously discussed, these numbers might not correspond to the
local or national definition of slums in most developing countries, they do serve to identify the
extension of the population living with considerable shelter deprivations.
Declining proportions, increasing numbers
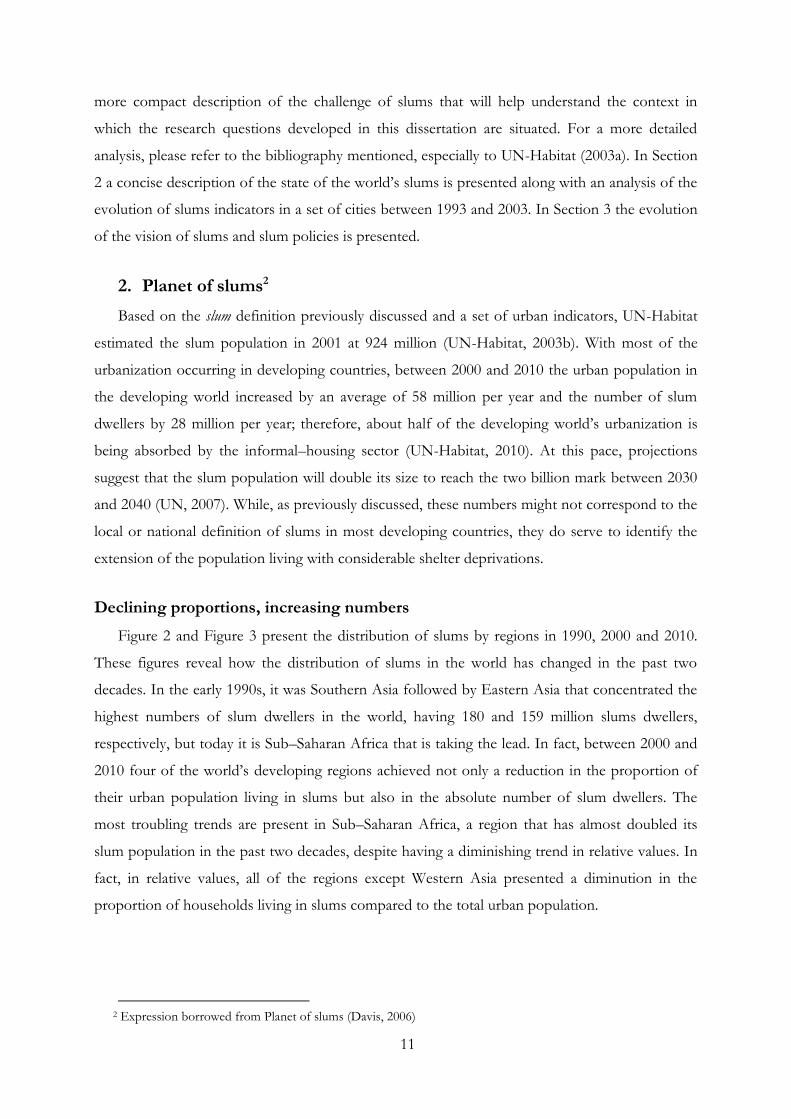
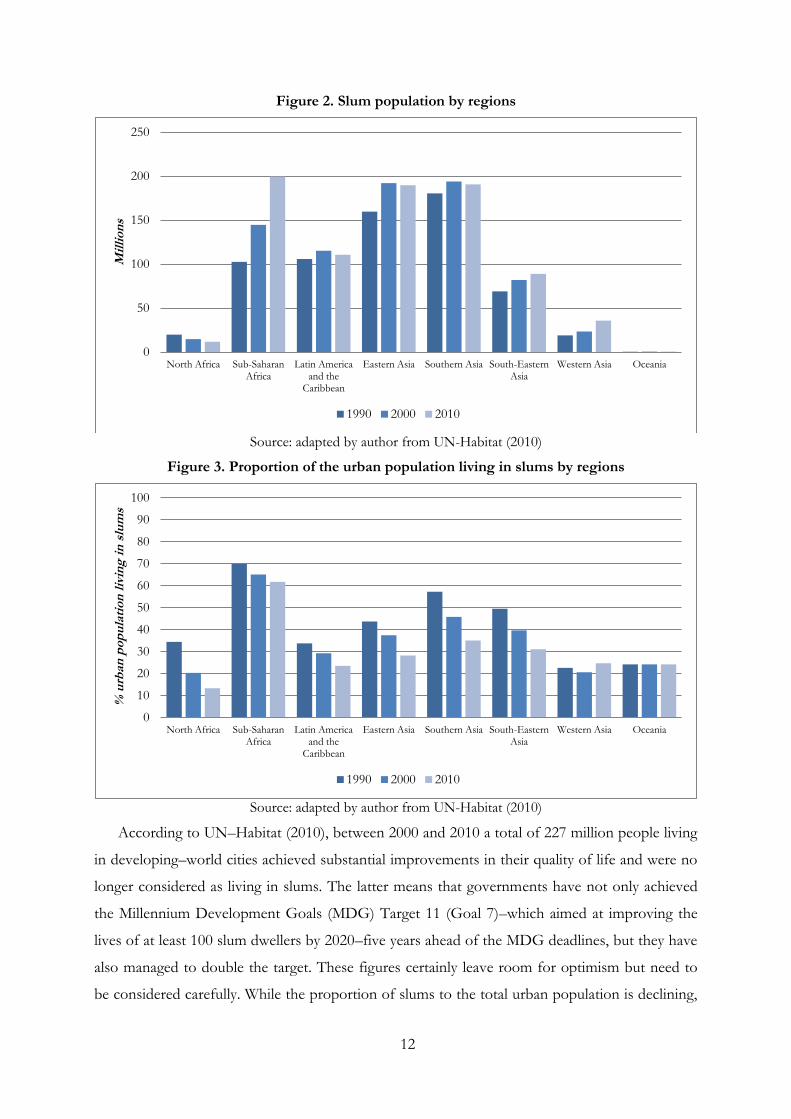
Figure 2 and Figure 3 present the distribution of slums by regions in 1990, 2000 and 2010.
These figures reveal how the distribution of slums in the world has changed in the past two
decades. In the early 1990s, it was Southern Asia followed by Eastern Asia that concentrated the
highest numbers of slum dwellers in the world, having 180 and 159 million slums dwellers,
respectively, but today it is Sub–Saharan Africa that is taking the lead. In fact, between 2000 and
2010 four of the world‘s developing regions achieved not only a reduction in the proportion of
their urban population living in slums but also in the absolute number of slum dwellers. The
most troubling trends are present in Sub–Saharan Africa, a region that has almost doubled its
slum population in the past two decades, despite having a diminishing trend in relative values. In
fact, in relative values, all of the regions except Western Asia presented a diminution in the
proportion of households living in slums compared to the total urban population.
2 Expression borrowed from Planet of slums (Davis, 2006)
12
Figure 2. Slum population by regions
Source: adapted by author from UN-Habitat (2010)
Figure 3. Proportion of the urban population living in slums by regions
Source: adapted by author from UN-Habitat (2010)
According to UN–Habitat (2010), between 2000 and 2010 a total of 227 million people living
in developing–world cities achieved substantial improvements in their quality of life and were no
longer considered as living in slums. The latter means that governments have not only achieved
the Millennium Development Goals (MDG) Target 11 (Goal 7)–which aimed at improving the
lives of at least 100 slum dwellers by 2020–five years ahead of the MDG deadlines, but they have
also managed to double the target. These figures certainly leave room for optimism but need to
be considered carefully. While the proportion of slums to the total urban population is declining,
0
50
100
150
200
250
North Africa Sub-Saharan Africa
Latin America and the
Caribbean
Eastern Asia Southern Asia South-Eastern Asia
Western Asia Oceania
Mil
lio
ns
1990 2000 2010
0
10
20
30
40
50
60
70
80
90
100
North Africa Sub-Saharan Africa
Latin America and the
Caribbean
Eastern Asia Southern Asia South-Eastern Asia
Western Asia Oceania
% u
rban
po
pu
lati
on
liv
ing
in
slu
ms
1990 2000 2010
13
the number of slum dwellers worldwide continues to grow and trends diverge from one region to
another and between regions. China, India, Indonesia, Brazil and Colombia are among the most
successful countries, achieving together the improvement of the living conditions of around 160
million slum dwellers. On the contrary in countries like Benin, Ethiopia, Zimbabwe and Malawi,
slum prevalence remains very high and the slum population continues to increase (UN-Habitat,
2010). Furthermore, the 100 million slum dwellers‘ target set in 2000 for the MDG was selected
as a symbolic number. At this time no accurate global estimates of the magnitude of slums
existed, and it was only in 2002 that the first estimations of the ‗slum problem‘ appeared based on
the five criteria previously discussed.
Trends in urban and slum indicators 1990–20033
This sub-section is based on a study done by Martinez et al. (2008) examining the evolution
of multiple shelter and slum indicators in 188 cities belonging to eight different regions. Their
analysis is based on the UN–Habitat Global Urban Indicators Database (GUID). Of the five
UN–Habitat indicators to evaluate shelter deprivations and identify slums (see Table 1), only four
are studied due to information constraints: durable structures, sufficient living area, access to safe
water and access to improve sanitation. The indicator which refers to security of tenure was not
analyzed since no data on tenure were included in the GUID. Results from their analysis are
presented in Figure 4 and Figure 5.
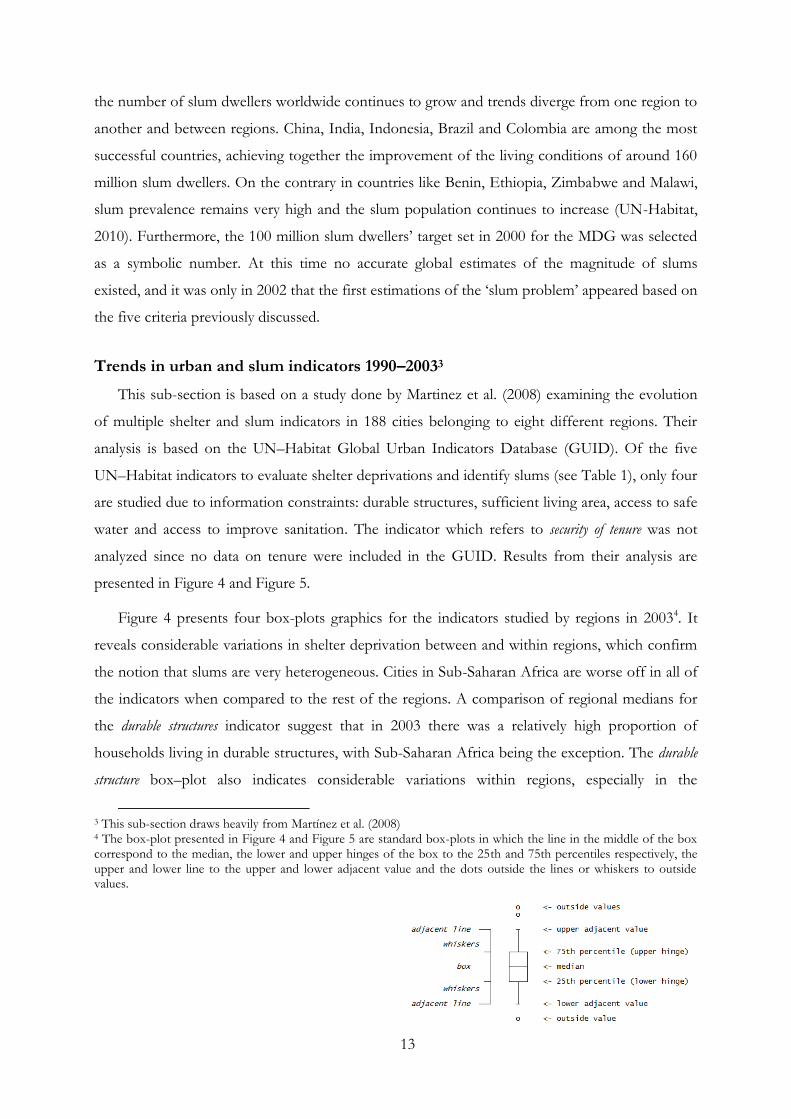
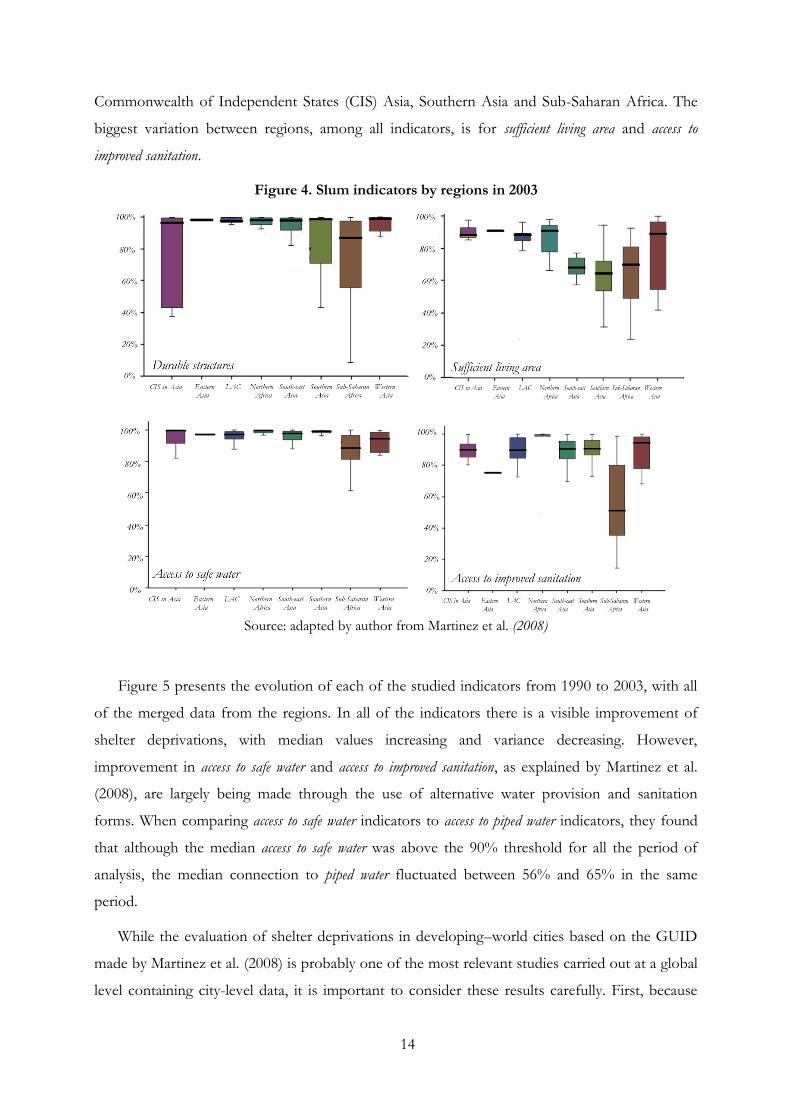
Figure 4 presents four box-plots graphics for the indicators studied by regions in 20034. It
reveals considerable variations in shelter deprivation between and within regions, which confirm
the notion that slums are very heterogeneous. Cities in Sub-Saharan Africa are worse off in all of
the indicators when compared to the rest of the regions. A comparison of regional medians for
the durable structures indicator suggest that in 2003 there was a relatively high proportion of
households living in durable structures, with Sub-Saharan Africa being the exception. The durable
structure box–plot also indicates considerable variations within regions, especially in the
3 This sub-section draws heavily from Martínez et al. (2008) 4 The box-plot presented in Figure 4 and Figure 5 are standard box-plots in which the line in the middle of the box correspond to the median, the lower and upper hinges of the box to the 25th and 75th percentiles respectively, the upper and lower line to the upper and lower adjacent value and the dots outside the lines or whiskers to outside values.
14
Commonwealth of Independent States (CIS) Asia, Southern Asia and Sub-Saharan Africa. The
biggest variation between regions, among all indicators, is for sufficient living area and access to
improved sanitation.
Figure 4. Slum indicators by regions in 2003
Source: adapted by author from Martinez et al. (2008)
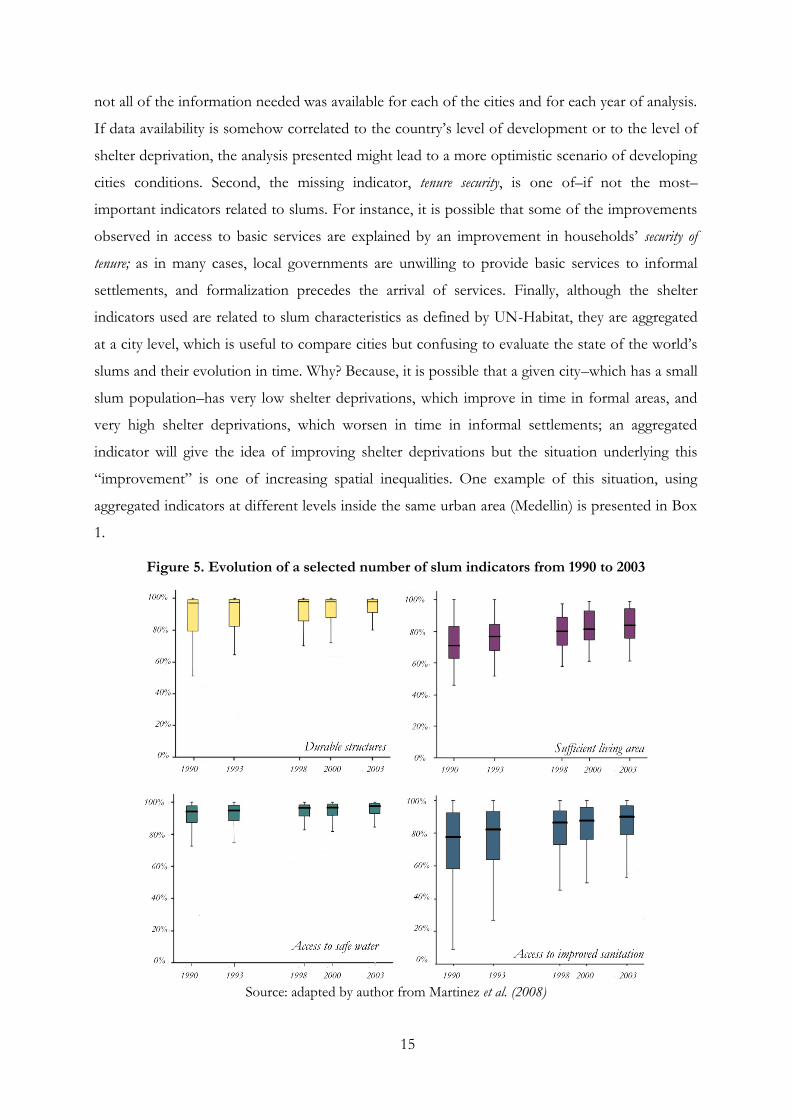
Figure 5 presents the evolution of each of the studied indicators from 1990 to 2003, with all
of the merged data from the regions. In all of the indicators there is a visible improvement of
shelter deprivations, with median values increasing and variance decreasing. However,
improvement in access to safe water and access to improved sanitation, as explained by Martinez et al.
(2008), are largely being made through the use of alternative water provision and sanitation
forms. When comparing access to safe water indicators to access to piped water indicators, they found
that although the median access to safe water was above the 90% threshold for all the period of
analysis, the median connection to piped water fluctuated between 56% and 65% in the same
period.
While the evaluation of shelter deprivations in developing–world cities based on the GUID
made by Martinez et al. (2008) is probably one of the most relevant studies carried out at a global
level containing city-level data, it is important to consider these results carefully. First, because
15
not all of the information needed was available for each of the cities and for each year of analysis.
If data availability is somehow correlated to the country‘s level of development or to the level of
shelter deprivation, the analysis presented might lead to a more optimistic scenario of developing
cities conditions. Second, the missing indicator, tenure security, is one of–if not the most–
important indicators related to slums. For instance, it is possible that some of the improvements
observed in access to basic services are explained by an improvement in households‘ security of
tenure; as in many cases, local governments are unwilling to provide basic services to informal
settlements, and formalization precedes the arrival of services. Finally, although the shelter
indicators used are related to slum characteristics as defined by UN-Habitat, they are aggregated
at a city level, which is useful to compare cities but confusing to evaluate the state of the world‘s
slums and their evolution in time. Why? Because, it is possible that a given city–which has a small
slum population–has very low shelter deprivations, which improve in time in formal areas, and
very high shelter deprivations, which worsen in time in informal settlements; an aggregated
indicator will give the idea of improving shelter deprivations but the situation underlying this
―improvement‖ is one of increasing spatial inequalities. One example of this situation, using
aggregated indicators at different levels inside the same urban area (Medellin) is presented in Box
1.
Figure 5. Evolution of a selected number of slum indicators from 1990 to 2003
Source: adapted by author from Martinez et al. (2008)
16
Slums and poverty
“Slums and poverty are closely related and mutually reinforcing, but the relationship is not always direct or
simple.” UN–Habitat, 2003a5
Two phenomena related to today‘s urbanization have led to an increased concentration of the
poor in urban areas. The first, introduced by Ravallion (2001) who studied cross-sectional data
for 39 countries, suggest that the poor are urbanizing more rapidly than the population as a
whole, which might lead to a shift in the rural–urban composition of poverty and a higher spatial
concentration of the poor in cities. The second, studied by Fay and Opal (2000), suggests that the
urbanization process occurring in developing countries is not always coupled with economic
growth. In their study, out of 187 countries reporting annual negative growth over a period of
five years, 183 experienced positive urbanization rates. As a large number of the world‘s rural
population continues to shift to urban areas, the distribution of the poor among rural and urban
areas is changing and poverty–reduction efforts need to account for these phenomena.
5 pp. XXVI
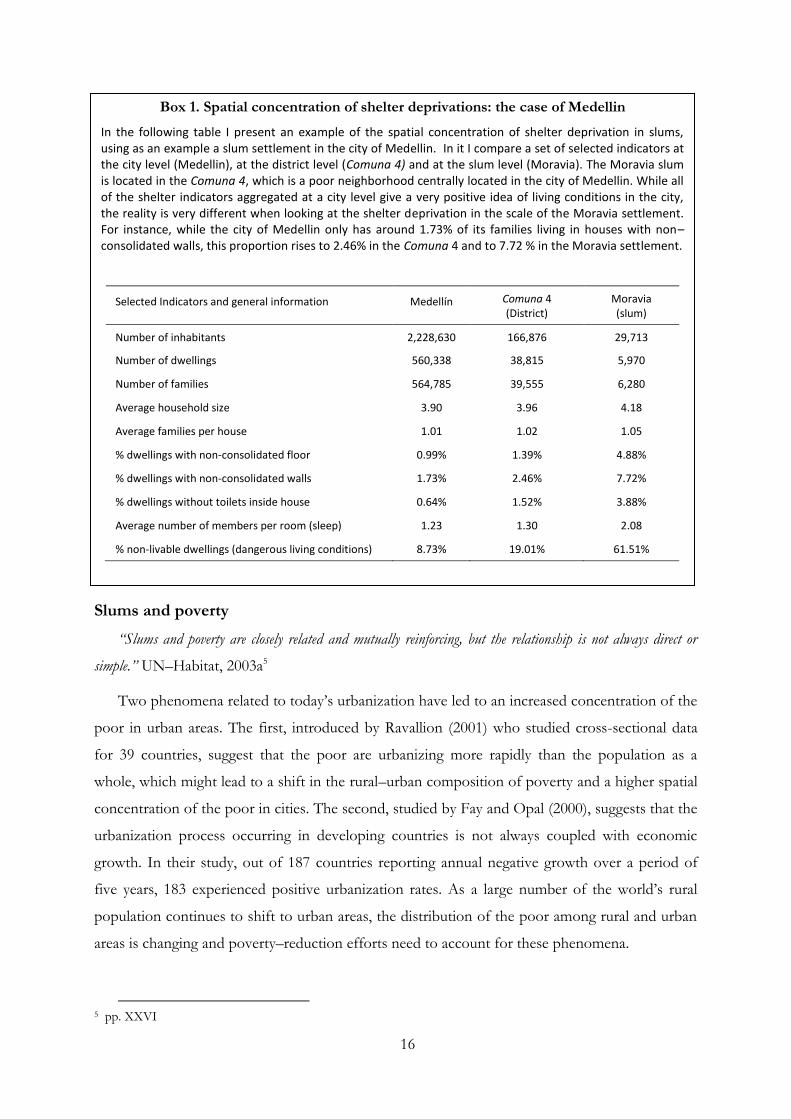
Box 1. Spatial concentration of shelter deprivations: the case of Medellin
In the following table I present an example of the spatial concentration of shelter deprivation in slums, using as an example a slum settlement in the city of Medellin. In it I compare a set of selected indicators at the city level (Medellin), at the district level (Comuna 4) and at the slum level (Moravia). The Moravia slum is located in the Comuna 4, which is a poor neighborhood centrally located in the city of Medellin. While all of the shelter indicators aggregated at a city level give a very positive idea of living conditions in the city, the reality is very different when looking at the shelter deprivation in the scale of the Moravia settlement. For instance, while the city of Medellin only has around 1.73% of its families living in houses with non–consolidated walls, this proportion rises to 2.46% in the Comuna 4 and to 7.72 % in the Moravia settlement.
Selected Indicators and general information Medellín Comuna 4 (District)
Moravia (slum)
Number of inhabitants 2,228,630 166,876 29,713
Number of dwellings 560,338 38,815 5,970
Number of families 564,785 39,555 6,280
Average household size 3.90 3.96 4.18
Average families per house 1.01 1.02 1.05
% dwellings with non-consolidated floor 0.99% 1.39% 4.88%
% dwellings with non-consolidated walls 1.73% 2.46% 7.72%
% dwellings without toilets inside house 0.64% 1.52% 3.88%
Average number of members per room (sleep) 1.23 1.30 2.08
% non-livable dwellings (dangerous living conditions) 8.73% 19.01% 61.51%
17
Baker‘s study (2008) on urban poverty suggests that, while the characteristics of the urban
poor change between and across regions and cities, they all tend to face a number of
deprivations, which affect their daily lives: limited access to the labor market, inadequate and
insecure living conditions, poor infrastructure and services, risk of natural disasters and
environmental hazards and spatial exclusion. Most of these deprivations correspond to the idea
or definition of slums presented in the previous section. In the same way, the latest UN–Habitat
(2010) report on the State of the World Cities, argues that many of the slums are spatially isolated
and disconnected from the rest of the city making it difficult for their inhabitants to access the
city‘s labor market and profit from the advantages of living in the city. The physical and social
exclusion of many of the poor in some areas could lead to spatial poverty traps. An example of the
spatial concentration of shelter deprivations can be found in Box 1.
Slums are for many the urban manifestation of poverty. However, while slums do house the
greatest proportion of the urban poor, not all of the poor live in slums and not all of those who
live in slums are poor. Nevertheless, with the increased urbanization of the poor and the
concentration of poverty in slums, slum policies are increasingly being viewed as a way to
diminish poverty. UN–Habitat (2010) states that “Progress in improving the lives of slum dwellers will
depend largely on the way governments address slums as part of the broader agenda of reducing urban poverty and
inequality”6. In the same way The World Bank (2009) argues that “as urban poverty increases, the focus is
shifting from villages to slums”. The higher spatial concentration of the poor in cities, and in slums,
calls, on the one hand, for a higher integration of slum policies and poverty reduction efforts and,
on the other hand, for a higher understanding of how slum policies can improve welfare.
3. From slum eviction to slum upgrading7
“Un milliard de personnes survivent dans les bidonvilles du monde, lieux de reproduction de la misère, à
laquelle les gouvernements n'apportent aucune réponse adaptée » Mike Davis, 2006
“Les villes du Tiers monde ne souffrent pas tant d‟un manque drastique d‟investissement et d‟emplois que
d‟une pénurie artificielle de droits de propriété”. Hernando De Soto, 1990
Two authors have considerably influenced the general public view of the ‗slum problem‘ in
developing countries. The first, Mike Davis, in his book entitled Planet of Slums, describes slums as
the catastrophic result of bad policies and bad institutions and leaves the reader with the idea that
little has been done. The second, Hernando De Soto, describes slums as lands of opportunities
and suggests that titling policies are the key to include poor households in the economic system.
6 p. 49 (Section 1) 7 Many of the elements discussed in this section can be found in UN-Habitat(2003a), pp.128-133
18
While it is true that initially applied slum policies had catastrophic consequences on slum
dwellers‘ welfare, today‘s policies have integrated more welfare–improving approaches, which
serve both to combat the ‗slum problem‘ and reduce poverty. The latter does not mean that there
has been a complete shift from one policy to another or that a one–fits–all policy (i.e. titling) has
emerged; rather, there has been a general shift of the vision of slums and of the ―efficiency‖ of a
set of policies as the learning–by–doing process evolved and governments or political parties
realized that ‗slums‘ could make part of their strategies to access or remain in power.
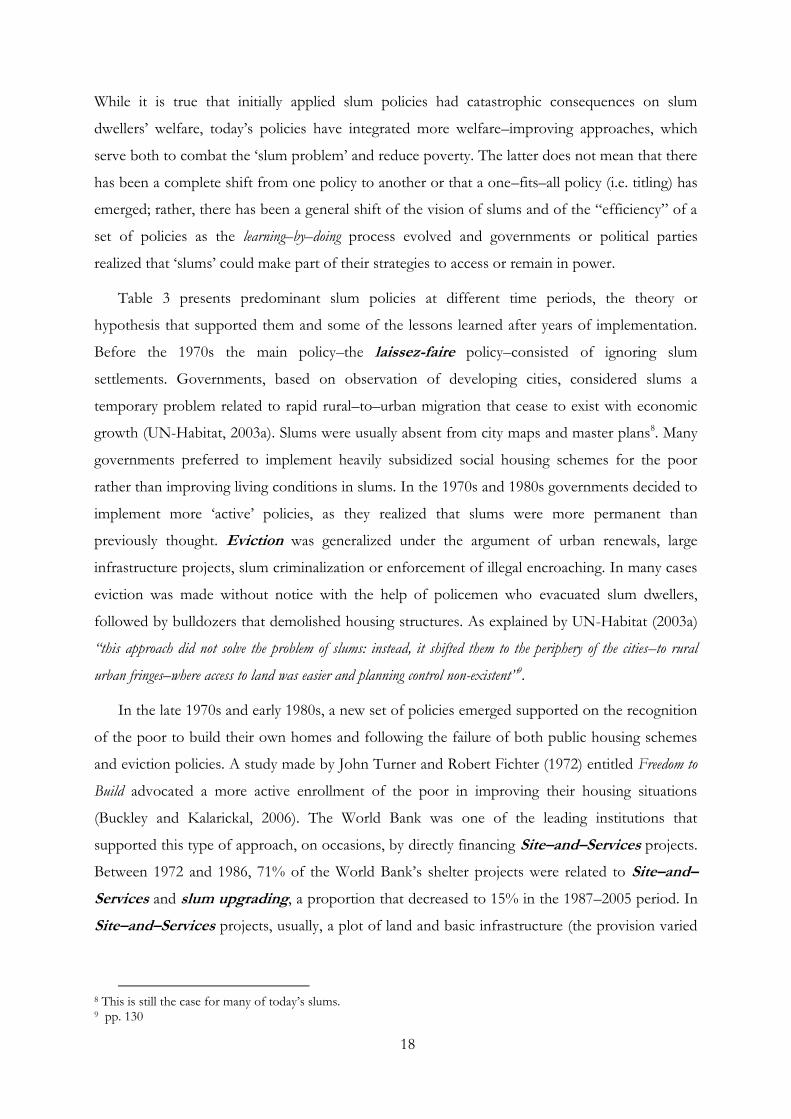
Table 3 presents predominant slum policies at different time periods, the theory or
hypothesis that supported them and some of the lessons learned after years of implementation.
Before the 1970s the main policy–the laissez-faire policy–consisted of ignoring slum
settlements. Governments, based on observation of developing cities, considered slums a
temporary problem related to rapid rural–to–urban migration that cease to exist with economic
growth (UN-Habitat, 2003a). Slums were usually absent from city maps and master plans8. Many
governments preferred to implement heavily subsidized social housing schemes for the poor
rather than improving living conditions in slums. In the 1970s and 1980s governments decided to
implement more ‗active‘ policies, as they realized that slums were more permanent than
previously thought. Eviction was generalized under the argument of urban renewals, large
infrastructure projects, slum criminalization or enforcement of illegal encroaching. In many cases
eviction was made without notice with the help of policemen who evacuated slum dwellers,
followed by bulldozers that demolished housing structures. As explained by UN-Habitat (2003a)
“this approach did not solve the problem of slums: instead, it shifted them to the periphery of the cities–to rural
urban fringes–where access to land was easier and planning control non-existent”9.
In the late 1970s and early 1980s, a new set of policies emerged supported on the recognition
of the poor to build their own homes and following the failure of both public housing schemes
and eviction policies. A study made by John Turner and Robert Fichter (1972) entitled Freedom to
Build advocated a more active enrollment of the poor in improving their housing situations
(Buckley and Kalarickal, 2006). The World Bank was one of the leading institutions that
supported this type of approach, on occasions, by directly financing Site–and–Services projects.
Between 1972 and 1986, 71% of the World Bank‘s shelter projects were related to Site–and–
Services and slum upgrading, a proportion that decreased to 15% in the 1987–2005 period. In
Site–and–Services projects, usually, a plot of land and basic infrastructure (the provision varied
8 This is still the case for many of today‘s slums. 9 pp. 130
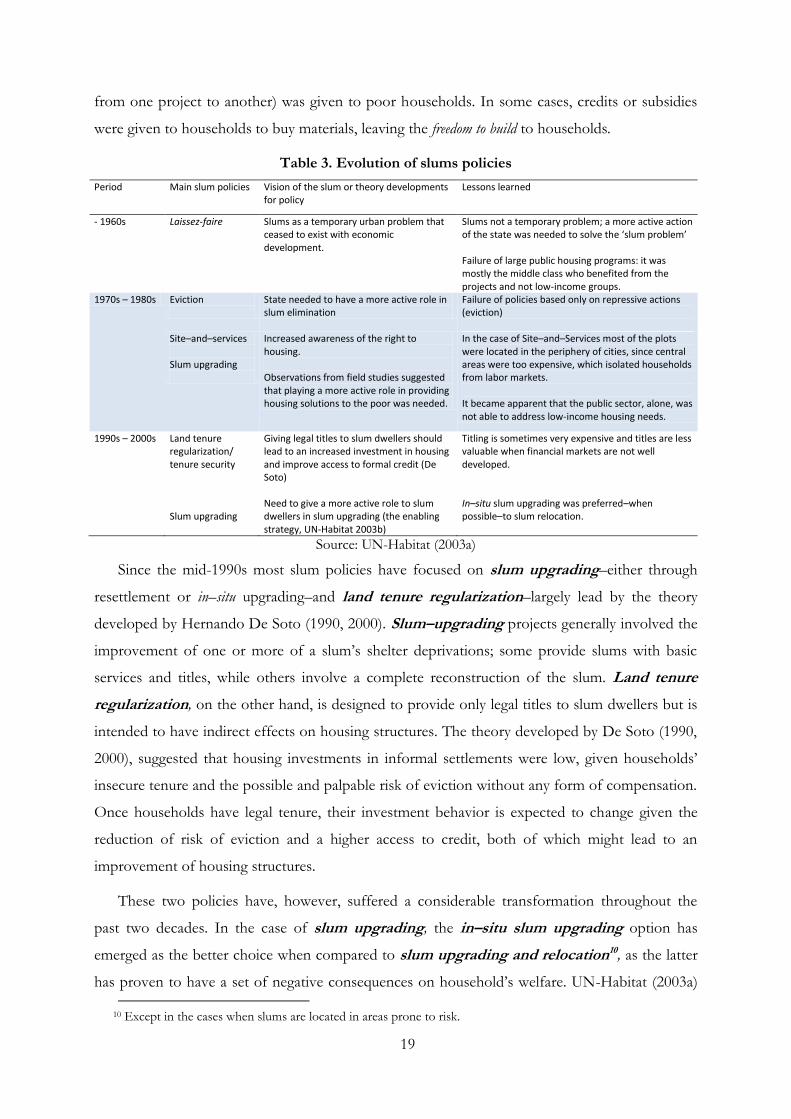
19
from one project to another) was given to poor households. In some cases, credits or subsidies
were given to households to buy materials, leaving the freedom to build to households.
Table 3. Evolution of slums policies
Period Main slum policies Vision of the slum or theory developments for policy
Lessons learned
- 1960s Laissez-faire Slums as a temporary urban problem that ceased to exist with economic development.
Slums not a temporary problem; a more active action of the state was needed to solve the ‘slum problem’ Failure of large public housing programs: it was mostly the middle class who benefited from the projects and not low-income groups.
1970s – 1980s Eviction
State needed to have a more active role in slum elimination
Failure of policies based only on repressive actions (eviction)
Site–and–services Slum upgrading
Increased awareness of the right to housing. Observations from field studies suggested that playing a more active role in providing housing solutions to the poor was needed.
In the case of Site–and–Services most of the plots were located in the periphery of cities, since central areas were too expensive, which isolated households from labor markets. It became apparent that the public sector, alone, was not able to address low-income housing needs.
1990s – 2000s Land tenure regularization/ tenure security Slum upgrading
Giving legal titles to slum dwellers should lead to an increased investment in housing and improve access to formal credit (De Soto) Need to give a more active role to slum dwellers in slum upgrading (the enabling strategy, UN-Habitat 2003b)
Titling is sometimes very expensive and titles are less valuable when financial markets are not well developed. In–situ slum upgrading was preferred–when possible–to slum relocation.
Source: UN-Habitat (2003a)
Since the mid-1990s most slum policies have focused on slum upgrading–either through
resettlement or in–situ upgrading–and land tenure regularization–largely lead by the theory
developed by Hernando De Soto (1990, 2000). Slum–upgrading projects generally involved the
improvement of one or more of a slum‘s shelter deprivations; some provide slums with basic
services and titles, while others involve a complete reconstruction of the slum. Land tenure
regularization, on the other hand, is designed to provide only legal titles to slum dwellers but is
intended to have indirect effects on housing structures. The theory developed by De Soto (1990,
2000), suggested that housing investments in informal settlements were low, given households‘
insecure tenure and the possible and palpable risk of eviction without any form of compensation.
Once households have legal tenure, their investment behavior is expected to change given the
reduction of risk of eviction and a higher access to credit, both of which might lead to an
improvement of housing structures.
These two policies have, however, suffered a considerable transformation throughout the
past two decades. In the case of slum upgrading, the in–situ slum upgrading option has
emerged as the better choice when compared to slum upgrading and relocation10, as the latter
has proven to have a set of negative consequences on household‘s welfare. UN-Habitat (2003a)
10 Except in the cases when slums are located in areas prone to risk.
20
argues that “At worst, resettlement is little better than force eviction with no attempt at consultation or
consideration of the social and economic consequences of moving people to distant, often peripheral, sites with no
access to urban infrastructure, services or transport”11.
In the case of land tenure regularization, it has become apparent that an improvement in
tenure security, not necessarily through the provision of legal titles, is sometimes more adequate.
In some cases, where cadastre systems are not well developed, titling policies can be very costly
and time consuming and when financial markets are not well developed, the expected benefits of
titling–as expected by De Soto–might be lower. According to Buckley and Kalarickal (2006) one
of the lessons learned from years of titling policies is that legal tenure is not the most important
first step to take in many places. Furthermore, a number of empirical and theoretical studies
(Razzaz 1993, Gilbert 2002, Payne 2001, Van Gelder 2007 and Reerink and Van Gelder 2010)
suggest that legal titles are not the only way to improve a household‘s conditions and that
intermediate or semi–legal forms of tenure can also be beneficial. According to Payne (2001),
alternative tenure forms–such as registered leasehold or public rental in which households are not
the legal owners but do not face a constant threat of eviction–might also lead to an increase of
investments in housing.
Today, a very diverse group of slum policies are being implemented in the world‘s slums.
Some countries–like Peru–continue to lead large titling policies at the national level while other
countries–like Brazil–have introduced multiple policies that range from legalizing electricity in
informal settlement to establishing Special Social–Interest Zones in which land regulations are
relaxed for the development of low–income housing. While years of slum–policy implementation
have left the international community with a number of lessons, most of today‘s policies are
being designed to solve specific shelter deprivations and are a highly connected to a city‘s or
country‘s political economy. The following chapter, Chapter 2, concerns the analysis of the
mechanisms of slum formation. In Chapter 3 a discussion, very similar to the one carried out in
this chapter but using the two specific cases of studies, Medellin and Mumbai, is made in which
the definitions and evolution of slums and slum policies at the local scale are presented.
11 pp. 131
21
Part I
Understanding slum formation mechanisms

22
23
Chapter 2
On the mechanisms of slum formation
1. General ideas
"Squatting, like living in conventional slums, provides a solution to the housing needs of those that cannot afford, or even find, alternative formal accommodation" The Challenge of Slums, UN-Habitat (2003a)1
The existence of slums in cities and the evaluation of slum policies have been studied widely
by economists, sociologists, town planners and international organizations (Davis 2006, UN-
Habitat 2003a, WB 2009a). However, most of the literature concentrates either on the actual state
of slums or on slum absorption policies (upgrading, relocation, titling) and only a small number
of studies concentrate on the sources or mechanisms of slum formation (Jimenez 1985, Hoy and
Jimenez 1990, Brueckner and Selod 2009 and Henderson 2009). In a logical way, slum policies, if
intending to lead to slum–free scenarios, need to concentrate as much on slum formation as they
do on slum absorption. Furthermore, understanding the slum–formation mechanism is essential
not only for the implementation of housing policies which avoid new slum formation but for the
creation of more efficient slum–absorption policies. Knowing what blocks the way for a
considerable number of households to access formal housing and/or to stay in formal housing can
help to design better policies adapted to slum dwellers‘ needs and financial capacities.
Almost every article that deals with slums suggests one or more reasons for slum existence.
The most common explanations of slum formation deal with rapid urbanization, urbanization
without growth, malfunctioning housing markets and/or the incapacity of cities to absorb
newcomers resulting from poor city planning (UN-Habitat 2003a, Buckley and Kalarickal 2006,
Kappor and le Blanc 2008, Sietchiping and Yoon 2010). In fact, most of the literature agrees on
the variables affecting slum formation, but there is little consensus on how they interact or the
policy implications. For instance, reinforcing construction standards serves as an entry tax for
newcomers and might diminish migration (and slum formation), but makes housing much more
1 pp. 83
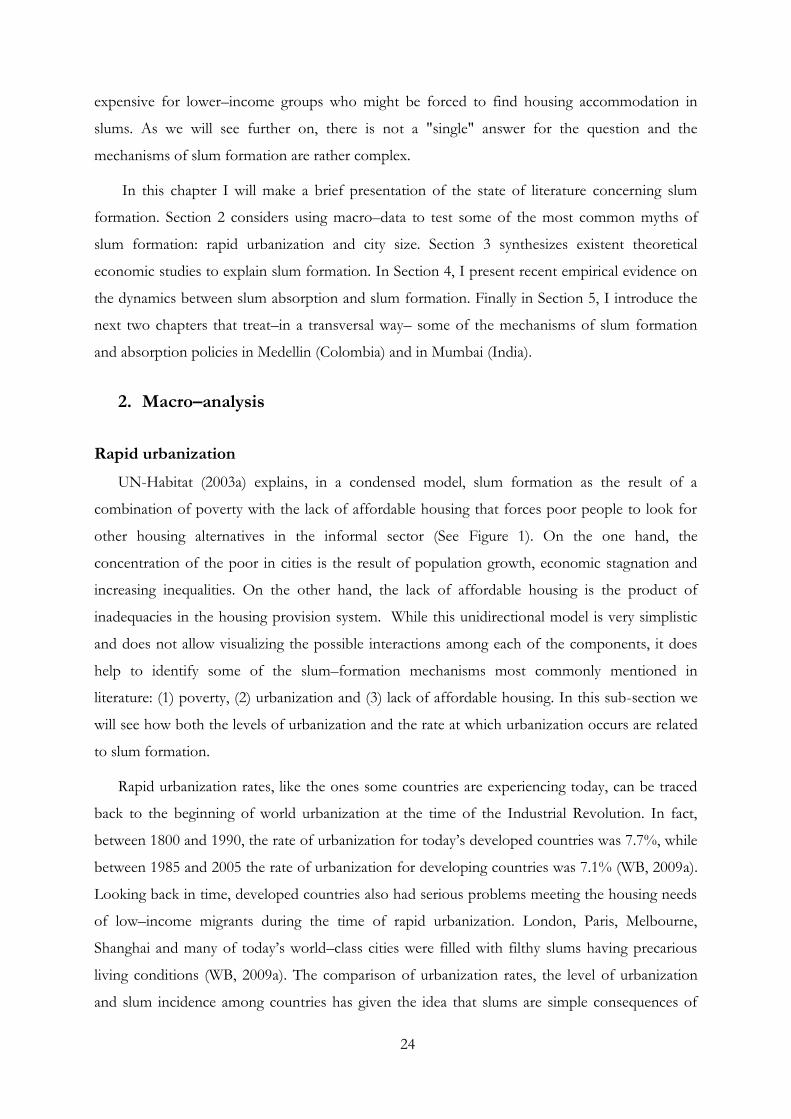
24
expensive for lower–income groups who might be forced to find housing accommodation in
slums. As we will see further on, there is not a "single" answer for the question and the
mechanisms of slum formation are rather complex.
In this chapter I will make a brief presentation of the state of literature concerning slum
formation. Section 2 considers using macro–data to test some of the most common myths of
slum formation: rapid urbanization and city size. Section 3 synthesizes existent theoretical
economic studies to explain slum formation. In Section 4, I present recent empirical evidence on
the dynamics between slum absorption and slum formation. Finally in Section 5, I introduce the
next two chapters that treat–in a transversal way– some of the mechanisms of slum formation
and absorption policies in Medellin (Colombia) and in Mumbai (India).
2. Macro–analysis
Rapid urbanization
UN-Habitat (2003a) explains, in a condensed model, slum formation as the result of a
combination of poverty with the lack of affordable housing that forces poor people to look for
other housing alternatives in the informal sector (See Figure 1). On the one hand, the
concentration of the poor in cities is the result of population growth, economic stagnation and
increasing inequalities. On the other hand, the lack of affordable housing is the product of
inadequacies in the housing provision system. While this unidirectional model is very simplistic
and does not allow visualizing the possible interactions among each of the components, it does
help to identify some of the slum–formation mechanisms most commonly mentioned in
literature: (1) poverty, (2) urbanization and (3) lack of affordable housing. In this sub-section we
will see how both the levels of urbanization and the rate at which urbanization occurs are related
to slum formation.
Rapid urbanization rates, like the ones some countries are experiencing today, can be traced
back to the beginning of world urbanization at the time of the Industrial Revolution. In fact,
between 1800 and 1990, the rate of urbanization for today‘s developed countries was 7.7%, while
between 1985 and 2005 the rate of urbanization for developing countries was 7.1% (WB, 2009a).
Looking back in time, developed countries also had serious problems meeting the housing needs
of low–income migrants during the time of rapid urbanization. London, Paris, Melbourne,
Shanghai and many of today‘s world–class cities were filled with filthy slums having precarious
living conditions (WB, 2009a). The comparison of urbanization rates, the level of urbanization
and slum incidence among countries has given the idea that slums are simple consequences of
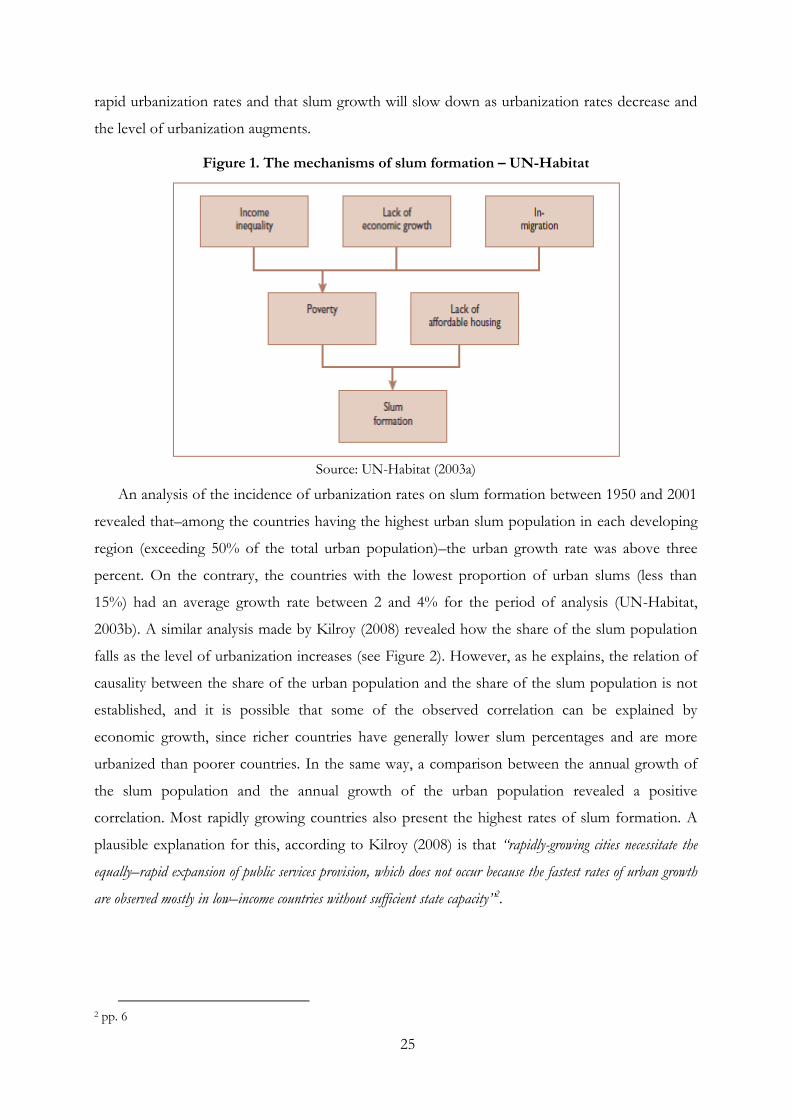
25
rapid urbanization rates and that slum growth will slow down as urbanization rates decrease and
the level of urbanization augments.
Figure 1. The mechanisms of slum formation – UN-Habitat
Source: UN-Habitat (2003a)
An analysis of the incidence of urbanization rates on slum formation between 1950 and 2001
revealed that–among the countries having the highest urban slum population in each developing
region (exceeding 50% of the total urban population)–the urban growth rate was above three
percent. On the contrary, the countries with the lowest proportion of urban slums (less than
15%) had an average growth rate between 2 and 4% for the period of analysis (UN-Habitat,
2003b). A similar analysis made by Kilroy (2008) revealed how the share of the slum population
falls as the level of urbanization increases (see Figure 2). However, as he explains, the relation of
causality between the share of the urban population and the share of the slum population is not
established, and it is possible that some of the observed correlation can be explained by
economic growth, since richer countries have generally lower slum percentages and are more
urbanized than poorer countries. In the same way, a comparison between the annual growth of
the slum population and the annual growth of the urban population revealed a positive
correlation. Most rapidly growing countries also present the highest rates of slum formation. A
plausible explanation for this, according to Kilroy (2008) is that “rapidly-growing cities necessitate the
equally–rapid expansion of public services provision, which does not occur because the fastest rates of urban growth
are observed mostly in low–income countries without sufficient state capacity”2.
2 pp. 6
26
Figure 2. Rapid urbanization and slum growth
Source: Kilroy (2008)
The previous allusions can be confusing. On the one hand, slum growth is linked to urban
growth, but, on the other hand, higher levels of urbanization are linked to lower slum shares to
the total urban population. Does this mean that as countries pass from low to higher levels of
urbanization, cities will converge to lower slum scenarios? It is not sure, since the casual link
between urbanization and slum formation has not been proved and there are a lot of other
variables that might also affect slum formation. For instance, it is possible that with higher
economic growth and at higher levels of urbanization, a bigger proportion of the urban
population is able to enter the formal–housing sector, or that more urbanized and richer
countries have better housing financial instruments which allow their formal–housing markets to
work better.
Two additional empirical studies evidence the difficulties of establishing causal relationships
between urban growth and slum–population growth and the complexity behind slum formation.
The first study, done by Lall et al. (2007) evaluates slum growth across Brazilian cities between
1980 and 2000. They find no statistically significant relationship between slum growth and the
growth of the urban population and a statistically significant and negative relationship between
slum growth and the growth of the formal housing stock (see Figure 3). According to them,
―(their results) suggest that slum formation is a complicated process influenced by various city characteristics, rather
than simply proportional to city growth itself”3. The second study, done by Sietchiping and Yoon (2010),
evaluates slum incidence in Sub–Saharan Africa based on a number of indicators. They find that
the initial level of slums and the level of urbanization had a positive and statistically significant
effect on slum incidence in Sub–Saharan Africa.
3 pp. 7-8
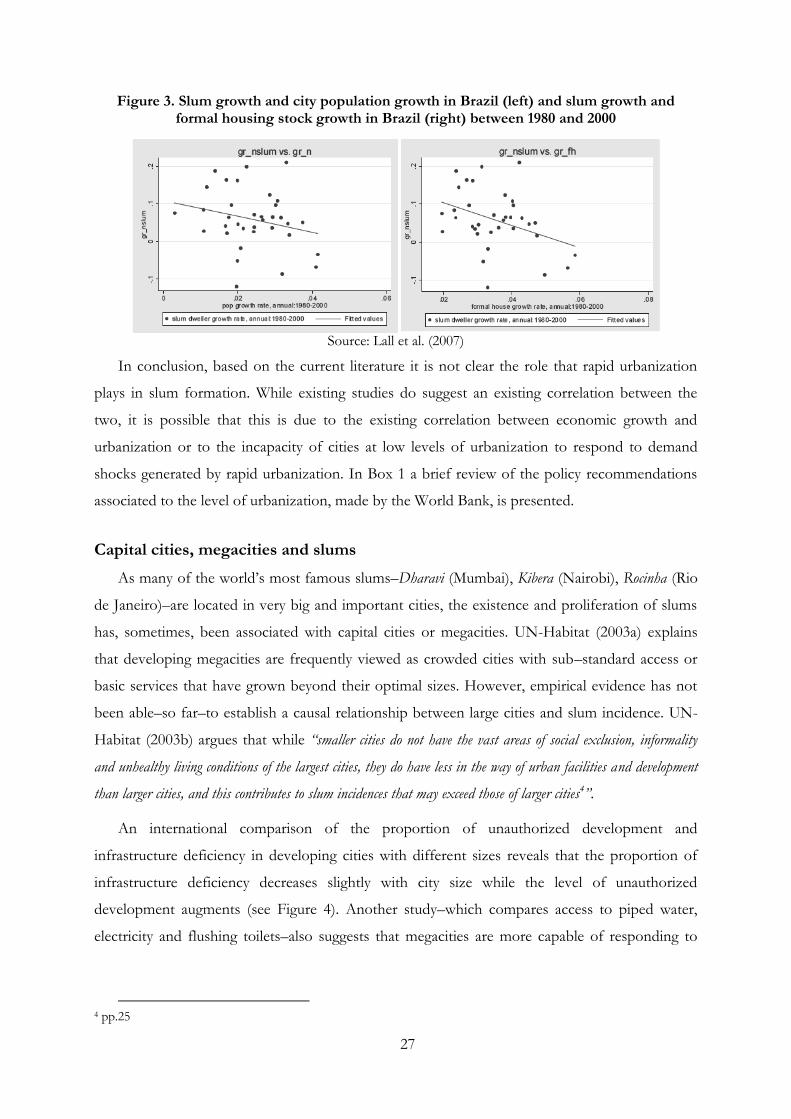
27
Figure 3. Slum growth and city population growth in Brazil (left) and slum growth and formal housing stock growth in Brazil (right) between 1980 and 2000
Source: Lall et al. (2007)
In conclusion, based on the current literature it is not clear the role that rapid urbanization
plays in slum formation. While existing studies do suggest an existing correlation between the
two, it is possible that this is due to the existing correlation between economic growth and
urbanization or to the incapacity of cities at low levels of urbanization to respond to demand
shocks generated by rapid urbanization. In Box 1 a brief review of the policy recommendations
associated to the level of urbanization, made by the World Bank, is presented.
Capital cities, megacities and slums
As many of the world‘s most famous slums–Dharavi (Mumbai), Kibera (Nairobi), Rocinha (Rio
de Janeiro)–are located in very big and important cities, the existence and proliferation of slums
has, sometimes, been associated with capital cities or megacities. UN-Habitat (2003a) explains
that developing megacities are frequently viewed as crowded cities with sub–standard access or
basic services that have grown beyond their optimal sizes. However, empirical evidence has not
been able–so far–to establish a causal relationship between large cities and slum incidence. UN-
Habitat (2003b) argues that while “smaller cities do not have the vast areas of social exclusion, informality
and unhealthy living conditions of the largest cities, they do have less in the way of urban facilities and development
than larger cities, and this contributes to slum incidences that may exceed those of larger cities4”.
An international comparison of the proportion of unauthorized development and
infrastructure deficiency in developing cities with different sizes reveals that the proportion of
infrastructure deficiency decreases slightly with city size while the level of unauthorized
development augments (see Figure 4). Another study–which compares access to piped water,
electricity and flushing toilets–also suggests that megacities are more capable of responding to
4 pp.25
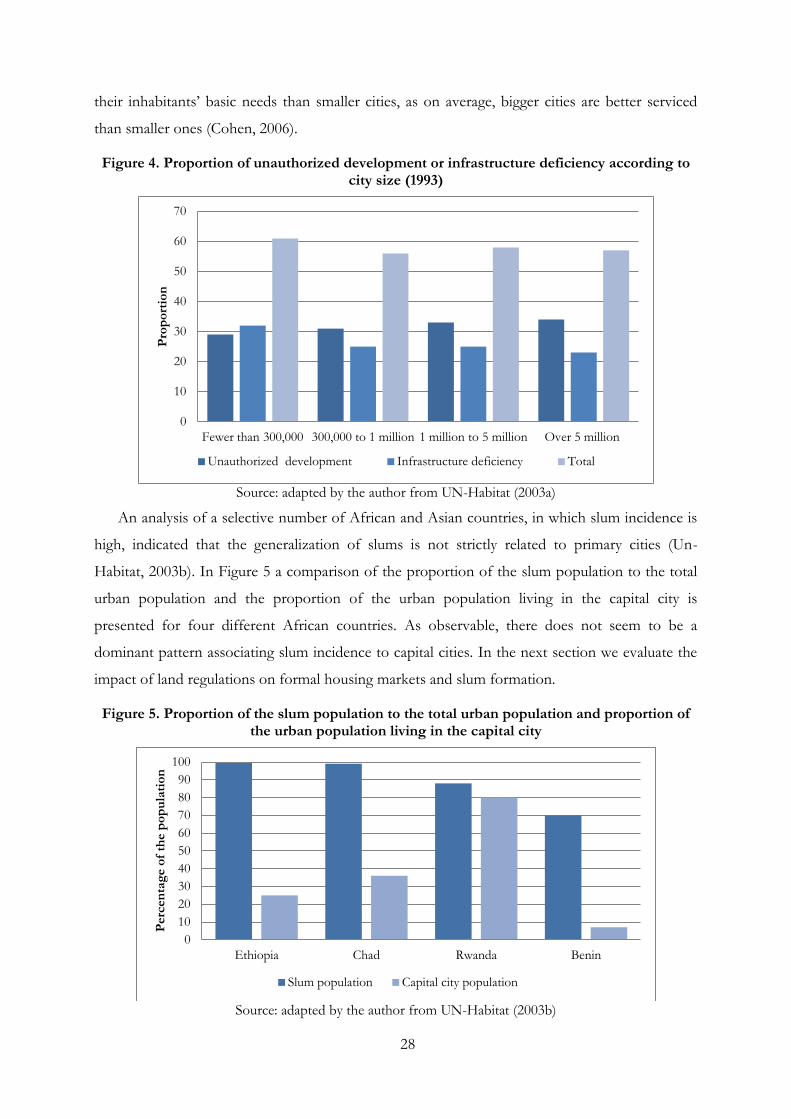
28
their inhabitants‘ basic needs than smaller cities, as on average, bigger cities are better serviced
than smaller ones (Cohen, 2006).
Figure 4. Proportion of unauthorized development or infrastructure deficiency according to city size (1993)
Source: adapted by the author from UN-Habitat (2003a)
An analysis of a selective number of African and Asian countries, in which slum incidence is
high, indicated that the generalization of slums is not strictly related to primary cities (Un-
Habitat, 2003b). In Figure 5 a comparison of the proportion of the slum population to the total
urban population and the proportion of the urban population living in the capital city is
presented for four different African countries. As observable, there does not seem to be a
dominant pattern associating slum incidence to capital cities. In the next section we evaluate the
impact of land regulations on formal housing markets and slum formation.
Figure 5. Proportion of the slum population to the total urban population and proportion of the urban population living in the capital city
Source: adapted by the author from UN-Habitat (2003b)
0
10
20
30
40
50
60
70
Fewer than 300,000 300,000 to 1 million 1 million to 5 million Over 5 million
Pro
po
rtio
n
Unauthorized development Infrastructure deficiency Total
0
10
20
30
40
50
60
70
80
90
100
Ethiopia Chad Rwanda Benin
Perc
en
tag
e o
f th
e p
op
ula
tio
n
Slum population Capital city population
29
3. Economic Theory
In this section I expose some of the most interesting theoretical developments related to
slum formation. The first study, done by Henderson (2009) will serve to illustrate the general
effects of regulations on the elasticity of supply of the formal–housing market in cities and how
formal residents can use regulations to push some of the migrant population into the informal
housing sector. The second and third studies, done by Hoy and Jimenez (1991) and Jimenez
(1985) reveal the interactions between squatters, landowners and local governments that lead to
squatters and formal residents compete for land within the city, with squatters squeezing the
formal market. Another theoretical study that I will not discuss in this section, but that is worth
highlighting, is Turnbull (2008). Turnball (2008), who develops a very similar model than Hoy
and Jimenez (1991), reveals that incomplete land markets do not inexorably produce squatting
equilibriums but that squatting arises from landowners‘ rational decision not to fully exercise their
property rights.
The role of regulations in the development of the informal sector5
Henderson (2009) explains how traditionally urban regulations have two bases in economics.
The first is to avoid neighborhood externalities or asymmetries of information that lead to a less-
efficient market. For instance, zoning norms that separate industrial and residential uses of land,
serve to avoid possible externalities generated by industries‘ noise or contamination. Construction
5 This sub–section is based on Henderson (2009)
Box 1. Policy recommendations for different levels of urbanization
According to the WB (2009) “The emergence and growth of slums in the early and intermediate stages of a
country’s development can be explained by the interaction of functioning labor markets with dysfunctional
land markets. In the rapid phase of urbanization, the labor market signals higher labor demand in urban
areas, the higher demand that rises from growth in industries and services. Labor responds by moving to
towns and cities.” While the causal link between urbanization and economic growth, or the inverse, has not
been proved, higher levels of urbanization are in many cases associated to positive outcomes in terms of
social capital accumulation, democratic accountability and improvement of the quality of life. Urbanization,
if well, managed can be a positive fuel or economic development.
The World Bank in the 2009 World Development Report recommends governments to coordinate their
policies according to the level of urbanization or what they call an "I" for a "D". Areas of incipient
urbanization should create spatially blind institutions (people will move according to market forces). Areas of
intermediate urbanization should additionally create spatially connective infrastructure (diminishing
congestion effects and increasing agglomeration economies) and areas of advanced urbanization that have
within city divisions (like slums) should -in addition- create spatially targeted interventions (i.e. slum
upgrading).
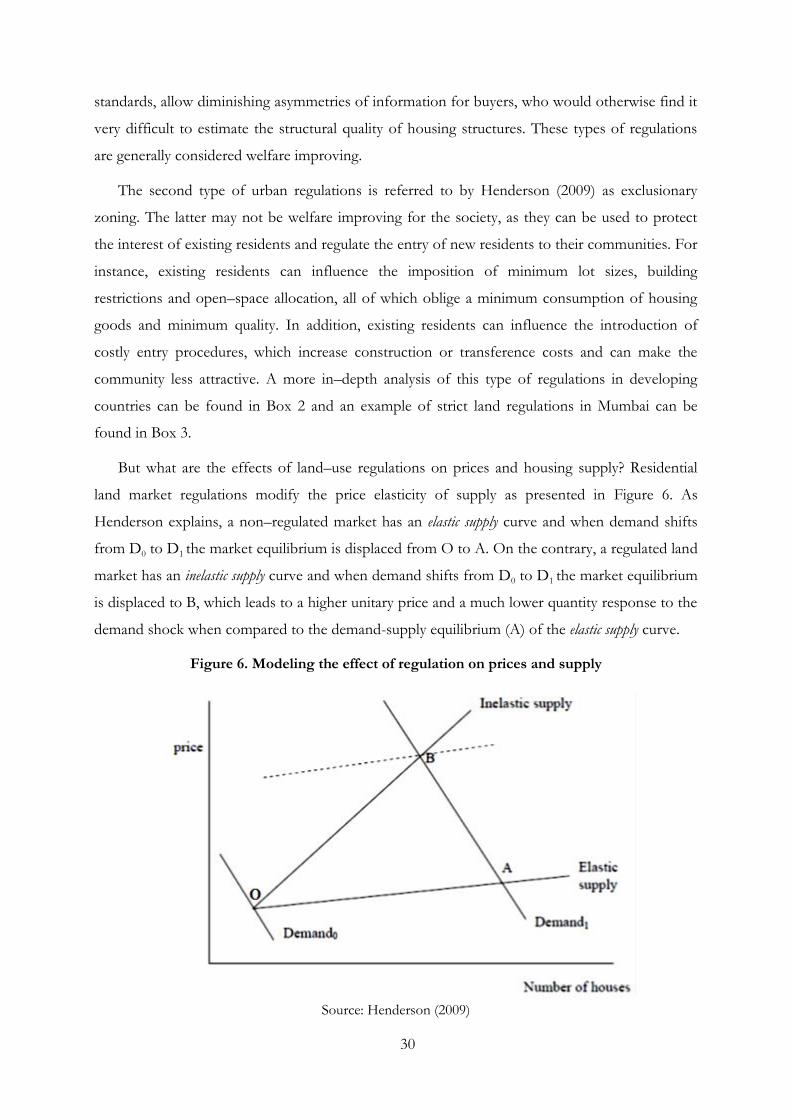
30
standards, allow diminishing asymmetries of information for buyers, who would otherwise find it
very difficult to estimate the structural quality of housing structures. These types of regulations
are generally considered welfare improving.
The second type of urban regulations is referred to by Henderson (2009) as exclusionary
zoning. The latter may not be welfare improving for the society, as they can be used to protect
the interest of existing residents and regulate the entry of new residents to their communities. For
instance, existing residents can influence the imposition of minimum lot sizes, building
restrictions and open–space allocation, all of which oblige a minimum consumption of housing
goods and minimum quality. In addition, existing residents can influence the introduction of
costly entry procedures, which increase construction or transference costs and can make the
community less attractive. A more in–depth analysis of this type of regulations in developing
countries can be found in Box 2 and an example of strict land regulations in Mumbai can be
found in Box 3.
But what are the effects of land–use regulations on prices and housing supply? Residential
land market regulations modify the price elasticity of supply as presented in Figure 6. As
Henderson explains, a non–regulated market has an elastic supply curve and when demand shifts
from D0 to D1 the market equilibrium is displaced from O to A. On the contrary, a regulated land
market has an inelastic supply curve and when demand shifts from D0 to D1 the market equilibrium
is displaced to B, which leads to a higher unitary price and a much lower quantity response to the
demand shock when compared to the demand-supply equilibrium (A) of the elastic supply curve.
Figure 6. Modeling the effect of regulation on prices and supply
Source: Henderson (2009)
31
Some empirical studies on the effects of regulation on housing prices made by Malpezzi and
Mayo (1997), Mayo and Sheppard (1996) and Bertaud and Malpezzi (2001) suggest that
restriction are more costly for lower–income groups since they induce ―forced consumption.‖
Restrictions have little effect on middle–and higher–income groups who anyway would demand
and be willing to pay for the minimum quantities and qualities defined by regulations. Another
study done by Glaeser et al. (2006) finds that the response of regulated cities to positive demand
shocks are limited because the housing market is not able to expand.
Contrary to previous empirical studies on the subject, Henderson (2009) proposes to treat
regulation as endogenous and uses this to explain the emergence of an informal–housing market
in developing countries. A city, and its existing residents, can strategically decide to implement
exclusionary regulations which discourage immigration and push the new population to the
informal–housing sector. The interest of existing residents in pushing the new population to the
informal–housing sector rises from the following argument: since migrants are usually poorer,
their inclusion in the formal–housing sector supposes the extension of local public services that
generate a fiscal burden to existing residents. If migrants live in the informal sector they will
contribute to some of the city taxes (i.e. wage taxes, sales taxes) and get no services in return.
Henderson‘s theoretical analysis reveals that if migrants can freely enter the formal sector,
equilibrium leads to a larger city and lower utility for existing residents. Using the case of Brazil to
evaluate empirically his theoretical development, he finds that poor migrants are more poorly
served than poor residents and the first are more likely to live in stricter zoning regulating areas
than the second. He also finds that cities that are both larger and more educated are more likely
to reduce servicing to migrants.
The role of regulations in informal settlements or slum formation has also been recognized
by international organizations. According to the World Bank ―Regulating, zoning and minimum
standards are key policies levers for affecting the operation of urban land markets and particularly access to shelter
and land by the poor. There is ample evidence than when formal land development parameters are not
benchmarked against what the local population can afford to pay, most households (not just poor households) are
excluded from access to formal land ownership”6 Buckley and Kalarickal (2006). UN-Habitat also points
out that most urban–planning regulations in developing countries, which are generally based on
the experience of developed countries, are not affordable for the majority of the population and
should be redeveloped on a basis of realistic standards (UN-Habitat, 2009b).
6 pp.36
32
Theoretical models of slum formation: stable squatter equilibriums
Laquian (1973) argues that squatter communities are located on land that belongs to the
government or on private land that has not been developed for a number of reasons. In the case
of governmental land, land is sometimes kept outside the market for the development of future
infrastructure, to avoid the installment of communities in areas prone to risk or for the creation
of buffer zones that divide different land uses (i.e. space between railway lines and building
constructions). In the case of private land, land can be kept from development for speculative
purposes, since in the actual state their development is not sufficiently profitable. For instance,
the existence of strict regulations or rental–control acts might diminish private incentives to
develop land.
Jimenez (1985) and Hoy and Jimenez (1990) develop a theoretical model to explain why
squatting occurs based on households‘ rational optimization between the formal and informal
market. They suppose that rational households optimize their utility choosing between squatting
and living in formal–housing constraint to the action of an external agent (government or private
owners) who decides whether to enforce legal property rights and evict squatters. In equilibrium,
households are indifferent between the two tenure options. Jimenez (1985) evaluates how the
total number of squatters changes, under different assumptions (free entry or restricted entry),
and, under a number of external changes (income growth, increased law enforcement). Hoy and
Jimenez (1990) examine if private landowners‘ and squatters‘ individual strategies lead to the
social optimum. I will first present what the model specification and hypothesis are for these two
theoretical developments, and then, evaluate what these theoretical developments tell us about
slum formation and slum policies.
The Jimenez (1985) basic model supposes that all households are alike, vacant land–which is
fixed–is assumed to be owned by the government and households are price takers. The analysis
focuses on behavior by the supply side of squatting. Households maximize their utility choosing
between living in formal housing and being squatters according to their budget constraint, which
accounts for the cost of defending squatter communities from evictions. It supposes that as the
number of squatter raises, the probability of being evicted is reduced and the cost of being a
squatter augments due to a congestion effect7. While formal owners have to pay rent, squatters
7 The hypothesis is that–given a fixed amount of amenities and land which yield the services to be consumed–the higher the number of squatters, the higher the congestion in using amenities and land will be. Jimenez (1985) also supposes that the additional congestion of another squatter is less where there are few squatters than where they are many.
33
do not, but they have to pay a cost for accessing urban services and protecting themselves from
eviction. Some interesting results from his model are the following:
An increase in squatter income has an ambiguous effect on the number of squatters. Under
constant absolute–risk aversion, an increase in income leads to no change in the number of
squatters.
With entry restrictions, the number of squatters in equilibrium is smaller than in the
competitive solution with no entry restrictions.
In the coalition model with entry restrictions, an increase in government expenditures on
eviction generates a new equilibrium with a bigger squatter community than the one before.
The Hoy and Jimenez (1990) article evaluates squatting and private land owners‘ interactions
examining what the socially optimal land–management policy for squatter areas are. It is based on
a game in which private land owners announce their eviction policy in the first stage, squatters
decide their level of investment and eviction occurs in the second stage, based on the possibilities
of development and the cost of eviction. They assume that each landowner owns several parcels
of land, in which potential for development is uncertain. Each parcel is divided among
homogenous squatters who have to be evicted if the parcel is to be developed. As in the case of
Jimenez (1985) households decide their tenure choice (squatting versus living in formal housing)
maximizing their utility. Due to transaction or bargaining costs landowners are unable to
recuperate rents from squatter. Results indicate that landowners, when choosing a level of
eviction, do not take into account the effect of their actions on squatters and will tend to evict
over what is socially optimal. “It is the inability of landowners to maintain flexibility in use of land while
collecting some payment form squatters which prevents internalization by landowners of the benefits to land use by
squatters”8.
A more recent theoretical development on slum formation made by Brueckner and Selod
(2009) considers, contrary to Jimenez (1985) and Hoy and Jimenez (1990), that squatter
settlements squeeze the formal market by using land that could otherwise be developed in the
formal housing market. The model assumes that the city‘s land area is fixed, land is homogeneous
but households can be heterogeneous (i.e. skilled and unskilled workers). All households are
assumed to be renters and the city‘s landowners are absentee. As in the case of Jimenez (1985)
and Hoy and Jimenez (1990) squatters don‘t have to pay rent but incur costs to defend
themselves from being evicted. In the base model there is a squatter organizer that controls the
squatter population, has the power to dictate defensive expenditures and plot size and whose goal
8 pp.80
34
is to maximize squatters‘ utility. In equilibrium no eviction occurs. The squeezing mechanism
means that for a given number of squatters, increasing the quantity of land consumed increases
squatters‘ utility but invites eviction. In the same way, a lower level of defense expenditures
increases the consumption of non–housing goods but invites eviction.
Brueckner and Selod (2009) find that, under certain conditions, there is a stable squatter
equilibrium in which no household gains from changing their tenure. However, when analyzing
the possibility of formalizing tenure for squatters, they find the city‘s squatter equilibrium to be
inefficient. In fact, if a transfer mechanism between winners and losers is put into action, a policy
formalizing squatters provides sufficient welfare gains to compensate the losers. The winners in
the case of formalization are formal housing residents and absentee landowners, the first who
end up paying less rent after formalization (i.e. squeezing effect) and the second who manage to
recuperate rent from their previously squatter areas. The losers are squatters who have to start
paying rent to landowners and those who received defensive expenditures made by squatters.
Variants of the base model, which consider uncontrolled squatter migration, suggest a higher
squatter population in equilibrium than in the base model and a further worsening of formal
resident‘s welfare due to the squeezing effect.
In the three theoretical models explored, under a certain number of conditions, a stable city‘s
squatter equilibrium exists in which no household gains from changing tenure. While the
mechanisms that lead to this equilibrium are different in each of the models, they serve to
provide theoretical evidence that supports the existence of slums in cities. The three models are,
as most theoretical developments, very simplistic and some of the hypothesis (i.e. migration
control, city land fixed) might be far from the reality, but they bring to light some interesting
ideas that relate to the causes of slum formation and policy implications for slum absorption. For
instance both Hoy and Jimenez (1990) and Brueckner and Selod (2009) signal the absence of
mutually accepted means to internalize the benefits of squatting land that allow transactions
between squatters and landowners, as one of the possible causes of the existence of a stable and
inefficient squatter equilibrium. The main hypothesis and policy implications of these three
models are summarized in Table 1.
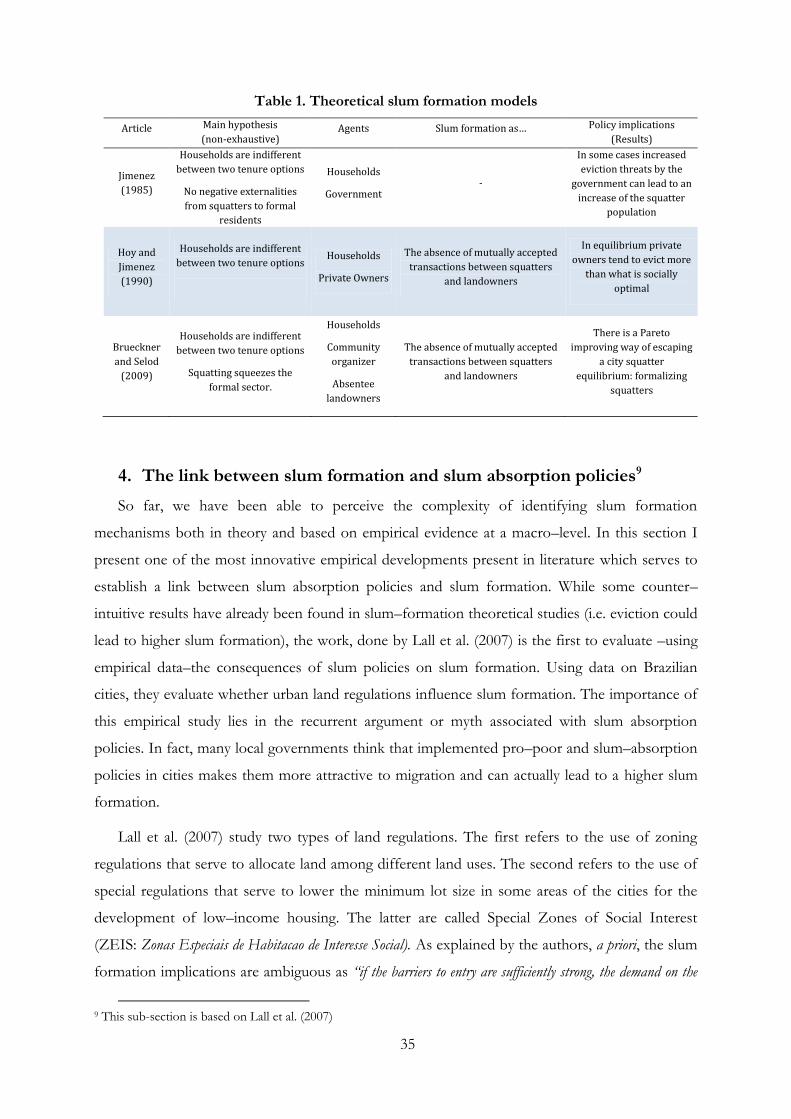
35
Table 1. Theoretical slum formation models
Article Main hypothesis
(non-exhaustive) Agents Slum formation as… Policy implications
(Results)
Jimenez
(1985)
Households are indifferent
between two tenure options
No negative externalities
from squatters to formal
residents
Households
Government -
In some cases increased
eviction threats by the
government can lead to an
increase of the squatter
population
Hoy and
Jimenez
(1990)
Households are indifferent
between two tenure options
Households
Private Owners
The absence of mutually accepted
transactions between squatters
and landowners
In equilibrium private
owners tend to evict more
than what is socially
optimal
Brueckner
and Selod
(2009)
Households are indifferent
between two tenure options
Squatting squeezes the
formal sector.
Households
Community
organizer
Absentee
landowners
The absence of mutually accepted
transactions between squatters
and landowners
There is a Pareto
improving way of escaping
a city squatter
equilibrium: formalizing
squatters
4. The link between slum formation and slum absorption policies9
So far, we have been able to perceive the complexity of identifying slum formation
mechanisms both in theory and based on empirical evidence at a macro–level. In this section I
present one of the most innovative empirical developments present in literature which serves to
establish a link between slum absorption policies and slum formation. While some counter–
intuitive results have already been found in slum–formation theoretical studies (i.e. eviction could
lead to higher slum formation), the work, done by Lall et al. (2007) is the first to evaluate –using
empirical data–the consequences of slum policies on slum formation. Using data on Brazilian
cities, they evaluate whether urban land regulations influence slum formation. The importance of
this empirical study lies in the recurrent argument or myth associated with slum absorption
policies. In fact, many local governments think that implemented pro–poor and slum–absorption
policies in cities makes them more attractive to migration and can actually lead to a higher slum
formation.
Lall et al. (2007) study two types of land regulations. The first refers to the use of zoning
regulations that serve to allocate land among different land uses. The second refers to the use of
special regulations that serve to lower the minimum lot size in some areas of the cities for the
development of low–income housing. The latter are called Special Zones of Social Interest
(ZEIS: Zonas Especiais de Habitacao de Interesse Social). As explained by the authors, a priori, the slum
formation implications are ambiguous as “if the barriers to entry are sufficiently strong, the demand on the
9 This sub-section is based on Lall et al. (2007)
36
formal supply system will drop and slum formation may possibly slow down. However, the extent to which drop in
migration is accompanied with an increase in formal housing supply remains an empirical question”. Land
regulation, as evaluated in the previous section, can serve as exclusionary policies inhibiting
migration.
The model developed is composed of two parts. The first part comprehends the
development of a housing supply–demand model based on a model used by Malpezzi and Mayo
(1997). The formal housing supply model is a function of formal housing prices while the
demand model is a function of average per–capita income, the number of people living in formal
houses and the formal–housing price. The formal–housing model reveals the price elasticity of
formal supply, which is intuitively linked to slum formation, as previously discussed in the work
done by Henderson (2009).
The second part comprehends the development of a migration–and slum–formation model
in which households decide (1) to which city they wish to migrate and (2) whether to live in the
formal–or informal–housing sector. Some of the hypotheses made in the model are the
following: The size of the formal–housing market is fixed (i.e. the number of households who
buy formal houses is exogenously given). The growth of the informal–housing market and the
city population are endogenously determined. In the migration model there are no migration
costs and people can migrate freely across cities. The decision to migrate to a given city is
affected by regulations which increase formal–housing prices or the cost of entering the city, but
also depends on the income possibilities the city offers. Once migration occurs, a household‘s
decisions to live in the informal or formal sector are given by the following assumptions:
(1) Households‘ willingness to pay (WTP) for a formal house is greater than an informal house.
(2) Land regulations, such as construction costs, increase the total construction cost of formal
houses when compared to informal ones.
(3) Therefore, a household decides to build an informal household if the difference between the
formal and informal total–construction cost is higher than the difference between households
WTP for formal and informal houses.
In addition to the previous decision thresholds, Lall et al. (2007) introduce households‘ access
to financial markets as a variable affecting the decision over housing tenure. A limited access to
the credit market might also influence a household‘s decision to build an informal household. A
comparative–statics analysis reveals the difficulties of establishing what the dominant effects of
income growth and land regulation on slum formation are:
37
The effect of land regulations on slum growth is ambiguous as strict land regulations
might push some of the city‘s population to find accommodation in the informal housing sector
but might defer poor households from moving to the city.
The effect of increase in income on slum formation is also ambiguous as higher income
has a positive effect on formal–housing demand and–therefore–should decrease slum formation,
but the latter could generate an increase in prices due to a demand shift that might force some
household to build informal houses. Curiously, in some cases, when the housing supply is
inelastic and there is low–price elasticity and high–income elasticity of housing demand,
economic growth can generate an increase in slum formation.
Some results from the Lall et al. (2007) study are the following:
In all model specifications they find that cities that introduced minimum lot–size regulations
experienced higher slum formation rates. In fact, city–population growth is higher than the
housing–supply growth generated by pro poor–land regulations.
In all model specifications the introduction of zoning regulation has no effect on slum–
formation rates. In fact, the opposite effects on the growth of the city population and the
growth of the formal housing market are of the same magnitude.
5. The mechanisms of slum formation in Medellin (Colombia) and in
Mumbai (India)
In this chapter I have presented the complex mechanisms underlying slum formation and the
little existent economic literature regarding this subject. We have seen how some of the myths of
slum formation (i.e. rapid urbanization and megacities) are not supported on solid empirical
analysis and others (i.e. the role of regulations in slum formation) rely on very complex
mechanisms which are difficult to examine with the naked eye.
In the next two chapters I present an empirical analysis related to the mechanisms of slum
formation in the city of Medellin and in the city of Mumbai. Chapter 3 presents a comparative
analysis of the history of slums and slum policies in Medellin and Mumbai. It serves as an
introduction to the context of the empirical analysis evaluating slum–absorption policies
presented in Part II of this dissertation. In addition, in Chapter 3, I present a simple framework
that accounts for the economic policy affecting slum formation similar to the one developed by
Henderson (2009), in which slum–inclusion or exclusion policies are fueled by a set of external
factors generated by the informal housing sector. Chapter 4, which only analyzes the case of
Medellin, evaluates households‘ choices between different tenure forms using hedonic–price
38
functions to evaluate household‘s willingness to pay for different rental contracts in informal
settlements.
39
Chapter 3
The inclusion of the informal city in the urban territory: a comparison between Medellin and Mumbai
Abstract The growth of cities in developing countries has been accompanied by the growth of an informal city on
the margins of the city. This informal city generally lacks of basic urban services and generates a number
of fragmentations of the urban tissue. In this article I review the history of the informal city in Medellin,
Colombia and Mumbai, India; evaluating its formation and evolution. I reveal how urban policies have
influenced the typology and location of the informal city and how this typology has influenced the
inclusion policies implemented in these two metropolises. The comparison between the policy of Urban
Integral Projects (Proyectos Urbanos Integrales, PUI; UIP for its initials in English) in the city of Medellin and the
Slum Rehabilitation Scheme (SRS) in the city of Mumbai confirms the relevance of defining policies locally
while -at the same time- setting forth elements that are valid globally, especially in the case of policy design
and coherence.
Résumé La croissance des villes des pays en voie de développement a été accompagnée d‘une croissance de la ville
informelle à la marge de la ville. Cette ville informelle manque généralement des services urbains de base
et engendre des fragmentations du tissu urbain. Ce chapitre présente l‘histoire de la ville informelle à
Medellin, Colombie, et Mumbai, Inde ; en analysant sa formation et son évolution. Il montre comment les
politiques urbaines ont influencé la typologie et la localisation de la ville informelle et comment cette
typologie a influencé les politiques d‘inclusion de la ville informelle actuellement appliquées dans ces deux
métropoles. La comparaison de la politique des Projets Urbains Intégraux (Proyectos Urbanos Integrales, PUI)
de la ville de Medellin et du Schéma de Réhabilitation des Bidonvilles (Slum Rehabilitation Scheme, SRS) de la
ville de Mumbai, confirme la pertinence du niveau local pour la définition des politiques en même temps
qu‘elle expose des éléments qui sont valables globalement, en particulier pour la conception de la
politique et sa cohérence.
40
1. Introduction
Urbanization in developing countries has been largely translated into a multiplication of
informal settlements that are synonymous with poverty and poor sanitary conditions. Pirate
urbanizations, slums and pavement dwellers are all evidence of the existing housing problems in
developing cities and a example of life outside the planned city. According to the United
Nations, each year 70 million new inhabitants are added to urban areas and around half of those
entering developing world cities are being housed in the informal sector (UN, 2007).
In some cases, the size of the informal city can overshadow the formal city, as happens in
Mumbai, India, where more than half of the inhabitants live in slums. Meanwhile in others, as
happens in the city of Medellin, Colombia, the informal city becomes the focus of illegality or
informality, generating perverse effects on the quality of life of the inhabitants of these
settlements and the rest of the city. In the latter, informal settlements house the majority of
illegal activities and groups outside the law.
Policies against informal settlements have evolved considerably since the late 1970s, a time in
which the main policy followed was to evict slum dwellers without any compensation and
demolish their dwellings. Advances in ideology have resulted in agreements, such as the
Millennium Development Goals, which are expected to improve significantly the lives of 100
million people living in this type of settlements between 1990 and 2015. In the last decade, a
number of countries and cities have led campaigns for the inclusion of the informal city, through
the introduction of new urban policies. However, the recent search for more inclusive cities has
generally focused on the problem (the existing informal city) and has ignored the dynamic
relationship that exists among urban policies, the informal city and inclusion policies.
But, what role do urban - or the so called inclusion - policies play in the formation and
evolution of the informal city? And, how can cities achieve total inclusion of the informal city in
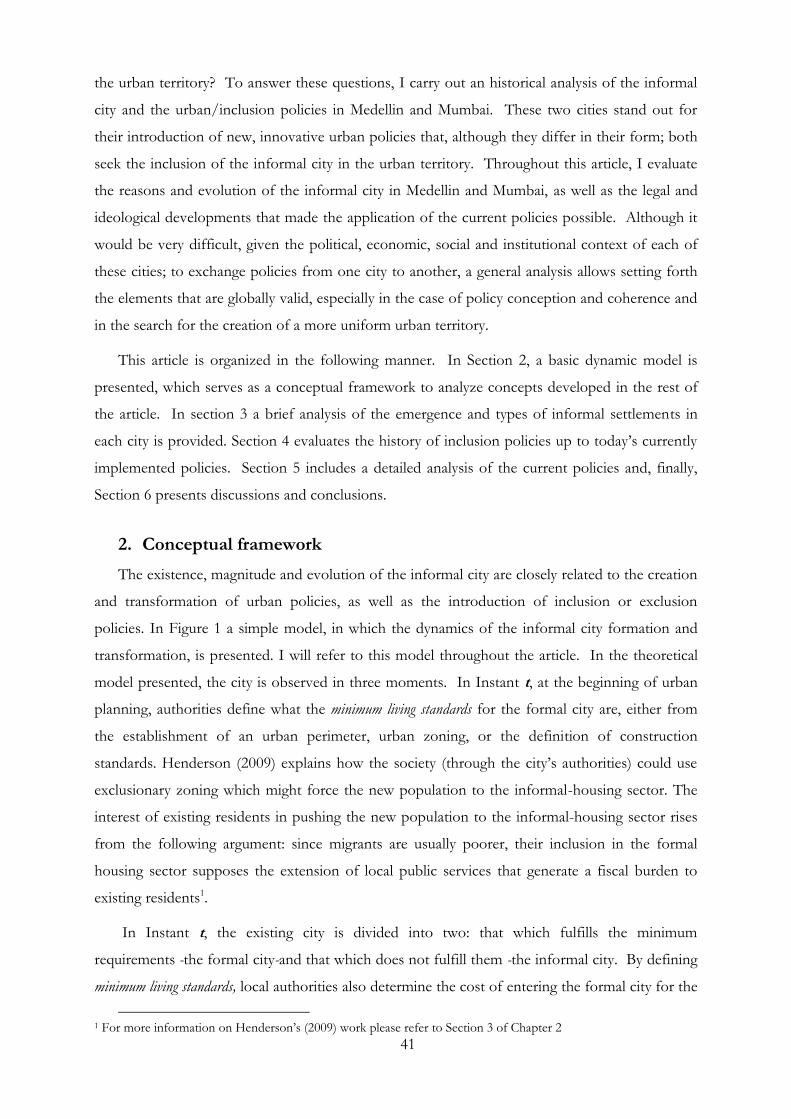
41
the urban territory? To answer these questions, I carry out an historical analysis of the informal
city and the urban/inclusion policies in Medellin and Mumbai. These two cities stand out for
their introduction of new, innovative urban policies that, although they differ in their form; both
seek the inclusion of the informal city in the urban territory. Throughout this article, I evaluate
the reasons and evolution of the informal city in Medellin and Mumbai, as well as the legal and
ideological developments that made the application of the current policies possible. Although it
would be very difficult, given the political, economic, social and institutional context of each of
these cities; to exchange policies from one city to another, a general analysis allows setting forth
the elements that are globally valid, especially in the case of policy conception and coherence and
in the search for the creation of a more uniform urban territory.
This article is organized in the following manner. In Section 2, a basic dynamic model is
presented, which serves as a conceptual framework to analyze concepts developed in the rest of
the article. In section 3 a brief analysis of the emergence and types of informal settlements in
each city is provided. Section 4 evaluates the history of inclusion policies up to today‘s currently
implemented policies. Section 5 includes a detailed analysis of the current policies and, finally,
Section 6 presents discussions and conclusions.
2. Conceptual framework
The existence, magnitude and evolution of the informal city are closely related to the creation
and transformation of urban policies, as well as the introduction of inclusion or exclusion
policies. In Figure 1 a simple model, in which the dynamics of the informal city formation and
transformation, is presented. I will refer to this model throughout the article. In the theoretical
model presented, the city is observed in three moments. In Instant t, at the beginning of urban
planning, authorities define what the minimum living standards for the formal city are, either from
the establishment of an urban perimeter, urban zoning, or the definition of construction
standards. Henderson (2009) explains how the society (through the city‘s authorities) could use
exclusionary zoning which might force the new population to the informal-housing sector. The
interest of existing residents in pushing the new population to the informal-housing sector rises
from the following argument: since migrants are usually poorer, their inclusion in the formal
housing sector supposes the extension of local public services that generate a fiscal burden to
existing residents1.
In Instant t, the existing city is divided into two: that which fulfills the minimum
requirements -the formal city-and that which does not fulfill them -the informal city. By defining
minimum living standards, local authorities also determine the cost of entering the formal city for the
1 For more information on Henderson‘s (2009) work please refer to Section 3 of Chapter 2
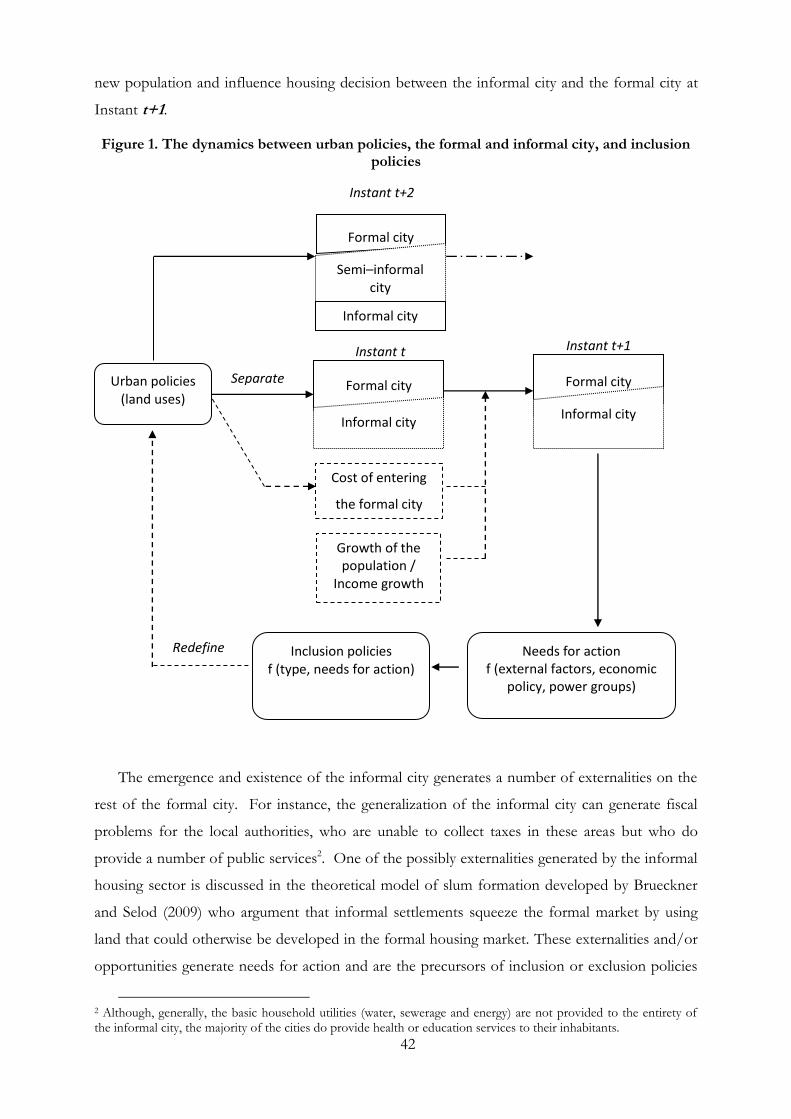
42
new population and influence housing decision between the informal city and the formal city at
Instant t+1.
Figure 1. The dynamics between urban policies, the formal and informal city, and inclusion policies
Instante t+2
Instant t Instant t+1
Urban policies (land uses)
Separate Formal city
Informal city
Cost of entering
the formal city
Formal city
Informal city
Growth of the population /
Income growth
Inclusion policies f (type, needs for action)
Needs for action f (external factors, economic
policy, power groups)
Redefine
Formal city
Semi–informal city
Informal city
Instant t+2
The emergence and existence of the informal city generates a number of externalities on the
rest of the formal city. For instance, the generalization of the informal city can generate fiscal
problems for the local authorities, who are unable to collect taxes in these areas but who do
provide a number of public services2. One of the possibly externalities generated by the informal
housing sector is discussed in the theoretical model of slum formation developed by Brueckner
and Selod (2009) who argument that informal settlements squeeze the formal market by using
land that could otherwise be developed in the formal housing market. These externalities and/or
opportunities generate needs for action and are the precursors of inclusion or exclusion policies
2 Although, generally, the basic household utilities (water, sewerage and energy) are not provided to the entirety of the informal city, the majority of the cities do provide health or education services to their inhabitants.
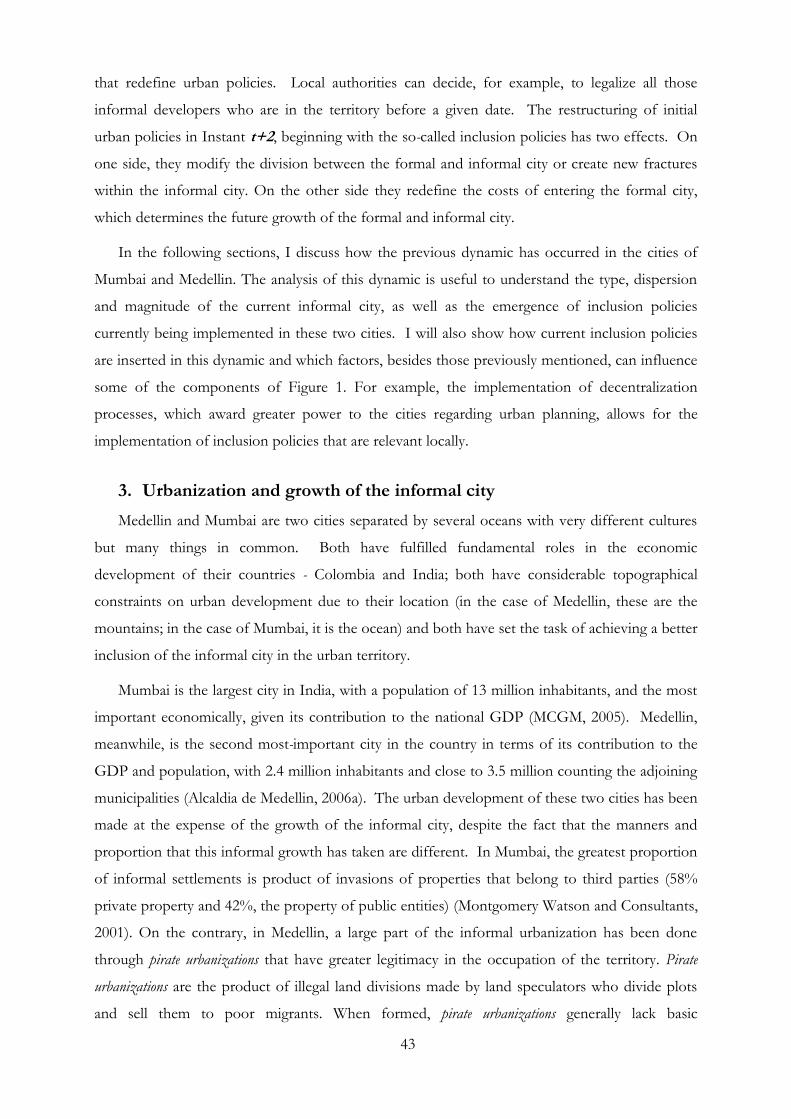
43
that redefine urban policies. Local authorities can decide, for example, to legalize all those
informal developers who are in the territory before a given date. The restructuring of initial
urban policies in Instant t+2, beginning with the so-called inclusion policies has two effects. On
one side, they modify the division between the formal and informal city or create new fractures
within the informal city. On the other side they redefine the costs of entering the formal city,
which determines the future growth of the formal and informal city.
In the following sections, I discuss how the previous dynamic has occurred in the cities of
Mumbai and Medellin. The analysis of this dynamic is useful to understand the type, dispersion
and magnitude of the current informal city, as well as the emergence of inclusion policies
currently being implemented in these two cities. I will also show how current inclusion policies
are inserted in this dynamic and which factors, besides those previously mentioned, can influence
some of the components of Figure 1. For example, the implementation of decentralization
processes, which award greater power to the cities regarding urban planning, allows for the
implementation of inclusion policies that are relevant locally.
3. Urbanization and growth of the informal city
Medellin and Mumbai are two cities separated by several oceans with very different cultures
but many things in common. Both have fulfilled fundamental roles in the economic
development of their countries - Colombia and India; both have considerable topographical
constraints on urban development due to their location (in the case of Medellin, these are the
mountains; in the case of Mumbai, it is the ocean) and both have set the task of achieving a better
inclusion of the informal city in the urban territory.
Mumbai is the largest city in India, with a population of 13 million inhabitants, and the most
important economically, given its contribution to the national GDP (MCGM, 2005). Medellin,
meanwhile, is the second most-important city in the country in terms of its contribution to the
GDP and population, with 2.4 million inhabitants and close to 3.5 million counting the adjoining
municipalities (Alcaldia de Medellin, 2006a). The urban development of these two cities has been
made at the expense of the growth of the informal city, despite the fact that the manners and
proportion that this informal growth has taken are different. In Mumbai, the greatest proportion
of informal settlements is product of invasions of properties that belong to third parties (58%
private property and 42%, the property of public entities) (Montgomery Watson and Consultants,
2001). On the contrary, in Medellin, a large part of the informal urbanization has been done
through pirate urbanizations that have greater legitimacy in the occupation of the territory. Pirate
urbanizations are the product of illegal land divisions made by land speculators who divide plots
and sell them to poor migrants. When formed, pirate urbanizations generally lack basic
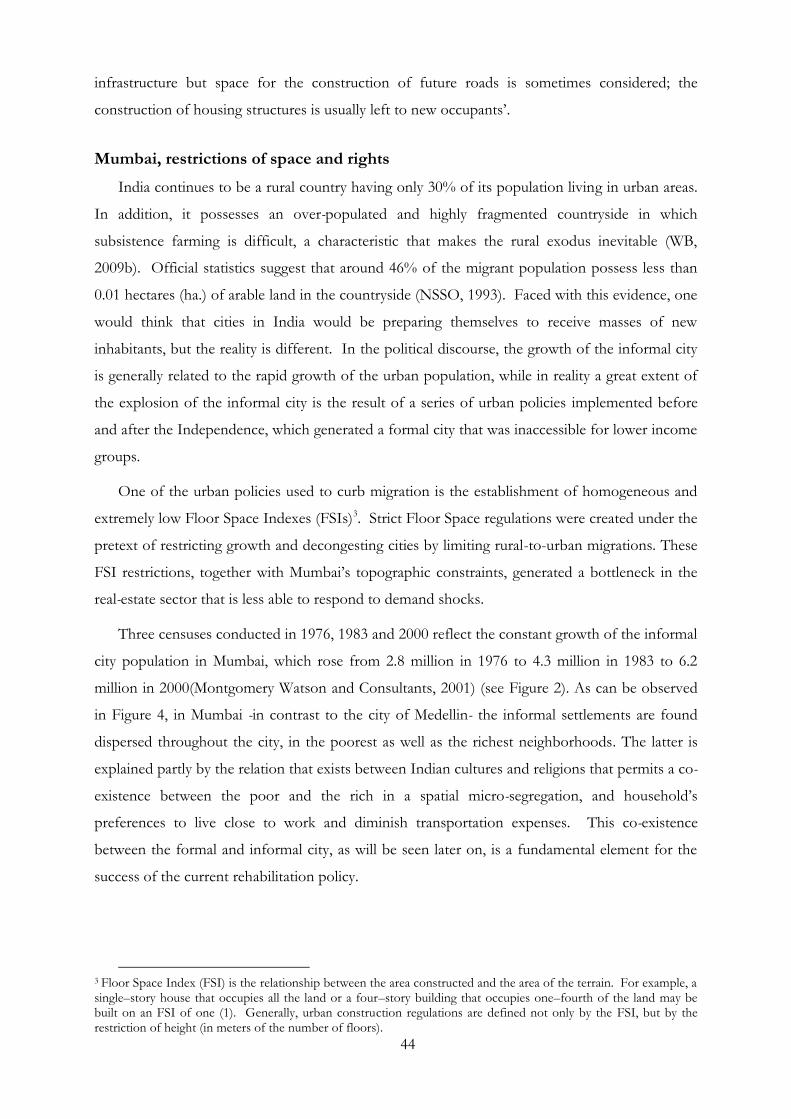
44
infrastructure but space for the construction of future roads is sometimes considered; the
construction of housing structures is usually left to new occupants‘.
Mumbai, restrictions of space and rights
India continues to be a rural country having only 30% of its population living in urban areas.
In addition, it possesses an over-populated and highly fragmented countryside in which
subsistence farming is difficult, a characteristic that makes the rural exodus inevitable (WB,
2009b). Official statistics suggest that around 46% of the migrant population possess less than
0.01 hectares (ha.) of arable land in the countryside (NSSO, 1993). Faced with this evidence, one
would think that cities in India would be preparing themselves to receive masses of new
inhabitants, but the reality is different. In the political discourse, the growth of the informal city
is generally related to the rapid growth of the urban population, while in reality a great extent of
the explosion of the informal city is the result of a series of urban policies implemented before
and after the Independence, which generated a formal city that was inaccessible for lower income
groups.
One of the urban policies used to curb migration is the establishment of homogeneous and
extremely low Floor Space Indexes (FSIs)3. Strict Floor Space regulations were created under the
pretext of restricting growth and decongesting cities by limiting rural-to-urban migrations. These
FSI restrictions, together with Mumbai‘s topographic constraints, generated a bottleneck in the
real-estate sector that is less able to respond to demand shocks.
Three censuses conducted in 1976, 1983 and 2000 reflect the constant growth of the informal
city population in Mumbai, which rose from 2.8 million in 1976 to 4.3 million in 1983 to 6.2
million in 2000(Montgomery Watson and Consultants, 2001) (see Figure 2). As can be observed
in Figure 4, in Mumbai -in contrast to the city of Medellin- the informal settlements are found
dispersed throughout the city, in the poorest as well as the richest neighborhoods. The latter is
explained partly by the relation that exists between Indian cultures and religions that permits a co-
existence between the poor and the rich in a spatial micro-segregation, and household‘s
preferences to live close to work and diminish transportation expenses. This co-existence
between the formal and informal city, as will be seen later on, is a fundamental element for the
success of the current rehabilitation policy.
3 Floor Space Index (FSI) is the relationship between the area constructed and the area of the terrain. For example, a single–story house that occupies all the land or a four–story building that occupies one–fourth of the land may be built on an FSI of one (1). Generally, urban construction regulations are defined not only by the FSI, but by the restriction of height (in meters of the number of floors).
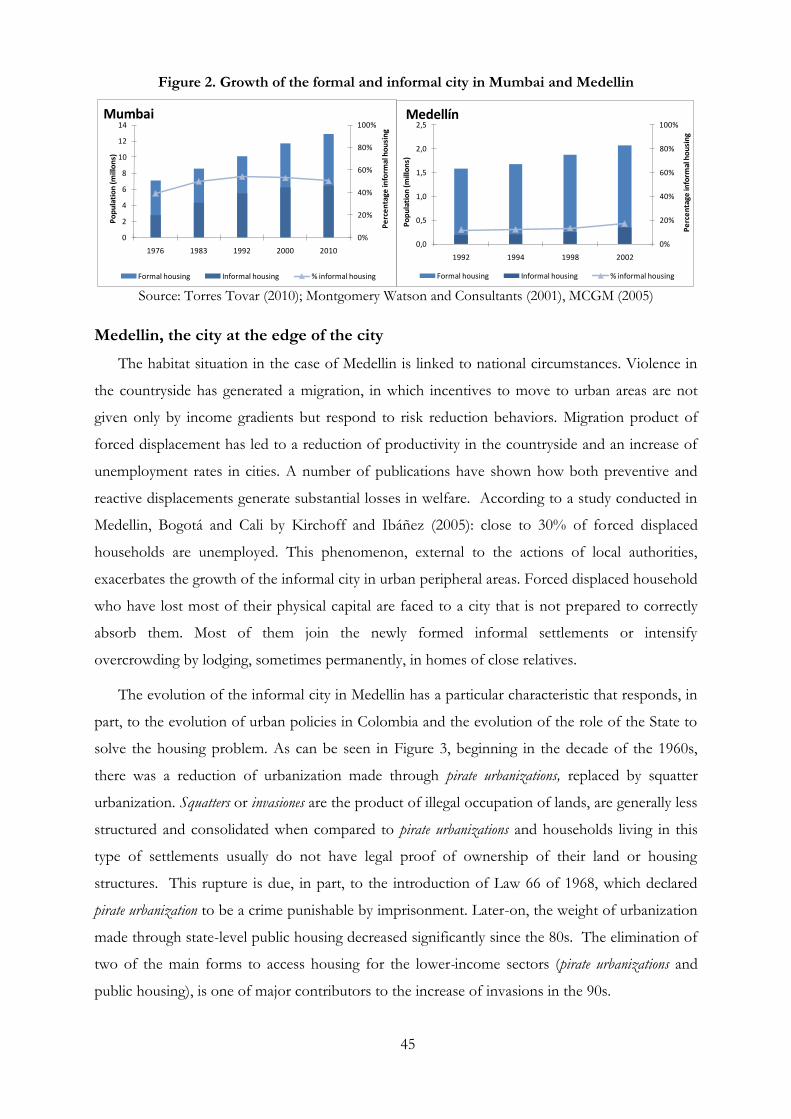
45
Figure 2. Growth of the formal and informal city in Mumbai and Medellin
Source: Torres Tovar (2010); Montgomery Watson and Consultants (2001), MCGM (2005)
Medellin, the city at the edge of the city
The habitat situation in the case of Medellin is linked to national circumstances. Violence in
the countryside has generated a migration, in which incentives to move to urban areas are not
given only by income gradients but respond to risk reduction behaviors. Migration product of
forced displacement has led to a reduction of productivity in the countryside and an increase of
unemployment rates in cities. A number of publications have shown how both preventive and
reactive displacements generate substantial losses in welfare. According to a study conducted in
Medellin, Bogotá and Cali by Kirchoff and Ibáñez (2005): close to 30% of forced displaced
households are unemployed. This phenomenon, external to the actions of local authorities,
exacerbates the growth of the informal city in urban peripheral areas. Forced displaced household
who have lost most of their physical capital are faced to a city that is not prepared to correctly
absorb them. Most of them join the newly formed informal settlements or intensify
overcrowding by lodging, sometimes permanently, in homes of close relatives.
The evolution of the informal city in Medellin has a particular characteristic that responds, in
part, to the evolution of urban policies in Colombia and the evolution of the role of the State to
solve the housing problem. As can be seen in Figure 3, beginning in the decade of the 1960s,
there was a reduction of urbanization made through pirate urbanizations, replaced by squatter
urbanization. Squatters or invasiones are the product of illegal occupation of lands, are generally less
structured and consolidated when compared to pirate urbanizations and households living in this
type of settlements usually do not have legal proof of ownership of their land or housing
structures. This rupture is due, in part, to the introduction of Law 66 of 1968, which declared
pirate urbanization to be a crime punishable by imprisonment. Later-on, the weight of urbanization
made through state-level public housing decreased significantly since the 80s. The elimination of
two of the main forms to access housing for the lower-income sectors (pirate urbanizations and
public housing), is one of major contributors to the increase of invasions in the 90s.
0%
20%
40%
60%
80%
100%
0,0
0,5
1,0
1,5
2,0
2,5
1992 1994 1998 2002
Pe
rce
nta
ge in
form
al h
ou
sin
g
Po
pu
lati
on
(mill
on
s)
Medellín
Formal housing Informal housing % informal housing
0%
20%
40%
60%
80%
100%
0
2
4
6
8
10
12
14
1976 1983 1992 2000 2010
Pe
rce
nta
ge in
form
al h
ou
sin
g
Po
pu
lati
on
(mill
on
s)Mumbai
Formal housing Informal housing % informal housing
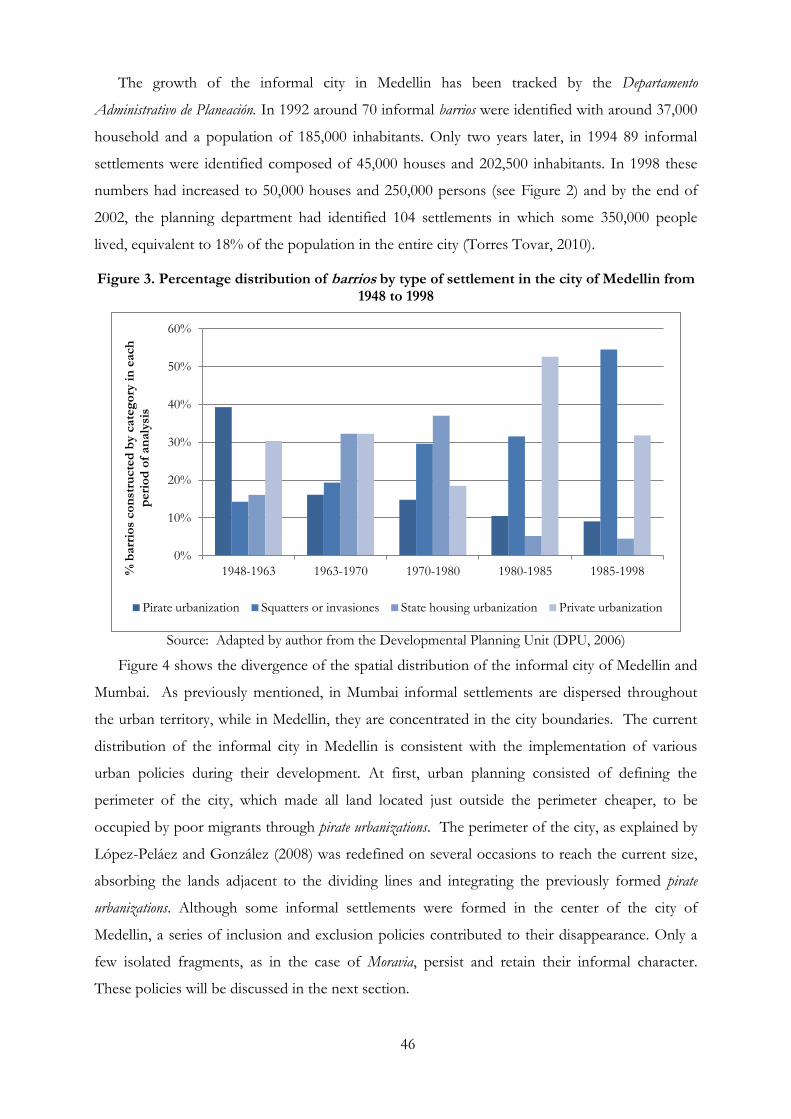
46
The growth of the informal city in Medellin has been tracked by the Departamento
Administrativo de Planeación. In 1992 around 70 informal barrios were identified with around 37,000
household and a population of 185,000 inhabitants. Only two years later, in 1994 89 informal
settlements were identified composed of 45,000 houses and 202,500 inhabitants. In 1998 these
numbers had increased to 50,000 houses and 250,000 persons (see Figure 2) and by the end of
2002, the planning department had identified 104 settlements in which some 350,000 people
lived, equivalent to 18% of the population in the entire city (Torres Tovar, 2010).
Figure 3. Percentage distribution of barrios by type of settlement in the city of Medellin from 1948 to 1998
Source: Adapted by author from the Developmental Planning Unit (DPU, 2006)
Figure 4 shows the divergence of the spatial distribution of the informal city of Medellin and
Mumbai. As previously mentioned, in Mumbai informal settlements are dispersed throughout
the urban territory, while in Medellin, they are concentrated in the city boundaries. The current
distribution of the informal city in Medellin is consistent with the implementation of various
urban policies during their development. At first, urban planning consisted of defining the
perimeter of the city, which made all land located just outside the perimeter cheaper, to be
occupied by poor migrants through pirate urbanizations. The perimeter of the city, as explained by
López-Peláez and González (2008) was redefined on several occasions to reach the current size,
absorbing the lands adjacent to the dividing lines and integrating the previously formed pirate
urbanizations. Although some informal settlements were formed in the center of the city of
Medellin, a series of inclusion and exclusion policies contributed to their disappearance. Only a
few isolated fragments, as in the case of Moravia, persist and retain their informal character.
These policies will be discussed in the next section.
0%
10%
20%
30%
40%
50%
60%
1948-1963 1963-1970 1970-1980 1980-1985 1985-1998 % b
arr
ios
co
nst
ructe
d b
y c
ate
go
ry i
n e
ach
p
eri
od
of
an
aly
sis
Pirate urbanization Squatters or invasiones State housing urbanization Private urbanization
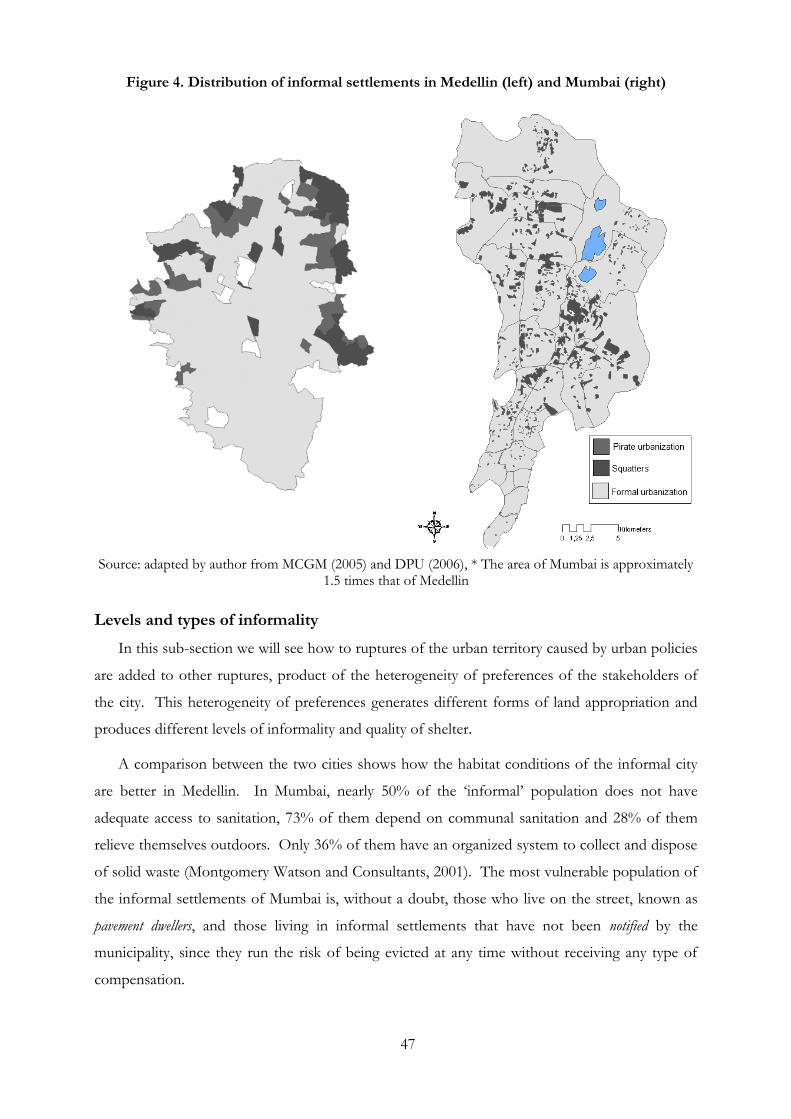
47
Figure 4. Distribution of informal settlements in Medellin (left) and Mumbai (right)
Source: adapted by author from MCGM (2005) and DPU (2006), * The area of Mumbai is approximately 1.5 times that of Medellin
Levels and types of informality
In this sub-section we will see how to ruptures of the urban territory caused by urban policies
are added to other ruptures, product of the heterogeneity of preferences of the stakeholders of
the city. This heterogeneity of preferences generates different forms of land appropriation and
produces different levels of informality and quality of shelter.
A comparison between the two cities shows how the habitat conditions of the informal city
are better in Medellin. In Mumbai, nearly 50% of the ‗informal‘ population does not have
adequate access to sanitation, 73% of them depend on communal sanitation and 28% of them
relieve themselves outdoors. Only 36% of them have an organized system to collect and dispose
of solid waste (Montgomery Watson and Consultants, 2001). The most vulnerable population of
the informal settlements of Mumbai is, without a doubt, those who live on the street, known as
pavement dwellers, and those living in informal settlements that have not been notified by the
municipality, since they run the risk of being evicted at any time without receiving any type of
compensation.
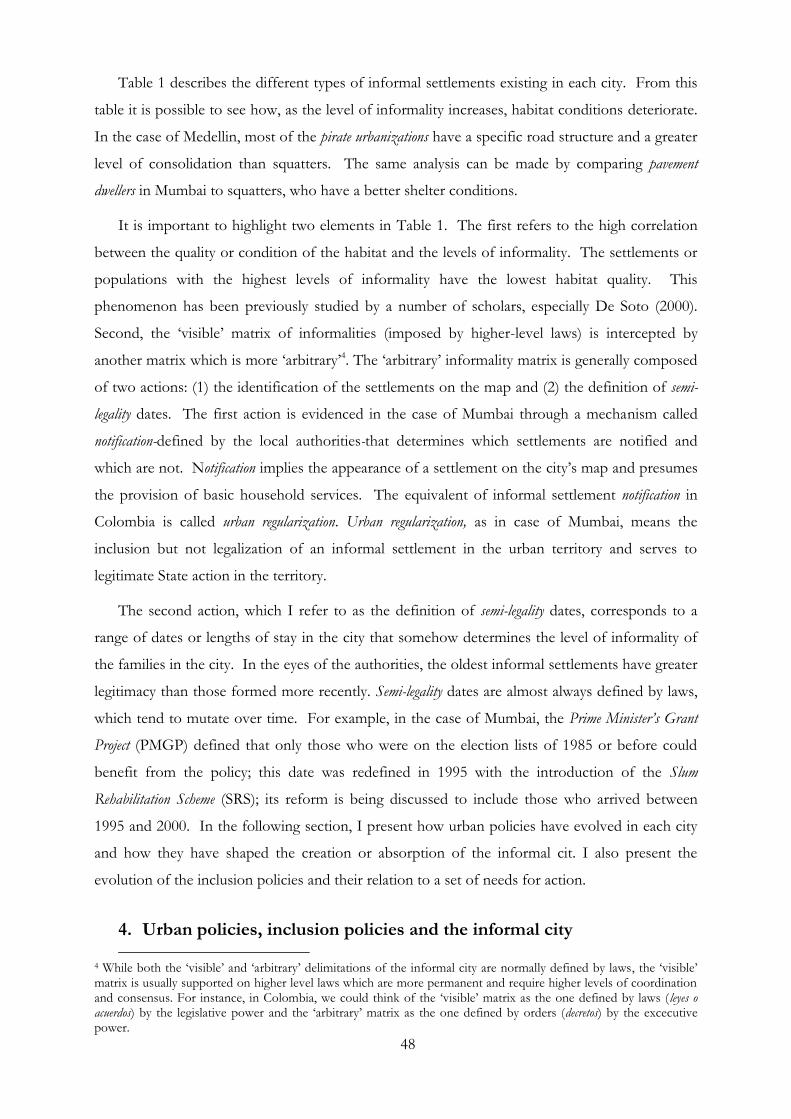
48
Table 1 describes the different types of informal settlements existing in each city. From this
table it is possible to see how, as the level of informality increases, habitat conditions deteriorate.
In the case of Medellin, most of the pirate urbanizations have a specific road structure and a greater
level of consolidation than squatters. The same analysis can be made by comparing pavement
dwellers in Mumbai to squatters, who have a better shelter conditions.
It is important to highlight two elements in Table 1. The first refers to the high correlation
between the quality or condition of the habitat and the levels of informality. The settlements or
populations with the highest levels of informality have the lowest habitat quality. This
phenomenon has been previously studied by a number of scholars, especially De Soto (2000).
Second, the ‗visible‘ matrix of informalities (imposed by higher-level laws) is intercepted by
another matrix which is more ‗arbitrary‘4. The ‗arbitrary‘ informality matrix is generally composed
of two actions: (1) the identification of the settlements on the map and (2) the definition of semi-
legality dates. The first action is evidenced in the case of Mumbai through a mechanism called
notification-defined by the local authorities-that determines which settlements are notified and
which are not. Notification implies the appearance of a settlement on the city‘s map and presumes
the provision of basic household services. The equivalent of informal settlement notification in
Colombia is called urban regularization. Urban regularization, as in case of Mumbai, means the
inclusion but not legalization of an informal settlement in the urban territory and serves to
legitimate State action in the territory.
The second action, which I refer to as the definition of semi-legality dates, corresponds to a
range of dates or lengths of stay in the city that somehow determines the level of informality of
the families in the city. In the eyes of the authorities, the oldest informal settlements have greater
legitimacy than those formed more recently. Semi-legality dates are almost always defined by laws,
which tend to mutate over time. For example, in the case of Mumbai, the Prime Minister‟s Grant
Project (PMGP) defined that only those who were on the election lists of 1985 or before could
benefit from the policy; this date was redefined in 1995 with the introduction of the Slum
Rehabilitation Scheme (SRS); its reform is being discussed to include those who arrived between
1995 and 2000. In the following section, I present how urban policies have evolved in each city
and how they have shaped the creation or absorption of the informal cit. I also present the
evolution of the inclusion policies and their relation to a set of needs for action.
4. Urban policies, inclusion policies and the informal city
4 While both the ‗visible‘ and ‗arbitrary‘ delimitations of the informal city are normally defined by laws, the ‗visible‘ matrix is usually supported on higher level laws which are more permanent and require higher levels of coordination and consensus. For instance, in Colombia, we could think of the ‗visible‘ matrix as the one defined by laws (leyes o acuerdos) by the legislative power and the ‗arbitrary‘ matrix as the one defined by orders (decretos) by the excecutive power.
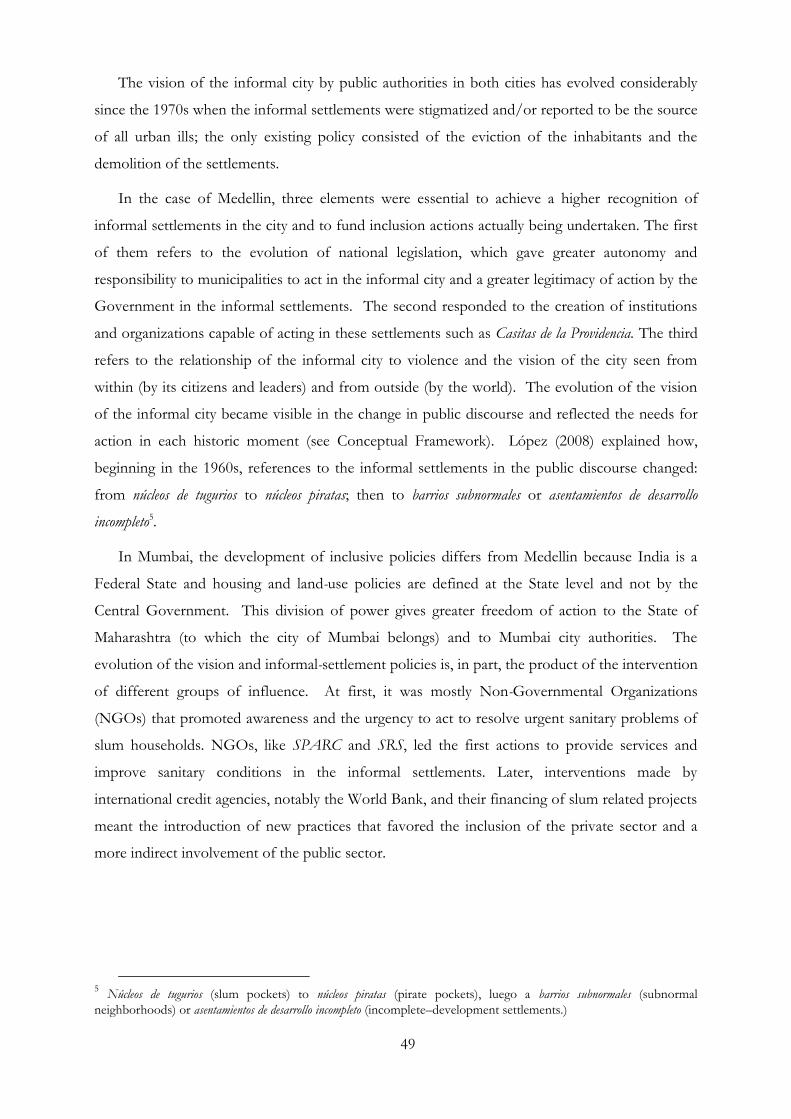
49
The vision of the informal city by public authorities in both cities has evolved considerably
since the 1970s when the informal settlements were stigmatized and/or reported to be the source
of all urban ills; the only existing policy consisted of the eviction of the inhabitants and the
demolition of the settlements.
In the case of Medellin, three elements were essential to achieve a higher recognition of
informal settlements in the city and to fund inclusion actions actually being undertaken. The first
of them refers to the evolution of national legislation, which gave greater autonomy and
responsibility to municipalities to act in the informal city and a greater legitimacy of action by the
Government in the informal settlements. The second responded to the creation of institutions
and organizations capable of acting in these settlements such as Casitas de la Providencia. The third
refers to the relationship of the informal city to violence and the vision of the city seen from
within (by its citizens and leaders) and from outside (by the world). The evolution of the vision
of the informal city became visible in the change in public discourse and reflected the needs for
action in each historic moment (see Conceptual Framework). López (2008) explained how,
beginning in the 1960s, references to the informal settlements in the public discourse changed:
from núcleos de tugurios to núcleos piratas; then to barrios subnormales or asentamientos de desarrollo
incompleto5.
In Mumbai, the development of inclusive policies differs from Medellin because India is a
Federal State and housing and land-use policies are defined at the State level and not by the
Central Government. This division of power gives greater freedom of action to the State of
Maharashtra (to which the city of Mumbai belongs) and to Mumbai city authorities. The
evolution of the vision and informal-settlement policies is, in part, the product of the intervention
of different groups of influence. At first, it was mostly Non-Governmental Organizations
(NGOs) that promoted awareness and the urgency to act to resolve urgent sanitary problems of
slum households. NGOs, like SPARC and SRS, led the first actions to provide services and
improve sanitary conditions in the informal settlements. Later, interventions made by
international credit agencies, notably the World Bank, and their financing of slum related projects
meant the introduction of new practices that favored the inclusion of the private sector and a
more indirect involvement of the public sector.
5 Núcleos de tugurios (slum pockets) to núcleos piratas (pirate pockets), luego a barrios subnormales (subnormal
neighborhoods) or asentamientos de desarrollo incompleto (incomplete–development settlements.)
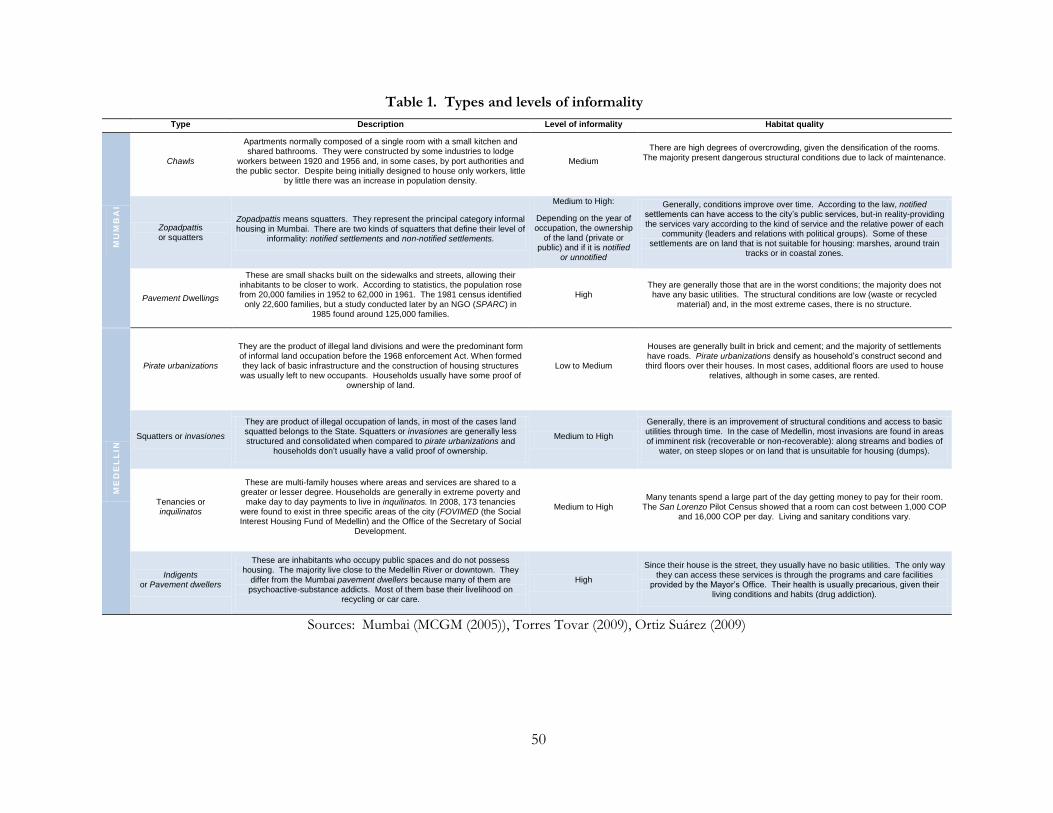
50
Table 1. Types and levels of informality
Sources: Mumbai (MCGM (2005)), Torres Tovar (2009), Ortiz Suárez (2009)
Type Description Level of informality Habitat quality M
UM
BA
I
Chawls
Apartments normally composed of a single room with a small kitchen and shared bathrooms. They were constructed by some industries to lodge
workers between 1920 and 1956 and, in some cases, by port authorities and the public sector. Despite being initially designed to house only workers, little
by little there was an increase in population density.
Medium
There are high degrees of overcrowding, given the densification of the rooms. The majority present dangerous structural conditions due to lack of maintenance.
Zopadpattis or squatters
Zopadpattis means squatters. They represent the principal category informal housing in Mumbai. There are two kinds of squatters that define their level of
informality: notified settlements and non-notified settlements.
Medium to High:
Depending on the year of occupation, the ownership
of the land (private or public) and if it is notified
or unnotified
Generally, conditions improve over time. According to the law, notified settlements can have access to the city’s public services, but-in reality-providing the services vary according to the kind of service and the relative power of each
community (leaders and relations with political groups). Some of these settlements are on land that is not suitable for housing: marshes, around train
tracks or in coastal zones.
Pavement Dwellings
These are small shacks built on the sidewalks and streets, allowing their inhabitants to be closer to work. According to statistics, the population rose from 20,000 families in 1952 to 62,000 in 1961. The 1981 census identified
only 22,600 families, but a study conducted later by an NGO (SPARC) in 1985 found around 125,000 families.
High They are generally those that are in the worst conditions; the majority does not have any basic utilities. The structural conditions are low (waste or recycled
material) and, in the most extreme cases, there is no structure.
ME
DE
LL
IN
Pirate urbanizations
They are the product of illegal land divisions and were the predominant form of informal land occupation before the 1968 enforcement Act. When formed they lack of basic infrastructure and the construction of housing structures was usually left to new occupants. Households usually have some proof of
ownership of land.
Low to Medium
Houses are generally built in brick and cement; and the majority of settlements have roads. Pirate urbanizations densify as household’s construct second and third floors over their houses. In most cases, additional floors are used to house
relatives, although in some cases, are rented.
Squatters or invasiones
They are product of illegal occupation of lands, in most of the cases land squatted belongs to the State. Squatters or invasiones are generally less structured and consolidated when compared to pirate urbanizations and
households don’t usually have a valid proof of ownership.
Medium to High
Generally, there is an improvement of structural conditions and access to basic utilities through time. In the case of Medellin, most invasions are found in areas of imminent risk (recoverable or non-recoverable): along streams and bodies of
water, on steep slopes or on land that is unsuitable for housing (dumps).
Tenancies or inquilinatos
These are multi-family houses where areas and services are shared to a greater or lesser degree. Households are generally in extreme poverty and
make day to day payments to live in inquilinatos. In 2008, 173 tenancies were found to exist in three specific areas of the city (FOVIMED (the Social Interest Housing Fund of Medellin) and the Office of the Secretary of Social
Development.
Medium to High Many tenants spend a large part of the day getting money to pay for their room.
The San Lorenzo Pilot Census showed that a room can cost between 1,000 COP and 16,000 COP per day. Living and sanitary conditions vary.
Indigents or Pavement dwellers
These are inhabitants who occupy public spaces and do not possess housing. The majority live close to the Medellin River or downtown. They
differ from the Mumbai pavement dwellers because many of them are psychoactive-substance addicts. Most of them base their livelihood on
recycling or car care.
High
Since their house is the street, they usually have no basic utilities. The only way they can access these services is through the programs and care facilities
provided by the Mayor’s Office. Their health is usually precarious, given their living conditions and habits (drug addiction).
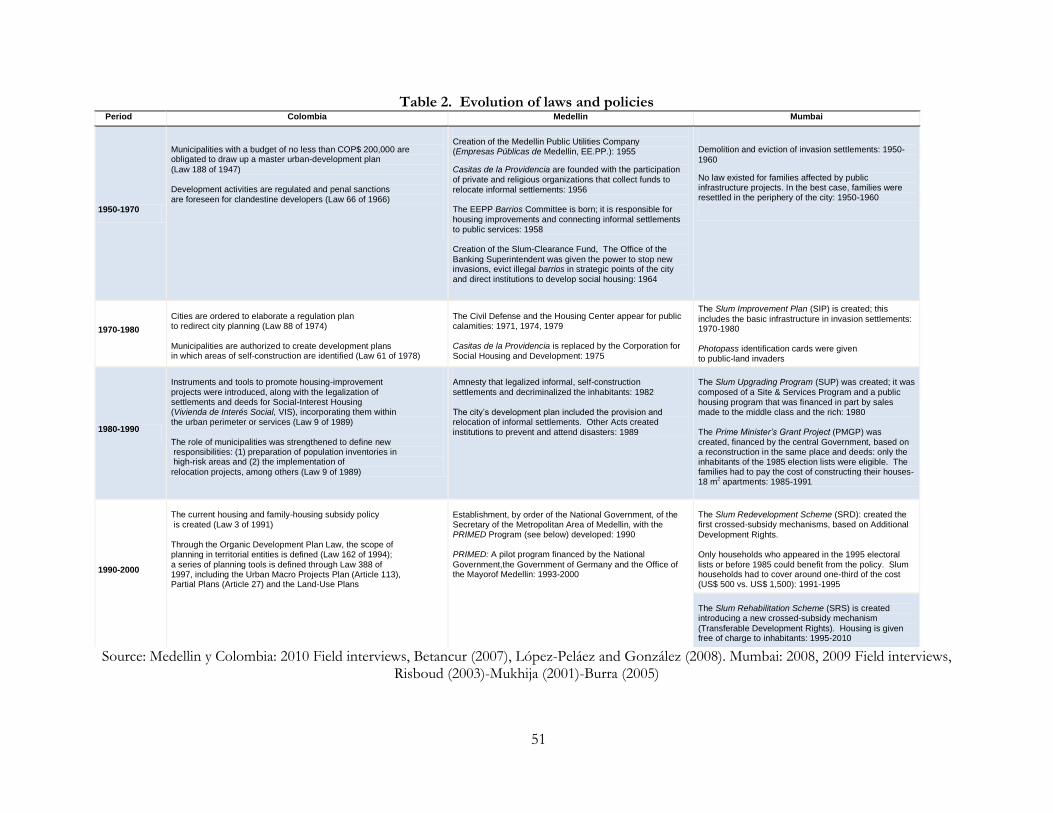
51
Table 2. Evolution of laws and policies Period Colombia Medellin Mumbai
1950-1970
Municipalities with a budget of no less than COP$ 200,000 are obligated to draw up a master urban-development plan
(Law 188 of 1947) Development activities are regulated and penal sanctions are foreseen for clandestine developers (Law 66 of 1966)
Creation of the Medellin Public Utilities Company (Empresas Públicas de Medellin, EE.PP.): 1955
Casitas de la Providencia are founded with the participation of private and religious organizations that collect funds to relocate informal settlements: 1956 The EEPP Barrios Committee is born; it is responsible for housing improvements and connecting informal settlements to public services: 1958 Creation of the Slum-Clearance Fund, The Office of the
Banking Superintendent was given the power to stop new invasions, evict illegal barrios in strategic points of the city and direct institutions to develop social housing: 1964
Demolition and eviction of invasion settlements: 1950-
1960
No law existed for families affected by public infrastructure projects. In the best case, families were resettled in the periphery of the city: 1950-1960
1970-1980
Cities are ordered to elaborate a regulation plan to redirect city planning (Law 88 of 1974) Municipalities are authorized to create development plans in which areas of self-construction are identified (Law 61 of 1978)
The Civil Defense and the Housing Center appear for public calamities: 1971, 1974, 1979 Casitas de la Providencia is replaced by the Corporation for Social Housing and Development: 1975
The Slum Improvement Plan (SIP) is created; this
includes the basic infrastructure in invasion settlements: 1970-1980 Photopass identification cards were given to public-land invaders
1980-1990
Instruments and tools to promote housing-improvement projects were introduced, along with the legalization of settlements and deeds for Social-Interest Housing (Vivienda de Interés Social, VIS), incorporating them within the urban perimeter or services (Law 9 of 1989) The role of municipalities was strengthened to define new responsibilities: (1) preparation of population inventories in high-risk areas and (2) the implementation of
relocation projects, among others (Law 9 of 1989)
Amnesty that legalized informal, self-construction settlements and decriminalized the inhabitants: 1982 The city’s development plan included the provision and relocation of informal settlements. Other Acts created institutions to prevent and attend disasters: 1989
The Slum Upgrading Program (SUP) was created; it was composed of a Site & Services Program and a public housing program that was financed in part by sales made to the middle class and the rich: 1980 The Prime Minister’s Grant Project (PMGP) was created, financed by the central Government, based on a reconstruction in the same place and deeds: only the inhabitants of the 1985 election lists were eligible. The families had to pay the cost of constructing their houses-18 m2 apartments: 1985-1991
1990-2000
The current housing and family-housing subsidy policy is created (Law 3 of 1991) Through the Organic Development Plan Law, the scope of planning in territorial entities is defined (Law 162 of 1994); a series of planning tools is defined through Law 388 of 1997, including the Urban Macro Projects Plan (Article 113), Partial Plans (Article 27) and the Land-Use Plans
Establishment, by order of the National Government, of the Secretary of the Metropolitan Area of Medellin, with the PRIMED Program (see below) developed: 1990 PRIMED: A pilot program financed by the National
Government,the Government of Germany and the Office of the Mayorof Medellin: 1993-2000
The Slum Redevelopment Scheme (SRD): created the first crossed-subsidy mechanisms, based on Additional
Development Rights. Only households who appeared in the 1995 electoral lists or before 1985 could benefit from the policy. Slum households had to cover around one-third of the cost (US$ 500 vs. US$ 1,500): 1991-1995
The Slum Rehabilitation Scheme (SRS) is created introducing a new crossed-subsidy mechanism
(Transferable Development Rights). Housing is given free of charge to inhabitants: 1995-2010
Source: Medellin y Colombia: 2010 Field interviews, Betancur (2007), López-Peláez and González (2008). Mumbai: 2008, 2009 Field interviews, Risboud (2003)-Mukhija (2001)-Burra (2005)
52
In addition, direct financing by the central Government for projects aimed at improving the
quality of life of informal city inhabitants, such as the Prime Minister‟s Grant Project-PMGP,
influenced local inclusion policies. For example, through PMGP, the inability of slum household‘s
to pay for the reconstruction of their houses was acknowledged and the possibility of introducing
cross-subsidy mechanisms involving the private sector was evaluated. Last but not least, political
parties who identified slums as vote banks introduced informal-city-programs in their campaigns.
The current policy was in fact proposed during the 1995 elections by the Shiv Sena party, which
promised to give 800,000 new houses to inhabitants of informal settlements (Burra, 1999). When
Shiv Sena reached power it introduced the SRS and determined that only those who had a
Photopass or who appeared in the electoral census of 1995 or before were eligible, establishing the
date of semi-legality, which is still maintained.
Table 2 presents the evolution of urban policies in both cities. In the case of Medellin, two
examples allow us to outline the impact of urban policies in the location of informal settlements
in this city. The first (1964) refers to a policy in which new investments and the eviction of illegal
barrios in strategic sites of the city were ordered; this was the responsibility of the Superintendencia
Bancaria. The second, in 1982, refers to an amnesty law that legitimized a number of informal
settlements. Together, they explain the current concentration of informal settlements at the edge
of the city. Later on, National Government laws gave municipalities the tools and responsibilities
to act in informal settlements that allowed them to initiate programs, such as the Integral
Improvement Program of Subnormal Barrios of Medellin (Programa de Mejoramiento Integral de
Barrios Subnormales de Medellin, PRIMED), around the beginning of the 90s. In the same manner,
Urban Integral Projects UIP are linked to the way in which the urban planning concept has been
developed in Colombia in the Law 9 of 1989 and the Law 388 of 1997. The use of such
management tools for the inclusion of the informal city in the urban area is, in turn, justified by
the morphology and distribution of the informal Colombian city.
5. Social Urbanism vs. Urban Neoliberalism: two answers to a need for
action
The cities of Medellin and Mumbai have led a series of informal-city inclusion policies for
several decades. In the beginning, both cities concentrated on providing essential services; they
then implemented more complete policies and included other essential aspects of life in the
harmonic city (UN-Habitat, 2009b): spatial, social and environmental harmony. In Medellin, the
introduction of Urban Integral Projects (UIPs) is consistent with the existence of an informal city
concentrated in specific areas, the planning and institutional mechanisms at hand and the socio-
53
economic context of the city. In Mumbai, the high fragmentation and coexistence of the informal
and the formal city allow for the implementation of cross-financing mechanisms and the
cohabitation of several groups of population. In this section I present the principal characteristics
of the actual inclusion policies in Medellin and Mumbai, as well as the mechanisms or needs for
action that made them possible.
Medellin: Social Urbanism
Both the birth of PRIMED1 and the beginning of Urban Integral Projects (UIPs) are largely
explained by the municipal administration‘s search for a less violent, less spatially unequal city.
According to Betancur (2007), PRIMED was proposed by the Office of the Secretary of the
Metropolitan Area and Medellin, an entity that had been commissioned by the National
Government to address the problems of violence, governance and social decomposition in the
poor barrios of the city. Betancur (2005) explains how PRIMED‟s most pressing objective was to
achieve the unification of the city through the inclusion of sub-normal barrios and to achieve
pacific coexistence.
The conception of urban projects, in which all the components of the city are integrated,
began with PRIMED, a program that took into account the improvement of housing conditions
and ownership, employment and training, education, environment, social relations, security and
governance. All these components, and a number of additional components, were also included
in the formulation of the Urban Integral Projects. PRIMED achieved considerable improvement in
public space and road infrastructure, the legalization of around 2,100 houses and the provision of
water and sewerage to the vast majority of houses that were within the range of action. However,
according to Betancur (2003), the projects did not generate a greater sense of ownership and the
titling program did not achieve the expected results since the legalization processes was too
complex and time consuming. PRIMED was ended following a number of administrative
problems, but later served as the basis for the formulation and implementation of the UIPs.
With the arrival of Sergio Fajardo to the city‘s administration, the introduction of the UIPs
found its justification in Line 3 of the 2004-2007 Develop Plan. The latter aimed to provide equal
regional opportunities, provide integral intervention in the city and propitiate positive changes in
the socio-cultural behavior of the population. According to EDU (the Medellin Urban
Development Enterprise-Empresa de Desarrollo Urbano de Medellin), an Urban Integral Project is a
planning instrument for physical intervention in areas characterized by high levels of
1 The Integral Program for Improvement of Sub–Normal Barrios in Medellín (Programa Integral de Mejoramiento de Barrios Subnormales de Medellín, PRIMED)
54
marginalization, segregation, poverty and violence (Echeverri Restrepo and Orsini, 2010). UIPs
consider the interaction of three fundamental components to coordinate actions in a defined
territory. The first, called the institutional component, seeks to coordinate the different policies,
programs and services from the Office of the Mayor. The second, called the community
participation and public communication component, seeks to incite the participation of communities in
the projects‘ design, construction and appropriation. The third and last is the physical component,
through which integral physical transformations are generated. In order to achieve a greater
appropriation of new public amenities and public spaces and taking into consideration the lessons
learned from PRIMED, the municipality decided to foster the use of enjoyable, modern
architecture to arouse community pride and generate a sense of belonging.
In reality it is not accurate to refer to UIPs as a policy, since they are more a coordination of a
set of projects in a given area expected to bring all essential urban services to the informal city. In
normative terms, each UIP is delimited by municipal decrees based on the principles of the
territorial organization defined by Law 388 of 1997 and land-use plans adopted by the
Municipality of Medellin. Considering that UIP interventions contemplate a number of
components, their correct implementation requires precise coordination of all of the Municipal
Secretaries and the different levels of government. The consolidation of the Urban Development
Enterprise (Empresa de Desarrollo Urbano, EDU) in 2002, which is in charge of designing and
implementing UIPs, was essential for the execution of these projects since, without the EDU,
UIPs which cover periods of four (4) to five (5) years, would not have fit in the Municipal
Investment Plan, which is annual.
Table 3 shows the four UIPs that have or are in the process of being implemented, the
population involved and the expected cost. Housing and transportation projects are generally
financed by the three administrative levels (Local, Departmental and National), while
interventions to improve public space and educational entities in the territory are largely financed
by the Medellin municipality. This policy, therefore, requires the existence of substantial
municipal budget. In the case of the city of Medellin, the generalization of UIPs has been possible
due to the increased income of the municipality in the last two administrations. The city‘s income
grew from around COP $1.517 billion in 2004 to COP $3,309 billion in 2008, equal to an
increase of 118%, in the same period, investment grew 169%( Alcaldía de Medellin, 2010). The
UIP areas of intervention coincide with the areas of the city that have the lowest levels of quality
of life. Of the ten Comunas with the lowest values in the Indicator of Quality of Life, eight are or
have been intervened through UIPs.
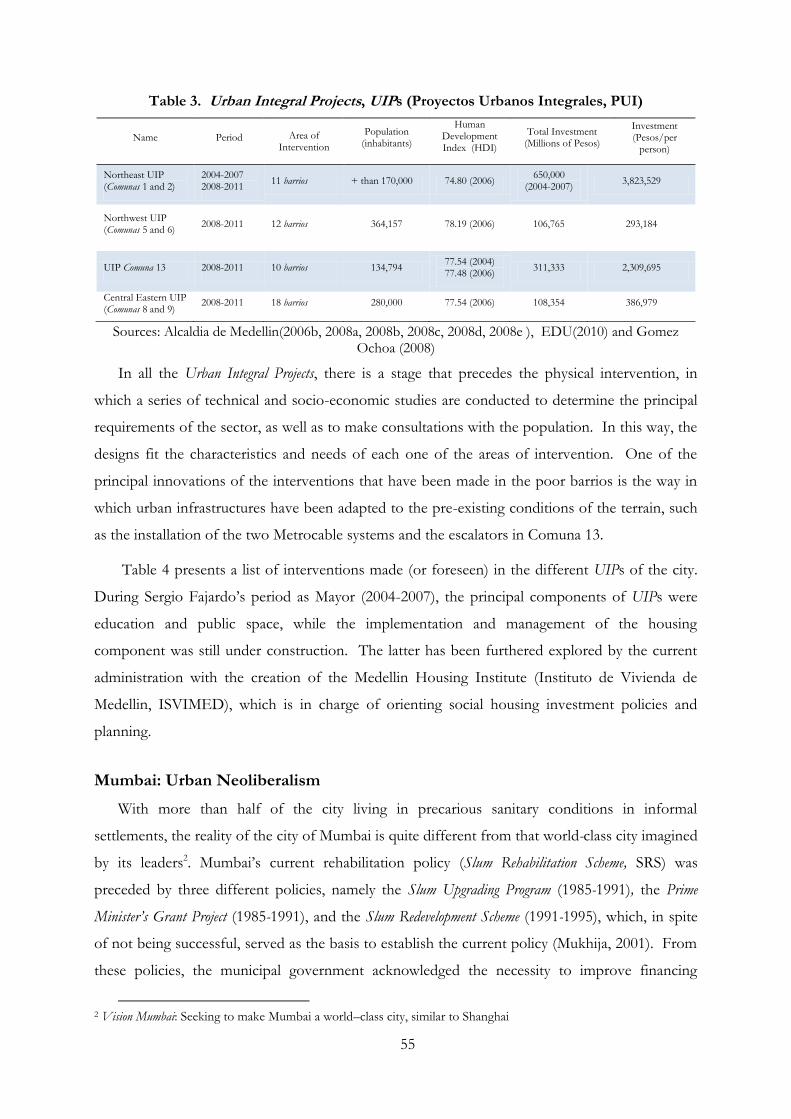
55
Table 3. Urban Integral Projects, UIPs (Proyectos Urbanos Integrales, PUI)
Sources: Alcaldia de Medellin(2006b, 2008a, 2008b, 2008c, 2008d, 2008e ), EDU(2010) and Gomez
Ochoa (2008)
In all the Urban Integral Projects, there is a stage that precedes the physical intervention, in
which a series of technical and socio-economic studies are conducted to determine the principal
requirements of the sector, as well as to make consultations with the population. In this way, the
designs fit the characteristics and needs of each one of the areas of intervention. One of the
principal innovations of the interventions that have been made in the poor barrios is the way in
which urban infrastructures have been adapted to the pre-existing conditions of the terrain, such
as the installation of the two Metrocable systems and the escalators in Comuna 13.
Table 4 presents a list of interventions made (or foreseen) in the different UIPs of the city.
During Sergio Fajardo‘s period as Mayor (2004-2007), the principal components of UIPs were
education and public space, while the implementation and management of the housing
component was still under construction. The latter has been furthered explored by the current
administration with the creation of the Medellin Housing Institute (Instituto de Vivienda de
Medellin, ISVIMED), which is in charge of orienting social housing investment policies and
planning.
Mumbai: Urban Neoliberalism
With more than half of the city living in precarious sanitary conditions in informal
settlements, the reality of the city of Mumbai is quite different from that world-class city imagined
by its leaders2. Mumbai‘s current rehabilitation policy (Slum Rehabilitation Scheme, SRS) was
preceded by three different policies, namely the Slum Upgrading Program (1985-1991), the Prime
Minister‟s Grant Project (1985-1991), and the Slum Redevelopment Scheme (1991-1995), which, in spite
of not being successful, served as the basis to establish the current policy (Mukhija, 2001). From
these policies, the municipal government acknowledged the necessity to improve financing
2 Vision Mumbai: Seeking to make Mumbai a world–class city, similar to Shanghai
Name Period Area of
Intervention
Population (inhabitants)
Human Development Index (HDI)
Total Investment (Millions of Pesos)
Investment (Pesos/per
person)
Northeast UIP (Comunas 1 and 2)
2004-2007 2008-2011
11 barrios + than 170,000 74.80 (2006) 650,000
(2004-2007) 3,823,529
Northwest UIP (Comunas 5 and 6)
2008-2011 12 barrios 364,157 78.19 (2006) 106,765 293,184
UIP Comuna 13 2008-2011 10 barrios 134,794 77.54 (2004) 77.48 (2006)
311,333 2,309,695
Central Eastern UIP (Comunas 8 and 9)
2008-2011 18 barrios 280,000 77.54 (2006) 108,354 386,979
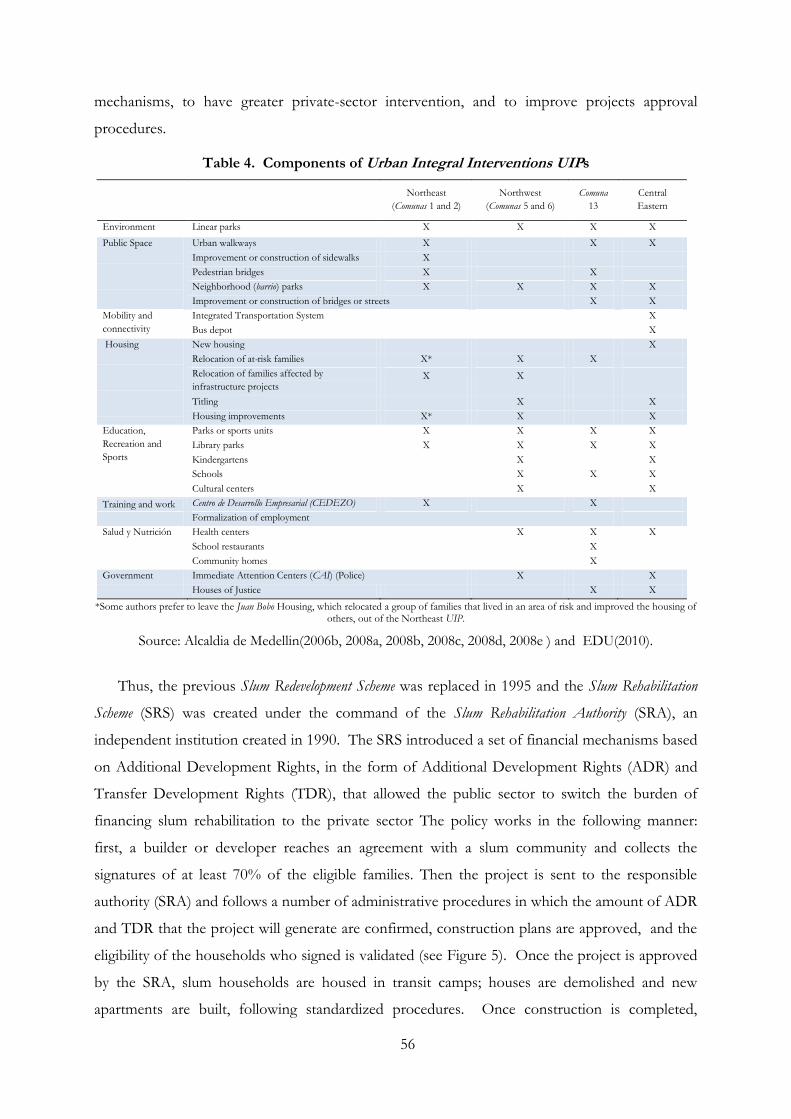
56
mechanisms, to have greater private-sector intervention, and to improve projects approval
procedures.
Table 4. Components of Urban Integral Interventions UIPs
*Some authors prefer to leave the Juan Bobo Housing, which relocated a group of families that lived in an area of risk and improved the housing of
others, out of the Northeast UIP.
Source: Alcaldia de Medellin(2006b, 2008a, 2008b, 2008c, 2008d, 2008e ) and EDU(2010).
Thus, the previous Slum Redevelopment Scheme was replaced in 1995 and the Slum Rehabilitation
Scheme (SRS) was created under the command of the Slum Rehabilitation Authority (SRA), an
independent institution created in 1990. The SRS introduced a set of financial mechanisms based
on Additional Development Rights, in the form of Additional Development Rights (ADR) and
Transfer Development Rights (TDR), that allowed the public sector to switch the burden of
financing slum rehabilitation to the private sector The policy works in the following manner:
first, a builder or developer reaches an agreement with a slum community and collects the
signatures of at least 70% of the eligible families. Then the project is sent to the responsible
authority (SRA) and follows a number of administrative procedures in which the amount of ADR
and TDR that the project will generate are confirmed, construction plans are approved, and the
eligibility of the households who signed is validated (see Figure 5). Once the project is approved
by the SRA, slum households are housed in transit camps; houses are demolished and new
apartments are built, following standardized procedures. Once construction is completed,
Northeast
(Comunas 1 and 2)
Northwest
(Comunas 5 and 6)
Comuna
13
Central
Eastern
Environment Linear parks X X X X
Public Space
Urban walkways X X X
Improvement or construction of sidewalks X
Pedestrian bridges X X
Neighborhood (barrio) parks X X X X
Improvement or construction of bridges or streets X X
Mobility and
connectivity
Integrated Transportation System X
Bus depot X
Housing
New housing X
Relocation of at-risk families X* X X
Relocation of families affected by
infrastructure projects X X
Titling X X
Housing improvements X* X X
Education,
Recreation and
Sports
Parks or sports units X X X X
Library parks X X X X
Kindergartens X X
Schools X X X
Cultural centers X X
Training and work Centro de Desarrollo Empresarial (CEDEZO) X X
Formalization of employment
Salud y Nutrición Health centers X X X
School restaurants X
Community homes X
Government Immediate Attention Centers (CAI) (Police) X X
Houses of Justice X X
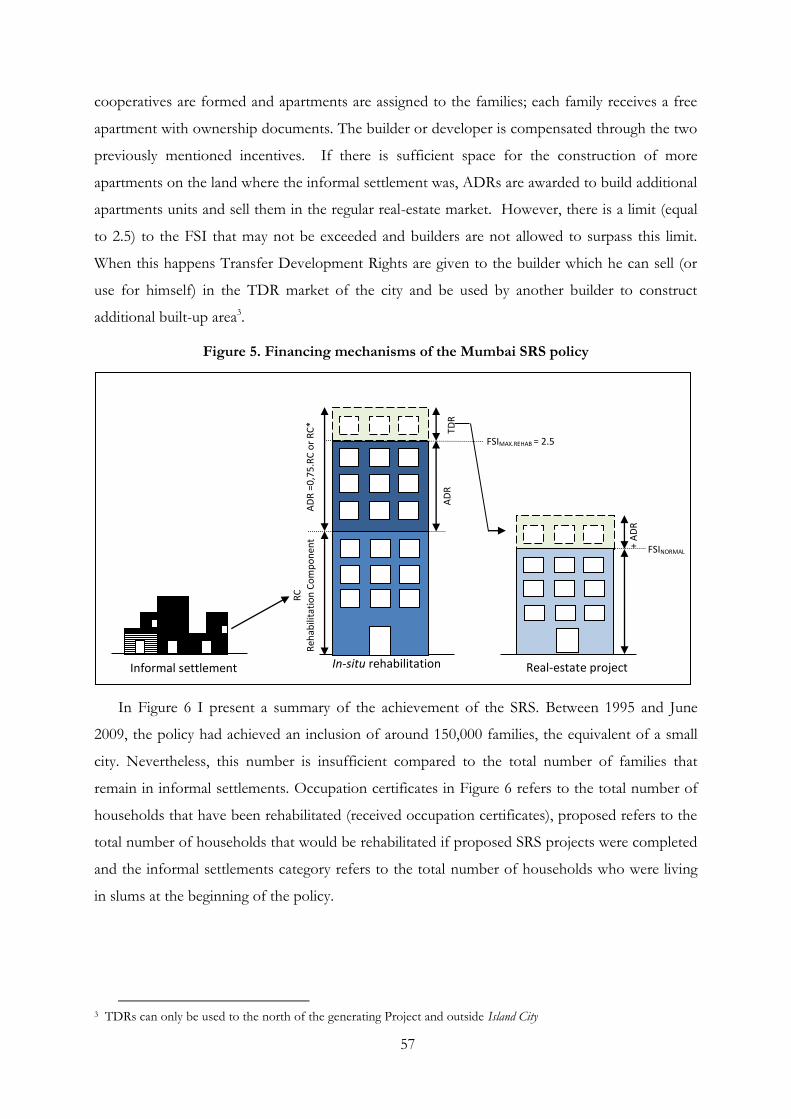
57
cooperatives are formed and apartments are assigned to the families; each family receives a free
apartment with ownership documents. The builder or developer is compensated through the two
previously mentioned incentives. If there is sufficient space for the construction of more
apartments on the land where the informal settlement was, ADRs are awarded to build additional
apartments units and sell them in the regular real-estate market. However, there is a limit (equal
to 2.5) to the FSI that may not be exceeded and builders are not allowed to surpass this limit.
When this happens Transfer Development Rights are given to the builder which he can sell (or
use for himself) in the TDR market of the city and be used by another builder to construct
additional built-up area3.
Figure 5. Financing mechanisms of the Mumbai SRS policy
In Figure 6 I present a summary of the achievement of the SRS. Between 1995 and June
2009, the policy had achieved an inclusion of around 150,000 families, the equivalent of a small
city. Nevertheless, this number is insufficient compared to the total number of families that
remain in informal settlements. Occupation certificates in Figure 6 refers to the total number of
households that have been rehabilitated (received occupation certificates), proposed refers to the
total number of households that would be rehabilitated if proposed SRS projects were completed
and the informal settlements category refers to the total number of households who were living
in slums at the beginning of the policy.
3 TDRs can only be used to the north of the generating Project and outside Island City
Figure 5. Financing mechanisms of the Mumbai SRS policy
TDR
AD
R =
0,7
5.R
C o
r R
C*
Informal settlement In-situ rehabilitation Real-estate project
RC
Reh
abili
tati
on
Co
mp
on
ent
AD
R
FSIMAX.REHAB = 2.5
+ A
DR
FSINORMAL
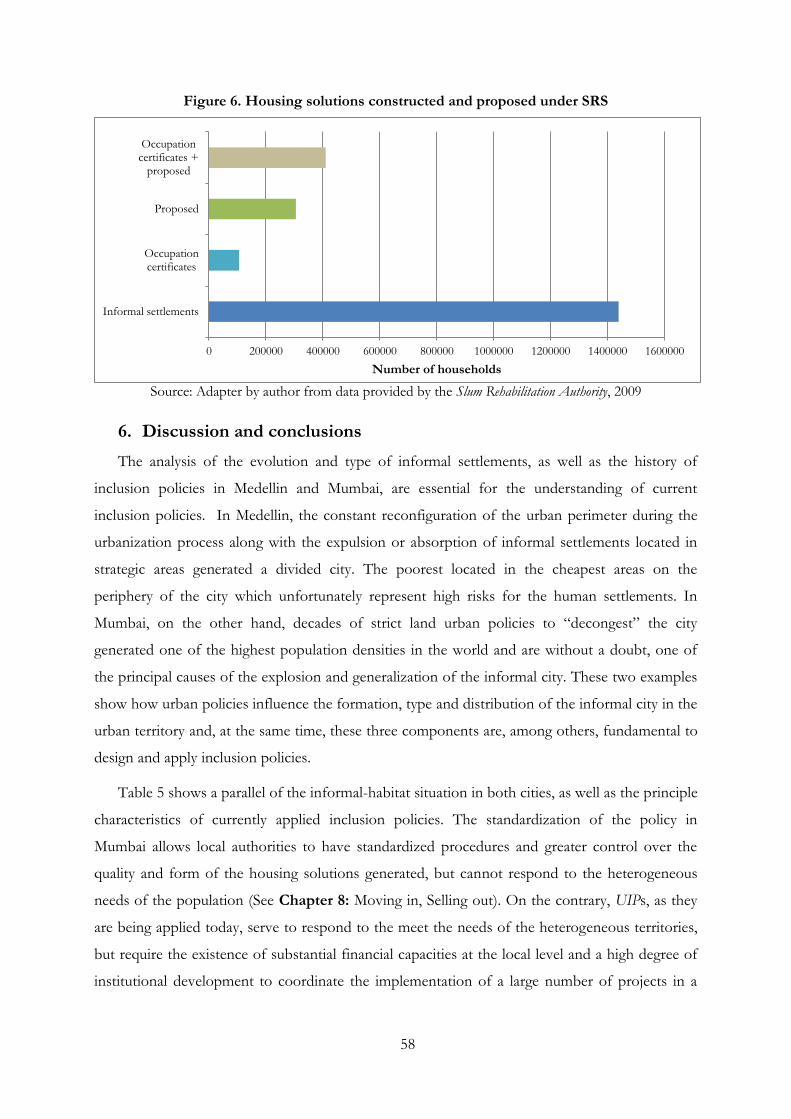
58
Figure 6. Housing solutions constructed and proposed under SRS
Source: Adapter by author from data provided by the Slum Rehabilitation Authority, 2009
6. Discussion and conclusions
The analysis of the evolution and type of informal settlements, as well as the history of
inclusion policies in Medellin and Mumbai, are essential for the understanding of current
inclusion policies. In Medellin, the constant reconfiguration of the urban perimeter during the
urbanization process along with the expulsion or absorption of informal settlements located in
strategic areas generated a divided city. The poorest located in the cheapest areas on the
periphery of the city which unfortunately represent high risks for the human settlements. In
Mumbai, on the other hand, decades of strict land urban policies to ―decongest‖ the city
generated one of the highest population densities in the world and are without a doubt, one of
the principal causes of the explosion and generalization of the informal city. These two examples
show how urban policies influence the formation, type and distribution of the informal city in the
urban territory and, at the same time, these three components are, among others, fundamental to
design and apply inclusion policies.
Table 5 shows a parallel of the informal-habitat situation in both cities, as well as the principle
characteristics of currently applied inclusion policies. The standardization of the policy in
Mumbai allows local authorities to have standardized procedures and greater control over the
quality and form of the housing solutions generated, but cannot respond to the heterogeneous
needs of the population (See Chapter 8: Moving in, Selling out). On the contrary, UIPs, as they
are being applied today, serve to respond to the meet the needs of the heterogeneous territories,
but require the existence of substantial financial capacities at the local level and a high degree of
institutional development to coordinate the implementation of a large number of projects in a
0 200000 400000 600000 800000 1000000 1200000 1400000 1600000
Informal settlements
Occupation certificates
Proposed
Occupation certificates +
proposed
Number of households
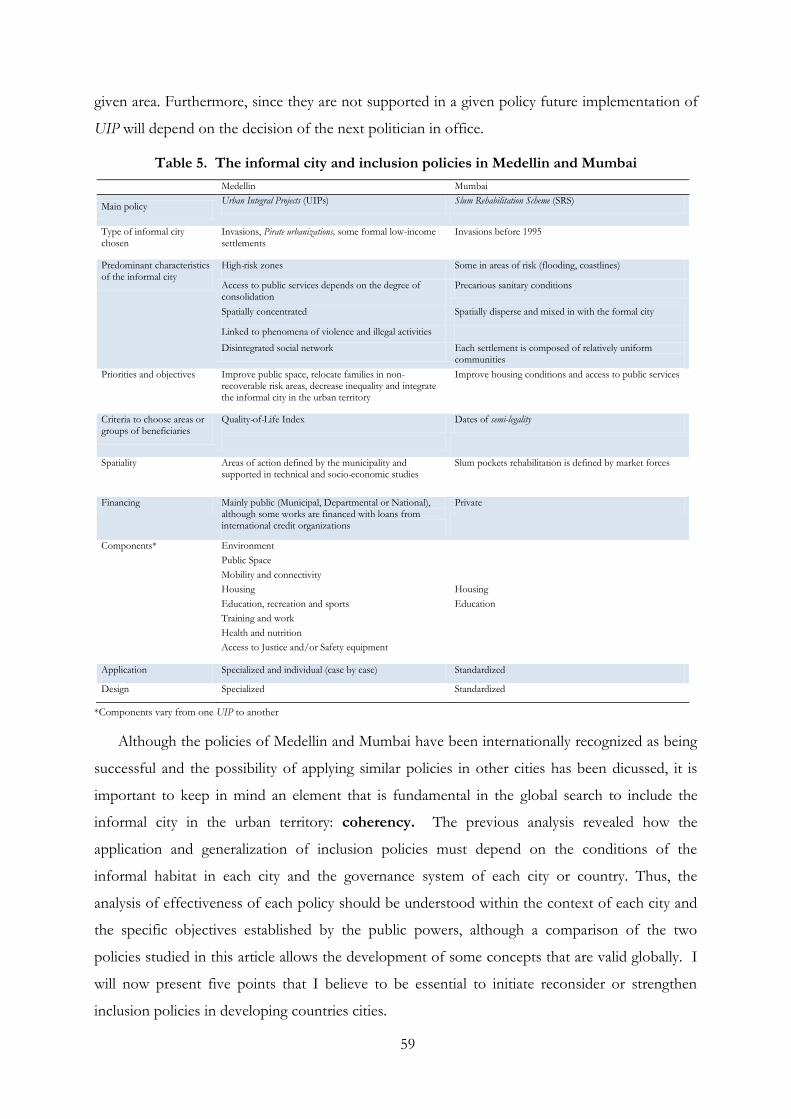
59
given area. Furthermore, since they are not supported in a given policy future implementation of
UIP will depend on the decision of the next politician in office.
Table 5. The informal city and inclusion policies in Medellin and Mumbai
*Components vary from one UIP to another
Although the policies of Medellin and Mumbai have been internationally recognized as being
successful and the possibility of applying similar policies in other cities has been dicussed, it is
important to keep in mind an element that is fundamental in the global search to include the
informal city in the urban territory: coherency. The previous analysis revealed how the
application and generalization of inclusion policies must depend on the conditions of the
informal habitat in each city and the governance system of each city or country. Thus, the
analysis of effectiveness of each policy should be understood within the context of each city and
the specific objectives established by the public powers, although a comparison of the two
policies studied in this article allows the development of some concepts that are valid globally. I
will now present five points that I believe to be essential to initiate reconsider or strengthen
inclusion policies in developing countries cities.
Medellin Mumbai
Main policy Urban Integral Projects (UIPs) Slum Rehabilitation Scheme (SRS)
Type of informal city chosen
Invasions, Pirate urbanizations, some formal low-income settlements
Invasions before 1995
Predominant characteristics of the informal city
High-risk zones Some in areas of risk (flooding, coastlines)
Access to public services depends on the degree of consolidation
Precarious sanitary conditions
Spatially concentrated Spatially disperse and mixed in with the formal city
Linked to phenomena of violence and illegal activities
Disintegrated social network Each settlement is composed of relatively uniform communities
Priorities and objectives Improve public space, relocate families in non-recoverable risk areas, decrease inequality and integrate the informal city in the urban territory
Improve housing conditions and access to public services
Criteria to choose areas or groups of beneficiaries
Quality-of-Life Index
Dates of semi-legality
Spatiality Areas of action defined by the municipality and supported in technical and socio-economic studies
Slum pockets rehabilitation is defined by market forces
Financing Mainly public (Municipal, Departmental or National), although some works are financed with loans from international credit organizations
Private
Components* Environment
Public Space
Mobility and connectivity
Housing Housing
Education, recreation and sports Education
Training and work
Health and nutrition
Access to Justice and/or Safety equipment
Application Specialized and individual (case by case) Standardized
Design Specialized Standardized
60
First, any inclusion policy must be preceded by a recognition and inventory of the
informal city in ALL its forms. As I have previously presented, in the case of Mumbai and
Medellin, there are a number of informal cities that range from pavement dwellers to pirate
urbanizations and each one possesses different priorities for action. Table 5 shows how informal
settlements that house the majority of the informal-city population in Medellin is characterized by
being in areas with steep slopes, at the periphery of the city, and are historically areas of ―no law‖
for which proper inclusion of these areas requires more than just a simple housing policy or
improving access to basic services.
For some authors and policy makers the recognition of the informal city can be regarded as a
policy itself since it gives a place to the informal city in the language of the city. This recognition
can range from a simple census of the informal city population to the demarcation of these
settlements in the urban map. For example, notification actions (in Mumbai) or urban regularization
(in Colombia) allow for informal settlements to be included in the city‘s official map. The latter
is sometimes fundamental to justify the state or the municipality‘s action in these areas. The
recognition of the informal city is a fundamental step for local authorities to act, even if their
actions do not lead to a true inclusion of the informal city.
Second, any inclusion policy should seek to use the current structure of the city as a
starting point or in some way build on what has been built. Medellin‘s authorities have taken
advantage of the concentration and segregation of its informal settlements to coordinate integral
policies in pre-defined areas. In the same way, Mumbai‘s municipality has managed to take
advantage of one of the causes of the existence and generalization of the informal city: low Floor
Space Indexes (FSIs) while using the co-existence of the informal city and the formal city as
foundation for cross-subsidizing schemes.
Third, any inclusion policy needs a clear definition of power structure and distribution,
and cities duties and responsibilities related to urban planning and housing. Comparing the
two cases of studies presented, it is possible to see how the federal organization of power in India
has led to the emergence of inclusion policies adapted to each city. On the contrary, in Colombia
inclusion actions and instruments have been previously determined by the central government
and cities adapt them to act locally. In both cases, a greater autonomy in urban planning has
allowed cities to design and implement policies that respond to local problems and incitations. In
the Colombian case, the strengthening of the urban-planning capability of cities during the past
15 years was essential for the establishment of local Land-Use Plans (Planes de Ordenamiento
Territorial, POT) in the city of Medellin and for the implementation of the current UIPs.
Furthermore, urban planning laws developed between 1989 and 1998 not only gave
61
municipalities responsibilities, but also provided them with instruments allowing them to shape
city‘s growth.
In the case of the UIPs, which are really a coordination of state actions in a specific area,
components such as education and transportation that are clearly defined by law as a
responsibility of the municipality have been carried out successfully, while components with
schizophrenic responsibilities -as in the case of housing- have presented a number of difficulties.
The recent creation of the Medellin Housing Institute (Instituto de Vivienda de Medellin,
ISVIMED) responds to the need to have a local-level housing policy that is consistent with the
circumstances of the city and adaptable to UIPs. A correct definition of powers and
responsibilities makes it easier to translate needs that are visible to local authorities, and would be
more difficult to identify by the national government, into inclusion policies.
Fourth, experience shows how any inclusion policy generates new fragmentations of the
informal habitat since it creates new subdivisions in the levels of informality. For example,
both in the case of the Moravia in Medellin as well as in the SRS policy in Mumbai, dates have
been established that define, who-from among the inhabitants of the informal city-has the right
to benefit from inclusion policies. The latter is clearly related to the so-called Right to the City,
subject that due to its extensions I have decided not to discuss in this article.
Finally, any policy that seeks total inclusion of the informal city in the urban territory must be
composed of two parts. The first seeks the harmonious inclusion of existing informal
settlements, according to its needs and priorities. The second seeks to avoid new exclusions
through the creation of parallel systems to access housing and basic urban services for the low-
income populations.
The previous points are -in my opinion- essential to transform cities of developing countries
into harmonious cities, but they are not sufficient. The cases of studies of Mumbai and Medellin
reveal that it takes considerable public will to promote these changes. If not, how can we explain
that other cities in India or Colombia-which have the same priorities and capabilities, have not
applied similar inclusion policies? This so-called political will might be in reality led by private
interests or collective concerns, which I have referred in this article as needs for action (Section 1).
In Mumbai, informal settlements have been seen as vote banks by many political parties, who
have made inclusion policies one more strategy to access or remain in power. In Medellin, the
expansion of violence from the so-called ―no law‖ areas into the rest of the city made these
sectors become priority areas for action.

62
63
Chapter 4
The informal rental housing market in Medellin: written versus oral contracts
Abstract In this article I evaluate, using hedonic prices, the risk premium associated to oral rental contracts when
compared to written rental contracts in informal settlements in the city of Medellin. Economic theory
suggests that households having oral rental arrangements have a higher risk of being evicted when
compared to households having written rental controls, who can more easily exercise their rights. I use a
household‘s survey carried out by the Mayor‘s office in the city of Medellin containing 10,373 households,
among which 3,372 are renters, and a qualitative survey carried out by the author. Results from hedonic
regressions suggest a difference of 21% in the rental value of identical housing units when passing from
oral to written contracts. The qualitative survey evidenced clear differences in household‘s perceived risk
of eviction, confirming the hypothesis of a ‗risk premium‘. Oral rental tenants reported having a higher
perceived risk of being evicted without a valid reasons and a higher risk of being expulsed before the
agreed duration of stay, when compared to written rental tenants. However, results also suggested that a
higher proportion of oral rental tenants had some relationship to the landlord. If related landlords
consider less risky to have oral contracts with relatives –given that a ‗social‘ contract already exists
between the two parts- the written contract dummy in the hedonic price equation might be capturing both
a ‗risk premium‘ as well as a ‗ relative premium effect‘. Therefore the risk prime associated with having
oral rental contracts is probably higher than the one measured using hedonic prices.
Résumé Cet article évalue, à partir des prix hédoniques, la prime de risque associée aux contrats de location oraux
comparé aux contrats de location écrits dans la ville de Medellin. La théorie économique suggère que les
ménages ayant un contrat oral ont un plus grand risque d‘être expulsées comparés aux ménages ayant un
contrat écrit qui peuvent plus facilement exercer leurs droits. J‘utilise un enquête effectué par le bureau de
la Mairie de la ville de Medellin portant sur 10,373 ménages parmi lesquels 3372 sont des locataires, et une
enquête qualitative réalisé par l‘auteur. Les résultats des régressions hédoniques suggèrent une différence
de 21% de la valeur locative des logements identiques entre un contrat oral à un contrat écrit. L‘enquête
qualitative montre des différences considérables dans le risque perçu par les ménages ayant différent type
de contrats de location, ce qui confirme l‘hypothèse d‘existence d‘une prime de risque. Les locataires ayant
un contrat oral ont déclaré avoir un plus grand sentiment de risque d‘être expulsés par rapport aux
locataires ayant un contrat écrit. Cependant, les résultats de l‘enquête qualitative ont également suggéré
qu‘une plus grande proportion de locataires ayant un contrat oral avait une certaine relation personnelle
(de parents, amicale) avec le propriétaire. Si les propriétaires considèrent moins risqué d‘avoir des contrats
oraux avec des personnes qui leur sont proches – étant donné qu‘un contrat ‗social‘ existe déjà entre les
deux parties, la variable muette dans l‘équation de prix hédoniques peut capturer la ‗prime de risque‘ ainsi
qu‘un effet de réduction de risque due aux contrats ‗sociaux‘ préexistants. Par conséquent, les risques
associés aux contrats de location oraux sont probablement encore plus élevés que ceux mesurés en
utilisant la fonction des prix hédoniques.
64
1. Introduction
In the past two decades many local governments as well as other authorities at different levels
of governance have recognized the need to solve the ‗slum problem‘ and implement a number of
inclusive slum policies. Moving away from eviction and laissez-faire policies, titling and slum
upgrading policies have taken the lead. The latter is both due to the recognition of the ‗slum
problem‘ at a national and international level as the results of political strategic behavior of policy
makers who acknowledge potential votes hidden in slum pockets. Generally slum or informal
housing policies are targeted both at diminishing the proportion of slums in a given city as well as
improving household‘s living conditions. However, the measurement of the welfare effects of
slum policies is not always easy and some slum policies have proven to have serious negative
welfare effects. For example, two studies carried out in Mumbai show that relocating slum
dwellers to distant areas might have serious consequences on their incomes and increase
considerably transportation costs (Vaquier, 2010; Takeuchi et al., 2008).
In some cases the use of hedonic regressions techniques or discrete location choice models
has been used to identify how household‘s value housing characteristics such as tenure and to
determine welfare effects of different slum policies (Friedman et al. 1988; Aiga and Umenai, 2002;
Takeuchi et al. 2008). Hedonic price functions, widely used in environmental economics to
uncover the market price of environmental goods, were first used in informal housing studies by
Jimenez (1984) and by Friedman et al. (1988) to determine how urban household‘s valued tenure
security in the Philippines. By comparing informal owners and renters to formal owners and
renters, they were able to measure the risk premium associated with informality. Friedman et al.
(1988) found a risk premium of 11% for renters and 23% for owners and confirmed the idea that
65
risks associated with living in informal settlements were not the same for owners and renters1.
The differences in risk premiums for different tenure arrangements was explained in the
following way: while renters had to support the cost of moving when evicted, owners also had to
face the loss of physical capital made in form of housing investments. A more recent study, by
Kapoor and Le Blanc (2008), found that once observed characteristics of the dwellings where
accounted for, the prime risk associated with informality in the city of Pune (India) was 35%.
Lanjouw and Levy (2002), who used a different methodology, in which households were asked to
estimate the value of their homes with and without titles, find a 23.4% difference in value
between titled houses and non-titled houses in Ecuador.
Payne (2001) argues that the conceptual binary division of the city between the informal and
the formal housing sector is generally incomplete since there is a very diverse range and
complexity of tenure systems in developing countries. For instance, in many cities, the informal
sector can be home to both pavement dwellers - who live in the open and have no housing
structures – and squatter ‗owners‘ – who, while having little or no legal documents to prove their
ownership, usually have more or less consolidated structures and a certain access to basic
services. Figure 1 presents a possible typology of tenure categories existing in developing
countries‘ cities and their related tenure security. The purpose of this article is to compare the
two shaded categories in Figure 1: squatter tenants with written contracts versus squatter tenants
with oral contracts. The initial hypothesis is that, in the same way that squatter houses are
assumed to be less valuable than identical formal houses, households‘ having oral rental
arrangements are expected to pay lower rents when compared to household‘s having written
rental arrangements. Although in legal terms, both informal written and oral rental contracts have
no value, written contracts can have higher social value and squatter owners (renters) who make
written rental agreements might be more willing to maintain their ‗promises‘ than those who
make oral rental agreements. In fact a number of recent studies in experimental economics show
how, when individuals sign and agree to follow a certain behavior prior to the realization of a
given event, they are more likely to keep their ‗promises‘ (Charnes and Dufwenberg 2006,
Vanberg 2008, Jacquemet 2009). Vanberg (2008) results suggest that people have a preference for
‗promise‘ keeping and a ‗promise‘ creates a contractual obligation toward the person to whom it
is made. However, no empirical or experimental analysis has been done so far to evaluate
‗promise‘ keeping comparing written to oral agreements.
1 Households in informal settlements generally consider themselves to be the owners of their property even when the land in which they are located belongs to a third party.
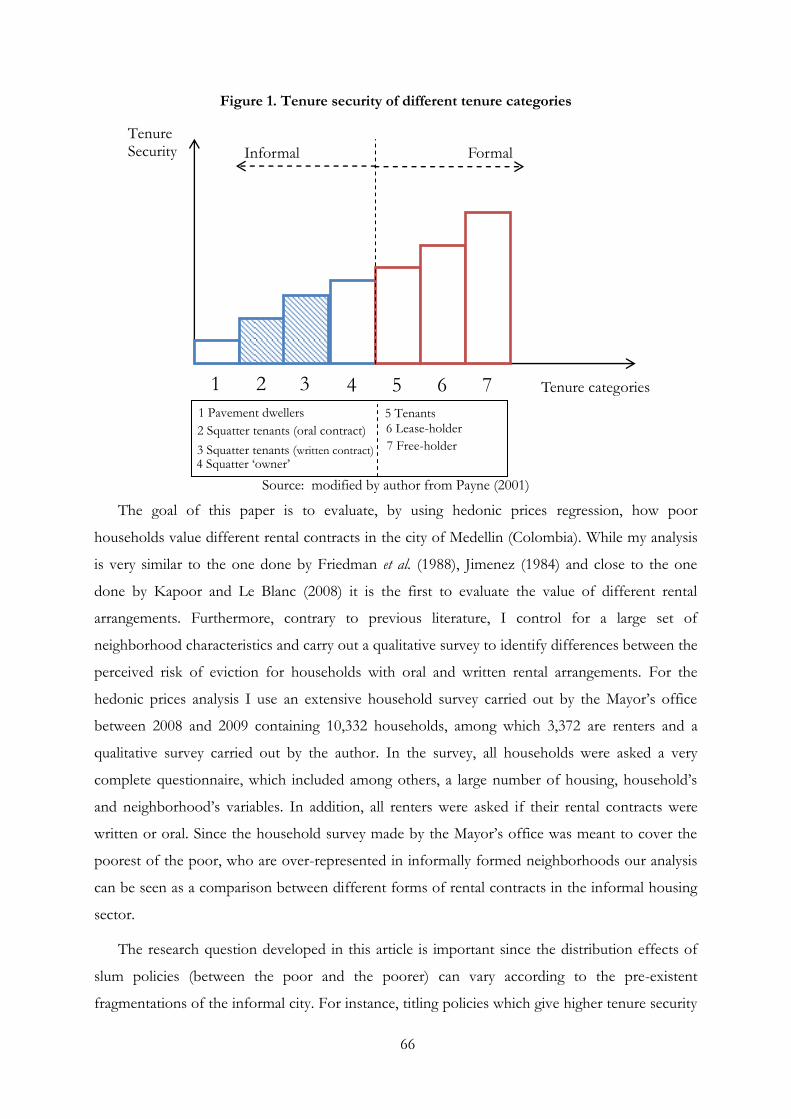
66
Figure 1. Tenure security of different tenure categories
Source: modified by author from Payne (2001)
The goal of this paper is to evaluate, by using hedonic prices regression, how poor
households value different rental contracts in the city of Medellin (Colombia). While my analysis
is very similar to the one done by Friedman et al. (1988), Jimenez (1984) and close to the one
done by Kapoor and Le Blanc (2008) it is the first to evaluate the value of different rental
arrangements. Furthermore, contrary to previous literature, I control for a large set of
neighborhood characteristics and carry out a qualitative survey to identify differences between the
perceived risk of eviction for households with oral and written rental arrangements. For the
hedonic prices analysis I use an extensive household survey carried out by the Mayor‘s office
between 2008 and 2009 containing 10,332 households, among which 3,372 are renters and a
qualitative survey carried out by the author. In the survey, all households were asked a very
complete questionnaire, which included among others, a large number of housing, household‘s
and neighborhood‘s variables. In addition, all renters were asked if their rental contracts were
written or oral. Since the household survey made by the Mayor‘s office was meant to cover the
poorest of the poor, who are over-represented in informally formed neighborhoods our analysis
can be seen as a comparison between different forms of rental contracts in the informal housing
sector.
The research question developed in this article is important since the distribution effects of
slum policies (between the poor and the poorer) can vary according to the pre-existent
fragmentations of the informal city. For instance, titling policies which give higher tenure security
Tenure Security
1 2 3 4 5 6 7
Informal Formal
Tenure categories
1 Pavement dwellers 2 Squatter tenants (oral contract)
3 Squatter tenants (written contract) 4 Squatter ‗owner‘
5 Tenants 6 Lease-holder 7 Free-holder
67
to owners might have monetary consequences for tenants, and these consequences might be
different according to the type of rental contract they have. The purpose of this paper is, on the
one hand, to extend existing literature on the risks associated to different formal and informal
tenure systems in developing countries and, on the other hand, to provide evidence that could
help to have a better understanding of the different mechanisms available for the poor that
provide informal assurances based on social contracts that have no legal value. Findings from the
hedonic prices analysis suggest that informal housing tenants value differently written and oral
contracts and that the difference in value might be associated to a premium risk of having less
secured rental social contract.
This article is organized as follows. Section 2 briefly describes the formation and evolution of
the informal housing market in the city of Medellin. Section 3 presents the data and methodology
used for the empirical analysis. Section 4 shows results from the hedonic price analysis and the
qualitative study and Section 5 outlines the conclusions.
2. Medellin: violence, poverty and spatial inequalities
The city of Medellin is located in the Aburra Valley in the middle of the Andes Mountains.
With a population of 2.4 million inside the city limits and 3.5 million when considering the
metropolitan area, it is the second largest city in Colombia (Alcaldía de Medellin, 2006a). Medellin
is the capital of the Department of Antioquia which produces around 15% of Colombia‘s GDP
(Torres Tovar, 2009). The city of Medellin has been known nationally for its industrial
development and is home to many of the country‘s most important industries; however, it has
also been recognized as one of the most violent cities in the world.
A series of informal settlements censuses have been carried out in the city. In 1992, 70
informal settlements were identified composed of 37,000 housing units housing around 185,000
persons. In 1994, the planning departments registered 87 informal settlements with
approximately 202,500 inhabitants. By the end of 2002 the total number of informal settlements
raised to 104 with around 350,000 inhabitants, the equivalent of 18% of the total city population
(Torres Tovar, 2010). Informal settlements in Medellin, unlike other developing cities like
Mumbai (India), are spatially concentrated and most of them are located at the periphery of the
city. Almost all of the informal settlements have access to basic services and have achieved a
certain degree of consolidation. However, given that a considerable proportion of the population
living in these settlements were forced to migrate to the city due to violence2, the levels of
unemployment are very high: 59% of the household‘s earn less than the minimum legal salary,
2 In Colombia this phenomenon is called forced displacement (desplazamiento forzado)
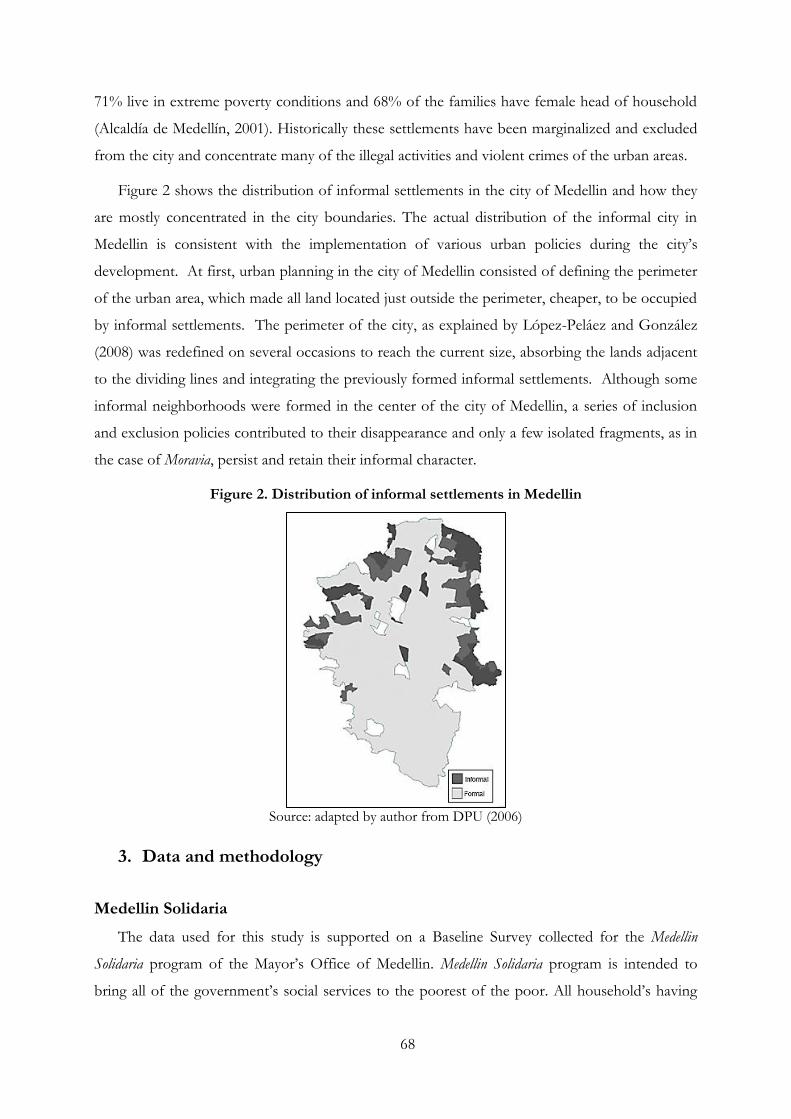
68
71% live in extreme poverty conditions and 68% of the families have female head of household
(Alcaldía de Medellín, 2001). Historically these settlements have been marginalized and excluded
from the city and concentrate many of the illegal activities and violent crimes of the urban areas.
Figure 2 shows the distribution of informal settlements in the city of Medellin and how they
are mostly concentrated in the city boundaries. The actual distribution of the informal city in
Medellin is consistent with the implementation of various urban policies during the city‘s
development. At first, urban planning in the city of Medellin consisted of defining the perimeter
of the urban area, which made all land located just outside the perimeter, cheaper, to be occupied
by informal settlements. The perimeter of the city, as explained by López-Peláez and González
(2008) was redefined on several occasions to reach the current size, absorbing the lands adjacent
to the dividing lines and integrating the previously formed informal settlements. Although some
informal neighborhoods were formed in the center of the city of Medellin, a series of inclusion
and exclusion policies contributed to their disappearance and only a few isolated fragments, as in
the case of Moravia, persist and retain their informal character.
Figure 2. Distribution of informal settlements in Medellin
Source: adapted by author from DPU (2006)
3. Data and methodology
Medellin Solidaria
The data used for this study is supported on a Baseline Survey collected for the Medellin
Solidaria program of the Mayor‘s Office of Medellin. Medellin Solidaria program is intended to
bring all of the government‘s social services to the poorest of the poor. All household‘s having
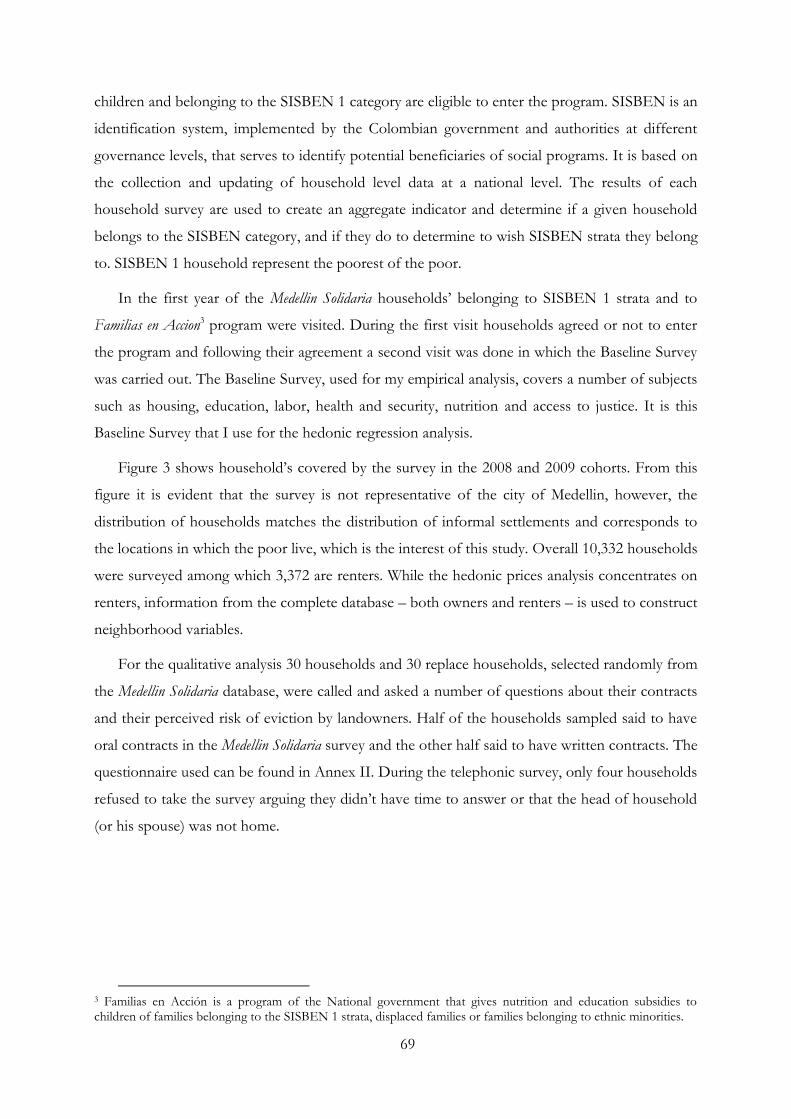
69
children and belonging to the SISBEN 1 category are eligible to enter the program. SISBEN is an
identification system, implemented by the Colombian government and authorities at different
governance levels, that serves to identify potential beneficiaries of social programs. It is based on
the collection and updating of household level data at a national level. The results of each
household survey are used to create an aggregate indicator and determine if a given household
belongs to the SISBEN category, and if they do to determine to wish SISBEN strata they belong
to. SISBEN 1 household represent the poorest of the poor.
In the first year of the Medellin Solidaria households‘ belonging to SISBEN 1 strata and to
Familias en Accion3 program were visited. During the first visit households agreed or not to enter
the program and following their agreement a second visit was done in which the Baseline Survey
was carried out. The Baseline Survey, used for my empirical analysis, covers a number of subjects
such as housing, education, labor, health and security, nutrition and access to justice. It is this
Baseline Survey that I use for the hedonic regression analysis.
Figure 3 shows household‘s covered by the survey in the 2008 and 2009 cohorts. From this
figure it is evident that the survey is not representative of the city of Medellin, however, the
distribution of households matches the distribution of informal settlements and corresponds to
the locations in which the poor live, which is the interest of this study. Overall 10,332 households
were surveyed among which 3,372 are renters. While the hedonic prices analysis concentrates on
renters, information from the complete database – both owners and renters – is used to construct
neighborhood variables.
For the qualitative analysis 30 households and 30 replace households, selected randomly from
the Medellin Solidaria database, were called and asked a number of questions about their contracts
and their perceived risk of eviction by landowners. Half of the households sampled said to have
oral contracts in the Medellin Solidaria survey and the other half said to have written contracts. The
questionnaire used can be found in Annex II. During the telephonic survey, only four households
refused to take the survey arguing they didn‘t have time to answer or that the head of household
(or his spouse) was not home.
3 Familias en Acción is a program of the National government that gives nutrition and education subsidies to children of families belonging to the SISBEN 1 strata, displaced families or families belonging to ethnic minorities.
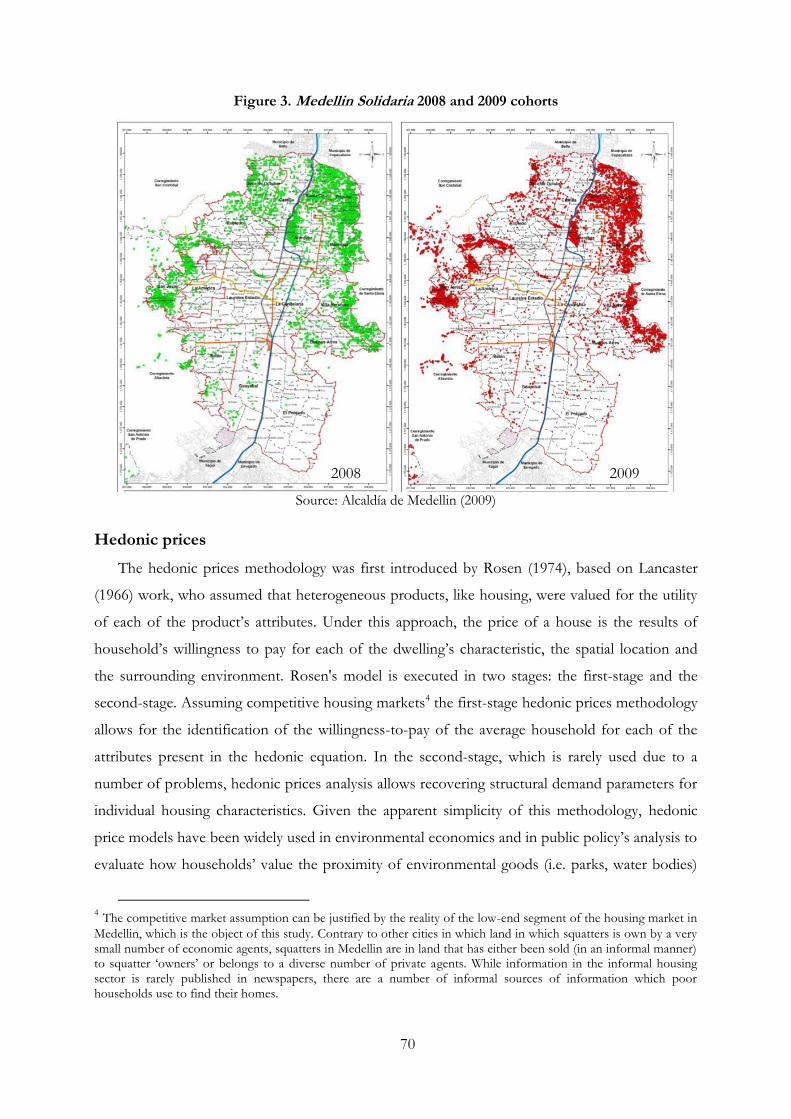
70
Figure 3. Medellin Solidaria 2008 and 2009 cohorts
Source: Alcaldía de Medellin (2009)
Hedonic prices
The hedonic prices methodology was first introduced by Rosen (1974), based on Lancaster
(1966) work, who assumed that heterogeneous products, like housing, were valued for the utility
of each of the product‘s attributes. Under this approach, the price of a house is the results of
household‘s willingness to pay for each of the dwelling‘s characteristic, the spatial location and
the surrounding environment. Rosen's model is executed in two stages: the first-stage and the
second-stage. Assuming competitive housing markets4 the first-stage hedonic prices methodology
allows for the identification of the willingness-to-pay of the average household for each of the
attributes present in the hedonic equation. In the second-stage, which is rarely used due to a
number of problems, hedonic prices analysis allows recovering structural demand parameters for
individual housing characteristics. Given the apparent simplicity of this methodology, hedonic
price models have been widely used in environmental economics and in public policy‘s analysis to
evaluate how households‘ value the proximity of environmental goods (i.e. parks, water bodies)
4 The competitive market assumption can be justified by the reality of the low-end segment of the housing market in
Medellin, which is the object of this study. Contrary to other cities in which land in which squatters is own by a very small number of economic agents, squatters in Medellin are in land that has either been sold (in an informal manner) to squatter ‗owners‘ or belongs to a diverse number of private agents. While information in the informal housing sector is rarely published in newspapers, there are a number of informal sources of information which poor households use to find their homes.
2008 2009
71
or urban interventions such as new metro-lines (Garrod, G.D. et al. 1992; Netusil, 2005;
Ihlanfeldt 2007; Gibbons, S. and Machin, S. 2008).
The use of hedonic prices for empirical research, has however, been criticized due to a
number of limitations inherent to hedonic models that are rarely taken into account by
researchers. One of the most common critiques is that, by defining a specific functional form,
researchers restrain demand to a specific demand form. For instance, in reality households might
be willing to pay more for one more room when they have 2 rooms than when they have 4
rooms. In the same way, families having children might assign more value to a marginal increase
in space (or rooms) than those who don‘t have children. One of the possibilities for not
restraining the hedonic analysis to a specific functional form and allowing preferences to be
flexible is to use non-parametric distributions. Recent work done by Bajari and Kahn (2005) and
Lall and Lundberg (2008) uses non-parametric approaches to recover structural demand
parameters and explain tastes as functions of households‘ characteristics.
For my analysis I use the standard model presented in equation [1] in which the rental price
and number of are in log while the rest of the variables are not transformed.
Similar models have been used in literature by Netusil (2005), Ihlanfeldt (2007) and Guttery
(2002). A Box-Cox transformation as well as a log-linear specification, in which the
variable is linear but is still in log, was also used with similar results. A non-
parametric approach using Generalized Additive Models (GAMs) was also used with very similar
results. Variables like the distance to city center and the number of rooms proved to have
significant gains when using GAMs when compared to linear models, showing that preferences
for this attributes are not linear. However, since the variable of interest is binary
and the hedonic price analysis considered in this paper is not intended to recover structural
demand parameters (second-stage), for simplification purposes I rely on the standard model
specification ([1]) for the rest of the analysis.
[1]
In [1] is a vector of housing characteristics such as the predominant material of walls
and the type of structure. is a vector of neighborhood characteristics that account for the
socio-economic characteristics of the neighborhood in which the house is located as well as other
elements that might have consequences on the rental value. is a dummy variable
equal to 1 if the household living in the dwelling has an written rental arrangement and 0
otherwise. In order to avoid problems arising from multicollinearity, which occurs when
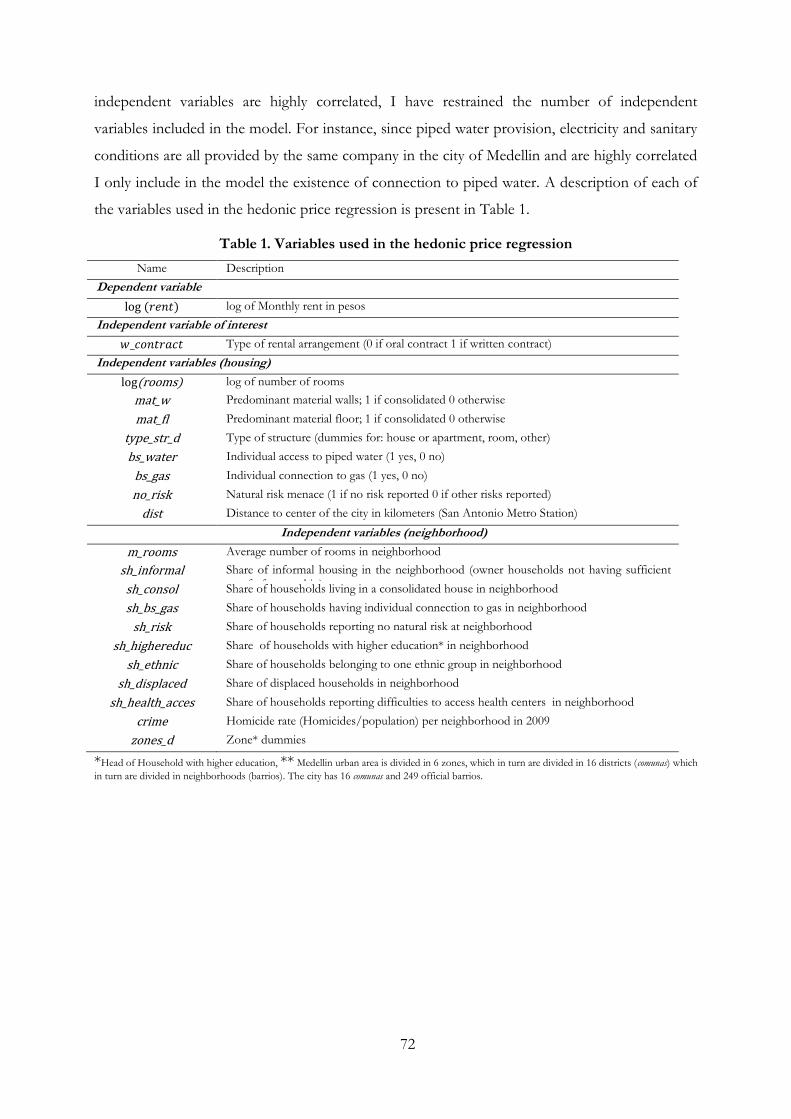
72
independent variables are highly correlated, I have restrained the number of independent
variables included in the model. For instance, since piped water provision, electricity and sanitary
conditions are all provided by the same company in the city of Medellin and are highly correlated
I only include in the model the existence of connection to piped water. A description of each of
the variables used in the hedonic price regression is present in Table 1.
Table 1. Variables used in the hedonic price regression
Name Description
Dependent variable
log of Monthly rent in pesos
Independent variable of interest
Type of rental arrangement (0 if oral contract 1 if written contract)
Independent variables (housing)
log(rooms) log of number of rooms
mat_w Predominant material walls; 1 if consolidated 0 otherwise
mat_fl Predominant material floor; 1 if consolidated 0 otherwise
type_str_d Type of structure (dummies for: house or apartment, room, other)
bs_water Individual access to piped water (1 yes, 0 no)
bs_gas Individual connection to gas (1 yes, 0 no)
no_risk Natural risk menace (1 if no risk reported 0 if other risks reported)
dist Distance to center of the city in kilometers (San Antonio Metro Station)
Independent variables (neighborhood)
m_rooms Average number of rooms in neighborhood
sh_informal Share of informal housing in the neighborhood (owner households not having sufficient proof of ownership) sh_consol Share of households living in a consolidated house in neighborhood
sh_bs_gas Share of households having individual connection to gas in neighborhood
sh_risk Share of households reporting no natural risk at neighborhood
sh_highereduc Share of households with higher education* in neighborhood
sh_ethnic Share of households belonging to one ethnic group in neighborhood
sh_displaced Share of displaced households in neighborhood
sh_health_acces Share of households reporting difficulties to access health centers in neighborhood
crime Homicide rate (Homicides/population) per neighborhood in 2009
zones_d Zone* dummies
*Head of Household with higher education, ** Medellin urban area is divided in 6 zones, which in turn are divided in 16 districts (comunas) which
in turn are divided in neighborhoods (barrios). The city has 16 comunas and 249 official barrios.
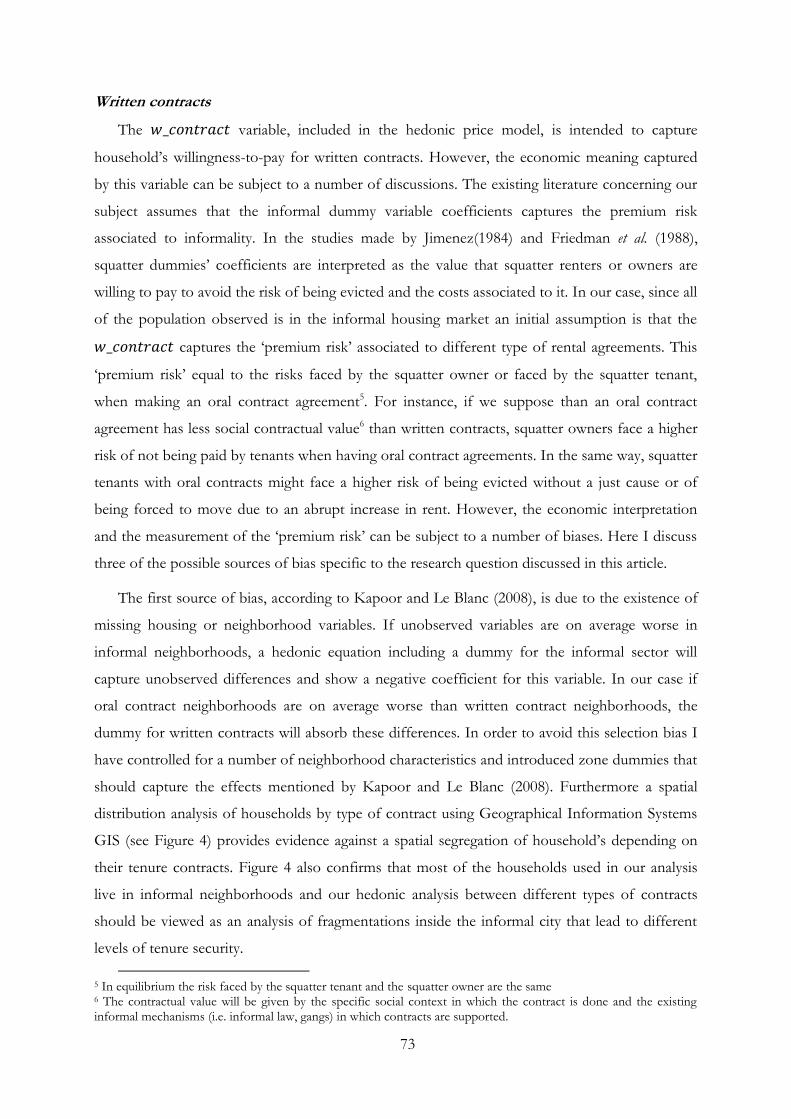
73
Written contracts
The variable, included in the hedonic price model, is intended to capture
household‘s willingness-to-pay for written contracts. However, the economic meaning captured
by this variable can be subject to a number of discussions. The existing literature concerning our
subject assumes that the informal dummy variable coefficients captures the premium risk
associated to informality. In the studies made by Jimenez(1984) and Friedman et al. (1988),
squatter dummies‘ coefficients are interpreted as the value that squatter renters or owners are
willing to pay to avoid the risk of being evicted and the costs associated to it. In our case, since all
of the population observed is in the informal housing market an initial assumption is that the
captures the ‗premium risk‘ associated to different type of rental agreements. This
‗premium risk‘ equal to the risks faced by the squatter owner or faced by the squatter tenant,
when making an oral contract agreement5. For instance, if we suppose than an oral contract
agreement has less social contractual value6 than written contracts, squatter owners face a higher
risk of not being paid by tenants when having oral contract agreements. In the same way, squatter
tenants with oral contracts might face a higher risk of being evicted without a just cause or of
being forced to move due to an abrupt increase in rent. However, the economic interpretation
and the measurement of the ‗premium risk‘ can be subject to a number of biases. Here I discuss
three of the possible sources of bias specific to the research question discussed in this article.
The first source of bias, according to Kapoor and Le Blanc (2008), is due to the existence of
missing housing or neighborhood variables. If unobserved variables are on average worse in
informal neighborhoods, a hedonic equation including a dummy for the informal sector will
capture unobserved differences and show a negative coefficient for this variable. In our case if
oral contract neighborhoods are on average worse than written contract neighborhoods, the
dummy for written contracts will absorb these differences. In order to avoid this selection bias I
have controlled for a number of neighborhood characteristics and introduced zone dummies that
should capture the effects mentioned by Kapoor and Le Blanc (2008). Furthermore a spatial
distribution analysis of households by type of contract using Geographical Information Systems
GIS (see Figure 4) provides evidence against a spatial segregation of household‘s depending on
their tenure contracts. Figure 4 also confirms that most of the households used in our analysis
live in informal neighborhoods and our hedonic analysis between different types of contracts
should be viewed as an analysis of fragmentations inside the informal city that lead to different
levels of tenure security.
5 In equilibrium the risk faced by the squatter tenant and the squatter owner are the same 6 The contractual value will be given by the specific social context in which the contract is done and the existing informal mechanisms (i.e. informal law, gangs) in which contracts are supported.
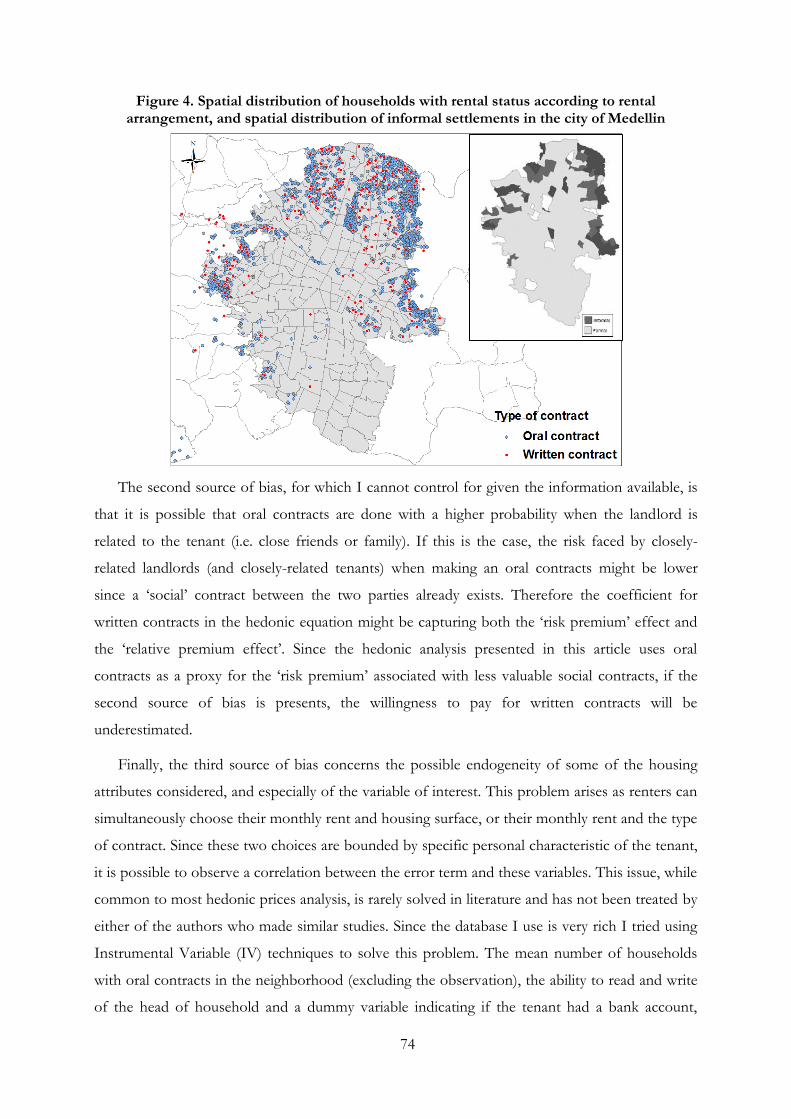
74
Figure 4. Spatial distribution of households with rental status according to rental arrangement, and spatial distribution of informal settlements in the city of Medellin
The second source of bias, for which I cannot control for given the information available, is
that it is possible that oral contracts are done with a higher probability when the landlord is
related to the tenant (i.e. close friends or family). If this is the case, the risk faced by closely-
related landlords (and closely-related tenants) when making an oral contracts might be lower
since a ‗social‘ contract between the two parties already exists. Therefore the coefficient for
written contracts in the hedonic equation might be capturing both the ‗risk premium‘ effect and
the ‗relative premium effect‘. Since the hedonic analysis presented in this article uses oral
contracts as a proxy for the ‗risk premium‘ associated with less valuable social contracts, if the
second source of bias is presents, the willingness to pay for written contracts will be
underestimated.
Finally, the third source of bias concerns the possible endogeneity of some of the housing
attributes considered, and especially of the variable of interest. This problem arises as renters can
simultaneously choose their monthly rent and housing surface, or their monthly rent and the type
of contract. Since these two choices are bounded by specific personal characteristic of the tenant,
it is possible to observe a correlation between the error term and these variables. This issue, while
common to most hedonic prices analysis, is rarely solved in literature and has not been treated by
either of the authors who made similar studies. Since the database I use is very rich I tried using
Instrumental Variable (IV) techniques to solve this problem. The mean number of households
with oral contracts in the neighborhood (excluding the observation), the ability to read and write
of the head of household and a dummy variable indicating if the tenant had a bank account,
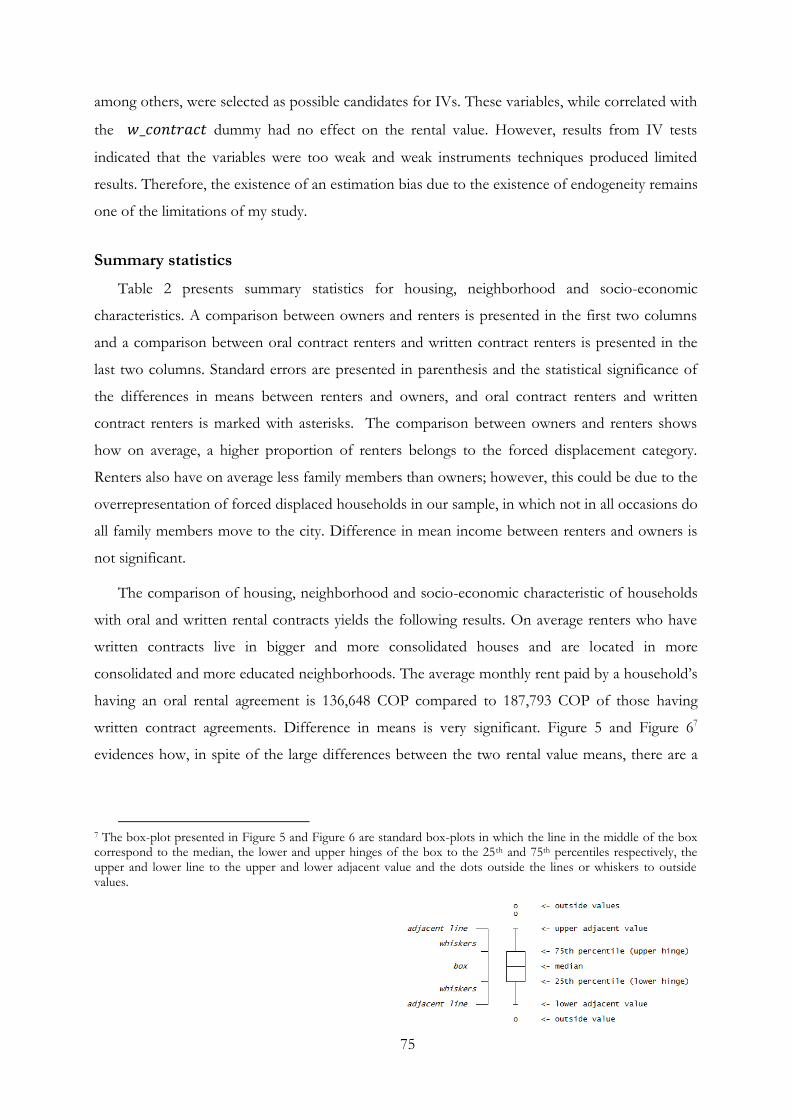
75
among others, were selected as possible candidates for IVs. These variables, while correlated with
the dummy had no effect on the rental value. However, results from IV tests
indicated that the variables were too weak and weak instruments techniques produced limited
results. Therefore, the existence of an estimation bias due to the existence of endogeneity remains
one of the limitations of my study.
Summary statistics
Table 2 presents summary statistics for housing, neighborhood and socio-economic
characteristics. A comparison between owners and renters is presented in the first two columns
and a comparison between oral contract renters and written contract renters is presented in the
last two columns. Standard errors are presented in parenthesis and the statistical significance of
the differences in means between renters and owners, and oral contract renters and written
contract renters is marked with asterisks. The comparison between owners and renters shows
how on average, a higher proportion of renters belongs to the forced displacement category.
Renters also have on average less family members than owners; however, this could be due to the
overrepresentation of forced displaced households in our sample, in which not in all occasions do
all family members move to the city. Difference in mean income between renters and owners is
not significant.
The comparison of housing, neighborhood and socio-economic characteristic of households
with oral and written rental contracts yields the following results. On average renters who have
written contracts live in bigger and more consolidated houses and are located in more
consolidated and more educated neighborhoods. The average monthly rent paid by a household‘s
having an oral rental agreement is 136,648 COP compared to 187,793 COP of those having
written contract agreements. Difference in means is very significant. Figure 5 and Figure 67
evidences how, in spite of the large differences between the two rental value means, there are a
7 The box-plot presented in Figure 5 and Figure 6 are standard box-plots in which the line in the middle of the box correspond to the median, the lower and upper hinges of the box to the 25th and 75th percentiles respectively, the upper and lower line to the upper and lower adjacent value and the dots outside the lines or whiskers to outside values.
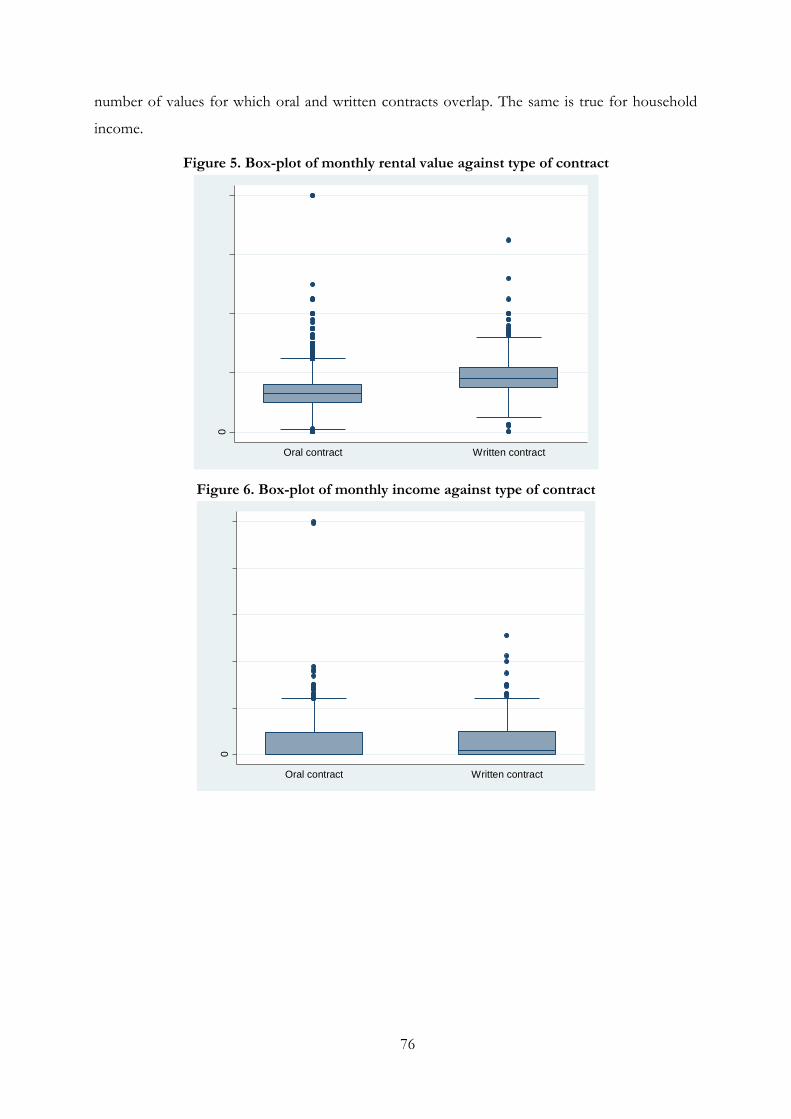
76
number of values for which oral and written contracts overlap. The same is true for household
income.
Figure 5. Box-plot of monthly rental value against type of contract
Figure 6. Box-plot of monthly income against type of contract
0
20
00
00
40
00
00
60
00
00
80
00
00
Mon
thly
ren
t in
peso
s
Oral contract Written contract
0
1.0
e+
06
2.0
e+
06
3.0
e+
06
4.0
e+
06
5.0
e+
06
Mon
thly
in
com
e in p
eso
s
Oral contract Written contract
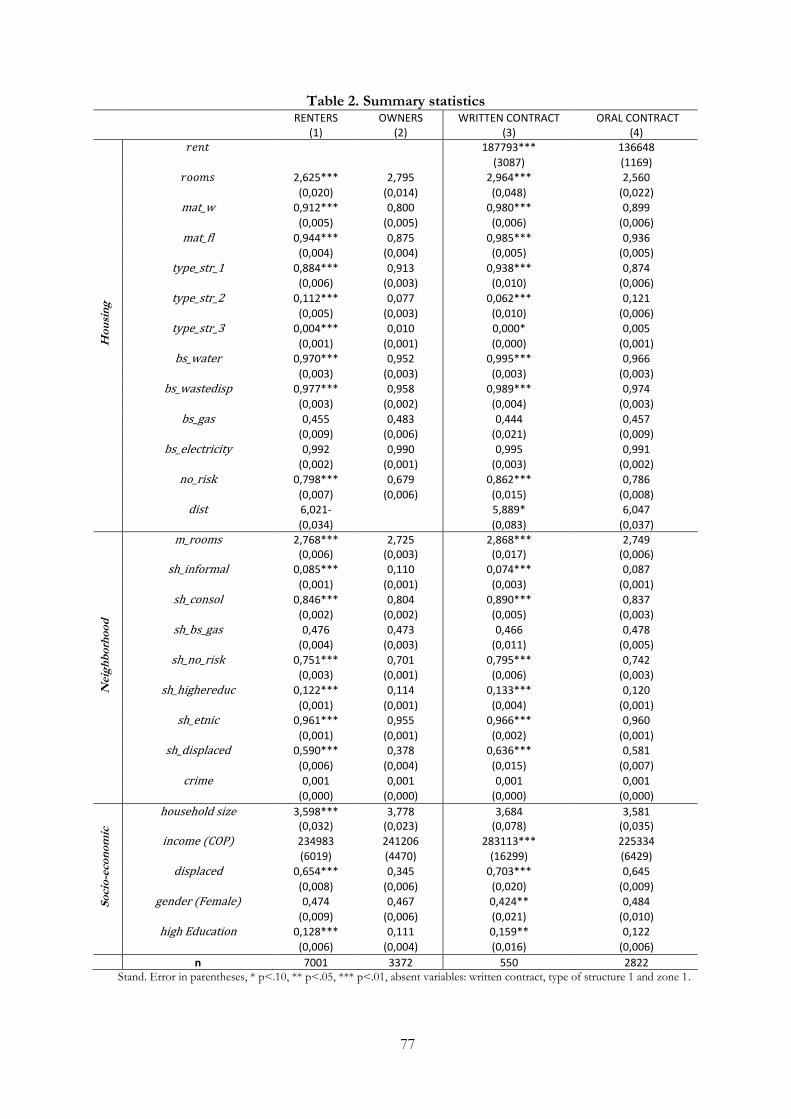
77
Table 2. Summary statistics RENTERS
(1) OWNERS
(2) WRITTEN CONTRACT
(3) ORAL CONTRACT
(4)
Ho
usi
ng
187793*** 136648
(3087) (1169)
2,625*** 2,795 2,964*** 2,560
(0,020) (0,014) (0,048) (0,022) mat_w 0,912*** 0,800 0,980*** 0,899
(0,005) (0,005) (0,006) (0,006)
mat_fl 0,944*** 0,875 0,985*** 0,936
(0,004) (0,004) (0,005) (0,005)
type_str_1 0,884*** 0,913 0,938*** 0,874
(0,006) (0,003) (0,010) (0,006)
type_str_2 0,112*** 0,077 0,062*** 0,121
(0,005) (0,003) (0,010) (0,006) type_str_3 0,004*** 0,010 0,000* 0,005
(0,001) (0,001) (0,000) (0,001) bs_water 0,970*** 0,952 0,995*** 0,966
(0,003) (0,003) (0,003) (0,003) bs_wastedisp 0,977*** 0,958 0,989*** 0,974
(0,003) (0,002) (0,004) (0,003)
bs_gas 0,455 0,483 0,444 0,457
(0,009) (0,006) (0,021) (0,009)
bs_electricity 0,992 0,990 0,995 0,991
(0,002) (0,001) (0,003) (0,002)
no_risk 0,798*** 0,679 0,862*** 0,786
(0,007) (0,006) (0,015) (0,008) dist 6,021- 5,889* 6,047
(0,034) (0,083) (0,037)
Nei
gh
bo
rho
od
m_rooms 2,768*** 2,725 2,868*** 2,749 (0,006) (0,003) (0,017) (0,006)
sh_informal 0,085*** 0,110 0,074*** 0,087
(0,001) (0,001) (0,003) (0,001)
sh_consol 0,846*** 0,804 0,890*** 0,837
(0,002) (0,002) (0,005) (0,003)
sh_bs_gas 0,476 0,473 0,466 0,478
(0,004) (0,003) (0,011) (0,005)
sh_no_risk 0,751*** 0,701 0,795*** 0,742
(0,003) (0,001) (0,006) (0,003)
sh_highereduc 0,122*** 0,114 0,133*** 0,120
(0,001) (0,001) (0,004) (0,001) sh_etnic 0,961*** 0,955 0,966*** 0,960
(0,001) (0,001) (0,002) (0,001) sh_displaced 0,590*** 0,378 0,636*** 0,581
(0,006) (0,004) (0,015) (0,007)
crime 0,001 0,001 0,001 0,001
(0,000) (0,000) (0,000) (0,000)
So
cio
-eco
no
mic
household size
3,598*** 3,778 3,684 3,581 (0,032) (0,023) (0,078) (0,035)
income (COP) 234983 241206 283113*** 225334 (6019) (4470) (16299) (6429)
displaced 0,654*** 0,345 0,703*** 0,645
(0,008) (0,006) (0,020) (0,009) gender (Female) 0,474 0,467 0,424** 0,484
(0,009) (0,006) (0,021) (0,010) high Education 0,128*** 0,111 0,159** 0,122
(0,006) (0,004) (0,016) (0,006)
n 7001 3372 550 2822 Stand. Error in parentheses, * p<.10, ** p<.05, *** p<.01, absent variables: written contract, type of structure 1 and zone 1.
78
4. Results
Hedonic prices
Results from the two hedonic models used, with and without neighborhood controls, are
presented in Table 3. Robust standard errors are presented in parenthesis and a plot containing
leverage and normalized square residuals can be found in Annex I. In both of the models all of
the coefficients have the expected signs. For housing attributes, I find that bigger houses who
have floors and walls made of consolidated materials have higher rents that smaller and less
consolidated households. An increase of distance to the city center, measured by the distance, in
kilometers, of each dwelling to the San Antonio Metro station, diminishes rental value. The
absence of reported natural risk is found to have a positive and significant effect on rent. On the
contrary access to piped water is found to be not significant; however, this could be due to the
generalization of water provision in the city8. Individual connection to the gas network was
initially found to have a negative but not significant effect – in the model without neighborhood
variables – and then found to have a positive and significant effect – in the model with
neighborhood variables. The latter might be due to the correlation between the individual access
to the gas network variable and the share of access to the gas network in the neighborhood.
For neighborhood attributes I find some of the coefficients to be non-significantly
different from zero. The share of informal houses in the neighborhood, the share of consolidated
houses and the crime rate seem to have no effect on rental value. Furthermore, a positive
discrimination for ethnic neighborhoods and towards forced displaced neighborhoods was
found. However, the latter might be due to the high proportion of displaced households in the
database which might have preferences to live in neighborhoods overrepresented by displaced
households. Households also value living in neighborhood with low incidence of natural risks,
with a higher share of educated households and good access to health care facilities.
In both of the regressions the coefficient for written contracts is positive and very significant.
The latter is expected to capture the premium risk associated to informal rental contracts of the
average households. In terms of magnitude the coefficient for written contract is considerably
smaller when I control for neighborhood characteristics. While in the first model, the rental value
of a house when passing from oral to written rental contract increases by 26.56%, in the second
model, the estimated increase in rental value is 18.23%. The latter confirms Kapoor and Le Blanc
(2008) expressed concerns about unobserved characteristics that differ between informal and
8 In Colombia the constitution defines that all household have the right to have access to water and services even when living informal settlements.
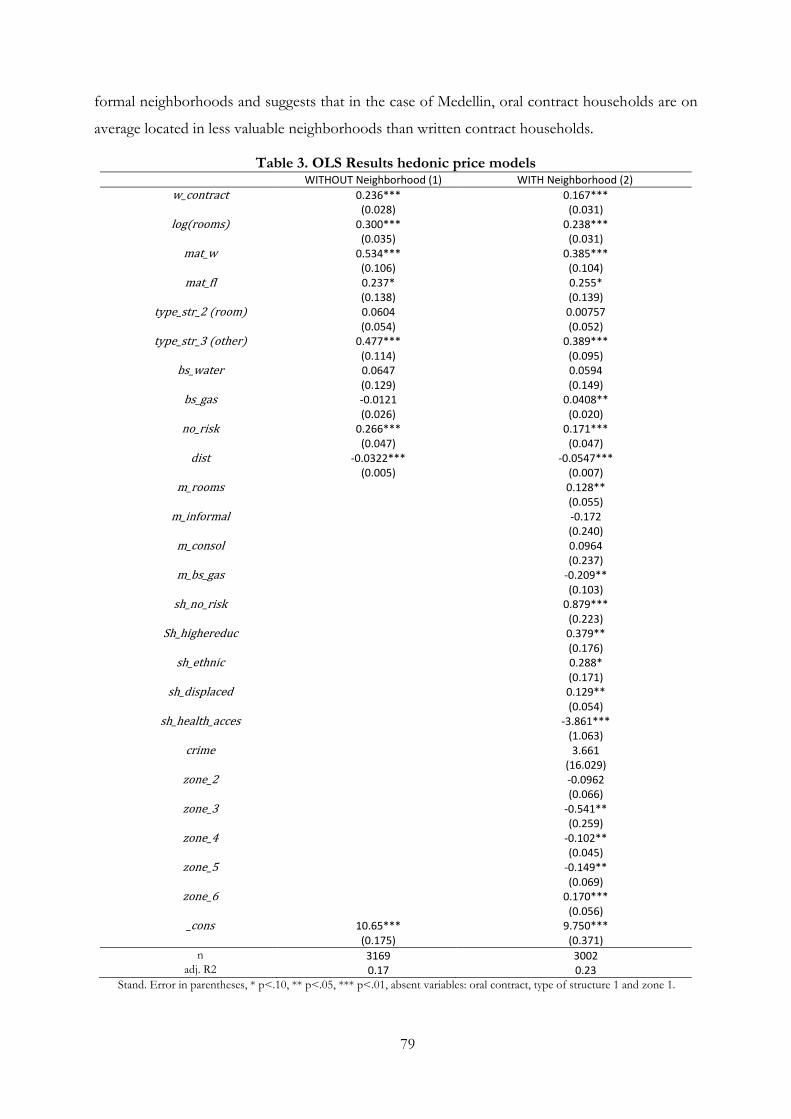
79
formal neighborhoods and suggests that in the case of Medellin, oral contract households are on
average located in less valuable neighborhoods than written contract households.
Table 3. OLS Results hedonic price models WITHOUT Neighborhood (1) WITH Neighborhood (2)
w_contract 0.236*** 0.167*** (0.028) (0.031)
log(rooms) 0.300*** 0.238*** (0.035) (0.031)
mat_w 0.534*** 0.385*** (0.106) (0.104)
mat_fl 0.237* 0.255* (0.138) (0.139)
type_str_2 (room) 0.0604 0.00757 (0.054) (0.052)
type_str_3 (other) 0.477*** 0.389*** (0.114) (0.095)
bs_water 0.0647 0.0594 (0.129) (0.149)
bs_gas -0.0121 0.0408** (0.026) (0.020)
no_risk 0.266*** 0.171*** (0.047) (0.047)
dist -0.0322*** -0.0547*** (0.005) (0.007)
m_rooms 0.128** (0.055)
m_informal -0.172 (0.240)
m_consol 0.0964 (0.237)
m_bs_gas -0.209** (0.103)
sh_no_risk 0.879*** (0.223)
Sh_highereduc 0.379** (0.176)
sh_ethnic 0.288* (0.171)
sh_displaced 0.129** (0.054)
sh_health_acces -3.861*** (1.063)
crime 3.661 (16.029)
zone_2 -0.0962 (0.066)
zone_3 -0.541** (0.259)
zone_4 -0.102** (0.045)
zone_5 -0.149** (0.069)
zone_6 0.170*** (0.056)
_cons 10.65*** 9.750*** (0.175) (0.371)
n 3169 3002 adj. R2 0.17 0.23
Stand. Error in parentheses, * p<.10, ** p<.05, *** p<.01, absent variables: oral contract, type of structure 1 and zone 1.
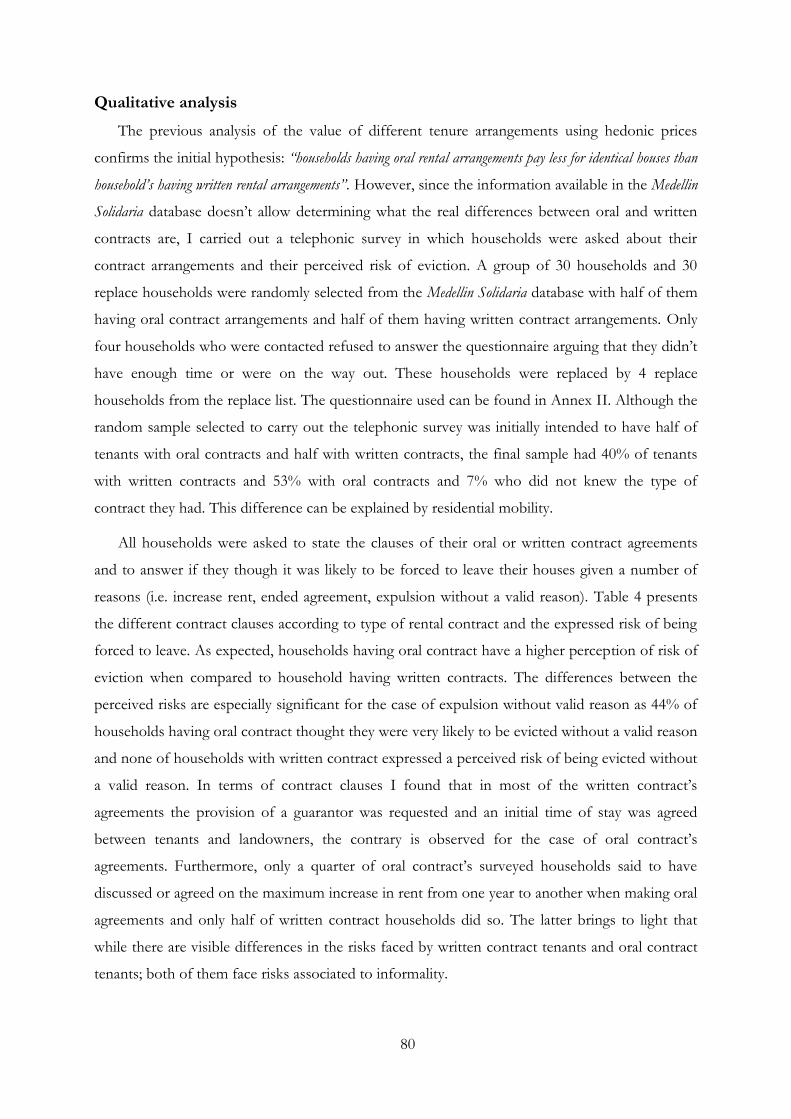
80
Qualitative analysis
The previous analysis of the value of different tenure arrangements using hedonic prices
confirms the initial hypothesis: “households having oral rental arrangements pay less for identical houses than
household‟s having written rental arrangements”. However, since the information available in the Medellin
Solidaria database doesn‘t allow determining what the real differences between oral and written
contracts are, I carried out a telephonic survey in which households were asked about their
contract arrangements and their perceived risk of eviction. A group of 30 households and 30
replace households were randomly selected from the Medellin Solidaria database with half of them
having oral contract arrangements and half of them having written contract arrangements. Only
four households who were contacted refused to answer the questionnaire arguing that they didn‘t
have enough time or were on the way out. These households were replaced by 4 replace
households from the replace list. The questionnaire used can be found in Annex II. Although the
random sample selected to carry out the telephonic survey was initially intended to have half of
tenants with oral contracts and half with written contracts, the final sample had 40% of tenants
with written contracts and 53% with oral contracts and 7% who did not knew the type of
contract they had. This difference can be explained by residential mobility.
All households were asked to state the clauses of their oral or written contract agreements
and to answer if they though it was likely to be forced to leave their houses given a number of
reasons (i.e. increase rent, ended agreement, expulsion without a valid reason). Table 4 presents
the different contract clauses according to type of rental contract and the expressed risk of being
forced to leave. As expected, households having oral contract have a higher perception of risk of
eviction when compared to household having written contracts. The differences between the
perceived risks are especially significant for the case of expulsion without valid reason as 44% of
households having oral contract thought they were very likely to be evicted without a valid reason
and none of households with written contract expressed a perceived risk of being evicted without
a valid reason. In terms of contract clauses I found that in most of the written contract‘s
agreements the provision of a guarantor was requested and an initial time of stay was agreed
between tenants and landowners, the contrary is observed for the case of oral contract‘s
agreements. Furthermore, only a quarter of oral contract‘s surveyed households said to have
discussed or agreed on the maximum increase in rent from one year to another when making oral
agreements and only half of written contract households did so. The latter brings to light that
while there are visible differences in the risks faced by written contract tenants and oral contract
tenants; both of them face risks associated to informality.
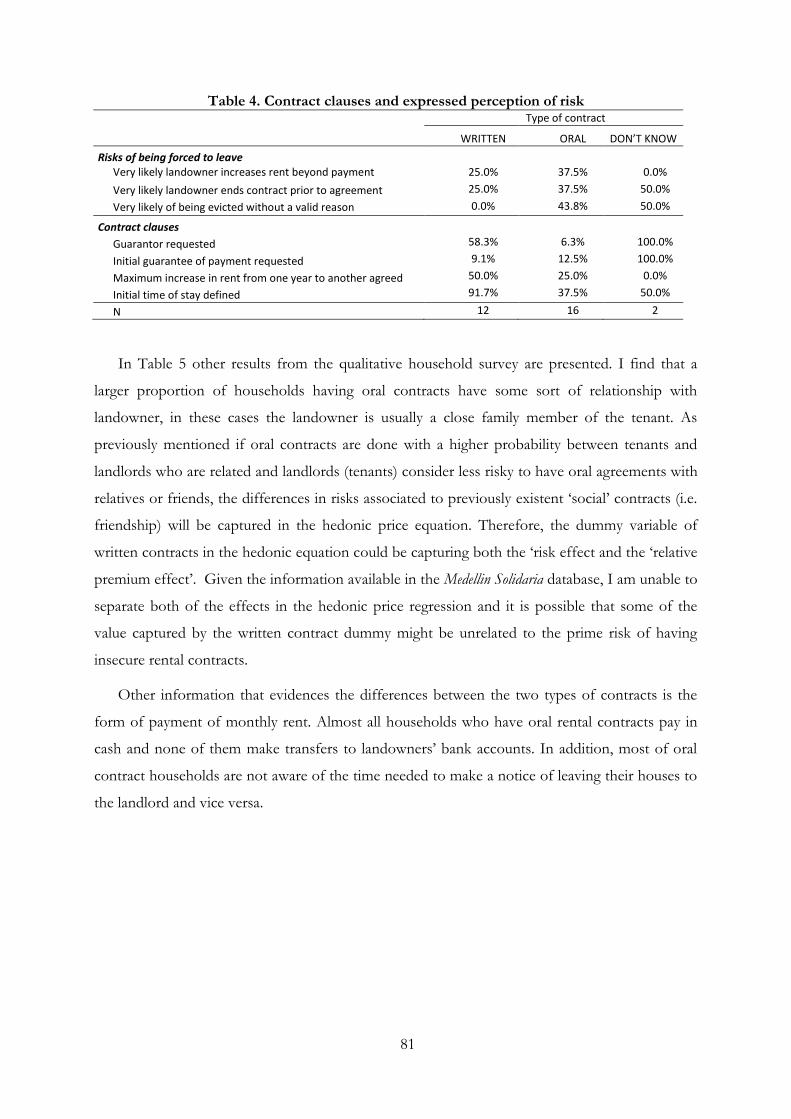
81
Table 4. Contract clauses and expressed perception of risk Type of contract
WRITTEN ORAL DON’T KNOW
Risks of being forced to leave Very likely landowner increases rent beyond payment
capacities 25.0% 37.5% 0.0%
Very likely landowner ends contract prior to agreement 25.0% 37.5% 50.0%
Very likely of being evicted without a valid reason 0.0% 43.8% 50.0%
Contract clauses Guarantor requested 58.3% 6.3% 100.0%
Initial guarantee of payment requested 9.1% 12.5% 100.0%
Maximum increase in rent from one year to another agreed 50.0% 25.0% 0.0%
Initial time of stay defined 91.7% 37.5% 50.0%
N 12 16 2
In Table 5 other results from the qualitative household survey are presented. I find that a
larger proportion of households having oral contracts have some sort of relationship with
landowner, in these cases the landowner is usually a close family member of the tenant. As
previously mentioned if oral contracts are done with a higher probability between tenants and
landlords who are related and landlords (tenants) consider less risky to have oral agreements with
relatives or friends, the differences in risks associated to previously existent ‗social‘ contracts (i.e.
friendship) will be captured in the hedonic price equation. Therefore, the dummy variable of
written contracts in the hedonic equation could be capturing both the ‗risk effect and the ‗relative
premium effect‘. Given the information available in the Medellin Solidaria database, I am unable to
separate both of the effects in the hedonic price regression and it is possible that some of the
value captured by the written contract dummy might be unrelated to the prime risk of having
insecure rental contracts.
Other information that evidences the differences between the two types of contracts is the
form of payment of monthly rent. Almost all households who have oral rental contracts pay in
cash and none of them make transfers to landowners‘ bank accounts. In addition, most of oral
contract households are not aware of the time needed to make a notice of leaving their houses to
the landlord and vice versa.
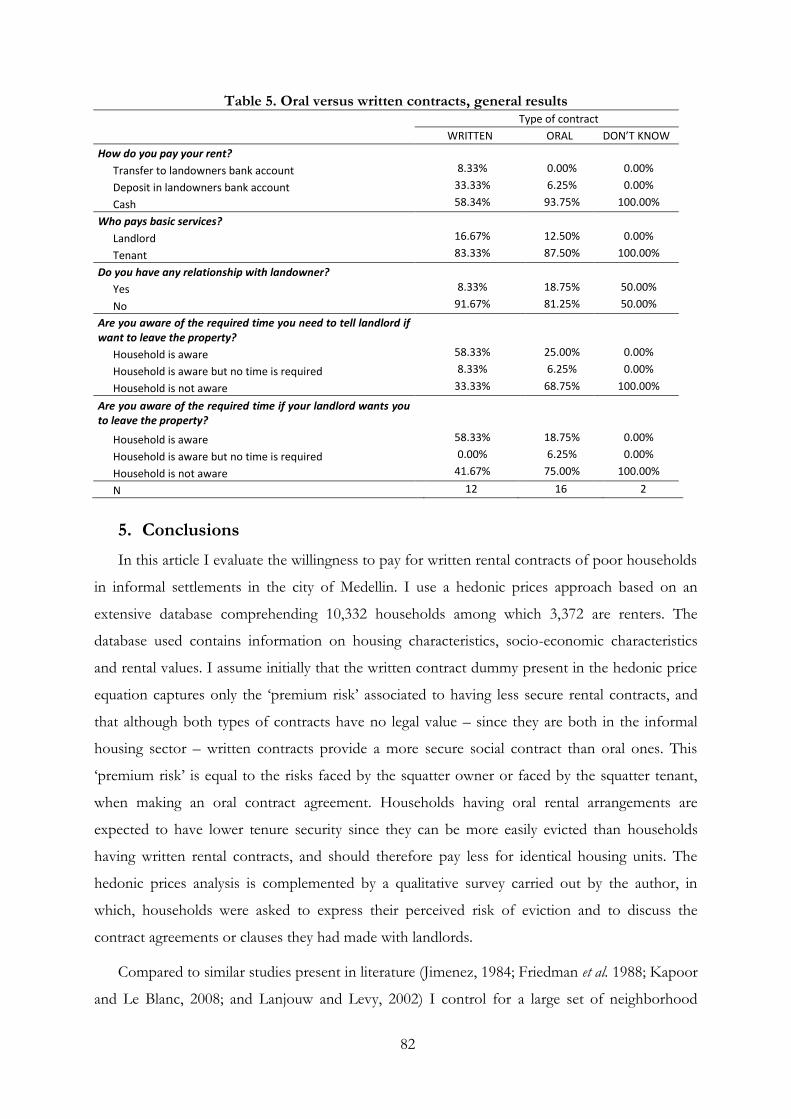
82
Table 5. Oral versus written contracts, general results
Type of contract
WRITTEN ORAL DON’T KNOW
How do you pay your rent?
Transfer to landowners bank account 8.33% 0.00% 0.00%
Deposit in landowners bank account 33.33% 6.25% 0.00%
Cash 58.34% 93.75% 100.00%
Who pays basic services?
Landlord 16.67% 12.50% 0.00%
Tenant 83.33% 87.50% 100.00%
Do you have any relationship with landowner?
Yes 8.33% 18.75% 50.00%
No 91.67% 81.25% 50.00%
Are you aware of the required time you need to tell landlord if want to leave the property?
Household is aware 58.33% 25.00% 0.00%
Household is aware but no time is required 8.33% 6.25% 0.00%
Household is not aware 33.33% 68.75% 100.00%
Are you aware of the required time if your landlord wants you to leave the property?
Household is aware 58.33% 18.75% 0.00%
Household is aware but no time is required 0.00% 6.25% 0.00%
Household is not aware 41.67% 75.00% 100.00%
N 12 16 2
5. Conclusions
In this article I evaluate the willingness to pay for written rental contracts of poor households
in informal settlements in the city of Medellin. I use a hedonic prices approach based on an
extensive database comprehending 10,332 households among which 3,372 are renters. The
database used contains information on housing characteristics, socio-economic characteristics
and rental values. I assume initially that the written contract dummy present in the hedonic price
equation captures only the ‗premium risk‘ associated to having less secure rental contracts, and
that although both types of contracts have no legal value – since they are both in the informal
housing sector – written contracts provide a more secure social contract than oral ones. This
‗premium risk‘ is equal to the risks faced by the squatter owner or faced by the squatter tenant,
when making an oral contract agreement. Households having oral rental arrangements are
expected to have lower tenure security since they can be more easily evicted than households
having written rental contracts, and should therefore pay less for identical housing units. The
hedonic prices analysis is complemented by a qualitative survey carried out by the author, in
which, households were asked to express their perceived risk of eviction and to discuss the
contract agreements or clauses they had made with landlords.
Compared to similar studies present in literature (Jimenez, 1984; Friedman et al. 1988; Kapoor
and Le Blanc, 2008; and Lanjouw and Levy, 2002) I control for a large set of neighborhood
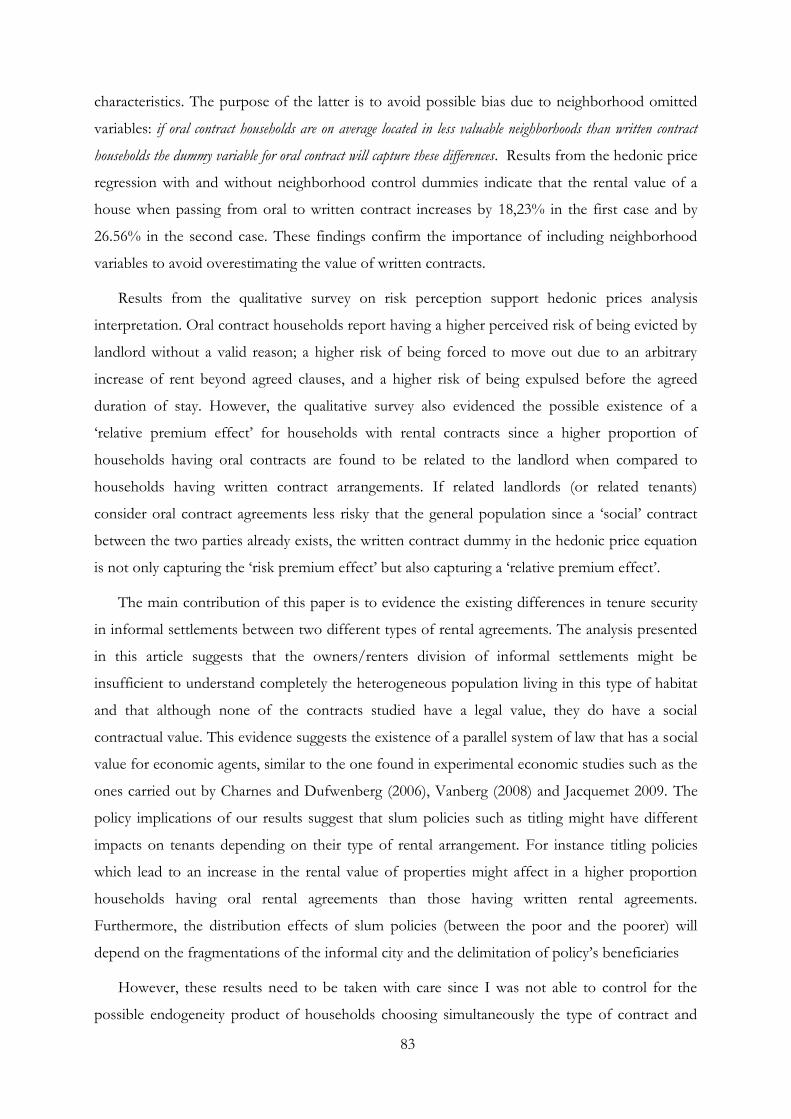
83
characteristics. The purpose of the latter is to avoid possible bias due to neighborhood omitted
variables: if oral contract households are on average located in less valuable neighborhoods than written contract
households the dummy variable for oral contract will capture these differences. Results from the hedonic price
regression with and without neighborhood control dummies indicate that the rental value of a
house when passing from oral to written contract increases by 18,23% in the first case and by
26.56% in the second case. These findings confirm the importance of including neighborhood
variables to avoid overestimating the value of written contracts.
Results from the qualitative survey on risk perception support hedonic prices analysis
interpretation. Oral contract households report having a higher perceived risk of being evicted by
landlord without a valid reason; a higher risk of being forced to move out due to an arbitrary
increase of rent beyond agreed clauses, and a higher risk of being expulsed before the agreed
duration of stay. However, the qualitative survey also evidenced the possible existence of a
‗relative premium effect‘ for households with rental contracts since a higher proportion of
households having oral contracts are found to be related to the landlord when compared to
households having written contract arrangements. If related landlords (or related tenants)
consider oral contract agreements less risky that the general population since a ‗social‘ contract
between the two parties already exists, the written contract dummy in the hedonic price equation
is not only capturing the ‗risk premium effect‘ but also capturing a ‗relative premium effect‘.
The main contribution of this paper is to evidence the existing differences in tenure security
in informal settlements between two different types of rental agreements. The analysis presented
in this article suggests that the owners/renters division of informal settlements might be
insufficient to understand completely the heterogeneous population living in this type of habitat
and that although none of the contracts studied have a legal value, they do have a social
contractual value. This evidence suggests the existence of a parallel system of law that has a social
value for economic agents, similar to the one found in experimental economic studies such as the
ones carried out by Charnes and Dufwenberg (2006), Vanberg (2008) and Jacquemet 2009. The
policy implications of our results suggest that slum policies such as titling might have different
impacts on tenants depending on their type of rental arrangement. For instance titling policies
which lead to an increase in the rental value of properties might affect in a higher proportion
households having oral rental agreements than those having written rental agreements.
Furthermore, the distribution effects of slum policies (between the poor and the poorer) will
depend on the fragmentations of the informal city and the delimitation of policy‘s beneficiaries
However, these results need to be taken with care since I was not able to control for the
possible endogeneity product of households choosing simultaneously the type of contract and
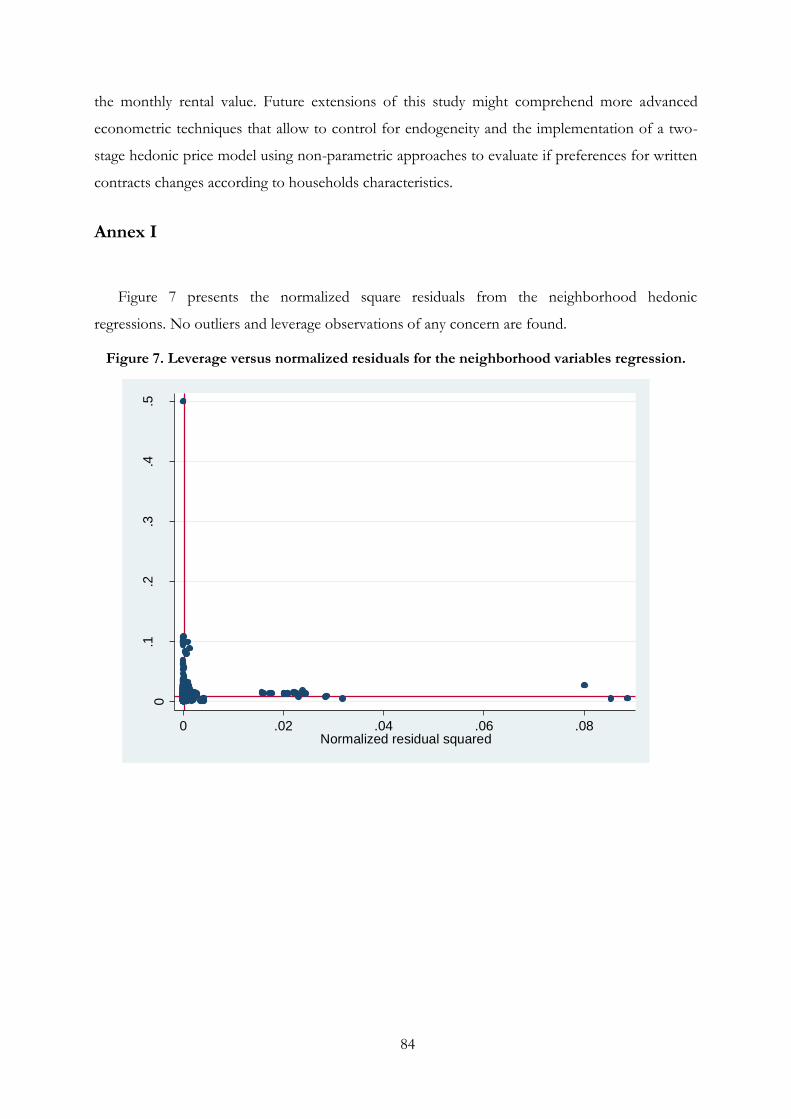
84
the monthly rental value. Future extensions of this study might comprehend more advanced
econometric techniques that allow to control for endogeneity and the implementation of a two-
stage hedonic price model using non-parametric approaches to evaluate if preferences for written
contracts changes according to households characteristics.
Annex I
Figure 7 presents the normalized square residuals from the neighborhood hedonic
regressions. No outliers and leverage observations of any concern are found.
Figure 7. Leverage versus normalized residuals for the neighborhood variables regression.
0.1
.2.3
.4.5
Le
vera
ge
0 .02 .04 .06 .08Normalized residual squared
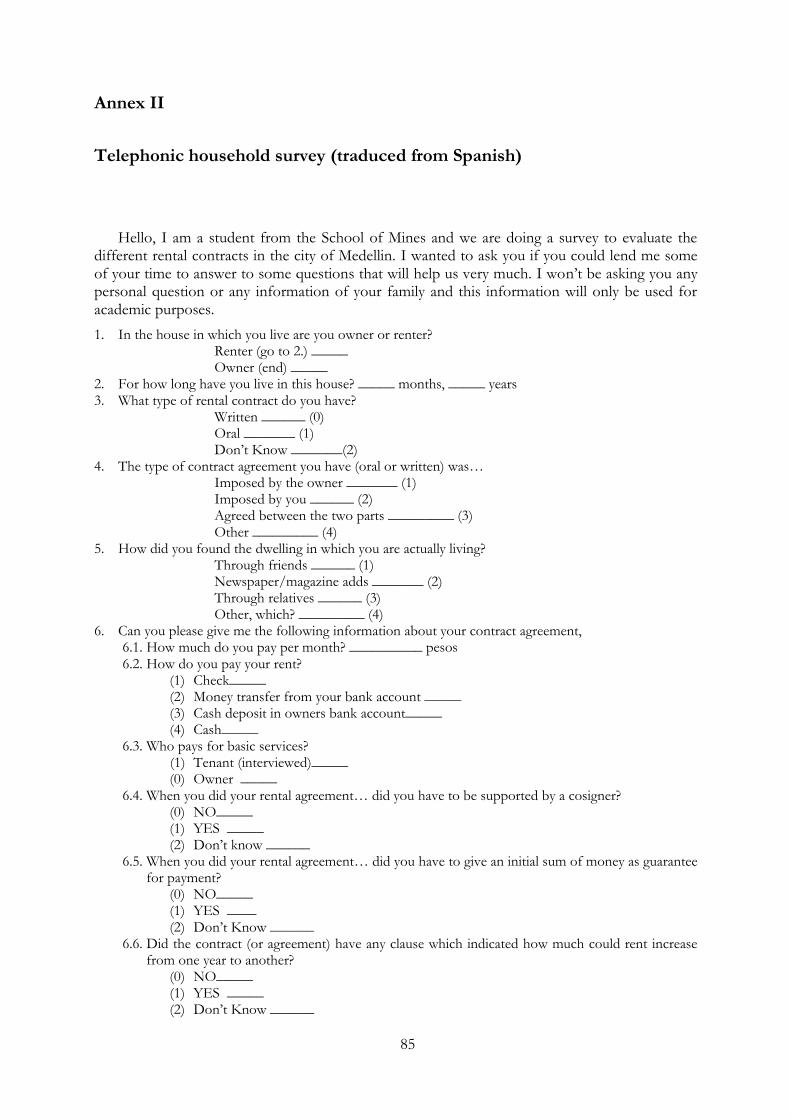
85
Annex II
Telephonic household survey (traduced from Spanish)
Hello, I am a student from the School of Mines and we are doing a survey to evaluate the different rental contracts in the city of Medellin. I wanted to ask you if you could lend me some of your time to answer to some questions that will help us very much. I won‘t be asking you any personal question or any information of your family and this information will only be used for academic purposes.
1. In the house in which you live are you owner or renter? Renter (go to 2.) _____ Owner (end) _____
2. For how long have you live in this house? _____ months, _____ years 3. What type of rental contract do you have?
Written ______ (0) Oral _______ (1) Don‘t Know _______(2)
4. The type of contract agreement you have (oral or written) was… Imposed by the owner _______ (1) Imposed by you ______ (2) Agreed between the two parts _________ (3) Other _________ (4)
5. How did you found the dwelling in which you are actually living? Through friends ______ (1) Newspaper/magazine adds _______ (2) Through relatives ______ (3) Other, which? _________ (4)
6. Can you please give me the following information about your contract agreement, 6.1. How much do you pay per month? __________ pesos 6.2. How do you pay your rent?
(1) Check_____ (2) Money transfer from your bank account _____ (3) Cash deposit in owners bank account_____ (4) Cash_____
6.3. Who pays for basic services? (1) Tenant (interviewed)_____ (0) Owner _____
6.4. When you did your rental agreement… did you have to be supported by a cosigner? (0) NO_____ (1) YES _____ (2) Don‘t know ______
6.5. When you did your rental agreement… did you have to give an initial sum of money as guarantee for payment?
(0) NO_____ (1) YES ____ (2) Don‘t Know ______
6.6. Did the contract (or agreement) have any clause which indicated how much could rent increase from one year to another?
(0) NO_____ (1) YES _____ (2) Don‘t Know ______
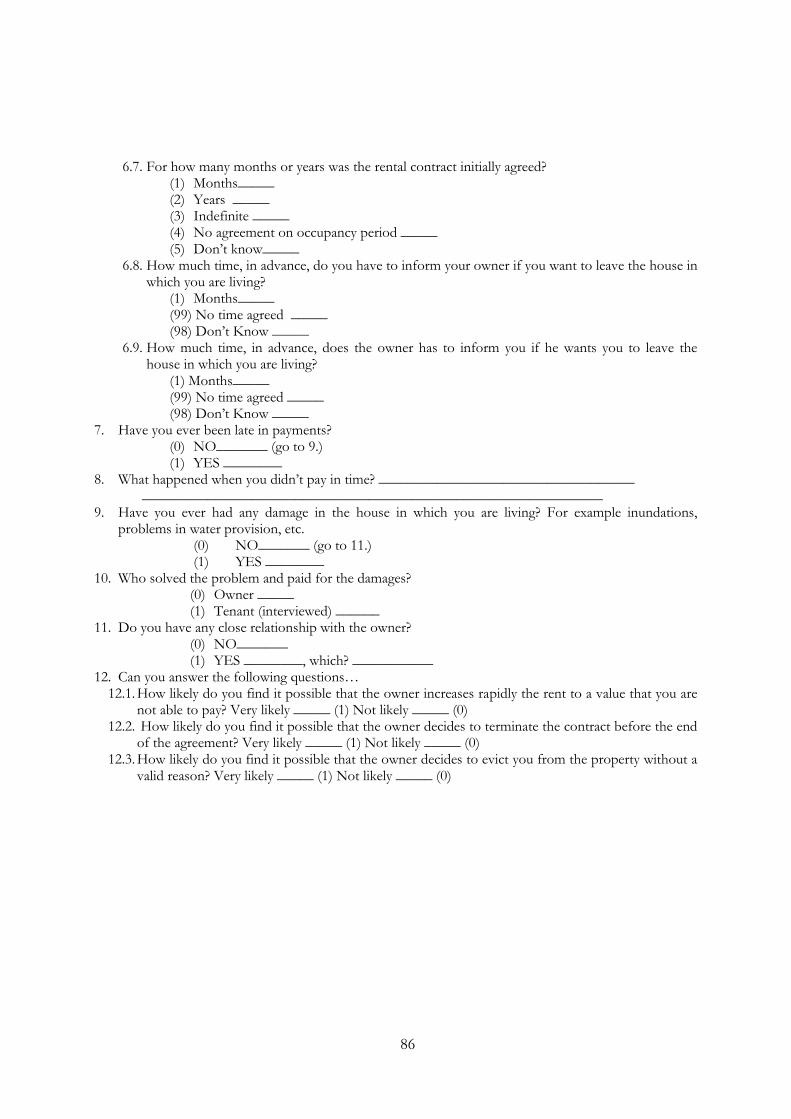
86
6.7. For how many months or years was the rental contract initially agreed? (1) Months_____ (2) Years _____ (3) Indefinite _____ (4) No agreement on occupancy period _____ (5) Don‘t know_____
6.8. How much time, in advance, do you have to inform your owner if you want to leave the house in which you are living?
(1) Months_____ (99) No time agreed _____ (98) Don‘t Know _____
6.9. How much time, in advance, does the owner has to inform you if he wants you to leave the house in which you are living?
(1) Months_____ (99) No time agreed _____ (98) Don‘t Know _____
7. Have you ever been late in payments? (0) NO_______ (go to 9.) (1) YES ________
8. What happened when you didn‘t pay in time? ___________________________________ _______________________________________________________________
9. Have you ever had any damage in the house in which you are living? For example inundations, problems in water provision, etc.
(0) NO_______ (go to 11.) (1) YES ________
10. Who solved the problem and paid for the damages? (0) Owner _____ (1) Tenant (interviewed) ______
11. Do you have any close relationship with the owner? (0) NO_______ (1) YES ________, which? ___________
12. Can you answer the following questions… 12.1. How likely do you find it possible that the owner increases rapidly the rent to a value that you are
not able to pay? Very likely _____ (1) Not likely _____ (0) 12.2. How likely do you find it possible that the owner decides to terminate the contract before the end
of the agreement? Very likely _____ (1) Not likely _____ (0) 12.3. How likely do you find it possible that the owner decides to evict you from the property without a
valid reason? Very likely _____ (1) Not likely _____ (0)
87
Part II
The impact of slum interventions on households’ welfare

88
89
Chapter 5
Measuring the effects of slum policies
1. Introduction
A slum household as defined by the United Nations is a household that lacks one or more of
the following characteristics: access to improved water, access to improved sanitation, security of
tenure, durable housing and sufficient living area (UN Habitat, 2003). Therefore, slum policies
can cover very different interventions from simple improvements in access to basic services to
more complete actions that lead to a total reconstruction of slums. In the previous chapters we
have discussed the importance of making correct impact evaluations of slum policies (1) to
identify if a given policy is achieving its objectives (i.e. number of beneficiaries, total cost), (2) to
compare the policy‘s return to other policies and (3) to evaluate whether the policy is
contributing to or opposing poverty–alleviation efforts. In addition, evaluating the outcomes of
slum improvements can lead to a better understanding of slum formation mechanisms, which are
essential to tackle the slum ‗problem‘.
The evaluation of the impacts of slum policies encounters the same difficulties as that of the
analysis of traditional public policies but has some additional complexities specific to the slum
issue. First, slum policies are on many occasions composed of packages of policies; a given slum
policy can improve both basic service provision and tenure security, thus making it difficult to
separate the effects of each intervention on a given welfare indicator and develop theoretical
analysis that consider both. Second, as explained by Field and Kremer (2006), most poor
neighborhoods and particularly informal settlements are underrepresented in census data. The
lack of information on slums and the sometimes low quality of the information available makes it
more difficult for researchers to establish pre–existing conditions and evaluate the effects of
policies. This means that in many cases researchers need to collect the information themselves,
which can be time–consuming and costly. Furthermore, when little information on the
distribution and the dispersion of the slum population is known, the creation of representative
samples of treated and control groups can be difficult.
90
In addition, the evaluation of the impact of slum policies intends to respond–as every other
analysis of public policies–an essential counterfactual question: what would have happened to
those who benefitted from the policy if they had not benefitted and how would those who did
not benefit react in the presence of the policy? Since it is impossible to measure the two
outcomes for the same individual, researchers have to find ways to identify non–beneficiary or
control groups that can be used as the benchmark for treated or beneficiary groups. The latter is
referred to in literature as the evaluation problem. Finding comparable treated and control
groups is in most cases problematic since those who did benefit from the policy are generally
different from those who were left outside. For instance, in Mumbai, only households that are
live prior to January 1, 1995 in the city can be eligible for the Slum Rehabilitation Scheme (SRS);
non–eligible slums are more recent, less consolidated and tend to house poorer households.
Therefore, a direct comparison of rehabilitated households to slum households introduces a
selection bias as the initial differences between the two groups are captured in the measurement
of the effect of the policy. In the following section we will evaluate different methodologies to
face the evaluation problem and control or reduce selection bias. Throughout this chapter the
terms intervention, project or public policy and treated or beneficiaries are used without
distinction.
This chapter is organized as follows. Section 2 discusses the evaluation problem and some of
the possible selection bias present in slum–policy evaluation. Section 3 describes methodological
approaches to overcome the evaluation problem and selection bias. Section 4 presents some of
the most relevant empirical studies related to slum upgrading. Finally, in Section 5 I present the
methodologies used to evaluate the welfare effects of slum upgrading, in Mumbai and Medellin,
which are used in the development of impact evaluations presented in the following chapters.
2. Methodological concerns for public policies evaluation1
The evaluation problem
The evaluation of public interventions aims to assess the effect of a treatment on a variable
of interest y. In empirical economic analysis, modifications of y due to public interventions can
be measured by looking at the variable of interest for the same individual with ( ) and without
the treatment ( ). The difference between the outcome of interest ( ) will
correspond to the treatment effect. Usually public interventions are studied to determine how
treated individuals responded to the policy and/or to anticipate how those who did not benefit
1 This section draws heavily from Chapter 10 ―Evaluation des politiques publiques. Econométrie des effets de traitement” of
Crépon and Jacquemet (2010)
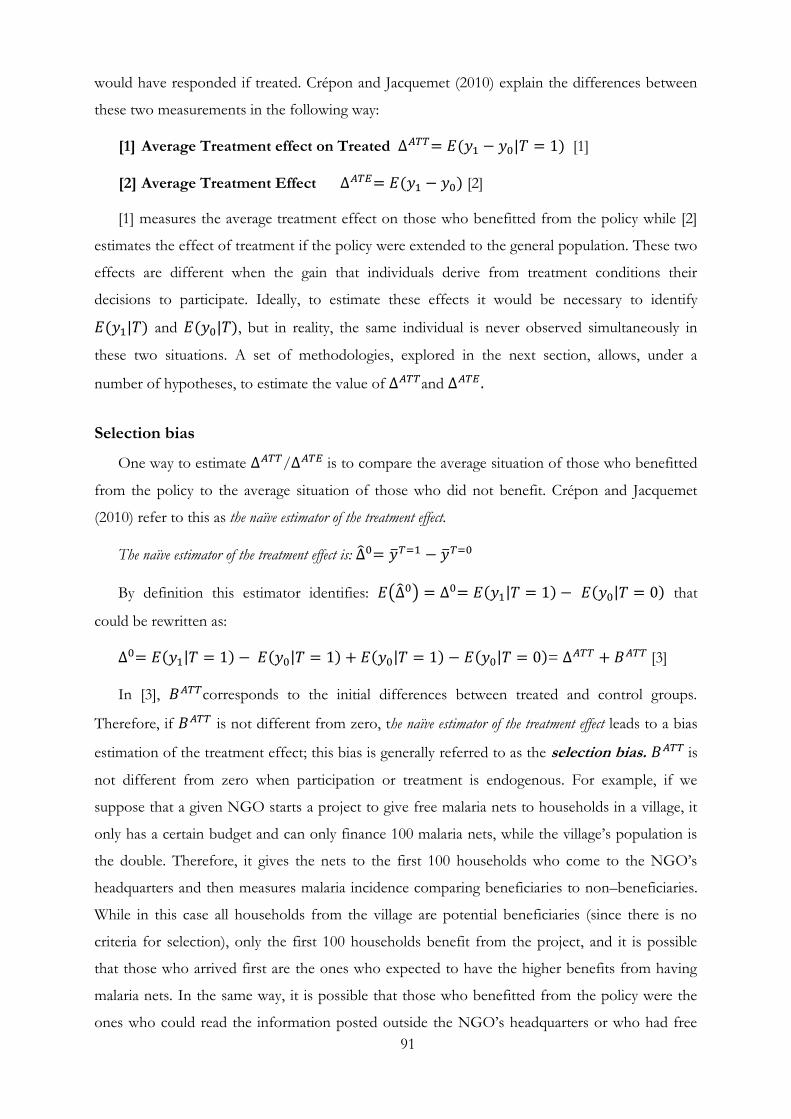
91
would have responded if treated. Crépon and Jacquemet (2010) explain the differences between
these two measurements in the following way:
[1] Average Treatment effect on Treated [1]
[2] Average Treatment Effect [2]
[1] measures the average treatment effect on those who benefitted from the policy while [2]
estimates the effect of treatment if the policy were extended to the general population. These two
effects are different when the gain that individuals derive from treatment conditions their
decisions to participate. Ideally, to estimate these effects it would be necessary to identify
and , but in reality, the same individual is never observed simultaneously in
these two situations. A set of methodologies, explored in the next section, allows, under a
number of hypotheses, to estimate the value of and
Selection bias
One way to estimate / is to compare the average situation of those who benefitted
from the policy to the average situation of those who did not benefit. Crépon and Jacquemet
(2010) refer to this as the naïve estimator of the treatment effect.
The naïve estimator of the treatment effect is:
By definition this estimator identifies: that
could be rewritten as:
= [3]
In [3], corresponds to the initial differences between treated and control groups.
Therefore, if is not different from zero, the naïve estimator of the treatment effect leads to a bias
estimation of the treatment effect; this bias is generally referred to as the selection bias. is
not different from zero when participation or treatment is endogenous. For example, if we
suppose that a given NGO starts a project to give free malaria nets to households in a village, it
only has a certain budget and can only finance 100 malaria nets, while the village‘s population is
the double. Therefore, it gives the nets to the first 100 households who come to the NGO‘s
headquarters and then measures malaria incidence comparing beneficiaries to non–beneficiaries.
While in this case all households from the village are potential beneficiaries (since there is no
criteria for selection), only the first 100 households benefit from the project, and it is possible
that those who arrived first are the ones who expected to have the higher benefits from having
malaria nets. In the same way, it is possible that those who benefitted from the policy were the
ones who could read the information posted outside the NGO‘s headquarters or who had free
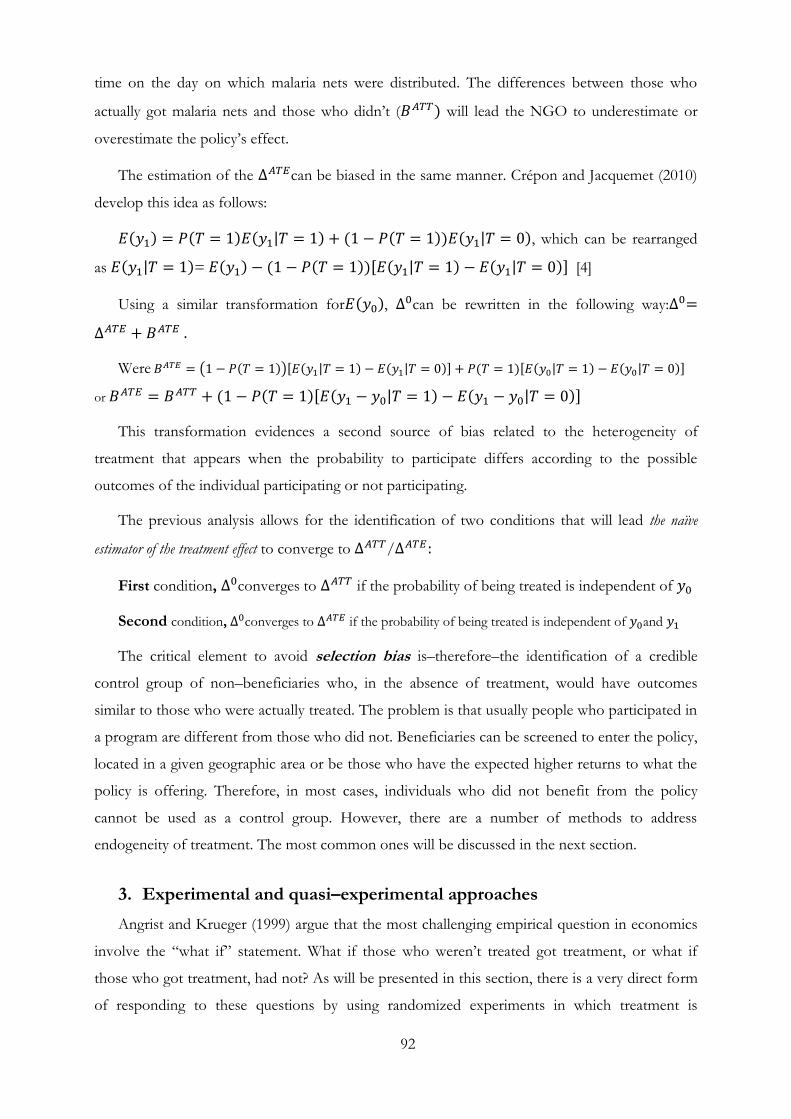
92
time on the day on which malaria nets were distributed. The differences between those who
actually got malaria nets and those who didn‘t ( will lead the NGO to underestimate or
overestimate the policy‘s effect.
The estimation of the can be biased in the same manner. Crépon and Jacquemet (2010)
develop this idea as follows:
, which can be rearranged
as = [4]
Using a similar transformation for , can be rewritten in the following way:
Were
or
This transformation evidences a second source of bias related to the heterogeneity of
treatment that appears when the probability to participate differs according to the possible
outcomes of the individual participating or not participating.
The previous analysis allows for the identification of two conditions that will lead the naïve
estimator of the treatment effect to converge to /
First condition, converges to if the probability of being treated is independent of
Second condition, converges to if the probability of being treated is independent of and
The critical element to avoid selection bias is–therefore–the identification of a credible
control group of non–beneficiaries who, in the absence of treatment, would have outcomes
similar to those who were actually treated. The problem is that usually people who participated in
a program are different from those who did not. Beneficiaries can be screened to enter the policy,
located in a given geographic area or be those who have the expected higher returns to what the
policy is offering. Therefore, in most cases, individuals who did not benefit from the policy
cannot be used as a control group. However, there are a number of methods to address
endogeneity of treatment. The most common ones will be discussed in the next section.
3. Experimental and quasi–experimental approaches
Angrist and Krueger (1999) argue that the most challenging empirical question in economics
involve the ―what if‖ statement. What if those who weren‘t treated got treatment, or what if
those who got treatment, had not? As will be presented in this section, there is a very direct form
of responding to these questions by using randomized experiments in which treatment is
93
assigned to households randomly. However, rarely do researchers have the chance to observe
policies that assign treatment randomly and, in most cases, the establishment of credible
comparison groups–who in the absence of the policy would have had similar outcomes to those
who were treated–is essential (Field and Kremer, 2006). In this section experimental and quasi–
experimental approaches that lead to a reduction of the selection bias will be discussed.
Randomized methodologies (Experimental approaches)
Most public policies are designed to target a certain group of individuals gathering a number
of characteristics that make them eligible. In some cases, like our example of malaria–net
distributions, all households are potential beneficiaries but the project is designed in a way that
those who finally benefit are probably the ones who expect to have the higher returns for using
malaria nets. In both cases it is not possible to assure the First and Second conditions to avoid
selection bias, since treated and non–treated groups have visible differences before the policy is
implemented and do not have the same probability of treatment.
Unlike quasi–experimental methodologies, randomized methodologies propose the
elimination of selection bias through the implementation of policies that assign treatment
randomly to the potential population of beneficiaries. Duflo and Kremer (2003) explain how “In
this case, on average, we can be assured that those who are exposed to the program are no different from those who
are not, and thus a statistically significant difference between the groups in the outcomes the program was planning
to affect can be confidently attributed to the program”2.
Randomly assigning individuals to treatment and following both treated and control groups
allows–on the one hand–the elimination of the initial differences between the two groups and–on
the other hand–breaking the relationship between the expected treatment effect and the
probability of being treated. If the NGO mentioned in the previous section had assigned malaria
nets randomly to households in the village, the probability of being treated would be independent
from the households‘ expected utility of having malaria nets, their malaria incidence prior to the
project (Second condition) and their initial characteristics such as their ability to read or their
time constraints (First condition).
Nevertheless, randomized methodologies require large coordination and monetary efforts to
implement and track beneficiaries and non–beneficiaries a sufficient time for the policy to have
produced results. Furthermore, most randomized evaluation encounters strong opposition
related to ethical issues. If two very poor households are in great need of malaria nets, it is
ethically difficult to accept that one got one and the other one did not, due to the implementation
2 pp. 95
94
of randomized evaluations. The latter makes it very difficult for policy makers to justify the
implementation of policies which assign treatment randomly. For all of these reasons, the use of
randomized evaluations for public policy analysis has remained low.
In the past decade research institutions like the Poverty Action Laboratory and Innovation for
Poverty Action have lead a campaign for the implementation of randomized evaluation that has
resulted in a higher recognition of the benefits of this type of evaluations and the multiplication
of the number of randomized experiments worldwide. Nevertheless, most randomized
experiments carried out for the moment have been in rural areas and involve the analysis of
health or education policies or projects. The extension of randomized experiments for the
analysis of more complex public policies, like slum policies, is not always easy and has not been
developed considerably. To my knowledge only one randomized evaluation carried out so far can
be considered as being part of slum policies and it involved the evaluation of the effects of
accessing private piped water connections in Tangier (Morocco). This example will be discussed
in the following section.
In Conclusion, How does it control for initial differences between control and treated groups and solve
endogeneity of treatment? By designing a policy that assigns the treatment randomly, breaking the
endogeneity of treatment and leading to ‗perfect‘ treated and control groups (as both had the
same probability of being treated).
Downsides: Ethical dilemma. They are labor intensive and costly. From the technical point of
view, it means that the researcher is at the core of the program or policy implementation, which
is not always the case. Furthermore, randomized evaluation estimates partial equilibrium
programs which–if implemented on a large scale–could have different results. Randomized
evaluations are not exempt from other problems also present in quasi–experimental studies that
lead to bias in the estimation of the treatment effect, such as attrition (i.e. individuals with
specific characteristics dropping out of the database), a non–random sample and spillovers (i.e.
effects of treatment on treated which affect the control group indirectly).
Non–experimental approaches
In most impact evaluation studies of public interventions, control groups are identified ex–
post based on the policy‘s design and data availability. In some cases multiple observations of
treated and/or non–treated individuals are available (panel or multiple cross–sections), in others,
it is only possible for the researcher to observe individuals after the policy was implemented
(cross–section). The availability of data determines–to some extent–the possible methodologies
used to control for selection bias. In this sub–section, we will first discuss how treatment effects
95
are estimated according to the type of data available and then describe some empirical techniques
available for the identification of control groups in the case of non–experimental studies.
Before–After, Difference and Difference–in–Difference estimations
Before–After (BA), Difference (D) and Difference–in–Difference (DID) estimations are
some of the most used methodologies to evaluate public policies. They are based on the
comparison of individuals before and/or after the policy, in which the individuals observed
before and after are not necessarily the same. In each of these estimations, additional
hypotheses–that are sometimes not very convincing–need to be made to control for Selection
bias. We will first discuss what the hypotheses are that are made in each of these cases–that
allow a consistent estimation of the treatment effect–and then describe some of the available
methodologies or techniques used in literature to support these hypotheses.
Before–After (BA) estimation is based on panel–data or repeated cross–section observations of
treated individuals. In BA evaluations the control group is a group of to–be–treated individuals
before they receive treatment. This estimator is biased if an exogenous variation affects the
variable of interest in the period of analysis. Therefore, BA evaluation supposes that all
observables changes between the two periods of analysis were caused by the policy or program, a
very restrictive and unrealistic hypothesis.
Difference (D) estimations use cross–sectional observations of treated and non–treated
(control) individuals ex–post. This estimator is–therefore–the same as the naïve estimator discussed
in the previous section and is biased if unobservable differences between the two groups are
correlated with the probability of receiving treatment.
Difference–in–Difference (DID) estimations combine the two previous methodologies by using
panel or repeated cross–sections of treated and non–treated individuals. The hypothesis made in
this estimation is less restrictive than in the case of BA and D, since it supposes that initial
differences between treated and control groups would have been maintained in absence of
treatment(Crépon and Jacquemet, 2010) . Field and Kremer (2006) argue that it is important not
to take this assumption for granted. On a number of occasions treatment is assigned following
negative shock in output (Ashenfelter, 1978). Some techniques might allow evaluating graphically
if data support the hypothesis of constant average differences between the two groups prior to
treatment. For instance, when long–time series data are available, it is possible to compare trends
between control and treated groups over a long period before the intervention took place.
However, even in these cases a recent study made by Bertrand et al. (2004) suggest that DID
estimators (as commonly performed) can lead to biased estimators of the treatment effect due to
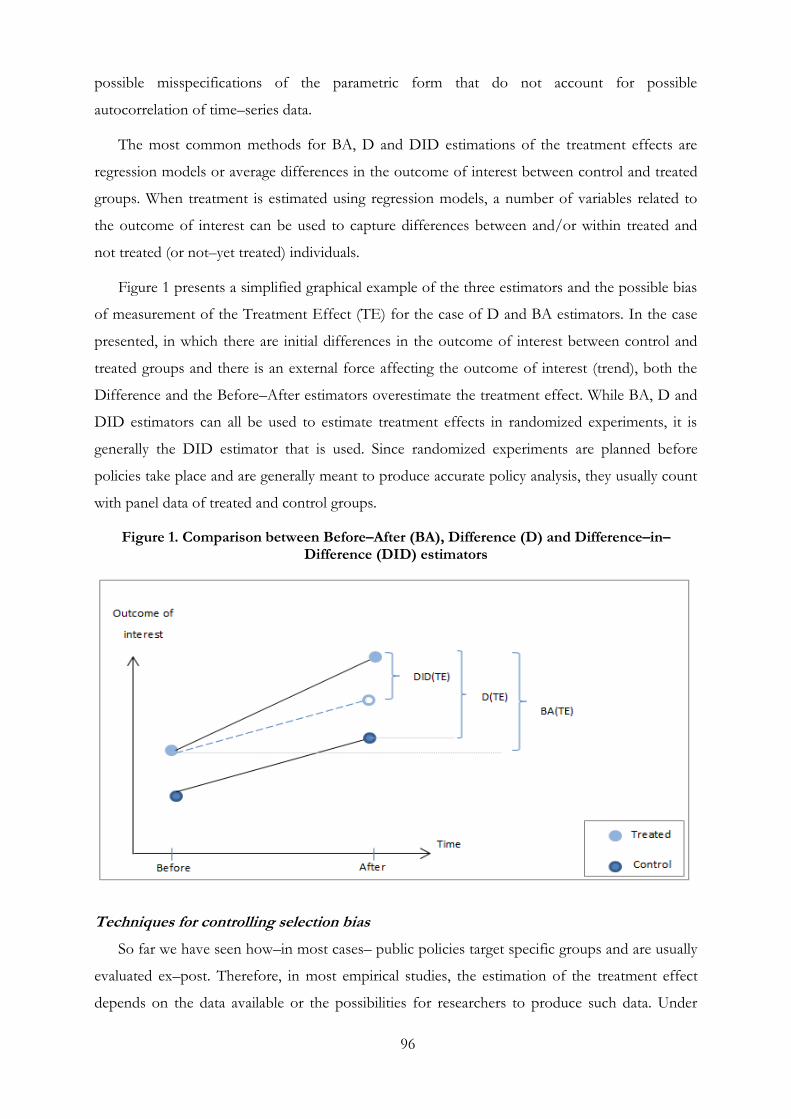
96
possible misspecifications of the parametric form that do not account for possible
autocorrelation of time–series data.
The most common methods for BA, D and DID estimations of the treatment effects are
regression models or average differences in the outcome of interest between control and treated
groups. When treatment is estimated using regression models, a number of variables related to
the outcome of interest can be used to capture differences between and/or within treated and
not treated (or not–yet treated) individuals.
Figure 1 presents a simplified graphical example of the three estimators and the possible bias
of measurement of the Treatment Effect (TE) for the case of D and BA estimators. In the case
presented, in which there are initial differences in the outcome of interest between control and
treated groups and there is an external force affecting the outcome of interest (trend), both the
Difference and the Before–After estimators overestimate the treatment effect. While BA, D and
DID estimators can all be used to estimate treatment effects in randomized experiments, it is
generally the DID estimator that is used. Since randomized experiments are planned before
policies take place and are generally meant to produce accurate policy analysis, they usually count
with panel data of treated and control groups.
Figure 1. Comparison between Before–After (BA), Difference (D) and Difference–in–Difference (DID) estimators
Techniques for controlling selection bias
So far we have seen how–in most cases– public policies target specific groups and are usually
evaluated ex–post. Therefore, in most empirical studies, the estimation of the treatment effect
depends on the data available or the possibilities for researchers to produce such data. Under
97
these circumstances most empirical studies carried out for policy analysis require the
identification of convincing control groups to assure that the First and Second conditions are
met. In this sub–section we present two of the most common techniques3 used in empirical
literature to identify control groups and reduce selection bias. In some empirical studies a
combination of both techniques is used.
Regression discontinuities
Regression–discontinuities techniques are applicable when either cross–sectional or panel
data of treated and non–treated groups are available, and the policy design allows for it. On some
occasions the criteria or the rules used to select policy beneficiaries generate discontinuities that can
be used to compare those who meet the criteria (treated) to those who almost met the criteria but
were left out (control). Scenarios in which policies allow for this type of techniques to be used are
usually referred to as natural experiments. Discontinuities can take a number of different forms,
such as geographical disruptions or ―timing‖ discontinuities. Cattaneo et al. (2009) take advantage
of a geographic disruption in the implementation of a policy that replaced dirty floors for cement
floors in Mexico. In their study they compare treated and non–treated individuals who lived on
the boundaries of two states, when only one of them had been treated. Field (2003, 2005 and
2007) and Field and Torero (2006) use timing discontinuities in a massive titling program in Peru,
comparing households in areas that had already been reached by the program to households that
had not been reached by the program at the moment of analysis.
In Conclusion, How does it control for initial differences between control and treated groups and solve
endogeneity of treatment? By comparing treated and non–treated individuals who are very close to
one another (boundaries).
Downsides: The use of regression discontinuities can be problematic in a number of cases. On the
one hand, it is one technique that is especially vulnerable to spillover effects since treated and
non–treated individuals sometimes share the same environment. On the other hand, it is
sometimes difficult to identify accurately treated and control groups based on criteria as in many
developing countries rules or criteria for participation in interventions are not always respected.
Propensity Score Matching
Propensity Score Matching (PSM) techniques are applicable when either cross–sectional or
panel data of treated and non–treated groups are available, and the quality of the data allows for
it. Controls and treated groups are identified using different matching techniques based on a
3 Other techniques such as hedonic prices, contingent evaluation methods or location choice models are used commonly to evaluate the monetary value of public interventions or model the possible welfare effects of different interventions. Examples of these techniques in the case of slum upgrading interventions are presented in Section 4 of this Chapter.
98
series of observable covariates according to the probability of being treated (Propensity Score).
The Propensity Score is calculated using regression techniques based on covariates and serves to
estimate the probability of treatment conditional on the covariates for each observation. The
treatment effect is estimated comparing the average outcome of interest for individuals who had
the same (or a very similar) probability of being treated (control) than treated individuals. One of
the advantages of PSM, as explained by Jalan and Ravallion (2003), is that it allows estimating the
heterogeneity of public policies, which serves to measure distributional impacts.
In Conclusion, How does it control for initial differences between control and treated groups and solve
endogeneity of treatment? By comparing treated and non–treated individuals who had the same
probability of treatment.
Downsides: To be able to find sufficiently close individuals from the non–treated group to
those who were treated, this methodology sometimes requires the existence of very large
databases. Furthermore, as matching is done based on observed covariates, bias may result if
non–observables from the treated and control groups are very different and are related to the
outcome of measurements or when the rules for allocating treatment are unknown to the
observer.
4. Examples of empirical studies of slum upgrading interventions
Table 1 presents relevant examples of empirical studies evaluating slum upgrading
interventions. As in the case of most public policies evaluations, most of these evaluations are
done ex–post and many of them use cross–sectional data of treated and non–treated individuals.
In many cases regression discontinuities are used to identify control groups or exogenous treatment
allocation is assumed, as in the case of Galiani and Schargrodky (2010). Some studies use ex–ante
data of treated and non–treated individuals, usually coming from official sources such as census
data, which serve to test the hypothesis made for each estimation (BA, D, DID) based on a series
of covariates.
In this chapter only empirical evaluations of real policies have been discussed; however, there
are a number of studies in literature that respond to the ―what if‖ question using techniques such
as hedonic prices. In these cases, the empirical analysis serves to evaluate multiple policy
scenarios and determine their welfare benefits. Most of these techniques are used to determine
monetary values of public interventions, usually relying on the housing market, to evaluate how
households value different policies and – if possible–estimate possible financing mechanisms.
One example of this type of evaluations is presented in Table 1 (Takeuchi et al. 2008). The
hedonic regression analysis of the informal rental housing market in the city of Medellin,
presented in Chapter 4 can be considered as being part of this type of evaluations.
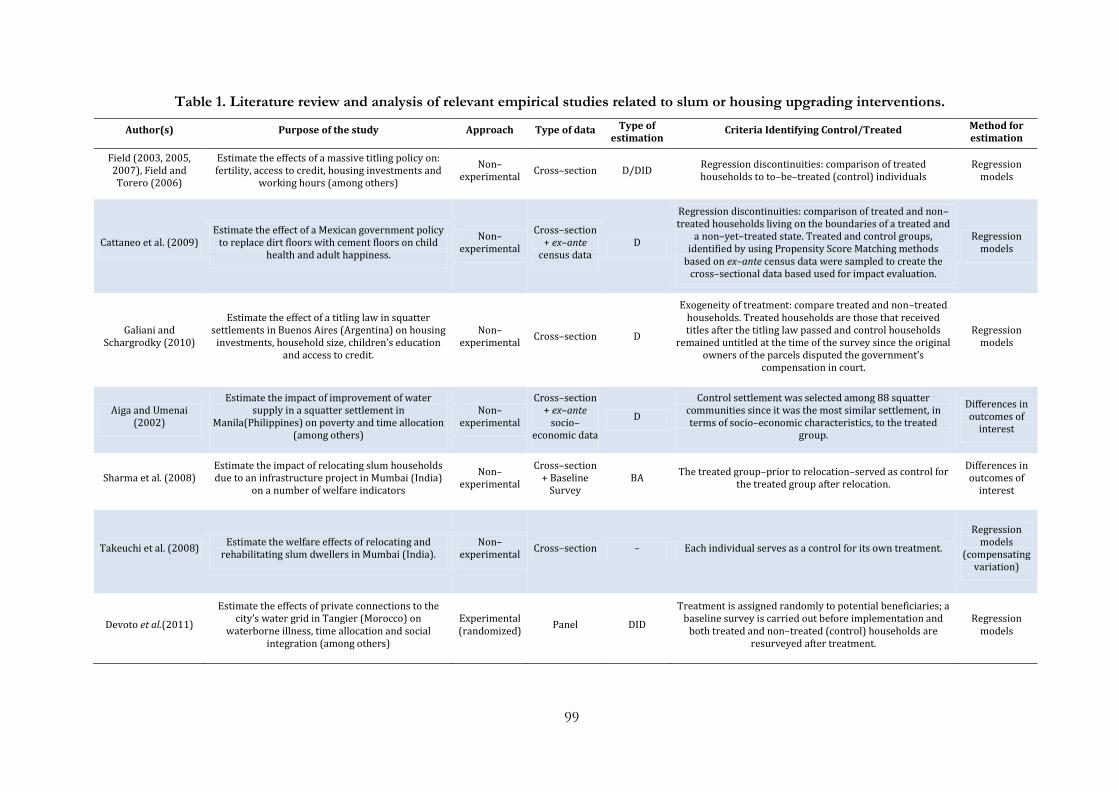
99
Table 1. Literature review and analysis of relevant empirical studies related to slum or housing upgrading interventions.
Author(s) Purpose of the study Approach Type of data Type of estimation
Criteria Identifying Control/Treated Method for estimation
Field (2003, 2005, 2007), Field and Torero (2006)
Estimate the effects of a massive titling policy on: fertility, access to credit, housing investments and
working hours (among others)
Non– experimental
Cross–section D/DID Regression discontinuities: comparison of treated households to to–be–treated (control) individuals
Regression models
Cattaneo et al. (2009) Estimate the effect of a Mexican government policy
to replace dirt floors with cement floors on child health and adult happiness.
Non– experimental
Cross–section + ex–ante
census data D
Regression discontinuities: comparison of treated and non–treated households living on the boundaries of a treated and
a non–yet–treated state. Treated and control groups, identified by using Propensity Score Matching methods
based on ex–ante census data were sampled to create the cross–sectional data based used for impact evaluation.
Regression models
Galiani and Schargrodky (2010)
Estimate the effect of a titling law in squatter settlements in Buenos Aires (Argentina) on housing
investments, household size, children’s education and access to credit.
Non– experimental
Cross–section D
Exogeneity of treatment: compare treated and non–treated households. Treated households are those that received titles after the titling law passed and control households
remained untitled at the time of the survey since the original owners of the parcels disputed the government’s
compensation in court.
Regression models
Aiga and Umenai (2002)
Estimate the impact of improvement of water supply in a squatter settlement in
Manila(Philippines) on poverty and time allocation (among others)
Non– experimental
Cross–section + ex–ante
socio–economic data
D
Control settlement was selected among 88 squatter communities since it was the most similar settlement, in terms of socio–economic characteristics, to the treated
group.
Differences in outcomes of
interest
Sharma et al. (2008) Estimate the impact of relocating slum households due to an infrastructure project in Mumbai (India)
on a number of welfare indicators
Non– experimental
Cross–section + Baseline
Survey BA
The treated group–prior to relocation–served as control for the treated group after relocation.
Differences in outcomes of
interest
Takeuchi et al. (2008) Estimate the welfare effects of relocating and
rehabilitating slum dwellers in Mumbai (India). Non–
experimental Cross–section – Each individual serves as a control for its own treatment.
Regression models
(compensating variation)
Devoto et al.(2011)
Estimate the effects of private connections to the city’s water grid in Tangier (Morocco) on
waterborne illness, time allocation and social integration (among others)
Experimental (randomized)
Panel DID
Treatment is assigned randomly to potential beneficiaries; a baseline survey is carried out before implementation and
both treated and non–treated (control) households are resurveyed after treatment.
Regression models
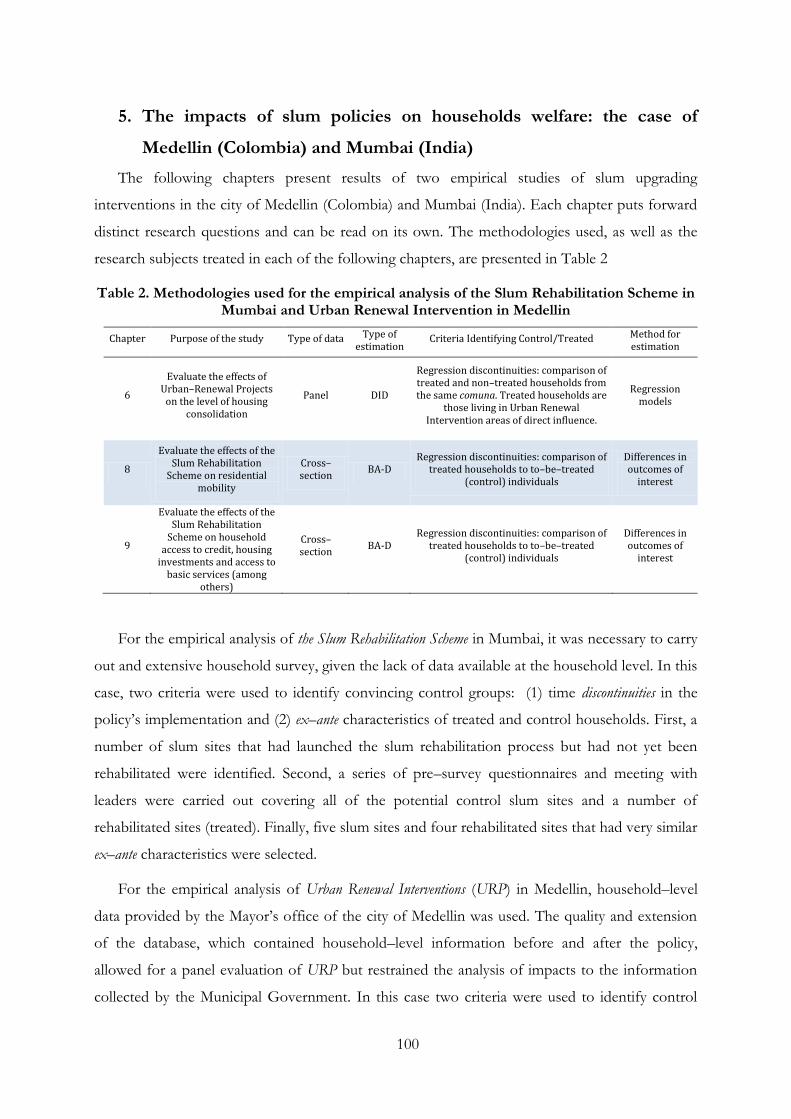
100
5. The impacts of slum policies on households welfare: the case of
Medellin (Colombia) and Mumbai (India)
The following chapters present results of two empirical studies of slum upgrading
interventions in the city of Medellin (Colombia) and Mumbai (India). Each chapter puts forward
distinct research questions and can be read on its own. The methodologies used, as well as the
research subjects treated in each of the following chapters, are presented in Table 2
Table 2. Methodologies used for the empirical analysis of the Slum Rehabilitation Scheme in Mumbai and Urban Renewal Intervention in Medellin
Chapter Purpose of the study Type of data Type of estimation
Criteria Identifying Control/Treated Method for estimation
6
Evaluate the effects of Urban–Renewal Projects
on the level of housing consolidation
Panel DID
Regression discontinuities: comparison of treated and non–treated households from the same comuna. Treated households are
those living in Urban Renewal Intervention areas of direct influence.
Regression models
8
Evaluate the effects of the Slum Rehabilitation
Scheme on residential mobility
Cross–section
BA-D Regression discontinuities: comparison of
treated households to to–be–treated (control) individuals
Differences in outcomes of
interest
9
Evaluate the effects of the Slum Rehabilitation
Scheme on household access to credit, housing
investments and access to basic services (among
others)
Cross–section
BA-D Regression discontinuities: comparison of
treated households to to–be–treated (control) individuals
Differences in outcomes of
interest
For the empirical analysis of the Slum Rehabilitation Scheme in Mumbai, it was necessary to carry
out and extensive household survey, given the lack of data available at the household level. In this
case, two criteria were used to identify convincing control groups: (1) time discontinuities in the
policy‘s implementation and (2) ex–ante characteristics of treated and control households. First, a
number of slum sites that had launched the slum rehabilitation process but had not yet been
rehabilitated were identified. Second, a series of pre–survey questionnaires and meeting with
leaders were carried out covering all of the potential control slum sites and a number of
rehabilitated sites (treated). Finally, five slum sites and four rehabilitated sites that had very similar
ex–ante characteristics were selected.
For the empirical analysis of Urban Renewal Interventions (URP) in Medellin, household–level
data provided by the Mayor‘s office of the city of Medellin was used. The quality and extension
of the database, which contained household–level information before and after the policy,
allowed for a panel evaluation of URP but restrained the analysis of impacts to the information
collected by the Municipal Government. In this case two criteria were used to identify control
101
and treated groups. First, the universe of analysis was restrained to the two comunas (districts) in
which the first URP was implemented. Second, based on the geographical position of each
observation and the areas of direct intervention of the policy, a distance to treatment was
estimated. Based on distance to treatment and a number of additional information (of the policy‘s
implementation and households behavior), treated and control groups were identified. The
estimation of the treatment effect was made using DID based on regression models.

102
103
Chapter 6
The effects of Urban Renewal Projects on the level of housing consolidation: the case of Medellin (Colombia)1
Abstract Recent literature suggests that changes in the perception of risk of eviction in informal settlements–even
when titles are not granted–could lead to changes in the level of investments in housing. This paper
examines the effects of Urban Renewal Projects (URPs), which consider the Metrocable intervention and the
Urban Integral Project (UIP), implemented in two marginalized settlements in the city of Medellin
(Colombia), on the level of housing consolidation. The setting of the URP allows the testing of the
previous hypothesis since it does not induce direct changes in housing but is based on the improvement
of public amenities that lead to a higher presence of local authorities in these settlements. I use a quasi-
experimental approach using geographical position of households in relation to the direct area of URP
intervention to compare outcomes for treated and control groups. Results suggest that the Metrocable
intervention had a negative and significant effect on the probability of living in a consolidated house and
the Urban Integral Project had no significant effect. A more specific analysis based on tenure security and
forms of occupation of the territory (squatters, pirate urbanization and public housing) indicates that
Metrocable‘s effect is only significant for squatter households. This unexpected result evidences how Urban
Renewal Projects, even when aiming to improve a household‘s living conditions, could disrupt their
perception of security and lead to a diminution of housing investments.
Résumé La littérature récente suggère que des changements dans la perception du risque d'éviction dans des
bidonvilles, même quand des titres ne sont pas accordés, pourrait conduire à des changements dans le
niveau des investissements dans le logement. Cet article évalue les effets des Projets de Renouvellement Urbain
(PRU – Urban Renewal Projects URP en anglais), qui comprennent le Metrocable et le Projet Urbain Intégral (PUI
– Urban Integral Project UIP en anglais), sur le niveau de consolidation des logements. Etant donné que les
PRU ne concernent pas des modifications des logements mais des améliorations des équipements publics
qui conduisent à une plus grande présence des autorités, on peut tester l‘hypothèse précédente. Pour cela
j‘utilise une approche quasi-expérimentale utilisant la localisation géographique des ménages par rapport à
la zone d‘intervention directe du PRU. Les résultats suggèrent que le Metrocable a eu un effet négatif et
significatif sur la probabilité de vivre dans une maison consolidée et que le PUI n‘a eu aucun effet
significatif. Une analyse approfondie basé sur une comparaison des formes d‘occupation du territoire
(squatters, urbanisation pirate ou logement public) indique que l‘effet du Metrocable n‘est significatif que
pour les squatteurs. Ce résultat montre comment des projets de renouvellement urbain ayant le but
d‘améliorer les conditions de vie de ménages, peuvent perturber la perception de sécurité des ménages et
les conduire à diminuer leurs investissements dans le logement.
1 Acknowledgments: I thank the Medellin Mayor‘s office especially the Departamento Administrativo de Planeación. Alexandra Peláez, Sub–Director of Metroinformación and Martha Ligia Restrepo of the DAP for providing me invaluable information. I also thank the Nicolas Jacquemet for having the patience to discuss my work and give me very useful comments.
104
1. Introduction
The United Nations uses five criteria to define a slum household: a group of individuals living
under the same roof and lacking one or more of the following conditions: access to improved
water, access to improved sanitation, sufficient living area, structural quality and durability of
housing and security of tenure (UN-Habitat, 2009b). Following these axes, most ‗inclusive‘ slum
policies implemented in developing countries consider the improvement of one or more of these
criteria. Some policies bring piped–water connections to slum households while others consider a
complete reconstruction and reabsorption of slums. In this paper I study an innovative slum
policy currently being applied in Medellin (Colombia), which–contrary to traditional slum
policies–concentrates on everything that is outside the house. Urban Renewal Projects (URPs),
which are the scope of this article, involve, among others, the improvement of public spaces,
mobility, public amenities and environmental conditions in marginalized settlements. The
purpose of this article is to evaluate what the long–lasting private effects of the implementation
of public policies are, using the level of housing consolidation as an indicator.
The causal relationship between the implementation of URPs and changes in the level of
housing consolidation can be understood through the relationship between changes in perceived
security of tenure generated by changes in the presence of the local government (or the law) in
marginalized settlements. The link between tenure security and the level of housing investments
has been studied broadly in literature and is one of the most common subjects in slum studies.
Literature on the relationship between housing investments and tenure security is generally
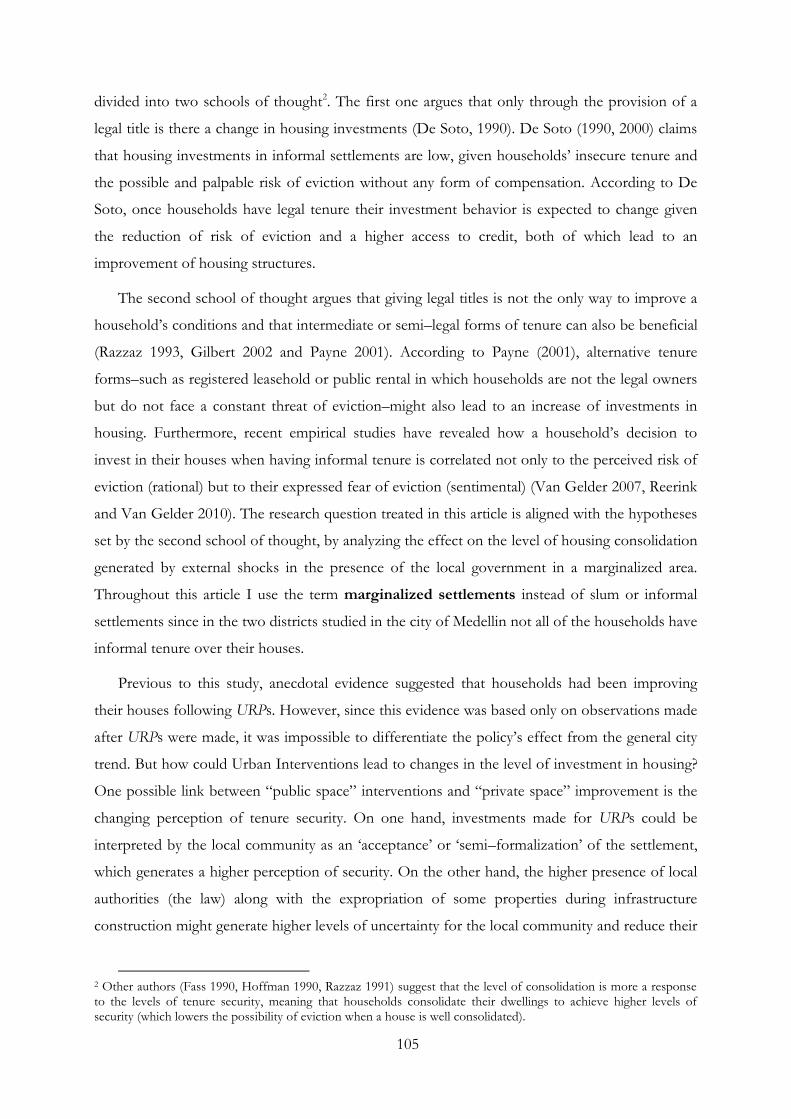
105
divided into two schools of thought2. The first one argues that only through the provision of a
legal title is there a change in housing investments (De Soto, 1990). De Soto (1990, 2000) claims
that housing investments in informal settlements are low, given households‘ insecure tenure and
the possible and palpable risk of eviction without any form of compensation. According to De
Soto, once households have legal tenure their investment behavior is expected to change given
the reduction of risk of eviction and a higher access to credit, both of which lead to an
improvement of housing structures.
The second school of thought argues that giving legal titles is not the only way to improve a
household‘s conditions and that intermediate or semi–legal forms of tenure can also be beneficial
(Razzaz 1993, Gilbert 2002 and Payne 2001). According to Payne (2001), alternative tenure
forms–such as registered leasehold or public rental in which households are not the legal owners
but do not face a constant threat of eviction–might also lead to an increase of investments in
housing. Furthermore, recent empirical studies have revealed how a household‘s decision to
invest in their houses when having informal tenure is correlated not only to the perceived risk of
eviction (rational) but to their expressed fear of eviction (sentimental) (Van Gelder 2007, Reerink
and Van Gelder 2010). The research question treated in this article is aligned with the hypotheses
set by the second school of thought, by analyzing the effect on the level of housing consolidation
generated by external shocks in the presence of the local government in a marginalized area.
Throughout this article I use the term marginalized settlements instead of slum or informal
settlements since in the two districts studied in the city of Medellin not all of the households have
informal tenure over their houses.
Previous to this study, anecdotal evidence suggested that households had been improving
their houses following URPs. However, since this evidence was based only on observations made
after URPs were made, it was impossible to differentiate the policy‘s effect from the general city
trend. But how could Urban Interventions lead to changes in the level of investment in housing?
One possible link between ―public space‖ interventions and ―private space‖ improvement is the
changing perception of tenure security. On one hand, investments made for URPs could be
interpreted by the local community as an ‗acceptance‘ or ‗semi–formalization‘ of the settlement,
which generates a higher perception of security. On the other hand, the higher presence of local
authorities (the law) along with the expropriation of some properties during infrastructure
construction might generate higher levels of uncertainty for the local community and reduce their
2 Other authors (Fass 1990, Hoffman 1990, Razzaz 1991) suggest that the level of consolidation is more a response to the levels of tenure security, meaning that households consolidate their dwellings to achieve higher levels of security (which lowers the possibility of eviction when a house is well consolidated).
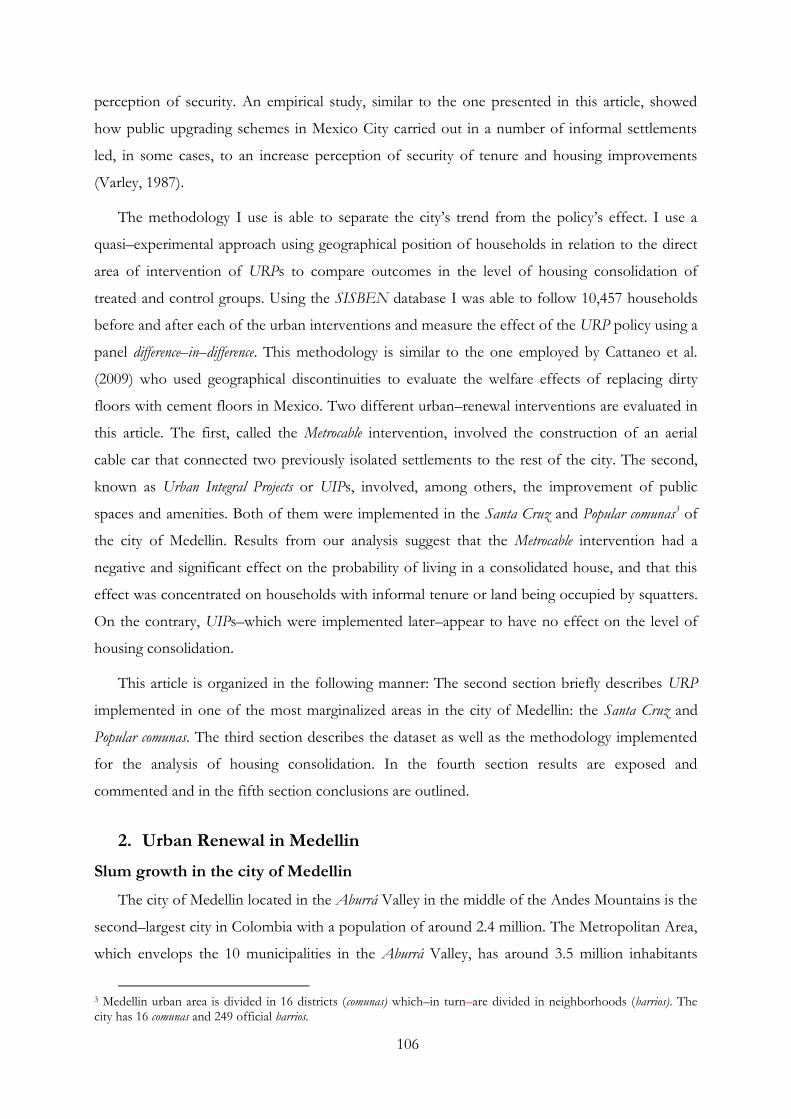
106
perception of security. An empirical study, similar to the one presented in this article, showed
how public upgrading schemes in Mexico City carried out in a number of informal settlements
led, in some cases, to an increase perception of security of tenure and housing improvements
(Varley, 1987).
The methodology I use is able to separate the city‘s trend from the policy‘s effect. I use a
quasi–experimental approach using geographical position of households in relation to the direct
area of intervention of URPs to compare outcomes in the level of housing consolidation of
treated and control groups. Using the SISBEN database I was able to follow 10,457 households
before and after each of the urban interventions and measure the effect of the URP policy using a
panel difference–in–difference. This methodology is similar to the one employed by Cattaneo et al.
(2009) who used geographical discontinuities to evaluate the welfare effects of replacing dirty
floors with cement floors in Mexico. Two different urban–renewal interventions are evaluated in
this article. The first, called the Metrocable intervention, involved the construction of an aerial
cable car that connected two previously isolated settlements to the rest of the city. The second,
known as Urban Integral Projects or UIPs, involved, among others, the improvement of public
spaces and amenities. Both of them were implemented in the Santa Cruz and Popular comunas3 of
the city of Medellin. Results from our analysis suggest that the Metrocable intervention had a
negative and significant effect on the probability of living in a consolidated house, and that this
effect was concentrated on households with informal tenure or land being occupied by squatters.
On the contrary, UIPs–which were implemented later–appear to have no effect on the level of
housing consolidation.
This article is organized in the following manner: The second section briefly describes URP
implemented in one of the most marginalized areas in the city of Medellin: the Santa Cruz and
Popular comunas. The third section describes the dataset as well as the methodology implemented
for the analysis of housing consolidation. In the fourth section results are exposed and
commented and in the fifth section conclusions are outlined.
2. Urban Renewal in Medellin
Slum growth in the city of Medellin
The city of Medellin located in the Aburrá Valley in the middle of the Andes Mountains is the
second–largest city in Colombia with a population of around 2.4 million. The Metropolitan Area,
which envelops the 10 municipalities in the Aburrá Valley, has around 3.5 million inhabitants
3 Medellin urban area is divided in 16 districts (comunas) which–in turn–are divided in neighborhoods (barrios). The city has 16 comunas and 249 official barrios.
107
(Alcaldía de Medellin, 2006a). Medellin is the capital of the Department of Antioquia, which
produces approximately 15% of Colombia‘s GDP (Torres Tovar, 2009). Although the city has
been known nationally for its industrial development and is home to many of the country‘s most
important industries, it has also been recognized as one of the most–violent cities in the world. In
many ways, today‘s urban interventions have been fueled by the idea of changing both the
insider‘s and the outsider‘s image of the city.
Informal settlements began appearing in Medellin in the middle of the XX century, as in
many Latin American cities, in the form of pirate urbanizations. However, contrary to experiences
in other countries, classic urbanization led by economic growth was also accompanied by
violence, which led rural–to–urban migration caused first by ―La Violencia”, a period of civil
conflict between the liberal and conservative parties (1948-1958*), and later, by the confrontation
between insurgent groups and the government. Two predominant types of informal settlements
are visible in the city: Pirate urbanizations and squatters. Pirate urbanizations are the product of illegal
land divisions made by land speculators who divide plots and sell them to poor migrants. When
formed, pirate urbanizations generally lack basic infrastructure but space for the construction of
future roads is sometimes considered; the construction of housing structures is usually left to new
occupants‘. Pirate urbanizations were the predominant form of informal land occupation in the city
before the 1968 Enforcement Act, which declared illegal urbanization as a crime punishable by
imprisonment (DPU, 2006). Squatter settlements, commonly known as invasiones, flourished in the
early 70s and are even today the principal form of informal urbanization in the city. Squatters or
invasiones are the product of illegal occupation of lands, are generally less structured and
consolidated when compared to pirate urbanizations and households living in this type of
settlements usually do not have legal proof of ownership of their land or of their housing
structures.
A series of informal–settlement censuses have been carried out in the city. In 1992, 70
informal settlements, composed of 37,000 housing units housing around 185,000 persons, were
identified. In 1994, the Planning Departments registered 87 informal settlements with
approximately 202,500 inhabitants. By the end of 2002 the total number of informal settlements
had risen to 104 with around 350,000 inhabitants, the equivalent of 18% of the total city
population (Torres Tovar, 2010). Informal settlements in Medellin, unlike other developing cities
like Mumbai (India), are spatially concentrated and most of them are located at the periphery of
the city. Almost all of the informal settlements have access to basic services and have achieved a
certain degree of consolidation. However, given that a considerable proportion of the population
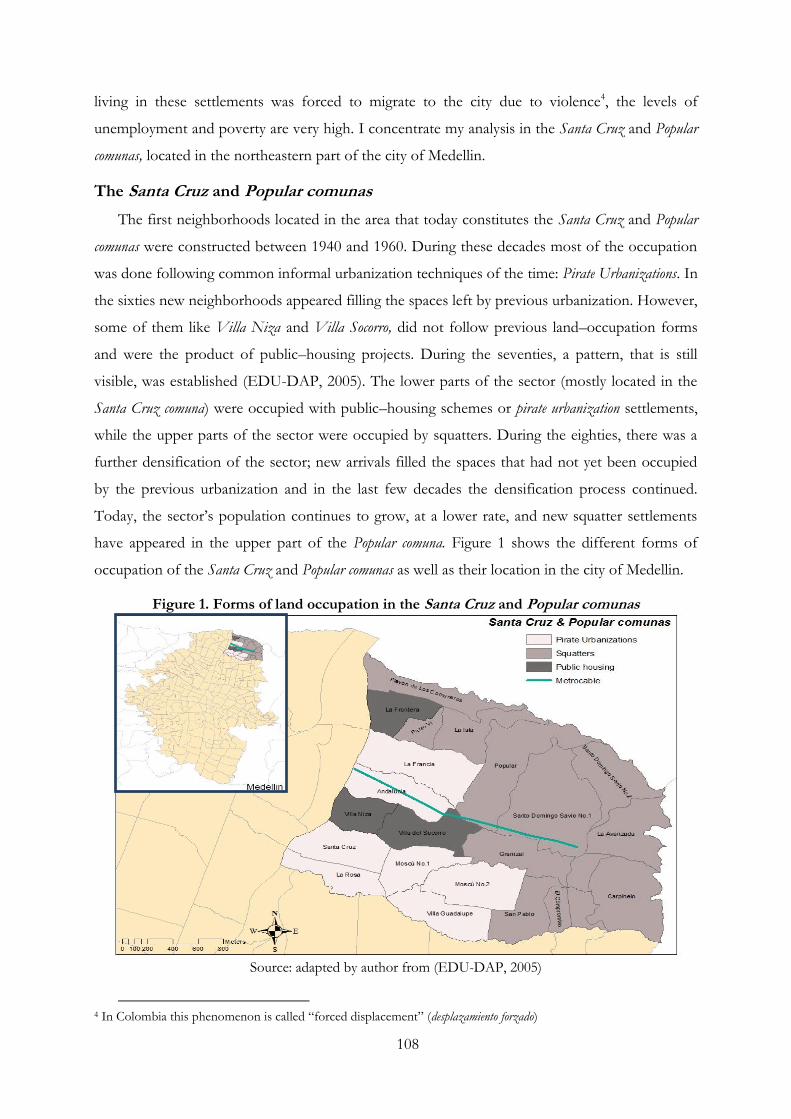
108
living in these settlements was forced to migrate to the city due to violence4, the levels of
unemployment and poverty are very high. I concentrate my analysis in the Santa Cruz and Popular
comunas, located in the northeastern part of the city of Medellin.
The Santa Cruz and Popular comunas
The first neighborhoods located in the area that today constitutes the Santa Cruz and Popular
comunas were constructed between 1940 and 1960. During these decades most of the occupation
was done following common informal urbanization techniques of the time: Pirate Urbanizations. In
the sixties new neighborhoods appeared filling the spaces left by previous urbanization. However,
some of them like Villa Niza and Villa Socorro, did not follow previous land–occupation forms
and were the product of public–housing projects. During the seventies, a pattern, that is still
visible, was established (EDU-DAP, 2005). The lower parts of the sector (mostly located in the
Santa Cruz comuna) were occupied with public–housing schemes or pirate urbanization settlements,
while the upper parts of the sector were occupied by squatters. During the eighties, there was a
further densification of the sector; new arrivals filled the spaces that had not yet been occupied
by the previous urbanization and in the last few decades the densification process continued.
Today, the sector‘s population continues to grow, at a lower rate, and new squatter settlements
have appeared in the upper part of the Popular comuna. Figure 1 shows the different forms of
occupation of the Santa Cruz and Popular comunas as well as their location in the city of Medellin.
Figure 1. Forms of land occupation in the Santa Cruz and Popular comunas
Source: adapted by author from (EDU-DAP, 2005)
4 In Colombia this phenomenon is called ―forced displacement‖ (desplazamiento forzado)
109
Urban Renewal Projects: Metrocable + Urban Integral Project
In the next two sections I evaluate the effects of two Urban Renewal Projects (URPs)
implemented in the city of Medellin by two different local administrations: the Northeastern
Metrocable line and the Northeastern Urban Integral Project, the first implemented during the Luis
Pérez administration and the second, during the Sergio Fajardo administration.
The 2001–2003 Luis Pérez Development Plan of the city of Medellin considered the
implementation of a new model of mobility supported by the existing Metro system but having
medium capacity and looking to improve the conditions of low–income households.
Concentrating a considerable percentage of the city‘s poor and having the highest population
densities, the Santa Cruz and Popular comunas were chosen for the development of the new model
of mobility. However, given the zone‘s topography and unorganized urbanization, the
establishment of traditional public–transport systems was very difficult and the Mayor‘s office
opted for an alternative approach: using aerial cable cars. In July 2004 the first Metrocable system
with three stations, connected to the Metro A line, started operating in the Santa Cruz and Popular
comunas. Calle 107 (Street 107), which divides the two comunas in half, was chosen as the axis for
the Metrocable trace following technical recommendations and to assure an efficient delivery of the
public–transportation service.
With the arrival of Sergio Fajardo to the city‘s administration in 2004, a new wave of
thoughts was introduced to the city management that became the basis for the creation of Urban
Integral Projects. Line 3 of Fajardo‘s Development Plan had as its objective “to bring equal
opportunities to all of the territory, make urban integral interventions in the city to pay for the accumulated social
debt and stimulate positive socio–cultural changes in the population”. A number of scholars and architects
were designated to lead these actions to conceive a model for urban intervention in poor
settlements. Since the previous administration had constructed the new Metrocable system in the
Santa Cruz and Popular comunas, they decided to implement the first Urban Integral Project5 in this
area. The main objective of the UIP according to the EDU6 was to ―Improve households‟ living
conditions through the implementation of comprehensive development initiatives that bring together the local
administration and communities‖ (Echeverri Restrepo and Orsini, 2010). The project, lead by the
EDU, involved more than 16 entities at the local level, among which are the following secretaries:
Treasury, Public Works, Education; Solidarity and Civic Culture and Environment. The criteria
5 Today, three more Urban Integral Projects (Comuna 13, Centro–Oriental and Noroccidental) are being implemented in the city. Urban Integral Projects in the city of Medellin have been recognized by a number of international organizations and awarded half a dozen urban planning and architectural prizes (Holcim Awards Gold 2008, 2009 City of Barcelona FAD Award, Curry Stone Design 2009…). 6 The Medellín Urban Development Enterprise–Empresa de Desarrollo Urbano de Medellín
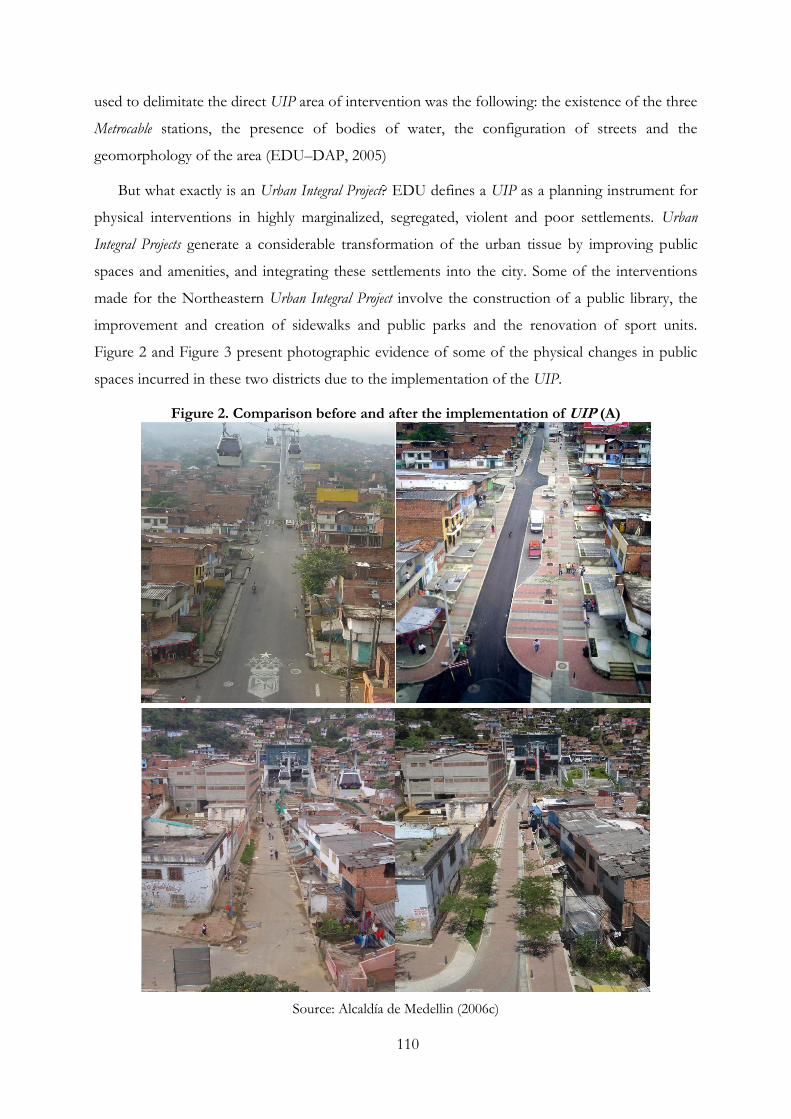
110
used to delimitate the direct UIP area of intervention was the following: the existence of the three
Metrocable stations, the presence of bodies of water, the configuration of streets and the
geomorphology of the area (EDU–DAP, 2005)
But what exactly is an Urban Integral Project? EDU defines a UIP as a planning instrument for
physical interventions in highly marginalized, segregated, violent and poor settlements. Urban
Integral Projects generate a considerable transformation of the urban tissue by improving public
spaces and amenities, and integrating these settlements into the city. Some of the interventions
made for the Northeastern Urban Integral Project involve the construction of a public library, the
improvement and creation of sidewalks and public parks and the renovation of sport units.
Figure 2 and Figure 3 present photographic evidence of some of the physical changes in public
spaces incurred in these two districts due to the implementation of the UIP.
Figure 2. Comparison before and after the implementation of UIP (A)
Source: Alcaldía de Medellin (2006c)
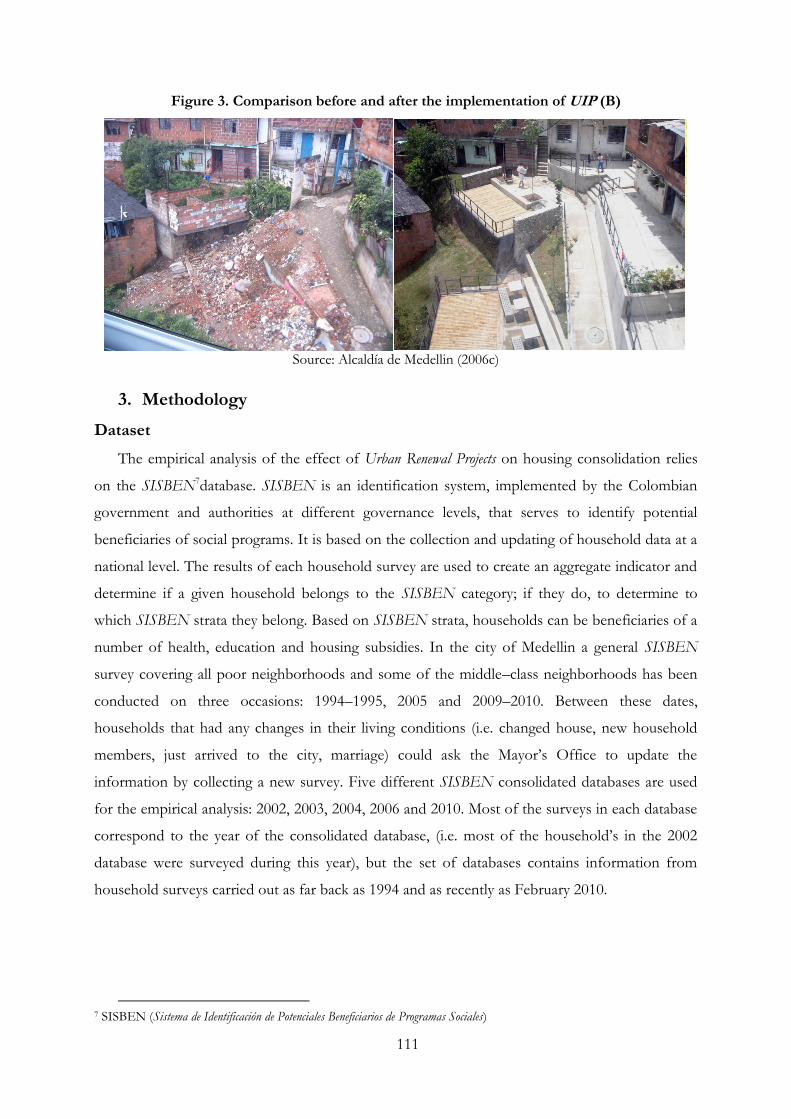
111
Figure 3. Comparison before and after the implementation of UIP (B)
Source: Alcaldía de Medellin (2006c)
3. Methodology
Dataset
The empirical analysis of the effect of Urban Renewal Projects on housing consolidation relies
on the SISBEN7database. SISBEN is an identification system, implemented by the Colombian
government and authorities at different governance levels, that serves to identify potential
beneficiaries of social programs. It is based on the collection and updating of household data at a
national level. The results of each household survey are used to create an aggregate indicator and
determine if a given household belongs to the SISBEN category; if they do, to determine to
which SISBEN strata they belong. Based on SISBEN strata, households can be beneficiaries of a
number of health, education and housing subsidies. In the city of Medellin a general SISBEN
survey covering all poor neighborhoods and some of the middle–class neighborhoods has been
conducted on three occasions: 1994–1995, 2005 and 2009–2010. Between these dates,
households that had any changes in their living conditions (i.e. changed house, new household
members, just arrived to the city, marriage) could ask the Mayor‘s Office to update the
information by collecting a new survey. Five different SISBEN consolidated databases are used
for the empirical analysis: 2002, 2003, 2004, 2006 and 2010. Most of the surveys in each database
correspond to the year of the consolidated database, (i.e. most of the household‘s in the 2002
database were surveyed during this year), but the set of databases contains information from
household surveys carried out as far back as 1994 and as recently as February 2010.
7 SISBEN (Sistema de Identificación de Potenciales Beneficiarios de Programas Sociales)
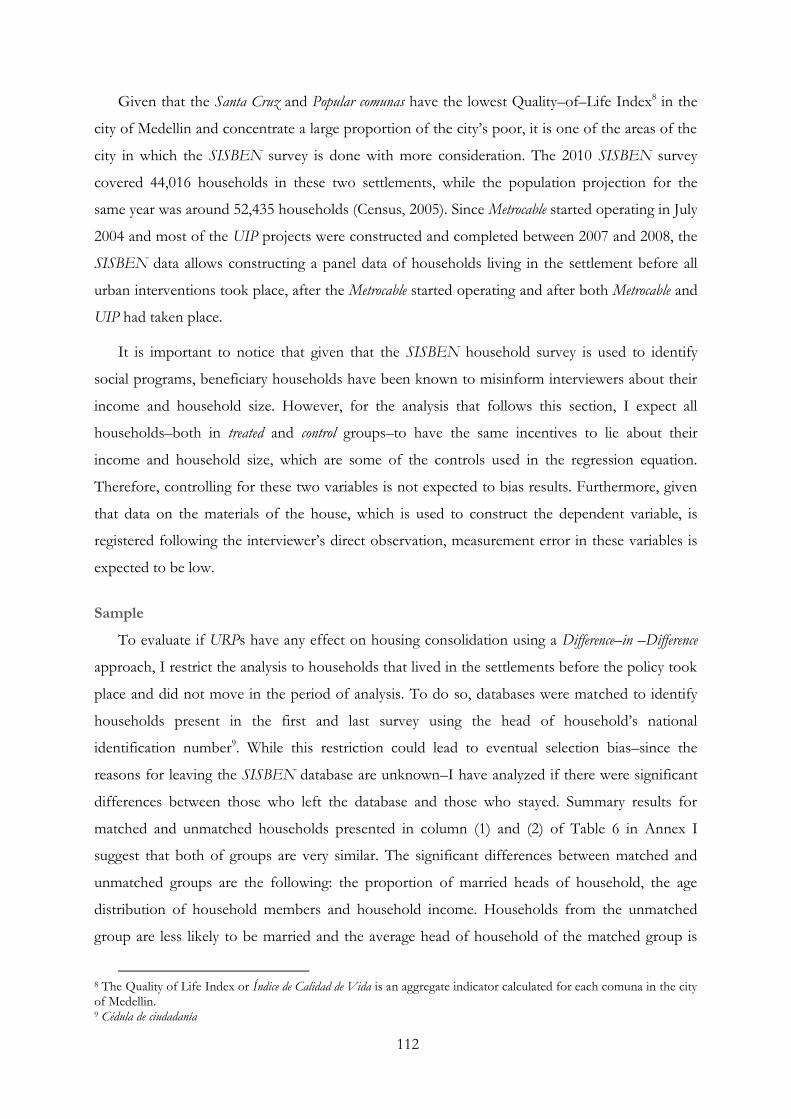
112
Given that the Santa Cruz and Popular comunas have the lowest Quality–of–Life Index8 in the
city of Medellin and concentrate a large proportion of the city‘s poor, it is one of the areas of the
city in which the SISBEN survey is done with more consideration. The 2010 SISBEN survey
covered 44,016 households in these two settlements, while the population projection for the
same year was around 52,435 households (Census, 2005). Since Metrocable started operating in July
2004 and most of the UIP projects were constructed and completed between 2007 and 2008, the
SISBEN data allows constructing a panel data of households living in the settlement before all
urban interventions took place, after the Metrocable started operating and after both Metrocable and
UIP had taken place.
It is important to notice that given that the SISBEN household survey is used to identify
social programs, beneficiary households have been known to misinform interviewers about their
income and household size. However, for the analysis that follows this section, I expect all
households–both in treated and control groups–to have the same incentives to lie about their
income and household size, which are some of the controls used in the regression equation.
Therefore, controlling for these two variables is not expected to bias results. Furthermore, given
that data on the materials of the house, which is used to construct the dependent variable, is
registered following the interviewer‘s direct observation, measurement error in these variables is
expected to be low.
Sample
To evaluate if URPs have any effect on housing consolidation using a Difference–in –Difference
approach, I restrict the analysis to households that lived in the settlements before the policy took
place and did not move in the period of analysis. To do so, databases were matched to identify
households present in the first and last survey using the head of household‘s national
identification number9. While this restriction could lead to eventual selection bias–since the
reasons for leaving the SISBEN database are unknown–I have analyzed if there were significant
differences between those who left the database and those who stayed. Summary results for
matched and unmatched households presented in column (1) and (2) of Table 6 in Annex I
suggest that both of groups are very similar. The significant differences between matched and
unmatched groups are the following: the proportion of married heads of household, the age
distribution of household members and household income. Households from the unmatched
group are less likely to be married and the average head of household of the matched group is
8 The Quality of Life Index or Índice de Calidad de Vida is an aggregate indicator calculated for each comuna in the city of Medellin. 9 Cédula de ciudadanía
113
about 3–4 years older than the unmatched head of household. Since unmarried households and
younger households are more mobile, this might be one of the causes for not finding a match
between databases.
In addition, since the main objective of the study is to measure changes in the level of
consolidation of houses, it was necessary to restrain the analysis to households that had not
moved during the period of analysis. I make use of two different controls. The first control I use
is the land telephone number. While there is the possibility of households moving to another
house and keeping the same land telephone number, the local telephone company (UNE)
assured us that this involved a very complicated procedure and that it was only possible when
households were moving very close to their original dwelling. Therefore the bias induced by
using this information is expected to be low. The second control I use, for households that do
not report having a land telephone number, is household‘s address; this was done manually. As
mentioned before, during the time of study a housing upgrading program10 was carried out in one
small area of the Santa Cruz comuna. To avoid bias, all households living in this area were
eliminated from the database. Matching the head–of–household national identification number, I
found that 20,836 of the households present in the 2010 database were also present in the 2002–
2003 databases11. Controlling for land telephone number and address, I further restrict the
analysis to 10,457 households, for which I can have a high degree of certainty that they were
living in the settlement before URP started and have not changed of house since.
Treatment
The following procedure was used to identify a household‘s location in relation to the URP
area of intervention and define treatment variables:
(1) Geographical coordinates were obtained for each of the households, using the
reported address and the Medellin MapGIS free–use application
<http://www.medellin.gov.co/MapGIS/web/swf/MAPGIS_FLEX.jsp>
(2) Administrative maps were obtained from the Mayor‘s Office; maps containing the
exact location of the Metrocable line and stations and the direct area of intervention of
the UIPs were obtained from the Empresa de Desarrollo Urbano.
(3) Distance to the closest Metrocable station ( ) was calculated for each of the
households.
10 Proyecto Habitacional Juan Bobo 11 The restriction of the analysis to almost half of the initial matched database might seem a little radical. However, the difficulty of matching telephones and addresses in a marginal and semi–informal settlement needs to be taken into consideration. For instance on many occasions no exact address is reported and one finds information such as ―In front of House #5 on Street 110‖ or ―neighbor‘s telephone: 311XXXX‖ which makes it almost impossible to assure that households have not moved by matching addresses and/or telephones from different databases.
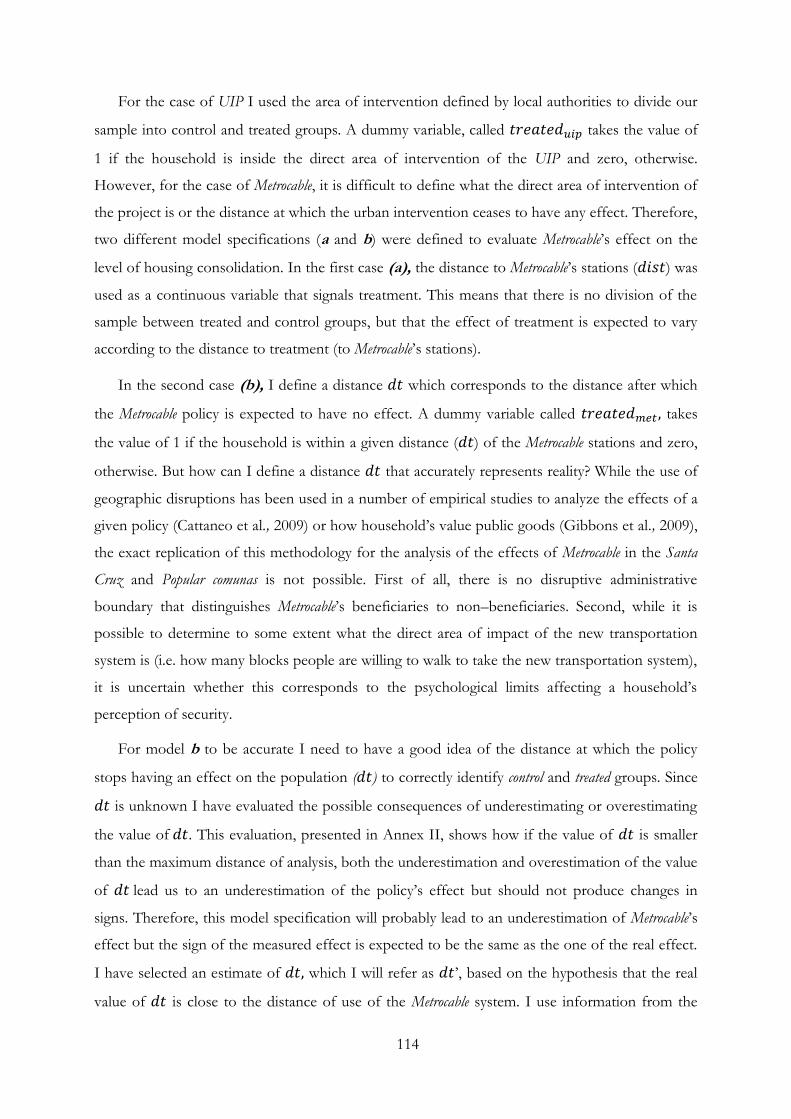
114
For the case of UIP I used the area of intervention defined by local authorities to divide our
sample into control and treated groups. A dummy variable, called takes the value of
1 if the household is inside the direct area of intervention of the UIP and zero, otherwise.
However, for the case of Metrocable, it is difficult to define what the direct area of intervention of
the project is or the distance at which the urban intervention ceases to have any effect. Therefore,
two different model specifications (a and b) were defined to evaluate Metrocable‘s effect on the
level of housing consolidation. In the first case (a), the distance to Metrocable‘s stations ( ) was
used as a continuous variable that signals treatment. This means that there is no division of the
sample between treated and control groups, but that the effect of treatment is expected to vary
according to the distance to treatment (to Metrocable‘s stations).
In the second case (b), I define a distance which corresponds to the distance after which
the Metrocable policy is expected to have no effect. A dummy variable called takes
the value of 1 if the household is within a given distance ( ) of the Metrocable stations and zero,
otherwise. But how can I define a distance that accurately represents reality? While the use of
geographic disruptions has been used in a number of empirical studies to analyze the effects of a
given policy (Cattaneo et al., 2009) or how household‘s value public goods (Gibbons et al., 2009),
the exact replication of this methodology for the analysis of the effects of Metrocable in the Santa
Cruz and Popular comunas is not possible. First of all, there is no disruptive administrative
boundary that distinguishes Metrocable‘s beneficiaries to non–beneficiaries. Second, while it is
possible to determine to some extent what the direct area of impact of the new transportation
system is (i.e. how many blocks people are willing to walk to take the new transportation system),
it is uncertain whether this corresponds to the psychological limits affecting a household‘s
perception of security.
For model b to be accurate I need to have a good idea of the distance at which the policy
stops having an effect on the population ( ) to correctly identify control and treated groups. Since
is unknown I have evaluated the possible consequences of underestimating or overestimating
the value of . This evaluation, presented in Annex II, shows how if the value of is smaller
than the maximum distance of analysis, both the underestimation and overestimation of the value
of lead us to an underestimation of the policy‘s effect but should not produce changes in
signs. Therefore, this model specification will probably lead to an underestimation of Metrocable‘s
effect but the sign of the measured effect is expected to be the same as the one of the real effect.
I have selected an estimate of which I will refer as ‘, based on the hypothesis that the real
value of is close to the distance of use of the Metrocable system. I use information from the
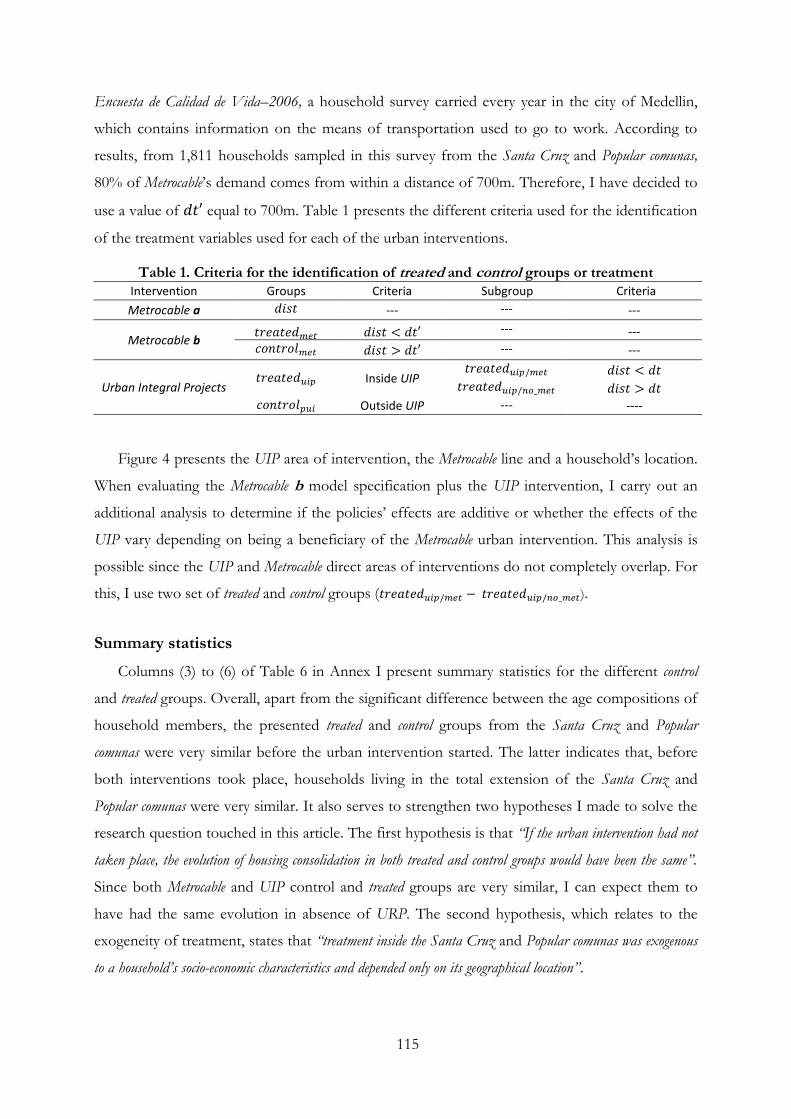
115
Encuesta de Calidad de Vida–2006, a household survey carried every year in the city of Medellin,
which contains information on the means of transportation used to go to work. According to
results, from 1,811 households sampled in this survey from the Santa Cruz and Popular comunas,
80% of Metrocable‘s demand comes from within a distance of 700m. Therefore, I have decided to
use a value of equal to 700m. Table 1 presents the different criteria used for the identification
of the treatment variables used for each of the urban interventions.
Table 1. Criteria for the identification of treated and control groups or treatment
Intervention Groups Criteria Subgroup Criteria
Metrocable a --- --- ---
Metrocable b --- ---
--- ---
Urban Integral Projects Inside UIP
Outside UIP --- ----
Figure 4 presents the UIP area of intervention, the Metrocable line and a household‘s location.
When evaluating the Metrocable b model specification plus the UIP intervention, I carry out an
additional analysis to determine if the policies‘ effects are additive or whether the effects of the
UIP vary depending on being a beneficiary of the Metrocable urban intervention. This analysis is
possible since the UIP and Metrocable direct areas of interventions do not completely overlap. For
this, I use two set of treated and control groups ( ).
Summary statistics
Columns (3) to (6) of Table 6 in Annex I present summary statistics for the different control
and treated groups. Overall, apart from the significant difference between the age compositions of
household members, the presented treated and control groups from the Santa Cruz and Popular
comunas were very similar before the urban intervention started. The latter indicates that, before
both interventions took place, households living in the total extension of the Santa Cruz and
Popular comunas were very similar. It also serves to strengthen two hypotheses I made to solve the
research question touched in this article. The first hypothesis is that “If the urban intervention had not
taken place, the evolution of housing consolidation in both treated and control groups would have been the same”.
Since both Metrocable and UIP control and treated groups are very similar, I can expect them to
have had the same evolution in absence of URP. The second hypothesis, which relates to the
exogeneity of treatment, states that “treatment inside the Santa Cruz and Popular comunas was exogenous
to a household‟s socio-economic characteristics and depended only on its geographical location”.
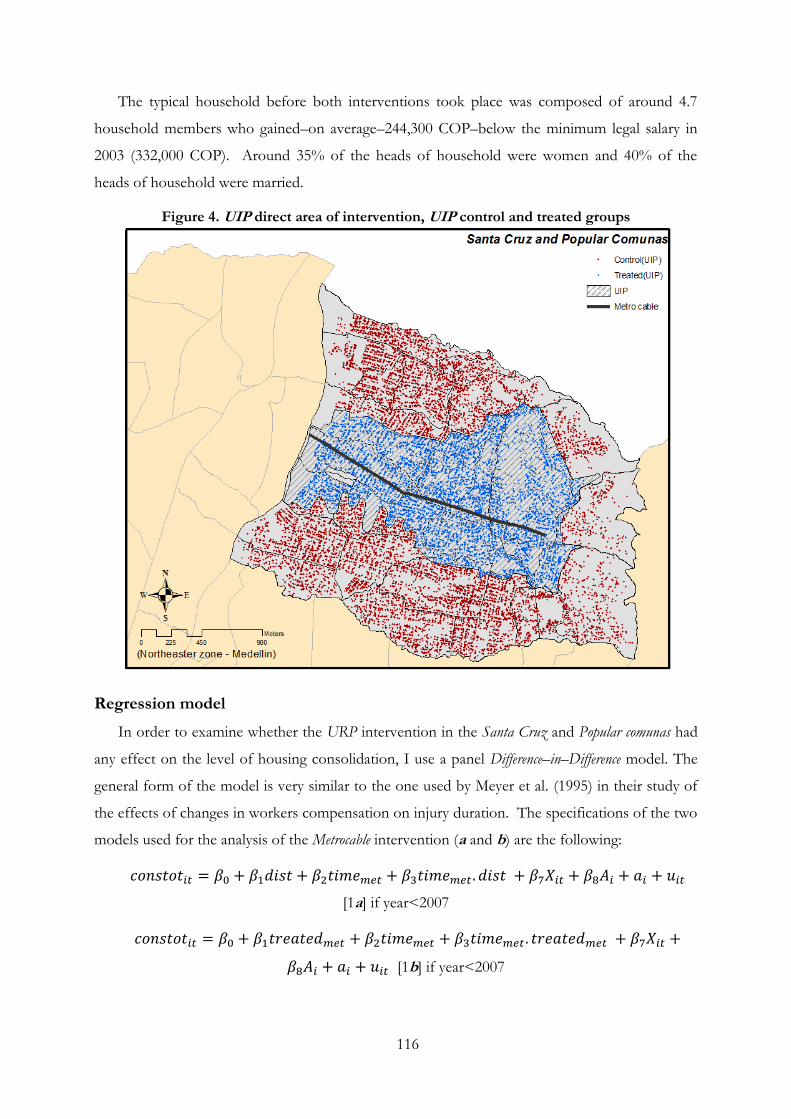
116
The typical household before both interventions took place was composed of around 4.7
household members who gained–on average–244,300 COP–below the minimum legal salary in
2003 (332,000 COP). Around 35% of the heads of household were women and 40% of the
heads of household were married.
Figure 4. UIP direct area of intervention, UIP control and treated groups
Regression model
In order to examine whether the URP intervention in the Santa Cruz and Popular comunas had
any effect on the level of housing consolidation, I use a panel Difference–in–Difference model. The
general form of the model is very similar to the one used by Meyer et al. (1995) in their study of
the effects of changes in workers compensation on injury duration. The specifications of the two
models used for the analysis of the Metrocable intervention (a and b) are the following:
[1a] if year<2007
[1b] if year<2007
117
The analysis of the Metrocable and UIP intervention together is done with the following model
specifications:
[2a]
[2b]
The aggregate dependent variable in all the model specifications is equal to 1 if the
house is consolidated and zero, otherwise. This variable was constructed from the information
provided in SISBEN surveys on predominant material of external walls and interior floors. Each
of the floor and wall materials (i.e. carton, wood, bricks, and cement) was classified accordingly.
Consolidated houses have both their external walls and floors made of long–lasting materials. I
use a probit model in which the succeed event is having a consolidated house; therefore, the
coefficients represent the effect of each of the explanatory variables on the probability of having
a consolidated house.
In equations [1-2a] I use the distance to Metrocable stations as a proxy for treatment. On
the contrary, in equations [1-2b] the dummy variable serves to identify treated
individuals from the Metrocable intervention according to the maximum distance to treatment
criteria. In [2a-b] models is a dummy variable that identifies treated individuals from
UIP intervention. Timemet and timeUIP are dummy variables that identify the year in which each of
the interventions was completed (I use 2004 for Metrocable and 2008 for UIP) and
and are the variables of interest that
will indicate if the policies had any effect on the probability of living in a consolidated house.
and are, respectively, vectors of time–variant and time–invariant individual and
household characteristics to control for other elements that might affect the probability of living
in a consolidated house. Among the time–invariant control variables, I include head of household
gender and marital status and if the household states to be at risk from natural disasters. Among
the time–variant control variables, I include household size, household or head–of–household
income and number of members under 10 years old. Households with a higher income are
expected to have a higher probability of living in a consolidated house. In the same way, I control
for the existence of older household members who can be used as labor income since on many
occasions houses are self–made. Field (2007) and Lanjow and Levy (2002) find that levels of
tenure security are variable among urban communities; years of residence could positively affect
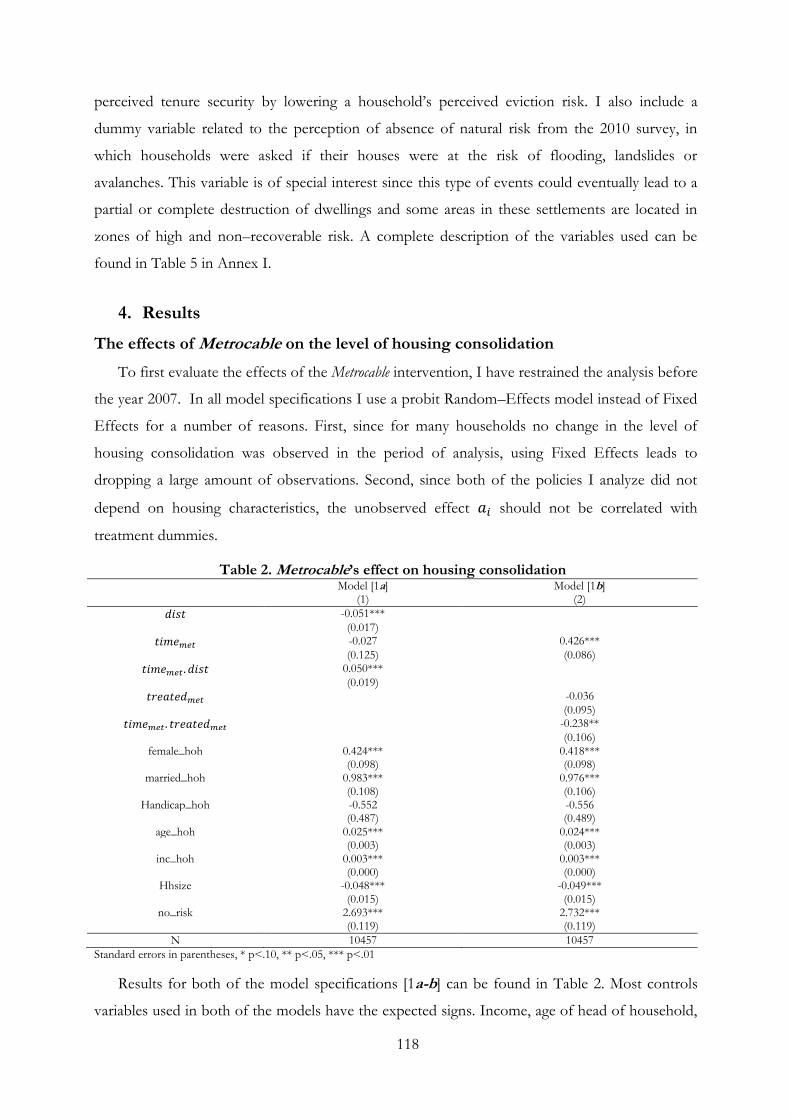
118
perceived tenure security by lowering a household‘s perceived eviction risk. I also include a
dummy variable related to the perception of absence of natural risk from the 2010 survey, in
which households were asked if their houses were at the risk of flooding, landslides or
avalanches. This variable is of special interest since this type of events could eventually lead to a
partial or complete destruction of dwellings and some areas in these settlements are located in
zones of high and non–recoverable risk. A complete description of the variables used can be
found in Table 5 in Annex I.
4. Results
The effects of Metrocable on the level of housing consolidation
To first evaluate the effects of the Metrocable intervention, I have restrained the analysis before
the year 2007. In all model specifications I use a probit Random–Effects model instead of Fixed
Effects for a number of reasons. First, since for many households no change in the level of
housing consolidation was observed in the period of analysis, using Fixed Effects leads to
dropping a large amount of observations. Second, since both of the policies I analyze did not
depend on housing characteristics, the unobserved effect should not be correlated with
treatment dummies.
Table 2. Metrocable’s effect on housing consolidation Model [1a]
(1) Model [1b]
(2)
-0.051***
(0.017)
-0.027 0.426***
(0.125) (0.086)
0.050***
(0.019)
-0.036
(0.095)
-0.238**
(0.106) female_hoh 0.424*** 0.418***
(0.098) (0.098) married_hoh 0.983*** 0.976***
(0.108) (0.106) Handicap_hoh -0.552 -0.556
(0.487) (0.489) age_hoh 0.025*** 0.024***
(0.003) (0.003) inc_hoh 0.003*** 0.003***
(0.000) (0.000) Hhsize -0.048*** -0.049***
(0.015) (0.015) no_risk 2.693*** 2.732***
(0.119) (0.119)
N 10457 10457
Standard errors in parentheses, * p<.10, ** p<.05, *** p<.01
Results for both of the model specifications [1a-b] can be found in Table 2. Most controls
variables used in both of the models have the expected signs. Income, age of head of household,
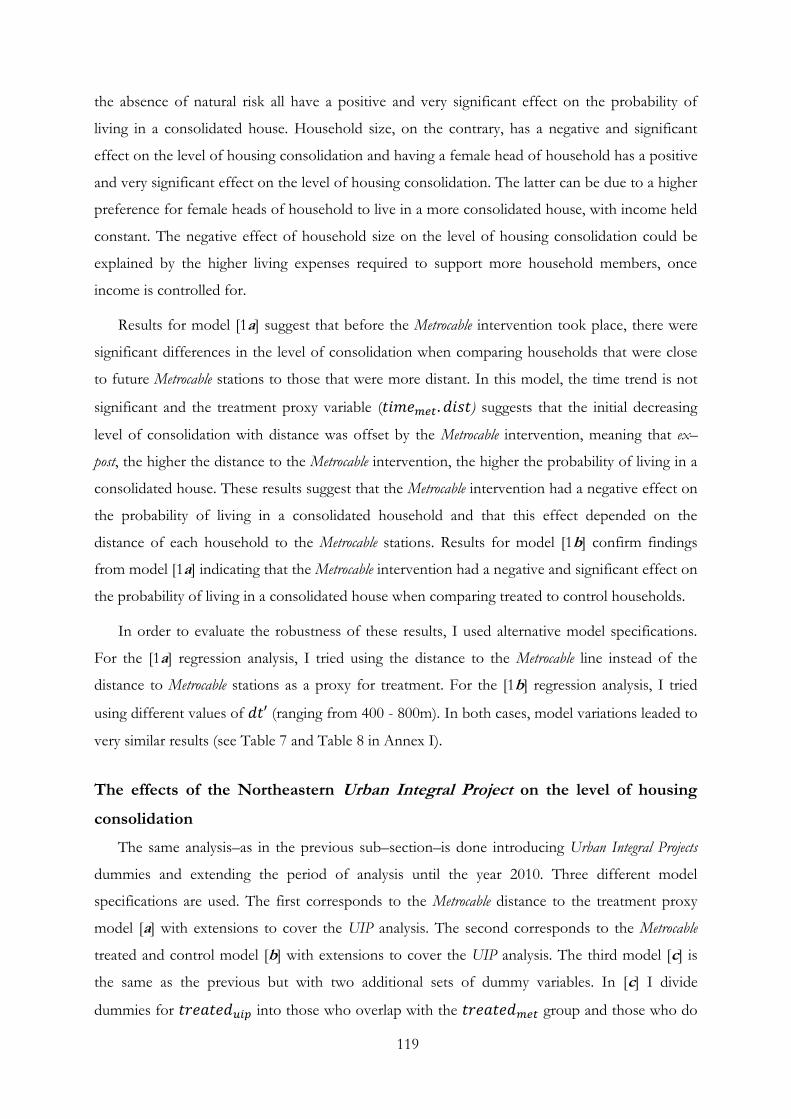
119
the absence of natural risk all have a positive and very significant effect on the probability of
living in a consolidated house. Household size, on the contrary, has a negative and significant
effect on the level of housing consolidation and having a female head of household has a positive
and very significant effect on the level of housing consolidation. The latter can be due to a higher
preference for female heads of household to live in a more consolidated house, with income held
constant. The negative effect of household size on the level of housing consolidation could be
explained by the higher living expenses required to support more household members, once
income is controlled for.
Results for model [1a] suggest that before the Metrocable intervention took place, there were
significant differences in the level of consolidation when comparing households that were close
to future Metrocable stations to those that were more distant. In this model, the time trend is not
significant and the treatment proxy variable ( ) suggests that the initial decreasing
level of consolidation with distance was offset by the Metrocable intervention, meaning that ex–
post, the higher the distance to the Metrocable intervention, the higher the probability of living in a
consolidated house. These results suggest that the Metrocable intervention had a negative effect on
the probability of living in a consolidated household and that this effect depended on the
distance of each household to the Metrocable stations. Results for model [1b] confirm findings
from model [1a] indicating that the Metrocable intervention had a negative and significant effect on
the probability of living in a consolidated house when comparing treated to control households.
In order to evaluate the robustness of these results, I used alternative model specifications.
For the [1a] regression analysis, I tried using the distance to the Metrocable line instead of the
distance to Metrocable stations as a proxy for treatment. For the [1b] regression analysis, I tried
using different values of (ranging from 400 - 800m). In both cases, model variations leaded to
very similar results (see Table 7 and Table 8 in Annex I).
The effects of the Northeastern Urban Integral Project on the level of housing
consolidation
The same analysis–as in the previous sub–section–is done introducing Urban Integral Projects
dummies and extending the period of analysis until the year 2010. Three different model
specifications are used. The first corresponds to the Metrocable distance to the treatment proxy
model [a] with extensions to cover the UIP analysis. The second corresponds to the Metrocable
treated and control model [b] with extensions to cover the UIP analysis. The third model [c] is
the same as the previous but with two additional sets of dummy variables. In [c] I divide
dummies for into those who overlap with the group and those who do
120
not overlap. This model specification allows evaluating if the effects of UIP vary according to the
Metrocable‘s treatment:
Results for the three model specifications are presented in Table 3. I use the same controls as
in Table 2 but have not included them to avoid extensions. In all model specifications I find that
the UIP intervention had no significant effect on the probability of living in a consolidated house.
The effect of Metrocable intervention on the level of housing consolidation is still negative and
very significant. Furthermore, the [2c] model presented in column (3) of Table 3 suggests that the
UIP intervention had no significant effect on the level of housing consolidation, independent of
being a beneficiary of the Metrocable intervention or not.
Table 3. Metrocable’s and UIP’s effect on housing consolidation Model [2a]
(1) Model [2b]
(2) Model [2c]
(3)
0.033
(0.023)
0.010 0.487*** 0.491***
(0.128) (0.085) (0.086)
0.055***
(0.019)
-0.381*** -0.466***
(0.106) (0.108)
-0.226** -0.228**
(0.104) (0.104)
0.777*** 0.789***
(0.125) (0.104)
0.158* 0.173* 0.174*
(0.092) (0.091) (0.091)
-0.132 -0.184
(0.161) (0.159)
0.885***
(0.107)
-0.558
(0.368)
-0.186
(0.162)
-0.172
(0.607)
n 10457 10457 10457
Standard errors in parentheses, * p<.10, ** p<.05, *** p<.01
The difference in results from the two URP interventions can be explained by the differences
in the local authority‘s attitude in the implementation of UIP when compared to the Metrocable
121
intervention. As previously mentioned, two contrary mechanisms might be at the core of the
evolutions in the level of housing consolidation due to URP. The first, which might lead to
increase investments in housing, is produced when URP interventions are interpreted by the local
community as an ―acceptance‖ or ―semi–formalization‖ of the settlement generating higher
perceptions of security. The second, which might lead to a decrease of housing investments, is
produced when the higher presence of local authorities (the law)–along with the expropriation of
some properties during infrastructure construction–is seen as a ―menace‖ by the local community
which reduces perception of security. UIP, contrary to the Metrocable intervention, was done with
a high degree of community participation, which generated a friendlier environment. Therefore, it
is possible that the external shock in the presence of state generated by the UIP intervention
could have generated compensation between the ―acceptance effect‖ and the ―menace effect‖.
Tenure security and forms of occupation
So far I have evaluated whether the URP implemented in the Santa Cruz and Popular comunas
have had any effect on housing consolidation for all households, regardless of their tenure
security or form of occupation. Results suggest the Metrocable intervention had a negative and
significant effect on the probability of living in a consolidated house and the UIP intervention
had non–significant effect. However, the causal mechanisms which produce this effect have not
been discussed. As I mentioned in the introduction, the most probable cause for a household‘s
investment changes due to the implementation of policy is the variation of the perception of risk
of eviction for households having insecure tenure over their houses. Nevertheless, as discussed in
section 2, the Santa Cruz and Popular comunas are home to a variety of communities with different
forms of tenure. Therefore, I carry out the same analysis as in the previous two sub–sections
differentiating, tenure security and type of occupation.
Information on tenure security (informal or formal occupation) was created by the author by
observing housing and neighborhood urbanization structure (organized versus disorganized
forms) viewing the layout of settlements using Geographical Information Systems (GIS). The
different forms of type of occupation (public housing, pirate urbanization and squatters) correspond
to the historic forms of urbanization of each neighborhood discussed in section 2. Results
presented in Table 4 correspond to the 2b model specification and use the same control variables
as in the previous analysis; however, the latter were not presented to avoid extensions. The same
analysis, using the 2b model specification was also done with similar results and can be found in
Table 9 in Annex I.
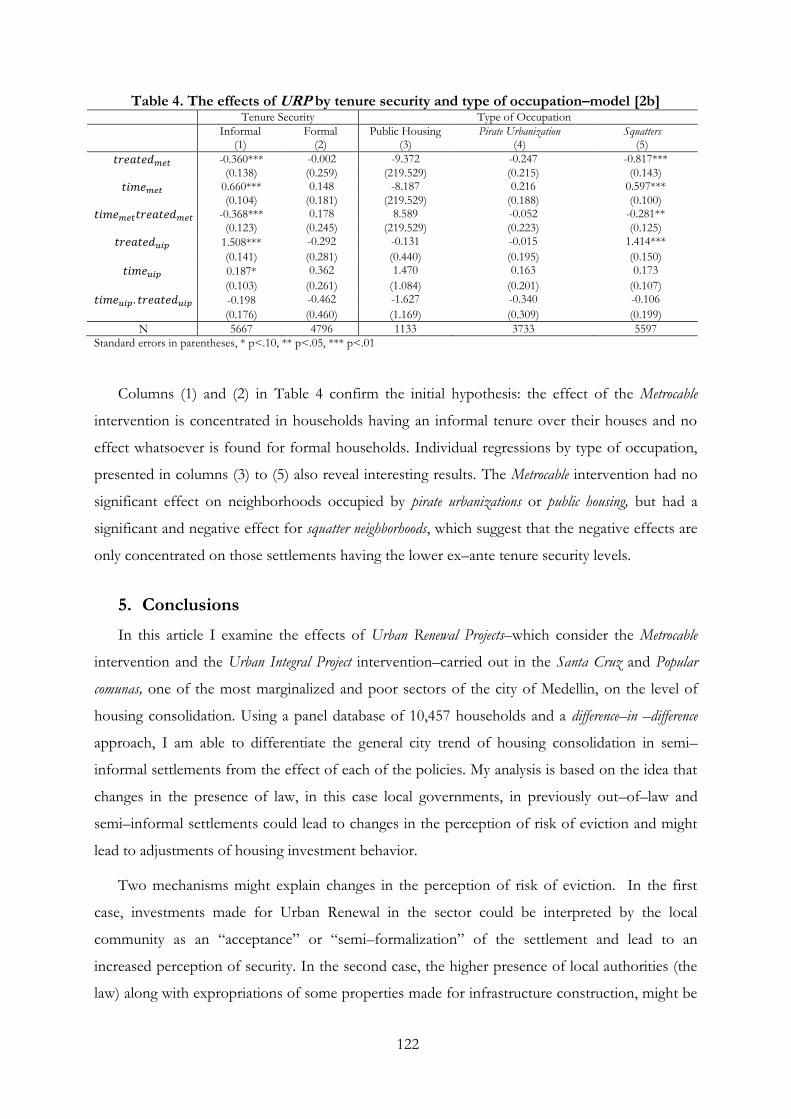
122
Table 4. The effects of URP by tenure security and type of occupation–model [2b] Tenure Security Type of Occupation
Informal (1)
Formal (2)
Public Housing (3)
Pirate Urbanization (4)
Squatters (5)
-0.360*** -0.002 -9.372 -0.247 -0.817***
(0.138) (0.259) (219.529) (0.215) (0.143)
0.660*** 0.148 -8.187 0.216 0.597***
(0.104) (0.181) (219.529) (0.188) (0.100)
-0.368*** 0.178 8.589 -0.052 -0.281**
(0.123) (0.245) (219.529) (0.223) (0.125)
1.508*** -0.292 -0.131 -0.015 1.414***
(0.141) (0.281) (0.440) (0.195) (0.150)
0.187* 0.362 1.470 0.163 0.173
(0.103) (0.261) (1.084) (0.201) (0.107)
-0.198 -0.462 -1.627 -0.340 -0.106
(0.176) (0.460) (1.169) (0.309) (0.199)
N 5667 4796 1133 3733 5597
Standard errors in parentheses, * p<.10, ** p<.05, *** p<.01
Columns (1) and (2) in Table 4 confirm the initial hypothesis: the effect of the Metrocable
intervention is concentrated in households having an informal tenure over their houses and no
effect whatsoever is found for formal households. Individual regressions by type of occupation,
presented in columns (3) to (5) also reveal interesting results. The Metrocable intervention had no
significant effect on neighborhoods occupied by pirate urbanizations or public housing, but had a
significant and negative effect for squatter neighborhoods, which suggest that the negative effects are
only concentrated on those settlements having the lower ex–ante tenure security levels.
5. Conclusions
In this article I examine the effects of Urban Renewal Projects–which consider the Metrocable
intervention and the Urban Integral Project intervention–carried out in the Santa Cruz and Popular
comunas, one of the most marginalized and poor sectors of the city of Medellin, on the level of
housing consolidation. Using a panel database of 10,457 households and a difference–in –difference
approach, I am able to differentiate the general city trend of housing consolidation in semi–
informal settlements from the effect of each of the policies. My analysis is based on the idea that
changes in the presence of law, in this case local governments, in previously out–of–law and
semi–informal settlements could lead to changes in the perception of risk of eviction and might
lead to adjustments of housing investment behavior.
Two mechanisms might explain changes in the perception of risk of eviction. In the first
case, investments made for Urban Renewal in the sector could be interpreted by the local
community as an ―acceptance‖ or ―semi–formalization‖ of the settlement and lead to an
increased perception of security. In the second case, the higher presence of local authorities (the
law) along with expropriations of some properties made for infrastructure construction, might be
123
seen as a ―menace‖ and generate higher levels of uncertainty for local communities and reduce
their perception of security. My analysis reveals that–in the case of the Metrocable policy–it is the
second effect that dominates.
To test the set hypothesis I used two models in the case of the Metrocable interventions, the
first using a binary indicator of treatment based on an estimation of the maximum distance at
which the policy had an effect, and the second using the distance to Metrocable stations as a proxy
for treatment. Both model specifications indicated a negative and significant effect on the
probability of living in a consolidated house of the Metrocable intervention and no significant
effect of the Urban Integral Projects. The absence of effect of Urban Integral Projects can be due to the
integration of the local community in the implementation of projects, which might have led to a
balance between the ―acceptance‖ and ―menace‖ mechanisms previously mentioned. A more
specific analysis of the effects of both the urban intervention using tenure status and forms of
occupation indicated that the effect of the Metrocable policy was only significant for squatter
households. No effect was found on settlements occupied by pirate urbanizations, confirming that
their semi–formal form of occupation and perception security is not affected by URP.
Results confirm theory on the correlation between insecurity of tenure and housing
investments and indicate that not only changes from informal to formal tenure systems produce
changes in a households‘ housing–investment behavior. In the case analyzed, the higher presence
of the local government due to the Metrocable intervention was sufficient to produce changes in
housing investments. Urban Renewal Projects and especially Urban Integral Projects carried out in the
city of Medellin are–without a doubt–one of the most innovative slum policies of the last decade.
They allow local government to concentrate its efforts in a given area and transform the urban
tissue. However, this article has revealed how fragile the equilibrium of tenure perception in
marginalized and semi–informal areas is and how easily it can be disrupted by the action of the
local government.
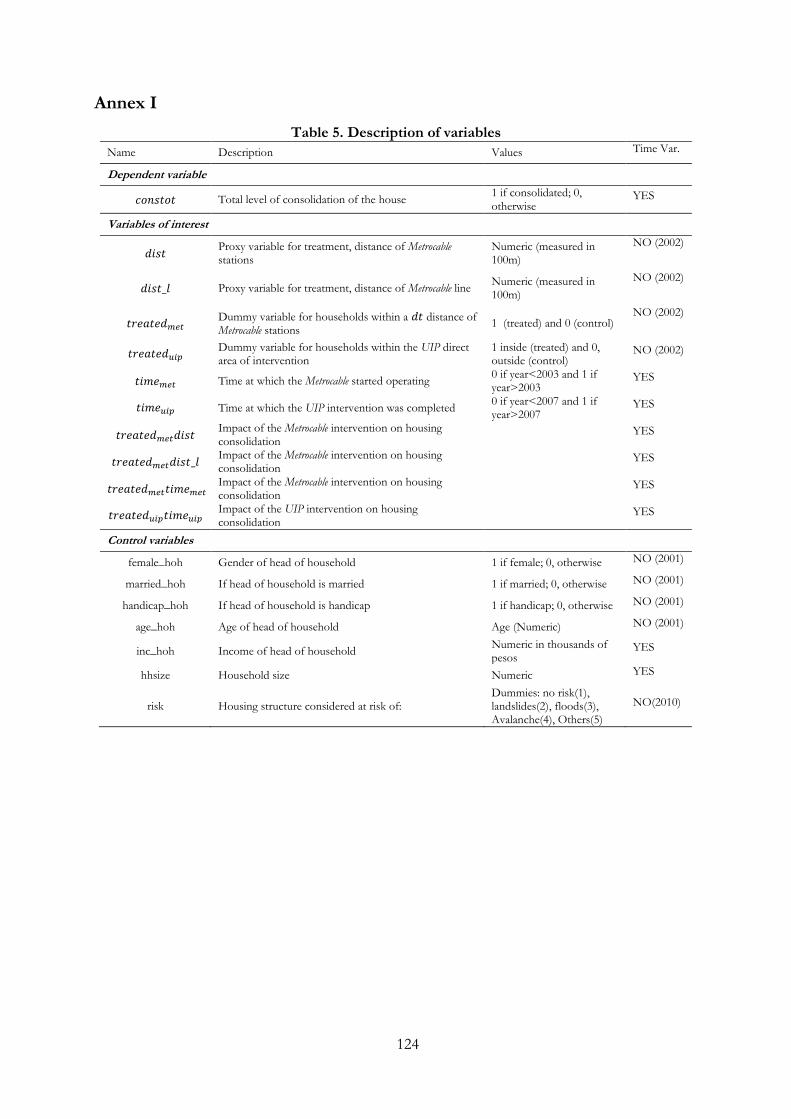
124
Annex I
Table 5. Description of variables
Name Description Values Time Var.
Dependent variable
Total level of consolidation of the house 1 if consolidated; 0, otherwise
YES
Variables of interest
Proxy variable for treatment, distance of Metrocable stations
Numeric (measured in 100m)
NO (2002)
Proxy variable for treatment, distance of Metrocable line Numeric (measured in 100m)
NO (2002)
Dummy variable for households within a distance of Metrocable stations
1 (treated) and 0 (control) NO (2002)
Dummy variable for households within the UIP direct area of intervention
1 inside (treated) and 0, outside (control)
NO (2002)
Time at which the Metrocable started operating 0 if year<2003 and 1 if year>2003
YES
Time at which the UIP intervention was completed 0 if year<2007 and 1 if year>2007
YES
Impact of the Metrocable intervention on housing consolidation
YES
Impact of the Metrocable intervention on housing consolidation
YES
Impact of the Metrocable intervention on housing consolidation
YES
Impact of the UIP intervention on housing consolidation
YES
Control variables
female_hoh Gender of head of household 1 if female; 0, otherwise NO (2001)
married_hoh If head of household is married 1 if married; 0, otherwise NO (2001)
handicap_hoh If head of household is handicap 1 if handicap; 0, otherwise NO (2001)
age_hoh Age of head of household Age (Numeric) NO (2001)
inc_hoh Income of head of household Numeric in thousands of pesos
YES
hhsize Household size Numeric YES
risk Housing structure considered at risk of: Dummies: no risk(1), landslides(2), floods(3), Avalanche(4), Others(5)
NO(2010)
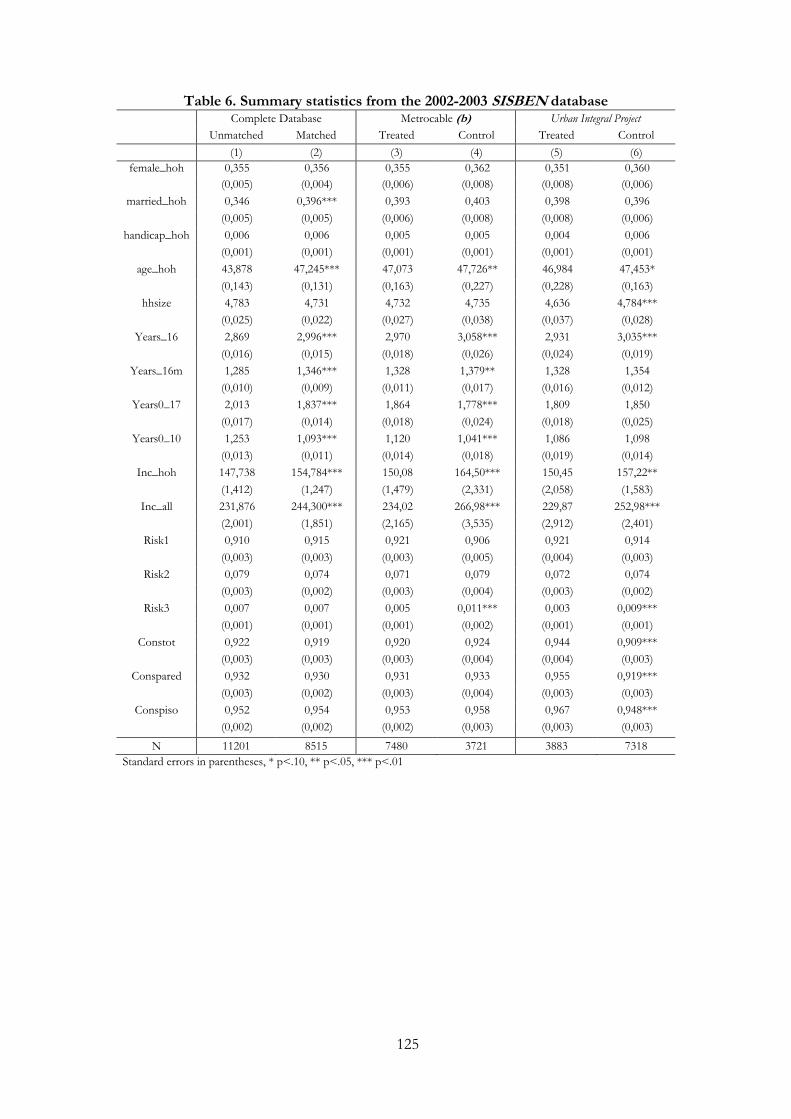
125
Table 6. Summary statistics from the 2002-2003 SISBEN database
Complete Database Metrocable (b) Urban Integral Project
Unmatched Matched Treated Control Treated Control
(1) (2) (3) (4) (5) (6)
female_hoh 0,355 0,356 0,355 0,362 0,351 0,360
(0,005) (0,004) (0,006) (0,008) (0,008) (0,006)
married_hoh 0,346 0,396*** 0,393 0,403 0,398 0,396
(0,005) (0,005) (0,006) (0,008) (0,008) (0,006)
handicap_hoh 0,006 0,006 0,005 0,005 0,004 0,006
(0,001) (0,001) (0,001) (0,001) (0,001) (0,001)
age_hoh 43,878 47,245*** 47,073 47,726** 46,984 47,453*
(0,143) (0,131) (0,163) (0,227) (0,228) (0,163)
hhsize 4,783 4,731 4,732 4,735 4,636 4,784***
(0,025) (0,022) (0,027) (0,038) (0,037) (0,028)
Years_16 2,869 2,996*** 2,970 3,058*** 2,931 3,035***
(0,016) (0,015) (0,018) (0,026) (0,024) (0,019)
Years_16m 1,285 1,346*** 1,328 1,379** 1,328 1,354
(0,010) (0,009) (0,011) (0,017) (0,016) (0,012)
Years0_17 2,013 1,837*** 1,864 1,778*** 1,809 1,850
(0,017) (0,014) (0,018) (0,024) (0,018) (0,025)
Years0_10 1,253 1,093*** 1,120 1,041*** 1,086 1,098
(0,013) (0,011) (0,014) (0,018) (0,019) (0,014)
Inc_hoh 147,738 154,784*** 150,08 164,50*** 150,45 157,22**
(1,412) (1,247) (1,479) (2,331) (2,058) (1,583)
Inc_all 231,876 244,300*** 234,02 266,98*** 229,87 252,98***
(2,001) (1,851) (2,165) (3,535) (2,912) (2,401)
Risk1 0,910 0,915 0,921 0,906 0,921 0,914
(0,003) (0,003) (0,003) (0,005) (0,004) (0,003)
Risk2 0,079 0,074 0,071 0,079 0,072 0,074
(0,003) (0,002) (0,003) (0,004) (0,003) (0,002)
Risk3 0,007 0,007 0,005 0,011*** 0,003 0,009***
(0,001) (0,001) (0,001) (0,002) (0,001) (0,001)
Constot 0,922 0,919 0,920 0,924 0,944 0,909***
(0,003) (0,003) (0,003) (0,004) (0,004) (0,003)
Conspared 0,932 0,930 0,931 0,933 0,955 0,919***
(0,003) (0,002) (0,003) (0,004) (0,003) (0,003)
Conspiso 0,952 0,954 0,953 0,958 0,967 0,948***
(0,002) (0,002) (0,002) (0,003) (0,003) (0,003)
N 11201 8515 7480 3721 3883 7318
Standard errors in parentheses, * p<.10, ** p<.05, *** p<.01
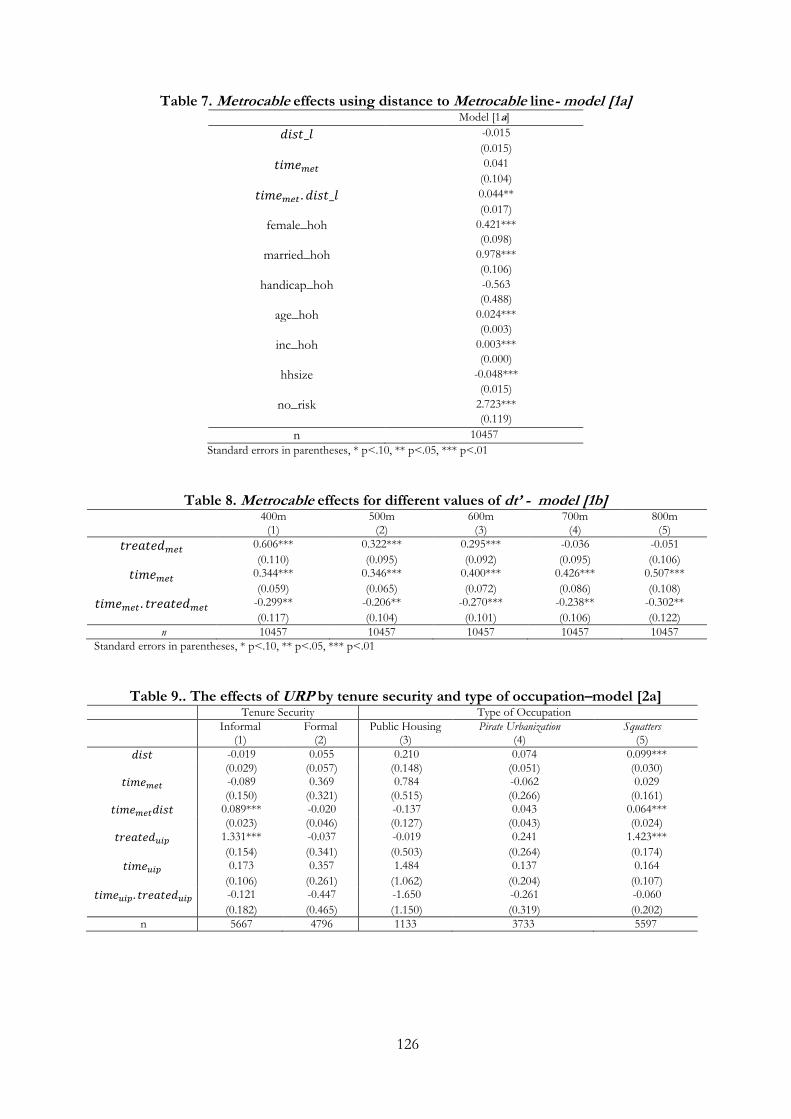
126
Table 7. Metrocable effects using distance to Metrocable line- model [1a] Model [1a]
-0.015
(0.015)
0.041
(0.104)
0.044**
(0.017)
female_hoh 0.421***
(0.098)
married_hoh 0.978***
(0.106)
handicap_hoh -0.563
(0.488)
age_hoh 0.024***
(0.003)
inc_hoh 0.003***
(0.000)
hhsize -0.048***
(0.015)
no_risk 2.723***
(0.119)
n 10457
Standard errors in parentheses, * p<.10, ** p<.05, *** p<.01
Table 8. Metrocable effects for different values of dt’ - model [1b] 400m
(1) 500m
(2) 600m
(3) 700m
(4) 800m
(5)
0.606*** 0.322*** 0.295*** -0.036 -0.051
(0.110) (0.095) (0.092) (0.095) (0.106)
0.344*** 0.346*** 0.400*** 0.426*** 0.507***
(0.059) (0.065) (0.072) (0.086) (0.108)
-0.299** -0.206** -0.270*** -0.238** -0.302**
(0.117) (0.104) (0.101) (0.106) (0.122)
n 10457 10457 10457 10457 10457
Standard errors in parentheses, * p<.10, ** p<.05, *** p<.01
Table 9.. The effects of URP by tenure security and type of occupation–model [2a] Tenure Security Type of Occupation
Informal (1)
Formal (2)
Public Housing (3)
Pirate Urbanization (4)
Squatters (5)
-0.019 0.055 0.210 0.074 0.099***
(0.029) (0.057) (0.148) (0.051) (0.030)
-0.089 0.369 0.784 -0.062 0.029
(0.150) (0.321) (0.515) (0.266) (0.161)
0.089*** -0.020 -0.137 0.043 0.064***
(0.023) (0.046) (0.127) (0.043) (0.024)
1.331*** -0.037 -0.019 0.241 1.423***
(0.154) (0.341) (0.503) (0.264) (0.174)
0.173 0.357 1.484 0.137 0.164
(0.106) (0.261) (1.062) (0.204) (0.107)
-0.121 -0.447 -1.650 -0.261 -0.060
(0.182) (0.465) (1.150) (0.319) (0.202)
n 5667 4796 1133 3733 5597
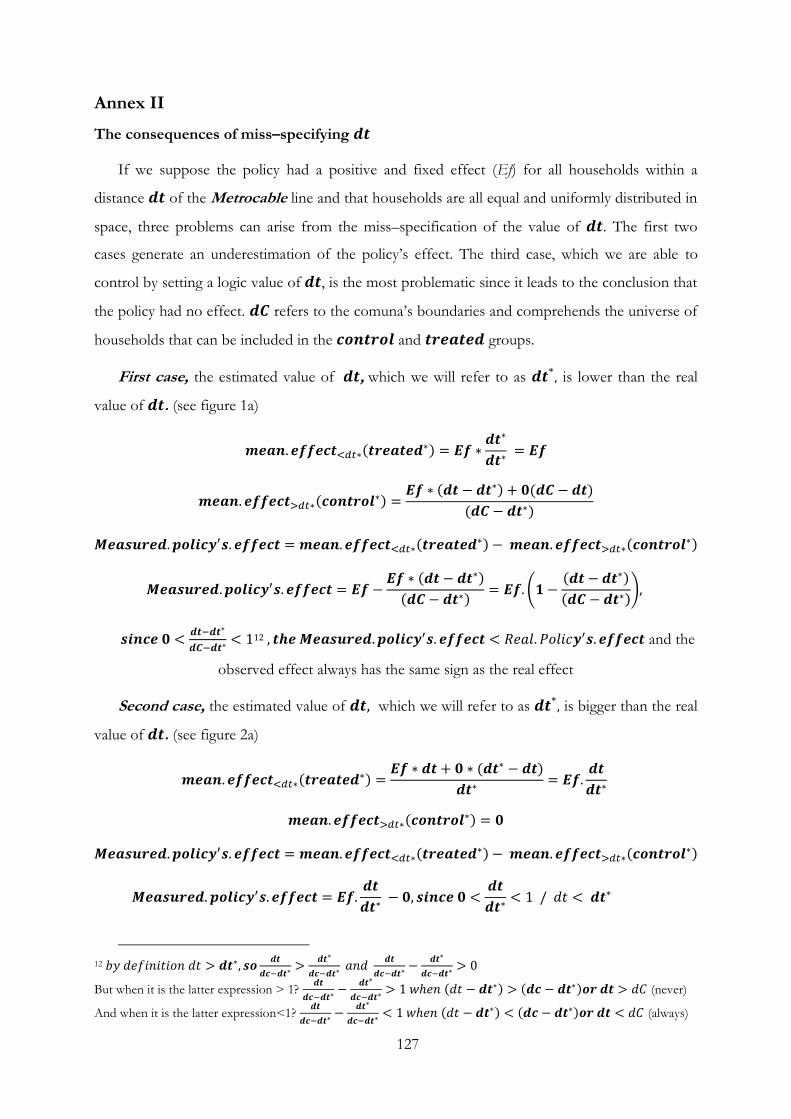
127
Annex II
The consequences of miss–specifying
If we suppose the policy had a positive and fixed effect (Ef) for all households within a
distance of the Metrocable line and that households are all equal and uniformly distributed in
space, three problems can arise from the miss–specification of the value of . The first two
cases generate an underestimation of the policy‘s effect. The third case, which we are able to
control by setting a logic value of , is the most problematic since it leads to the conclusion that
the policy had no effect. refers to the comuna‘s boundaries and comprehends the universe of
households that can be included in the and groups.
First case, the estimated value of , which we will refer to as is lower than the real
value of . (see figure 1a)
12 and the
observed effect always has the same sign as the real effect
Second case, the estimated value of which we will refer to as is bigger than the real
value of . (see figure 2a)
12
But when it is the latter expression > 1?
(never)
And when it is the latter expression<1?
(always)
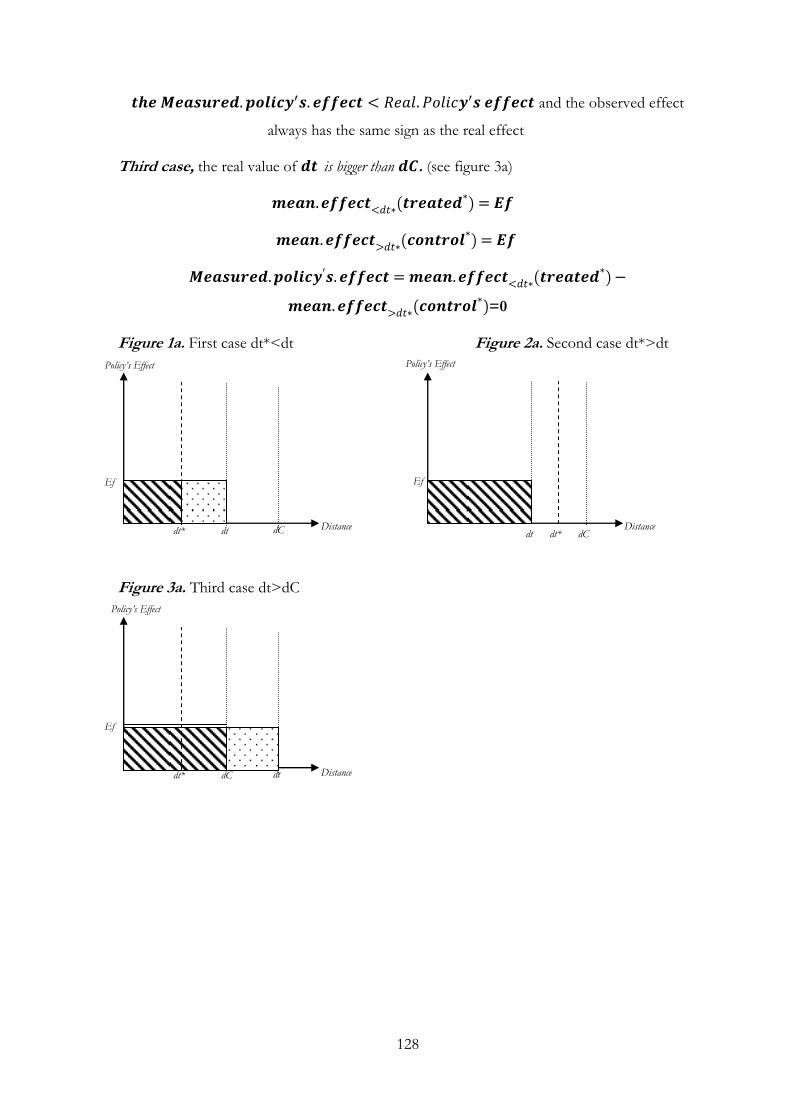
128
and the observed effect
always has the same sign as the real effect
Third case, the real value of is bigger than . (see figure 3a)
=0
Figure 1a. First case dt*<dt Figure 2a. Second case dt*>dt
Figure 3a. Third case dt>dC
dt dt*
Ef
dC dt* dt dC
Ef
dC dt*
Ef
dt
Policy‟s Effect
Policy‟s Effect Policy‟s Effect
Distance
Distance
Distance
129
Chapter 7
The Slum Rehabilitation Scheme: What consequences at a city level?
1
Abstract
In this article we evaluate the achievements–in terms of slum absorption–of the Slum Rehabilitation Scheme
(SRS), the principal slum policy of the city of Mumbai (India) and its consequences on population density
distribution at the city level. The SRS is a very innovative slum policy since it allows for the private sector
to completely finance slum rehabilitation through the creation of an Additional Development Rights
(ADR) program. Developers who rehabilitate slums are compensated with transferable or in-situ ADRs,
which allow them to exceed planned Floor Space Index (FSI) regulations, construct additional tenements
and sell them in the traditional formal–housing market. The profits made from the conferment of ADRs
serve to finance the total cost of the slum rehabilitation. This policy allows the private sector to choose
which slums to rehabilitate –having the slum dwellers‘ agreement–and does not designate specific wards as
ADRs generators or receptors. Results suggest that while the SRS has successfully absorbed a significant
part of the slum population into the formal city, it has not been able to meet the initial objectives and will
be insufficient to make Mumbai a ‗slum–free city‘. In addition, the ADR program‘s analysis revealed that
most of the additional population density is being absorbed by Mumbai‘s wealthier neighborhoods, which
might be generating infrastructure bottlenecks as planned capacities might not be able to host a greater
demand for services.
Résumé Dans cet article, nous évaluons les avancées – en termes d‘absorption des bidonvilles –permises par le
Schéma de Réhabilitation des Bidonvilles (SRB, Slum Rehabilitation Scheme SRS en anglais), principale politique des
bidonvilles à la ville de Mumbai et ses conséquences sur la distribution des densités à l‘intérieur de la ville.
Le SRS est une politique innovante car elle permet de financer la totalité de la reconstruction des
bidonvilles par le secteur privé en mettant en place un système d‘incitations par l‘allocation aux
promoteurs des « Droits de Développement Supplémentaires » (DDS). Les promoteurs qui réhabilitent
des bidonvilles sont compensés par des DDS qui leur permettent de construire plus de surface, sur le
même terrain ou ailleurs selon les conditions, de vendre la surface additionnelle sur le marché immobilier
et de financer ainsi la totalité des projets de réhabilitation. Dans ce système, ce sont les promoteurs privés
qui choisissent les bidonvilles à réhabiliter, après accord des habitants. On examine quel sont ses effets sur
l‘évolution des densités dans la ville de cette logique du secteur privé et on identifie les problèmes de
congestion d‘infrastructures que cela peut poser. Les résultats de cette analyse suggèrent que, malgré une
absorption significative de la population des bidonvilles à Mumbai, le SRB n‘a pas réussi à répondre aux
objectifs initiaux et restera insuffisante pour faire de Mumbai une ‗ville sans bidonvilles‘. En outre,
l‘analyse du programme de DDS a révélé que la densité de population supplémentaire a été absorbée par
les quartiers aisés de Mumbai, ce qui pourrait engendrer une congestion de l‘infrastructure urbaine
existante qui n‘est pas en mesure d‘accueillir une plus grande demande de services sans investissement
complémentaires.
1 A part of this chapter has been published as: Giraud, P.N. and Restrepo, P. (2011), Mumbai, des droits de
construire baladeurs au service du renouvellement urbain, Etudes foncières, nro 150 Mars-Avril.
130
1. Introduction
According to the United Nations, each year 70 million inhabitants are added to the world
cities; the equivalent to creating seven new megacities from scratch. In 2015, the world will have
at least 550 cities with more than one million inhabitants and by 2020, almost all of the worlds‘
demographic growth will occur in urban areas. However, while urbanization has usually been
linked to prosperity, most of today‘s urbanization is occurring in developing countries and about
half of it is being absorbed by the informal housing sector. Estimations suggest that between
2030 and 2040, the world will house around two billion inhabitants in slums, which will represent
about one third of the worlds‘ urban population (UN-Habitat, 2003a).
The recognition of slums as a world urban problem, along with their high correlation with
poverty, has made slum improvement a priority for local governments and international
organizations. Goal 7 of the Millennium Development Goals, which seeks to ensure environmental
sustainability, envisions the improvement of the lives of at least 100 million slum dwellers world-
wide by the year 2020 (UN, 2010). In Peru for the past two decades, the national Government
has lead a massive titling campaign at a national level that resulted in the formalization of around
1.9 million urban properties between 1991 and 2010 (Camaiora, 2011). In Medellin (Colombia),
the local Government introduced a policy to connect and integrate marginalized settlements to
the rest of the city, leading to the transformation of previously outside–of–law neighborhoods
into international city references2. The actual policy applied in the city of Mumbai (India), which
is the object of analysis of this article, is also a relevant example of new tendencies in slum
policies.
2 Urban Integral Projects of the city of Medellin have been recognized by a number of international organizations and awarded half a dozen urban planning and architectural prizes (Holcim Awards Gold 2008, 2009 City of Barcelona FAD Award, Curry Stone Design 2009…).
131
Despite being the commercial and industrial capital of India, the city of Mumbai (Bombay),
is–unfortunately–one of the most famous references of informal urbanization. With a population
of around 13 million inhabitants, considerable development restrictions, due to topographic
constraints and a history of strict land use policies, formal housing prices have remained outside
most of the population‘s payment capacities for decades. Around half of its inhabitants live in
slums with precarious sanitary conditions while its leaders dream of making Mumbai a ―World-
Class City‖ (McKinsey, 2003). The actual slum policy was at first proposed by the Shiv Sena
political party in the 1995 election and was intended to rehabilitate 800,000 slum dwellers (Burra,
1999). The policy, called the Slum Rehabilitation Scheme (SRS), introduced a set of financial
mechanisms based on Additional Development Rights that allowed the public sector to switch
the burden of financing slum rehabilitation to the private sector.
In this article we approach two different research questions related to the SRS policy. The
first question evaluates the effectiveness of the SRS policy in terms of slum absorption,
comparing the initial political objectives to the actual policy results. Since the policy has been
running for 16 years, it is possible for us examine the achievements of the policy, based on data
provided by the Slum Rehabilitation Authority (SRA). The second question evaluates the
consequences of the SRS on population density distribution at the city level by using data
provided by the Municipal Corporation of Greater Mumbai (MCGM) on the Additional
Development Rights (ADRs) program. This question is of special relevance given the policy
design and the city context. As the SRS is based on density incentives in the form of Additional
Development Rights and does not designate specific areas in which ADRs can be generated or to
which they can be transferred, the outcome of the policy–in terms of density changes–is left to
the economic rationale of project developers. With density changes being fueled by the private
sector, the policy could eventually lead to infrastructure bottlenecks in areas in which additional
density–that goes beyond the planned capacities–cannot host a greater demand for services.
While a number of articles have studied the SRS‘s effects on the city of Mumbai, most of the
existing literature evaluates (or simulates) the policy‘s effect at the household‘s level and not at
the city level (Bhide et al. 2003; Sharma et al. 2008; Takeuchi et al. 2008; Restrepo 2010; Vaquier
2010). To the present time only Navtej (2008) has done work similar to the one covered by this
article. However, her research is focused on the possible consequences of the relocation of
Project Affected Households (PAHs) from the Mumbai Urban Transport Project (MUTP) and
the Mumbai Urban Infrastructure Project (MUIP), as well as the ADRs generated in this process.
Both of these projects correspond to once–in–a–life–time interventions and the location choices
for the rehabilitation of PAHs were defined by public authorities. Compared to Navtej‘s work,
132
we extend our analysis to evaluate the effectiveness of the policy in achieving its objective and
evaluate the possible density consequences generated by the SRS‘s ADR program, which is
leaded by the private sector.
This article is organized in the following manner. In Section 2 we outline the history of slum
policies in the city of Mumbai. In Section 3 we describe the principal characteristics of the Slum
Rehabilitation Scheme and develop the analysis of the effectiveness of the Slum Rehabilitation Scheme
in terms of slum absorption rates. In Section 4 we evaluate density changes produced by the SRS
using the Slum Rehabilitation Authority (SRA) project‘s database and the MCGM Transfer
Development Rights (TDRs) database. Finally, in Section 5 we conclude.
2. Mumbai, the Indian megapolis
The city of Mumbai, which belonged to the Portuguese since 1534, was given as dowry to the
King of England in 1661 and remained under Britain‘s control until India‘s independence in
1947. Mumbai‘s urbanization started in the south of the peninsula–Island City–and spread to the
north, first filling the eastern and western suburbs and then expanding beyond the city‘s
boundaries to satellite cities like Navi Mumbai, Bhiwandi and Kalyan. From the 19th century, the
population of Mumbai grew considerably, passing from 813,000 inhabitants in 1901 to 5,971,000
in 1971 and 13,831,000 in 2010 (MCGM, 2005). Today, Mumbai is the largest city in India and
more than two thirds of the city‘s population lives in the suburbs, outside Island City, which is
composed of wards A to G; the suburbs are composed of wards H to T, and together they
constitute ―Greater Mumbai‖, a city under a unique authority (See Figure 1).
Slums have been a part of the city of Mumbai for a long time. They emerged in the mid-
nineteenth century and by the time of India's independence around five percent (5%) of the city‘s
populations was already living in this type of habitat. Since then, slums have grown considerably,
both in absolute and in relative terms. The total slum population passed from 2.8 million in 1976
to 4.3 million in 1983 and exploded to 6.2 million by the year 2000 (MCGM, 2005). The latest
report estimated that 55% of the city population lived in informal settlements while occupying
only 16% of the city land, clear evidence of the overcrowdings and spatial inequalities of this
megapolis (Hagn, 2006). Slums in Mumbai are spatially dispersed and are present in most of the
areas of the city, as can be seen in Figure 1.
Living conditions in Mumbai slums are variable but most of the slum settlement are relatively
old and have achieved a certain degree of consolidation. In terms of surface, slum dwellings are
quite small, with 42% having 10 sq.mt, 38% between 15–20 sq.mt and only 9% above 20 sq.mt
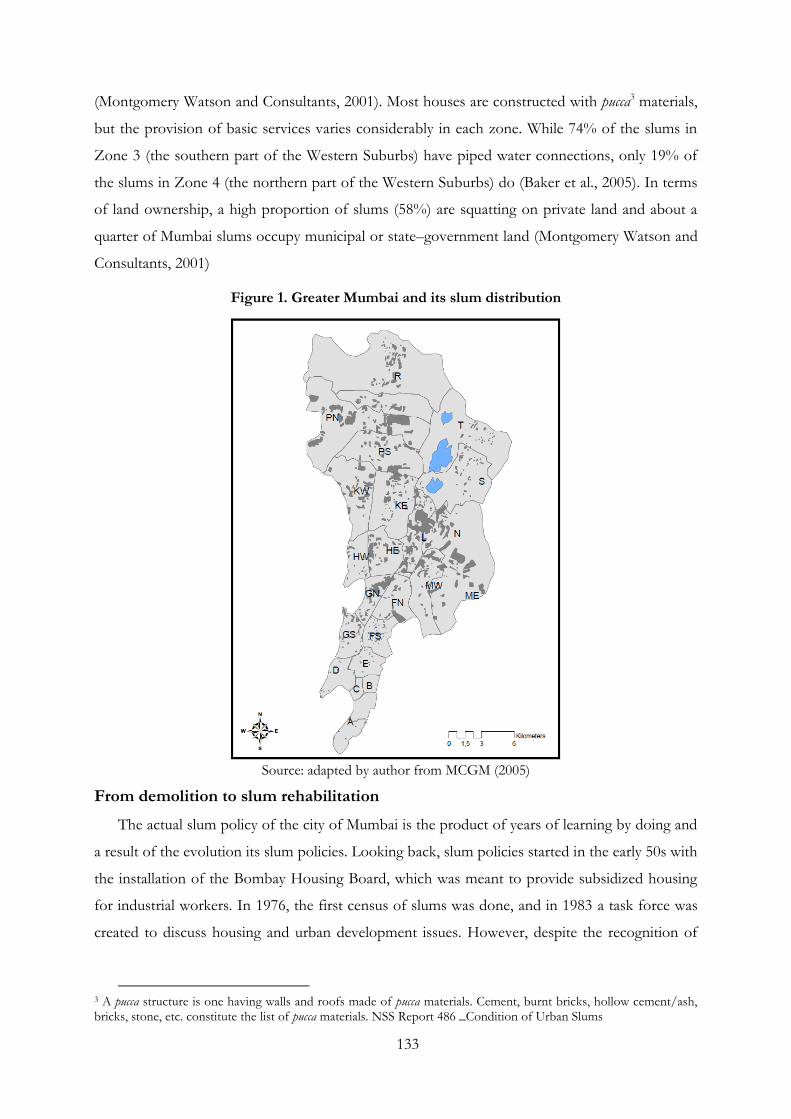
133
(Montgomery Watson and Consultants, 2001). Most houses are constructed with pucca3 materials,
but the provision of basic services varies considerably in each zone. While 74% of the slums in
Zone 3 (the southern part of the Western Suburbs) have piped water connections, only 19% of
the slums in Zone 4 (the northern part of the Western Suburbs) do (Baker et al., 2005). In terms
of land ownership, a high proportion of slums (58%) are squatting on private land and about a
quarter of Mumbai slums occupy municipal or state–government land (Montgomery Watson and
Consultants, 2001)
Figure 1. Greater Mumbai and its slum distribution
Source: adapted by author from MCGM (2005)
From demolition to slum rehabilitation
The actual slum policy of the city of Mumbai is the product of years of learning by doing and
a result of the evolution its slum policies. Looking back, slum policies started in the early 50s with
the installation of the Bombay Housing Board, which was meant to provide subsidized housing
for industrial workers. In 1976, the first census of slums was done, and in 1983 a task force was
created to discuss housing and urban development issues. However, despite the recognition of
3 A pucca structure is one having walls and roofs made of pucca materials. Cement, burnt bricks, hollow cement/ash, bricks, stone, etc. constitute the list of pucca materials. NSS Report 486 _Condition of Urban Slums
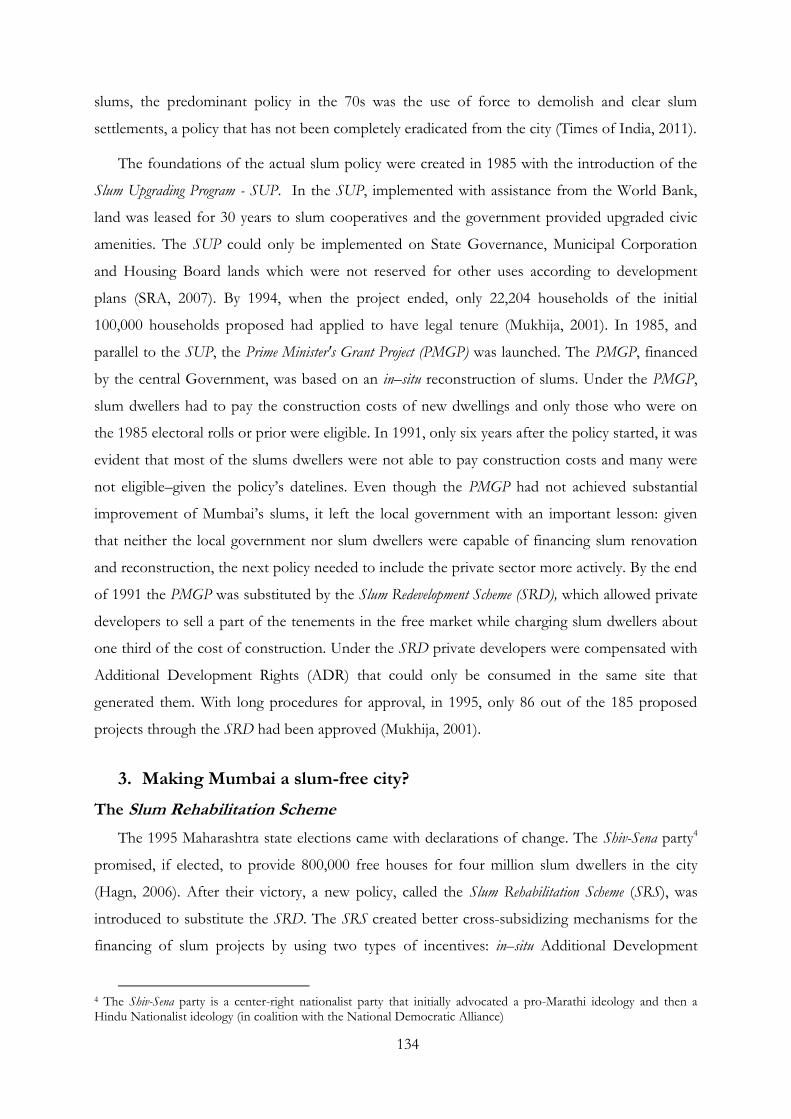
134
slums, the predominant policy in the 70s was the use of force to demolish and clear slum
settlements, a policy that has not been completely eradicated from the city (Times of India, 2011).
The foundations of the actual slum policy were created in 1985 with the introduction of the
Slum Upgrading Program - SUP. In the SUP, implemented with assistance from the World Bank,
land was leased for 30 years to slum cooperatives and the government provided upgraded civic
amenities. The SUP could only be implemented on State Governance, Municipal Corporation
and Housing Board lands which were not reserved for other uses according to development
plans (SRA, 2007). By 1994, when the project ended, only 22,204 households of the initial
100,000 households proposed had applied to have legal tenure (Mukhija, 2001). In 1985, and
parallel to the SUP, the Prime Minister's Grant Project (PMGP) was launched. The PMGP, financed
by the central Government, was based on an in–situ reconstruction of slums. Under the PMGP,
slum dwellers had to pay the construction costs of new dwellings and only those who were on
the 1985 electoral rolls or prior were eligible. In 1991, only six years after the policy started, it was
evident that most of the slums dwellers were not able to pay construction costs and many were
not eligible–given the policy‘s datelines. Even though the PMGP had not achieved substantial
improvement of Mumbai‘s slums, it left the local government with an important lesson: given
that neither the local government nor slum dwellers were capable of financing slum renovation
and reconstruction, the next policy needed to include the private sector more actively. By the end
of 1991 the PMGP was substituted by the Slum Redevelopment Scheme (SRD), which allowed private
developers to sell a part of the tenements in the free market while charging slum dwellers about
one third of the cost of construction. Under the SRD private developers were compensated with
Additional Development Rights (ADR) that could only be consumed in the same site that
generated them. With long procedures for approval, in 1995, only 86 out of the 185 proposed
projects through the SRD had been approved (Mukhija, 2001).
3. Making Mumbai a slum-free city?
The Slum Rehabilitation Scheme
The 1995 Maharashtra state elections came with declarations of change. The Shiv-Sena party4
promised, if elected, to provide 800,000 free houses for four million slum dwellers in the city
(Hagn, 2006). After their victory, a new policy, called the Slum Rehabilitation Scheme (SRS), was
introduced to substitute the SRD. The SRS created better cross-subsidizing mechanisms for the
financing of slum projects by using two types of incentives: in–situ Additional Development
4 The Shiv-Sena party is a center-right nationalist party that initially advocated a pro-Marathi ideology and then a Hindu Nationalist ideology (in coalition with the National Democratic Alliance)
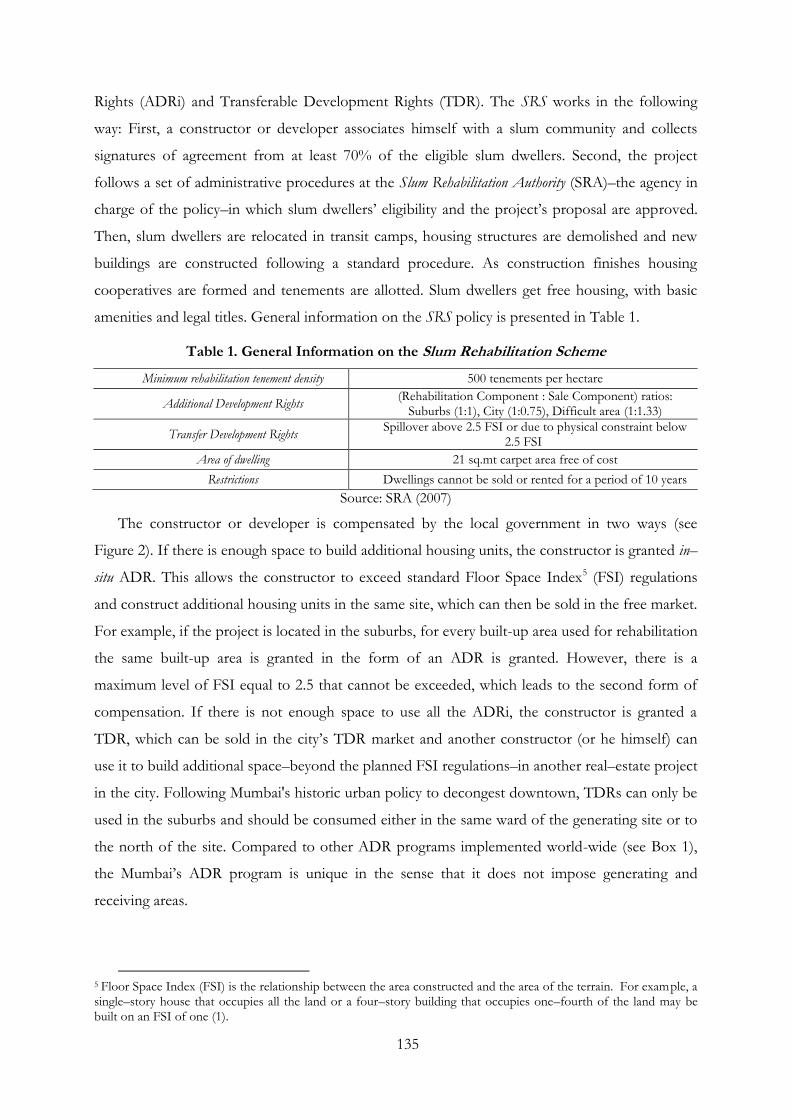
135
Rights (ADRi) and Transferable Development Rights (TDR). The SRS works in the following
way: First, a constructor or developer associates himself with a slum community and collects
signatures of agreement from at least 70% of the eligible slum dwellers. Second, the project
follows a set of administrative procedures at the Slum Rehabilitation Authority (SRA)–the agency in
charge of the policy–in which slum dwellers‘ eligibility and the project‘s proposal are approved.
Then, slum dwellers are relocated in transit camps, housing structures are demolished and new
buildings are constructed following a standard procedure. As construction finishes housing
cooperatives are formed and tenements are allotted. Slum dwellers get free housing, with basic
amenities and legal titles. General information on the SRS policy is presented in Table 1.
Table 1. General Information on the Slum Rehabilitation Scheme
Minimum rehabilitation tenement density 500 tenements per hectare
Additional Development Rights (Rehabilitation Component : Sale Component) ratios:
Suburbs (1:1), City (1:0.75), Difficult area (1:1.33)
Transfer Development Rights Spillover above 2.5 FSI or due to physical constraint below
2.5 FSI
Area of dwelling 21 sq.mt carpet area free of cost
Restrictions Dwellings cannot be sold or rented for a period of 10 years
Source: SRA (2007)
The constructor or developer is compensated by the local government in two ways (see
Figure 2). If there is enough space to build additional housing units, the constructor is granted in–
situ ADR. This allows the constructor to exceed standard Floor Space Index5 (FSI) regulations
and construct additional housing units in the same site, which can then be sold in the free market.
For example, if the project is located in the suburbs, for every built-up area used for rehabilitation
the same built-up area is granted in the form of an ADR is granted. However, there is a
maximum level of FSI equal to 2.5 that cannot be exceeded, which leads to the second form of
compensation. If there is not enough space to use all the ADRi, the constructor is granted a
TDR, which can be sold in the city‘s TDR market and another constructor (or he himself) can
use it to build additional space–beyond the planned FSI regulations–in another real–estate project
in the city. Following Mumbai's historic urban policy to decongest downtown, TDRs can only be
used in the suburbs and should be consumed either in the same ward of the generating site or to
the north of the site. Compared to other ADR programs implemented world-wide (see Box 1),
the Mumbai‘s ADR program is unique in the sense that it does not impose generating and
receiving areas.
5 Floor Space Index (FSI) is the relationship between the area constructed and the area of the terrain. For example, a single–story house that occupies all the land or a four–story building that occupies one–fourth of the land may be built on an FSI of one (1).
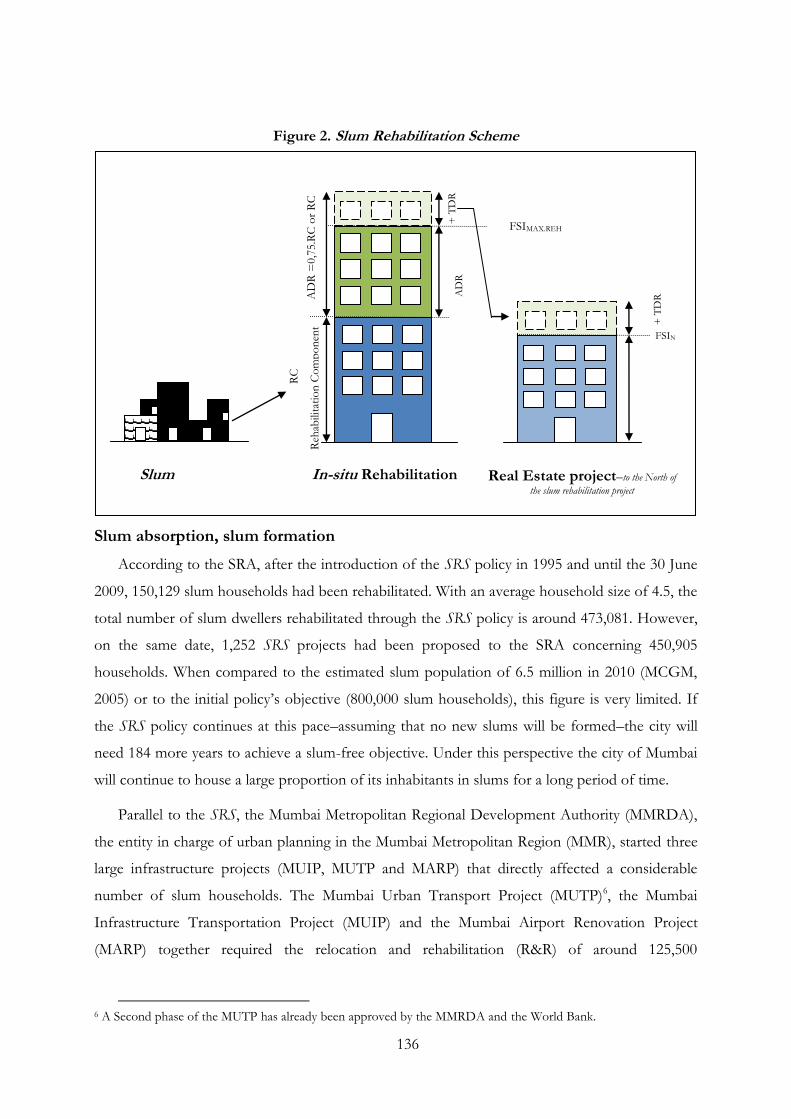
136
Figure 2. Slum Rehabilitation Scheme
Slum absorption, slum formation
According to the SRA, after the introduction of the SRS policy in 1995 and until the 30 June
2009, 150,129 slum households had been rehabilitated. With an average household size of 4.5, the
total number of slum dwellers rehabilitated through the SRS policy is around 473,081. However,
on the same date, 1,252 SRS projects had been proposed to the SRA concerning 450,905
households. When compared to the estimated slum population of 6.5 million in 2010 (MCGM,
2005) or to the initial policy‘s objective (800,000 slum households), this figure is very limited. If
the SRS policy continues at this pace–assuming that no new slums will be formed–the city will
need 184 more years to achieve a slum-free objective. Under this perspective the city of Mumbai
will continue to house a large proportion of its inhabitants in slums for a long period of time.
Parallel to the SRS, the Mumbai Metropolitan Regional Development Authority (MMRDA),
the entity in charge of urban planning in the Mumbai Metropolitan Region (MMR), started three
large infrastructure projects (MUIP, MUTP and MARP) that directly affected a considerable
number of slum households. The Mumbai Urban Transport Project (MUTP)6, the Mumbai
Infrastructure Transportation Project (MUIP) and the Mumbai Airport Renovation Project
(MARP) together required the relocation and rehabilitation (R&R) of around 125,500
6 A Second phase of the MUTP has already been approved by the MMRDA and the World Bank.
+ T
DR
AD
R =
0,7
5.R
C o
r R
C
Slum In-situ Rehabilitation Real Estate project–to the North of
the slum rehabilitation project
RC
Reh
abili
tati
on
Co
mp
on
ent
AD
R
FSIMAX.REH
AB = 2.5
+ T
DR
FSIN
ORM
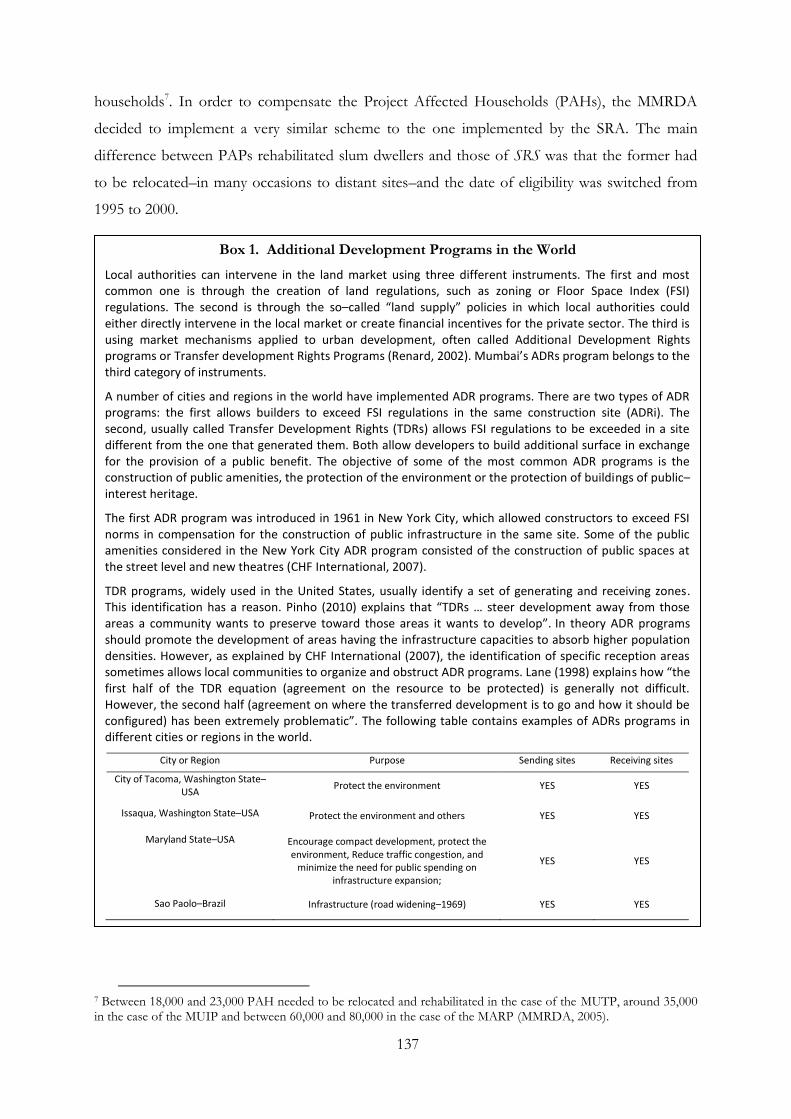
137
households7. In order to compensate the Project Affected Households (PAHs), the MMRDA
decided to implement a very similar scheme to the one implemented by the SRA. The main
difference between PAPs rehabilitated slum dwellers and those of SRS was that the former had
to be relocated–in many occasions to distant sites–and the date of eligibility was switched from
1995 to 2000.
7 Between 18,000 and 23,000 PAH needed to be relocated and rehabilitated in the case of the MUTP, around 35,000 in the case of the MUIP and between 60,000 and 80,000 in the case of the MARP (MMRDA, 2005).
Box 1. Additional Development Programs in the World
Local authorities can intervene in the land market using three different instruments. The first and most common one is through the creation of land regulations, such as zoning or Floor Space Index (FSI) regulations. The second is through the so–called “land supply” policies in which local authorities could either directly intervene in the local market or create financial incentives for the private sector. The third is using market mechanisms applied to urban development, often called Additional Development Rights programs or Transfer development Rights Programs (Renard, 2002). Mumbai’s ADRs program belongs to the third category of instruments.
A number of cities and regions in the world have implemented ADR programs. There are two types of ADR programs: the first allows builders to exceed FSI regulations in the same construction site (ADRi). The second, usually called Transfer Development Rights (TDRs) allows FSI regulations to be exceeded in a site different from the one that generated them. Both allow developers to build additional surface in exchange for the provision of a public benefit. The objective of some of the most common ADR programs is the construction of public amenities, the protection of the environment or the protection of buildings of public–interest heritage.
The first ADR program was introduced in 1961 in New York City, which allowed constructors to exceed FSI norms in compensation for the construction of public infrastructure in the same site. Some of the public amenities considered in the New York City ADR program consisted of the construction of public spaces at the street level and new theatres (CHF International, 2007).
TDR programs, widely used in the United States, usually identify a set of generating and receiving zones. This identification has a reason. Pinho (2010) explains that “TDRs … steer development away from those areas a community wants to preserve toward those areas it wants to develop”. In theory ADR programs should promote the development of areas having the infrastructure capacities to absorb higher population densities. However, as explained by CHF International (2007), the identification of specific reception areas sometimes allows local communities to organize and obstruct ADR programs. Lane (1998) explains how “the first half of the TDR equation (agreement on the resource to be protected) is generally not difficult. However, the second half (agreement on where the transferred development is to go and how it should be configured) has been extremely problematic”. The following table contains examples of ADRs programs in different cities or regions in the world.
City or Region Purpose Sending sites Receiving sites
City of Tacoma, Washington State–USA
Protect the environment YES YES
Issaqua, Washington State–USA Protect the environment and others YES YES
Maryland State–USA Encourage compact development, protect the environment, Reduce traffic congestion, and
minimize the need for public spending on infrastructure expansion;
YES YES
Sao Paolo–Brazil Infrastructure (road widening–1969) YES YES
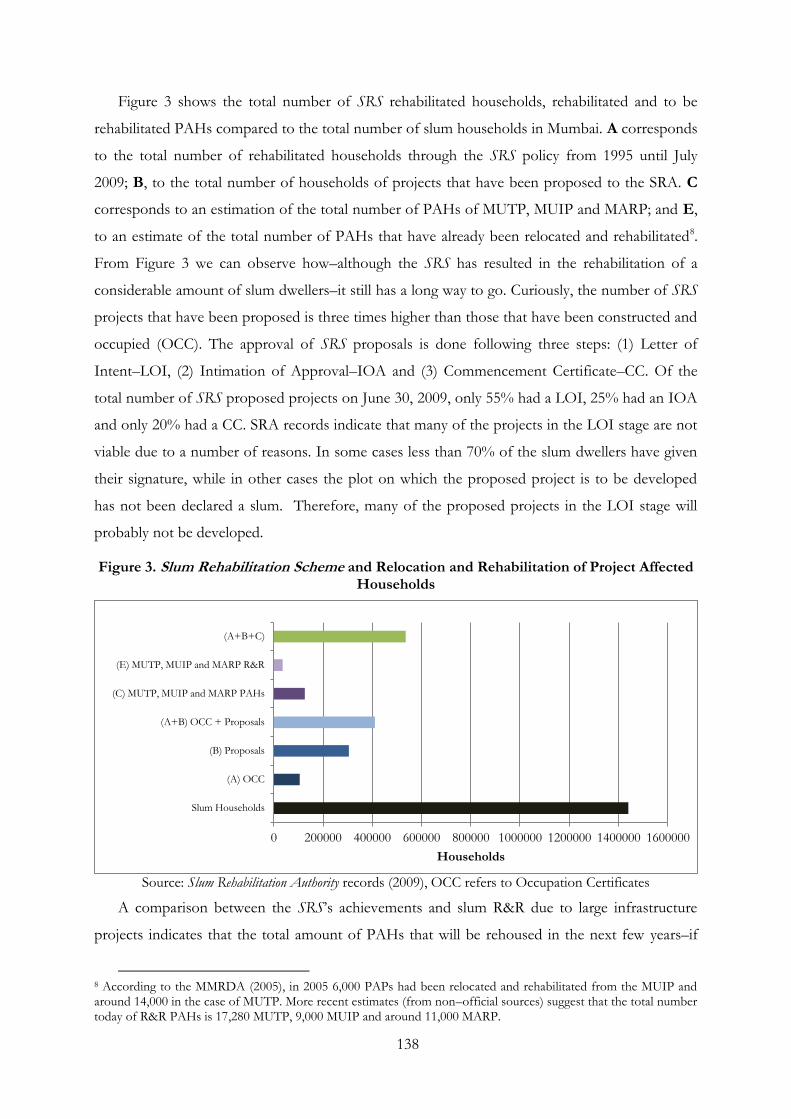
138
Figure 3 shows the total number of SRS rehabilitated households, rehabilitated and to be
rehabilitated PAHs compared to the total number of slum households in Mumbai. A corresponds
to the total number of rehabilitated households through the SRS policy from 1995 until July
2009; B, to the total number of households of projects that have been proposed to the SRA. C
corresponds to an estimation of the total number of PAHs of MUTP, MUIP and MARP; and E,
to an estimate of the total number of PAHs that have already been relocated and rehabilitated8.
From Figure 3 we can observe how–although the SRS has resulted in the rehabilitation of a
considerable amount of slum dwellers–it still has a long way to go. Curiously, the number of SRS
projects that have been proposed is three times higher than those that have been constructed and
occupied (OCC). The approval of SRS proposals is done following three steps: (1) Letter of
Intent–LOI, (2) Intimation of Approval–IOA and (3) Commencement Certificate–CC. Of the
total number of SRS proposed projects on June 30, 2009, only 55% had a LOI, 25% had an IOA
and only 20% had a CC. SRA records indicate that many of the projects in the LOI stage are not
viable due to a number of reasons. In some cases less than 70% of the slum dwellers have given
their signature, while in other cases the plot on which the proposed project is to be developed
has not been declared a slum. Therefore, many of the proposed projects in the LOI stage will
probably not be developed.
Figure 3. Slum Rehabilitation Scheme and Relocation and Rehabilitation of Project Affected Households
Source: Slum Rehabilitation Authority records (2009), OCC refers to Occupation Certificates
A comparison between the SRS‘s achievements and slum R&R due to large infrastructure
projects indicates that the total amount of PAHs that will be rehoused in the next few years–if
8 According to the MMRDA (2005), in 2005 6,000 PAPs had been relocated and rehabilitated from the MUIP and around 14,000 in the case of MUTP. More recent estimates (from non–official sources) suggest that the total number today of R&R PAHs is 17,280 MUTP, 9,000 MUIP and around 11,000 MARP.
0 200000 400000 600000 800000 1000000 1200000 1400000 1600000
Slum Households
(A) OCC
(B) Proposals
(A+B) OCC + Proposals
(C) MUTP, MUIP and MARP PAHs
(E) MUTP, MUIP and MARP R&R
(A+B+C)
Households
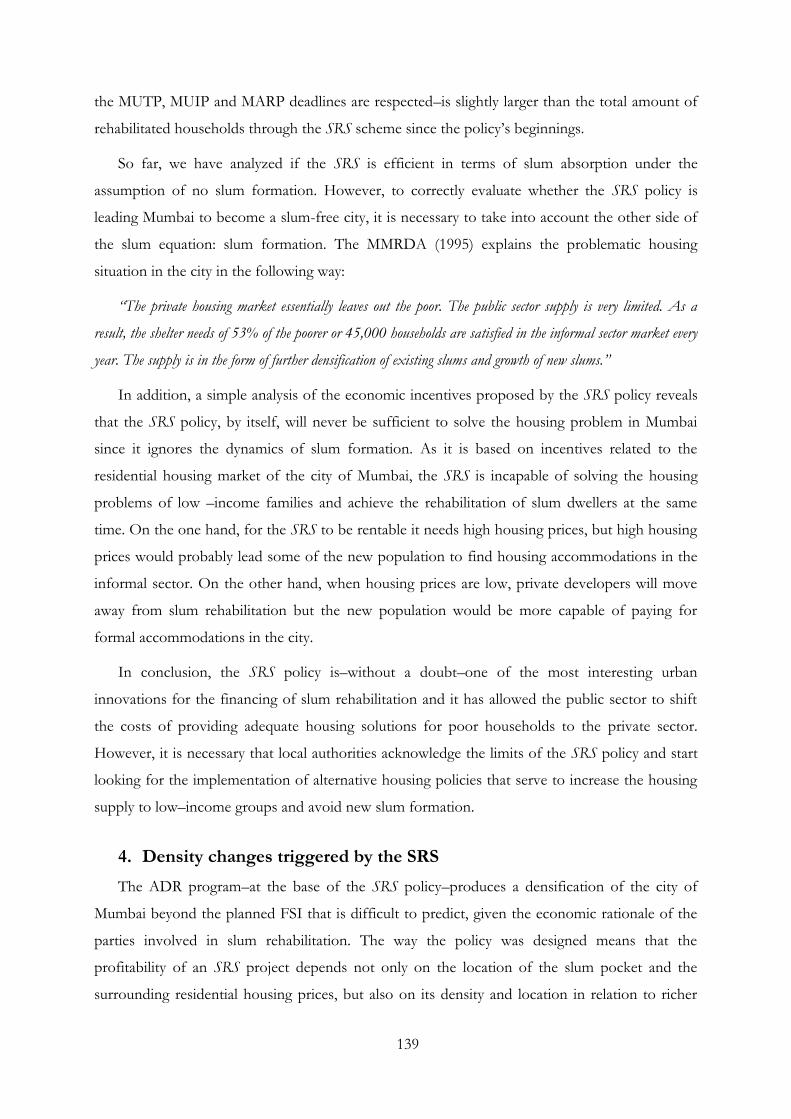
139
the MUTP, MUIP and MARP deadlines are respected–is slightly larger than the total amount of
rehabilitated households through the SRS scheme since the policy‘s beginnings.
So far, we have analyzed if the SRS is efficient in terms of slum absorption under the
assumption of no slum formation. However, to correctly evaluate whether the SRS policy is
leading Mumbai to become a slum-free city, it is necessary to take into account the other side of
the slum equation: slum formation. The MMRDA (1995) explains the problematic housing
situation in the city in the following way:
“The private housing market essentially leaves out the poor. The public sector supply is very limited. As a
result, the shelter needs of 53% of the poorer or 45,000 households are satisfied in the informal sector market every
year. The supply is in the form of further densification of existing slums and growth of new slums.”
In addition, a simple analysis of the economic incentives proposed by the SRS policy reveals
that the SRS policy, by itself, will never be sufficient to solve the housing problem in Mumbai
since it ignores the dynamics of slum formation. As it is based on incentives related to the
residential housing market of the city of Mumbai, the SRS is incapable of solving the housing
problems of low –income families and achieve the rehabilitation of slum dwellers at the same
time. On the one hand, for the SRS to be rentable it needs high housing prices, but high housing
prices would probably lead some of the new population to find housing accommodations in the
informal sector. On the other hand, when housing prices are low, private developers will move
away from slum rehabilitation but the new population would be more capable of paying for
formal accommodations in the city.
In conclusion, the SRS policy is–without a doubt–one of the most interesting urban
innovations for the financing of slum rehabilitation and it has allowed the public sector to shift
the costs of providing adequate housing solutions for poor households to the private sector.
However, it is necessary that local authorities acknowledge the limits of the SRS policy and start
looking for the implementation of alternative housing policies that serve to increase the housing
supply to low–income groups and avoid new slum formation.
4. Density changes triggered by the SRS
The ADR program–at the base of the SRS policy–produces a densification of the city of
Mumbai beyond the planned FSI that is difficult to predict, given the economic rationale of the
parties involved in slum rehabilitation. The way the policy was designed means that the
profitability of an SRS project depends not only on the location of the slum pocket and the
surrounding residential housing prices, but also on its density and location in relation to richer
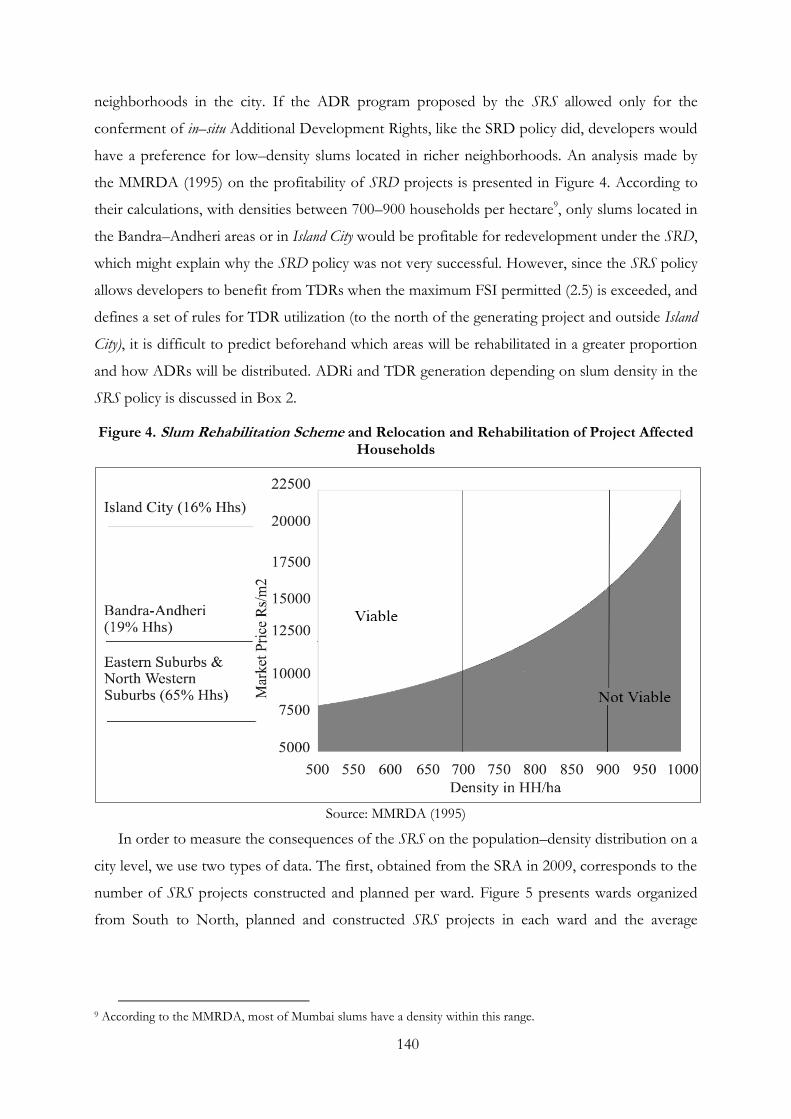
140
neighborhoods in the city. If the ADR program proposed by the SRS allowed only for the
conferment of in–situ Additional Development Rights, like the SRD policy did, developers would
have a preference for low–density slums located in richer neighborhoods. An analysis made by
the MMRDA (1995) on the profitability of SRD projects is presented in Figure 4. According to
their calculations, with densities between 700–900 households per hectare9, only slums located in
the Bandra–Andheri areas or in Island City would be profitable for redevelopment under the SRD,
which might explain why the SRD policy was not very successful. However, since the SRS policy
allows developers to benefit from TDRs when the maximum FSI permitted (2.5) is exceeded, and
defines a set of rules for TDR utilization (to the north of the generating project and outside Island
City), it is difficult to predict beforehand which areas will be rehabilitated in a greater proportion
and how ADRs will be distributed. ADRi and TDR generation depending on slum density in the
SRS policy is discussed in Box 2.
Figure 4. Slum Rehabilitation Scheme and Relocation and Rehabilitation of Project Affected Households
Source: MMRDA (1995)
In order to measure the consequences of the SRS on the population–density distribution on a
city level, we use two types of data. The first, obtained from the SRA in 2009, corresponds to the
number of SRS projects constructed and planned per ward. Figure 5 presents wards organized
from South to North, planned and constructed SRS projects in each ward and the average
9 According to the MMRDA, most of Mumbai slums have a density within this range.
141
residential price of formal housing in Rupees (Rs.) per square meter10. From this figure the
correlation between the number of projects and the average price in each ward is apparent, with a
higher number of projects being developed in richer neighborhoods. However with this
information only, it is not possible to estimate the effects of the policy on density distribution
since the proportion of TDR/ADRi granted in each of the projects depends on slum density,
information that is not available.
Figure 5. Number of Projects Rehabilitated by Ward and Residential Prices (Rs/ sq.mt.)
Source: SRA (2009), World Bank Household Survey (2008) **Values for average price per sq.mt for ward P/N and
presented inconsistencies; therefore, we used the average price per sq.mt of nearby wards.
The second type of data used refers to the total number of TDRs generated and consumed
per ward. This TDR database was obtained in July 2008 from the Mumbai Municipal
Corporation of Greater Mumbai (MCGM). Figure 6 reveals how the large bulk of TDRs are
generated in cheap neighborhoods, while most of them are consumed in the wealthiest sectors of
the city. In rich wards–outside Island City–(H/E, H/W, KE/KW), many rehabilitation projects
have been built but the TDR generation remains low when compared to poor wards. The latter
suggests that developers have a preference for the rehabilitation of low–density slums in rich
neighborhoods since they can profit from the conferment of additional built–up areas in–situ and
get high returns with the sale of the sale component. In contrast, poor neighborhoods (M/E,
M/W, L, P/S, S) generate a lot of TDRs compared to the number of rehabilitation projects they
house. This suggests that developers have a preference for the development of high–density
10 Residential prices were calculated by the author using the World Bank Transport Household Survey database conducted in 2008 which is representative of the city of Mumbai.
0
1000
2000
3000
4000
5000
6000
7000
8000
9000
-
50
100
150
200
250
300
350
A
B
C
D
E
G/
S
F/
S
G/
N
F/
N
H/
E
H/
W
M/
E
M/
W
L
K/
E
K/
W
N
P/
S
S
P/
N
T
R
Rs/
sq.m
t.
Nu
mb
er
of
pro
jects
Constructed and occupied projects Planned projects price/sq.mt
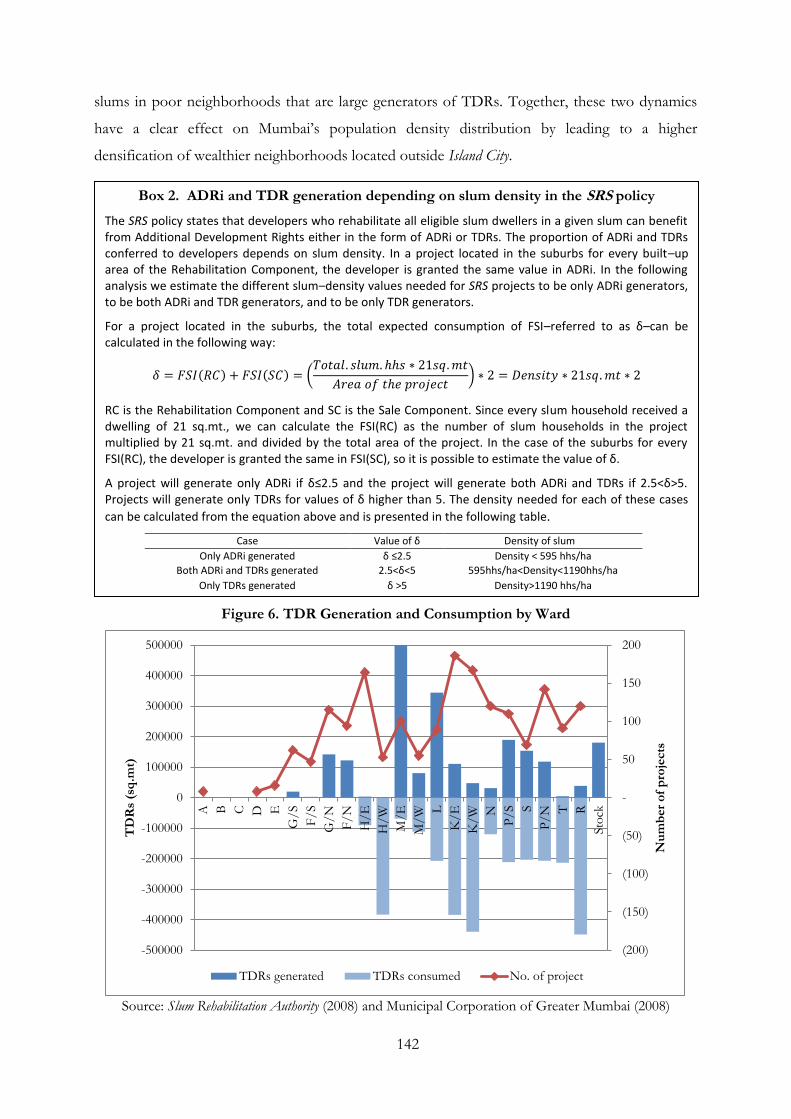
142
slums in poor neighborhoods that are large generators of TDRs. Together, these two dynamics
have a clear effect on Mumbai‘s population density distribution by leading to a higher
densification of wealthier neighborhoods located outside Island City.
Figure 6. TDR Generation and Consumption by Ward
Source: Slum Rehabilitation Authority (2008) and Municipal Corporation of Greater Mumbai (2008)
(200)
(150)
(100)
(50)
-
50
100
150
200
-500000
-400000
-300000
-200000
-100000
0
100000
200000
300000
400000
500000
A
B
C
D
E
G/
S
F/
S
G/
N
F/
N
H/
E
H/
W
M/
E
M/
W
L
K/
E
K/
W
N
P/
S
S
P/
N
T
R
Sto
ck
Nu
mb
er
of
pro
jects
TD
Rs
(sq
.mt)
TDRs generated TDRs consumed No. of project
Box 2. ADRi and TDR generation depending on slum density in the SRS policy
The SRS policy states that developers who rehabilitate all eligible slum dwellers in a given slum can benefit from Additional Development Rights either in the form of ADRi or TDRs. The proportion of ADRi and TDRs conferred to developers depends on slum density. In a project located in the suburbs for every built–up area of the Rehabilitation Component, the developer is granted the same value in ADRi. In the following analysis we estimate the different slum–density values needed for SRS projects to be only ADRi generators, to be both ADRi and TDR generators, and to be only TDR generators.
For a project located in the suburbs, the total expected consumption of FSI–referred to as δ–can be calculated in the following way:
RC is the Rehabilitation Component and SC is the Sale Component. Since every slum household received a dwelling of 21 sq.mt., we can calculate the FSI(RC) as the number of slum households in the project multiplied by 21 sq.mt. and divided by the total area of the project. In the case of the suburbs for every FSI(RC), the developer is granted the same in FSI(SC), so it is possible to estimate the value of δ.
A project will generate only ADRi if δ≤2.5 and the project will generate both ADRi and TDRs if 2.5<δ>5. Projects will generate only TDRs for values of δ higher than 5. The density needed for each of these cases
can be calculated from the equation above and is presented in the following table.
Case Value of δ Density of slum
Only ADRi generated δ ≤2.5 Density < 595 hhs/ha
Both ADRi and TDRs generated 2.5<δ<5 595hhs/ha<Density<1190hhs/ha
Only TDRs generated δ >5 Density>1190 hhs/ha
143
5. Conclusions
In this paper we evaluate the impact of the Slum Rehabilitation Scheme (SRS), the principal slum
policy in the city of Mumbai, at a city level. We address two issues: First, we evaluate the
effectiveness of the policy in achieving the initial objectives and in achieving a slum–free
scenario. Second, since the SRS policy is based on Additional Development Rights incentives
that lead to an increase of population density beyond the planned Floor Space Index, we evaluate
the SRS consequences on the population density distribution at a city level.
In terms of the SRS policy‘s achievements, we found that–although the policy has been
relatively successful compared to previous slum policies–it has not been able to meet the initial
slum absorption objective and will not be sufficient, by itself, to reach a slum–free scenario.
From the introduction of the policy in 1995 until June 2009, a total of 150,129 slum households
had been rehabilitated, equivalent to around 10% of the slum population. Furthermore, since the
SRS is based on incentives linked to the state of the housing market in the city, it is not able to
achieve substantial slum rehabilitation and resolve the housing problems of low–income families
simultaneously. On the one hand, if the housing market prices in the city are high, slum
rehabilitation is very profitable but the new population would probably find it difficult to find
affordable formal housing accommodation. On the other hand, when housing market prices are
low, private developers will be less interested in slum rehabilitation but the new population will
be more able to integrate the formal–housing sector.
A brief analysis of other ADR programs in the world showed that in all of the case studies,
specific ADR reception and generation areas were designated based on urban sustainable–
development criteria. This designation allows local and regional authorities to increase density in
neighborhoods having enough infrastructures to absorb a larger population. The ADR program
of the SRS policy in Mumbai does not specify in which wards ADR can be generated and in
which areas they can be consumed, but only states the rule that the consumption site of Transfer
Development Rights (TDRs) has to be outside Island City and to the north of the generating
project. The failure to designate neighborhoods receptors of ADR in the city of Mumbai leaves
development in the hands of the private sector, whose sole objective is to maximize its profits in
the selection of areas for densification, regardless of the capacities of the existing urban
infrastructure.
A close examination of the number of projects developed in each ward and the number of
TDRs generated and consumed in each ward evidenced a pattern in slum rehabilitation leading to
a concentration of the density increase in the wealthiest neighborhoods outside Island City.
144
Results suggest that private developers have a preference for low–density slums in rich areas,
which allow them to consume ADR in–situ, and high–density slums in poor areas, which allow
them to generate large amount of TDRs to be consumed in rich areas.
In conclusion, the SRS is–without a doubt–a very innovative policy since it allows local
authorities to shift the burden of rehousing slum dwellers in adequate housing to the private
sector. It is a very attractive alternative for local authorities who lack the capacities to finance
ambitious slum absorption policies at a city level by themselves. However, although the SRS has
improved the quality of life of a significant proportion of the slum population, it will not, by
itself, be able to make Mumbai a slum–free city. Furthermore, the economic rationale of private
developers is leading to the densification of the richest neighborhoods, thus requiring additional
public investment to adapt exiting infrastructure to new demands.
145
Chapter 8
Moving in, Selling Out: The Outcomes of Slum Rehabilitation in Mumbai1
Abstract One of the possible side–effects of slum policies is policy–induced residential mobility associated with
gentrification and poverty recycling. Poverty recycling is related to the incapacity of slum households to
support the cost of living in formal housing, who might be forced to move back to slum settlements. This
paper identifies the magnitude and causes of residential mobility using the Slum Rehabilitation Scheme (SRS)
of the city of Mumbai as an example. It is based on the results of an exhaustive household survey,
comprising 510 households. Results show that the magnitude of poverty recycling and gentrification is
small, and that in most cases post–rehabilitation residential mobility is associated with incompatible
housing attributes. Higher levels of residential mobility actually serve as a platform to attain better living
conditions, both for those who left as well as for new comers.
Résumé Une des possibles effets secondaires des politiques de résorption des bidonvilles est la mobilité
résidentielle associée à des phénomènes de gentrification et de ‗recyclage de la pauvreté‘. Le recyclage de la
pauvreté est lié à l‘incapacité des ménages à faire face aux couts associés à la vie dans un logement légaux,
et leur possible retour aux bidonvilles. Cet article évalue l‘ampleur et les causes de la mobilité résidentielle
dans le cas du Schéma de Réhabilitation des Bidonvilles (SRB) de la ville de Mumbai. Il est basé sur les
résultats d'une enquête auprès de 510 ménages. Les résultats montrent que l‘ampleur du recyclage de la
pauvreté et de la géntrification est faible, et que la mobilité dans la plupart des cas est associée à des
attributs des logements après réhabilitation qui sont incompatibles avec les besoins des ménages. Dans la
plupart des cas, la mobilité résidentielle se traduit par de meilleures conditions de vie, tant pour ceux qui
sont partis que pour les nouveaux venus.
1 This research and data collection was financed by the French Energy Council. I am grateful to the World Bank-
Delhi for providing useful information and recommendations. I also thank R.N Sharma and A.Bhide of the Tata Institute of Social Sciences for their invaluable suggestions and kindness. Finally, without the wonderful staff of the Slum Rehabilitation Society, the completion of the household survey would not have been possible.
146
1. Introduction
Seventy million inhabitants, or the equivalent of creating 7 new mega-cities from scratch, are
added each year to cities worldwide. While most of this urban growth is occurring in developing
countries, about half of the new population is being absorbed by the informal–housing sector. By
2040, estimates suggest that there will be two billion slum dwellers, and slums will be housing
about one third of the total urban population (UN, 2007). The recognition of slums as a menace
to the ―planned city,‖ along with their high correlation with poverty, have made slum
improvement a priority for many local governments and international organizations. Slum and
housing policies have multiplied, bringing new waves of thinking and original solutions that
extend beyond the goal of just providing a house. Furthermore, recent studies have revealed that
slum policies, by changing the living environment, might trigger other important positive changes
as well as some unwanted side-effects. Among the stated benefits of slum policies are poverty
reduction, higher gender equality, better access to credit and higher income generation (Aiga and
Umenai, 2002; Cattaneo et al., 2009; Field, 2007).
This paper focuses on one of the possible side effects of slum rehabilitation policies: policy-
induced residential mobility. Our interest in this subject came from a recurrent statement made
by policy makers, non-governmental organizations and some researchers about how a significant
proportion of slum dwellers moved out of their new homes after slum policies took place.
Generally, two causes are mentioned at the core of this phenomenon. The first suggest that as
many slums are located in prime areas, their inclusion in the formal real–estate market might
increases the value of property and generate a gentrification process in which the poor end up
being pushed out. According to Payne (2001), the provision of land titles may increase property
values and displace most vulnerable groups in favor of groups with higher incomes. Gravois
(2005) states how ―for a poor squatter in the middle of the capital city, the promise of a title would seem to be a
road to riches…but in practice, it is more like a sign taped to his back that says, kick me”.
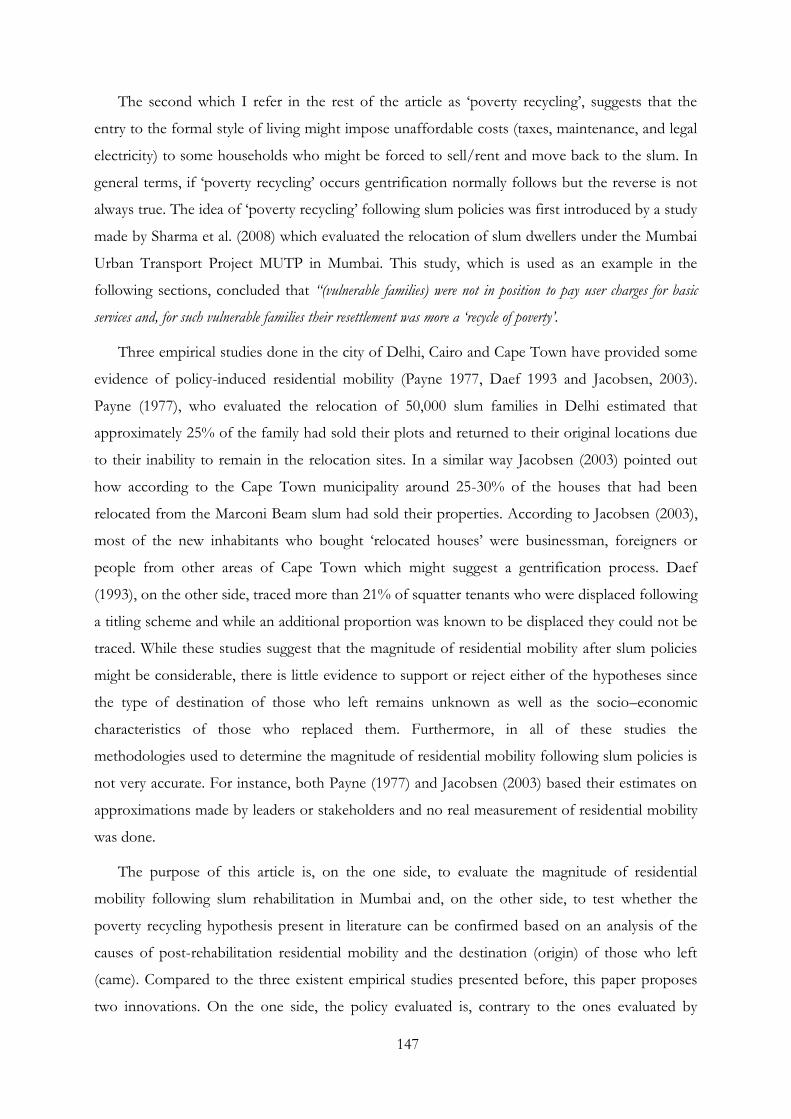
147
The second which I refer in the rest of the article as ‗poverty recycling‘, suggests that the
entry to the formal style of living might impose unaffordable costs (taxes, maintenance, and legal
electricity) to some households who might be forced to sell/rent and move back to the slum. In
general terms, if ‗poverty recycling‘ occurs gentrification normally follows but the reverse is not
always true. The idea of ‗poverty recycling‘ following slum policies was first introduced by a study
made by Sharma et al. (2008) which evaluated the relocation of slum dwellers under the Mumbai
Urban Transport Project MUTP in Mumbai. This study, which is used as an example in the
following sections, concluded that “(vulnerable families) were not in position to pay user charges for basic
services and, for such vulnerable families their resettlement was more a „recycle of poverty‟.
Three empirical studies done in the city of Delhi, Cairo and Cape Town have provided some
evidence of policy-induced residential mobility (Payne 1977, Daef 1993 and Jacobsen, 2003).
Payne (1977), who evaluated the relocation of 50,000 slum families in Delhi estimated that
approximately 25% of the family had sold their plots and returned to their original locations due
to their inability to remain in the relocation sites. In a similar way Jacobsen (2003) pointed out
how according to the Cape Town municipality around 25-30% of the houses that had been
relocated from the Marconi Beam slum had sold their properties. According to Jacobsen (2003),
most of the new inhabitants who bought ‗relocated houses‘ were businessman, foreigners or
people from other areas of Cape Town which might suggest a gentrification process. Daef
(1993), on the other side, traced more than 21% of squatter tenants who were displaced following
a titling scheme and while an additional proportion was known to be displaced they could not be
traced. While these studies suggest that the magnitude of residential mobility after slum policies
might be considerable, there is little evidence to support or reject either of the hypotheses since
the type of destination of those who left remains unknown as well as the socio–economic
characteristics of those who replaced them. Furthermore, in all of these studies the
methodologies used to determine the magnitude of residential mobility following slum policies is
not very accurate. For instance, both Payne (1977) and Jacobsen (2003) based their estimates on
approximations made by leaders or stakeholders and no real measurement of residential mobility
was done.
The purpose of this article is, on the one side, to evaluate the magnitude of residential
mobility following slum rehabilitation in Mumbai and, on the other side, to test whether the
poverty recycling hypothesis present in literature can be confirmed based on an analysis of the
causes of post-rehabilitation residential mobility and the destination (origin) of those who left
(came). Compared to the three existent empirical studies presented before, this paper proposes
two innovations. On the one side, the policy evaluated is, contrary to the ones evaluated by
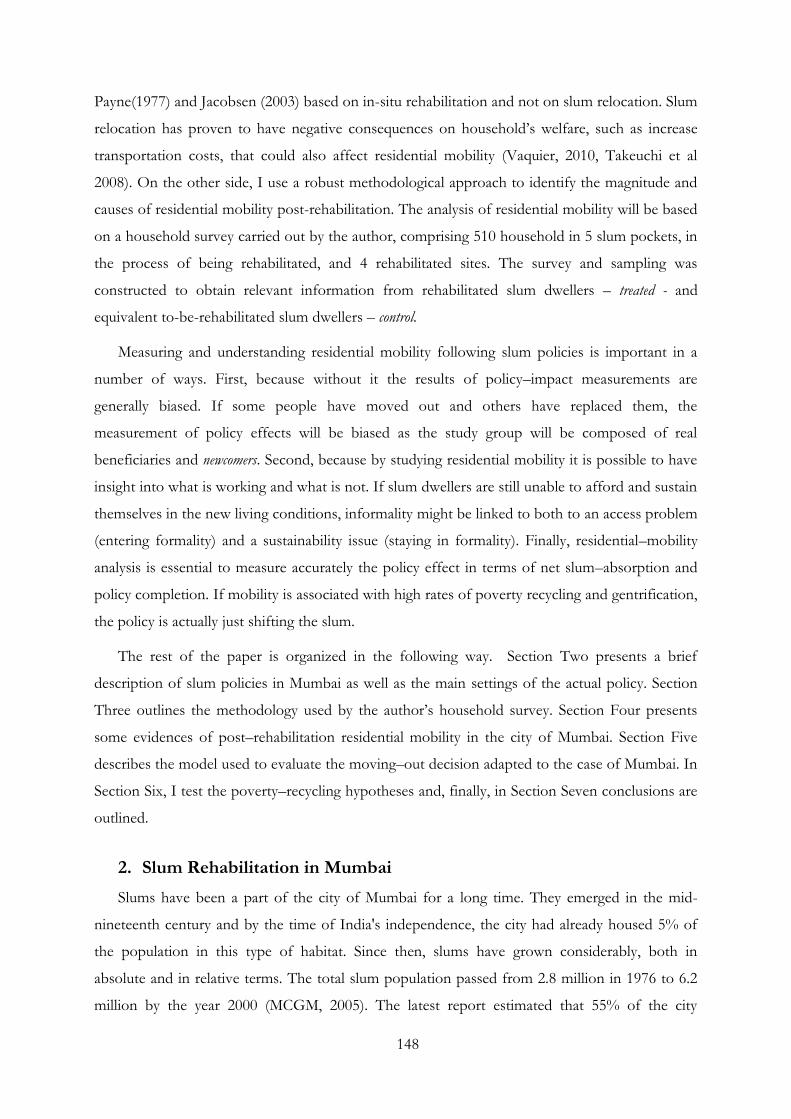
148
Payne(1977) and Jacobsen (2003) based on in-situ rehabilitation and not on slum relocation. Slum
relocation has proven to have negative consequences on household‘s welfare, such as increase
transportation costs, that could also affect residential mobility (Vaquier, 2010, Takeuchi et al
2008). On the other side, I use a robust methodological approach to identify the magnitude and
causes of residential mobility post-rehabilitation. The analysis of residential mobility will be based
on a household survey carried out by the author, comprising 510 household in 5 slum pockets, in
the process of being rehabilitated, and 4 rehabilitated sites. The survey and sampling was
constructed to obtain relevant information from rehabilitated slum dwellers – treated - and
equivalent to-be-rehabilitated slum dwellers – control.
Measuring and understanding residential mobility following slum policies is important in a
number of ways. First, because without it the results of policy–impact measurements are
generally biased. If some people have moved out and others have replaced them, the
measurement of policy effects will be biased as the study group will be composed of real
beneficiaries and newcomers. Second, because by studying residential mobility it is possible to have
insight into what is working and what is not. If slum dwellers are still unable to afford and sustain
themselves in the new living conditions, informality might be linked to both to an access problem
(entering formality) and a sustainability issue (staying in formality). Finally, residential–mobility
analysis is essential to measure accurately the policy effect in terms of net slum–absorption and
policy completion. If mobility is associated with high rates of poverty recycling and gentrification,
the policy is actually just shifting the slum.
The rest of the paper is organized in the following way. Section Two presents a brief
description of slum policies in Mumbai as well as the main settings of the actual policy. Section
Three outlines the methodology used by the author‘s household survey. Section Four presents
some evidences of post–rehabilitation residential mobility in the city of Mumbai. Section Five
describes the model used to evaluate the moving–out decision adapted to the case of Mumbai. In
Section Six, I test the poverty–recycling hypotheses and, finally, in Section Seven conclusions are
outlined.
2. Slum Rehabilitation in Mumbai
Slums have been a part of the city of Mumbai for a long time. They emerged in the mid-
nineteenth century and by the time of India's independence, the city had already housed 5% of
the population in this type of habitat. Since then, slums have grown considerably, both in
absolute and in relative terms. The total slum population passed from 2.8 million in 1976 to 6.2
million by the year 2000 (MCGM, 2005). The latest report estimated that 55% of the city
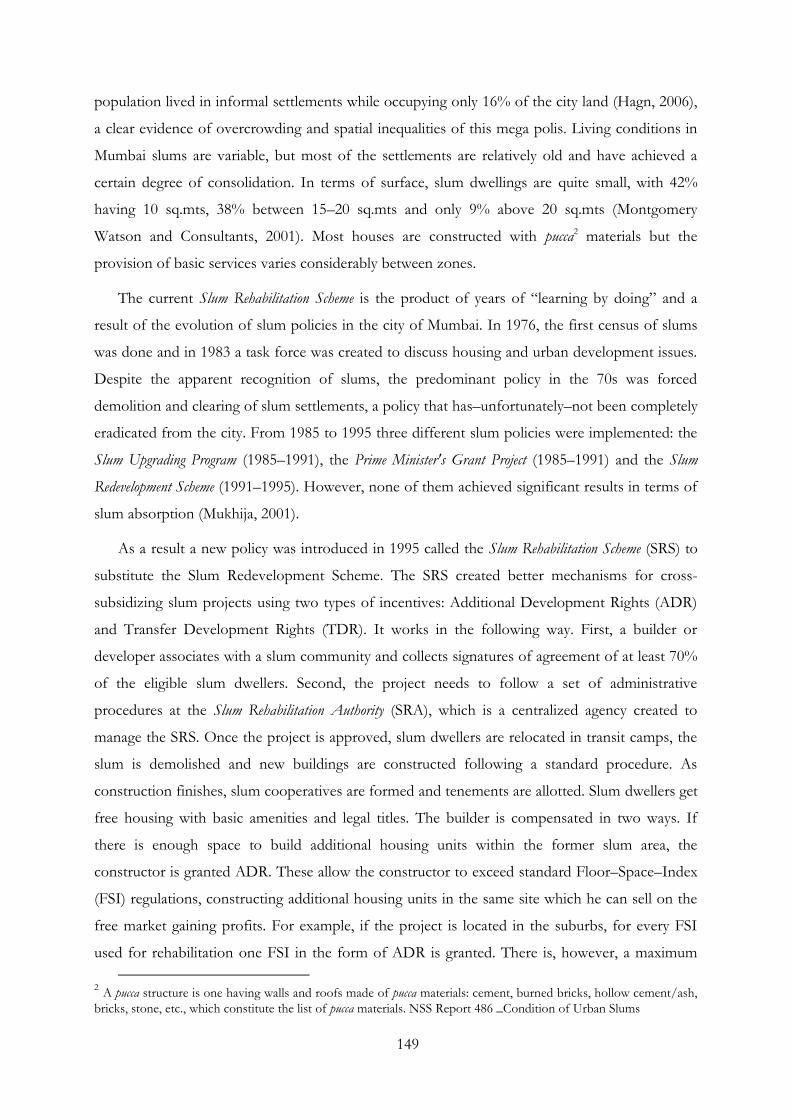
149
population lived in informal settlements while occupying only 16% of the city land (Hagn, 2006),
a clear evidence of overcrowding and spatial inequalities of this mega polis. Living conditions in
Mumbai slums are variable, but most of the settlements are relatively old and have achieved a
certain degree of consolidation. In terms of surface, slum dwellings are quite small, with 42%
having 10 sq.mts, 38% between 15–20 sq.mts and only 9% above 20 sq.mts (Montgomery
Watson and Consultants, 2001). Most houses are constructed with pucca2 materials but the
provision of basic services varies considerably between zones.
The current Slum Rehabilitation Scheme is the product of years of ―learning by doing‖ and a
result of the evolution of slum policies in the city of Mumbai. In 1976, the first census of slums
was done and in 1983 a task force was created to discuss housing and urban development issues.
Despite the apparent recognition of slums, the predominant policy in the 70s was forced
demolition and clearing of slum settlements, a policy that has–unfortunately–not been completely
eradicated from the city. From 1985 to 1995 three different slum policies were implemented: the
Slum Upgrading Program (1985–1991), the Prime Minister's Grant Project (1985–1991) and the Slum
Redevelopment Scheme (1991–1995). However, none of them achieved significant results in terms of
slum absorption (Mukhija, 2001).
As a result a new policy was introduced in 1995 called the Slum Rehabilitation Scheme (SRS) to
substitute the Slum Redevelopment Scheme. The SRS created better mechanisms for cross-
subsidizing slum projects using two types of incentives: Additional Development Rights (ADR)
and Transfer Development Rights (TDR). It works in the following way. First, a builder or
developer associates with a slum community and collects signatures of agreement of at least 70%
of the eligible slum dwellers. Second, the project needs to follow a set of administrative
procedures at the Slum Rehabilitation Authority (SRA), which is a centralized agency created to
manage the SRS. Once the project is approved, slum dwellers are relocated in transit camps, the
slum is demolished and new buildings are constructed following a standard procedure. As
construction finishes, slum cooperatives are formed and tenements are allotted. Slum dwellers get
free housing with basic amenities and legal titles. The builder is compensated in two ways. If
there is enough space to build additional housing units within the former slum area, the
constructor is granted ADR. These allow the constructor to exceed standard Floor–Space–Index
(FSI) regulations, constructing additional housing units in the same site which he can sell on the
free market gaining profits. For example, if the project is located in the suburbs, for every FSI
used for rehabilitation one FSI in the form of ADR is granted. There is, however, a maximum
2 A pucca structure is one having walls and roofs made of pucca materials: cement, burned bricks, hollow cement/ash,
bricks, stone, etc., which constitute the list of pucca materials. NSS Report 486 _Condition of Urban Slums
150
level of FSI that cannot be exceeded, which brings us to the second form of compensation. If
there is not enough space to use all ADR in the slum area, the constructor is granted TDR, which
he can sell on the market and another constructor can use to build additional space in another
part of the city3.
3. Materials and methods
The analysis of the magnitude of policy–induced residential mobility–in Section Four–will be
based on three household surveys; the first two were carried out by the Tata Institute of Social
Sciences (TISS) and the third, by the author in cooperation with the Slum Rehabilitation Society
(srsindia.org). However, the analysis of the causes and effects of post–rehabilitation residential
mobility–in Sections Five and Six–will be based only on the survey carried out by the author
since the other two surveys did not have all of the information required.
The first of the surveys corresponds to a household survey done in 2003 by Bhide et al. of
the TISS for the Slum Rehabilitation Authority. It covered 151 rehabilitation sites spread over 19
wards and a total of 2,138 households. A random sampling of 10% of the households in each of
the sites was done. The second survey, carried out by Sharma et al. was also prepared by the TISS
in 2008 but for the Mumbai Metropolitan Region Development Authority (MMRDA). It
intended to analyze the impact of relocating slum dwellers under the Mumbai Urban
Transportation Project–MUTP. It involved a sample of 1,505 of Project–Affected Households,
which corresponds to approximately 20% of the total relocated population. The third survey,
done by the author, comprised a sample of 510 households spread over nine sites and was carried
out to fill–in the blanks of two previous surveys carried out by the TISS. Since in the first two
studies only households who had benefited from slum rehabilitation or resettlement were
sampled, it was not possible, from their results, to correctly evaluate changes produced by
treatment. Therefore, in the author‘s study a control group was introduced, composed of future
policy beneficiaries and additional questions on mobility determinants (why did households leave?)
and on abandonment destination (where did households move?) were made.
Apart from residential mobility the author‘s survey took into account issues like time
allocation, education, access to credit and basic services provision. Two types of settlements were
sampled: the first–referred to as the treated group–corresponds to four slum pockets that have
already benefited from the SRS policy; the second–referred to as the control group–corresponds to
five slum pockets that are in the process of being rehabilitated. To avoid ‗selection bias‘ I use two
3 TDR‘s can only be sold or transferred to projects located to the north of the generating project and cannot be used in Island City. For more information on SRS incentive mechanisms, please refer to Chandy, 2007
151
criteria to identify convincing control groups, as suggested by Field and Kremer (2006): (1) time
discontinuities in the policy‘s implementation and (2) controlling for ex–ante characteristics of
treated and control households. First, a number of slum sites that had launched the slum
rehabilitation process but had not yet been rehabilitated were identified4. Second, a series of pre–
survey questionnaires and meeting with leaders were carried out covering all of the potential
control slum sites and a number of rehabilitated sites (treated). Finally, five slum sites and four
rehabilitated sites that had very similar ex–ante characteristics were selected. This methodology is
similar to the one used by Field (2007) who also used time discontinuities in a massive titling
campaign in Peru to evaluate the policy‘s effect on labor supply. However, this is the first study
to apply this type of methodology for the analysis of residential mobility following slum
rehabilitation.
The final group of settlements selected was very similar: around 60% gained area after
rehabilitation; most of the slum houses structures were made of durable materials; and a very
small proportion had separate bathrooms, an indoor piped–water connection or toilets. Random
sampling of around 35% of the households was done in each of the sites. In order to do so, a
number of field visits were made previous to the survey to identify slum limits, and maps of both
buildings and slum pockets were collected. Since the SRS policy dictates that only slum
households who can prove that they live in Mumbai prior to 1st January 1995, meaning that the
sites in the survey conducted by the author had to meet this criteria, the sites sampled can be
found to be more consolidated that more recent slums in Mumbai. Therefore our analysis might
only be representative of more or less consolidated slum settlements and the SRS policy‘s effect
might be different if less consolidated and poorer slum settlements were to benefit.
For the purpose of this article, households that did not belong to the original group of
beneficiaries will be referred to as newcomers. Households that benefited from the initial policy will
be referred to as original occupants. In order to identify newcomers I used a different methodology
than the one used by Bhide et al. (2003) and Sharma et al. (2008), who compared the list of
beneficiaries of each of the sites, provided by authorities, with households found during the field
work. In our case, since data at the household level of all the policy beneficiaries was not
available for all of the sites, newcomers were differentiated from original occupants using a test
questionnaire where households were asked a series of questions on their previous and current
living conditions. When the test questionnaire result was positive, meaning that the household
belonged to the newcomers group, the interviewer moved on to the newcomers‟ module to ask the
4 At the time of the survey (August, 2009), most of control group settlements had already collected 70% or more of
the required signatures and passed administrative procedures at the SRA to prove the eligibility of slum dwellers.
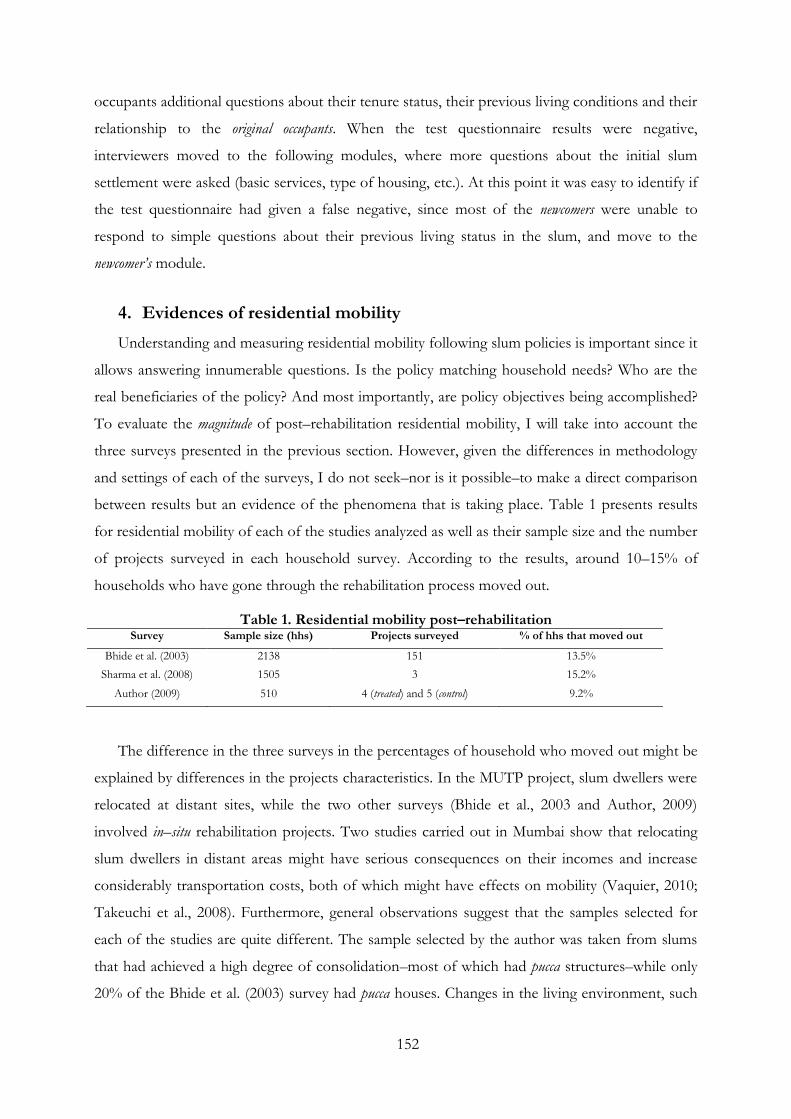
152
occupants additional questions about their tenure status, their previous living conditions and their
relationship to the original occupants. When the test questionnaire results were negative,
interviewers moved to the following modules, where more questions about the initial slum
settlement were asked (basic services, type of housing, etc.). At this point it was easy to identify if
the test questionnaire had given a false negative, since most of the newcomers were unable to
respond to simple questions about their previous living status in the slum, and move to the
newcomer‟s module.
4. Evidences of residential mobility
Understanding and measuring residential mobility following slum policies is important since it
allows answering innumerable questions. Is the policy matching household needs? Who are the
real beneficiaries of the policy? And most importantly, are policy objectives being accomplished?
To evaluate the magnitude of post–rehabilitation residential mobility, I will take into account the
three surveys presented in the previous section. However, given the differences in methodology
and settings of each of the surveys, I do not seek–nor is it possible–to make a direct comparison
between results but an evidence of the phenomena that is taking place. Table 1 presents results
for residential mobility of each of the studies analyzed as well as their sample size and the number
of projects surveyed in each household survey. According to the results, around 10–15% of
households who have gone through the rehabilitation process moved out.
Table 1. Residential mobility post–rehabilitation Survey Sample size (hhs) Projects surveyed % of hhs that moved out
Bhide et al. (2003) 2138
(10% per project)
151 13.5%
Sharma et al. (2008) 1505
(20% per project)
3 15.2%
Author (2009) 510
(35% per project)
4 (treated) and 5 (control) 9.2%
The difference in the three surveys in the percentages of household who moved out might be
explained by differences in the projects characteristics. In the MUTP project, slum dwellers were
relocated at distant sites, while the two other surveys (Bhide et al., 2003 and Author, 2009)
involved in–situ rehabilitation projects. Two studies carried out in Mumbai show that relocating
slum dwellers in distant areas might have serious consequences on their incomes and increase
considerably transportation costs, both of which might have effects on mobility (Vaquier, 2010;
Takeuchi et al., 2008). Furthermore, general observations suggest that the samples selected for
each of the studies are quite different. The sample selected by the author was taken from slums
that had achieved a high degree of consolidation–most of which had pucca structures–while only
20% of the Bhide et al. (2003) survey had pucca houses. Changes in the living environment, such
153
as evolution in the housing market, can also be a source of divergence but it is not possible to
account for this effect.
Compared to the three other studies available in literature (Payne 1977, Daef 1993 and
Jacobsen, 2003) which suggest rates of moving out between 10–30%, the SRS seems to generate
lower levels of post–rehabilitation residential mobility. However, as mention before, the
methodology used to measure residential mobility in prior empirical studies was not very robust
as it was based on approximations made by stakeholders (i.e. mayor‘s office), or community
leaders. Furthermore, to have a clear idea of the effects on residential mobility of the SRS policy,
it is necessary to take a look at residential mobility before slum rehabilitation took place. The
Bhide et al. (2003) survey included a question that asked policy beneficiaries how many times they
had moved before rehabilitation. Results shown in Figure 1 indicate that for 78% of the policy
beneficiaries, slum rehabilitation represented their first shift in dwelling. On average, households
sampled by the Bhide et al. (2003) survey had lived in Mumbai for 25 years before rehabilitation
took place and for 3.3 years in new rehabilitated apartments. A rough estimate, based on these
values, gives a 0.88% rate of households moving out of their houses every year before
rehabilitation takes place, which is equivalent to a moving–out rate of 2.9% in 3.3 years. The
latter suggests that residential mobility before rehabilitation was very low and that the SRS policy
might be generating higher levels of residential mobility.
The very low levels of residential mobility found in Mumbai slums confirms a similar pattern
found in other Indian cities and developing countries‘ cities. A study of residential mobility in
Bhopal slums made by Lall et al. (2006) suggested that slums are by no means temporal homes as
the average length of stay in the sample studied was around 21 years and some household had
been living in the same slum dwelling for more than two generations. Another study made by
Gilbert (1999), evidence the extremely limited residential mobility of owners in consolidated low-
income settlement in the city of Bogota(Colombia). In the following sections I analyze what the
causes of post–rehabilitation residential mobility and the consequences on slum–reduction
objectives are.
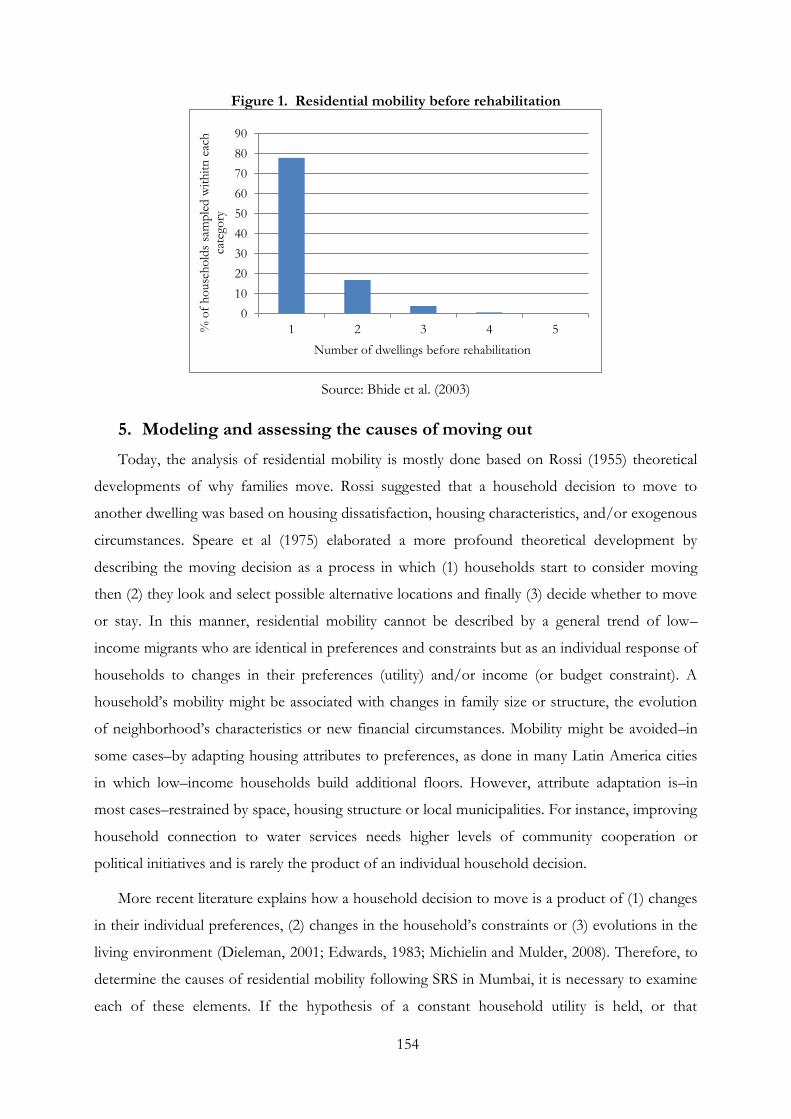
154
Figure 1. Residential mobility before rehabilitation
Source: Bhide et al. (2003)
5. Modeling and assessing the causes of moving out
Today, the analysis of residential mobility is mostly done based on Rossi (1955) theoretical
developments of why families move. Rossi suggested that a household decision to move to
another dwelling was based on housing dissatisfaction, housing characteristics, and/or exogenous
circumstances. Speare et al (1975) elaborated a more profound theoretical development by
describing the moving decision as a process in which (1) households start to consider moving
then (2) they look and select possible alternative locations and finally (3) decide whether to move
or stay. In this manner, residential mobility cannot be described by a general trend of low–
income migrants who are identical in preferences and constraints but as an individual response of
households to changes in their preferences (utility) and/or income (or budget constraint). A
household‘s mobility might be associated with changes in family size or structure, the evolution
of neighborhood‘s characteristics or new financial circumstances. Mobility might be avoided–in
some cases–by adapting housing attributes to preferences, as done in many Latin America cities
in which low–income households build additional floors. However, attribute adaptation is–in
most cases–restrained by space, housing structure or local municipalities. For instance, improving
household connection to water services needs higher levels of community cooperation or
political initiatives and is rarely the product of an individual household decision.
More recent literature explains how a household decision to move is a product of (1) changes
in their individual preferences, (2) changes in the household‘s constraints or (3) evolutions in the
living environment (Dieleman, 2001; Edwards, 1983; Michielin and Mulder, 2008). Therefore, to
determine the causes of residential mobility following SRS in Mumbai, it is necessary to examine
each of these elements. If the hypothesis of a constant household utility is held, or that
0
10
20
30
40
50
60
70
80
90
1 2 3 4 5 % o
f h
ouse
ho
lds
sam
ple
d w
ith
itn
eac
h
cate
gory
Number of dwellings before rehabilitation
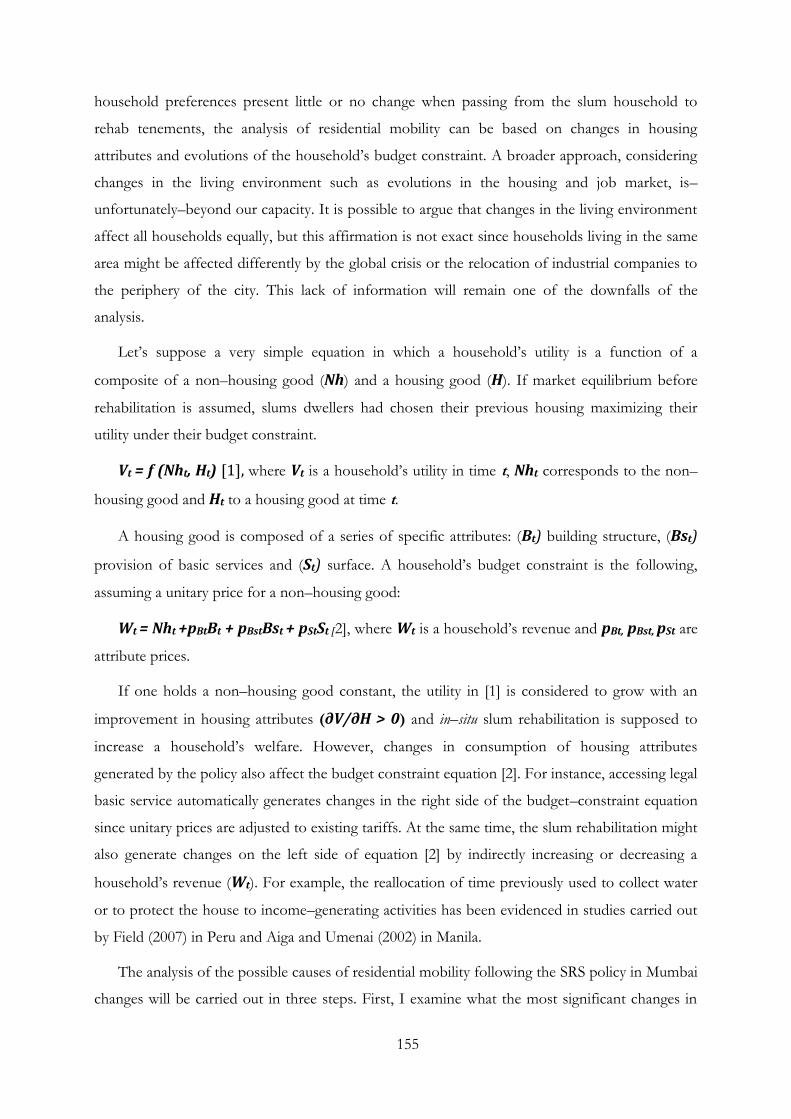
155
household preferences present little or no change when passing from the slum household to
rehab tenements, the analysis of residential mobility can be based on changes in housing
attributes and evolutions of the household‘s budget constraint. A broader approach, considering
changes in the living environment such as evolutions in the housing and job market, is–
unfortunately–beyond our capacity. It is possible to argue that changes in the living environment
affect all households equally, but this affirmation is not exact since households living in the same
area might be affected differently by the global crisis or the relocation of industrial companies to
the periphery of the city. This lack of information will remain one of the downfalls of the
analysis.
Let‘s suppose a very simple equation in which a household‘s utility is a function of a
composite of a non–housing good (Nh) and a housing good (H). If market equilibrium before
rehabilitation is assumed, slums dwellers had chosen their previous housing maximizing their
utility under their budget constraint.
Vt = f (Nht, Ht) [1], where Vt is a household‘s utility in time t, Nht corresponds to the non–
housing good and Ht to a housing good at time t.
A housing good is composed of a series of specific attributes: (Bt) building structure, (Bst)
provision of basic services and (St) surface. A household‘s budget constraint is the following,
assuming a unitary price for a non–housing good:
Wt = Nht +pBtBt + pBstBst + pStSt [2], where Wt is a household‘s revenue and pBt, pBst, pSt are
attribute prices.
If one holds a non–housing good constant, the utility in [1] is considered to grow with an
improvement in housing attributes (∂V/∂H > 0) and in–situ slum rehabilitation is supposed to
increase a household‘s welfare. However, changes in consumption of housing attributes
generated by the policy also affect the budget constraint equation [2]. For instance, accessing legal
basic service automatically generates changes in the right side of the budget–constraint equation
since unitary prices are adjusted to existing tariffs. At the same time, the slum rehabilitation might
also generate changes on the left side of equation [2] by indirectly increasing or decreasing a
household‘s revenue (Wt). For example, the reallocation of time previously used to collect water
or to protect the house to income–generating activities has been evidenced in studies carried out
by Field (2007) in Peru and Aiga and Umenai (2002) in Manila.
The analysis of the possible causes of residential mobility following the SRS policy in Mumbai
changes will be carried out in three steps. First, I examine what the most significant changes in
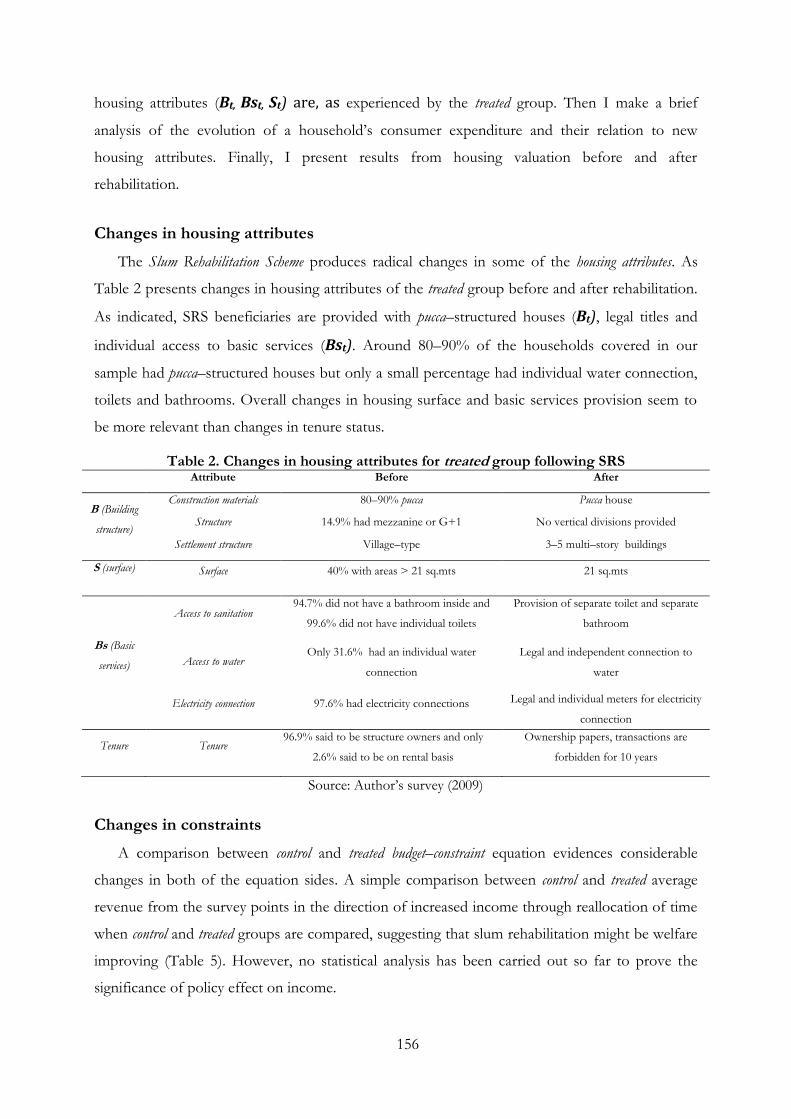
156
housing attributes (Bt, Bst, St) are, as experienced by the treated group. Then I make a brief
analysis of the evolution of a household‘s consumer expenditure and their relation to new
housing attributes. Finally, I present results from housing valuation before and after
rehabilitation.
Changes in housing attributes
The Slum Rehabilitation Scheme produces radical changes in some of the housing attributes. As
Table 2 presents changes in housing attributes of the treated group before and after rehabilitation.
As indicated, SRS beneficiaries are provided with pucca–structured houses (Bt), legal titles and
individual access to basic services (Bst). Around 80–90% of the households covered in our
sample had pucca–structured houses but only a small percentage had individual water connection,
toilets and bathrooms. Overall changes in housing surface and basic services provision seem to
be more relevant than changes in tenure status.
Table 2. Changes in housing attributes for treated group following SRS Attribute Before After
B (Building
structure)
Construction materials 80–90% pucca Pucca house
Structure 14.9% had mezzanine or G+1 No vertical divisions provided
Settlement structure Village–type 3–5 multi–story buildings
S (surface) Surface 40% with areas > 21 sq.mts 21 sq.mts
Bs (Basic
services)
Access to sanitation 94.7% did not have a bathroom inside and
99.6% did not have individual toilets
Provision of separate toilet and separate
bathroom
Access to water Only 31.6% had an individual water
connection
Legal and independent connection to
water
Electricity connection 97.6% had electricity connections Legal and individual meters for electricity
connection
Tenure Tenure 96.9% said to be structure owners and only
2.6% said to be on rental basis
Ownership papers, transactions are
forbidden for 10 years
Source: Author‘s survey (2009)
Changes in constraints
A comparison between control and treated budget–constraint equation evidences considerable
changes in both of the equation sides. A simple comparison between control and treated average
revenue from the survey points in the direction of increased income through reallocation of time
when control and treated groups are compared, suggesting that slum rehabilitation might be welfare
improving (Table 5). However, no statistical analysis has been carried out so far to prove the
significance of policy effect on income.
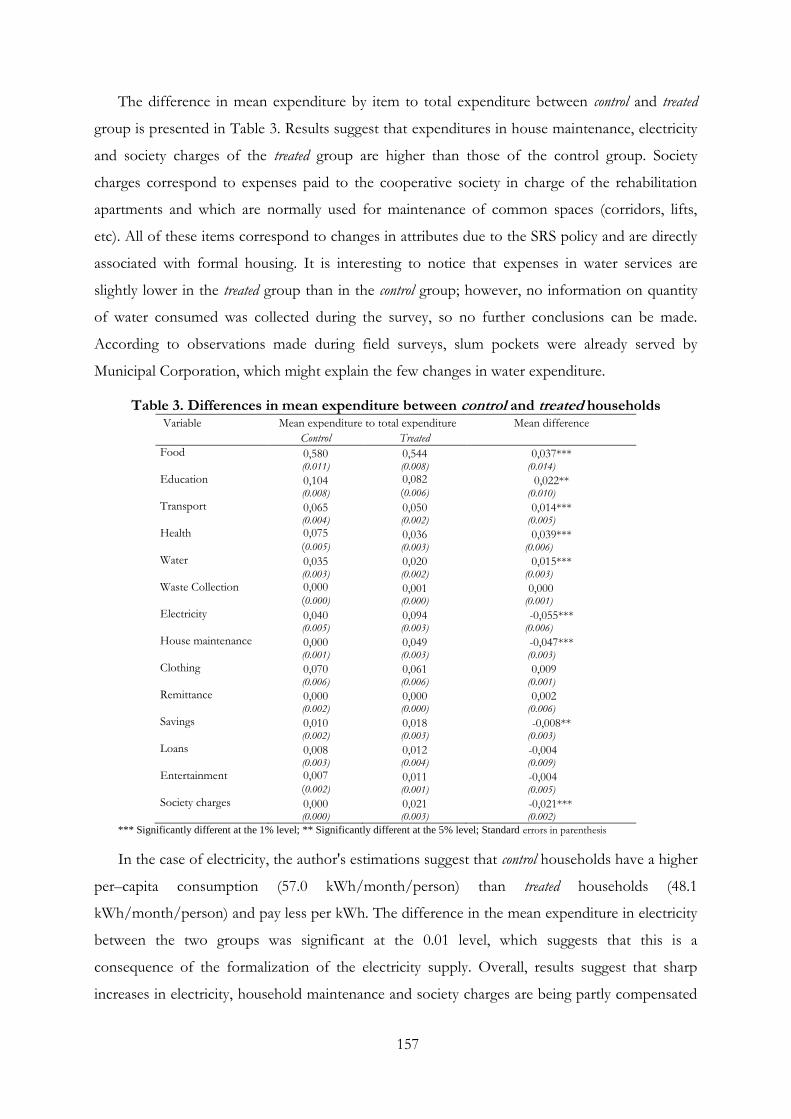
157
The difference in mean expenditure by item to total expenditure between control and treated
group is presented in Table 3. Results suggest that expenditures in house maintenance, electricity
and society charges of the treated group are higher than those of the control group. Society
charges correspond to expenses paid to the cooperative society in charge of the rehabilitation
apartments and which are normally used for maintenance of common spaces (corridors, lifts,
etc). All of these items correspond to changes in attributes due to the SRS policy and are directly
associated with formal housing. It is interesting to notice that expenses in water services are
slightly lower in the treated group than in the control group; however, no information on quantity
of water consumed was collected during the survey, so no further conclusions can be made.
According to observations made during field surveys, slum pockets were already served by
Municipal Corporation, which might explain the few changes in water expenditure.
Table 3. Differences in mean expenditure between control and treated households Variable Mean expenditure to total expenditure Mean difference
Control Treated
Food
0,580 (0.011)
0,544 (0.008)
0,037*** (0.014)
Education
0,104 (0.008)
0,082 (0.006)
0,022** (0.010)
Transport
0,065 (0.004)
0,050 (0.002)
0,014*** (0.005)
Health
0,075 (0.005)
0,036 (0.003)
0,039*** (0.006)
Water
0,035 (0.003)
0,020 (0.002)
0,015*** (0.003)
Waste Collection
0,000 (0.000)
0,001 (0.000)
0,000 (0.001)
Electricity
0,040 (0.005)
0,094 (0.003)
-0,055*** (0.006)
House maintenance
0,000 (0.001)
0,049 (0.003)
-0,047*** (0.003)
Clothing
0,070 (0.006)
0,061 (0.006)
0,009 (0.001)
Remittance
0,000 (0.002)
0,000 (0.000)
0,002 (0.006)
Savings
0,010 (0.002)
0,018 (0.003)
-0,008** (0.003)
Loans
0,008 (0.003)
0,012 (0.004)
-0,004 (0.009)
Entertainment
0,007 (0.002)
0,011 (0.001)
-0,004 (0.005)
Society charges
0,000 (0.000)
0,021 (0.003)
-0,021*** (0.002)
*** Significantly different at the 1% level; ** Significantly different at the 5% level; Standard errors in parenthesis
In the case of electricity, the author's estimations suggest that control households have a higher
per–capita consumption (57.0 kWh/month/person) than treated households (48.1
kWh/month/person) and pay less per kWh. The difference in the mean expenditure in electricity
between the two groups was significant at the 0.01 level, which suggests that this is a
consequence of the formalization of the electricity supply. Overall, results suggest that sharp
increases in electricity, household maintenance and society charges are being partly compensated
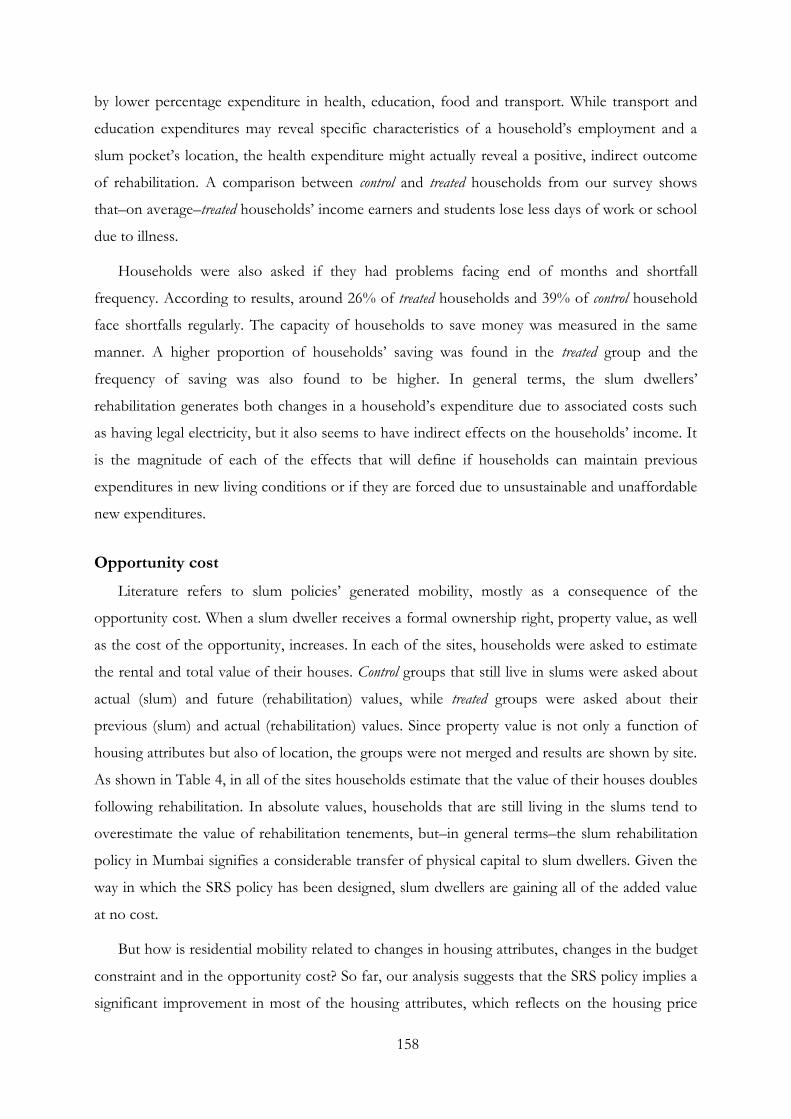
158
by lower percentage expenditure in health, education, food and transport. While transport and
education expenditures may reveal specific characteristics of a household‘s employment and a
slum pocket‘s location, the health expenditure might actually reveal a positive, indirect outcome
of rehabilitation. A comparison between control and treated households from our survey shows
that–on average–treated households‘ income earners and students lose less days of work or school
due to illness.
Households were also asked if they had problems facing end of months and shortfall
frequency. According to results, around 26% of treated households and 39% of control household
face shortfalls regularly. The capacity of households to save money was measured in the same
manner. A higher proportion of households‘ saving was found in the treated group and the
frequency of saving was also found to be higher. In general terms, the slum dwellers‘
rehabilitation generates both changes in a household‘s expenditure due to associated costs such
as having legal electricity, but it also seems to have indirect effects on the households‘ income. It
is the magnitude of each of the effects that will define if households can maintain previous
expenditures in new living conditions or if they are forced due to unsustainable and unaffordable
new expenditures.
Opportunity cost
Literature refers to slum policies‘ generated mobility, mostly as a consequence of the
opportunity cost. When a slum dweller receives a formal ownership right, property value, as well
as the cost of the opportunity, increases. In each of the sites, households were asked to estimate
the rental and total value of their houses. Control groups that still live in slums were asked about
actual (slum) and future (rehabilitation) values, while treated groups were asked about their
previous (slum) and actual (rehabilitation) values. Since property value is not only a function of
housing attributes but also of location, the groups were not merged and results are shown by site.
As shown in Table 4, in all of the sites households estimate that the value of their houses doubles
following rehabilitation. In absolute values, households that are still living in the slums tend to
overestimate the value of rehabilitation tenements, but–in general terms–the slum rehabilitation
policy in Mumbai signifies a considerable transfer of physical capital to slum dwellers. Given the
way in which the SRS policy has been designed, slum dwellers are gaining all of the added value
at no cost.
But how is residential mobility related to changes in housing attributes, changes in the budget
constraint and in the opportunity cost? So far, our analysis suggests that the SRS policy implies a
significant improvement in most of the housing attributes, which reflects on the housing price
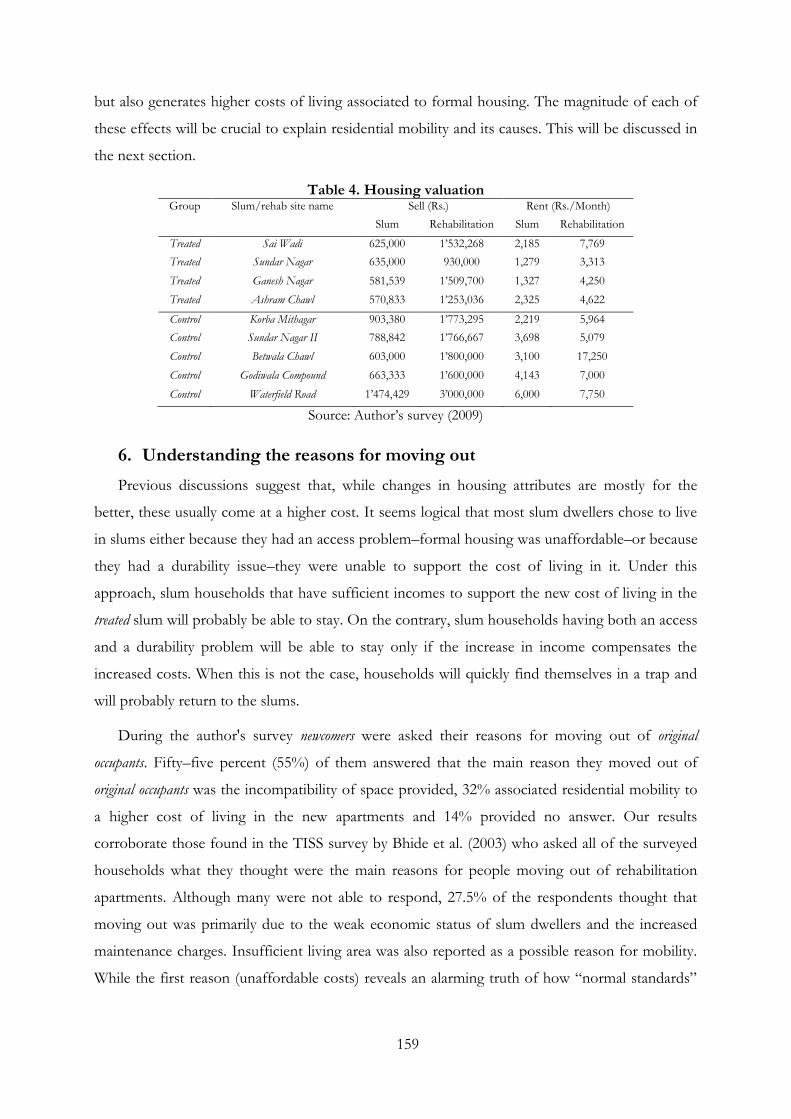
159
but also generates higher costs of living associated to formal housing. The magnitude of each of
these effects will be crucial to explain residential mobility and its causes. This will be discussed in
the next section.
Table 4. Housing valuation Group Slum/rehab site name Sell (Rs.) Rent (Rs./Month)
Slum Rehabilitation Slum Rehabilitation
Treated Sai Wadi 625,000 1‘532,268 2,185 7,769
Treated Sundar Nagar 635,000 930,000 1,279 3,313
Treated Ganesh Nagar 581,539 1‘509,700 1,327 4,250
Treated Ashram Chawl 570,833 1‘253,036 2,325 4,622
Control Korba Mithagar 903,380 1‘773,295 2,219 5,964
Control Sundar Nagar II 788,842 1‘766,667 3,698 5,079
Control Betwala Chawl 603,000 1‘800,000 3,100 17,250
Control Godiwala Compound 663,333 1‘600,000 4,143 7,000
Control Waterfield Road 1‘474,429 3‘000,000 6,000 7,750
Source: Author‘s survey (2009)
6. Understanding the reasons for moving out
Previous discussions suggest that, while changes in housing attributes are mostly for the
better, these usually come at a higher cost. It seems logical that most slum dwellers chose to live
in slums either because they had an access problem–formal housing was unaffordable–or because
they had a durability issue–they were unable to support the cost of living in it. Under this
approach, slum households that have sufficient incomes to support the new cost of living in the
treated slum will probably be able to stay. On the contrary, slum households having both an access
and a durability problem will be able to stay only if the increase in income compensates the
increased costs. When this is not the case, households will quickly find themselves in a trap and
will probably return to the slums.
During the author's survey newcomers were asked their reasons for moving out of original
occupants. Fifty–five percent (55%) of them answered that the main reason they moved out of
original occupants was the incompatibility of space provided, 32% associated residential mobility to
a higher cost of living in the new apartments and 14% provided no answer. Our results
corroborate those found in the TISS survey by Bhide et al. (2003) who asked all of the surveyed
households what they thought were the main reasons for people moving out of rehabilitation
apartments. Although many were not able to respond, 27.5% of the respondents thought that
moving out was primarily due to the weak economic status of slum dwellers and the increased
maintenance charges. Insufficient living area was also reported as a possible reason for mobility.
While the first reason (unaffordable costs) reveals an alarming truth of how ―normal standards‖
160
of living are simply not affordable for the poor, the second reason (incompatible living space)
evidences a failure in the policy to meet household needs.
The standardization of the SRS policy–providing equal surfaces and housing structures
regardless of original conditions–might be its Achilles heel. While local authorities argue that
giving areas of 21 sq.mts implies an improvement for most of the slum dwellers, four walls do
not make a home. The rigidity of new houses poses a serious problem since modification of
housing attributes is restrained. Differences in type of investments in housing made between
control and treated groups evidence these limitations: 22,2% of the control groups‘ investments in
housing are used for structural changes (adding divisions, mezzanine or doors) while only 10.9%
in the case of the treated group. Results also suggest that a good part of a household‘s investments
in housing after rehabilitation are directed towards the acquisition of durable goods (electrical
appliances and furniture).
These results show how slum dwellings, despite their constant stigmatization, seem to
provide more adaptable environments to household needs. Joshi (2006) states how “The priorities
of the slum dweller are frequently not those of the authorities or the developers. Space takes precedence over
permanence, function over aesthetic. A porch may be built before a bathroom”.
Poverty Recycling
Previous findings suggest that post–rehabilitation mobility might be associated with poverty
recycling. The poorest of former slum dwellers moving to rehabilitation apartments find they are
unable to support the higher cost of living and are forced to move back to the slums. But what is
the magnitude of this recycling and is it seriously damaging the overall efficiency of the policy? In
order to answer both of these questions, it is necessary to know both the original occupants‟
destinations and the newcomers‟ origins. Net slum absorption is given by the total number of
rehabilitated households minus poverty–recycled households plus newcomers coming from slums,
or:
Net Slum Absorption = Rehab. Households – Rehab. Households that went back to slums
+ Newcomers that previously lived in slums
In the author's survey newcomers were asked about their previous place of living and about the
original occupants‟ destination. Results are shown in Figure 2. While 44% of newcomers said they had
previously lived in slums, most of the original occupants (82%) moved out to formal housing. Out
of all the households leaving, only 18% went back to live in slums. Curiously, it seems that
mobility post–rehabilitation is actually increasing the net absorption rates by allowing additional
161
slum dwellers to enter formality. Newcomers were also asked the time they spent in their previous
residence and results indicate that around 72.7% had spent only five years or less in their
previous houses. This means that most of the newcomers who were previously living in the slums
are not eligible as beneficiaries of any rehabilitation policy, given policy deadline (1st January
1995).
Figure 2. Original occupants’ destinations and newcomers’ origins
During the survey, households were asked on what basis they were staying in rehabilitation
apartments. I found that the actual status of tenure differs according to newcomers‟ origins. Of the
newcomers who were previously living in slums, 72.7% are tenants and 90.9% of those previously
living in formal housing are now owners. In the case of original occupants, 36.4% of those renting
their apartments moved back to slums and 45.5% to formal housing, while 100% of those selling
their houses moved to formal housing (either in the city or outside of it). Furthermore, data on
income distribution suggests that status of tenure is associated with the level of income of the
household, as newcomers on rental status are–on average–poorer than newcomers who bought
rehabilitation tenements. Table 5 shows a comparison of general indicators of control, original
occupants (treated) and newcomers groups. Results show how newcomers are very similar to original
occupants, but seem to belong to a slightly richer income group.
A comparison between control and treated groups, from Table 5, evidences a decrease in the
household size and a positive displacement of the post - rehabilitation income distribution. While
the proportion of children less than five years old suggests a decrease in post–rehabilitation
fertility; smaller household size can also be associated with individual ―invisible mobility‖. To
cover for this, all treated households were asked if they had lost members after rehabilitation.
Results indicate that only 3.5% of treated households had lost members following rehabilitation
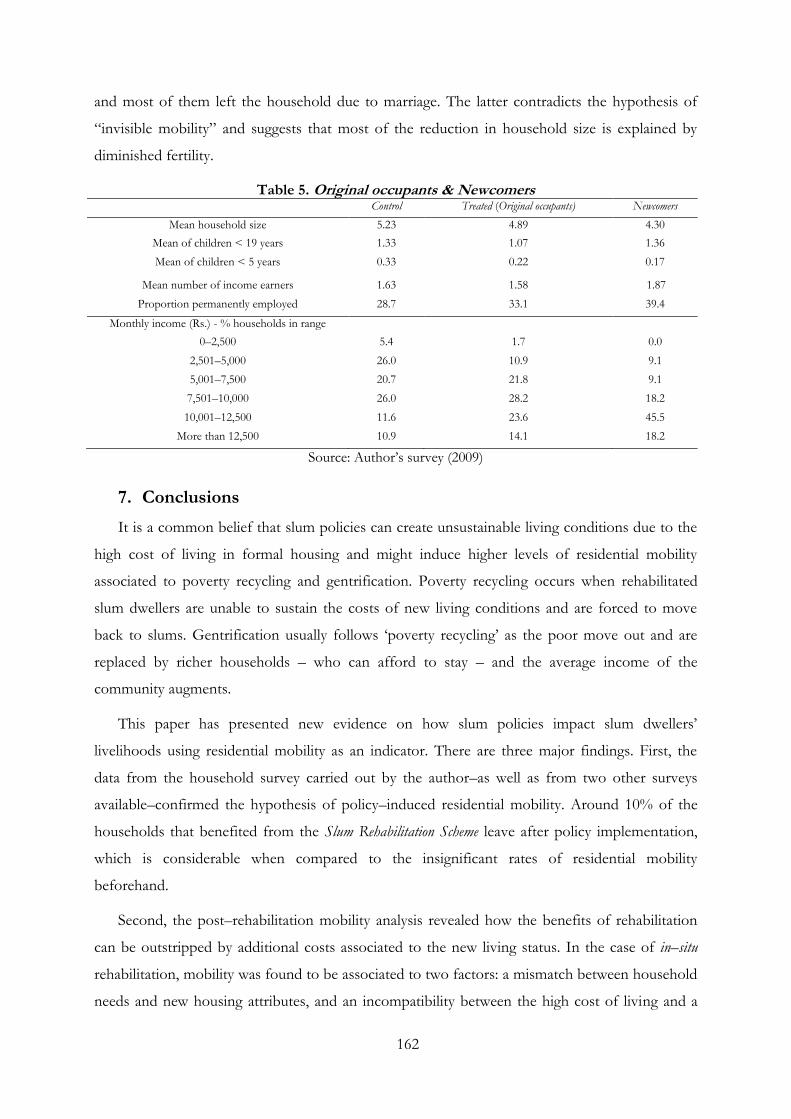
162
and most of them left the household due to marriage. The latter contradicts the hypothesis of
―invisible mobility‖ and suggests that most of the reduction in household size is explained by
diminished fertility.
Table 5. Original occupants & Newcomers Control Treated (Original occupants) Newcomers
Mean household size 5.23 4.89 4.30
Mean of children < 19 years 1.33 1.07 1.36
Mean of children < 5 years 0.33 0.22 0.17
Mean number of income earners 1.63 1.58 1.87
Proportion permanently employed 28.7 33.1 39.4
Monthly income (Rs.) - % households in range
0–2,500 5.4 1.7 0.0
2,501–5,000 26.0 10.9 9.1
5,001–7,500 20.7 21.8 9.1
7,501–10,000 26.0 28.2 18.2
10,001–12,500 11.6 23.6 45.5
More than 12,500 10.9 14.1 18.2
Source: Author‘s survey (2009)
7. Conclusions
It is a common belief that slum policies can create unsustainable living conditions due to the
high cost of living in formal housing and might induce higher levels of residential mobility
associated to poverty recycling and gentrification. Poverty recycling occurs when rehabilitated
slum dwellers are unable to sustain the costs of new living conditions and are forced to move
back to slums. Gentrification usually follows ‗poverty recycling‘ as the poor move out and are
replaced by richer households – who can afford to stay – and the average income of the
community augments.
This paper has presented new evidence on how slum policies impact slum dwellers‘
livelihoods using residential mobility as an indicator. There are three major findings. First, the
data from the household survey carried out by the author–as well as from two other surveys
available–confirmed the hypothesis of policy–induced residential mobility. Around 10% of the
households that benefited from the Slum Rehabilitation Scheme leave after policy implementation,
which is considerable when compared to the insignificant rates of residential mobility
beforehand.
Second, the post–rehabilitation mobility analysis revealed how the benefits of rehabilitation
can be outstripped by additional costs associated to the new living status. In the case of in–situ
rehabilitation, mobility was found to be associated to two factors: a mismatch between household
needs and new housing attributes, and an incompatibility between the high cost of living and a
163
household‘s economic status. However, contrary to the hypotheses found in the literature, our
results indicate that the first factor is dominant with 82% of the original occupants moving to formal
housing and not returning to slums.
Third, post–rehabilitation residential mobility was found to lead to higher slum net–
absorption rates since most of those who left moved to formal housing and 44% of those who
replaced them came from the slums. While this is certainly positive, the generalization of this
result is not automatic. Slum resettlement policies, in which slums are relocated to distant areas,
might have higher proportions of residential mobility associated to poverty recycling due to
greater impacts on the right side of the budget–constraint equation (i.e. transport) and negative
impacts on the left side of the equation (i.e. loss of employment). Furthermore, slums surveyed
by the authors had achieved a certain degree of consolidation, and slum rehabilitation in less–
consolidated slums might lead to higher rates of poverty recycling.
Finally, throughout this, paper I have suggested how the analysis of residential mobility and
abandonment destinations can be used not only as an indicator of policy impacts but also as an
indicator of the mechanisms of slum formation in a given city. In the rehabilitation projects
studied, slum choice was found to be linked mainly to formal entry barriers (accessing formal
housing) and not to a durability problem (cost of living in formal housing).

164
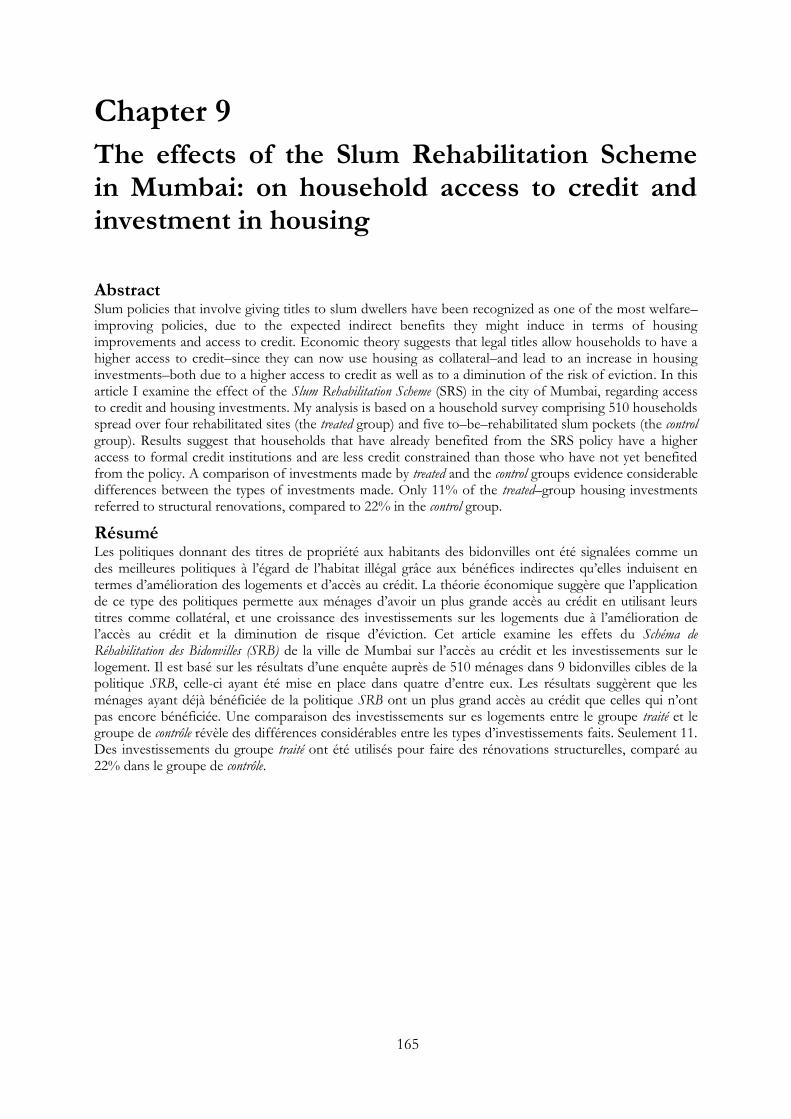
165
Chapter 9
The effects of the Slum Rehabilitation Scheme in Mumbai: on household access to credit and investment in housing
Abstract Slum policies that involve giving titles to slum dwellers have been recognized as one of the most welfare– improving policies, due to the expected indirect benefits they might induce in terms of housing improvements and access to credit. Economic theory suggests that legal titles allow households to have a higher access to credit–since they can now use housing as collateral–and lead to an increase in housing investments–both due to a higher access to credit as well as to a diminution of the risk of eviction. In this article I examine the effect of the Slum Rehabilitation Scheme (SRS) in the city of Mumbai, regarding access to credit and housing investments. My analysis is based on a household survey comprising 510 households spread over four rehabilitated sites (the treated group) and five to–be–rehabilitated slum pockets (the control group). Results suggest that households that have already benefited from the SRS policy have a higher access to formal credit institutions and are less credit constrained than those who have not yet benefited from the policy. A comparison of investments made by treated and the control groups evidence considerable differences between the types of investments made. Only 11% of the treated–group housing investments referred to structural renovations, compared to 22% in the control group.
Résumé Les politiques donnant des titres de propriété aux habitants des bidonvilles ont été signalées comme un des meilleures politiques à l‘égard de l‘habitat illégal grâce aux bénéfices indirectes qu‘elles induisent en termes d‘amélioration des logements et d‘accès au crédit. La théorie économique suggère que l‘application de ce type des politiques permette aux ménages d‘avoir un plus grande accès au crédit en utilisant leurs titres comme collatéral, et une croissance des investissements sur les logements due à l‘amélioration de l‘accès au crédit et la diminution de risque d‘éviction. Cet article examine les effets du Schéma de Réhabilitation des Bidonvilles (SRB) de la ville de Mumbai sur l‘accès au crédit et les investissements sur le logement. Il est basé sur les résultats d‘une enquête auprès de 510 ménages dans 9 bidonvilles cibles de la politique SRB, celle-ci ayant été mise en place dans quatre d‘entre eux. Les résultats suggèrent que les ménages ayant déjà bénéficiée de la politique SRB ont un plus grand accès au crédit que celles qui n‘ont pas encore bénéficiée. Une comparaison des investissements sur es logements entre le groupe traité et le groupe de contrôle révèle des différences considérables entre les types d‘investissements faits. Seulement 11. Des investissements du groupe traité ont été utilisés pour faire des rénovations structurelles, comparé au 22% dans le groupe de contrôle.
166
1. Literature review
The theory on the relationship between insecure tenure and housing investments was first
developed and disclosed by Hernando de Soto (1990, 2000). De Soto argued that giving titles to
households with insecure tenure should improve their access to credit and lead to an increase in
housing investments. On the one hand, the expected higher access to credit was explained by the
possibility of using housing as collateral when having legal titles. Fleisig et al. (2006) state that “In
low and middle–income countries between 70 percent and 80 percent of firms applying for a loan are required to
pledge some form of collateral”. On the other hand, the expected increase of housing investments was
explained as both the result of higher access to credit as well as the result of the reduction of the
risk of eviction.
The accuracy of De Soto‘s theory has been questioned by both new theory developments
and recent empirical studies. Some of the arguments against De Soto‘s theory linking titling and
access to credit are the following. First, since in many developing countries financial markets are
not well developed and housing cannot be used as collateral, titles do not play a major role in
household access to credit (Buckley and Karackal, 2006; Payne et al., 2007). Field and Torero
(2006), who studied Peru‘s massive titling campaign, found no evidence of titles increasing the
probability of receiving credit from private–sector banks, which did not use titles to secure loans.
Second, even in the case of well–developed financial markets–in which housing can be used as
collateral–most formal financial institutions also request households to have a stable and
sufficient income to assure credits. Galiani and Schargrodky (2010), who conducted a household
survey in titled and no–titled slums in Buenos Aires, provide empirical evidence to support the
latter argument. They found that since most Argentine banks tend to lend only to workers with
167
high wages and a stable employment situation, and most of the slum dwellers (titled or not)
worked in the informal sector, having titles did not lead to lower credit constraints.
The relationship between titling and housing investments developed by De Soto (1990,
2000) has, however, been less criticized by literature and verified empirically by a number of
authors. Field (2005) finds that strengthening property rights in Peru had a significant effect on
housing investments with the rate of housing renovations rising by more than two thirds of the
baseline level. Galiani and Schargrodky (2010) also find that families substantially increased
housing investment after being entitled. In fact, the main argument against De Soto‘s theory
linking titling and housing investment is that not only can legal titles induce higher housing
investments through a reduction of the risk of eviction, but that intermediate options–such as a
temporary lease–could also lead households to improve their housing conditions (Payne, 2001;
Gilbert, 2002; Van Gelder, 2007).
The main idea of this article is to evaluate whether the Slum Rehabilitation Scheme (SRS) had any
effects on household access to credit and housing investment. To answer both of these
questions, I use the results of a household survey carried out by the author in cooperation with
the Slum Rehabilitation Society and Mars Ltda. The household–survey methodology, as well as the
setting of the SRS policy, will not be mentioned in this section since both of them have already
been discussed in previous articles of this thesis (see Section 3 of Chapter 8 for more
information). It is important to highlight that, although the two groups considered in the policy
analysis (treated = beneficiaries of SRS, control = future beneficiaries) differ in their tenure
security–as the first group has legal titles and the second does not–the policy has not only granted
titles to slum dwellers, but it is composed of a ―package of policies.‖ This ―package of policies‖
differs from the one–dimensional binary policy analysis of titling policies done by Field (2005),
Field and Torero (2006) and Galiani and Schargrodky (2010), since other components included in
the policy package might also have an influence on housing investments and households access
to credit. For instance, it is possible that the SRS has improved the health of a household due to
the improvement of their access to basic services, which could–in turn–reduce the need to
request health–related loans. Furthermore, since the SRS policy implies an improvement of
housing conditions, we should not expect investments in housing to be comparable to those
incurred in the control group.
This article is organized as follows: In Section 2 I discuss some methodological concerns
related to the implementation of the Consumption Module, which included questions on the access
to credit and investments. In Section 3 I present the results of the household surveys on access to
credit, analyzing differences to both credit constraints and access to formal–informal credits
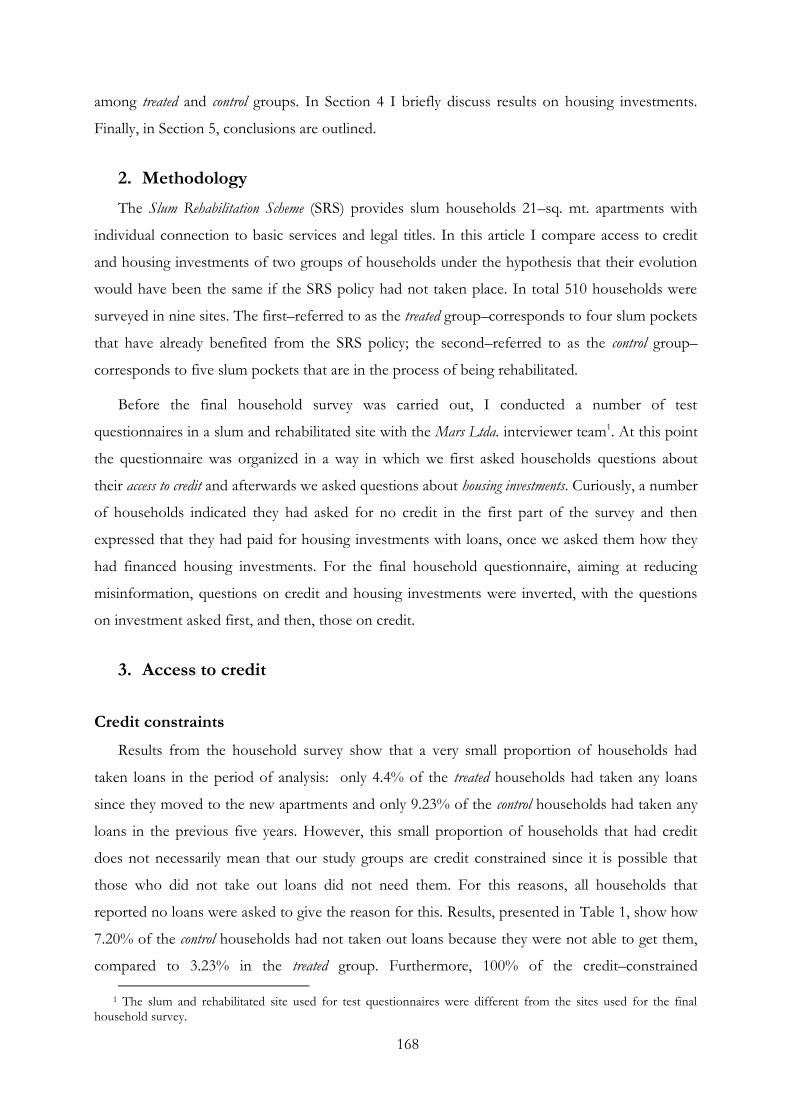
168
among treated and control groups. In Section 4 I briefly discuss results on housing investments.
Finally, in Section 5, conclusions are outlined.
2. Methodology
The Slum Rehabilitation Scheme (SRS) provides slum households 21–sq. mt. apartments with
individual connection to basic services and legal titles. In this article I compare access to credit
and housing investments of two groups of households under the hypothesis that their evolution
would have been the same if the SRS policy had not taken place. In total 510 households were
surveyed in nine sites. The first–referred to as the treated group–corresponds to four slum pockets
that have already benefited from the SRS policy; the second–referred to as the control group–
corresponds to five slum pockets that are in the process of being rehabilitated.
Before the final household survey was carried out, I conducted a number of test
questionnaires in a slum and rehabilitated site with the Mars Ltda. interviewer team1. At this point
the questionnaire was organized in a way in which we first asked households questions about
their access to credit and afterwards we asked questions about housing investments. Curiously, a number
of households indicated they had asked for no credit in the first part of the survey and then
expressed that they had paid for housing investments with loans, once we asked them how they
had financed housing investments. For the final household questionnaire, aiming at reducing
misinformation, questions on credit and housing investments were inverted, with the questions
on investment asked first, and then, those on credit.
3. Access to credit
Credit constraints
Results from the household survey show that a very small proportion of households had
taken loans in the period of analysis: only 4.4% of the treated households had taken any loans
since they moved to the new apartments and only 9.23% of the control households had taken any
loans in the previous five years. However, this small proportion of households that had credit
does not necessarily mean that our study groups are credit constrained since it is possible that
those who did not take out loans did not need them. For this reasons, all households that
reported no loans were asked to give the reason for this. Results, presented in Table 1, show how
7.20% of the control households had not taken out loans because they were not able to get them,
compared to 3.23% in the treated group. Furthermore, 100% of the credit–constrained
1 The slum and rehabilitated site used for test questionnaires were different from the sites used for the final
household survey.
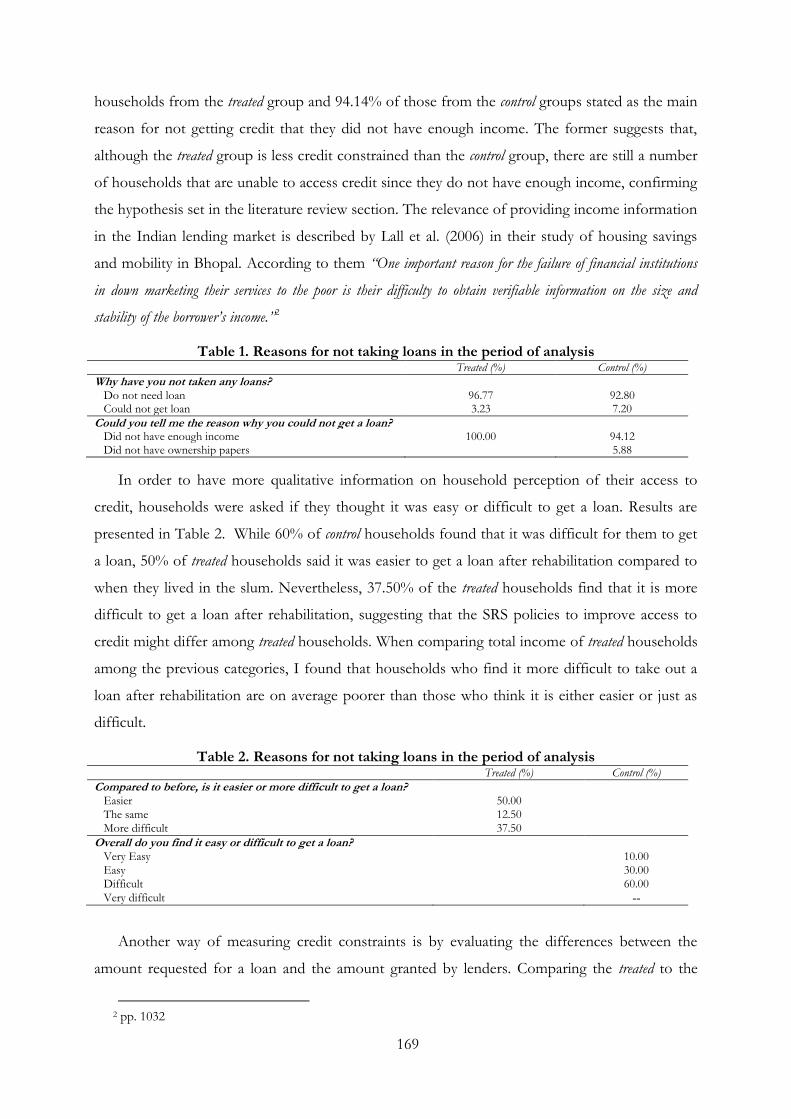
169
households from the treated group and 94.14% of those from the control groups stated as the main
reason for not getting credit that they did not have enough income. The former suggests that,
although the treated group is less credit constrained than the control group, there are still a number
of households that are unable to access credit since they do not have enough income, confirming
the hypothesis set in the literature review section. The relevance of providing income information
in the Indian lending market is described by Lall et al. (2006) in their study of housing savings
and mobility in Bhopal. According to them “One important reason for the failure of financial institutions
in down marketing their services to the poor is their difficulty to obtain verifiable information on the size and
stability of the borrower‟s income.”2
Table 1. Reasons for not taking loans in the period of analysis Treated (%) Control (%)
Why have you not taken any loans? Do not need loan 96.77 92.80 Could not get loan 3.23 7.20
Could you tell me the reason why you could not get a loan? Did not have enough income 100.00 94.12 Did not have ownership papers 5.88
In order to have more qualitative information on household perception of their access to
credit, households were asked if they thought it was easy or difficult to get a loan. Results are
presented in Table 2. While 60% of control households found that it was difficult for them to get
a loan, 50% of treated households said it was easier to get a loan after rehabilitation compared to
when they lived in the slum. Nevertheless, 37.50% of the treated households find that it is more
difficult to get a loan after rehabilitation, suggesting that the SRS policies to improve access to
credit might differ among treated households. When comparing total income of treated households
among the previous categories, I found that households who find it more difficult to take out a
loan after rehabilitation are on average poorer than those who think it is either easier or just as
difficult.
Table 2. Reasons for not taking loans in the period of analysis Treated (%) Control (%)
Compared to before, is it easier or more difficult to get a loan? Easier 50.00 The same 12.50 More difficult 37.50
Overall do you find it easy or difficult to get a loan? Very Easy 10.00
Easy 30.00
Difficult 60.00
Very difficult --
Another way of measuring credit constraints is by evaluating the differences between the
amount requested for a loan and the amount granted by lenders. Comparing the treated to the
2 pp. 1032
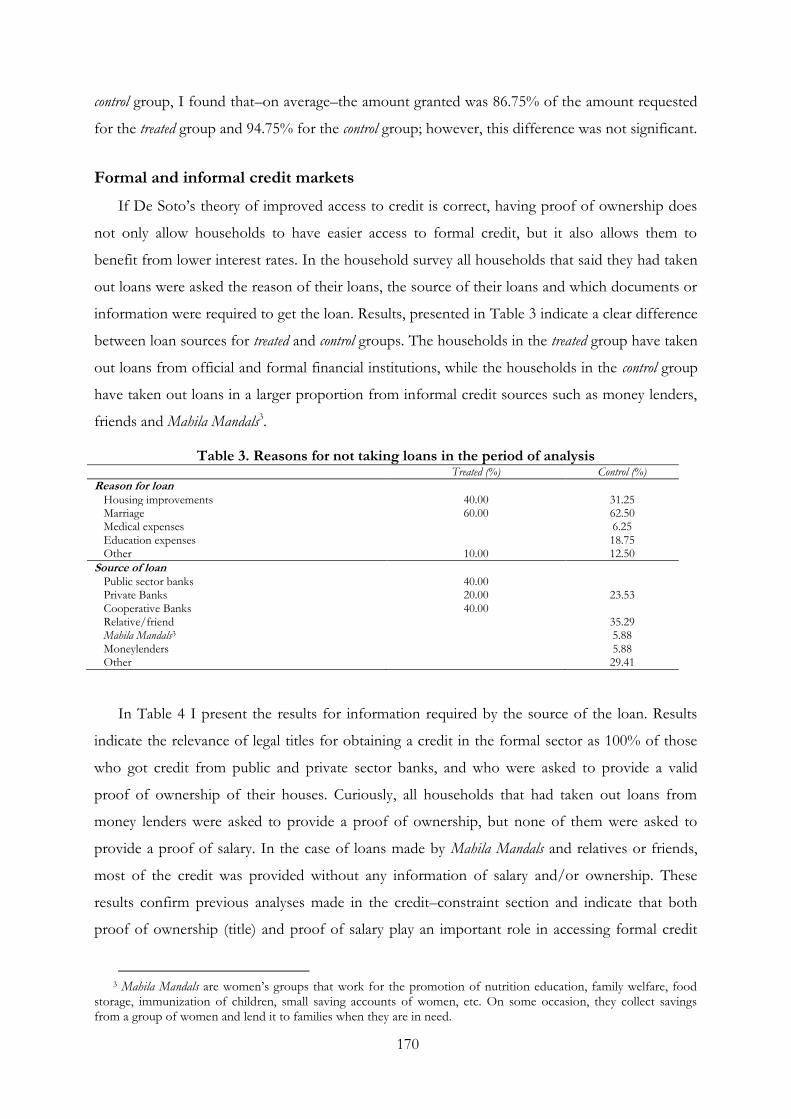
170
control group, I found that–on average–the amount granted was 86.75% of the amount requested
for the treated group and 94.75% for the control group; however, this difference was not significant.
Formal and informal credit markets
If De Soto‘s theory of improved access to credit is correct, having proof of ownership does
not only allow households to have easier access to formal credit, but it also allows them to
benefit from lower interest rates. In the household survey all households that said they had taken
out loans were asked the reason of their loans, the source of their loans and which documents or
information were required to get the loan. Results, presented in Table 3 indicate a clear difference
between loan sources for treated and control groups. The households in the treated group have taken
out loans from official and formal financial institutions, while the households in the control group
have taken out loans in a larger proportion from informal credit sources such as money lenders,
friends and Mahila Mandals3.
Table 3. Reasons for not taking loans in the period of analysis Treated (%) Control (%)
Reason for loan Housing improvements 40.00 31.25 Marriage 60.00 62.50 Medical expenses 6.25 Education expenses 18.75 Other 10.00 12.50
Source of loan Public sector banks 40.00 Private Banks 20.00 23.53 Cooperative Banks 40.00 Relative/friend 35.29 Mahila Mandals3 5.88 Moneylenders 5.88 Other 29.41
In Table 4 I present the results for information required by the source of the loan. Results
indicate the relevance of legal titles for obtaining a credit in the formal sector as 100% of those
who got credit from public and private sector banks, and who were asked to provide a valid
proof of ownership of their houses. Curiously, all households that had taken out loans from
money lenders were asked to provide a proof of ownership, but none of them were asked to
provide a proof of salary. In the case of loans made by Mahila Mandals and relatives or friends,
most of the credit was provided without any information of salary and/or ownership. These
results confirm previous analyses made in the credit–constraint section and indicate that both
proof of ownership (title) and proof of salary play an important role in accessing formal credit
3 Mahila Mandals are women‘s groups that work for the promotion of nutrition education, family welfare, food
storage, immunization of children, small saving accounts of women, etc. On some occasion, they collect savings from a group of women and lend it to families when they are in need.
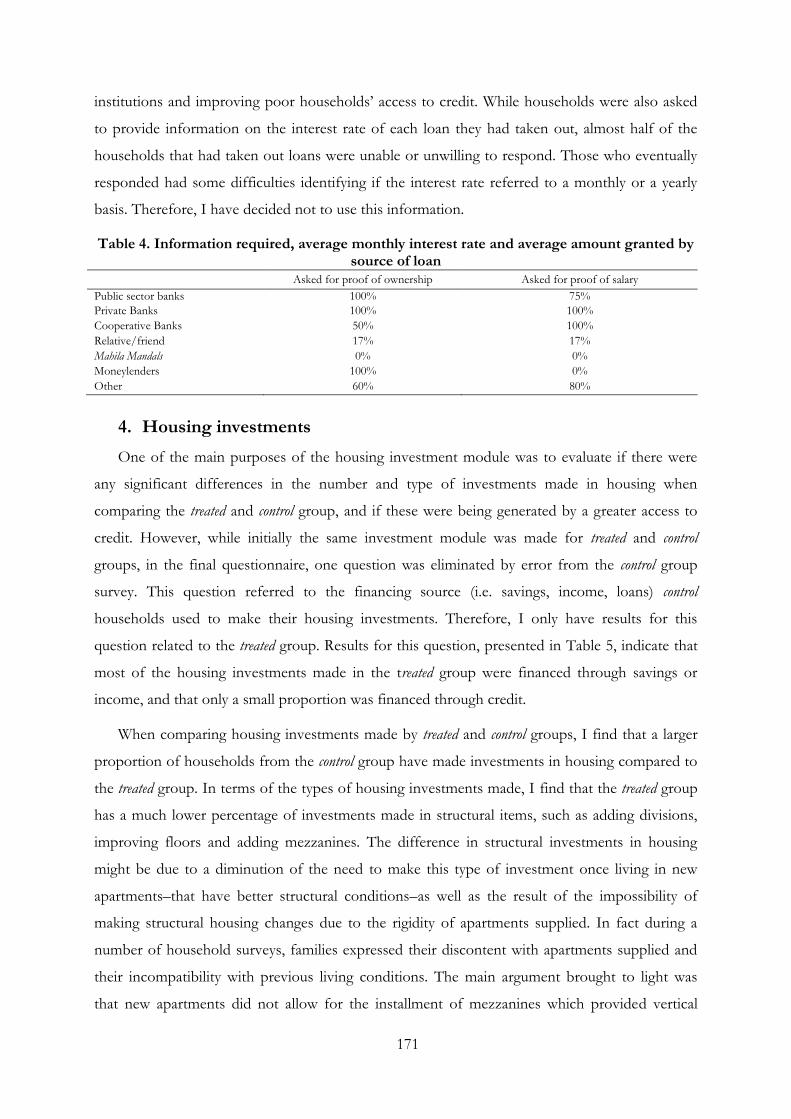
171
institutions and improving poor households‘ access to credit. While households were also asked
to provide information on the interest rate of each loan they had taken out, almost half of the
households that had taken out loans were unable or unwilling to respond. Those who eventually
responded had some difficulties identifying if the interest rate referred to a monthly or a yearly
basis. Therefore, I have decided not to use this information.
Table 4. Information required, average monthly interest rate and average amount granted by source of loan
Asked for proof of ownership Asked for proof of salary
Public sector banks 100% 75%
Private Banks 100% 100%
Cooperative Banks 50% 100%
Relative/friend 17% 17%
Mahila Mandals 0% 0%
Moneylenders 100% 0%
Other 60% 80%
4. Housing investments
One of the main purposes of the housing investment module was to evaluate if there were
any significant differences in the number and type of investments made in housing when
comparing the treated and control group, and if these were being generated by a greater access to
credit. However, while initially the same investment module was made for treated and control
groups, in the final questionnaire, one question was eliminated by error from the control group
survey. This question referred to the financing source (i.e. savings, income, loans) control
households used to make their housing investments. Therefore, I only have results for this
question related to the treated group. Results for this question, presented in Table 5, indicate that
most of the housing investments made in the treated group were financed through savings or
income, and that only a small proportion was financed through credit.
When comparing housing investments made by treated and control groups, I find that a larger
proportion of households from the control group have made investments in housing compared to
the treated group. In terms of the types of housing investments made, I find that the treated group
has a much lower percentage of investments made in structural items, such as adding divisions,
improving floors and adding mezzanines. The difference in structural investments in housing
might be due to a diminution of the need to make this type of investment once living in new
apartments–that have better structural conditions–as well as the result of the impossibility of
making structural housing changes due to the rigidity of apartments supplied. In fact during a
number of household surveys, families expressed their discontent with apartments supplied and
their incompatibility with previous living conditions. The main argument brought to light was
that new apartments did not allow for the installment of mezzanines which provided vertical
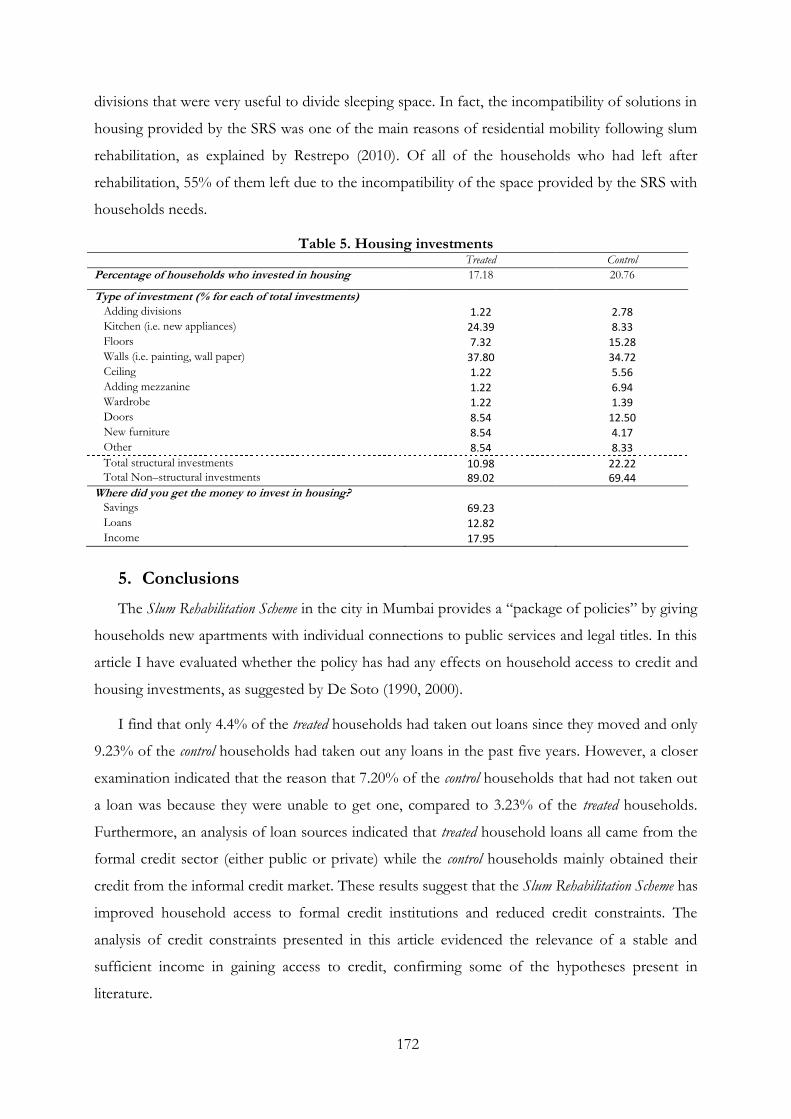
172
divisions that were very useful to divide sleeping space. In fact, the incompatibility of solutions in
housing provided by the SRS was one of the main reasons of residential mobility following slum
rehabilitation, as explained by Restrepo (2010). Of all of the households who had left after
rehabilitation, 55% of them left due to the incompatibility of the space provided by the SRS with
households needs.
Table 5. Housing investments Treated Control
Percentage of households who invested in housing 17.18 20.76
Type of investment (% for each of total investments)
Adding divisions 1.22 2.78 Kitchen (i.e. new appliances) 24.39 8.33 Floors 7.32 15.28 Walls (i.e. painting, wall paper) 37.80 34.72 Ceiling 1.22 5.56 Adding mezzanine 1.22 6.94 Wardrobe 1.22 1.39 Doors 8.54 12.50 New furniture 8.54 4.17 Other 8.54 8.33 Total structural investments 10.98 22.22 Total Non–structural investments 89.02 69.44
Where did you get the money to invest in housing? Savings 69.23 Loans 12.82 Income 17.95
5. Conclusions
The Slum Rehabilitation Scheme in the city in Mumbai provides a ―package of policies‖ by giving
households new apartments with individual connections to public services and legal titles. In this
article I have evaluated whether the policy has had any effects on household access to credit and
housing investments, as suggested by De Soto (1990, 2000).
I find that only 4.4% of the treated households had taken out loans since they moved and only
9.23% of the control households had taken out any loans in the past five years. However, a closer
examination indicated that the reason that 7.20% of the control households that had not taken out
a loan was because they were unable to get one, compared to 3.23% of the treated households.
Furthermore, an analysis of loan sources indicated that treated household loans all came from the
formal credit sector (either public or private) while the control households mainly obtained their
credit from the informal credit market. These results suggest that the Slum Rehabilitation Scheme has
improved household access to formal credit institutions and reduced credit constraints. The
analysis of credit constraints presented in this article evidenced the relevance of a stable and
sufficient income in gaining access to credit, confirming some of the hypotheses present in
literature.
173
In terms of housing investments, results suggest a switch of investments made by the treated
group moving away from structural renovations such as adding divisions and increasing non–
structural investments. While only 11% of the housing investments of the treated group referred
to structural renovation, this proportion in the control group was 22%. However, since I am not
evaluating a titling policy, many of the changes in housing investment between the two groups
studied can be explained by the establishment of the policy. The Slum Rehabilitation Scheme, by
providing better and more–rigid housing structures, reduces the need to improve housing, and
therefore, housing investments as the same time as it constrains investments in housing
renovations.

174
175
Chapter 10
The effects of the Slum Rehabilitation Scheme in Mumbai: on household access to improved and modern basic services
Abstract The Slum Rehabilitation Scheme (SRS) in Mumbai has managed to improve the living conditions in slum households by providing a package of policies that include the provision of legal basic services, titling and improvement of housing structures. This policy uses an innovative market-driven approach in which slum rehabilitation is financed by the private sector, which, in turn, is compensated with Additional Development Rights to construct over the permitted Floor Space Index (FSI). So while the burden of providing housing solutions has been passed to the private sector, local authorities need to assure the financing and production of additional infrastructure requirements to cope with increased population densities. In this article I evaluate if expected improvements in access to modern basic services by the SRS policy are being translated into action based on a household survey carried out by the author in four rehabilitated sites and five sites to be rehabilitated. Findings suggest that while the SRS has significantly improved the access to modern basic services, the quality of services provided has sometimes worsened, especially in the case of water supply. It is possible that this is due to infrastructure bottlenecks in the water–provision system of the city of Mumbai, a system that has already problems meeting demand.
Résumé Le Schéma de Réhabilitation des Bidonvilles (SRB) de la ville de Mumbai améliore les conditions de vie des habitants des bidonvilles en fournissant des services de base améliorés (eau, assainissement, électricité), en allouant des titres de propriété et en améliorant des structures des logements. Le SRB permet de financer la totalité de la reconstruction des bidonvilles par le secteur privé en mettant en place un système d‘incitations par allocation aux promoteurs de « Droits de Développement Supplémentaires ». Ainsi, alors que le coût de fourniture des solutions de logements formels a été transféré au secteur privé, le secteur public doit assurer le financement et la production d‘une infrastructure urbaine additionnelle pour faire face à l‘augmentation de la densité démographique. Dans cet article j‘évalue si les améliorations attendues en matière d‘accès aux services de base se sont effectivement produites en utilisant une enquête auprès de 510 ménages dans 9 bidonvilles cibles de la politique, celle-ci ayant été mise en place dans quatre d‘entre eux. Les résultats montrent que même si le SRB a réussi à améliorer de façon significative l‘accès aux services de base, on observe une dégradation de la qualité de service fourni dans le cas de l‘approvisionnement en eau. Il est probable que cela soit dû aux problèmes de congestion de l‘infrastructure d‘approvisionnement en eau potable de la ville de Mumbai, qui connaissait déjà des difficultés pour faire face à la demande.
176
1. Introduction
The Slum Rehabilitation Scheme (SRS) of the city of Mumbai is intended to improve living
conditions of slum dwellers by completely renovating slums. Using a market–driven approach,
slums are being redeveloped in-situ by builders; slum households are provided new apartments
free of cost, with titles and access to basic services. Builders are compensated in two forms, both
of them based on the conferment of higher Floor Space Index. The first form of compensation
gives the builder Additional Development Rights (ADR) that he can develop on the same site to
construct additional housing units and sell them on the real estate market; the Slum
Rehabilitation Authority refers to this as the free–sale component. The second form of
compensation is through Transfer Development Rights (TDR) that can either be used by the
same builder–on a site to the north of the slum site–or be sold to another builder who can then
increase the FSI in a given construction project. Both of these compensations generate an
increase of population density that goes beyond the planned density capacity in each area (FSI
norms). So while the burden of providing housing solutions to slum households has been
somehow passed to the private sector, local authorities need to assure the financing and
production of additional infrastructure requirements due to utilization of ADRs and TDRs that
go beyond planned capacities.
Throughout this article I evaluate the evolution of the provision of basic services in a set of
rehabilitated slums by comparing their conditions before and after they entered the policy and
with a control group of to–be–rehabilitated slums. My analysis will be based on two indicators:
access to modern basic services and perceived quality of basic services. I expand the definition of
modern basic service, commonly used in energy poverty studies, to other basic services. For
instance, having an inside piped–water connection is considered a modern basic service when
177
compared to having water provision via a stand post. The same is considered for having
individual toilets inside the house when compared to community toilets. Four basic services are
included in the analysis: energy, water provision, sanitation and waste collection. Since the
improvement of access to quality basic services is one of the ways in which slum rehabilitation
can enhance a household‘s welfare, it is of vital importance to see if the SRS policy intentions are
being translated into real actions. Furthermore, an analysis of this type, given the setting of the
SRS in Mumbai, could serve to identify some negative spillover effects being generated by the
policy–through the allocation of ADRs or TDRs–that have not been previously studied or
accounted for.
Most of the analysis is based on a household survey carried out by the author, comprising of
510 household in nine slum pockets and complemented by findings of two studies carried out by
the Tata Institute of Social Sciences. A complete description of the household–survey
methodology, as well as the setting of the Slum Rehabilitation Scheme policy, is not included in this
article since both of them have already been discussed in previous articles of this thesis (see
Section 3 of Chapter 8 for more information).
The rest of the paper is organized in the following manner: Section 2 presents a brief
description of the Slum Rehabilitation Scheme. Section 3 evaluates changes in accessing modern
basic services before and after the policy. Section 4 comprehends an analysis of the evolution of
the quality of basic services based on household perception and Section 5 outlines the
conclusions.
2. The Slum Rehabilitation Scheme
The Slum Rehabilitation Scheme (SRS) was introduced in 1995 substituting the previous slum
policy (Slum Redevelopment Scheme). The SRS, compared to the previous policy, created better
mechanisms for cross–subsidizing slum projects using two types of incentives: Additional
Development Rights (ADR) and Transfer Development Rights (TDR). It works in the following
way. First, a builder or developer becomes associated with a slum community and collects
signatures of agreement of at least 70% of the eligible slum dwellers. Second, the project needs to
follow a set of administrative procedures at the Slum Rehabilitation Authority (SRA), which is a
centralized agency created to manage the SRS. Once the project is approved, slum dwellers are
relocated in transit camps, the slum is demolished and new buildings are constructed following a
standard procedure. As construction finishes slum cooperatives are formed and tenements are
allotted. Slum dwellers get free housing, with basic amenities and legal titles. The builder is
compensated in two ways. If there is enough space to build additional housing units within the
178
former slum area, the constructor is granted ADRs. These allow the constructor to exceed
standard Floor Space Index (FSI) regulations, constructing additional housing units on the same
site which he can then sell on the free market gaining profits. For example, if the project is
located in the suburbs, for every FSI used for rehabilitation, one FSI in form of an ADR is
granted. There is, however, a maximum level of FSI that cannot be exceeded, which brings us to
the second form of compensation. If there is not enough space to use all the ADRs in the slum
area, the constructor is granted TDRs, which he can sell on the market to another constructor
who can use it to build additional space in another part of the city1.
Anticipating possible infrastructure bottlenecks created by slum rehabilitation due to
increased density beyond planned capacities, the Slum Rehabilitation Scheme includes a clause that
considers infrastructure charges–to be paid by the constructor. The Slum Rehabilitation
Authority, the agency in charge of the SRS policy–dictates that builders need to pay 840 Rupees
(Rs.) per square meter for the built–up area over the normally permissible FSI. This amount is
intended for the improvement of infrastructure in slum–rehabilitated areas (SRA, 2007).
However, the amount charged has remained unchanged since the beginning of the policy (1995)
and some circulars from the SRA indicate that developers (builders) have not paid infrastructure
development charges as expected: “It has come to notice that many developers are neither paying the deferred
amounts (referring to unpaid infrastructure charges and maintenance deposits) to SRA nor interests
on them” (Circular No. 51 of 2001–SRA (2007)). The procedure for payment of infrastructure
charges (outlined in Circular No. 7–SRA (2007)) is the following: a first installment of Rs. 400 per
square meter (sq. mt.) shall be paid at the time of the issuance of Commencement Certificates; a
second installment of Rs. 400 per sq. mt. shall be paid at the time of the issuance of Occupation
Certificates of the free–sale component. In the case when TDR is claimed, the entire amount of
Rs. 840 sq. mt., proportionate to the extent of such TDR claimed, shall become payable.
According to the United Nations a slum household is a household that lacks one or more of
the minimum standard characteristics (UN Habitat, 2003). Minimum standard characteristics as
defined by the UN are: access to improved water, access to improved sanitation, security of
tenure, durable housing and sufficient living area. Therefore, when compared to traditional slum
policies, which consider the improvement of only one or two of the minimum standard
characteristics, the SRS policy–if carried out correctly–solves most of the housing problems
present in slums (see Table 1). The only housing deficiency that is not solved by the SRS, when
compared to the UN‘s definition, is the provision of sufficient living area. Based on an average of
1 TDR‘s can only be sold or transferred to projects located to the north of the generating project and cannot be
used in Island City.
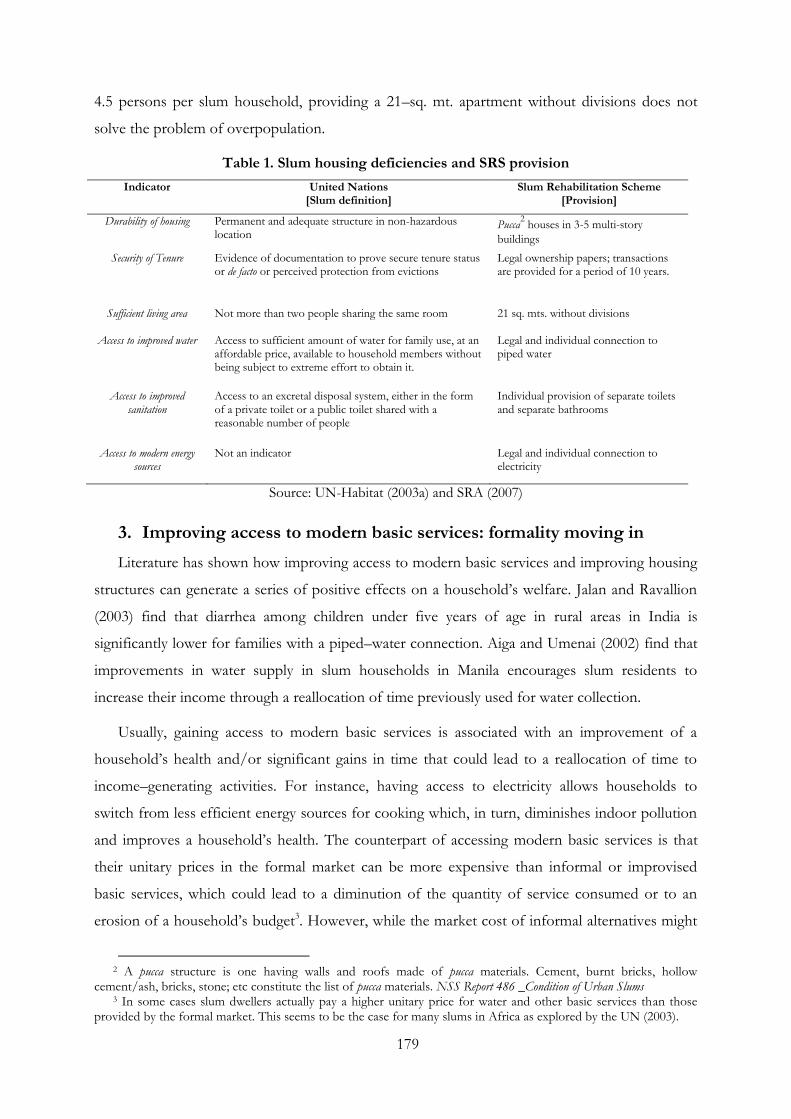
179
4.5 persons per slum household, providing a 21–sq. mt. apartment without divisions does not
solve the problem of overpopulation.
Table 1. Slum housing deficiencies and SRS provision
Indicator United Nations [Slum definition]
Slum Rehabilitation Scheme [Provision]
Durability of housing Permanent and adequate structure in non-hazardous location
Pucca2 houses in 3-5 multi-story
buildings
Security of Tenure Evidence of documentation to prove secure tenure status or de facto or perceived protection from evictions
Legal ownership papers; transactions are provided for a period of 10 years.
Sufficient living area Not more than two people sharing the same room 21 sq. mts. without divisions
Access to improved water Access to sufficient amount of water for family use, at an affordable price, available to household members without being subject to extreme effort to obtain it.
Legal and individual connection to piped water
Access to improved sanitation
Access to an excretal disposal system, either in the form of a private toilet or a public toilet shared with a reasonable number of people
Individual provision of separate toilets and separate bathrooms
Access to modern energy sources
Not an indicator Legal and individual connection to electricity
Source: UN-Habitat (2003a) and SRA (2007)
3. Improving access to modern basic services: formality moving in
Literature has shown how improving access to modern basic services and improving housing
structures can generate a series of positive effects on a household‘s welfare. Jalan and Ravallion
(2003) find that diarrhea among children under five years of age in rural areas in India is
significantly lower for families with a piped–water connection. Aiga and Umenai (2002) find that
improvements in water supply in slum households in Manila encourages slum residents to
increase their income through a reallocation of time previously used for water collection.
Usually, gaining access to modern basic services is associated with an improvement of a
household‘s health and/or significant gains in time that could lead to a reallocation of time to
income–generating activities. For instance, having access to electricity allows households to
switch from less efficient energy sources for cooking which, in turn, diminishes indoor pollution
and improves a household‘s health. The counterpart of accessing modern basic services is that
their unitary prices in the formal market can be more expensive than informal or improvised
basic services, which could lead to a diminution of the quantity of service consumed or to an
erosion of a household‘s budget3. However, while the market cost of informal alternatives might
2 A pucca structure is one having walls and roofs made of pucca materials. Cement, burnt bricks, hollow
cement/ash, bricks, stone; etc constitute the list of pucca materials. NSS Report 486 _Condition of Urban Slums 3 In some cases slum dwellers actually pay a higher unitary price for water and other basic services than those
provided by the formal market. This seems to be the case for many slums in Africa as explored by the UN (2003).
180
be low when compared to modern basic services, the indirect costs inflicted by them (i.e. bad
health) can be much higher. Furthermore, indirect costs associated to the provision of informal
or improvised basic services are not equally distributed between genders, since it is normally
women who spend considerable time in their day assuring water provision and enduring indoor
pollution. Results from the household survey carried out by the author indicated that around
92% of water collection in the slums is the responsibility of women. To evaluate if the SRS has
generated changes in household access to modern basic services, I first analyze pre–existing
conditions in Mumbai slums and then evaluate if there were any improvements.
Pre-existing conditions: basic service provision in Mumbai slums
Provision of basic services in Mumbai slums varies from one slum to another and generally
improves with time as slums consolidate. Notification of slums, an action decided by the
Municipal Corporation that includes a given slum on the city map and legitimizes public actions
inside their territory, has proven to improve the access to basic services of slums. During pre–
survey meetings with community leaders and women‘s groups, a common evolution in basic
services provision was described. Leaders explained how initially slum communities did not have
access to water, sanitation or electricity. Through community organization and sometimes in
association with Non–Governmental Organizations (NGOs), little by little the slum communities
gained access to MCGM4 shared water taps, community toilets and electricity.
Access to water: Most of the slums in Mumbai have access to water through the MCGM
and almost all of them have shared sources. YUVA (2005) explains that this is, in part, the result
of an MCGM policy which dictates that slum household‘s can only apply for water connection in
groups of five or more. Slum households that state they have an independent connection have
obtained it through extensions made from shared connections. Estimates of the number of
households per shared connection vary from one author to another. YUVA (2005) estimates that
stand posts are shared by 11 families but Karn (2003) suggest that in some cases up to 30 families
might be sharing a stand post. Given that most slums only have connection to water for a
number of hours per day, sharing a stand post with 10–30 families sometimes leads to conflicts
and long queues and significantly affects the probability of incursion in the labor market for
women. In the Korba Mithagar slum, one of the slum pockets in which the author worked, stand
posts are on average shared by 10 households. Water is supplied for two hours a day from six to
seven in the morning and from four to five in the evening MTSU (2007).
4 The Municipal Corporation of Greater Mumbai (MCGM) is the civic body that governs the city of Mumbai and is in charge
of the provision of civil infrastructure.
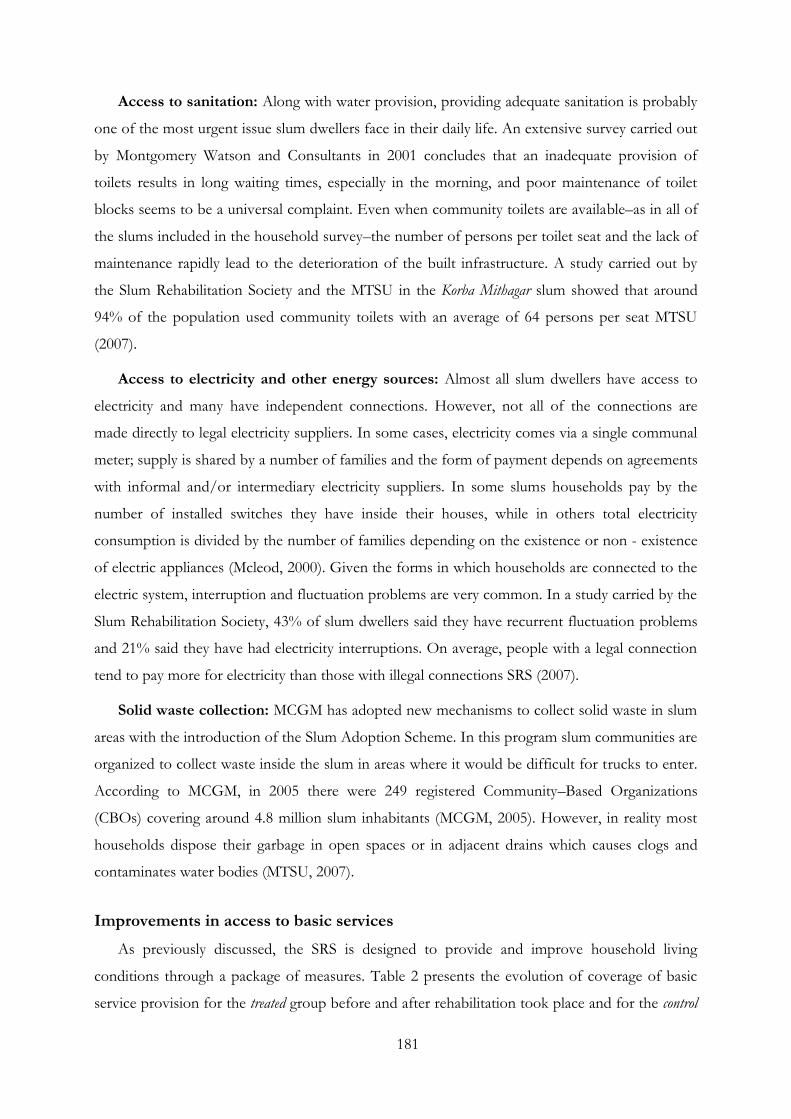
181
Access to sanitation: Along with water provision, providing adequate sanitation is probably
one of the most urgent issue slum dwellers face in their daily life. An extensive survey carried out
by Montgomery Watson and Consultants in 2001 concludes that an inadequate provision of
toilets results in long waiting times, especially in the morning, and poor maintenance of toilet
blocks seems to be a universal complaint. Even when community toilets are available–as in all of
the slums included in the household survey–the number of persons per toilet seat and the lack of
maintenance rapidly lead to the deterioration of the built infrastructure. A study carried out by
the Slum Rehabilitation Society and the MTSU in the Korba Mithagar slum showed that around
94% of the population used community toilets with an average of 64 persons per seat MTSU
(2007).
Access to electricity and other energy sources: Almost all slum dwellers have access to
electricity and many have independent connections. However, not all of the connections are
made directly to legal electricity suppliers. In some cases, electricity comes via a single communal
meter; supply is shared by a number of families and the form of payment depends on agreements
with informal and/or intermediary electricity suppliers. In some slums households pay by the
number of installed switches they have inside their houses, while in others total electricity
consumption is divided by the number of families depending on the existence or non - existence
of electric appliances (Mcleod, 2000). Given the forms in which households are connected to the
electric system, interruption and fluctuation problems are very common. In a study carried by the
Slum Rehabilitation Society, 43% of slum dwellers said they have recurrent fluctuation problems
and 21% said they have had electricity interruptions. On average, people with a legal connection
tend to pay more for electricity than those with illegal connections SRS (2007).
Solid waste collection: MCGM has adopted new mechanisms to collect solid waste in slum
areas with the introduction of the Slum Adoption Scheme. In this program slum communities are
organized to collect waste inside the slum in areas where it would be difficult for trucks to enter.
According to MCGM, in 2005 there were 249 registered Community–Based Organizations
(CBOs) covering around 4.8 million slum inhabitants (MCGM, 2005). However, in reality most
households dispose their garbage in open spaces or in adjacent drains which causes clogs and
contaminates water bodies (MTSU, 2007).
Improvements in access to basic services
As previously discussed, the SRS is designed to provide and improve household living
conditions through a package of measures. Table 2 presents the evolution of coverage of basic
service provision for the treated group before and after rehabilitation took place and for the control
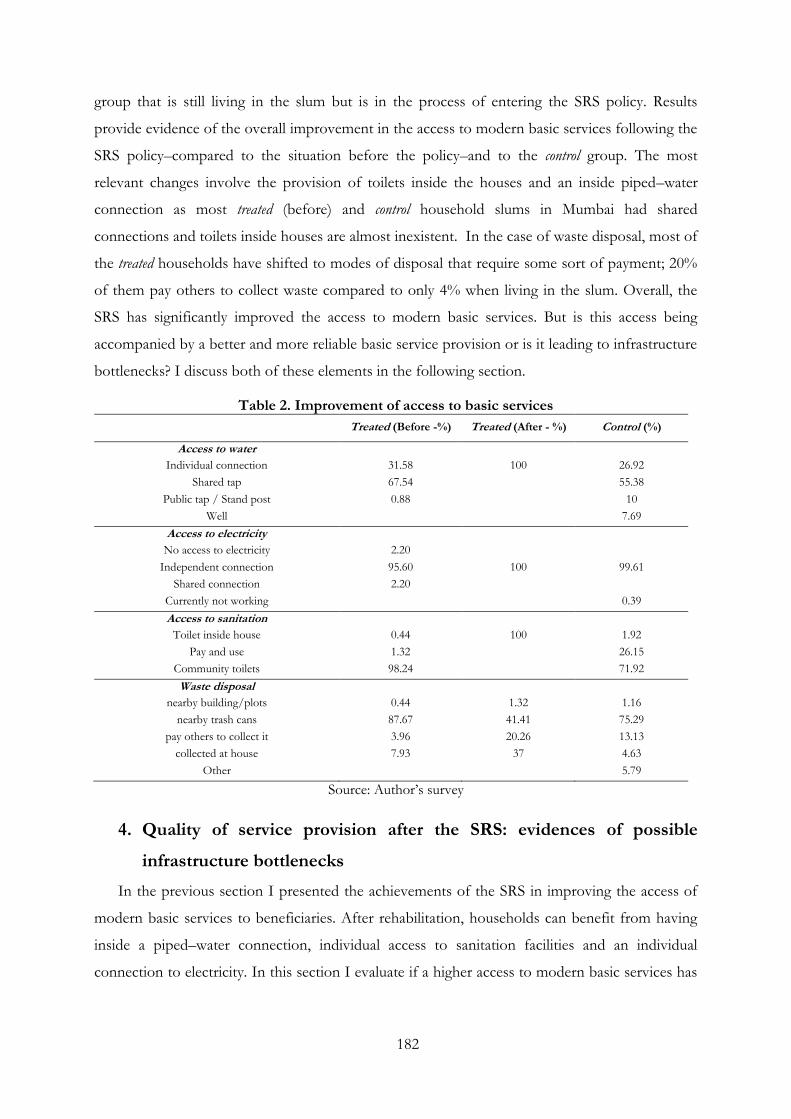
182
group that is still living in the slum but is in the process of entering the SRS policy. Results
provide evidence of the overall improvement in the access to modern basic services following the
SRS policy–compared to the situation before the policy–and to the control group. The most
relevant changes involve the provision of toilets inside the houses and an inside piped–water
connection as most treated (before) and control household slums in Mumbai had shared
connections and toilets inside houses are almost inexistent. In the case of waste disposal, most of
the treated households have shifted to modes of disposal that require some sort of payment; 20%
of them pay others to collect waste compared to only 4% when living in the slum. Overall, the
SRS has significantly improved the access to modern basic services. But is this access being
accompanied by a better and more reliable basic service provision or is it leading to infrastructure
bottlenecks? I discuss both of these elements in the following section.
Table 2. Improvement of access to basic services
Treated (Before -%) Treated (After - %) Control (%)
Access to water
Individual connection 31.58 100 26.92
Shared tap 67.54
55.38
Public tap / Stand post 0.88
10
Well
7.69
Access to electricity
No access to electricity 2.20
Independent connection 95.60 100 99.61
Shared connection 2.20
Currently not working
0.39
Access to sanitation
Toilet inside house 0.44 100 1.92
Pay and use 1.32
26.15
Community toilets 98.24
71.92
Waste disposal
nearby building/plots 0.44 1.32 1.16
nearby trash cans 87.67 41.41 75.29
pay others to collect it 3.96 20.26 13.13
collected at house 7.93 37 4.63
Other 5.79
Source: Author‘s survey
4. Quality of service provision after the SRS: evidences of possible
infrastructure bottlenecks
In the previous section I presented the achievements of the SRS in improving the access of
modern basic services to beneficiaries. After rehabilitation, households can benefit from having
inside a piped–water connection, individual access to sanitation facilities and an individual
connection to electricity. In this section I evaluate if a higher access to modern basic services has
183
been accompanied by an improvement in the quality of service provided. I concentrate my
analysis on water and electricity provision since they are the most well–documented subjects.
A higher access to basic services, but a better one?
Quality of water services: One of the possible benefits of having access to an individual
water connection is the gain in time that was previously used to collect water outside the
dwelling. However, if an individual connection is only working for a small period of time and the
time of connection is not fixed, expected gains from connection to piped water will be lower. In
order to evaluate changes in quality of water provision, two indicators are used: time of
connection to piped water and perceived quality of water. As Figure 1 suggests, the actual service
measured by the time of access to a piped connection has worsened for the treated group.
When comparing households having access to a piped connection before rehabilitation, 71% of
the treated group now receives less than 30 minutes of daily access to piped water, compared to
37% before rehabilitation and 21% in the control group. The latter confirms family complaints
during surveys that indicated consistent water–provision problems in some of the rehabilitation
projects. In Ashram Chawl families said that they were getting water for only 20 minutes per day.
Figure 1. Time receiving water connection per day
Source: Author‘s survey
Sharma et al (2008), who studied MUTP5 resettled households, describe a similar situation as
98% of the sampled households had less than two hours of water supply daily. Their work also
pointed out consistent water shortages in some of the sites. For example, in the Lallubhai
5 Mumbai Urban Transport Project (MUTP)
0%
10%
20%
30%
40%
50%
60%
70%
10 min 15 min 30 min 45 min One hour More than one hour
% H
ou
seh
old
s fr
om
to
tal
Treated (Before) Treated (After) Control
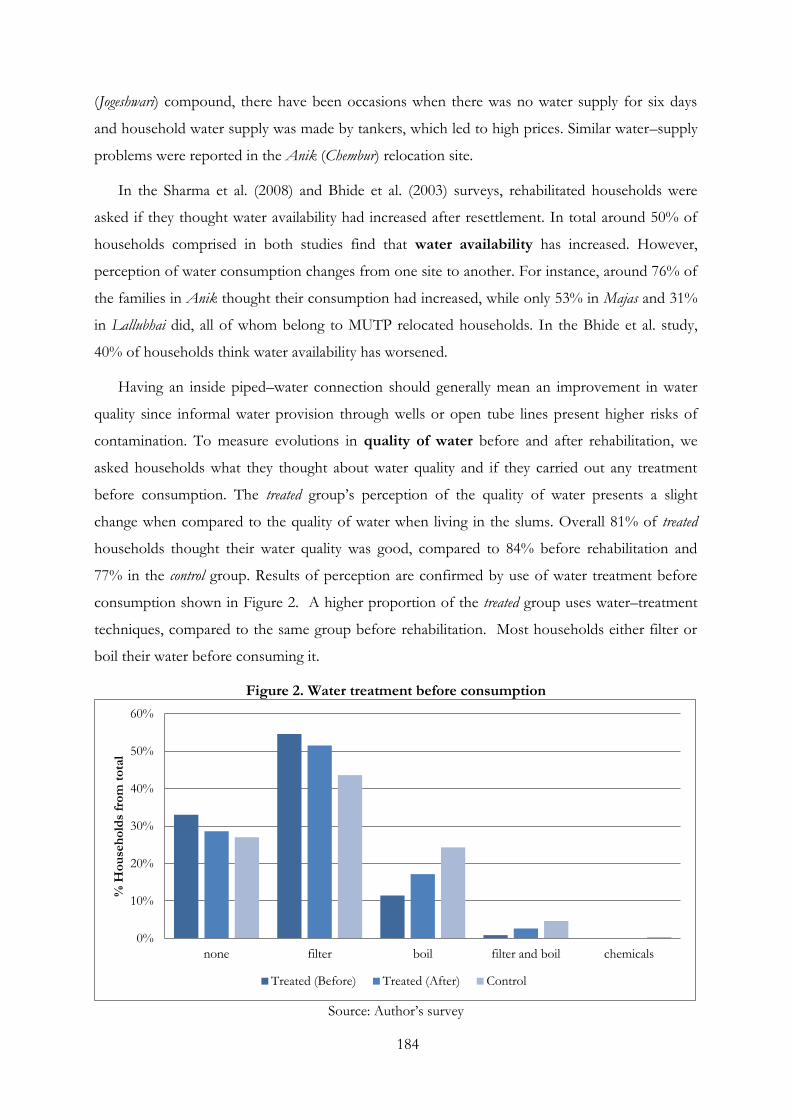
184
(Jogeshwari) compound, there have been occasions when there was no water supply for six days
and household water supply was made by tankers, which led to high prices. Similar water–supply
problems were reported in the Anik (Chembur) relocation site.
In the Sharma et al. (2008) and Bhide et al. (2003) surveys, rehabilitated households were
asked if they thought water availability had increased after resettlement. In total around 50% of
households comprised in both studies find that water availability has increased. However,
perception of water consumption changes from one site to another. For instance, around 76% of
the families in Anik thought their consumption had increased, while only 53% in Majas and 31%
in Lallubhai did, all of whom belong to MUTP relocated households. In the Bhide et al. study,
40% of households think water availability has worsened.
Having an inside piped–water connection should generally mean an improvement in water
quality since informal water provision through wells or open tube lines present higher risks of
contamination. To measure evolutions in quality of water before and after rehabilitation, we
asked households what they thought about water quality and if they carried out any treatment
before consumption. The treated group‘s perception of the quality of water presents a slight
change when compared to the quality of water when living in the slums. Overall 81% of treated
households thought their water quality was good, compared to 84% before rehabilitation and
77% in the control group. Results of perception are confirmed by use of water treatment before
consumption shown in Figure 2. A higher proportion of the treated group uses water–treatment
techniques, compared to the same group before rehabilitation. Most households either filter or
boil their water before consuming it.
Figure 2. Water treatment before consumption
Source: Author‘s survey
0%
10%
20%
30%
40%
50%
60%
none filter boil filter and boil chemicals
% H
ou
seh
old
s fr
om
to
tal
Treated (Before) Treated (After) Control
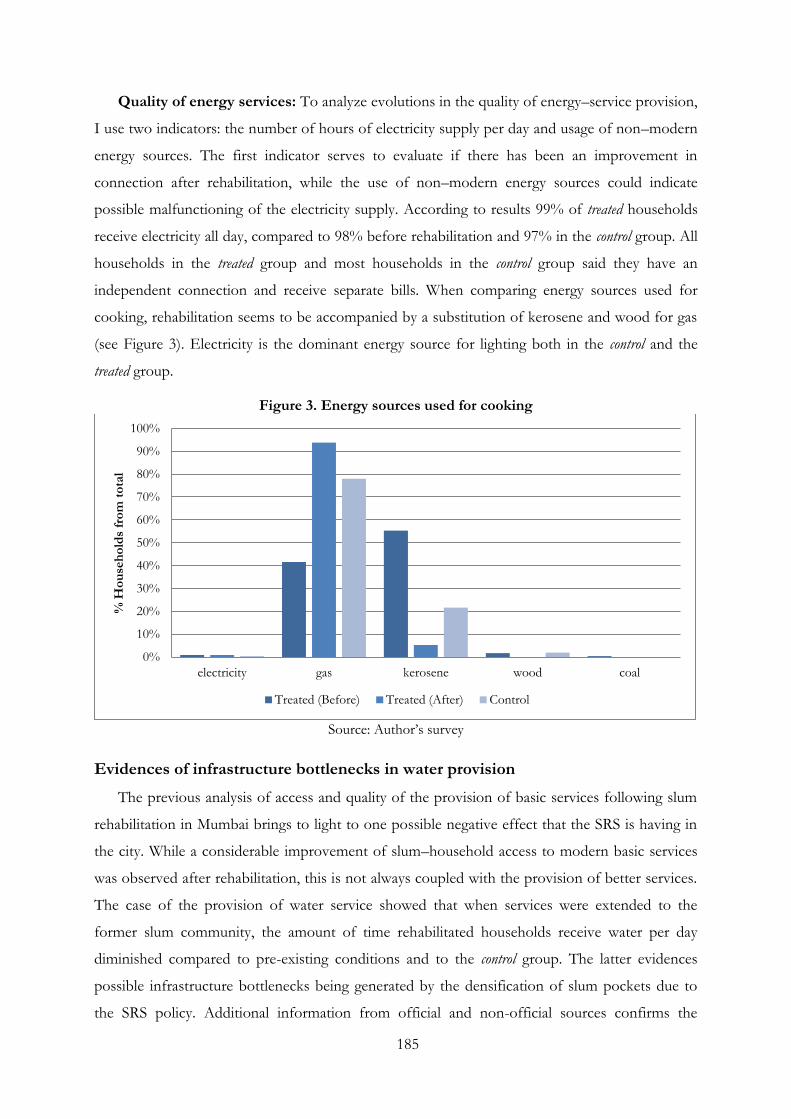
185
Quality of energy services: To analyze evolutions in the quality of energy–service provision,
I use two indicators: the number of hours of electricity supply per day and usage of non–modern
energy sources. The first indicator serves to evaluate if there has been an improvement in
connection after rehabilitation, while the use of non–modern energy sources could indicate
possible malfunctioning of the electricity supply. According to results 99% of treated households
receive electricity all day, compared to 98% before rehabilitation and 97% in the control group. All
households in the treated group and most households in the control group said they have an
independent connection and receive separate bills. When comparing energy sources used for
cooking, rehabilitation seems to be accompanied by a substitution of kerosene and wood for gas
(see Figure 3). Electricity is the dominant energy source for lighting both in the control and the
treated group.
Figure 3. Energy sources used for cooking
Source: Author‘s survey
Evidences of infrastructure bottlenecks in water provision
The previous analysis of access and quality of the provision of basic services following slum
rehabilitation in Mumbai brings to light to one possible negative effect that the SRS is having in
the city. While a considerable improvement of slum–household access to modern basic services
was observed after rehabilitation, this is not always coupled with the provision of better services.
The case of the provision of water service showed that when services were extended to the
former slum community, the amount of time rehabilitated households receive water per day
diminished compared to pre-existing conditions and to the control group. The latter evidences
possible infrastructure bottlenecks being generated by the densification of slum pockets due to
the SRS policy. Additional information from official and non-official sources confirms the
0%
10%
20%
30%
40%
50%
60%
70%
80%
90%
100%
electricity gas kerosene wood coal
% H
ou
seh
old
s fr
om
to
tal
Treated (Before) Treated (After) Control
186
problematic relation between SRS densification and the adaptation of the basic–services
infrastructure to meet new demand.
On a number of occasions the MCGM has denied or restrained water connection to SRS
projects or to infrastructure projects, thus affecting households. In February 2010, the MCGM
denied Mankhurd, an MUTP relocation site, access to water of 3,863 flats under the argument that
they needed to consume more than 200 liters per day (Thompson, 2010). In the same month the
Hydraulic Engineering Department of the MCGM suspended water supply to buildings meant
for the rehabilitation of slum dwellers around the airport in the L ward (Shekhar, 2010). The
insufficient pre-existing capacity, along with the additional capacity required to provide
rehabilitated slum dwellers, seems to be at the core of this problem. Shekhar (2010) describes that
while the total area requirement in the L ward is around 300 Million Liters per Day (MLD), the
actual supply is between 150–200 MLD and additional requirements of 3,823,365 liters of water
per day will be needed after residents move to the new apartments. Furthermore, some anecdotes
suggest that when area‘s installed infrastructure was insufficient for the development of new SRS
buildings, the MCGM was not able to increase installed capacities in time. In the Chandivali
project, although 8,000 families were rehabilitated three years ago, the MCGM has not increased
the water supply of the area (Shekhar, 2010).
Literature indicates that the existent water provision infrastructure does not have the capacity
to absorb higher demand generated by the SRS; the policy might be leading to infrastructure
bottlenecks that affect communities other than those directly covered by the policy. Mhaske
(2009) explains how some slum rehabilitation or infrastructure projects affecting households will
be supplied with only 45 liters of water per person per day by the MCGM once they are in new
buildings. The sale component, product of the conferment of Additional Development Rights to
the builder, will not get a single drop of water and will only get a connection after the Middle
Vaitarana project is ready by the year 2011. Thompson (2010) describes how–given the water
shortages–some sites have started moving back to informal sources for water provision. In
Mankhurd, one of the sites studied by Thompson, many households have started digging illegal
wells between buildings to assure water provision.
In fact, leaving aside the SRS, demand for water in Mumbai exceeds supply (MCGM, 2005).
The gap between demand and supply was 1,642 million liters per day in 2001 and is expected to
be 1,210 MLD in 2011. The latter, added to the increased pressure on infrastructure due to the
extended access of services to slums and the increased population density, might be responsible
for the diminution of the quality of water services provided to rehabilitated households. Mcleod
(2000) argues that the SRS policy is placing minimal emphasis on the existing and projected need
187
for infrastructure services and more attention should be given based on realistic demographic
projections. Furthermore, infrastructure bottlenecks due to increased population density affect
not only the area in which an SRS project is developed, but also the areas receiving TDRs.
According to Toutain and Gopiprasad (2006) the principle of TDRs has no bearing on the spatial
plan and design of infrastructure to match increased demands of the areas receiving TDRs.
Increasing infrastructure in time to be coupled with increased population densities–in the TDR
receiving areas–is basically impossible since these areas are chosen by external market forces
which are invisible to local authorities.
5. Conclusions
The Slum Rehabilitation Scheme (SRS) implemented in the city of Mumbai has allowed the
public sector to shift the burden of slum improvement to the private sector, by making use of
Additional Development Rights (ADRs) that allow developers to construct over the planned
Floor Space Index (FSI). The SRS was designed to provide new apartments with connection to
individual basic services free of cost. In this article I have evaluated whether the expected
improvements in the provision of basic service by the SRS were being translated into action.
Results from the household survey carried out by the author showed how the SRS has
significantly improved the access of households to modern basic services. Compared to the
situation before rehabilitation, where only 32% of households had an individual piped –water
connection and 99% used community or pay–and–use toilets, the SRS had led to universal access
to individual piped water and toilets inside the houses. Changes in terms of access to electricity
provision before and after rehabilitation are less dramatic, since most households had
independent connections when living in the slum.
To evaluate if the improvement of access to modern basic services was also accompanied by
a better provision in terms of quality and quantity, a more specific analysis was made which led to
contradictory results. In the case of electricity provision, the majority of treated and control
households have 24–hour service and their only concern seems to deal with increased electricity
payments when passing from illegal–and sometimes shared connection–to legal and independent
electricity provision. In the case of water services, treated households time of connection has
decreased when compared to their pre-existing conditions and those of the control group. The
latter, added to evidence found in official and non–official sources suggest that the SRS is leading
to infrastructure bottlenecks due to increased density and the extension of modern basic services
to the slum communities.
188
These results bring to light one of the possible problems of introducing density–based
incentives for slum rehabilitation. When the existent infrastructure–normally designed to support
planned capacities–is not able to expand to absorb new densities, density–based incentive policies
might lead to infrastructure bottlenecks. In fact, the sole existence of policies based on density
incentives collides with the reason and making of urban plans and sets schizophrenic rules which
might have consequences, not only on the areas in which density above permissible FSI is
granted but also on areas in which TDRs are consumed. While the Slum Rehabilitation Scheme
introduced a clause that accounts for extra infrastructure charges due to the conferment of higher
FSI, the timing and extension of payments makes it very difficult for these to be translated into
real infrastructure investments. The extent of the consequences generated by higher densities will
depend on the existent infrastructure capacities and the ability of public authorities to adapt
urban infrastructure to match new demand.

189
190
Conclusions and perspectives
This thesis addresses two aspects within the vast field of slum–policy evaluation. The first of
them, covered in Part I, comprehends a descriptive analysis of urban policies, slum–formation
mechanisms and slum absorption policies in Medellín and Mumbai and an econometric study
seeking to determine how informal renters value different rental contracts in Medellín. The
second, covered in Part II, deals with the evaluation of some of the possible welfare implication
of slum – upgrading interventions using a set of welfare indicators. Built upon the idea that cities
and–more precisely–slums play an important role in poverty alleviation, this dissertation intends
to bring a better understanding of how slum policies can affect households‘ welfare by measuring
some of the direct and indirect effects of their implementation. To achieve this, we have
addressed very specific questions that had not been treated before in literature, tested some of the
‗myths‘ and theories related to slum–absorption policies and incurred in new subjects that had
specific relevance at the local context. Changes in households‘ access to credit, improvement of
access to basic services, changes in housing investments and residential mobility related to slum
rehabilitation were some of the ‗welfare‘ indicators used.
The two slum–upgrading interventions considered in this dissertation are relevant since they
introduce a set of innovations when compared to traditionally applied slum policies. The Slum
Rehabilitation Scheme (SRS) in Mumbai uses market incentives based on Additional Development
Rights (ADRs) that switch the burden of financing slum rehabilitation to the private sector.
Through the SRS, Mumbai municipalities achieve a complete absorption of rehabilitated slum
settlements by providing a ‗package of policies‘ that include the provision of basic services,
durable housing structures and titles. Urban Integral Projects (UIPs) implemented in the city of
Medellín are, on the contrary, mainly financed by the public sector and focus on the
improvement of public spaces rather than private areas. The construction of public libraries and
the improvement of public parks and the surrounding environment are among some of the
project interventions considered in Urban Integral Projects.
191
I next disclose the main conclusions of the research questions addressed in this dissertation,
derive general conclusions of the full set of chapters and present some relevant policy
implications emerging from these conclusions as well as their relevance compared to existing
literature.
1. Main results and policy implications
The role of urban policies in the emergence of slums
The descriptive analysis presented in Chapter 3 brings to light how urban policies
implemented in Medellin and Mumbai have played a fundamental role in shaping the emergence
and distribution of slums. In the case of Mumbai, decades of strict land regulations to ‗decongest‘
and avoid migration summed with the city‘s topographical constraints for horizontal
development lead to a generalization of slums and one of the highest population densities in the
world. In Medellin, the constant reconfiguration of the urban perimeter, the following
abandonment of the central role of the state in the provision of low–income housing, added to
the implementation of a set of inclusion and exclusion policies, led to the multiplication and
spatial concentration of squatter settlements at the margins of the city. The two examples studied
reveal how urban policies influence the formation, type and distribution of the informal city in
the urban territory and, at the same time, these three components are, among others,
fundamental to design and apply inclusion policies.
The role of urban political economy in the emergence of slum policies
While slum interventions should address the double challenge of upgrading and absorbing
slum settlement in the urban territory and reducing poverty, it is not always the case. In fact, the
analysis made in Chapter 3 evidenced the central role that the city‘s political economy takes in
shaping slum inclusion or exclusion policies. Both in Medellin and Mumbai, slum policies have
been fueled by a series of externalities or opportunities for action emerging from slums or
marginal settlements. In the case of Medellín, the Integral Improvement Program of Subnormal
Barrios of Medellin (Programa de Mejoramiento Integral de Barrios Subnormales de Medellin, PRIMED)
which preceded the Urban Integral Projects had–as its main objective, to search for a less–violent
and spatially unequal city. PRIMED emerged at a time where the city was considered one of the
most dangerous cities in the world and arose from a Commission ordered by the national
government to find ways to address the problems of violence, governance and social
decomposition in poor barrios. Similarly, Urban Integral Projects were created under the argument of
providing ‗equal opportunities for all‘ to induce positive changes in the socio–cultural behavior of
192
the population. In Mumbai, informal settlements have been seen as vote banks by many political
parties, who have made inclusion policies one more strategy to access or remain in power.
These externalities are present in the theoretical literature regarding slum formation discussed
in Chapter 2. Henderson (2009) explains how residents can use exclusionary zoning to push
low–income migrants into the informal housing sector and avoid the fiscal burdens imposed by
them while Brueckner and Selod (2009) suggest the existence of a squeezing mechanism in which
the informal sector, by occupying space that could be developed in the formal sector, raises
formal housing prices.
Slum housing, a very heterogeneous population
An important result that emerges from this dissertation is that slum households house a very
heterogeneous population and the distributional effects of slums policies might depend on the
fragmentation within the informal sector. In Chapter 3 we saw the different forms the informal
city took in Medellín and Mumbai and how as the level of informality increased, meaning that
tenure security decreased, shelter conditions deteriorated. These observations are consistent with
empirical observations made by a number of authors in other cities (De Soto, 1990; Payne 2001).
In the same sense, Chapter 4 confirmed that the binary division between the formal and
informal sector or between renters and owners is generally insufficient to describe the reality of
cities in developing countries. Evidence was found of the existence of a parallel insurance system
in the informal sector that allowed economic agents to internalize the risk of making incomplete
rental contracts. Using hedonic regression techniques a difference of around 21% in the rental
value of identical housing units was found when passing from oral to written rental contracts in
informal settlements. Considerable differences in the risk faced by households having different
rental contracts were found, although both oral– and written–contract renters faced risks
associated to informality. The policy implication of slum heterogeneity is that the welfare effects
of slum policies will probably differ according to pre–existing fragmentations of the informal
housing sector. Results from the empirical analysis presented in Chapter 6 support this
argument. In the latter, a negative and significant effect of the Metrocable intervention on the level
of housing consolidation in Medellín was found for squatter settlements and no effect was found for
pirate urbanizations. In addition, policy makers might induce different distributional effects by
delimiting policies‘ boundaries, which indirectly legitimize sections of the informal city (i.e.
informal renters or owners, time of stay in the city, etc.).
193
The side – effects of slum policies
At the city level
The analysis presented in Chapter 3 and Chapter 7 on the Slum Rehabilitation Scheme (SRS)
reveals one of the possible consequences of its implementation at a city level: changes in the
population–density distribution. Our research revealed how the past 14 years of the policy‘s
implementation have lead to a densification of wealthier neighborhoods located outside Island
City. The economic rationale behind this is the following: Given the market incentives provided
by the SRS policy, developers have a preference to rehabilitate low–density slums in wealthier
neighborhoods, which allow them to profit from the conferment of in-situ ADRs and high–
density slums in poor neighborhoods, which allow them to profit from the conferment of
Transfer Development Rights (TDRs) that can be used in wealthier neighborhoods. While the
densification of the city‘s wealthier neighborhoods is not, by itself, good or bad, it does have
some indirect consequences on the provision and adaptation of urban infrastructure. To date, the
SRS policy does not allow for the private sector to internalize the total cost of adapting new
infrastructure to assure that the increased demand–the product of higher population densities
that exceed planned capacities–can be met. Moreover, even if the policy allows for this cost to be
internalized, it is difficult for the public sector to predict where the areas needing additional
investments in infrastructure will be, and react in time. The latter comes from the failure of the
policy in identifying generating and consuming areas according to their infrastructure capacities.
The research question developed in Chapter 10 evidenced consistent water–provision problems
in rehabilitated slums, suggesting infrastructure bottlenecks in the water–provision system and
confirming some of the hypothesis set forth in Chapter 7.
As functioning today, the so–called ‗free‘ policy has shifted the burden of slum rehabilitation
to the private sector, but has hidden costs in the form of urban infrastructure adaptation that are
still supported by the public sector. The creation of a public provision fund–alimented by taxes
collected upon rehabilitated slum dwellers–and its recycling for the adaptation of new
infrastructure could be an option to solve this problem. Another possibility is to actualize
‗infrastructure development charges‘ charged to project developers and assure their payment,
although this might be difficult given the institutional and political economic context surrounding
slum rehabilitation in Mumbai. However, even if the city had sufficient funds to finance the
adaptation and managed to identify areas needing investments in infrastructure, the ‗timing‘
problem remains as, given the time needed for infrastructure adaptation, increased demand will
continue to precede supply.
194
At the individual level
Residential mobility and poverty recycling
This dissertation presents the first comprehensive study regarding the magnitude, causes and
consequences of post–rehabilitation residential mobility. Results presented in Chapter 8
suggested higher levels of residential mobility following slum rehabilitation, an increase in
households‘ expenses in items related to entering formality (such as unitary prices adjusted to the
legal sector) and a considerable increase in housing value. Two–and–a–half years after moving in,
10% of the original occupants had left rehabilitation apartments although the majority of them
(82%) moved to formal housing and did not return to slums. The principal reasons for leaving
were the high cost of living in new apartments and the incompatibility between the housing
solutions provided and households‘ preferences. While the first reason reveals how ‗normal
standards of living‘ are simply not affordable for a part of the slum population, the second
evidences the difficulties that a standardized policy has in meeting the heterogeneous needs of
slum dwellers. In this regard, while usually seen as a ‗problem‘ slums are sometimes more adapted
to the needs and constraints (i.e. incremental improvements and savings in form of materials,
forms of payment) of poor households. Our analysis revealed that with the SRS policy little
poverty recycling had occurred and that residential mobility lead to a higher net slum absorption, as
44% of newcomers previously lived in slums. It would be interesting to make similar analysis in
other context and with different policies, as the generalization of this result is not automatic. It is
possible that resettlement policies, in which slums are relocated to distant areas, or policies
applied to slums that are poorer and less connected to the formal sector leads to higher
proportions of residential mobility associated with poverty recycling.
The evaluation of the evolution of living expenses before and after rehabilitation reveal how
the higher the divergence between the formal and informal economic sectors, the higher the
shock experience by slum households when passing from informal to formal houses. One of the
possible policy implications of our results is that step–by–step interventions similar to the ones
implemented in some developing countries, in which slums are first provided with water or
electricity and later on titles, could serve to diminish these shocks and adapt the urban
infrastructure to provide its services to the whole population. Another is that innovations or
adaptations of slum policies that allow the creation of temporary buffer zones between the two
sectors could help households to adapt to new living conditions more easily. These are discussed
in the next section as one of the possible perspectives for research.
195
Tenure security, access to credit and housing investments
The study of Urban Renewal Projects in Chapter 6 confirmed the complexity of human
behavior under incomplete tenure rights. The analysis of the effects of the Metrocable intervention
and Urban Integral Projects in Medellín revealed how tenure security can be easily disrupted by
changes in the presence of state (the law). The hypotheses linking the implementation of Urban
Renewal Projects and changes in housing investment are the following: On one hand, investments
made for URPs could be interpreted by the local community as an ‗acceptance‘ of the settlement,
generating higher perceptions of security. On the other hand, the higher presence of local
authorities (the law) might be seen as a ‗menace‘ which might reduce the community‘s perception
of security and lead to lower investments in housing. We found a significant diminution of
investments in housing following a greater presence of the state due to the implementation of the
Metrocable intervention. However, the policy‘s effect was concentrated on squatter settlements and
no effect was found on pirate urbanizations. It is possible that pirate urbanizations, having a higher
legitimacy in the occupation of the territory and being in the city for longer, are not affected by
changes in the presence of state given their level of tenure security. Our results align with
previous literature development that argues that not only through the provision of titles do
policies affect housing investment (Razzaz 1993, Gilbert 2002 an Payne 2001). Compared to the
Metrocable intervention, we found no significant effect of Urban Integral Projects on the level of
housing consolidation. The latter could be related to the higher integration and participation of
the communities involved in the Urban Integral Projects which lead to a compensation of the
‗acceptance‘ effect and the ‗menace‘ effect.
The analysis of the effects of the Slum Rehabilitation Scheme on households presented in
Chapter 9 evidenced an improvement of households‘ access to credit after rehabilitation,
compared to their situation before and to the control group. The latter suggest that slum
rehabilitation generated a higher integration of slum households in the formal economy and
confirms one of the most recurrent statements associated to titling policies in literature (De Soto
1990, De Soto, 2000). However, results also revealed that titles were sometimes not enough to
diminish credit constraints and that having a sufficient and secure income is also important.
2. Perspectives for future research
Some of the possible future research perspectives that will allow complementing the
questions addressed in this dissertation are the following:
Evaluate the consequences of slum–upgrading intervention in the integration of slum communities in the formal
economy. So far, most of the studies related to this subject have evaluated whether titling policies
196
improve households‘ access to credit from formal credit institutions. It would be interesting to
see if, for instance, titling or slum – upgrading policies induce a higher integration of households
to the formal labor market. This question might be of special relevance in the case of spatially
targeted interventions that seek a higher integration of marginalized settlements to the city, like
the Urban Integral Projects. For instance it might be possible that prior stigmatization of these
settlements and labor market discrimination decreases as marginalized settlements get
redeveloped.
Study the benefits of policy innovations or adaptations that reduce the shock of passing from the informal to the
formal sector: In both of the cases studied a series of policy innovations were introduced to
attenuate or help families adapt to the cost associated to formality. In Mumbai, property taxes are
subsidized in a linearly decreasing way for a period of 20 years for rehabilitated slum dwellers. In
Medellin three examples of policy adaptations were found in the Moravia relocation project. The
first consisted of the installment of ramps leading from the first to the third floor, allowing
constructors to elude standard regulations–which oblige the installment of lifts in buildings
having more than five floors–and avoid the payment of additional maintenance and
administration fees by relocated slum dwellers. The second, which was agreed upon between the
local government and the Moravia community prior to the implementation of the policy allowed
relocated slum dwellers to keep the same Estrato1 for a couple of years. The third emerged due to
a series of problems detected in the payment of administrative bills related to the provision of
lighting and water in buildings‘ community spaces. To solve the ‗free–rider‘ behavior of relocated
slum dwellers who wanted to profit from the latter without paying, the local government, along
with the utility company, decided to include these costs in households‘ individual electricity and
water bills. Similar adaptations were found in other slum upgrading policies such as the Safe
Electricity and Loss Reduction (SELR) program implemented in a slum in Sao Paulo, Brazil.
Evaluate the long term effects of slum policies. Existent literature related to slum studies has
concentrated on the evaluation of the short terms effects of slum policies (2-5 years) and little has
been done to evaluate the long terms effects (10-20 years). While many of the questions we have
covered in this dissertation are also relevant at a long term some phenomenon‘s can take longer
time periods to occur and might be difficult to observe when evaluating shorter time periods.
1 Estrato refers to a classification of residential buildings or houses used by the Colombian state in which the level of poverty, the provision of basic services, among others, is considered. Six different levels of estratos exist, level 1 and 2 which correspond to the poorer and less – consolidated residential buildings usually benefit from subsidies in the provision of basic services, education and other social programs.
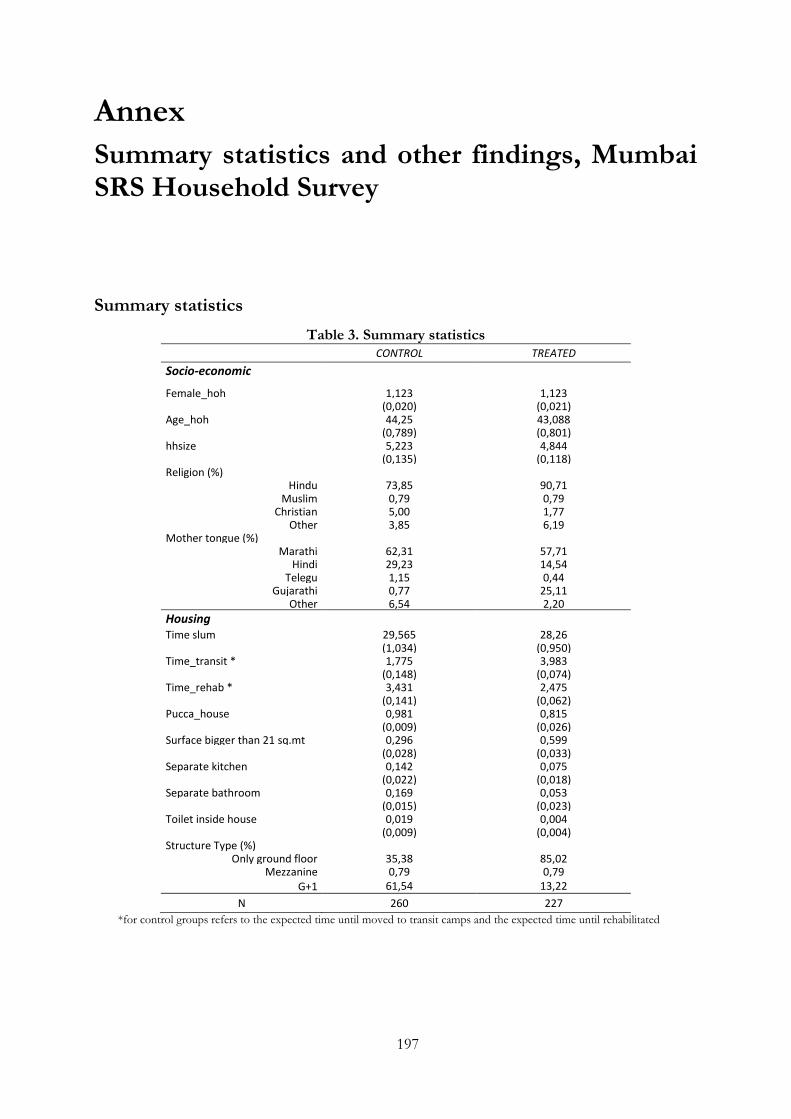
197
Annex
Summary statistics and other findings, Mumbai SRS Household Survey
Summary statistics
Table 3. Summary statistics
CONTROL TREATED
Socio-economic
Female_hoh 1,123 1,123 (0,020) (0,021)
Age_hoh 44,25 43,088 (0,789) (0,801)
hhsize 5,223 4,844 (0,135) (0,118)
Religion (%)
Hindu 73,85 90,71
Muslim 0,79 0,79 Christian 5,00 1,77
Other 3,85 6,19 Mother tongue (%)
Marathi 62,31 57,71 Hindi 29,23 14,54
Telegu 1,15 0,44 Gujarathi 0,77 25,11
Other 6,54 2,20
Housing Time slum 29,565 28,26
(1,034) (0,950) Time_transit * 1,775 3,983
(0,148) (0,074) Time_rehab * 3,431 2,475
(0,141) (0,062) Pucca_house 0,981 0,815
(0,009) (0,026) Surface bigger than 21 sq.mt 0,296 0,599 (0,028) (0,033) Separate kitchen 0,142 0,075 (0,022) (0,018) Separate bathroom 0,169 0,053 (0,015) (0,023) Toilet inside house 0,019 0,004 (0,009) (0,004) Structure Type (%)
Only ground floor 35,38 85,02 Mezzanine
G+1 0,79 0,79
61,54 13,22
N 260 227
*for control groups refers to the expected time until moved to transit camps and the expected time until rehabilitated
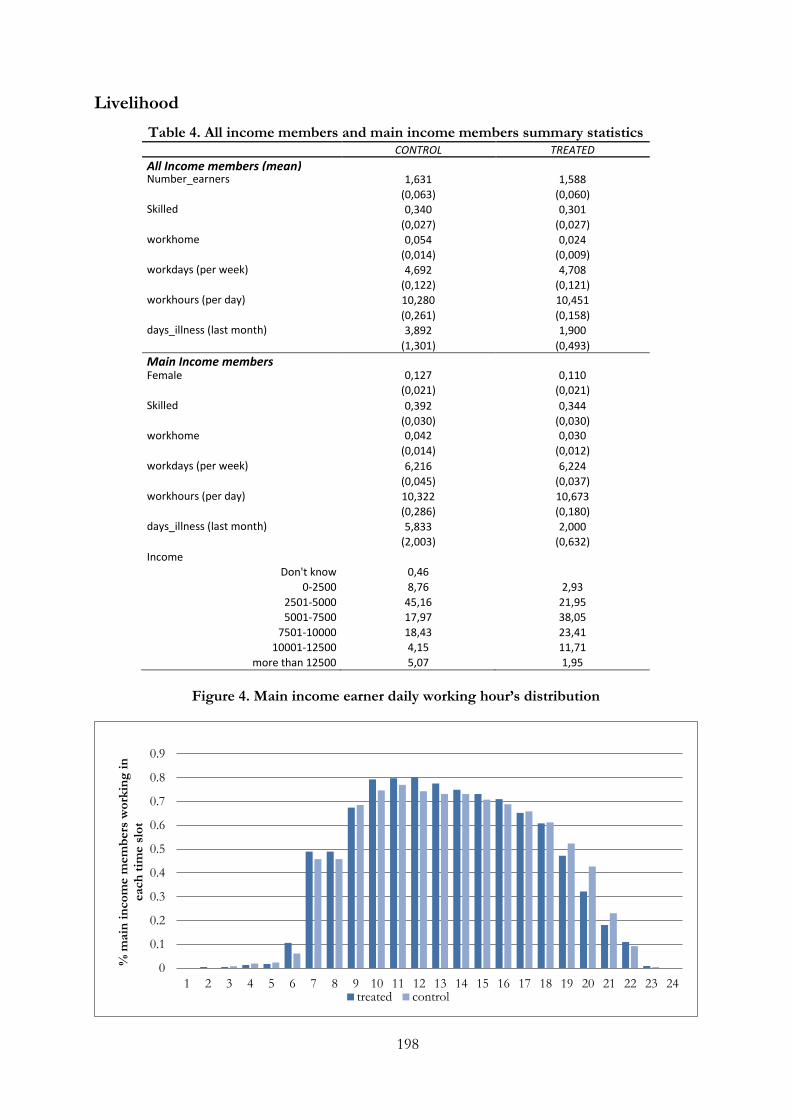
198
Livelihood
Table 4. All income members and main income members summary statistics CONTROL TREATED
All Income members (mean) Number_earners 1,631 1,588
(0,063) (0,060) Skilled 0,340 0,301
(0,027) (0,027) workhome 0,054 0,024
(0,014) (0,009) workdays (per week) 4,692 4,708
(0,122) (0,121) workhours (per day) 10,280 10,451
(0,261) (0,158) days_illness (last month) 3,892 1,900
(1,301) (0,493)
Main Income members
Female 0,127 0,110
(0,021) (0,021)
Skilled 0,392 0,344
(0,030) (0,030) workhome 0,042 0,030
(0,014) (0,012)
workdays (per week) 6,216 6,224
(0,045) (0,037) workhours (per day) 10,322 10,673
(0,286) (0,180) days_illness (last month) 5,833 2,000
(2,003) (0,632)
Income Don't know 0,46
0-2500 8,76 2,93
2501-5000 45,16 21,95
5001-7500 17,97 38,05
7501-10000 18,43 23,41
10001-12500 4,15 11,71
more than 12500 5,07 1,95
Figure 4. Main income earner daily working hour’s distribution
0
0.1
0.2
0.3
0.4
0.5
0.6
0.7
0.8
0.9
1 2 3 4 5 6 7 8 9 10 11 12 13 14 15 16 17 18 19 20 21 22 23 24
% m
ain
in
co
me m
em
bers
wo
rkin
g i
n
each
tim
e s
lot
treated control
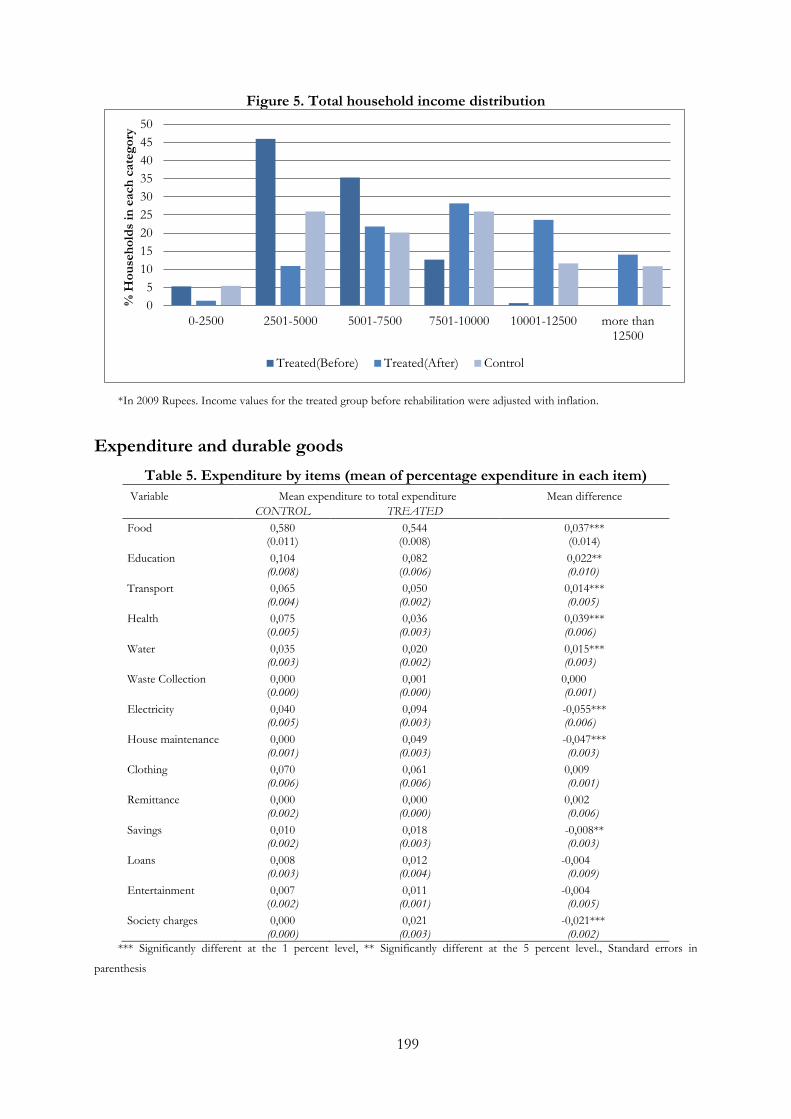
199
Figure 5. Total household income distribution
*In 2009 Rupees. Income values for the treated group before rehabilitation were adjusted with inflation.
Expenditure and durable goods
Table 5. Expenditure by items (mean of percentage expenditure in each item)
Variable Mean expenditure to total expenditure Mean difference
CONTROL TREATED
Food
0,580 (0.011)
0,544 (0.008)
0,037*** (0.014)
Education
0,104 (0.008)
0,082 (0.006)
0,022** (0.010)
Transport
0,065 (0.004)
0,050 (0.002)
0,014*** (0.005)
Health
0,075 (0.005)
0,036 (0.003)
0,039*** (0.006)
Water
0,035 (0.003)
0,020 (0.002)
0,015*** (0.003)
Waste Collection
0,000 (0.000)
0,001 (0.000)
0,000 (0.001)
Electricity
0,040 (0.005)
0,094 (0.003)
-0,055*** (0.006)
House maintenance
0,000 (0.001)
0,049 (0.003)
-0,047*** (0.003)
Clothing
0,070 (0.006)
0,061 (0.006)
0,009 (0.001)
Remittance
0,000 (0.002)
0,000 (0.000)
0,002 (0.006)
Savings
0,010 (0.002)
0,018 (0.003)
-0,008** (0.003)
Loans
0,008 (0.003)
0,012 (0.004)
-0,004 (0.009)
Entertainment
0,007 (0.002)
0,011 (0.001)
-0,004 (0.005)
Society charges
0,000 (0.000)
0,021 (0.003)
-0,021*** (0.002)
*** Significantly different at the 1 percent level, ** Significantly different at the 5 percent level., Standard errors in
parenthesis
0
5
10
15
20
25
30
35
40
45
50
0-2500 2501-5000 5001-7500 7501-10000 10001-12500 more than 12500
% H
ou
seh
old
s in
each
cate
go
ry
Treated(Before) Treated(After) Control
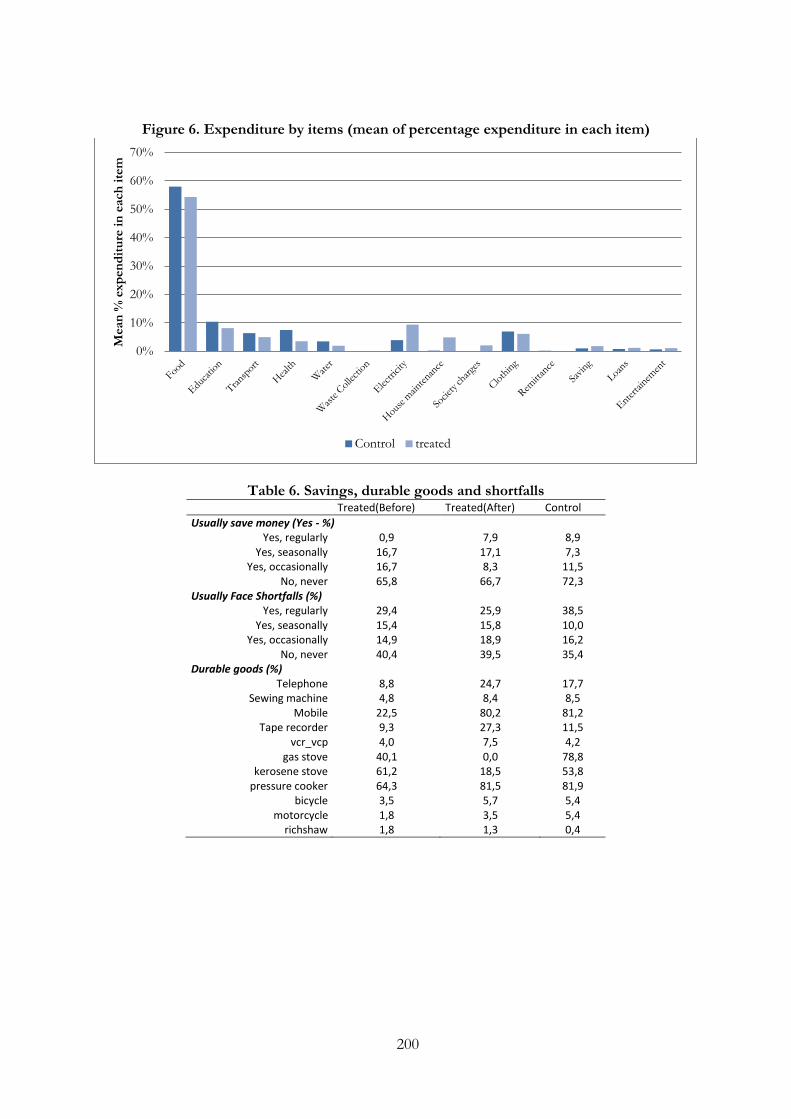
200
Figure 6. Expenditure by items (mean of percentage expenditure in each item)
Table 6. Savings, durable goods and shortfalls Treated(Before) Treated(After) Control
Usually save money (Yes - %) Yes, regularly 0,9 7,9 8,9
Yes, seasonally 16,7 17,1 7,3 Yes, occasionally 16,7 8,3 11,5
No, never 65,8 66,7 72,3 Usually Face Shortfalls (%)
Yes, regularly 29,4 25,9 38,5 Yes, seasonally 15,4 15,8 10,0
Yes, occasionally 14,9 18,9 16,2 No, never 40,4 39,5 35,4
Durable goods (%) Telephone 8,8 24,7 17,7
Sewing machine 4,8 8,4 8,5 Mobile 22,5 80,2 81,2
Tape recorder 9,3 27,3 11,5 vcr_vcp 4,0 7,5 4,2
gas stove 40,1 0,0 78,8 kerosene stove 61,2 18,5 53,8
pressure cooker 64,3 81,5 81,9 bicycle 3,5 5,7 5,4
motorcycle 1,8 3,5 5,4 richshaw 1,8 1,3 0,4
0%
10%
20%
30%
40%
50%
60%
70%
Mean
% e
xp
en
dit
ure
in
each
ite
m
Control treated
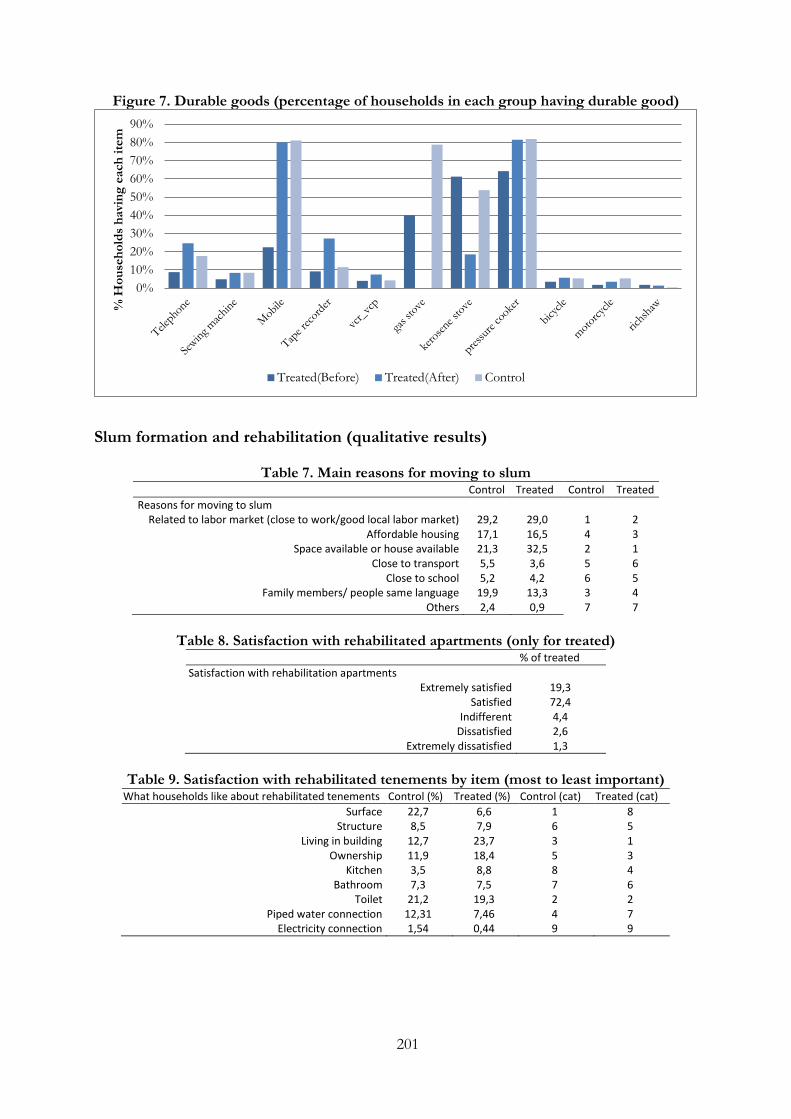
201
Figure 7. Durable goods (percentage of households in each group having durable good)
Slum formation and rehabilitation (qualitative results)
Table 7. Main reasons for moving to slum Control Treated Control Treated
Reasons for moving to slum Related to labor market (close to work/good local labor market) 29,2 29,0 1 2
Affordable housing 17,1 16,5 4 3 Space available or house available 21,3 32,5 2 1
Close to transport 5,5 3,6 5 6 Close to school 5,2 4,2 6 5
Family members/ people same language 19,9 13,3 3 4 Others 2,4 0,9 7 7
Table 8. Satisfaction with rehabilitated apartments (only for treated)
% of treated
Satisfaction with rehabilitation apartments Extremely satisfied 19,3
Satisfied 72,4 Indifferent 4,4
Dissatisfied 2,6 Extremely dissatisfied 1,3
Table 9. Satisfaction with rehabilitated tenements by item (most to least important)
What households like about rehabilitated tenements Control (%) Treated (%) Control (cat) Treated (cat)
Surface 22,7 6,6 1 8 Structure 8,5 7,9 6 5
Living in building 12,7 23,7 3 1 Ownership 11,9 18,4 5 3
Kitchen 3,5 8,8 8 4 Bathroom 7,3 7,5 7 6
Toilet 21,2 19,3 2 2 Piped water connection 12,31 7,46 4 7
Electricity connection 1,54 0,44 9 9
0%
10%
20%
30%
40%
50%
60%
70%
80%
90% %
Ho
use
ho
lds
havi
ng
each
ite
m
Treated(Before) Treated(After) Control
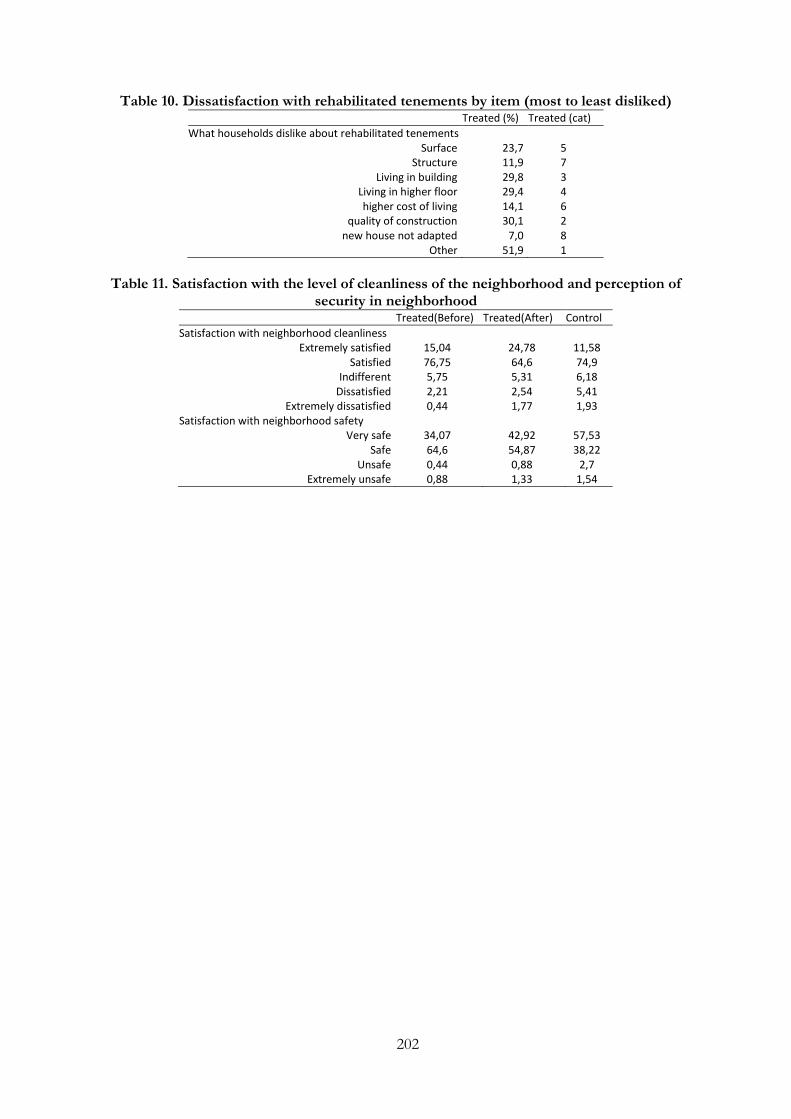
202
Table 10. Dissatisfaction with rehabilitated tenements by item (most to least disliked) Treated (%) Treated (cat)
What households dislike about rehabilitated tenements Surface 23,7 5
Structure 11,9 7 Living in building 29,8 3
Living in higher floor 29,4 4 higher cost of living 14,1 6
quality of construction 30,1 2 new house not adapted 7,0 8
Other 51,9 1
Table 11. Satisfaction with the level of cleanliness of the neighborhood and perception of
security in neighborhood Treated(Before) Treated(After) Control
Satisfaction with neighborhood cleanliness Extremely satisfied 15,04 24,78 11,58
Satisfied 76,75 64,6 74,9 Indifferent 5,75 5,31 6,18
Dissatisfied 2,21 2,54 5,41 Extremely dissatisfied 0,44 1,77 1,93
Satisfaction with neighborhood safety
Very safe 34,07 42,92 57,53 Safe 64,6 54,87 38,22
Unsafe 0,44 0,88 2,7 Extremely unsafe 0,88 1,33 1,54
203
References Aiga, H. and Umenai, T. (2002) Impact of improvement of water supply on household economy in a
squatter area of Manila, Social Science & Medicine, 55, pp. 627-641.
Alcaldía de Medellin (2001) Holistic Upgrading Program in Medellin, Colombia, Istanbul+5
conference: Reviewing and Appraising Progress Five Years after Habitat II
Alcaldía de Medellín (2006a) Proyección de población por género y edades
Alcaldía de Medellín (2006b) Encuesta de Calidad de Vida 2006: IDH para Medellín por comuna o
corregimiento <http://www.medellin.gov.co/alcaldia/jsp/modulos/datosEstadisticos/ob/pdf/calidad
devida2006/288-%20indicadores.pdf>
Alcaldía de Medellín (2006c), Proyecto Urbano Integral PUI Nororiental, Proyecto urbano integral: un
modelo de transformación
Alcaldia de Medellín (2008a) Balance de Gestión del PUI Comuna 13 – San Javier < http://www.
medellin.gov.co/alcaldia/jsp/modulos/I_gestion/puinororientalmapa.jsp>
Alcaldia de Medellín (2008b) Presentación del PUI de la comúna 13 < http://www.
medellin.gov.co/alcaldia/jsp/modulos/I_gestion/puinororientalmapa.jsp>
Alcaldia de Medellín (2008c) Presentación del PUI Zona Noroccidental comunas 5 y 6 <http://www
.medellin.gov.co/alcaldia/jsp/modulos/I_gestion/puinororientalgestionsocial.jsp>
Alcaldia de Medellín (2008d) Presentación del PUI Zona Centrooriental comunas 8 y 9 <http://www.
medellin.gov.co/alcaldia/jsp/modulos/I_gestion/puinororientapresentacion.jsp>
Alcaldia de Medellín (2008e) Proyecto Urbano Integral un modelo de transformación <http://www.
medellin.gov.co/alcaldia/jsp/modulos/I_gestion/puinororientalproyectos.jsp>
Alcaldía de Medellín (2009) Programa Medellín Solidaria, Mesa de trabajo sobre la pobreza y exclusión en
Medellín, Noviembre 27 2009
Alcaldia de Medellín (2010) Medellín Calidad de vida y transformación. Presentación del Ministro de
Hacienda de Medellín en el Seminario Ciudades Latinoamericanas y Calidad de Vida(AFD)
Angrist, J.D. and Krueger, A.B (1999) Empirical strategies in labor economics, Handbook of Labor
economics, 3, pp. 1277–1366
Ashenfelter, O. (1978) Estimating the effect of training programs on earnings, The Review of Economics
and Statistics, 60(1), pp. 47–57
Baker G.L. (2008) Urban Poverty: a global view, Urban Papers–The World Bank
Baker, J. and Basu, R. and Cropper, M. and Lall, S. and Takeuchi, A. (2005) Urban poverty and
transport: the case of Mumbai, World Bank Publications
Barry, M. (2006) Formalising informal land rights: The case of Marconi Beam to Joe Slovo Park,
Habitat international, 30(3), pp. 628-644
Bertaud, A. and Brueckner, J.K. (2005) Analyzing building-height restrictions: predicted impacts and
welfare costs, Regional Science and Urban Economics, 35(2), pp. 109-125
Bertaud, A. and Buckley, R. and Owens, K. (2003) Is Indian Urban Policy Impoverishing?, World
Bank: Urban Research Symposium
204
Bertaud, A. and Malpezzi, S. (2001) Measuring the Costs and Benefits of Urban Land Use Regulation:
A Simple Model with an Application to Malaysia*, Journal of Housing Economics, 10(3), pp. 393-418
Bertrand, M. and Duflo, E. and Mullainathan, S. (2004) How Much Should We Trust Differences–in–
Differences Estimates?*, Quarterly Journal of Economics, 119(1), pp. 249–275
Betancur JJ. (2007) Approaches to the regularization of informal settlements : the case of PRIMED in
Medellin, Colombia, Global Urban Development, 3(1)
Bhide, A., Shajahan, P.K. and Shinde, S. (2003) Utilisation of Slum Rehabilitation Scheme - a study
conducted for the Slum Rehabilitation Authority, Mumbai. Technical report, Tata Institute of Social Sciences
Brueckner, J.K. and Selod, H. (2009) A theory of urban squatting and land-tenure formalization in
developing countries, American Economic Journal: Economic Policy, 1(1), pp. 28-51
Buckley, R.M. and Kalarickal, J. (2006), Thirty years of World Bank shelter lending: what have we
learned?, World Bank Publications
Burra S. (1999) Resettlement and rehabilitation of the urban poor: the soty of Kanjur Marh,
Development Planning Unit–University College London
Burra S. (2005) Towards a Pro-poor framework for slum upgrading in Mumbai, India, Environment and
Urbanization, 17(1), pp. 67-88
Camaiora, A.L. (2011) Evaluación y perspectivas de las políticas gubernamentales para consolidar los
derechos de propiedad en el Perú, Conferencia la Red Geodésica y el Desarrollo Nacional 30-03-2011
Cattaneo, M.D., Galiani, S., Gertler, P.J, Martinez, S., and Titiunik, R. (2009) Housing, health, and
happiness, American Economic Journal: Economic Policy, 1(1), pp. 75-105
Chandy, M. (2007), TDR - lessons from Mumbai, World Bank Urban Research Forum 2007
CHF International (2007), The use of Transfer Development Rights and Additional Development
Rights in urban service upgrading, Fourth Urban Research Forum
Cohen, B. (2006) Urbanization in developing countries: Current trends, future projections, and key
challenges for sustainability, Technology in Society¸ 28(1-2), pp. 63-80
Crépon B., Jacquemet N. (2010) Econométrie: Méthodes et Applications, De Boeck Universités, Collection
« Ouvertures ».
Daef, M. A. (1993). ‗Residential displacement in the rental sector: The effects of upgrading on the
squatter settlement of Arab Rashed—Egypt 1981–1991‘. University College London mimeo
Davis, M. (2006) Planet of slums, Verso
De Soto, H (2000) The Mystery of Capital: Why Capitalism Triumphs in the West and Fails
Everywhere Else, Basic Books, New York
De Soto, H. (1990) The Other Path: the invisible revolution in the Third World, Bepress
Devoto, F. and Duflo, E. and Dupas, P. and Pariente, W. and Pons, V. (2011) Happiness on Tap:
Piped Water Adoption in Urban Morocco, National Bureau of Economic Research
Dieleman, F.M. (2001) Modelling residential mobility; a review of recent trends in research, Journal of
Housing and the Built Environment, pp. 249-265
DPU (2006) Estudios de caso: Bogotá-Soacha-Mosquera; Medellín y Área Metropolitana
205
Duflo, E. and Kremer, M. (2003) Use of randomization in the evaluation of development
effectiveness, Conference on Evaluation and Development Effectiveness, World Bank Operations
Evaluation Department (OED)
Echeverri Restrepo A. and Orsini F.M. (2010) Informalidad y Urbanismo Social en Medellín, Medellin
Medio-Ambiente Urbanismo y Sociedad. Fondo Editorial Universidad EAFIT
EDU (2010) Proyectos Urbanos Integrales 2004-2008,<http://edu.gov.co/index.php?option
=com_content&view=article&id=107&Itemid=73#2008-2011>
EDU–DAP (2005) PUI Nororiental: Etapa diagnóstico y formulación, Informe Final, Mayo 21 de
2005
Edwards, M. (1983) Residential mobility in a changing housing market: the case of Bucaramanga,
Colombia, Urban Studies, 20(2), pp. 131-145
Fass, S.M. (1990) Land Tenure and Informal Housing Processes in Haiti, paper presented at the 32nd
Annual Conference of the Association of Collegiate Schools of Planning, Austin, Texas
Fay, M. and Opal, C. (2000) Urbanization without growth: a not-so-uncommon phenomenon, Policy
Research Working Paper Series–The World Bank
Field, E. (2003) Fertility responses to urban land titling programs: The roles of ownership security and
the distribution of household assets, unpublished paper, Harvard University
Field, E. (2005) Property rights and investment in urban slums, Journal of the European Economic
Association, 3(2–3), pp. 279–290.
Field, E. (2007) Entitled to Work: Urban Property Rights and Labor Supply in Peru, Quarterly Journal of
Economics, 122(4), pp. 1561–1602
Field, E. and Kremer, M. (2006) Impact evaluation for slum upgrading interventions, World Bank,
Poverty Reduction and Economic Management
Field, E. and Torero, M. (2006) Do Property Titles Increase Credit Access Among the Urban Poor?
Evidence from a Nationwide Titling Program. Harvard Working Paper
Fleisig, H.W. and Safavian, M. and de la Peña, N (2006), Reforming collateral laws to expand access to
finance, World Bank Publications.
Friedman, J. and Jimenez, E. and Mayo, S.K. (1988) The demand for tenure security in developing
countries, Journal of Development Economics, 29(2), pp. 185-98
Galiani, S. and Schargrodky, E. (2010) Property rights for the poor: Effects of land titling. Journal of
Public Economics, 94(9–10), pp. 700–729.
Garrod, G.D. and Willis, K.G. (1992) Valuing goods' characteristics: an application of the hedonic
price method to environmental attributes, Journal of Environmental management, 34(1), pp. 59-76
Gibbons, S. and Machin, S. (2008) Valuing school quality, better transport, and lower crime: evidence
from house prices, Oxford Review of Economic Policy, 24(1), pp. 99
Gibbons, S. Machin, S. and Silva, O. (2009) Valuing school quality using boundary discontinuities,
SERC DISCUSSION PAPER 18, Spatial Economics Research Center
Gilbert, A. (2002) On the mystery of capital and the myths of Hernando De Soto: What difference
does legal title make?, International Development Planning Review, 24(1), pp. 1-19
Glaeser, E.L., J. Gyourko and R. Saks (2006) Urban Growth and Housing Supply, Journal of Economic
Geography, 6, pp. 71-89.
206
Gomez Ochoa M.L. (2008) El PUI tranformará la 8 y la 9, El Colombiano (12 de Octubre de 2008),
<http://www.elcolombiano.com/BancoConocimiento/E/el_pui_transformara_la_8_y_la_9_premio_a_l
os_pui_de_la_13_y_nororiental/el_pui_transformara_la_8_y_la_9_premio_a_los_pui_de_la_13_y_norori
ental.asp>
Government of India (2001) Metadata and Brief Highlights on Slum Population, Census 2001
Gravois, J. (2005) The De Soto Delusion, Slate, 28(Jan.) Available <http://slate.msn.com/
id/2112792/>, last date retrieved: July 2005.
Guttery, R. S. (2002) The effects of subdivision design on housing values: the case of alleyways, Journal
of Real Estate Research, 23 (3), pp. 265-274
Hagn, A. (2006) Looking at the situation of informal settlements in Mumbai, Mumbai Reader 06 UDRI
Henderson, J.V. (2009) The Effect of Residential Land Market Regulations on Urban Welfare, Urban
land markets: improving land management for successful urbanization, springer Verlag
Hoffman, M.L. (1990) Informal Residential Land Development in Indonesia. Paper prepared for the
Workshop on Regularizing the Informal Land Development Process, Washington DC
Hoy, M. and Jimenez, E. (1991) Squatters' rights and urban development: an economic perspective,
Económica, pp. 79-92
Ihlanfeldt K.R. (2007) The effect of land use regulation on housing and land prices, Journal of Urban
Economics, 61 (3), pp. 420-435.
Jacobsen, I. (2003) Privatisation and individualisation of land rights in urban areas: The cases of
Imizamo Yethu and Joe Slovo Park in Cape Town, PhD thesis
Jacquemet, N. and Joule, R.V. and Luchini, S. and Shogren, J. (2009) Preference Elicitation under
Oath, Working Paper
Jalan, J. and Ravallion, M. (2003) Does piped water reduce diarrhea for children in rural India?, Journal
of Econometrics, 112(1), pp. 153–173
Jalan, J. and Ravallion, M. (2003) Does piped water reduce diarrhea for children in rural India?, Journal
of Econometrics, 112, pp. 153-173.
Jimenez, E. (1984) Tenure security and urban squatting, The Review of Economic and Statistics, pp. 556-
567
Jimenez, E. (1985) Urban squatting and community organization in developing countries, Journal of
Public Economics, 27(1), pp. 69-92
Joshi, P. (2006) Slums a solution to the housing problem, Mumbai Reader 06 UDRI
Kapoor, M. and Le Blanc, D. (2008) Measuring risk on investment in informal (illegal) housing:
Theory and evidence from Pune, India, Regional Science and Urban Economics, 38(4), pp. 311-329
Karn, S. and Shikura, S. and Harada, H. (2003) Living environment and health of urban poor: A Study
in Mumbai, Economic and Political Weekly, pp. 3575-3586.
Kilroy, A. (2008) Intra-Urban Spatial Inequality: cities as ―urban regions‖, World Development
Report 2009: Background paper
Kirchhoff S. Ibáñez A.M. (2008) Displacement due to Violence in Colombia: Determinants and
consequences at household level, World Development Vol 36. No. 4 pp. 659-676
207
Lall, S.V. and Suri, A. and Deichmann, U. (2006) Household savings and residential mobility in
informal settlements in Bhopal, India, Urban Studies, 43(7), pp. 1025-1040
Lall, S.V. and Wang, H.G. and Da Mata, D. (2007) Do Urban Land Regulations Influence Slum
Formation? Evidence from Brazilian Cities, Brazilian Association of Graduate Programs in Economics
Lancaster, K.J. (1966) A new approach to consumer theory, The Journal of Political Economy, 74(2), pp.
132-157
Lane, R. (1998) Transfer of Development Rights for Balanced Development, Land Lines
Lanjouw, J.O. and Levy, P.I. (2002) Untitled: A Study of Formal and Informal Property Rights in
Urban Ecuador*, The Economic Journal, 112(482), pp. 986-1019
Laquian, A.A. (1973) Slums and squatters in six Philippine cities, IDRC, Ottawa, Canada
López J. (2008) La construction sociale du risque à Medellin(Colombie) : gouvernance locale et
représentations, thèse en géographie de l‘EHESS
Lopez-Pelaez J. Gonzalez L.F. (2008) Marginalité et inclusion urbaine à Medellin (Colombie): un
regard historique à partir des instruments de planification, Autrepart, (47), pp. 187-207
Malpezzi, S. and Mayo, S.K. (1997) Getting housing incentives right: a case study of the effects of
regulation, taxes, and subsidies on housing supply in Malaysia, Land Economics, 73(3), pp. 372-391
Martínez, J. and Mboup, G. and Sliuzas, R. and Stein, A. (2008) Trends in urban and slum indicators
across developing world cities, 1990-2003, Habitat International, 32(1), pp. 86-108
Mayo, S. and Sheppard, S. (1996) Housing supply under rapid economic growth and varying
regulatory stringency: An international comparison, Journal of Housing Economics, 5(3), pp. 274-289
MCGM (2005), Mumbai city development plan 2005-2025, Technical report.
McKinsey (2003) Vision Mumbai: transforming Mumbai into a world-class city
Mcleod, R. (2000) Bridging the finance gap in housing and infrastructure SPARC–a case study,
January 2000.
Meyer, B.D. Viscusi, W.K. and Durbin, D.L. (1995) Workers' compensation and injury duration:
Evidence from a natural experiment, The American Economic Review, 85(3), pp. 322-340
Mhaske, P. (2009) 24x7 water supply in Mumbai only by 2011, DNA, March 3 2009.
Michielin, F. and Mulder, C.H. (2008) Family events and the residential mobility of
couples, Environment and Planning A, 40(11), pp. 2770–2790
MMRDA (2005), Transforming Mumbai into a World Class City, Resettlement & Rehabilitation of
Urban Poor , Workshop on Land Acquisition, Resettlement and Rehabilitation in Urban Development and
Redevelopment (September 10-13, 2006)
Montgomery Watson & Consultants (2001) Slum Sanitation Programme
MTSU (2007), Crystallizing Housing Reforms: reality check through pilot studies, January 2007
Report.
Mukhija V. (2001) Enabling Slum Redevelopment in Mumbai policy paradox in practice, Housing
Studies, 16(6), pp. 791-806
Navtej, N. (2008) Building boomers and fragmentation of space in Mumbai, Economic and Political
Weekly, 43(21), pp. 29-34
208
Netusil, N. (2005) The effects of environmental zoning and amenities on property values, Land
Economics, 81 (2), pp. 227-246
NSSO (1993) Migration in India –NSS 49th round
Ortiz Suarez N. (2009) Al interior de un inquilinato
Parasurman, S. (2007) Uncovering the Myth of Urban Development in Mumbai‘ Urban Age Conference
Payne, G. (1977) Urban housing in the Third World. Routledge Kegan & Paul
Payne, G. (2001) Urban land tenure policy options: Titles or rights?, Habitat International, 25(3), pp.
415-429
Payne, G. Durand–Lasserve, A. Rakodi, C. (2007) Social and economic impacts of land titling
programmes in urban and peri–urban areas: A review of literature. Presented at the World Bank Urban
Research Symposium–Washington, DC, 14–16 May 2007.
Payne, G., (2001) Urban land tenure policy options: Titles or rights? , Habitat International, 25(3), pp.
415-429
Pinho, R. (2010) Maryland‘s Transfer of Development Rights Program, OLR Research Report <
http://www.cga.ct.gov/2010/rpt/2010-R-0464.htm>
Ravallion M. (2001) The Urbanization of Poverty, Policy Research Working Paper Series–The World
Bank
Razzaz, O.M. (1991) Law, urban land tenure and property disputes in contested settlements: the case
of Jordan, PhD dissertation –Harvard University
Reerink, G. and Van Gelder, J.L. (2010) Land titling, perceived tenure security, and housing
consolidation in the kampongs of Bandung, Indonesia, Habitat International, 34(1), pp. 78-85
Renard, V. (2002) Les dynamiques économiques des villes du XXIe siècle: dérive des marchés
immobiliers et fragmentation urbaine, Communication à l‟Académie des Sciences Morales et Politiques
Restrepo, P. (2010) Moving in, Selling out: the outcomes of Slum Rehabilitation in Mumbai. CERNA
Working Paper Series 2010–08.
Risbud N. (2003) The case of Mumbai: India, Understanding slums: case study for the Global Report
on Human Settlements 2003
Rosen, S. (1974) Hedonic prices and implicit markets: product differentiation in pure competition, The
Journal of Political Economy, 82(1), pp. 34-55
Rossi, P.H. (1955) Why families move: a study in the social psychology of urban residential mobility,
Glencoe, IL: Free Press.
Sharma, R.N., Sita, K., Shevade, L. et al (2008) Impact assessment of resettlement implementation
under the MUTP program prepared for The Mumbai Metropolitan Region Development Authority
(MMRDA), Technical report, Tata Institute of Social Sciences
Shekhar, S. (2010) Slum Rehabilitation: no water for Kurla L Ward. Indian Express, February 16 <
http://www.indianexpress.com/news/slum-rehabilitation-no-water-for-kurla-l-wa/580115/>.
Sietchiping, R., Yoon, H-J. 2010. What drives slum persistence and growth? Empirical evidence from
sub-Saharan Africa, International Journal of Advances Studies and Research in Africa, 1(1), pp. 1-22.
Speare, A., Goldstein, S. and Frey, W. H. (1975) Residential Mobility, Migration, and Metropolitan
Change. Cambridge, MA: Ballinger.
209
SRA (2007) Guidelines for the implementation of Slum Rehabilitation Scheme in Greater Mumbai Slum
Rehabilitation Authority–Housing Department of Maharashtra
SRS (2007) Safe Electricity for All! , Slum Electrification and Loss Reduction Program.
Takeuchi, A. Cropper, M. and Bento, A. (2008) Measuring the welfare effects of slum improvement
programs: The case of Mumbai, Journal of Urban Economics, 64(1), pp 65-84
Thompson, C. (2010) Eye on: Slum Rehabilitation, Beyond Profit. <http://beyondprofit.com/eye-on-
slum-rehabilitation/>.
Times of India (2011) Illegal huts fall faster < http://articles.timesofindia.indiatimes.com/2011-01-
20/mumbai/28372384_1_illegal-floors-hutments-illegal-slums>
Torres Tovar C.A. (2009) Ciudad informal colombiana: Barrios construidos por la gente, Universidad
Nacional de Colombia Sede BogotḠEditorial Universidad Nacional de Colombia
Toutain, O. and Gopiprasad S. (2006) Planning for urban infrastructure, India Infrastructure Report 2006:
Urban Infrastructure, New Delhi <http://www.iitk.ac.in/3inetwork/html/reports/IIR2006
/Planning_for_Urban.pdf>.
Turnbull, G.K. (2008) Squatting, eviction and development, Regional Science and Urban Economics, 38(1),
pp. 1-15
Turner, J.F.C. and Fichter, R. (1972) Freedom to build: dweller control of the housing process,
Macmillan, New York
Tyagi, R.D. (1998) Get Back to Basic Policing <http://www.indianexpress.com/res/web
/pIe/ie/daily/19980523/14350394.html>
UN (2007) World urbanization prospects: The 2007 revision
UN (2010) The Millennium Development Goals Report
UN-Habitat (2003a) The Challenge of Slums: Global Report on Human Settlements 2003
UN-Habitat (2003b) Slums of the World: the face of urban poverty in the new millennium, UN-
Habitat, Nairobi
UN-Habitat (2009a) Global Report on Human Settlements 2009: Sustainable Cities: Policy Directions
UN-Habitat (2009b) State of the World‘s cities 2008/2009: Harmonious Cities
UN-Habitat (2010) State of the World‘s Cities 2010/2011: Bridging The Urban Divide
Van Gelder, J.L. (2007) Feeling and thinking: quantifying the relationship between perceived tenure
security and housing improvement in an informal neighborhood in Buenos Aires, Habitat International,
31(2), pp. 219-231
Vanberg, C. (2008) Why Do People Keep Their Promises? An Experimental Test of Two
Explanations, Econometrica, 76(6), pp. 167-1480
Vaquier, D. (2010) The Impacts of Slum Resettlement on Urban Integration in Mumbai: The case of
the Chandivali Project, CHS Occasional Paper No. 26
Varley, A. (1987) The relationship between tenure legalization and housing improvements: evidence
from Mexico City, Development and Change, 18(3), pp. 463-481
WB (2009a) World Development Report 2009: Reshaping Economic Geography
WB (2009b) Urban Population by country, <http://data.worldbank.org/indicator /SP.URB.TOTL.
IN.ZS>
210
Webster, M. (2011) Merriam Webster Online < http://www.merriam-webster.com/dictionary/slum>
YUVA (2005), Access to Water for Urban Poor: A Situational Analysis of Slum settlements in
Mumbai
Les impacts des politiques à l’égard de l’habitat informel sur le bienêtre des
ménages : le cas de Medellin (Colombia) et Mumbai (India)
RESUME : Les politiques à l’égard de l’habitat illégal jouent un rôle central dans l’effort de
réduction de la pauvreté à l’échelle locale et nationale , étant donné que la pauvreté devient de plus en plus un phénomène urbain. Cependant, la réduction de la pauvreté est rarement définie comme objectif principal des politiques des bidonvilles, mais est une conséquence indirecte de leur application. Cette thèse a comme objectif l’amélioration de la compréhension des effets des politiques à l’égard des bidonvilles sur le bien-être des ménages. Deux cas d’études sont abordés: le Schéma de Réhabilitation des Bidonvilles (SRB) à Mumbai (Inde) et les Projets Urbains Intégraux (PUI) à Medellin (Colombie). Entre autre, nous répondons aux questions suivantes : Quelles sont les causes de la mobilité résidentielle post-réhabilitation ? Quels sont les impacts de la SRB sur l’accès au crédit ? Quels sont les effets des projets de renouvellement urbain sur le niveau de consolidation des logements ? Nous utilisons des méthodologies récentes d’économie empirique permettant de comparer des groupes bénéficiaires des politiques à des groupes non-bénéficiaires. Dans le cas de Mumbai, une enquête a été réalisée par l'auteur auprès de 510 ménages dans 9 bidonvilles cibles de la politique SRB, celle-ci ayant été mise en place dans quatre d’entre eux. Dans le cas de Medellin trois sources d’information ont été utilisés (L’Enquête Qualité de Vie, l'Enquête Medellin Solidaria et l'Enquête SISBEN) permettant le suivi d'un ensemble de bénéficiaires et de non-bénéficiaires des politiques, avant et après les opérations de rénovation urbaine.
Mots clés : bidonvilles, habitat informelle, politiques urbaines, politiques à l’égard des
bidonvilles, évaluation des politiques publiques
The impacts of slum policies on households’ welfare : The case of Medellin
(Colombia) and Mumbai (India)
ABSTRACT : Slum policies play an important role in poverty alleviation efforts at the local scale
and at the national scale – as poverty becomes increasingly ‘urban’ phenomena. However, poverty reduction is rarely positioned as the main objective of slum policies and, when occurring, is an indirect result of their application. The purpose of this thesis is to provide a more complete understanding of how slum policies affect households’ welfare. To explore these issues, two slum-upgrading interventions are used as case studies: the Slum Rehabilitation Scheme in Mumbai (India) and Urban Integral Projects in Medellin (Colombia). This research has addressed issues ranging from the causes of post-rehabilitation residential mobility to the impacts of slum rehabilitation on households’ access to credit as well as the effects of Urban Renewal Projects on housing consolidation. We used recent evolution in empirical economics methodologies that allow comparing policy beneficiaries to non-beneficiaries. In the case of Mumbai a household’s survey was carried out by the author in 9 slum pockets, 4 of which had already been rehabilitated and 5 to-be rehabilitated slums. In the case of Medellin household level information was obtained from three secondary sources (the Quality of Life Survey, the Medellin Solidaria Survey and the SISBEN Survey) that allowed following a set of beneficiaries and non-beneficiaries before and after Urban Renewal Projects took place.
Keywords : slums, informal settlements, urban policies, slum policies, public policies
evaluation
Related Documents