ORIGINAL PAPER The impact of urea-induced unfolding on the redox process of immobilised cytochrome c Stefano Monari • Diego Millo • Antonio Ranieri • Giulia Di Rocco • Gert van der Zwan • Cees Gooijer • Silvia Peressini • Claudio Tavagnacco • Peter Hildebrandt • Marco Borsari Received: 7 April 2010 / Accepted: 2 June 2010 / Published online: 13 June 2010 Ó SBIC 2010 Abstract We have studied the effect of urea-induced unfolding on the electron transfer process of yeast iso-1- cytochrome c and its mutant K72AK73AK79A adsorbed on electrodes coated by mixed 11-mercapto-1-undecanoic acid/ 11-mercapto-1-undecanol self-assembled monolayers. Electrochemical measurements, complemented by surface enhanced resonance Raman studies, indicate two distinct states of the adsorbed proteins that mainly differ with respect to the ligation pattern of the haem. The native state, in which the haem is axially coordinated by Met80 and His18, displays a reduction potential that slightly shifts to negative values with increasing urea concentration. At urea concen- trations higher than 6 M, a second state prevails in which the Met80 ligand is replaced by an additional histidine residue. This structural change in the haem pocket is associated with an approximately 0.4 V shift of the reduction potential to negative values. These two states were found for both the wild-type protein and the mutant in which lysine residues 72, 73 and 79 had been substituted by alanines. The analysis of the reduction potentials, the reaction enthalpies and entro- pies as well as the rate constants indicates that these three lysine residues have an important effect on stabilising the protein structure in the adsorbed state and facilitating the electron transfer dynamics. Keywords Unfolding Cytochrome c Electron transfer process Surface-enhanced resonance Raman Self-assembled monolayer Abbreviations 6cLS Six-coordinated low spin CV Cyclic voltammetry MU 11-Mercapto-1-undecanol MUA 11-Mercapto-1-undecanoic acid SAM Self-assembled monolayer SCE Saturated calomel electrode SERR Surface-enhanced resonance Raman ycc Recombinant non-trimethylated Saccharomyces cerevisiae iso-1-cytochrome c Introduction Cytochrome c is one of the most widely studied proteins in the past few decades. The strong interest in this small Electronic supplementary material The online version of this article (doi:10.1007/s00775-010-0681-7) contains supplementary material, which is available to authorized users. S. Monari A. Ranieri G. Di Rocco S. Peressini M. Borsari (&) Department of Chemistry, University of Modena and Reggio Emilia, Via Campi 183, 41125 Modena, Italy e-mail: [email protected] D. Millo P. Hildebrandt (&) Max-Volmer-Laboratorium, Sekr. PC14, Institut fu ¨r Chemie, Technische Universita ¨t Berlin, Straße des 17. Juni 135, 10623 Berlin, Germany e-mail: [email protected] D. Millo G. van der Zwan C. Gooijer Laser Centre—Analytical Chemistry and Applied Spectroscopy, Vrije Universiteit Amsterdam, De Boelelaan 1081, 1081 HV Amsterdam, The Netherlands C. Tavagnacco Department of Chemistry, University of Trieste, Via Giorgieri 1, 34127 Trieste, Italy 123 J Biol Inorg Chem (2010) 15:1233–1242 DOI 10.1007/s00775-010-0681-7

Welcome message from author
This document is posted to help you gain knowledge. Please leave a comment to let me know what you think about it! Share it to your friends and learn new things together.
Transcript

ORIGINAL PAPER
The impact of urea-induced unfolding on the redox processof immobilised cytochrome c
Stefano Monari • Diego Millo • Antonio Ranieri • Giulia Di Rocco • Gert van der Zwan •
Cees Gooijer • Silvia Peressini • Claudio Tavagnacco • Peter Hildebrandt • Marco Borsari
Received: 7 April 2010 / Accepted: 2 June 2010 / Published online: 13 June 2010
� SBIC 2010
Abstract We have studied the effect of urea-induced
unfolding on the electron transfer process of yeast iso-1-
cytochrome c and its mutant K72AK73AK79A adsorbed on
electrodes coated by mixed 11-mercapto-1-undecanoic acid/
11-mercapto-1-undecanol self-assembled monolayers.
Electrochemical measurements, complemented by surface
enhanced resonance Raman studies, indicate two distinct
states of the adsorbed proteins that mainly differ with respect
to the ligation pattern of the haem. The native state, in which
the haem is axially coordinated by Met80 and His18,
displays a reduction potential that slightly shifts to negative
values with increasing urea concentration. At urea concen-
trations higher than 6 M, a second state prevails in which the
Met80 ligand is replaced by an additional histidine residue.
This structural change in the haem pocket is associated with
an approximately 0.4 V shift of the reduction potential to
negative values. These two states were found for both the
wild-type protein and the mutant in which lysine residues 72,
73 and 79 had been substituted by alanines. The analysis of
the reduction potentials, the reaction enthalpies and entro-
pies as well as the rate constants indicates that these three
lysine residues have an important effect on stabilising the
protein structure in the adsorbed state and facilitating the
electron transfer dynamics.
Keywords Unfolding � Cytochrome c � Electron transfer
process � Surface-enhanced resonance Raman �Self-assembled monolayer
Abbreviations
6cLS Six-coordinated low spin
CV Cyclic voltammetry
MU 11-Mercapto-1-undecanol
MUA 11-Mercapto-1-undecanoic acid
SAM Self-assembled monolayer
SCE Saturated calomel electrode
SERR Surface-enhanced resonance Raman
ycc Recombinant non-trimethylated Saccharomyces
cerevisiae iso-1-cytochrome c
Introduction
Cytochrome c is one of the most widely studied proteins in
the past few decades. The strong interest in this small
Electronic supplementary material The online version of thisarticle (doi:10.1007/s00775-010-0681-7) contains supplementarymaterial, which is available to authorized users.
S. Monari � A. Ranieri � G. Di Rocco � S. Peressini �M. Borsari (&)
Department of Chemistry,
University of Modena and Reggio Emilia,
Via Campi 183, 41125 Modena, Italy
e-mail: [email protected]
D. Millo � P. Hildebrandt (&)
Max-Volmer-Laboratorium, Sekr. PC14, Institut fur Chemie,
Technische Universitat Berlin,
Straße des 17. Juni 135,
10623 Berlin, Germany
e-mail: [email protected]
D. Millo � G. van der Zwan � C. Gooijer
Laser Centre—Analytical Chemistry and Applied Spectroscopy,
Vrije Universiteit Amsterdam,
De Boelelaan 1081,
1081 HV Amsterdam, The Netherlands
C. Tavagnacco
Department of Chemistry,
University of Trieste,
Via Giorgieri 1,
34127 Trieste, Italy
123
J Biol Inorg Chem (2010) 15:1233–1242
DOI 10.1007/s00775-010-0681-7

soluble haem protein is, on the one hand, related to its
important physiological functions in the respiratory chain
of aerobic organisms and in apoptotic pathways [1–4]. On
the other hand, owing to its small size, its well-character-
ised structural and spectral properties as well as the
availability of engineered protein variants, cytochrome c is
frequently used as model protein for studying fundamental
biophysical processes such as electron transfer [5–9] and
protein folding [10–17]. Specifically, the elucidation of
relationships between protein folds and dynamics and the
electron transfer properties is of particular interest in view
of its impact for understanding biological processes on a
molecular level and for the design of novel tailor-made
redox enzymes for potential biotechnological applications.
The present work is dedicated to contributing to the
determination of those structural parameters that control the
thermodynamics and kinetics of interfacial redox processes.
We have focussed on the effect of protein structural changes
induced by urea on the redox properties of cytochrome c
immobilised on electrodes. So far, polypeptide unfolding of
cytochrome c has been intensively studied in solution by a
variety of techniques, monitoring changes of the secondary
and the tertiary structure of the protein as well as structural
alterations of the haem cofactor [10–17]. A variety of
intermediates along the unfolding pathways have been
identified, including those differing with respect to the haem
ligation.
The most vulnerable part of the haem pocket of ferric
cytochrome c has been shown to be the Met80 ligand,
which is easily detached from haem iron, constituting the
first step of the denaturant-induced structural perturbation
of the haem pocket. As shown by Yeh et al. [17], the vacant
coordination site is readily occupied by His33 or His26,
constituting a kinetic trap in the unfolding process. How-
ever, 1H-NMR spectroscopic studies led to the conclusion
that a Lys residue substitutes the Met80 ligand [15], which
would imply a quite different unfolding mechanism. In the
present work, experiments with the K72AK73AK79A
cytochrome c variant helped to discriminate between these
two ligation patterns. In fact, the substitution of those Lys
residues (Scheme 1) involved in the coordination with the
iron atom [15] excludes the existence of a Lys-coordinated
species. Moreover, since the same Lys residues are also
responsible for the electrostatic binding of cytochrome c on
negatively charged self-assembled monolayers (SAMs)
[18, 19], their substitution affects the kinetics of the
interfacial electron transfer process, suggesting different
haem orientations for recombinant non-trimethylated Sac-
charomyces cerevisiae iso-1-cytochrome c (ycc) and
K72AK73AK79A with respect the electrode surface.
In this work we employed electrochemical and spectro-
electrochemical methods to gain further insight into the
interplay between protein unfolding and electron transfer of
yeast iso-1 cytochrome c immobilised on electrodes. The
techniques of choice were cyclic voltammetry (CV), probing
the thermodynamics and kinetics of the interfacial redox
process, in combination with surface enhanced resonance
Raman (SERR) spectroscopy, which is a powerful tool to
identify the nature of the species involved. The aim of this
work was to provide novel insights into the factors control-
ling the interfacial electron transfer of ycc immobilised on
biocompatible surfaces in the presence of urea. In this
respect, the experimental approach allows combination of
the thermodynamic and kinetic electrochemical data with
structural information obtained from SERR spectroscopy to
gain comprehensive insight into the behaviour of ycc.
Materials and methods
Materials
Wild-type ycc and its variant K72AK73AK79A were
expressed in Escherichia coli and purified following pro-
cedures described elsewhere [20–22]. In both cases,
Cys102 was replaced by a threonine to avoid dimerisation
and minimise autoreduction without affecting the spectral
and the functional properties of the protein [23, 24]. All
chemicals were of reagent grade. 11-Mercapto-1-undeca-
noic acid (MUA) and 11-mercapto-1-undecanol (MU) were
purchased from Sigma-Aldrich and were recrystallised
from hexane before use. Urea was purchased from Sigma-
Aldrich. Nanopure water was used throughout.
Electrochemical measurements
A model 273A potentiostat/galvanostat (EG&G PAR, Oak
Ridge, USA) was used to perform CV. Experiments were
Scheme 1 Three-dimensional structure of cytochrome c from Sac-charomyces cerevisiae. The haem group is highlighted, the mutated
residues (Lys72, Lys73 and Lys79) are in red and the axial ligands
(Met80 and His18) are in green
1234 J Biol Inorg Chem (2010) 15:1233–1242
123
carried out at different scan rates (0.02–5 V s-1) using
a cell for small-volume samples (0.5 mL) under argon.
A 1-mm-diameter polycrystalline gold wire, a platinum
sheet, and a saturated calomel electrode (SCE) were used
as the working, counter, and reference electrodes, respec-
tively. The electrical contact between the SCE and the
working solution was achieved with a Vycor� (from PAR)
set. Potentials were calibrated against the MV2?/MV?
couple (MV is methylviologen) [25]. All the redox poten-
tials reported here are referred to the standard hydrogen
electrode, unless otherwise specified. The working gold
electrode was cleaned by flaming under oxidising condi-
tions; afterwards, it was heated in concentrated KOH for
30 min, rinsed with water and subsequently cleaned with
concentrated sulfuric acid for 30 min. To minimise residual
adsorbed impurities, the electrode was subjected to 20
voltammetric cycles between ?1.5 and -0.25 V (vs. SCE)
at 0.1 V s-1 in 1 M H2SO4. Finally, the electrode was
rinsed in water and anhydrous ethanol. The Vycor� set was
treated in an ultrasonic pool for about 5 min. SAM coatings
on the gold electrode were obtained by dipping the pol-
ished electrode into a 1 mM ethanol solution of both MUA
and MU for 12 h and then rinsing it with Milli-Q water.
Protein solutions were freshly prepared before use in 5 mM
phosphate buffer at pH 7 and their concentration (typically
0.2 mM) was carefully checked spectrophotometrically
(JASCO V-570 spectrophotometer). Protein adsorption on
the SAM-coated gold electrode was achieved by dipping
the functionalised electrode into a 0.2 mM protein solution
at 277 K for 5 h. Standard electrolyte solutions included
5 mM sodium perchlorate and 5 mM phosphate buffer at
pH 7. The urea concentration was varied between 0 and
8 M. The formal reduction potentials E�0 were taken to be
the midpoint between the anodic and cathodic peak
potentials [26] and were found to be almost independent of
scan rate in the range 0.02–5 V s-1. For each species, the
experiments were performed at least five times and the
reduction potentials were found to be reproducible within
±2 mV. Cyclic voltammograms at different scan rates
were also recorded to determine the electron transfer rate
constant ks for the adsorbed protein. The ks values obtained
from five measurements were found to be reproducible
within 6%. The CV experiments at different temperatures
were carried out with a cell in a ‘‘non-isothermal’’ setting
[26], in which the reference electrode was kept at constant
temperature (294 ± 0.1 K) whereas the half-cell contain-
ing the working electrode and the Vycor� junction to the
reference electrode was under thermostatic control with a
water bath. The temperature was varied from 278 to 323 K.
With this experimental configuration, the standard entropy
change for Fe(III) to Fe(II) cytochrome c reduction ðDS�0rcÞis given by [27, 28]
DS�0rc ¼ S�0red � S�0ox ¼ nFdE�0
dT
� �: ð1Þ
Thus, DS�0rc was determined from the slope of the plot of
E�0 versus T, which is linear under the assumption that DS�0rcis constant over the temperature range investigated. With
the same assumption, the enthalpy change ðDH�0rcÞ was
obtained from the Gibbs–Helmholtz equation, namely as
the negative slope of the E�0/T versus 1/T plot. The non-
isothermal behaviour of the cell was carefully checked by
determining the DH�0rc and DS�0rc values of the ferricyanide/
ferrocyanide couple [27, 28].
The activation enthalpy DH# was obtained using the
Arrhenius equation assuming DH# = DG#. This approxi-
mation implies that the contribution of the activation
entropy is negligibly small [28–30].
SERR spectroscopy measurements
SERR spectra were obtained with 413-nm excitation using
the experimental set-ups described previously [31, 32].
A detailed description of the preparation of the SERR-
active surface, SAM formation, and protein adsorption is
given elsewhere [32, 33].
Results and discussion
Formal reduction potentials of the immobilised
cytochromes
The electrochemical response of cytochrome c immobi-
lised on MUA/MU-coated electrodes exposed to increasing
urea concentrations is qualitatively the same for both ycc
and K72AK73AK79A immobilised either on polycrystal-
line gold (Fig. 1) or on roughened silver electrodes
(Fig. S1).
The CV traces of ycc obtained at urea concentrations
between 0 and 2 M are very similar (Fig. 1a, wave I,
Table 1), featuring two voltammetric peaks ascribed to the
monoelectronic oxidation and reduction of the haem group.
Importantly, experiments performed in a broader potential
window did not display further features (Fig. S2). Given
the quasi-reversibility of the electron transfer process, as
inferred from the linear plot of the peak current versus the
scan rate (not shown), the formal potential E�0 of the im-
mobilised ycc was determined as the average of the anodic
and the cathodic peak. The value of E�0 = 0.209 V is in
agreement with previous findings and is indicative of
native ycc [34].
At urea concentration between 3 and 8 M, a new
cathodic peak (Fig. 1a, wave II, Table 1) is detected at
J Biol Inorg Chem (2010) 15:1233–1242 1235
123
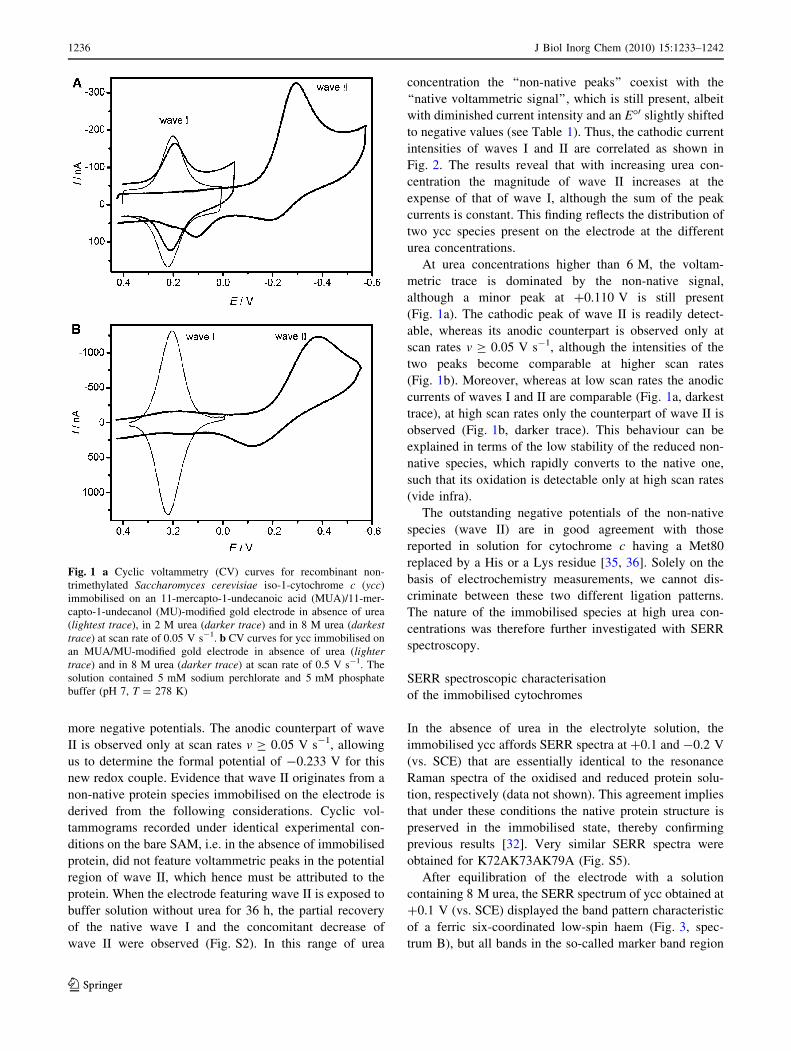
more negative potentials. The anodic counterpart of wave
II is observed only at scan rates v C 0.05 V s-1, allowing
us to determine the formal potential of -0.233 V for this
new redox couple. Evidence that wave II originates from a
non-native protein species immobilised on the electrode is
derived from the following considerations. Cyclic vol-
tammograms recorded under identical experimental con-
ditions on the bare SAM, i.e. in the absence of immobilised
protein, did not feature voltammetric peaks in the potential
region of wave II, which hence must be attributed to the
protein. When the electrode featuring wave II is exposed to
buffer solution without urea for 36 h, the partial recovery
of the native wave I and the concomitant decrease of
wave II were observed (Fig. S2). In this range of urea
concentration the ‘‘non-native peaks’’ coexist with the
‘‘native voltammetric signal’’, which is still present, albeit
with diminished current intensity and an E�0 slightly shifted
to negative values (see Table 1). Thus, the cathodic current
intensities of waves I and II are correlated as shown in
Fig. 2. The results reveal that with increasing urea con-
centration the magnitude of wave II increases at the
expense of that of wave I, although the sum of the peak
currents is constant. This finding reflects the distribution of
two ycc species present on the electrode at the different
urea concentrations.
At urea concentrations higher than 6 M, the voltam-
metric trace is dominated by the non-native signal,
although a minor peak at ?0.110 V is still present
(Fig. 1a). The cathodic peak of wave II is readily detect-
able, whereas its anodic counterpart is observed only at
scan rates v C 0.05 V s-1, although the intensities of the
two peaks become comparable at higher scan rates
(Fig. 1b). Moreover, whereas at low scan rates the anodic
currents of waves I and II are comparable (Fig. 1a, darkest
trace), at high scan rates only the counterpart of wave II is
observed (Fig. 1b, darker trace). This behaviour can be
explained in terms of the low stability of the reduced non-
native species, which rapidly converts to the native one,
such that its oxidation is detectable only at high scan rates
(vide infra).
The outstanding negative potentials of the non-native
species (wave II) are in good agreement with those
reported in solution for cytochrome c having a Met80
replaced by a His or a Lys residue [35, 36]. Solely on the
basis of electrochemistry measurements, we cannot dis-
criminate between these two different ligation patterns.
The nature of the immobilised species at high urea con-
centrations was therefore further investigated with SERR
spectroscopy.
SERR spectroscopic characterisation
of the immobilised cytochromes
In the absence of urea in the electrolyte solution, the
immobilised ycc affords SERR spectra at ?0.1 and -0.2 V
(vs. SCE) that are essentially identical to the resonance
Raman spectra of the oxidised and reduced protein solu-
tion, respectively (data not shown). This agreement implies
that under these conditions the native protein structure is
preserved in the immobilised state, thereby confirming
previous results [32]. Very similar SERR spectra were
obtained for K72AK73AK79A (Fig. S5).
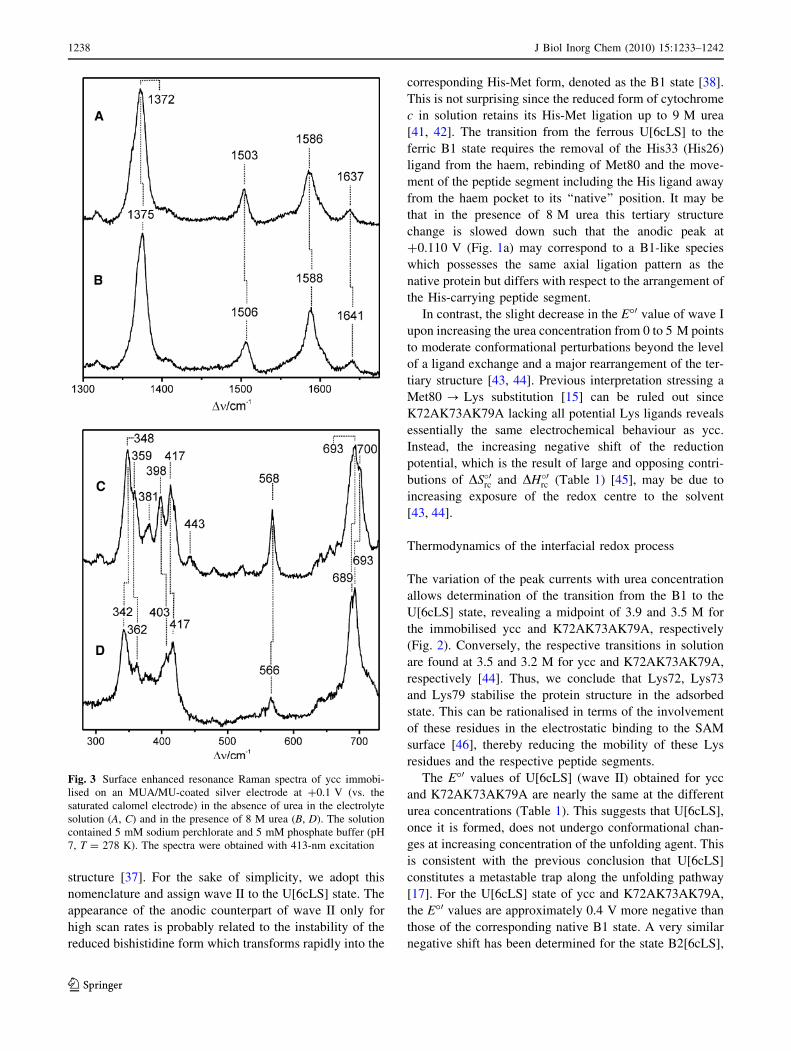
After equilibration of the electrode with a solution
containing 8 M urea, the SERR spectrum of ycc obtained at
?0.1 V (vs. SCE) displayed the band pattern characteristic
of a ferric six-coordinated low-spin haem (Fig. 3, spec-
trum B), but all bands in the so-called marker band region
Fig. 1 a Cyclic voltammetry (CV) curves for recombinant non-
trimethylated Saccharomyces cerevisiae iso-1-cytochrome c (ycc)
immobilised on an 11-mercapto-1-undecanoic acid (MUA)/11-mer-
capto-1-undecanol (MU)-modified gold electrode in absence of urea
(lightest trace), in 2 M urea (darker trace) and in 8 M urea (darkesttrace) at scan rate of 0.05 V s-1. b CV curves for ycc immobilised on
an MUA/MU-modified gold electrode in absence of urea (lightertrace) and in 8 M urea (darker trace) at scan rate of 0.5 V s-1. The
solution contained 5 mM sodium perchlorate and 5 mM phosphate
buffer (pH 7, T = 278 K)
1236 J Biol Inorg Chem (2010) 15:1233–1242
123

are upshifted by 2–4 cm-1 compared with those of the
native ferric form (Fig. 3, spectrum A). Essentially the
same upshifts of the marker bands are observed for ferric
cytochrome c in solution containing 6 M guanidinium
hydrochloride [17, 37] or after binding to negatively
charged surfaces at high electric fields (i.e., state B2)
[32, 37–39]. Under these conditions, the Met80 ligand is
replaced by His33 (or His26) [17, 37], and this replacement
evidently also takes place for ycc immobilised on the
SAM-coated electrode in the presence of 8 M urea. This
conclusion is also true for K72AK73AK79A as judged
from the similarities of the SERR spectra (Fig. S5).
This ligand exchange is further reflected by the SERR
spectrum between 280 and 700 cm-1 which displays a
unique vibrational signature for the specific haem–protein
interactions in cytochrome c. Thus, the quite drastic spec-
tral changes in this region (Fig. 3, spectra C, D) indicate
the structural rearrangement of the haem pocket associated
with the ligand exchange. Again, these spectral changes are
very similar to those observed for cytochrome c bound to
negatively charged surfaces [40].
Identification of the adsorbed species
The SERR spectroscopic data allow the two waves in the
cyclic voltammograms to be assigned to two distinct states
of the immobilised cytochrome c which differ with respect
to the haem ligation. Whereas wave I corresponds to the
state including the native axial ligand pair Met80 and
His18, wave II originates from a state in which Met80 is
replaced by His33 (or His26). This latter state is only
formed at high concentrations of the denaturant, consistent
with previous results obtained for the protein in solution
where this state, denoted as U[6cLS] (where 6cLS is ‘‘six-
coordinated low spin’’), prevails in the presence of 6 M
guanidinium hydrochloride at pH 7 [17, 37]. The haem
pocket structure of U[6cLS] is very similar to that of the
bishistidine-ligated B2 state (B2[6cLS]) induced by high
electric fields. The differences refer to the protein structure
since the formation of U[6cLS] involves a partial unfolding
of the polypeptide chain as demonstrated by circular
dichroism spectroscopy, whereas in B2[6cLS] structural
changes are largely restricted to the level of the tertiary
Table 1 Redox thermodynamic parameters of recombinant non-
trimethylated Saccharomyces cerevisiae iso-1-cytochrome c (ycc) and
its variant K72AK73AK79A immobilised on an 11-mercapto-1-
undecanoic acid (MUA)/11-mercapto-1-undecanol (MU)-modified
gold electrode at different urea concentrations
Curea (mol dm-3) ycc K72AK73AK79A
E�0 (Va) DS�0rc (J mol-1 K-1) DH�0rc (kJ mol-1) E�0 (Va) DS�0rc (J mol-1 K-1) DH�0rc (kJ mol-1)
0b 0.209 -71 -41.1 0.229 -77 -44.8
1b 0.206 -72 -41.1 0.225 -79 -44.8
2b 0.204 -72 -40.9 0.222 -81 -45.1
3b 0.201 -103 -49.7 0.217 -86 -45.4
4b 0.196 -128 -56.5 0.193 -102 -48.0
5b 0.192 -151 -62.9 0.168 -119 -51.0
8c -0.233 ?49 ?36.7 -0.244 ?65 ?43.1
The base electrolytes were 5 mM sodium perchlorate and 5 mM phosphate buffer, pH 7. DS�0rc and DH�0rc were obtained from the correspondent
E�0 versus T and E�0/T versus 1/T plots (Figs. S3, S4). The E�0, DS�0rc and DH�0rc values obtained with 7 M urea are, within the experimental errors,
the same of those obtained with 8 M urea. The average errors on E�0, DS�0rc and DH�0rc values are ±0.002 V, ±2 J mol-1 K-1 and ±0.3 kJ mol-1,
respectivelya T = 293 Kb Data refer to wave Ic Data refer to wave II
Fig. 2 Cathodic peak currents measured for ycc and its variant
K72AK73AK79A immobilised on an MUA/MU-modified gold
electrode at different urea concentrations. ycc, wave I filled circles;
ycc, wave II open circles; K72AK73AK79A, wave I invertedtriangles; K72AK73AK79A, wave II upright triangles. The solution
contained 5 mM sodium perchlorate and 5 mM phosphate buffer (pH
7, T = 278 K)
J Biol Inorg Chem (2010) 15:1233–1242 1237
123
structure [37]. For the sake of simplicity, we adopt this
nomenclature and assign wave II to the U[6cLS] state. The
appearance of the anodic counterpart of wave II only for
high scan rates is probably related to the instability of the
reduced bishistidine form which transforms rapidly into the
corresponding His-Met form, denoted as the B1 state [38].
This is not surprising since the reduced form of cytochrome
c in solution retains its His-Met ligation up to 9 M urea
[41, 42]. The transition from the ferrous U[6cLS] to the
ferric B1 state requires the removal of the His33 (His26)
ligand from the haem, rebinding of Met80 and the move-
ment of the peptide segment including the His ligand away
from the haem pocket to its ‘‘native’’ position. It may be
that in the presence of 8 M urea this tertiary structure
change is slowed down such that the anodic peak at
?0.110 V (Fig. 1a) may correspond to a B1-like species
which possesses the same axial ligation pattern as the
native protein but differs with respect to the arrangement of
the His-carrying peptide segment.
In contrast, the slight decrease in the E�0 value of wave I
upon increasing the urea concentration from 0 to 5 M points
to moderate conformational perturbations beyond the level
of a ligand exchange and a major rearrangement of the ter-
tiary structure [43, 44]. Previous interpretation stressing a
Met80 ? Lys substitution [15] can be ruled out since
K72AK73AK79A lacking all potential Lys ligands reveals
essentially the same electrochemical behaviour as ycc.
Instead, the increasing negative shift of the reduction
potential, which is the result of large and opposing contri-
butions of DS�0rc and DH�0rc (Table 1) [45], may be due to
increasing exposure of the redox centre to the solvent
[43, 44].
Thermodynamics of the interfacial redox process
The variation of the peak currents with urea concentration
allows determination of the transition from the B1 to the
U[6cLS] state, revealing a midpoint of 3.9 and 3.5 M for
the immobilised ycc and K72AK73AK79A, respectively
(Fig. 2). Conversely, the respective transitions in solution
are found at 3.5 and 3.2 M for ycc and K72AK73AK79A,
respectively [44]. Thus, we conclude that Lys72, Lys73
and Lys79 stabilise the protein structure in the adsorbed
state. This can be rationalised in terms of the involvement
of these residues in the electrostatic binding to the SAM
surface [46], thereby reducing the mobility of these Lys
residues and the respective peptide segments.
The E�0 values of U[6cLS] (wave II) obtained for ycc
and K72AK73AK79A are nearly the same at the different
urea concentrations (Table 1). This suggests that U[6cLS],
once it is formed, does not undergo conformational chan-
ges at increasing concentration of the unfolding agent. This
is consistent with the previous conclusion that U[6cLS]
constitutes a metastable trap along the unfolding pathway
[17]. For the U[6cLS] state of ycc and K72AK73AK79A,
the E�0 values are approximately 0.4 V more negative than
those of the corresponding native B1 state. A very similar
negative shift has been determined for the state B2[6cLS],
Fig. 3 Surface enhanced resonance Raman spectra of ycc immobi-
lised on an MUA/MU-coated silver electrode at ?0.1 V (vs. the
saturated calomel electrode) in the absence of urea in the electrolyte
solution (A, C) and in the presence of 8 M urea (B, D). The solution
contained 5 mM sodium perchlorate and 5 mM phosphate buffer (pH
7, T = 278 K). The spectra were obtained with 413-nm excitation
1238 J Biol Inorg Chem (2010) 15:1233–1242
123

which exhibits the same haem pocket structure as B1 [38],
and for cytochrome c in urea-containing solution [36, 41,
43, 44] and is consistent with a change of the ligand from
S-Met to N-His [3, 35, 36, 47]. The difference in the
reduction potential, DE�0, between these two states is
0.031 V more positive for ycc than for K72AK73AK79A
(Table 2). The DE�0 values for ycc and K72AK73AK79A
in solution, however, differ by only 0.014 V [44].
The B1 state displays negative enthalpy and entropy
values for reduction [25, 26, 33–35, 44, 48–51]. The
enthalpy term DH�0rc is considered to be the most important
for the high reduction potentials of cytochromes c. It is
mainly the result of stabilising the ferrous form owing to
ligand binding interactions, the hydrophobicity in the haem
pocket, and the limited solvent accessibility [2, 3, 35]. The
electrostatic interactions of the charge of the redox centre
with buried and surfaces charges, polar groups of the
protein, solvent dipoles and the ionic environment are
additional important factors constituting the enthalpic term
[2, 3, 26, 35, 52–55]. Conversely, the entropic term DS�0rcdisfavours protein reduction, yielding a negative contri-
bution to the E�0 values. Here, solvent reorganisation
effects, charge redistribution and changes in protein flexi-
bility associated with the haem reduction play the major
role in determining DS�0rc [25, 26, 35, 56–62]. At increasing
urea concentration DS�0rc and DH�0rc of both proteins shift
towards negative values (Table 1). This effect is larger for
ycc than for K72AK73AK79A.
To sort out the underlying enthalpic and entropic con-
tributions, we express the urea-induced changes of the
reduction potential E�0 according to [45]
E�0urea � E�0B1 ¼ �DG�0rc;urea
Fþ
DG�0rc;B1
F¼ �DDG�0rc
F; ð2Þ
with
�DDG�0rc ¼ �DDH�0rc þ TDDS�0rc
¼ � DDH�0rc;int þ DDH�0rc;solv
� �þ TDDS�0rc;solv; ð3Þ
where E�0B1 and E�0urea are the reduction potentials of the B1
state of the protein in its native form (without urea) and in
the presence of different urea concentrations, respectively,
DDH�0rc;solv is the change in DH�0rc due to solvent organisation
induced by the unfolding of the protein, whereas DDH�0rc;int
refers to internal protein structural changes such as the
opening of the haem crevice. DDS�0rc;solv is the entropic
contribution resulting from changes in the solvent
organisation. Equation 3 assumes that the contribution of
the intramolecular reaction entropy DS�0rc;int remains largely
unchanged with increasing urea concentration such that
DDS�0rc;int is zero [63–65]. Furthermore, the enthalpic and
entropic contributions to the solvent reorganisation are
assumed to compensate each other such that
DDH�0rc;solv ¼ TDDS�0rc;solv; ð4Þ
and Eq. 2 simplifies to
E�0urea � E�0B1 ¼ �DDG�0rc
F¼ �
DDH�0rc;int
F: ð5Þ
Enthalpy/entropy compensation phenomena are well
known for quite different processes of biopolymers [45, 51,
63, 66–69] and have been discussed on the basis of various
models [64, 65, 70–74]. Such a compensation also refers to
the present case of cytochrome c unfolding as shown in
Fig. 4. Here, the standard enthalpy change ðDH�0rcÞ is
plotted against the corresponding entropic terms ðTDS�0rcÞ at
293 K for adsorbed ycc and K72AK73AK79A at different
urea concentrations.
The plots in Fig. 4 clearly demonstrate that, within the
error margins, enthalpy and entropy changes are linearly
correlated, indicative of compensation effects. For ycc, the
slope was determined to be 0.94 and thus close to 1,
Table 2 Differences in the formal reduction potentials, DE�0, reac-
tion entropies, DDS�0rc, and reaction enthalpies, DDH�0rc , between states
U[6cLS] (where 6cLS is ‘‘six-coordinated low spin’’) (wave II) and
B1 (wave I) obtained for ycc and K72AK73AK79A immobilised on
an MUA/MU-modified gold electrode at 8 M urea concentration
DE�0(Va)
DDS�0rc(J mol-1 K-1)
DDH�0rc
(kJ mol-1)
ycc -0.442 ?120 ?77.8
K72AK73AK79A -0.473 ?142 ?87.9
The solution contained 5 mM sodium perchlorate and 5 mM phosphate
buffer (pH 7). The average errors on DE�0, DDS�0rc and DDH�0rc values are
±0.004 V, ±4 J mol-1 K-1 and ±0.6 kJ mol-1, respectivelya T = 293 K
Fig. 4 Enthalpy–entropy compensation plots at different urea con-
centrations for the reduction thermodynamics of the B1 states of ycc
(filled circles) and K72AK73AK79A (open circles) immobilised on
an MUA/MU-modified gold electrode at 293 K. The solution
contained 5 mM sodium perchlorate and 5 mM phosphate buffer
(pH 7). The straight lines represent the least-squares fits to the data,
yielding a slope of 0.94 and 0.51 for ycc and K72AK73AK79A,
respectively
J Biol Inorg Chem (2010) 15:1233–1242 1239
123

indicating a nearly fully compensatory effect. Conversely, a
much smaller value of 0.51 was obtained for the immobilised
K72AK73AK79A (Fig. 4) whereas K72AK73AK79A in
solution exhibits an almost exact compensatory behaviour
[45]. Evidently, the intramolecular contribution to the
reaction enthalpy increases for the electrostatically bound
mutant, underpinning the role of the three Lys residues in
stabilising the protein structure of the adsorbed protein as
discussed above. This conclusion is consistent with the
higher DDH�0rc;int values for K72AK73AK79A as compared
with ycc (Table 3).
For the U[6cLS] state of both ycc and K72AK73AK79A,
DS�0rc and DH�0rc are almost unaffected by the urea concen-
tration, implying that once the Met ? His ligand exchange
and the coupled peptide rearrangements have taken place, no
further structural changes are induced by the denaturant
(Table 1). The view that the local structural change in the
haem pocket including the ligand exchange is the main
determinant for the large negative shift of the reduction
potential is further supported by the quite similar reduction
potentials of the state B2, in which the same haem pocket
structural change is induced by electrostatic interactions
rather than denaturants [38].
Most remarkable are the positive values for DH�0rc and
DS�0rc, which have not been observed for other states of
cytochrome c [25, 26, 33–35, 44, 48–51].
Electron transfer kinetics of the adsorbed cytochrome c
The formal heterogeneous electron transfer rate constants
were determined using Laviron’s method [75] (Table 4). In
the absence of urea, the electron transfer rate constant for
ycc is distinctly higher than that previously determined for
that protein on an MUA/MU-coated silver electrode [32].
This discrepancy can be readily attributed to the higher
electric field strength at the silver–SAM interface [76].
Thus, reorientation of the immobilised protein is slowed
down and becomes the rate-limiting step of the interfacial
redox process, unlike for the gold–SAM interface, where
heterogeneous electron transfer is controlled by electron
tunnelling. In fact, the rate constant of ycc at the gold–SAM
interface is very similar to that of horse heart cytochrome c
on an MUA-coated silver electrode where electron tunnel-
ling is the rate-limiting step as well [77]. The respective rate
constant for K72AK73AK79A is lower by a factor of 6.6
compared with ycc. This finding suggests that the three Lys
residues are critical for prealignment of the protein prior to
electron transfer.
Upon increasing the urea concentration, the rate con-
stants steadily decrease, albeit more strongly for the mutant.
The ratio of the rate constants for ycc and K72AK73AK79A
increases from 6.6 (0 M urea) to 18.6 (4 M urea). On the
other hand, the difference in the activation enthalpies
remains largely unchanged (approximately 3 kJ mol-1) in
this range (Table 4), pointing to significant and protein-
specific entropic contributions of the reorganisation energy
and/or changes in the tunnelling effects.
The heterogeneous electron transfer rate constant of
U[6cLS] is substantially lower than that of state B1 even at
high urea concentrations. This finding implies that the pro-
tein structural change associated with the B1 ? U[6cLS]
transition leads to a configuration that is highly unfavourable
for the interfacial electron transfer. Again, this effect is more
severe for the triple mutant than for the wild-type protein.
Conclusions
The combined use of electrochemical (CV) and spectro-
scopic (SERR spectroscopy) techniques has allowed char-
acterisation of the interfacial redox process of immobilised
cytochrome c in the presence of the denaturant urea.
Increasing urea concentration leads to the formation of the
Table 3 DDH�0rc;int values obtained for the B1 state (wave I) of ycc
and K72AK73AK79A immobilised on an MUA/MU-modified gold
electrode at different urea concentrations (see Eq. 5)
Urea concentration (mol dm-3) 0 1 2 3 4 5
DDH�0rc;int (kJ mol-1) ycc 0 0.3 0.5 0.8 1.3 1.7
DDH�0rc;int (kJ mol-1)
K72AK73AK79A
0 0.4 0.7 1.2 3.5 5.9
The solution contained 5 mM sodium perchlorate and 5 mM phos-
phate buffer (pH 7). The average error on DDH�0rc;int values is
±0.4 kJ mol-1
Table 4 Rate constants and activation enthalpies (from the Arrhenius
plots in Fig. S6) for the heterogeneous electron transfer for ycc and
K72AK73AK79A immobilised on an MUA/MU-coated gold wire
electrode at different urea concentrations
Curea
(mol dm-3)
ycc K72AK73AK79A
ksa
(s-1)
DH#
(kJ mol-1)
ksa
(s-1)
DH#
(kJ mol-1)
0b 46 8.5 7.0 11.3
1b 15.1 8.7 2.4 11.4
2b 12.1 8.9 1.23 11.8
3b 11.2 9.1 0.71 12.1
4b 9.1 9.2 0.49 12.4
8c 0.91 10.1 0.58 10.9
The solution contained 5 mM sodium perchlorate and 5 mM phos-
phate buffer (pH 7). The average errors on ks and DH# are ±6% and
±0.3 kJ mol-1, respectivelya T = 293 Kb Data refer to the His/Met ligated forms (wave I)c Data refer to the bishistidinate form (wave II)
1240 J Biol Inorg Chem (2010) 15:1233–1242
123
conformational state U[6cLS] in which the Met80 ligand of
the haem iron is substituted by a His (His33 or His26). The
structural change associated with this transition causes an
approximately 400 mV shift of the reduction potential to
negative values. The potential is largely independent of the
urea concentration, whereas the reduction potential of the
native state B1 slightly shifts to negative values with
increasing urea concentration. This effect is attributed to
moderate urea-induced protein structural changes, includ-
ing a gradually increasing opening of the haem crevice.
Both the wild-type protein and the K72AK73AK79A var-
iant reveal qualitatively the same response with increasing
urea concentration such that the coordination of the haem
iron by a Lys residue can safely be ruled out. However, the
transition between states B1 and U[6cLS] occurs at a
slightly lower urea concentration in the triple mutant than
in the wild-type protein, pointing to the involvement of
Lys72, Lys73 and Lys79 in stabilising the structure of the
adsorbed protein. Furthermore, these Lys residues appear
to be important for controlling the interfacial redox prop-
erties inasmuch as they stabilise the ferric form and also
favour the appropriate prealignment of the protein for the
heterogeneous electron transfer.
Acknowledgments We gratefully acknowledge Murat Sezer for
supporting the SERR spectroscopy measurements in Berlin. This
work was performed with financial support from MIUR (COFIN
2007, protocollo 20079Y9578_002, Bioelettrochimica: trasferimento
di carica in sistemi di rilevanza biologica), the University of Modena
and Reggio Emilia, the Deutsche Forschungsgemeinschaft (Sfb498),
the Alexander von Humboldt Foundation (D.M.) and the European
Community Access to Research Infrastructures Action of The
Improving Human Potential (contract no. HPRI-CT-1999-00064)
(A.R.).
References
1. Messerschmidt A, Huber R, Poulos T, Wieghardt K (eds) (2001)
Handbook of metalloproteins, vol 1. Wiley, Chichester
2. Scott RA, Mauk GA (eds) (1996) Cytochrome c: a multidisci-
plinary approach. University Science Books, Sausalito
3. Moore GR, Pettigrew GW (1990) Cytochromes c: evolutionary,
structural, and physicochemical aspects. Springer, Berlin
4. Kagan VE, Bayr HA, Belikova NA, Kapralov O, Tyurina YY,
Jang J, Stoyanovsky DA, Wipf P, Kochanek PM, Greenberger JS,
Pitt B, Shvedova AA, Borisenko G (2009) Free Radic Biol Med
46:1439–1453
5. Bond AM (1994) Inorg Chim Acta 226:293–340
6. Hill HAO, Hunt NI (1993) Methods Enzymol 227:501–522
7. Armstrong FA (1990) Struct Bonding 72:137–222
8. Armstrong FA, Hill HAO, Walton NJ (1986) Q Rev Biophys
18:261–322
9. Murgida DH, Hildebrandt P (2008) Chem Soc Rev 37:937–945
10. Bryngelson JD, Onuchic JN, Socci ND, Wolynes PG (1995)
Proteins 21:167–195
11. Dobson CM, Sali A, Karplus M (1998) Angew Chem Int Ed
37:868–893
12. Dobson CM, Karplus M (1999) Curr Opin Struct Biol 9:92–101
13. Yeh SR, Rousseau DL (1998) Nat Struct Biol 5:222–228
14. Xu Y, Mayne L, Englander SW (1998) Nat Struct Biol 5:774–778
15. Russell BS, Melenkivitz R, Bren KL (2000) Proc Natl Acad Sci
USA 97:8312–8317
16. Myer YP, MacDonald LH, Verma BC, Pande A (1980) Bio-
chemistry 19:199–207
17. Yeh SR, Han SW, Rousseau DL (1998) Acc Chem Res 31:727–
736
18. Zhou J, Zheng J, Jiang S (2004) J Phys Chem B 108:17418–
17424
19. Xu J, Bowden EF (2006) J Am Chem Soc 128:6813–6822
20. Battistuzzi G, Borsari M, De Rienzo F, Di Rocco G, Ranieri A,
Sola M (2007) Biochemistry 46:1694–1702
21. Rosell FI, Ferrer JC, Mauk AG (1998) J Am Chem Soc
120:11234–11245
22. Pollock WBR, Rosell FI, Twitchett MB, Dumont ME, Mauk AG
(1998) Biochemistry 37:6124–6131
23. Cutler RJ, Pielak GJ, Mauk AG, Smith M (1987) Protein Eng
1:95–99
24. Liang N, Mauk AG, Pielak GJ, Johnson JA, Smith M, Hoffmann
B (1988) Science 240:311–313
25. Battistuzzi G, Borsari M, Sola M, Francia F (1997) Biochemistry
36:16247–16258
26. Battistuzzi G, Borsari M, Bortolotti CA, Di Rocco G, Ranieri A,
Sola M (2007) J Phys Chem B 111:10281–10287
27. Yee EL, Cave RJ, Guyer KL, Tyma PD, Weaver MJ (1979) J Am
Chem Soc 101:1131–1137
28. Yee EL, Weaver MJ (1980) Inorg Chem 19:1077–1079
29. Song S, Clark RA, Bowden EF, Tarlov MJ (1993) J Phys Chem
97:6564–6572
30. Weaver MJ (1979) J Phys Chem 13:1748–1757
31. Bonifacio A, Millo D, Gooijer C, Boegschoten R, van der Zwan
G (2004) Anal Chem 76:1529–1531
32. Feng JJ, Murgida DH, Utesch T, Mroginski MA, Hildebrandt P,
Weidinger I (2008) J Phys Chem B 112:15202–15211
33. Millo D, Bonifacio A, Ranieri A, Borsari M, Gooijer C, van der
Zwan G (2007) Langmuir 23:4340–4345
34. Millo D, Bonifacio A, Ranieri A, Borsari M, Gooijer C, van der
Zwan G (2007) Langmuir 23:9898–9904
35. Battistuzzi G, Borsari M, Sola M (2001) Eur J Inorg Chem 2989–
3004
36. Fedurco M, Augustynski J, Indiani C, Smulevich G, Antalık M,
Bano M, Sedlak E, Galscock MC, Dawson JH (2005) J Am Chem
Soc 127:7638–7646
37. Oellerich S, Wackerbarth H, Hildebrandt P (2002) J Phys Chem
B 106:6566–6580
38. Wackerbarth H, Hildebrandt P (2003) ChemPhysChem 4:714–724
39. Murgida DH, Hildebrandt P (2001) J Phys Chem B 105:1578–
1586
40. Hildebrandt P (1991) J Mol Struct 242:379–395
41. Fedurco M, Augustynski J, Indiani C, Smulevich G, Antalık M,
Bano M, Sedlak E, Galscock MC, Dawson JH (2004) Biochim
Biophys Acta 1703:31–41
42. Bhuyan AK, Udgaonkar JB (2001) J Mol Biol 312:1135–1160
43. Pilard R, Haladjian J, Bianco P, Serre P-A, Brabec V (1983)
Biophys Chem 17:131–137
44. Monari S, Ranieri A, Di Rocco G, van der Zwan G, Peressini S,
Tavagnacco C, Millo D, Borsari M (2009) J Appl Electrochem
39:2181–2190
45. Battistuzzi G, Borsari M, Di Rocco G, Ranieri A, Sola M (2004)
J Biol Inorg Chem 9:23–26
46. Paggi DA, Martın DF, Kranich A, Hildebrandt P, Martı M,
Murgida DH (2009) Electrochim Acta 54:4963–4970
47. Battistuzzi G, Borsari M, Cowan JA, Ranieri A, Sola M (2002)
J Am Chem Soc 124:5315–5324
J Biol Inorg Chem (2010) 15:1233–1242 1241
123

48. Bortolotti CA, Battistuzzi G, Borsari M, Facci P, Ranieri A, Sola
M (2006) J Am Chem Soc 128:5444–5451
49. Grealis C, Magner E (2003) Langmuir 19:1282–1286
50. Battistuzzi G, Borsari M, Canters GW, De Waal E, Loschi L,
Warmerdam G, Sola M (2001) Biochemistry 40:6707–6712
51. Bertrand P, Mbarki O, Asso M, Blanchard L, Guerlesquin F,
Tegoni M (1995) Biochemistry 34:11071–11079
52. Gunner MR, Alexov E, Torres E, Lipovaca S (1997) J Biol Inorg
Chem 2:126–134
53. Mauk AG, Moore GR (1997) J Biol Inorg Chem 2:119–125
54. Tezcan FA, Winkler JR, Gray HB (1998) J Am Chem Soc
120:13383–13388
55. Warshel A, Papazyan A, Muegge I (1997) J Biol Inorg Chem
2:143–152
56. Banci L, Bertini I, Rosato A, Varani G (1999) J Biol Inorg Chem
4:824–837
57. Battistuzzi G, Loschi L, Borsari M, Sola M (1999) J Biol Inorg
Chem 4:601–607
58. Borsari M, Bellei M, Tavagnacco C, Peressini S, Millo D, Costa
G (2003) Inorg Chim Acta 349:182–188
59. Banci L, Bertini I, Gray HB, Luchinat C, Redding T, Rosato A,
Turano P (1997) Biochemistry 36:9867–9877
60. Furlan S, La Penna G, Banci L, Mealli C (2007) J Phys Chem B
111:1157–1164
61. La Penna G, Furlan S, Banci L (2007) J Biol Inorg Chem
12:180–193
62. Mao J, Hauser K, Gunner MR (2003) Biochemistry 42:9829–
9840
63. Liu L, Guo Q-X (2001) Chem Rev 101:673–695
64. Grunwald E, Steel C (1995) J Am Chem Soc 117:5687–5692
65. Grunwald E (1986) J Am Chem Soc 108:5726–5731
66. Searle MS, Weatwell MS, Williams DH (1995) J Chem Soc
Perkin Trans 2 141–151
67. Rekharsky M, Inoue Y (2000) J Am Chem Soc 122:4418–4435
68. Liu L, Yang C, Guo Q-X (2000) Biophys Chem 84:239–251
69. Strazewski P (2002) J Am Chem Soc 124:3546–3554
70. Blokzijl W, Engberts JBNF (1993) Angew Chem Int Ed Engl
32:1545–1579
71. Lumry R, Rajender S (1970) Biopolymers 9:1125–1227
72. Krug RR, Hunter WG, Grieger RA (1976) J Phys Chem 80:2335–
2351
73. Ben-Naim A (1975) Biopolymers 14:1337–1355
74. Lee B, Graziano G (1996) J Am Chem Soc 118:5163–5168
75. Laviron E (1979) J Electroanal Chem 101:19–28
76. Millo D, Ranieri A, Gross P, Ly HK, Borsari M, Hildebrandt P,
Wuite GJL, Gooijer C, van der Zwan G (2009) J Phys Chem C
113:2861–2866
77. Murgida DH, Hildebrandt P (2001) J Am Chem Soc 123:4062–
4068
1242 J Biol Inorg Chem (2010) 15:1233–1242
123
Related Documents