The Impact of Transitioning to Shared Electric Vehicles on Grid Congestion and Management Nico Brinkel Copernicus Institute of Sustainable Development, Utrecht University [email protected] Tarek AlSkaif Information Technology Group Wageningen University and Research [email protected] Wilfried van Sark Copernicus Institute of Sustainable Development, Utrecht University [email protected] Abstract—The transition towards a sharing economy and the increasing electrification of the transport sector are occurring simultaneously. Consequently, we can expect more car sharing schemes using electric vehicles (EVs) to emerge in coming years. Numerous studies looked into the grid impact of EV charging and its potential to provide ancillary services, but these studies only considered regular EVs. This study compares the charging patterns of regular and shared EVs and creates insight in the grid impact and potential to provide ancillary services with future adoption of shared EVs. Four scenarios for the adoption of shared EVs are proposed, and a method to generate a set of future charging transactions based on historical charging data is presented. The analysis is performed using charging data from an EV sharing company in the Netherlands. Results indicate that charging demand peaks and grid congestion levels decrease substantially with higher adoption of shared EVs. Adoption of shared EVs increases the potential of EVs to provide ancillary services, due to a higher charging flexibility of shared EVs. Index Terms—sharing economy, electric vehicles, car sharing, grid congestion, ancillary services NOMENCLATURE Indices and sets j ∈J Set of EV categories (shared EVs and regular EVs) n ∈N Set of charging transactions Symbols ΔT ch,n Actual charging time of transaction n. ΔT con,n Connection time to charging station of transaction n. ΔT flex,n Flexibility in charging demand of transaction n. d arr,n,j Arrival day of the week of charging transaction n of category j . E ann,j Predetermined annual charging demand of all EV transactions of category j in an LV grid. E req,n,j Charging demand of transaction n of category j . h arr,n,j Arrival hour of charging transaction n of category j . P av,n Average charging power of transaction n. P max,n Average charging power of transaction n. S pl,j Set of historical charging transactions of category j of which the charging power is logged. S j Set of historical charging transactions of category j . I. I NTRODUCTION Stimulated by among others battery cost reductions and gov- ernmental incentives to decarbonize road transport, the share This study was supported by the European Regional Development Fund ‘EFRO Kansen voor West II’ through the project ‘Smart Solar Charging’. of electric vehicles (EVs) in the passenger car fleet is growing rapidly [1], [2]. High adoption of EVs can cause power quality and congestion problems in the low-voltage (LV) grid [3], since the extra load of EVs was not considered when designing the grid. At the same time, the battery capacity of EVs can be used to mitigate power quality and grid congestion problems due to the high flexibility in EV charging demand. For this reason, a large number of studies have estimated the future impact of EV charging on grid congestion (i.a., [4], [5]) and have assessed the potential of EVs to mitigate power quality and congestion problems (i.a., [6]–[8]). In parallel, a paradigm shift towards the sharing economy is emerging in recent years [9]. The application of the sharing economy to the transport sector could result in high market penetration of car sharing schemes [10]. Car sharing is an alternative to car ownership and provides users short-term access to a set of shared cars managed by a third-party orga- nization [11]. The number of car sharing members worldwide has increased with a factor of 40 between 2006 and 2018 [12]. Different studies expect that the market share of car sharing will continue to increase [13]–[15]. Further adoption of car sharing in combination with a market uptake of EVs could result in an increasing charging demand of shared EVs. This increased role of shared EVs could affect the results of previous studies on the future grid impact of EV charging and the potential of EVs to provide ancillary services, since shared EVs are driven by more people, have different arrival times and are used for different functions. The first aim of this study is to create insights in the impact of a shift towards shared EVs on the electricity grid. This study uses historical charging data from an EV sharing company in the Netherlands to compare the charging characteristics of shared and regular EVs, and proposes a novel method to generate future sets of EV charging transactions. These transaction sets are used to compare EV charging patterns in different adoption scenarios of shared EVs. Second, this study compares the flexibility in charging demand of shared and regular EVs to determine how the potential of EVs in pro- viding ancillary services changes with a shift towards shared EVs. The results of this analysis provide distribution system operators (DSOs) with insights in future grid congestion levels with high adoption of shared EVs, and also indicate whether shared EVs are a suitable technology for the provision of

Welcome message from author
This document is posted to help you gain knowledge. Please leave a comment to let me know what you think about it! Share it to your friends and learn new things together.
Transcript

The Impact of Transitioning to Shared ElectricVehicles on Grid Congestion and Management
Nico BrinkelCopernicus Institute of Sustainable
Development, Utrecht [email protected]
Tarek AlSkaifInformation Technology Group
Wageningen University and [email protected]
Wilfried van SarkCopernicus Institute of Sustainable
Development, Utrecht [email protected]
Abstract—The transition towards a sharing economy and theincreasing electrification of the transport sector are occurringsimultaneously. Consequently, we can expect more car sharingschemes using electric vehicles (EVs) to emerge in coming years.Numerous studies looked into the grid impact of EV chargingand its potential to provide ancillary services, but these studiesonly considered regular EVs. This study compares the chargingpatterns of regular and shared EVs and creates insight in the gridimpact and potential to provide ancillary services with futureadoption of shared EVs. Four scenarios for the adoption ofshared EVs are proposed, and a method to generate a set offuture charging transactions based on historical charging data ispresented. The analysis is performed using charging data froman EV sharing company in the Netherlands. Results indicatethat charging demand peaks and grid congestion levels decreasesubstantially with higher adoption of shared EVs. Adoption ofshared EVs increases the potential of EVs to provide ancillaryservices, due to a higher charging flexibility of shared EVs.
Index Terms—sharing economy, electric vehicles, car sharing,grid congestion, ancillary services
NOMENCLATURE
Indices and setsj ∈ J Set of EV categories (shared EVs and regular EVs)n ∈ N Set of charging transactionsSymbols∆Tch,n Actual charging time of transaction n.∆Tcon,n Connection time to charging station of transaction n.∆Tflex,n Flexibility in charging demand of transaction n.darr,n,j Arrival day of the week of charging transaction n of
category j.Eann,j Predetermined annual charging demand of all EV
transactions of category j in an LV grid.Ereq,n,j Charging demand of transaction n of category j.harr,n,j Arrival hour of charging transaction n of category j.Pav,n Average charging power of transaction n.Pmax,n Average charging power of transaction n.Spl,j Set of historical charging transactions of category j
of which the charging power is logged.Sj Set of historical charging transactions of category j.
I. INTRODUCTION
Stimulated by among others battery cost reductions and gov-ernmental incentives to decarbonize road transport, the share
This study was supported by the European Regional Development Fund‘EFRO Kansen voor West II’ through the project ‘Smart Solar Charging’.
of electric vehicles (EVs) in the passenger car fleet is growingrapidly [1], [2]. High adoption of EVs can cause power qualityand congestion problems in the low-voltage (LV) grid [3],since the extra load of EVs was not considered when designingthe grid. At the same time, the battery capacity of EVs can beused to mitigate power quality and grid congestion problemsdue to the high flexibility in EV charging demand. For thisreason, a large number of studies have estimated the futureimpact of EV charging on grid congestion (i.a., [4], [5]) andhave assessed the potential of EVs to mitigate power qualityand congestion problems (i.a., [6]–[8]).
In parallel, a paradigm shift towards the sharing economyis emerging in recent years [9]. The application of the sharingeconomy to the transport sector could result in high marketpenetration of car sharing schemes [10]. Car sharing is analternative to car ownership and provides users short-termaccess to a set of shared cars managed by a third-party orga-nization [11]. The number of car sharing members worldwidehas increased with a factor of 40 between 2006 and 2018[12]. Different studies expect that the market share of carsharing will continue to increase [13]–[15]. Further adoptionof car sharing in combination with a market uptake of EVscould result in an increasing charging demand of shared EVs.This increased role of shared EVs could affect the results ofprevious studies on the future grid impact of EV charging andthe potential of EVs to provide ancillary services, since sharedEVs are driven by more people, have different arrival timesand are used for different functions.
The first aim of this study is to create insights in the impactof a shift towards shared EVs on the electricity grid. This studyuses historical charging data from an EV sharing companyin the Netherlands to compare the charging characteristicsof shared and regular EVs, and proposes a novel methodto generate future sets of EV charging transactions. Thesetransaction sets are used to compare EV charging patternsin different adoption scenarios of shared EVs. Second, thisstudy compares the flexibility in charging demand of sharedand regular EVs to determine how the potential of EVs in pro-viding ancillary services changes with a shift towards sharedEVs. The results of this analysis provide distribution systemoperators (DSOs) with insights in future grid congestion levelswith high adoption of shared EVs, and also indicate whethershared EVs are a suitable technology for the provision of
ancillary services. In addition, the results of this study showpolicymakers whether a shift towards shared EVs should bestimulated from a grid perspective.
This study is outlined as follows: Section II introducesthe considered car sharing scheme and the investigated casestudy grid. Section III provides a comparison of the keycharging characteristics of shared and regular EVs. SectionIV presents a method to simulate future charging transactionsand outlines different future adoption scenarios of shared EVs.The aggregated EV charging behavior in a LV grid, flexibilityin charging demand and grid impact are presented for allconsidered scenarios in Section V. Lastly, a discussion andconclusion are presented in respectively Section VI and VII.
II. CASE STUDY SPECIFICATIONS
We Drive Solar is a car sharing company offering station-based car sharing services using EVs. As of February 2020, ithas a portfolio of three Tesla Model 3’s (battery capacity 50kWh) and 72 Renault ZOE’s (battery capacity 44-52 kWh).Users need a subscription to drive a We Drive Solar EV, andalso pay per driven kilometer.
EV charging data is obtained between 8 January 2019 and10 March 2020 from 230 charging stations with two chargingsockets in residential areas in the Netherlands, of which thelarge majority are located in the city of Utrecht. Each ofthese charging stations log the arrival time, departure time,car ID and charging volume of each charging transaction. 24stations also log the charging power over time, which is usedto determine the average charging power, maximum chargingpower and actual charging duration for each transaction. Adistinction is made between shared EVs and regular EVs basedon the car ID of the We Drive Solar EVs. All We Drive SolarEVs use one of the logged EV charging stations as their homestation. Table I provides an overview of the number of loggedcharging transactions for regular and shared EVs.
TABLE I: Overview of logged charging transactions in theinput data.
No. of logged charg-ing transactions
No. of charging transactions inwhich charging power is logged
Regular EVs 28,621 11,570Shared EVs 8,722 1,963
A residential grid in the Lombok district in Utrecht, theNetherlands serves as a case study grid to analyze the gridimpact of EV charging. This grid is connected to the medium-voltage (MV) grid through a 400 kVA transformer and serves340 grid connections, of which the majority is households. Itis assumed that 25% of the households will use a full-electricheat pump (HP) for heating in the future. The assumed futureinstalled photovoltaic (PV) capacity in the grid equals 200kWp. The profiles of HP demand, residential load and PVgeneration are created using the methods in [8].
III. CHARGING CHARACTERISTICS OF SHARED ANDREGULAR EVS
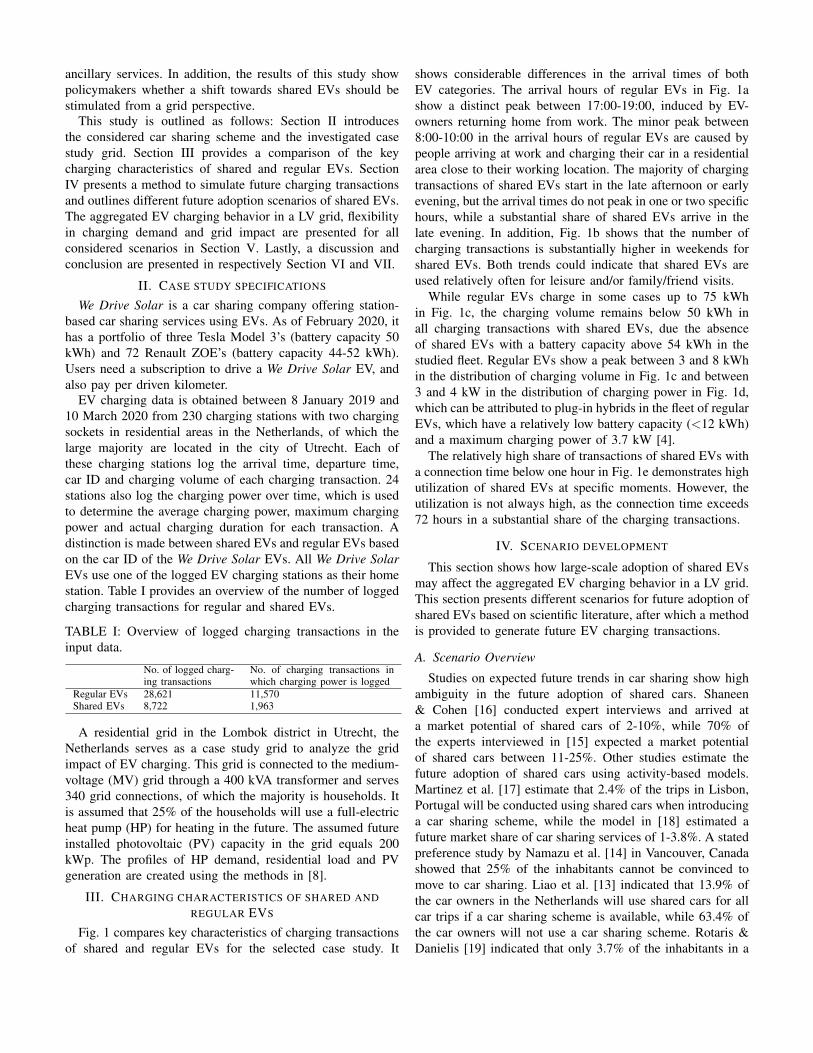
Fig. 1 compares key characteristics of charging transactionsof shared and regular EVs for the selected case study. It
shows considerable differences in the arrival times of bothEV categories. The arrival hours of regular EVs in Fig. 1ashow a distinct peak between 17:00-19:00, induced by EV-owners returning home from work. The minor peak between8:00-10:00 in the arrival hours of regular EVs are caused bypeople arriving at work and charging their car in a residentialarea close to their working location. The majority of chargingtransactions of shared EVs start in the late afternoon or earlyevening, but the arrival times do not peak in one or two specifichours, while a substantial share of shared EVs arrive in thelate evening. In addition, Fig. 1b shows that the number ofcharging transactions is substantially higher in weekends forshared EVs. Both trends could indicate that shared EVs areused relatively often for leisure and/or family/friend visits.
While regular EVs charge in some cases up to 75 kWhin Fig. 1c, the charging volume remains below 50 kWh inall charging transactions with shared EVs, due the absenceof shared EVs with a battery capacity above 54 kWh in thestudied fleet. Regular EVs show a peak between 3 and 8 kWhin the distribution of charging volume in Fig. 1c and between3 and 4 kW in the distribution of charging power in Fig. 1d,which can be attributed to plug-in hybrids in the fleet of regularEVs, which have a relatively low battery capacity (<12 kWh)and a maximum charging power of 3.7 kW [4].
The relatively high share of transactions of shared EVs witha connection time below one hour in Fig. 1e demonstrates highutilization of shared EVs at specific moments. However, theutilization is not always high, as the connection time exceeds72 hours in a substantial share of the charging transactions.
IV. SCENARIO DEVELOPMENT
This section shows how large-scale adoption of shared EVsmay affect the aggregated EV charging behavior in a LV grid.This section presents different scenarios for future adoption ofshared EVs based on scientific literature, after which a methodis provided to generate future EV charging transactions.
A. Scenario Overview
Studies on expected future trends in car sharing show highambiguity in the future adoption of shared cars. Shaneen& Cohen [16] conducted expert interviews and arrived ata market potential of shared cars of 2-10%, while 70% ofthe experts interviewed in [15] expected a market potentialof shared cars between 11-25%. Other studies estimate thefuture adoption of shared cars using activity-based models.Martinez et al. [17] estimate that 2.4% of the trips in Lisbon,Portugal will be conducted using shared cars when introducinga car sharing scheme, while the model in [18] estimated afuture market share of car sharing services of 1-3.8%. A statedpreference study by Namazu et al. [14] in Vancouver, Canadashowed that 25% of the inhabitants cannot be convinced tomove to car sharing. Liao et al. [13] indicated that 13.9% ofthe car owners in the Netherlands will use shared cars for allcar trips if a car sharing scheme is available, while 63.4% ofthe car owners will not use a car sharing scheme. Rotaris &Danielis [19] indicated that only 3.7% of the inhabitants in a
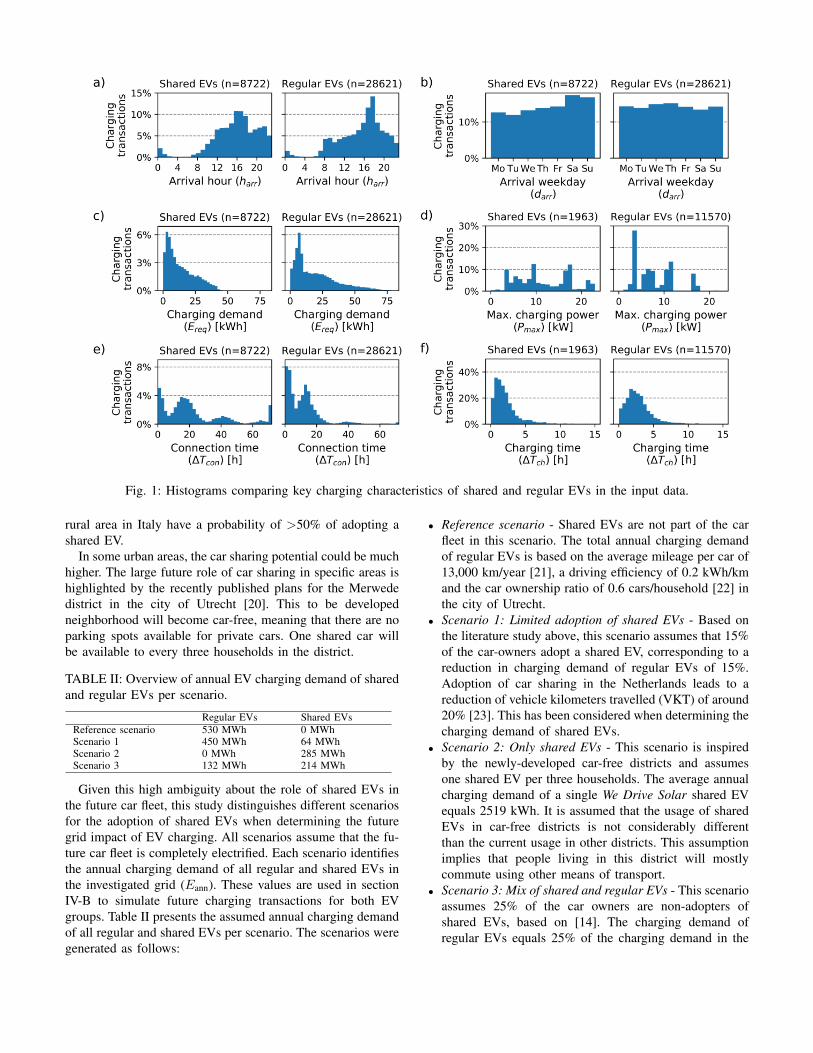
Fig. 1: Histograms comparing key charging characteristics of shared and regular EVs in the input data.
rural area in Italy have a probability of >50% of adopting ashared EV.
In some urban areas, the car sharing potential could be muchhigher. The large future role of car sharing in specific areas ishighlighted by the recently published plans for the Merwededistrict in the city of Utrecht [20]. This to be developedneighborhood will become car-free, meaning that there are noparking spots available for private cars. One shared car willbe available to every three households in the district.
TABLE II: Overview of annual EV charging demand of sharedand regular EVs per scenario.
Regular EVs Shared EVsReference scenario 530 MWh 0 MWhScenario 1 450 MWh 64 MWhScenario 2 0 MWh 285 MWhScenario 3 132 MWh 214 MWh
Given this high ambiguity about the role of shared EVs inthe future car fleet, this study distinguishes different scenariosfor the adoption of shared EVs when determining the futuregrid impact of EV charging. All scenarios assume that the fu-ture car fleet is completely electrified. Each scenario identifiesthe annual charging demand of all regular and shared EVs inthe investigated grid (Eann). These values are used in sectionIV-B to simulate future charging transactions for both EVgroups. Table II presents the assumed annual charging demandof all regular and shared EVs per scenario. The scenarios weregenerated as follows:
• Reference scenario - Shared EVs are not part of the carfleet in this scenario. The total annual charging demandof regular EVs is based on the average mileage per car of13,000 km/year [21], a driving efficiency of 0.2 kWh/kmand the car ownership ratio of 0.6 cars/household [22] inthe city of Utrecht.
• Scenario 1: Limited adoption of shared EVs - Based onthe literature study above, this scenario assumes that 15%of the car-owners adopt a shared EV, corresponding to areduction in charging demand of regular EVs of 15%.Adoption of car sharing in the Netherlands leads to areduction of vehicle kilometers travelled (VKT) of around20% [23]. This has been considered when determining thecharging demand of shared EVs.
• Scenario 2: Only shared EVs - This scenario is inspiredby the newly-developed car-free districts and assumesone shared EV per three households. The average annualcharging demand of a single We Drive Solar shared EVequals 2519 kWh. It is assumed that the usage of sharedEVs in car-free districts is not considerably differentthan the current usage in other districts. This assumptionimplies that people living in this district will mostlycommute using other means of transport.
• Scenario 3: Mix of shared and regular EVs - This scenarioassumes 25% of the car owners are non-adopters ofshared EVs, based on [14]. The charging demand ofregular EVs equals 25% of the charging demand in the
reference scenario. The charging demand of shared EVsequals 75% of the charging demand in Scenario 2.
B. Generating Future EV Charging Transactions
Charging transactions for shared EVs and regular EVs aresimulated for one year to obtain insight in EV chargingbehavior in the different scenarios. A new EV charging trans-action n ∈ N is created until the total charging requirementof all simulated transactions of a specific category j ∈{Shared EV, Regular EV} (Ereq,n,j) equals the predeterminedcharging demand of all EVs of category j (Eann,j):
N∑n=1
Ereq,n,j = Eann,j ∀j. (1)
The simulated charging transaction set is created using aprobabilistic model which considers a set of historical chargingtransactions Sj for each EV category. In case the chargingpower over time is not logged at all charging stations, thesubset Spl,j of Sj is created with all charging transactions ofwhich the charging power is logged. Charging transactions aresimulated using the following steps:
1) The arrival day of the week of charging transaction n(darr,n,j) is determined based on the probability densityfunction of the arrival day of the week in Sj . Subse-quently, this transaction is randomly assigned to a datewith the specific weekday in the simulation period.
2) The arrival hour harr,n,j is determined using a probabilitydensity function of the arrival hours of all EVs chargingtransactions in Sj arriving at weekday darr,n,j . Thecharging transaction is randomly assigned a startingminute in the arrival hour.
3) The required charging volume Ereq,n,j and connectiontime to the charging station ∆Tcon,n are determinedby randomly selecting a charging transaction from allEV charging transactions in Sj arriving at weekdaydarr,n,j and arriving at harr,n,j . The charging volume andconnection time of this specific charging transaction areassigned to the simulated charging transaction.
4) The average and maximum charging power (Pav,n andPmax,n) of a simulated charging transaction are deter-mined by using the charging power of a randomlyselected charging transaction from all charging trans-actions in Spl,j arriving at weekday darr,n and at hourharr,n. If the condition in eq. 2 is not met, the steps todetermine Pav,n and Pmax,n are repeated:
Pav,n ≥Ereq,n,j
∆Tcon,n. (2)
If no transaction in Spl,j arriving at weekday darr,n andat hour harr,n can meet this condition, Pav,n and Pmax,nare determined using eq. 3:
Pav,n, Pmax,n =Ereq,n,j
∆Tcon,n. (3)
Since Spl,j ≤ Sj , it can occur that there are no or avery limited number of transactions in Spl,j arriving at
weekday darr,n and at hour harr,n. In that case, the set ofcharging transactions from which a transaction is ran-domly selected is expanded to all charging transactionsarriving at hour harr,n for all weekdays if darr,n is aweekday, or all weekend days if darr,n is a weekend day.
V. RESULTS
A. Charging Patterns
Fig. 2 compares the average EV charging power duringweek and weekend days for the four considered scenarios.Both in the Reference Scenario and Scenario 1 a charging de-mand peak occurs around 19:00 on weekdays, caused by EVsarriving home from work. Comparing the charging demandpeak between both scenarios indicates that limited adoption ofshared EVs reduces the average peak in charging demand onweekdays by 8%, due to a lower overall charging demand anda lower simultaneity in arrival hours in Scenario 1. The averageoverall charging demand on weekdays decreases from 1433to 1366 kWh when transitioning from the Reference Scenarioto Scenario 1. Despite the lower overall charging demand inScenario 1, the average charging peak and overall chargingdemand in weekends are similar in both scenarios due to thelarge utilization of shared EVs in weekends.
A large scale transition towards shared EVs in Scenario 2and 3 has substantial impact on the charging peak and overallcharging demand on weekdays. The average charging peakon weekdays in Scenario 2 reduces by 75 kW compared tothe Reference Scenario, while the average overall chargingdemand on weekdays reduces from 1433 to 681 kWh. A largeshare of the charging demand is shifted towards weekends withhigh adoption of shared EVs; the average overall charging de-mand on weekend days is 51% higher compared to weekdaysin Scenario 2, while this is 4% in the Reference Scenario.
Charging demand peaks and overall charging demand aresimilar between Scenario 2 and 3, indicating that a limitedshare of regular EVs in the car fleet still leads to a considerablereduction in the peak charging demand compared to a scenariowithout shared EVs.
B. Charging Flexibility
TABLE III: Average share of charging demand that can bedelayed for at least 6 and 12 hours at different moments ofthe day in each considered scenario.
Ref. scenario Scenario 1 Scenario 2 Scenario 3>6h >12h >6h >12h >6h >12h >6h >12h
00:00-06:00 24% 7% 26% 9% 45% 25% 35% 16%06:00-12:00 9% 2% 10% 4% 25% 20% 15% 9%12:00-18:00 20% 15% 22% 18% 35% 33% 30% 27%18:00-24:00 36% 13% 37% 16% 47% 36% 43% 28%Total 27% 11% 28% 14% 41% 31% 35% 24%
Flexibility in charging demand provides insight in thepotential of EVs to provide ancillary services, as EVs havemore room to alter their charging behavior to provide ancillaryservices with high charging flexibility. It can be expressed asthe difference between the actual charging time ∆Tch and the
Fig. 2: Average charging power and average flexibility in EV charging demand on weekdays and weekend days in the studiedLV grid for the four scenarios introduced in section IV-A.
connection time to the charging station ∆Tcon, as introducedin [4]:
∆Tflex,n = ∆Tcon,n −∆Tch,n. (4)
Table III and the colors in Figure 2 indicate that chargingflexibility is generally high. In all considered scenarios, at least27% of charging can be delayed with 6 hours or more, at least11% of charging can be delayed with 12 hours or more, whileonly up to 12% of charging can be delayed with maximumone hour. EVs parking overnight cause that charging flexibilityis highest during the charging demand peak in the evening.Flexibility in charging demand increases with a higher shareof shared EVs in the car fleet. Since car sharing companiesmust guarantee availability of EVs to their customers, therewill always be a slight overcapacity of EVs. This results ina high connection time of shared EVs in different cases (seeSection III) leading to higher charging flexibility.
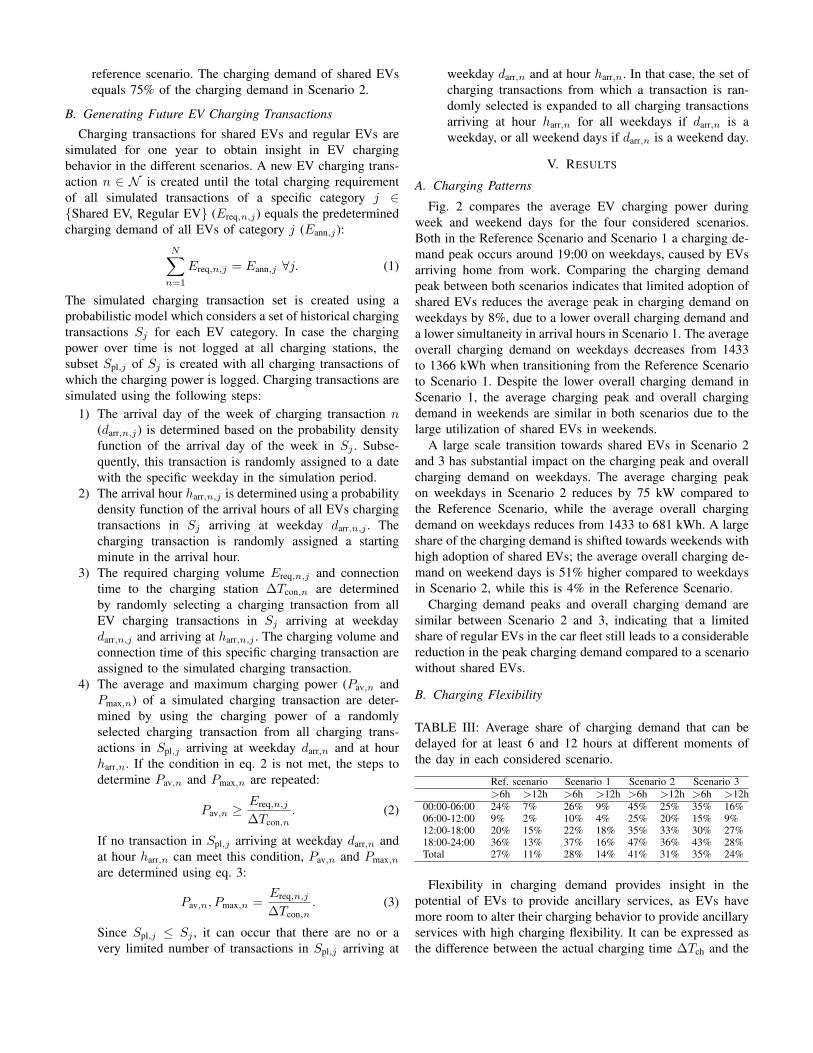
C. Grid Impact
Fig. 3 presents the transformer load in the investigatedgrid for each considered scenario. The grid load exceedsthe transformer capacity for more than 2.5% of the year inall scenarios. Transformer congestion levels decrease withhigher adoption of shared EVs, as this reduces the overallcharging demand in the grid. The difference in transformercongestion levels is minor between the Reference Scenarioand Scenario 1 (476 versus 446 hours/year). Large scaleadoption of shared EVs can reduce the number of hours withtransformer congestion with over 50%, with 235 hours/yearof transformer congestion in Scenario 2 and 248 hours/year inScenario 3.
0 1000 2000 3000 4000 5000 6000 7000 8000Hour of year
0
100
200
300
400
500
600
Grid
load
[kW
]
Reference scenarioScenario 1Scenario 2
Scenario 3Grid capacity
0 100 200 300 400 500400
450
500
550
600
650
Fig. 3: Load duration curve of transformer load in the inves-tigated grid for the four considered scenarios.
VI. DISCUSSION
This study presented a generic method to use historicalcharging transactions to get insight in the future chargingpatterns of shared EVs. However, different methodologicalconsiderations should be taken into account when interpretingthe results. With higher adoption of car sharing, the utilizationof shared EVs could increase and different user groups couldadopt shared EVs, potentially leading to different arrival timesor to lower connection times. On the other hand, one canexpect that there will always be an overcapacity in the numberof shared EVs to guarantee availability of shared EVs to users,causing that flexibility values will remain similar in the future.
As there is uncertainty about the departure times of EVs inabsence of perfect foresight and not all EV users will allowtheir EV to be used for the provision of ancillary services, thereported flexibility values will be lower in practice. SharedEVs can only be used through a reservation system, causingthat the departure time of a shared EV is more predictable andthat a larger share of the charging flexibility of shared EVs canbe used for the provision of ancillary services.
Future developments, including increased charging at fast-charging stations or a transition towards autonomous transportor hydrogen vehicles, could reduce the overall charging de-mand in LV grids, lowering grid congestion levels. Similarly,these congestion levels are affected by different externalfactors, including the installed PV capacity and the integrationof HPs in the grid.
An implication of this analysis is that DSOs can considerlower charging demand peaks in grids with a considerableshare of shared EVs in the local car fleet. The high chargingflexibility of shared EVs shows that grid operators and marketparties should target shared EVs for the provision of ancillaryservices or for participation in electricity markets.
VII. CONCLUSIONS AND FUTURE RESEARCH
This study compared the charging behavior of EVs in astation-based car sharing scheme with the charging behaviorof regular EVs to get insight in the future grid impact of EVcharging with a transition towards car sharing. Results of thestudy indicated that adoption of shared EVs leads to lowerEV charging peaks, since shared EVs show less simultaneityin arrival hours than regular EVs. The charging demand peakon week days decreases with 8% with limited adoption ofshared EVs compared to a scenario without shared EVs, whilethe charging demand peak decreases with over 50% withhigh adoption of shared EVs. Consequentially, the number ofhours with grid congestion decreases substantially with higheradoption of shared EVs. The potential of EVs to provideancillary services is substantially higher with high adoptionof shared EVs, in particular during the day, causing that atransition to shared EVs provides grid operators with moreflexibility resources for the provision of ancillary services.
Future research could use more sophisticated models (e.g.,activity-based models) to get more realistic insight in theutilization of shared EVs by new user groups. This allowsfor more detailed analyses in the charging behavior and gridimpact of shared EVs with high adoption of car sharing. To beable to quantify the potential of shared EVs to provide ancil-lary services, charging optimization models for the provisionof ancillary services should be applied to transaction data ofshared EVs in future research.
REFERENCES
[1] IEA, “Global EV Outlook 2019,” Tech. Rep., 2019.[2] Netherlands Enterprise Agency (RVO), “Statistics Electric Vehicles in
the Netherlands (upto June 2019),” Tech. Rep. July, 2019.[3] E. Ucer, M. C. Kisacikoglu, and A. Cafer Gurbuz, “Learning EV
Integration Impact on a Low Voltage Distribution Grid,” IEEE Powerand Energy Society General Meeting, vol. 2018-Augus, pp. 1–5, 2018.
[4] M. K. Gerritsma, T. A. AlSkaif, H. A. Fidder, and W. G. van Sark,“Flexibility of Electric Vehicle Demand: Analysis of Measured ChargingData and Simulation for the Future,” World Electric Vehicle Journal,vol. 10, no. 1, p. 14, 2019.
[5] S. Habib, M. Kamran, and U. Rashid, “Impact analysis of vehicle-to-gridtechnology and charging strategies of electric vehicles on distributionnetworks - A review,” 2015.
[6] N. Brinkel, W. Schram, T. AlSkaif, I. Lampropoulos, and W. van Sark,“Should we reinforce the grid? Cost and emission optimization ofelectric vehicle charging under different transformer limits,” AppliedEnergy, vol. 276, no. October, p. 115285, 2020.
[7] M. Raoofat, M. Saad, S. Lefebvre, D. Asber, H. Mehrjedri, andL. Lenoir, “Wind power smoothing using demand response of electricvehicles,” International Journal of Electrical Power and Energy Systems,2018.
[8] N. Brinkel, M. Gerritsma, T. AlSkaif, I. Lampropoulos, A. van Voorden,H. Fidder, and W. van Sark, “Impact of rapid PV fluctuations on powerquality in the low-voltage grid and mitigation strategies using electricvehicles,” International Journal of Electrical Power & Energy Systems,vol. 118, 2020.
[9] K. Frenken, “Political economies and environmental futures for thesharing economy,” Philosophical Transactions of the Royal Society A:Mathematical, Physical and Engineering Sciences, vol. 375, no. 2095,2017.
[10] D. Wosskow, “Unlocking the sharing economy: An independent review,”2014, no. November, p. 43.
[11] S. A. Shaheen, N. D. Chan, and H. Micheaux, “One-way carsharing’sevolution and operator perspectives from the Americas,” Transportation,vol. 42, no. 3, pp. 519–536, 2015.
[12] S. Shaheen, A. Cohen, and M. Jaffee, “InnovativeMobility: Carsharing Outlook,” Tech. Rep., 2018. [Online].Available: http://innovativemobility.org/?project=innovative-mobility-carsharing-outlook-spring-2018
[13] F. Liao, E. Molin, H. Timmermans, and B. van Wee, Carsharing: theimpact of system characteristics on its potential to replace private cartrips and reduce car ownership. Springer US, 2018, vol. 47, no. 2.
[14] M. Namazu, D. MacKenzie, H. Zerriffi, and H. Dowlatabadi, “Is carshar-ing for everyone? Understanding the diffusion of carsharing services,”Transport Policy, vol. 63, no. January, pp. 189–199, 2018.
[15] F. Zhou, Z. Zheng, J. Whitehead, R. Perrons, L. Page, and S. Washing-ton, “Projected prevalence of car-sharing in four Asian-Pacific countriesin 2030: What the experts think,” Transportation Research Part C:Emerging Technologies, vol. 84, pp. 158–177, 2017.
[16] S. A. Shaheen and A. P. Cohen, “Carsharing and Personal VehicleServices: Worldwide Market Developments and Emerging Trends,”International Journal of Sustainable Transportation, vol. 7, no. 1, pp.5–34, 2012.
[17] L. M. Martı́nez, G. H. d. A. Correia, F. Moura, and M. MendesLopes, “Insights into carsharing demand dynamics: Outputs of an agent-based model application to Lisbon, Portugal,” International Journal ofSustainable Transportation, vol. 11, no. 2, pp. 148–159, 2017.
[18] S. Le Vine, M. Lee-Gosselin, A. Sivakumar, and J. Polak, “A newapproach to predict the market and impacts of round-trip and point-to-point carsharing systems: Case study of London,” TransportationResearch Part D: Transport and Environment, vol. 32, pp. 218–229,2014.
[19] L. Rotaris and R. Danielis, “The role for carsharing in medium to small-sized towns and in less-densely populated rural areas,” TransportationResearch Part A: Policy and Practice, vol. 115, no. August 2017, pp. 49–62, 2018. [Online]. Available: https://doi.org/10.1016/j.tra.2017.07.006
[20] Municipality of Utrecht, “Omgevingsvisie Merwedekanaalzone,”Tech. Rep. december, 2018. [Online]. Available:https://www.utrecht.nl/fileadmin/uploads/documenten/bestuur-en-organisatie/beleid/omgevingsvisie/ deelgebied Merwedekanaalzone/2018-03-MWKZ-Omgevingsvisie–deel-1-ruimtelijke-agenda 01.pdf
[21] CBS Statline, “Verkeersprestaties personenauto’s; kilometers, brandstof-soort, grondgebied,” 2019. [Online]. Available: https://www.cbs.nl/nl-nl/cijfers/detail/80428ned
[22] CBS Statline, “Kerncijfers buurten en wijken 2017,” 2017. [On-line]. Available: https://www.cbs.nl/nl-nl/maatwerk/2017/31/kerncijfers-wijken-en-buurten-2017
[23] H. Nijland and J. van Meerkerk, “Mobility and environmental impacts ofcar sharing in the Netherlands,” Environmental Innovation and SocietalTransitions, vol. 23, pp. 84–91, 2017.
View publication statsView publication stats
Related Documents