The Impact of the CIMMYT Wheat Breeding Program on Mexican Wheat Producers and Consumers: An Economic Welfare Analysis Andrew P. Barkley Department of Agricultural Economics Kansas State University Manhattan, Kansas 66502 [email protected] Lawton L. Nalley 1 Assistant Professor Department of Agricultural Economics and Agribusiness University of Arkansas John Crespi Associate Professor Department of Agricultural Economics Kansas State University 1 Portions of this research was conducted while Lawton Nalley was an intern at the International Maize and Wheat Improvement Center (CIMMYT) in Mexico City, Mexico.

Welcome message from author
This document is posted to help you gain knowledge. Please leave a comment to let me know what you think about it! Share it to your friends and learn new things together.
Transcript
The Impact of the CIMMYT Wheat Breeding Program on Mexican Wheat
Producers and Consumers: An Economic Welfare Analysis
Andrew P. Barkley
Department of Agricultural Economics
Kansas State University
Manhattan, Kansas 66502
Lawton L. Nalley1
Assistant Professor
Department of Agricultural Economics and Agribusiness
University of Arkansas
John Crespi
Associate Professor
Department of Agricultural Economics
Kansas State University
1 Portions of this research was conducted while Lawton Nalley was an intern at the International Maize and Wheat
Improvement Center (CIMMYT) in Mexico City, Mexico.
The Impact of the CIMMYT Wheat Breeding Program on Mexican Wheat
Producers and Consumers: An Economic Welfare Analysis
Barkley, A., L. Nalley, and J. Crespi.
Abstract
The increase in wheat production in Mexico’s Yaqui Valley from the breeding and development
of semidwarf wheat varieties released by CIMMYT is quantified for the period 1990 to 2002, and
the costs and benefits of the wheat research program are estimated and evaluated using a two-
region model of the world wheat market. The economic rate of return of the wheat breeding
program is calculated, and policy implications are derived. Estimates of the Internal Rate of
Return of the CIMMYT breeding program were 55.5 % during the 1990-2002 period, with a
benefit cost ratio of 14.99, implying that for each dollar of public funds invested in CIMMYT
wheat breeding research, over 14 dollars of benefits result.
Keywords: Public wheat breeding, benefit/cost analysis, agricultural research, wheat varieties.
1
The Impact of the CIMMYT Wheat Breeding Program on Mexican Wheat
Producers and Consumers: An Economic Welfare Analysis
CIMMYT research in wheat breeding has resulted in higher yields for global wheat
producers over the past several decades.1 The sources of this research investment include federal
governments, non profit organization, and grants from organizations such as the Gates
Foundation. This study addressed the question, what are the economic impacts of this research
effort? Specifically, empirical evidence was used to determine whether the public investment in
CIMMYT wheat breeding has resulted in a socially worthwhile use of limited public funds, and
how the economic benefits of the research program are distributed across consumers and
producers in Mexico and the rest of the world. The results of this study are particularly important
in an era of declining public funds for public agricultural research (Fuglie et al., USDA
Cooperative State Research Service, 1993). CIMMYT, a public breeder, has experienced a
substantial decrease in funding from roughly 12 million (2002) USD in 1990 to approximately 6
million USD in 2002. Careful measurement of the economic rate of return of the investment in
wheat breeding research provides crucial information to administrators and policy makers, whose
decisions on the allocation of research funding will determine the future size and scope of
publicly funded agricultural research.
1The Centro Internacional de Mejoramiento de Maíz y Trigo (CIMMYT) is a nonprofit maize and wheat breeding
research center based in El Batan, Mexico. CIMMYT was created to establish international networks to improve
wheat and maize varieties in low-income countries.
The contribution of wheat research was measured by quantifying the increase in yields
attributable to genetic enhancements in wheat from the CIMMYT wheat breeding research
program for the period 1990 to 2002. Yield gains were measured for all semidwarf varieties
2
tested by CIMMYT in their main experiment station in Mexico’s Yaqui Valley. This increase in
yield represents an increase in the supply of wheat produced in Mexico, and is the foundation of
the economic impacts of the wheat breeding program.
An economic model of the world wheat market was developed and used to measure the
impact of the CIMMYT wheat breeding program on: (1) Mexican wheat producers; (2) Mexican
consumers of wheat (flour millers); (3) wheat producers outside of Mexico, including significant
foreign producers such as the United States (USA), European Union (EU), Canada, Argentina
and Australia; and (4) all wheat consumers outside of Mexico, including major wheat importers
such as China and Japan. Annual benefits to each group resulting from the increased wheat
yields were measured and analyzed. Several measures of the outcome of the investment in wheat
breeding were calculated and assessed.
Funding of CIMMYT Wheat Breeding Research
CIMMYT, a non-profit organization, distributes improved germplasm to national
agricultural research systems (NARS) for worldwide utilization. CIMMYT, through the release
of modern wheat varieties, has generated substantial increases in grain yields, improved grain
quality, reduced yield variability, and reduced environmental degradation in low-income
countries since the Green Revolution. On average, 65–77% of these crossed samples were sent to
developing countries. CIMMYT germplasm is present in roughly 24% of all wheat types using
the cross rule, 38% using the cross or parent rule, 64% using the any ancestor rule, and
approximately 80% of the total spring wheat area in developing countries (Lantican et al. 2005).2
2The term “CIMMYT cross” refers to a cross made at CIMMYT and the selections to obtain fixed lines that were
either made at CIMMYT or by a non-CIMMYT breeding program. The term “CIMMYT parent” refers to a cross
3
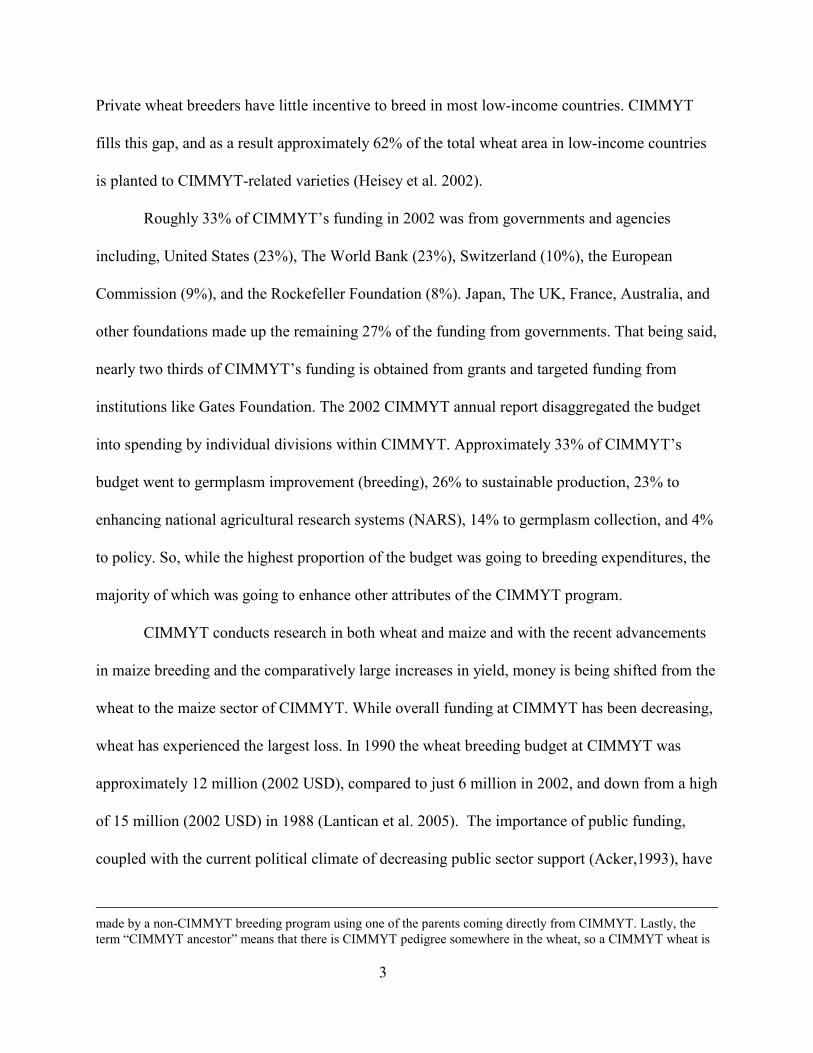
Private wheat breeders have little incentive to breed in most low-income countries. CIMMYT
fills this gap, and as a result approximately 62% of the total wheat area in low-income countries
is planted to CIMMYT-related varieties (Heisey et al. 2002).
Roughly 33% of CIMMYT’s funding in 2002 was from governments and agencies
including, United States (23%), The World Bank (23%), Switzerland (10%), the European
Commission (9%), and the Rockefeller Foundation (8%). Japan, The UK, France, Australia, and
other foundations made up the remaining 27% of the funding from governments. That being said,
nearly two thirds of CIMMYT’s funding is obtained from grants and targeted funding from
institutions like Gates Foundation. The 2002 CIMMYT annual report disaggregated the budget
into spending by individual divisions within CIMMYT. Approximately 33% of CIMMYT’s
budget went to germplasm improvement (breeding), 26% to sustainable production, 23% to
enhancing national agricultural research systems (NARS), 14% to germplasm collection, and 4%
to policy. So, while the highest proportion of the budget was going to breeding expenditures, the
majority of which was going to enhance other attributes of the CIMMYT program.
CIMMYT conducts research in both wheat and maize and with the recent advancements
in maize breeding and the comparatively large increases in yield, money is being shifted from the
wheat to the maize sector of CIMMYT. While overall funding at CIMMYT has been decreasing,
wheat has experienced the largest loss. In 1990 the wheat breeding budget at CIMMYT was
approximately 12 million (2002 USD), compared to just 6 million in 2002, and down from a high
of 15 million (2002 USD) in 1988 (Lantican et al. 2005). The importance of public funding,
coupled with the current political climate of decreasing public sector support (Acker,1993), have
made by a non-CIMMYT breeding program using one of the parents coming directly from CIMMYT. Lastly, the
term “CIMMYT ancestor” means that there is CIMMYT pedigree somewhere in the wheat, so a CIMMYT wheat is
4
resulted in a situation where continuation of public funding for the wheat-breeding research
program is dependent on how well the program is serving the public. Empirical evidence on the
economic consequences of the breeding program provides evaluation of the program, as well as
assessment of the likely consequences of changes in the level of funding of public wheat
breeding at CIMMYT.
Measurement of the Social Benefits of CIMMYT Wheat Breeding
The methodology used to calculate the economic consequences of the CIMMYT wheat-
breeding program follows a rich literature in the welfare economics of agricultural research
initiated by Schultz (1953) and further developed by Ayer and Schuh (1972) and Akino and
Hayami (1975). More recently, the economic evaluation of agricultural research has been
summarized by Huffman and Evenson (1993) and Alston et al. (1995).
not used directly in the cross, but was used in developing one of the parents.
The first step in evaluating the economic impact of the CIMMYT wheat breeding
program was to measure the increase in yields from the genetic improvement of wheat, holding
all other production parameters constant. Gains in wheat yield can be attributed to two factors:
genetic and agronomic. Agronomic gains are attributed to improvements in fertilizer, pesticides,
fungicides or other factors that are not embodied within the seed. Genetic gains are associated
with improved wheat breeding, or technology that is embodied within the seed. This study will
focus on the estimation of genetic gains attributed to CIMMYT. This was accomplished by
applying the methodology of Traxler et al. to calculate the relative yields for each variety with
data from CIMMYT wheat variety performance tests in Mexico’s Yaqui Valley experiment
station from 1990-2002. A total of 33 lines were analyzed with release years ranging from 1962-

5
2001, including the variety Siete Cerros, the most popular semidwarf wheat of the Green
Revolution. Thus, the test period for this data set is 1990-2002 but includes lines released prior
to 1990. Using relative yield performance data from nurseries implicitly assumes that actual
producer yields are equivalent to test plot yields in CIMMYT experiments. Although the
absolute level of producer yields may be overstated by experimental yield data, the relative
yields between varieties are likely to be similar in both experimental and producer fields.
Brennan (1984) reported, “The only reliable sources of relative yields are variety trials” (p. 182).
The present study follows previous evaluations of wheat breeding programs conducted by
Traxler et al. (1995) who analyzed ten wheat lines released in Mexico from 1950-1985. Their
goal was to analyze if CIMMYT released lines had progressively increased yield, improved yield
stability, or both over time. Traxler et al. implemented a Just and Pope (1979) production
function which estimates both output and output variance. The Just and Pope production function
was chosen due to its ability to account for multiplicative heteroscedasticity. The multiplicative
heteroscedastic correction is of importance to this data set because of the variations in both the
species (durum, bread wheat, and triticale) and breeding goals across CIMMYT wheat varieties.3
That is, since CIMMYT varieties are intended to be sown worldwide and are specifically bred for
different climatic, physical, and agronomic conditions, the error terms across varieties may be
heteroscedastic in nature. By accounting for this multiplicative heteroscedastic error term,
comparisons across varieties are more statistically appropriate.
The Just and Pope production function can be described as such:
(1) iiii gfY εαβ ),(),( XX +=
3The goals for breeding a specific wheat variety vary and can target a specific certain climatic conditions (drought
tolerance, heat stress, etc.) or target a specific physical attribute ( increased biomass, increased straw, etc.).
6
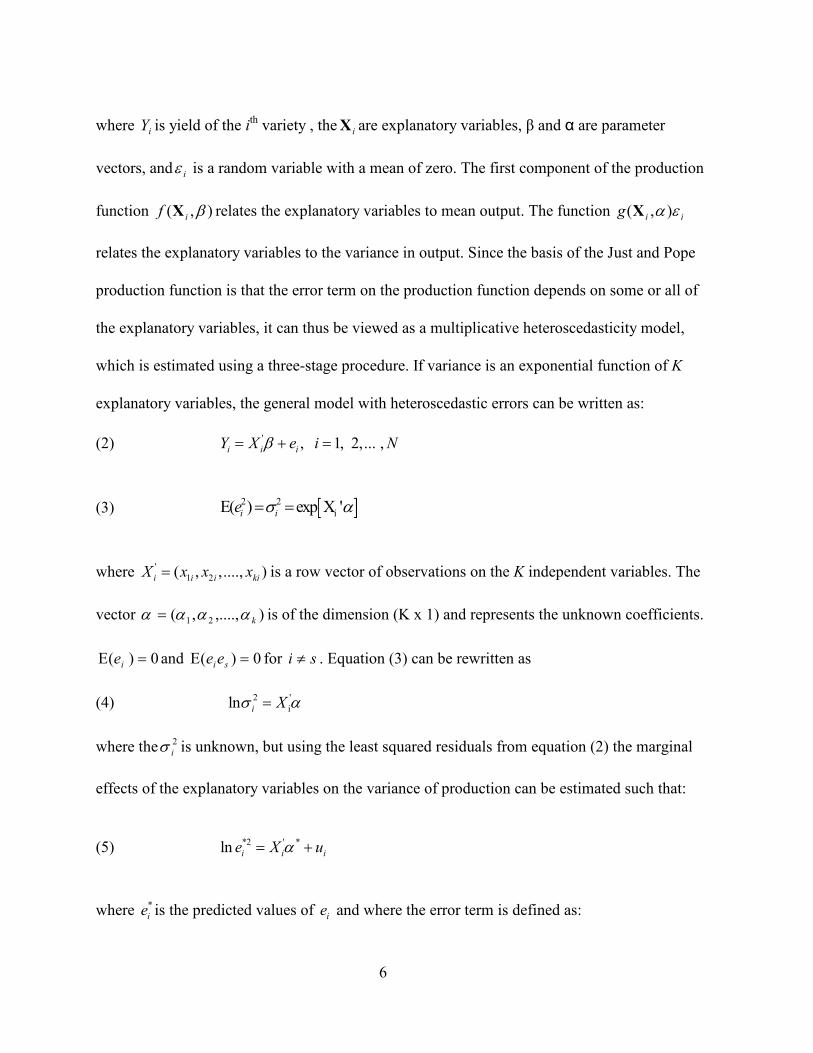
where iY is yield of the ith variety , the iX are explanatory variables, β and α are parameter
vectors, and iε is a random variable with a mean of zero. The first component of the production
function ),( βif X relates the explanatory variables to mean output. The function iig εα ),(X
relates the explanatory variables to the variance in output. Since the basis of the Just and Pope
production function is that the error term on the production function depends on some or all of
the explanatory variables, it can thus be viewed as a multiplicative heteroscedasticity model,
which is estimated using a three-stage procedure. If variance is an exponential function of K
explanatory variables, the general model with heteroscedastic errors can be written as:
(2) ' , 1, 2,... ,i i iY X e i Nβ= + =
(3) [ ]2 2
iE( ) exp X 'i ie σ α= =
where '
1 2( , ,...., )i i i kiX x x x= is a row vector of observations on the K independent variables. The
vector α ),....,,( 21 kααα= is of the dimension (K x 1) and represents the unknown coefficients.
0)(E =ie and 0)(E =siee for si ≠ . Equation (3) can be rewritten as
(4) 2 '
iln i Xσ α=
where the 2
iσ is unknown, but using the least squared residuals from equation (2) the marginal
effects of the explanatory variables on the variance of production can be estimated such that:
(5) *2 ' *ln i i ie X uα= +
where *
ie is the predicted values of ie and where the error term is defined as:

7
(6) *2
2ln i
i
i
eu
σ
=
.
The predicted values from equation (5) are used as weights for generating generalized least
squares (GLS) estimators for the mean output equation (2). That is, the estimates from equation
(5) can be viewed as the effects of the independent variables on yield variability. The predicted
values from equation (5) are then used as weights when re-estimating equation (2). The results
from the re-estimation of equation (2) with the weights from equation (5), give the effects of the
independent variables on yield.
In the Just and Pope production function the yield mean was specified as a function of the
release year of each variety tested, which can be interpreted as the “vintage” of the wheat
breeding technology (Traxler et al. 1995). The year each variety was released to the public
captures the progression of wheat breeding technology across time, forming the main variable for
measurement and analysis of the impact of the CIMMYT wheat breeding program on wheat
yields in performance fields. That is, the coefficient on release year represents the average
increase in yield due to genetic gains attributable to the CIMMYT wheat breeding program.
Release year is not a time trend variable but is modeled similar to the way that Arrow’s
(1962) growth model denoted embodied technology (Traxler et al. 1995). Arrow (1962) assigned
“serial numbers” of ordinal magnitude to the embodied technology in capital. In the Just and
Pope model the variable the release year, represents the embodied technology for a given year of
release by the CIMMYT breeding program. Therefore, the coefficient on release year possesses
both a cardinal and ordinal significance in defining the spacing as well as the sequencing of
releases (Traxler et al. 1995).
Just and Pope regression results were taken from Nalley et al. (2007) who used the same

8
data set to determine the annual genetic improvements attributed to CIMMYT. The shift in wheat
production (Jt), which is equivalent to the coefficient on release year in the Just and Pope model,
is the foundation for the analysis of the economic impacts of wheat breeding research.
An important aspect of a breeding program is its cumulative benefits over a specific
period. That is, the genetic enhancement received in time period t are those observed in t plus
those seen in t-1 as well. Therefore in this data set, the additional genetic benefits for 2002 (J2002)
would be the genetic gain from 2001 to 2002 plus the genetic gain from 1990 to 2001 1990
2001
(J )tJ∑.
Thus the shift in wheat production in 2002 would be a cumulative shift from 1990 to 2002.
Previous work by Echeverria et al. (1989) also used experimental yields to measure
research-induced industry supply curve shifts for rice in Uruguay. Alston et al. (1995)
demonstrated how to convert an annual shift in the quantity of wheat produced (Jt) into a
percentage shift in cost savings (Kt): the formula is Kt = Jt/ε, where ε is the elasticity of supply of
wheat (page 339).
A global analysis for total acres planted to CIMMYT varieties is possible since CIMMYT
publishes rough estimates on regional acres planted to CIMMYT varieties. A “precise” measure
of the benefits of the CIMMYT breeding program would include all global acres planted to
CIMMYT lines. CIMMYT’s regional acreage groupings (North Africa, West Asia, etc.) tend to
be rough estimates for areas and in most instances are not disaggregated on a county level,
making a precise international trade model difficult to implement. Because of this, the current
study will only analyze the effects of CIMMYT varieties planted in the Yaqui Valley of Mexico
rather than global acres planted to CIMMYT varieties. The reason for this is because of the
precision of the data collected within the Yaqui Valley (varieties planted, hectares planted,

9
hectares harvested, hectares planted to CIMMYT varieties, yield, etc.) and the unreliability of the
data from outside the Valley.
Since CIMMYT has their principal experiment station in the Yaqui Valley it has a solid
working relationship with the local farmers who are willing to exchange information regarding
their yields, varieties planted, etc. for modern varieties of wheat bred by CIMMYT. CIMMYT
varieties are planted outside of the Yaqui Valley in Mexico as well; however the data for other
regions of Mexico is much less reliable. So, this study only includes CIMMYT varieties planted
in the Yaqui Valley and excludes non-CIMMYT varieties planted within the Yaqui Valley as
well as CIMMYT varieties in other regions of Mexico. In that sense, this study would represent a
conservative estimate of the effects of the CIMMYT breeding program on Mexican farmers and
consumers because of the exclusion of CIMMYT varieties planted in other regions of Mexico.
Since the Yaqui Valley only accounts for approximately 15-20% of the wheat produced in
Mexico and not all of the wheat varieties planted in the Valley are of CIMMYT germplasm,
approximately 65-80% are of CIMMYT germplasm, the effects of the CIMMYT breeding
program on increasing Mexican yield “(Jt)” needs to be adjusted (CIMMYT, 2007). Therefore,
equation (7) is calculated to accurately account for the effects of the CIMMYT breeding program
on the Mexican supply curve. This new (Jt') is equal to
(7) Jt' = Jt * Θt* ψt
where (Jt) is the shift in wheat production associated with the use of CIMMYT varieties in
percent increase in yield annually.4 Θt is the percentage of Mexico’s wheat production that takes
place in the Yaqui Valley, and ψt is the percentage of the wheat in the Yaqui Valley that is
4The Nalley et al. (2007) Just and Pope production results indicated that CIMMYT contributed approximately a

10
planted to CIMMYT varieties. This new Jt' represents the Mexican shift in wheat supply based
solely on increased yields in the Yaqui Valley attributed to CIMMYT’s breeding program. From
here forward when the model refers to Mexican producers, losses will be experienced by all
producers in Mexico, gains however will only be experienced by those farmers who adopted
CIMMYT varieties within the Yaqui Valley.
An Economic Model of the Impacts of CIMMYT Wheat-Breeding Research
Edwards and Freebairn (1984) pioneered an economic model to measure the impact of
productivity gains from research into a tradable commodity such as wheat. The model was
applied to Australian wool research by Alston and Mullen (1992). This simple two-country
model of supply and demand is adopted here to estimate the impact of the research-induced
supply shift on producer and consumer surpluses in (A) Mexico, and (B) the rest of the world
(ROW, defined as all areas outside of Mexico). Alston et al. (1995) reported explicit formulas
for the calculation of changes in economic surplus to producers and consumers in two countries,
and their model is modified below to the case of CIMMYT wheat research. The supply (Qs) and
demand (Qd) of wheat in Mexico (denoted by subscript M) and the ROW (denoted by subscript
R) are assumed to be linear functions of the world price of wheat (P), as modeled in equations (8)
through (12), where k is the percentage downward shift in supply (k = KP, where K is the percent
shift in cost savings, Jt/ε, where ε is the elasticity of supply of wheat). Time subscripts have been
omitted for notational simplicity.
0.18% increase in yield annually from 1990-2002 to the Yaqui Valley (Jt = 0.0018).
(8) QsM = αM + βM(P + k)
(9) QdM = γM+ δMP
11
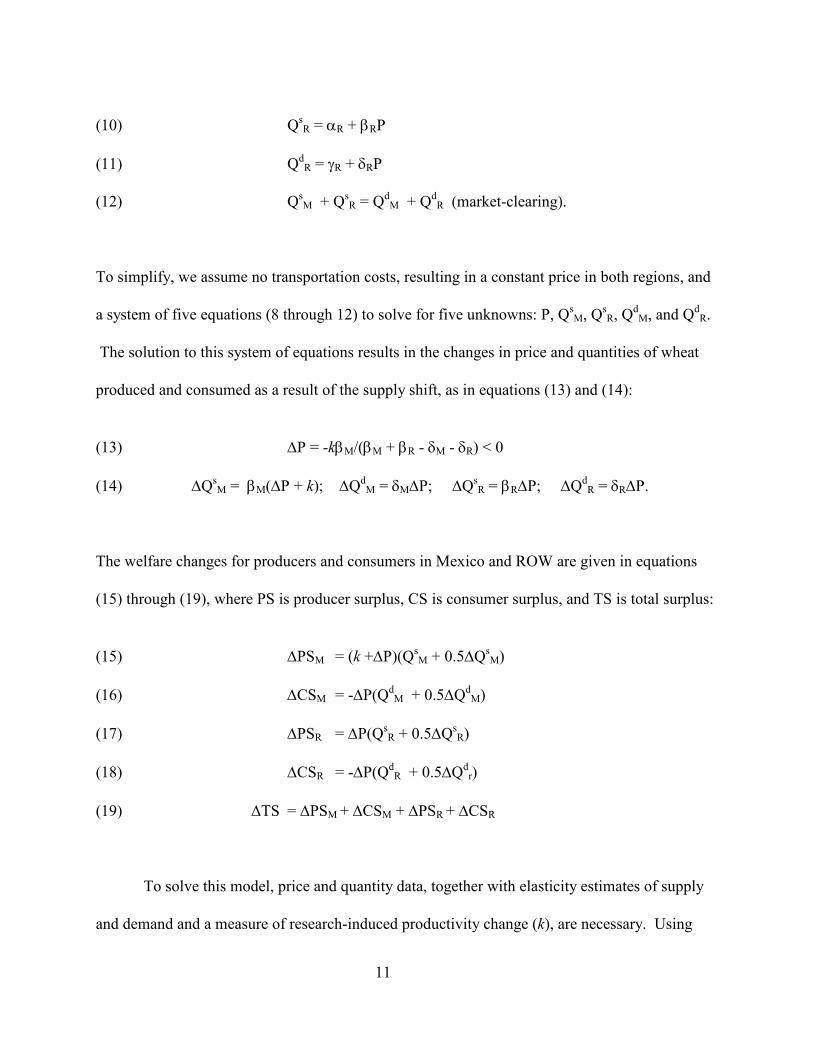
(10) QsR = αR + βRP
(11) QdR = γR + δRP
(12) QsM + Q
sR = Q
dM + Q
dR (market-clearing).
To simplify, we assume no transportation costs, resulting in a constant price in both regions, and
a system of five equations (8 through 12) to solve for five unknowns: P, QsM, Q
sR, Q
dM, and Q
dR.
The solution to this system of equations results in the changes in price and quantities of wheat
produced and consumed as a result of the supply shift, as in equations (13) and (14):
(13) ∆P = -kβM/(βM + βR - δM - δR) < 0
(14) ∆QsM = βM(∆P + k); ∆Q
dM = δM∆P; ∆Q
sR = βR∆P; ∆Q
dR = δR∆P.
The welfare changes for producers and consumers in Mexico and ROW are given in equations
(15) through (19), where PS is producer surplus, CS is consumer surplus, and TS is total surplus:
(15) ∆PSM = (k +∆P)(QsM + 0.5∆Q
sM)
(16) ∆CSM = -∆P(QdM + 0.5∆Q
dM)
(17) ∆PSR = ∆P(QsR + 0.5∆Q
sR)
(18) ∆CSR = -∆P(QdR + 0.5∆Q
dr)
(19) ∆TS = ∆PSM + ∆CSM + ∆PSR + ∆CSR
To solve this model, price and quantity data, together with elasticity estimates of supply
and demand and a measure of research-induced productivity change (k), are necessary. Using
12
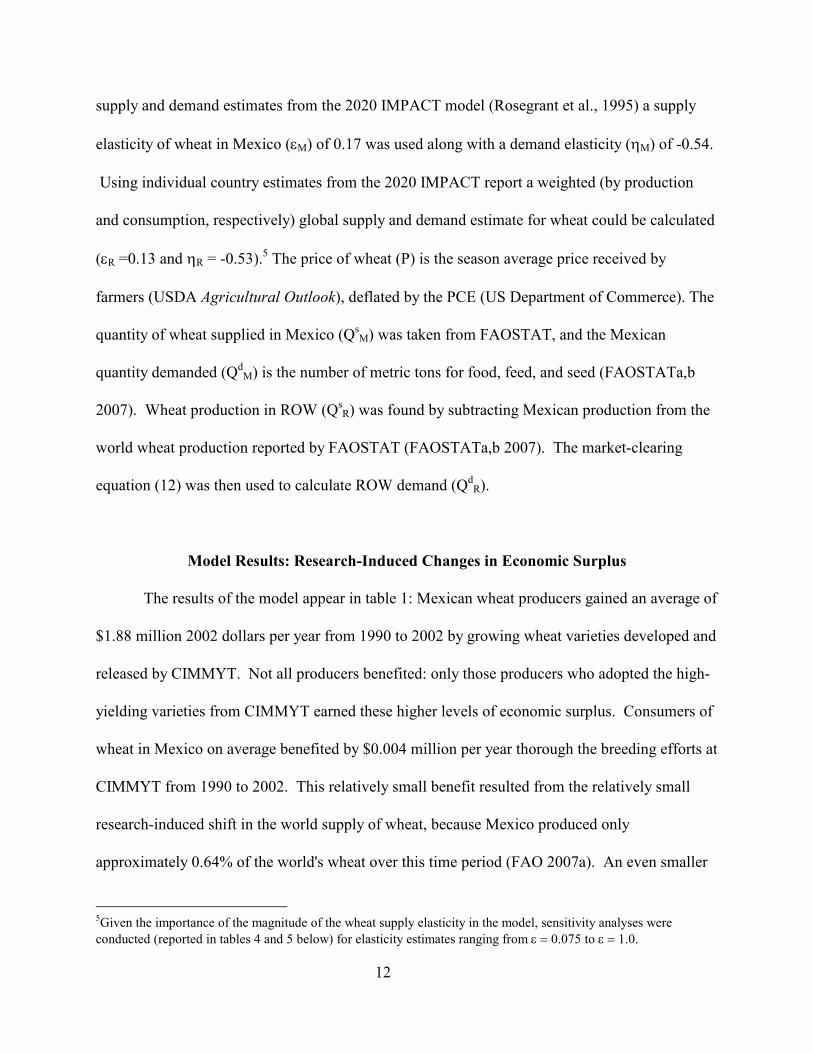
supply and demand estimates from the 2020 IMPACT model (Rosegrant et al., 1995) a supply
elasticity of wheat in Mexico (εM) of 0.17 was used along with a demand elasticity (ηM) of -0.54.
Using individual country estimates from the 2020 IMPACT report a weighted (by production
and consumption, respectively) global supply and demand estimate for wheat could be calculated
(εR =0.13 and ηR = -0.53).5 The price of wheat (P) is the season average price received by
farmers (USDA Agricultural Outlook), deflated by the PCE (US Department of Commerce). The
quantity of wheat supplied in Mexico (QsM) was taken from FAOSTAT, and the Mexican
quantity demanded (QdM) is the number of metric tons for food, feed, and seed (FAOSTATa,b
2007). Wheat production in ROW (QsR) was found by subtracting Mexican production from the
world wheat production reported by FAOSTAT (FAOSTATa,b 2007). The market-clearing
equation (12) was then used to calculate ROW demand (QdR).
Model Results: Research-Induced Changes in Economic Surplus
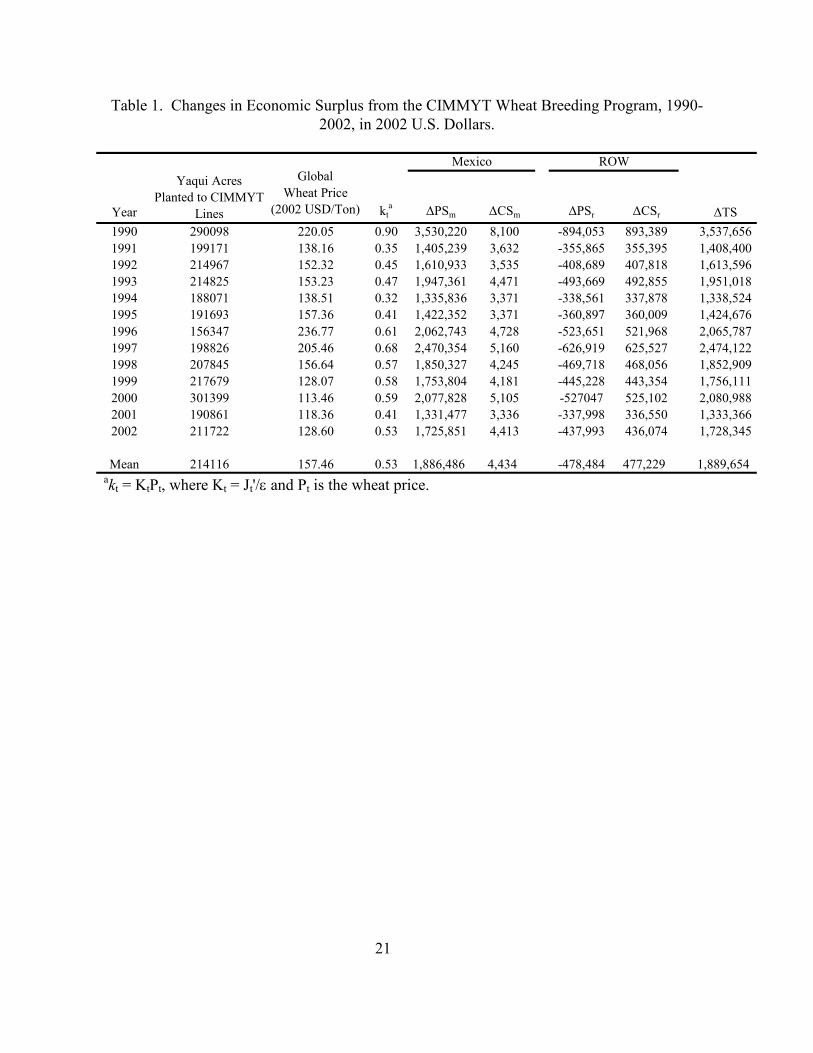
The results of the model appear in table 1: Mexican wheat producers gained an average of
$1.88 million 2002 dollars per year from 1990 to 2002 by growing wheat varieties developed and
released by CIMMYT. Not all producers benefited: only those producers who adopted the high-
yielding varieties from CIMMYT earned these higher levels of economic surplus. Consumers of
wheat in Mexico on average benefited by $0.004 million per year thorough the breeding efforts at
CIMMYT from 1990 to 2002. This relatively small benefit resulted from the relatively small
research-induced shift in the world supply of wheat, because Mexico produced only
approximately 0.64% of the world's wheat over this time period (FAO 2007a). An even smaller
5Given the importance of the magnitude of the wheat supply elasticity in the model, sensitivity analyses were
conducted (reported in tables 4 and 5 below) for elasticity estimates ranging from ε = 0.075 to ε = 1.0.

13
portion, 0.10%, of the worlds wheat is of CIMMYT germplasm and grown in the Yaqui Valley.
This fact allows for large gains for producers who adopted CIMMYT varieties in the Yaqui
Valley, with only a limited decrease in the world price of wheat.
Wheat producers who resided outside of the Yaqui Valley were made worse off by the
decrease in the price of wheat, with an average annual loss of $0.478 million (table 1). Non-
Mexican consumers benefited from the research-induced shift in the supply of wheat by an
annual average of $0.477 million. The ROW producer losses were approximately equal to the
ROW consumer gains. This outcome, together with the relatively large gains to Mexican wheat
producers and small Mexican consumer gains, resulted in an annual average change in total
economic surplus (∆TS) of $1.89 million 2002 USD (table 1). These annual benefits were large
relative to the annual average costs of the research program of approximately $10.1 million when
you account for the ratio of acres of wheat planted to CIMMYT varieties in the Yaqui Valley to
the global CIMMYT acres planted. Since CIMMYT does not disaggregate their breeding budget
into regions a simple ratio of average CIMMYT acres in the Yaqui to global acres planted to
CIMMYT crosses is calculated. From 1990 through 2002 there was an average of 56.56 million
acres planted to CIMMYT crosses worldwide compared to an average of just 0.216 million acres
of CIMMYT germplasm planted in the Yaqui Valley (Lantican et al. 2005). Thus if it is assumed
that the breeding costs are constant globally then the Yaqui Valley only accounts for 0.38% of
the total global CIMMYT breeding cost.
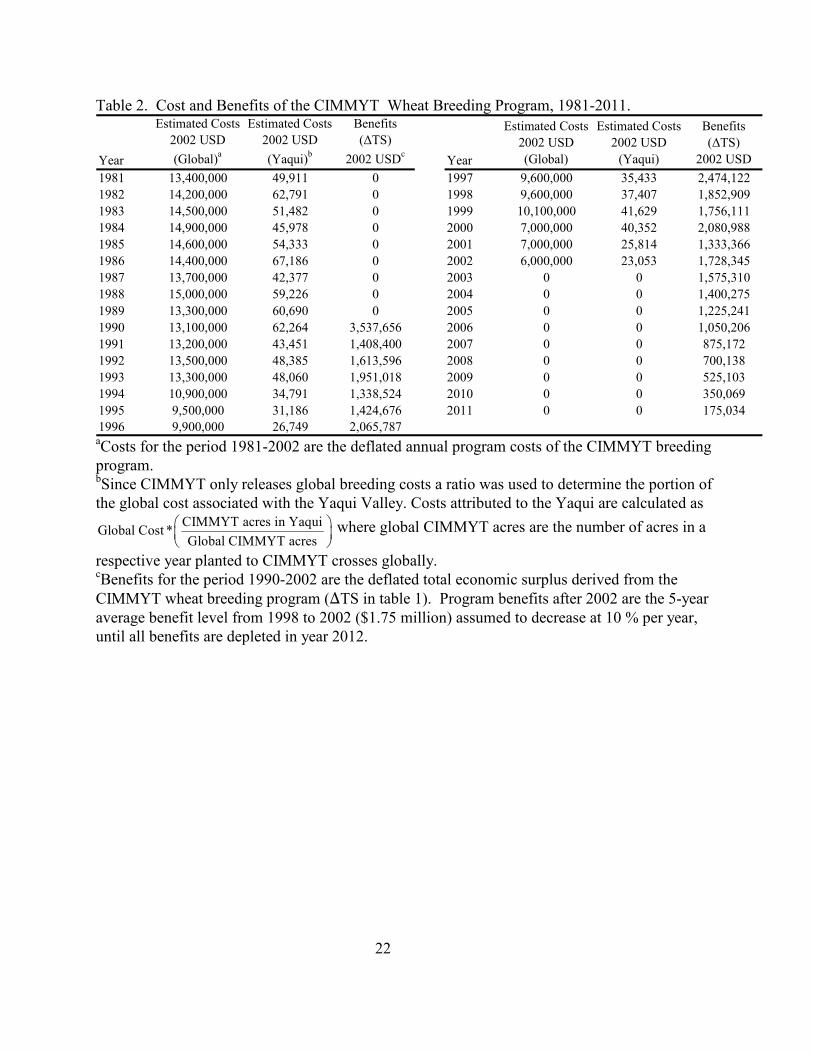
The final step in the evaluation of the impacts of the CIMMYT wheat breeding program
was to calculate the rate of return to the public investment in the genetic improvement of wheat
varieties. Proper measurement of the rate of return requires careful consideration of the timing of
varietal development and the discounting procedure. Input from CIMMYT agronomists led to

14
the assumption that 10 years are required to develop a variety from the initial variety cross to the
release date (Ammar 2006).6 Because the nature of the data set, the economic benefits of
CIMMYT semidwarf varieties began in 1990, to capture the lag between initially crossing a
variety and releasing it costs from the period of 1981 to 2002 were included in the analysis (table
2).
CIMMYT breeds for 12 specific “mega-environments” throughout the world, but does
not disaggregate their breeding budget between environments.7 Mega-environment 1, of which
the Yaqui Valley is a part, is the largest mega-environment, accounting for 18.2% of the total
world’s wheat production (Lantican et al. 2005). Since CIMMYT does not disaggregate breeding
costs into specific mega-environments, the following calculations will attribute all breeding costs
to mega-environment 1. Thus, the following cost-benefit ratios will be conservative since the
costs have been overstated.
The economic benefits (∆TS) reported in table 1 were used for the period 1990 to 2002.
After 2002, the 5-year average benefit level from 1998 to 2002 ($2.215 million) was assumed to
decrease at 10% per year, until all research program benefits are depleted in year 2011. Cost and
benefit data are reported in table 2.
6 Interviewed CIMMYT breeders stated that on average there is a 5-year breeding and testing period at CIMMYT
followed by a 3 to 4 year testing period at experiment stations within Mexico, such as the Yaqui Valley station. The
last step is a 2 year seed production stage before its release. Therefore, from initial breeding to release is estimated at
approximately 10 years. 7 Mega-environment 1 is classified as low latitude (35o N-35oS), irrigated land, temperate climate, with the major
constraints being rust and lodging. It consists of 35% of the wheat production in South and East Asia, 33% in West
Asia and North Africa, 28% in South and East Asia, and 7% in Latin America. It accounts for 42.9% of the worlds
total durum wheat acres and 16.5% of its total bread wheat acres (Lantican et al. 2005)

15
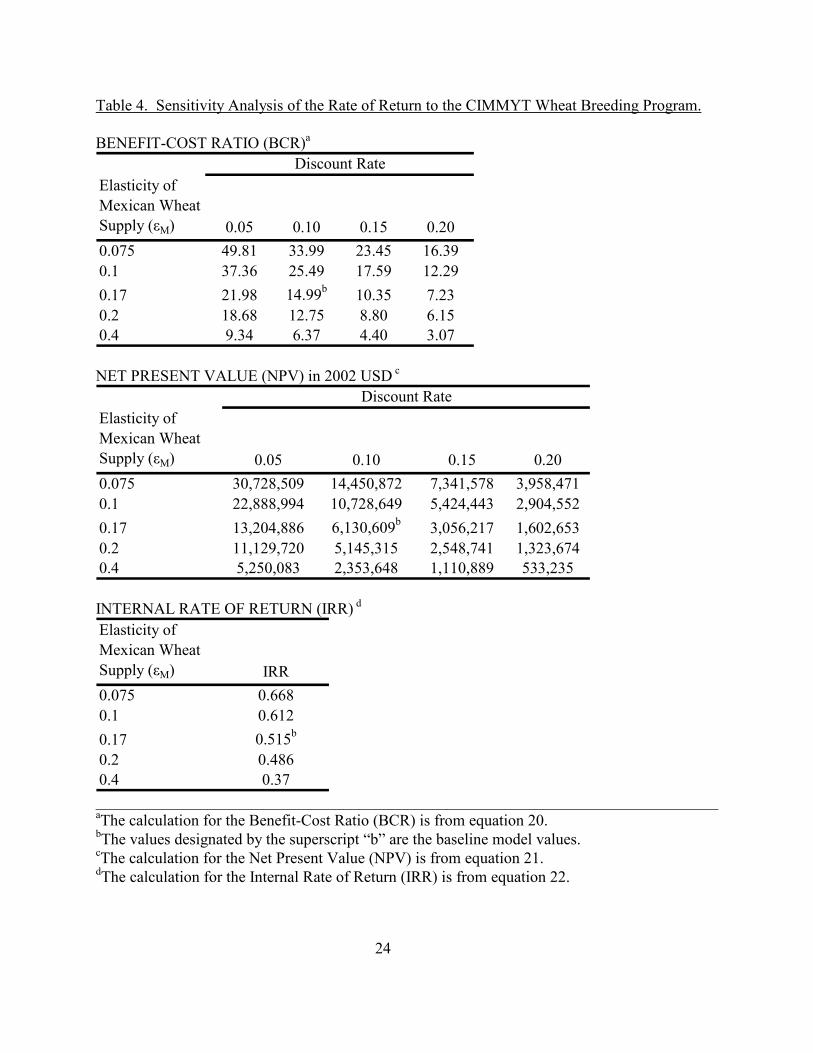
The benefit-cost ratio (BCR) is calculated as a measure of gross research benefits:
(20) BCRt=
B
(1 )
C
(1 )
t
tt
t
tt
r
r
+
+
∑
∑
where Bt is the total economic surplus in year t (∆TS from table 1), Ct are annual program costs,
and r is the assumed rate of discount. The BCRt for CIMMYT wheat varieties, assuming a 10%
rate of discount, equals 14.99 (table 4): for each dollar of public funds invested in wheat breeding
research, over 14 dollars of benefits result, with over 99% (1.88/1.89) of the benefit received by
Mexican wheat producers.
The Net Present Value (NPVt) of the program is given in equation (21):
(21) NPVt = Σt[(Bt -Ct)/(1+r)t],
where r is the discount rate. The NPVt of the program for the period 1981 to 2011, with an
assumed discount rate of 10% equals $6.13 million 2002 USD (table 4).
A third measure of economic performance is the Internal Rate of Return (IRRt), computed
as the discount rate that results in a value of zero for the NPVt as in equation (22):
(22) 0 = Σt[(Bt -Ct)/(1+IRR)t].
The IRRt for the wheat breeding program equaled 51.5% (table 4). The BCRt, NPVt, and IRRt

16
provide evidence that the economic rate of return to CIMMYT wheat breeding is high, although
assessing these measures further is difficult without comparable values for other public
investments (the opportunity cost of funds).
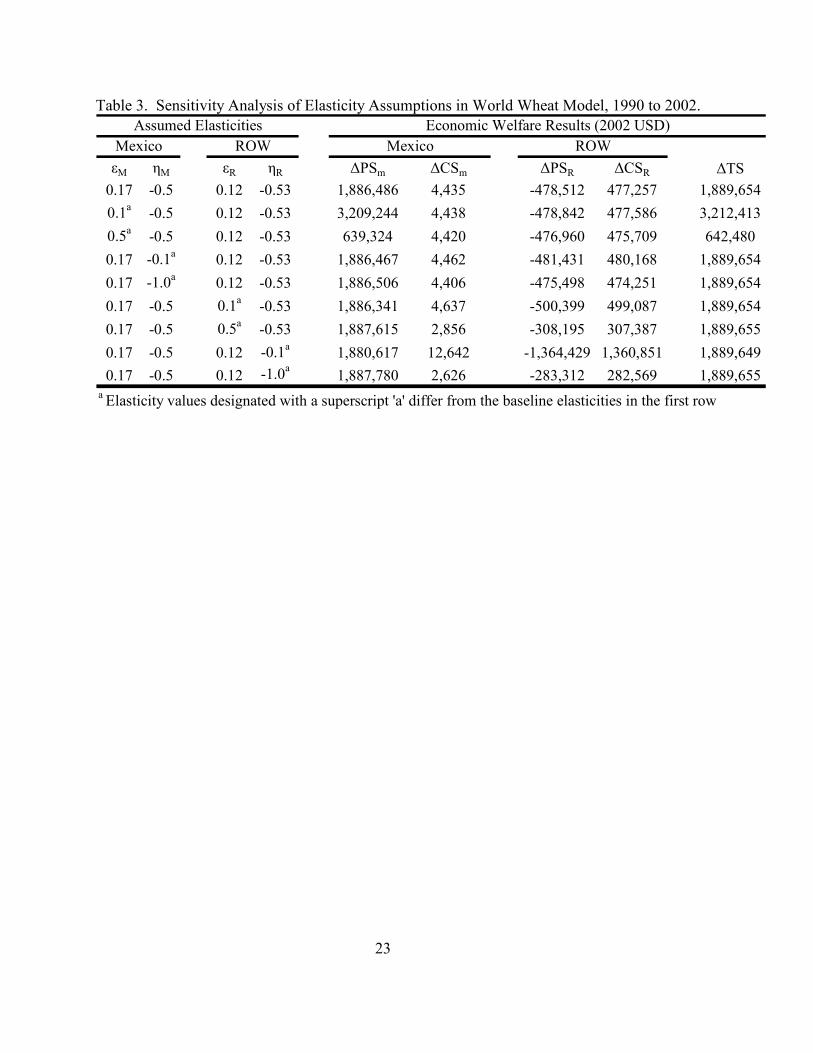
Sensitivity Analysis
The results of the two-region wheat model reported here are contingent upon numerous
assumptions, including the selected values for the supply and demand elasticities for Mexico and
the ROW, as well as linear demand and supply curves.8 To determine how robust the model
results are to changes in elasticity parameters, a sensitivity analysis was conducted by altering the
assumed values of the four elasticities: εM, εR, ηM, ηR. Table 3 reports the model results for a
range of elasticity values for the average annual changes in producer, consumer, and total
economic surpluses for the period 1990 to 2002. The model was estimated for both relatively
inelastic supply (ε = 0.1) and relatively elastic supply (ε = 0.5) for both Mexico and the ROW.
Changes in the assumed value of the Mexican supply elasticity (εM) resulted in large
changes in Mexican producer surplus from higher-yielding wheat varieties: inelastic Mexican
wheat supply (εM = 0.1) resulted in an increase in the annual average producer surplus from 1.886
to 3.20 million 2002 USD. Conversely, when the elasticity of Mexican wheat supply was
8Selection of the correct functional form of supply and demand curves in welfare analyses has received a great deal
of attention by previous researchers. Alston, Norton, and Pardey summarized this extensive discussion: "It turns out,
empirically, that measures of total research benefits and their distribution between producers and consumers are quite
insensitive to choices of functional form" (page 63). After summarizing the extensive debate over functional form
and the nature of the supply shift (parallel vs. pivotal), Alston, Norton, and Pardey concluded, "Our preference -- in
the absence of the information required to choose a particular type of shift -- is to follow Rose's (1980) suggestion
and employ a parallel shift… Under this assumption, the functional forms of supply or demand are unimportant"
(page 64). Following this line of reasoning, this study assumes a parallel supply shift and linear supply and demand
curves.
17
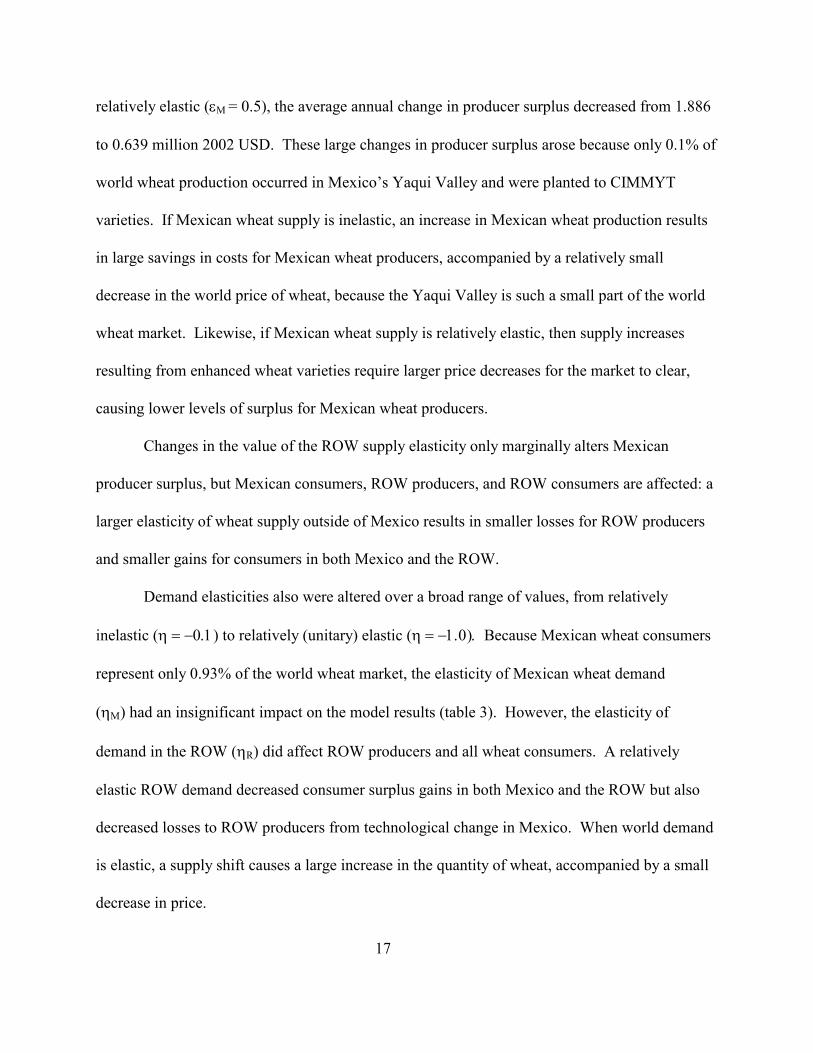
relatively elastic (εM = 0.5), the average annual change in producer surplus decreased from 1.886
to 0.639 million 2002 USD. These large changes in producer surplus arose because only 0.1% of
world wheat production occurred in Mexico’s Yaqui Valley and were planted to CIMMYT
varieties. If Mexican wheat supply is inelastic, an increase in Mexican wheat production results
in large savings in costs for Mexican wheat producers, accompanied by a relatively small
decrease in the world price of wheat, because the Yaqui Valley is such a small part of the world
wheat market. Likewise, if Mexican wheat supply is relatively elastic, then supply increases
resulting from enhanced wheat varieties require larger price decreases for the market to clear,
causing lower levels of surplus for Mexican wheat producers.
Changes in the value of the ROW supply elasticity only marginally alters Mexican
producer surplus, but Mexican consumers, ROW producers, and ROW consumers are affected: a
larger elasticity of wheat supply outside of Mexico results in smaller losses for ROW producers
and smaller gains for consumers in both Mexico and the ROW.
Demand elasticities also were altered over a broad range of values, from relatively
inelastic (η = −0.1) to relatively (unitary) elastic (η = −1.0). Because Mexican wheat consumers
represent only 0.93% of the world wheat market, the elasticity of Mexican wheat demand
(ηΜ) had an insignificant impact on the model results (table 3). However, the elasticity of
demand in the ROW (ηR) did affect ROW producers and all wheat consumers. A relatively
elastic ROW demand decreased consumer surplus gains in both Mexico and the ROW but also
decreased losses to ROW producers from technological change in Mexico. When world demand
is elastic, a supply shift causes a large increase in the quantity of wheat, accompanied by a small
decrease in price.
18
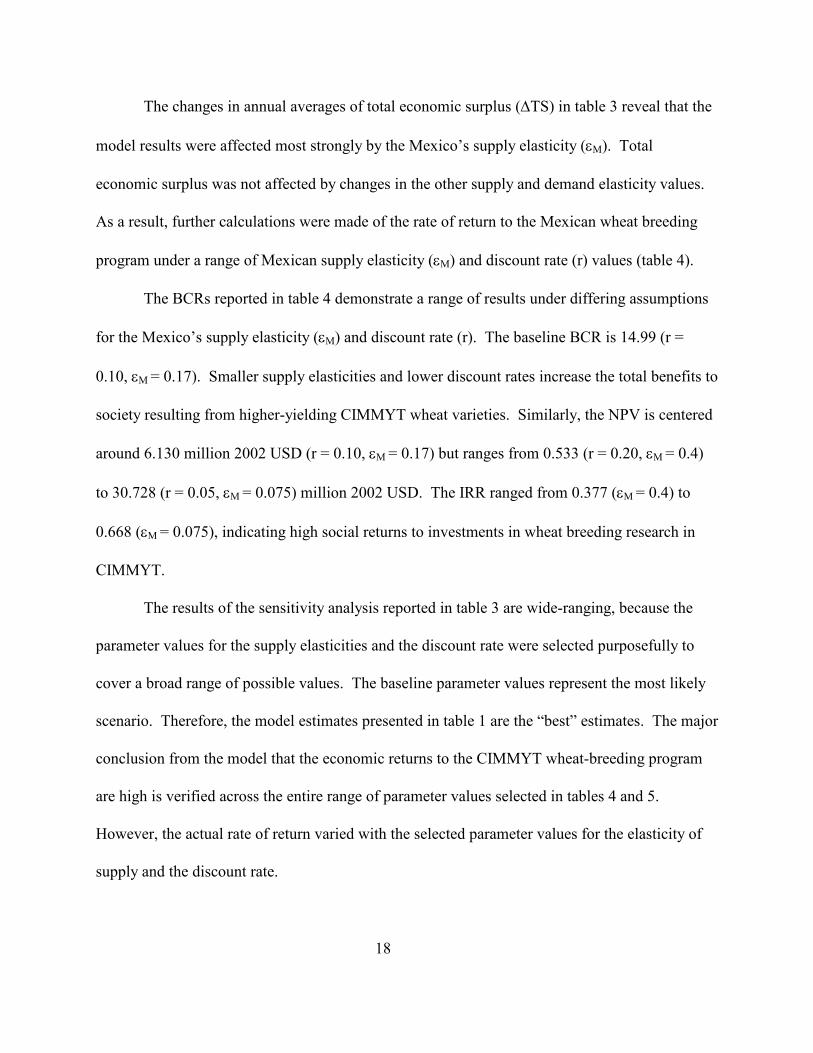
The changes in annual averages of total economic surplus (∆TS) in table 3 reveal that the
model results were affected most strongly by the Mexico’s supply elasticity (εM). Total
economic surplus was not affected by changes in the other supply and demand elasticity values.
As a result, further calculations were made of the rate of return to the Mexican wheat breeding
program under a range of Mexican supply elasticity (εM) and discount rate (r) values (table 4).
The BCRs reported in table 4 demonstrate a range of results under differing assumptions
for the Mexico’s supply elasticity (εM) and discount rate (r). The baseline BCR is 14.99 (r =
0.10, εM = 0.17). Smaller supply elasticities and lower discount rates increase the total benefits to
society resulting from higher-yielding CIMMYT wheat varieties. Similarly, the NPV is centered
around 6.130 million 2002 USD (r = 0.10, εM = 0.17) but ranges from 0.533 (r = 0.20, εM = 0.4)
to 30.728 (r = 0.05, εM = 0.075) million 2002 USD. The IRR ranged from 0.377 (εM = 0.4) to
0.668 (εM = 0.075), indicating high social returns to investments in wheat breeding research in
CIMMYT.
The results of the sensitivity analysis reported in table 3 are wide-ranging, because the
parameter values for the supply elasticities and the discount rate were selected purposefully to
cover a broad range of possible values. The baseline parameter values represent the most likely
scenario. Therefore, the model estimates presented in table 1 are the “best” estimates. The major
conclusion from the model that the economic returns to the CIMMYT wheat-breeding program
are high is verified across the entire range of parameter values selected in tables 4 and 5.
However, the actual rate of return varied with the selected parameter values for the elasticity of
supply and the discount rate.
19
Conclusions
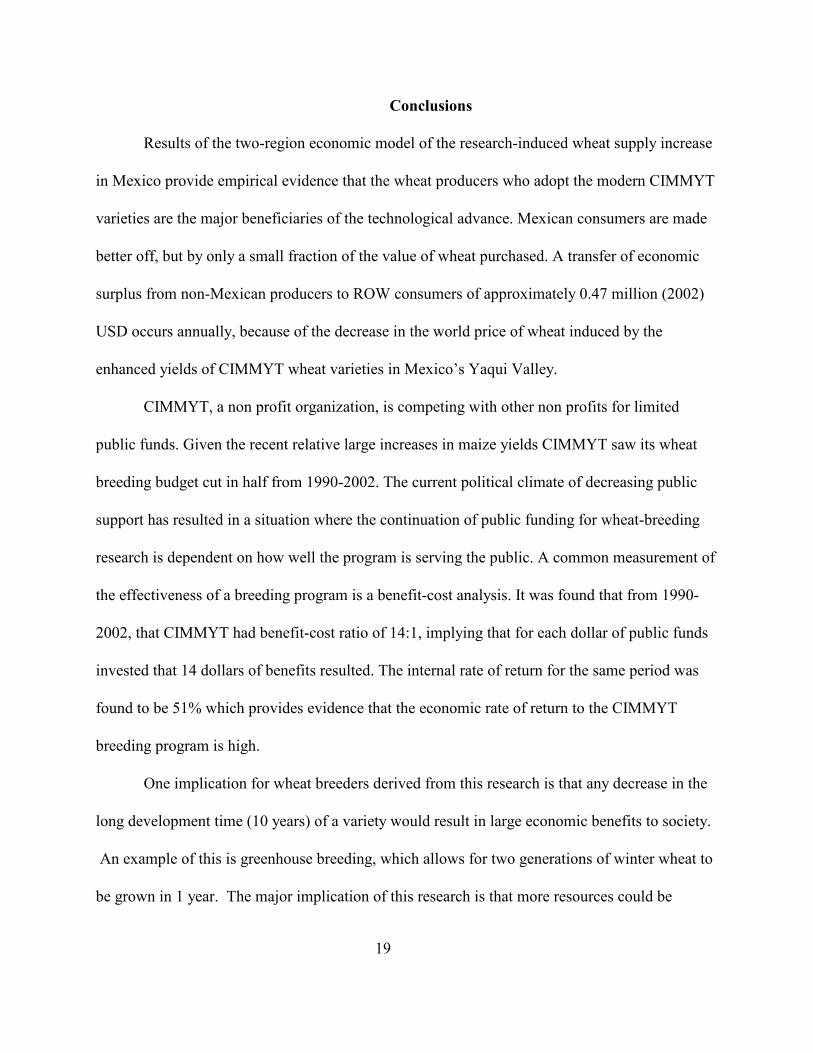
Results of the two-region economic model of the research-induced wheat supply increase
in Mexico provide empirical evidence that the wheat producers who adopt the modern CIMMYT
varieties are the major beneficiaries of the technological advance. Mexican consumers are made
better off, but by only a small fraction of the value of wheat purchased. A transfer of economic
surplus from non-Mexican producers to ROW consumers of approximately 0.47 million (2002)
USD occurs annually, because of the decrease in the world price of wheat induced by the
enhanced yields of CIMMYT wheat varieties in Mexico’s Yaqui Valley.
CIMMYT, a non profit organization, is competing with other non profits for limited
public funds. Given the recent relative large increases in maize yields CIMMYT saw its wheat
breeding budget cut in half from 1990-2002. The current political climate of decreasing public
support has resulted in a situation where the continuation of public funding for wheat-breeding
research is dependent on how well the program is serving the public. A common measurement of
the effectiveness of a breeding program is a benefit-cost analysis. It was found that from 1990-
2002, that CIMMYT had benefit-cost ratio of 14:1, implying that for each dollar of public funds
invested that 14 dollars of benefits resulted. The internal rate of return for the same period was
found to be 51% which provides evidence that the economic rate of return to the CIMMYT
breeding program is high.
One implication for wheat breeders derived from this research is that any decrease in the
long development time (10 years) of a variety would result in large economic benefits to society.
An example of this is greenhouse breeding, which allows for two generations of winter wheat to
be grown in 1 year. The major implication of this research is that more resources could be

20
allocated advantageously to the wheat breeding program. An important tenet of economics is to
allocate resources to the highest return. Given the large estimated economic benefits of the
CIMMYT wheat-breeding program, an increase in funding is an appropriate use of scarce
resources. Although the program has distributional consequences, the economic rate of return to
the investment is high.
21
Table 1. Changes in Economic Surplus from the CIMMYT Wheat Breeding Program, 1990-
2002, in 2002 U.S. Dollars.
Year
Yaqui Acres
Planted to CIMMYT
Lines
Global
Wheat Price
(2002 USD/Ton) kta
∆PSm ∆CSm ∆PSr ∆CSr ∆TS
1990 290098 220.05 0.90 3,530,220 8,100 -894,053 893,389 3,537,656
1991 199171 138.16 0.35 1,405,239 3,632 -355,865 355,395 1,408,400
1992 214967 152.32 0.45 1,610,933 3,535 -408,689 407,818 1,613,596
1993 214825 153.23 0.47 1,947,361 4,471 -493,669 492,855 1,951,018
1994 188071 138.51 0.32 1,335,836 3,371 -338,561 337,878 1,338,524
1995 191693 157.36 0.41 1,422,352 3,371 -360,897 360,009 1,424,676
1996 156347 236.77 0.61 2,062,743 4,728 -523,651 521,968 2,065,787
1997 198826 205.46 0.68 2,470,354 5,160 -626,919 625,527 2,474,122
1998 207845 156.64 0.57 1,850,327 4,245 -469,718 468,056 1,852,909
1999 217679 128.07 0.58 1,753,804 4,181 -445,228 443,354 1,756,111
2000 301399 113.46 0.59 2,077,828 5,105 -527047 525,102 2,080,988
2001 190861 118.36 0.41 1,331,477 3,336 -337,998 336,550 1,333,366
2002 211722 128.60 0.53 1,725,851 4,413 -437,993 436,074 1,728,345
Mean 214116 157.46 0.53 1,886,486 4,434 -478,484 477,229 1,889,654
Mexico ROW
akt = KtPt, where Kt = Jt'/ε and Pt is the wheat price.
22
Table 2. Cost and Benefits of the CIMMYT Wheat Breeding Program, 1981-2011.
Year
Estimated Costs
2002 USD
(Global)a
Estimated Costs
2002 USD
(Yaqui)b
Benefits
(∆TS)
2002 USDc
Year
Estimated Costs
2002 USD
(Global)
Estimated Costs
2002 USD
(Yaqui)
Benefits
(∆TS)
2002 USD
1981 13,400,000 49,911 0 1997 9,600,000 35,433 2,474,122
1982 14,200,000 62,791 0 1998 9,600,000 37,407 1,852,909
1983 14,500,000 51,482 0 1999 10,100,000 41,629 1,756,111
1984 14,900,000 45,978 0 2000 7,000,000 40,352 2,080,988
1985 14,600,000 54,333 0 2001 7,000,000 25,814 1,333,366
1986 14,400,000 67,186 0 2002 6,000,000 23,053 1,728,345
1987 13,700,000 42,377 0 2003 0 0 1,575,310
1988 15,000,000 59,226 0 2004 0 0 1,400,275
1989 13,300,000 60,690 0 2005 0 0 1,225,241
1990 13,100,000 62,264 3,537,656 2006 0 0 1,050,206
1991 13,200,000 43,451 1,408,400 2007 0 0 875,172
1992 13,500,000 48,385 1,613,596 2008 0 0 700,138
1993 13,300,000 48,060 1,951,018 2009 0 0 525,103
1994 10,900,000 34,791 1,338,524 2010 0 0 350,069
1995 9,500,000 31,186 1,424,676 2011 0 0 175,034
1996 9,900,000 26,749 2,065,787 aCosts for the period 1981-2002 are the deflated annual program costs of the CIMMYT breeding
program. bSince CIMMYT only releases global breeding costs a ratio was used to determine the portion of
the global cost associated with the Yaqui Valley. Costs attributed to the Yaqui are calculated as CIMMYT acres in Yaqui
Global Cost *Global CIMMYT acres
where global CIMMYT acres are the number of acres in a
respective year planted to CIMMYT crosses globally. cBenefits for the period 1990-2002 are the deflated total economic surplus derived from the
CIMMYT wheat breeding program ()TS in table 1). Program benefits after 2002 are the 5-year
average benefit level from 1998 to 2002 ($1.75 million) assumed to decrease at 10 % per year,
until all benefits are depleted in year 2012.
23
Table 3. Sensitivity Analysis of Elasticity Assumptions in World Wheat Model, 1990 to 2002.
εM ηM εR ηR ∆PSm ∆CSm ∆PSR ∆CSR ∆TS
0.17 -0.5 0.12 -0.53 1,886,486 4,435 -478,512 477,257 1,889,654
0.1a
-0.5 0.12 -0.53 3,209,244 4,438 -478,842 477,586 3,212,413
0.5a
-0.5 0.12 -0.53 639,324 4,420 -476,960 475,709 642,480
0.17 -0.1a
0.12 -0.53 1,886,467 4,462 -481,431 480,168 1,889,654
0.17 -1.0a
0.12 -0.53 1,886,506 4,406 -475,498 474,251 1,889,654
0.17 -0.5 0.1a
-0.53 1,886,341 4,637 -500,399 499,087 1,889,654
0.17 -0.5 0.5a
-0.53 1,887,615 2,856 -308,195 307,387 1,889,655
0.17 -0.5 0.12 -0.1a
1,880,617 12,642 -1,364,429 1,360,851 1,889,649
0.17 -0.5 0.12 -1.0a
1,887,780 2,626 -283,312 282,569 1,889,655a Elasticity values designated with a superscript 'a' differ from the baseline elasticities in the first row
Mexico ROWMexico ROW
Assumed Elasticities Economic Welfare Results (2002 USD)
24
Table 4. Sensitivity Analysis of the Rate of Return to the CIMMYT Wheat Breeding Program.
BENEFIT-COST RATIO (BCR)a
Elasticity of
Mexican Wheat
Supply (εM) 0.05 0.10 0.15 0.20
0.075 49.81 33.99 23.45 16.39
0.1 37.36 25.49 17.59 12.29
0.17 21.98 14.99b
10.35 7.23
0.2 18.68 12.75 8.80 6.15
0.4 9.34 6.37 4.40 3.07
Discount Rate
NET PRESENT VALUE (NPV) in 2002 USD c
Elasticity of
Mexican Wheat
Supply (εM) 0.05 0.10 0.15 0.20
0.075 30,728,509 14,450,872 7,341,578 3,958,471
0.1 22,888,994 10,728,649 5,424,443 2,904,552
0.17 13,204,886 6,130,609b
3,056,217 1,602,653
0.2 11,129,720 5,145,315 2,548,741 1,323,674
0.4 5,250,083 2,353,648 1,110,889 533,235
Discount Rate
INTERNAL RATE OF RETURN (IRR) d
Elasticity of
Mexican Wheat
Supply (εM) IRR
0.075 0.668
0.1 0.612
0.17 0.515b
0.2 0.486
0.4 0.37 ______________________________________________________________________________ aThe calculation for the Benefit-Cost Ratio (BCR) is from equation 20. bThe values designated by the superscript “b” are the baseline model values. cThe calculation for the Net Present Value (NPV) is from equation 21.
dThe calculation for the Internal Rate of Return (IRR) is from equation 22.

References
Acker, D. 1993. “The New Political Realities in Research Funding” .In: The Future of
Agricultural Research and Extension: Policy Perspectives. Rural Policy Research
Institute Report. June, 1993.
Akino, M., and Y. Hayami. 1975. “Efficiency and Equity in Public Research: Rice Breeding in
Japan's Economic Development.” American Journal of Agricultural Economics
57(1975):1-10.
Alston, J.M., and J.D. Mullen. 1992. “Economic Effects of Research into Traded Goods: The
Case of Australian Wool.” Journal of Agricultural Economics May 43(1992):268-278.
Alston, J.M., G.W. Norton, and P.G. Pardey. 1995. Science under Scarcity: Principles and
Practice for Agricultural Research and Evaluation and Priority Setting. Ithaca, New
York: Cornell University Press, 1995.
Ammar, Karim. 2006. Personal Interview. December 2006.
Arrow, K. 1962. “The Economic Implications of Learning by Doing.” Review of Economic
Studies 29(1962): 155-173.
Ayer, H.W., and G.E. Schuh. 1972. “Social Rates of Return and Other Aspects of Agricultural
Research: The Case of Cotton Research in Sao Paulo, Brazil.” American Journal of
Agricultural Economics 54(1972):557-569.
Brennan, J.P. 1984. “Measuring the Contribution of New Varieties to Increasing Wheat Yields.”
Review of Marketing and Agricultural Economics 52(December 1984):175-195.
Centro International de Mejoramiento de Maíz y Trigo (CIMMYT). 2007. “Yaqui Valley
Surveys of Farmer Level Data for Wheat Production. Accessed at
http://economics.cimmyt.org/Yaqui/index.htm
Centro Internacional de Mejoramiento de Maiz y Trigo (CIMMYT). 2002. “Annual Report 2002-
2003.” Mexico, D.F.: CIMMYT.
Echeverria, R.G., G. Ferreira, and M. Dabezies. 1989. Returns to Investment in the Generation
and Transfer of Rice Technology in Uruguay. ISNAR Working Paper No. 30. The
Hague: International Service for National Agricultural Research.
Edwards, G.W., and J.W. Freebairn. 1984. “The Gains from Research into Tradable
Commodities.” American Journal of Agricultural Economics 66(February 1984):41-49.
Food and Agricultural Organization (FAO). 2007a. “Core Production Data” FAOSTAT database.
Accessed October 2007, available at http://faostat.fao.org/stie/345/default.aspx
__. “Core Consumption Data” FAOSTAT database. Accessed October 2007, available at
http://faostat.fao.org/stie/343/default.aspx
Fuglie, K. et al. 1996. Agricultural Research and Development: Public and Private Investments
Under Alternative Markets and Institutions. Agricultural Economic Report No. 735.
Natural Resources and Environmental Division, Economic Research Service, United
States Department of Agriculture, Washington, DC: May, 1996.
Heisey, P., M. Lantican, and H. Dubin. 2002. Impacts of International Wheat Breeding Research
in Developing Countries, 1966-1997. Mexico, D.F.: CIMMYT.
Huffman, W.E., and R.E. Evenson. 1993. Science for Agriculture: A Long-Term Perspective.
Ames, Iowa: Iowa State University Press, 1993.
Just, R. and R. Pope. 1979. “Production Function Estimation and Related Risk Considerations.”
American Journal of Agricultural Economics 61(1979): 276-84.
Lantican, M., H. Dubin, and M. Morris. 2005. “Impacts of International Wheat Breeding
Research in the Developing World, 1998-2002.” Mexico, D.F.:CIMMYT.
Nalley, L., A. Barkley, and A. Featherstone. 2007. “The Genetic and Economic Impacts of the
CIMMYT Wheat Breeding Program: A Policy Analysis of Public Wheat Breeding”
Working Paper.
Rose, R. 1980. "Supply Shifts and Research Benefits: A Comment." American Journal of
Agricultural Economics 69(November 1980):834-44.
Rosegrant, M., M. Agcaoili-Sombilla, and N. Perez. 1995. Global Food Projections to 2020:
Implications for Investment. 2020 Discussion Paper No. 5. Washington D.C.:
International Food Policy Research Institute.
Schultz, T.W. 1953. The Economic Organization of Agriculture. New York: McGraw-Hill,
1953.
Traxler, G., J. Flack-Zepeda, J. Ortiz-Monasterio, and K. Sayre. 1995. “Production Risk and the
Evolution of Varietal Technology.” American Journal of Agricultural Economics
77(1995):1-7.
United States Department of Agriculture. Agricultural Outlook. Washington DC: USGPO,
various issues.

United States Department of Agriculture. Cooperative State Research Service. 1993. Dynamics
of the Research Investment: Issues and Trends in the Agricultural Research System.
Washington, DC: July 1993.
United States Department of Commerce. Bureau of Economic Analysis. Survey of Current
Business. Various issues.
Related Documents


