THE IMPACT OF SURFACE COVER & TREE CANOPY ON AIR TEMPERATURE IN WESTERN SYDNEY OCTOBER 2020

Welcome message from author
This document is posted to help you gain knowledge. Please leave a comment to let me know what you think about it! Share it to your friends and learn new things together.
Transcript
THE IMPACT OF SURFACE COVER & TREE CANOPY ON AIR TEMPERATURE IN WESTERN SYDNEYOCTOBER 2020

Western Sydney University2
WESTERN SYDNEY UNIVERSITY
AUTHORSDr Sebastian Pfautsch, Adam R Tjoelker
Urban Studies School of Social Sciences
Western Sydney University, Locked Bag 1797, Penrith, NSW 2751.
This research project has been funded by Campbelltown City Council, New South Wales, Australia.
With respect for Aboriginal cultural protocol and out of recognition that the campuses of Western Sydney University occupy their traditional lands, the Darug, Tharawal (also historically referred to as Dharawal), Gandangara and Wiradjuri peoples are acknowledged and thanked for permitting this work on their lands.
SUGGESTED CITATIONPfautsch, S., Tjoelker, A R. (2020) The impact of surface cover and tree canopy on air temperature in Western Sydney. Western Sydney University, 140 p.
DOI: https://doi.org/10.26183/bk6d-1466
©Western Sydney University.
www.westernsydney.edu.au
October, 2020.
Cover and other images from S. Pfautsch and istock.com
westernsydney.edu.au 3
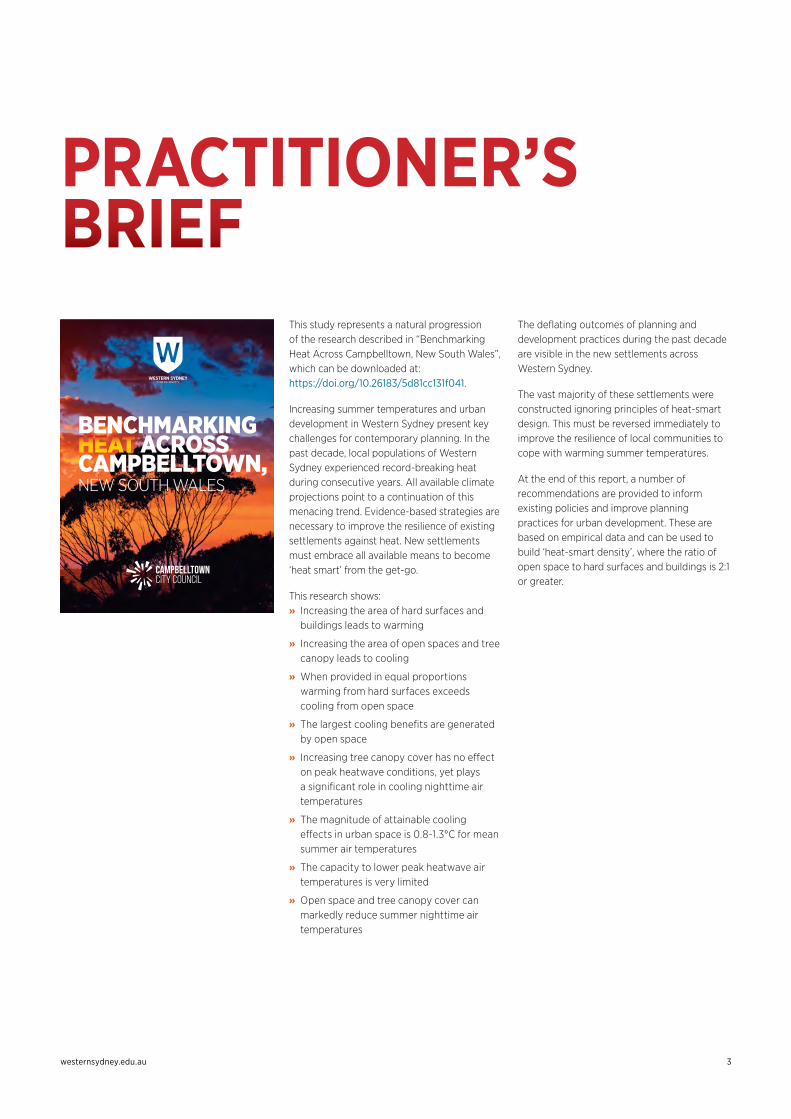
This study represents a natural progression of the research described in “Benchmarking Heat Across Campbelltown, New South Wales”, which can be downloaded at: https://doi.org/10.26183/5d81cc131f041.
Increasing summer temperatures and urban development in Western Sydney present key challenges for contemporary planning. In the past decade, local populations of Western Sydney experienced record-breaking heat during consecutive years. All available climate projections point to a continuation of this menacing trend. Evidence-based strategies are necessary to improve the resilience of existing settlements against heat. New settlements must embrace all available means to become ‘heat smart’ from the get-go.
This research shows: » Increasing the area of hard surfaces and buildings leads to warming
» Increasing the area of open spaces and tree canopy leads to cooling
» When provided in equal proportions warming from hard surfaces exceeds cooling from open space
» The largest cooling benefits are generated by open space
» Increasing tree canopy cover has no effect on peak heatwave conditions, yet plays a significant role in cooling nighttime air temperatures
» The magnitude of attainable cooling effects in urban space is 0.8-1.3°C for mean summer air temperatures
» The capacity to lower peak heatwave air temperatures is very limited
» Open space and tree canopy cover can markedly reduce summer nighttime air temperatures
The deflating outcomes of planning and development practices during the past decade are visible in the new settlements across Western Sydney.
The vast majority of these settlements were constructed ignoring principles of heat-smart design. This must be reversed immediately to improve the resilience of local communities to cope with warming summer temperatures.
At the end of this report, a number of recommendations are provided to inform existing policies and improve planning practices for urban development. These are based on empirical data and can be used to build ‘heat-smart density’, where the ratio of open space to hard surfaces and buildings is 2:1 or greater.
PRACTITIONER’S BRIEF
BENCHMARKING HEAT ACROSS CAMPBELLTOWN, NEW SOUTH WALES
WESTERNSYDNEY.EDU.AU
CONTACT USWestern Sydney University,
Locked Bag 1797, Penrith, NSW 2751
RSCH5007 Cambelltown cover.indd 60-1 10/10/19 9:45 am
Western Sydney University4
WESTERN SYDNEY UNIVERSITY
CONTENTSPRACTITIONER’S BRIEF 3
CONTENTS 4
1. INTRODUCTION 6
2. OBJECTIVE 10
3. METHODOLOGY 113.1 Study Sites 11
3.2 Geo-spatial Analyses 11
3.3 Data Analyses 16
4. RESULTS 184.1 Variability in Surface Types and Area 18
4.2 Effect of Surface Type on Summer Temperatures 20
4.3 Effect of Surface Type on January and February Temperatures 22
4.4 Effect of Surface Type on Heatwave Conditions 25
4.5 Individual Warming and Cooling Effects 26
5. RECOMMENDATIONS 305.1 Reduce Warming 30
5.2 Increase Cooling 31
5.3 The Role of Blue Space 31
5.4 Regulating Urban Temperatures with Tree Canopy 31
5.5 Low Capacity to Reduce Heatwave Temperatures 32
6. CONCLUSION 34
7. REFERENCES 35
8. DETAILS OF STUDY SITES 36
westernsydney.edu.au
SURFACE TYPES AND AIR TEMPERATURE
5
Western Sydney University6
WESTERN SYDNEY UNIVERSITY
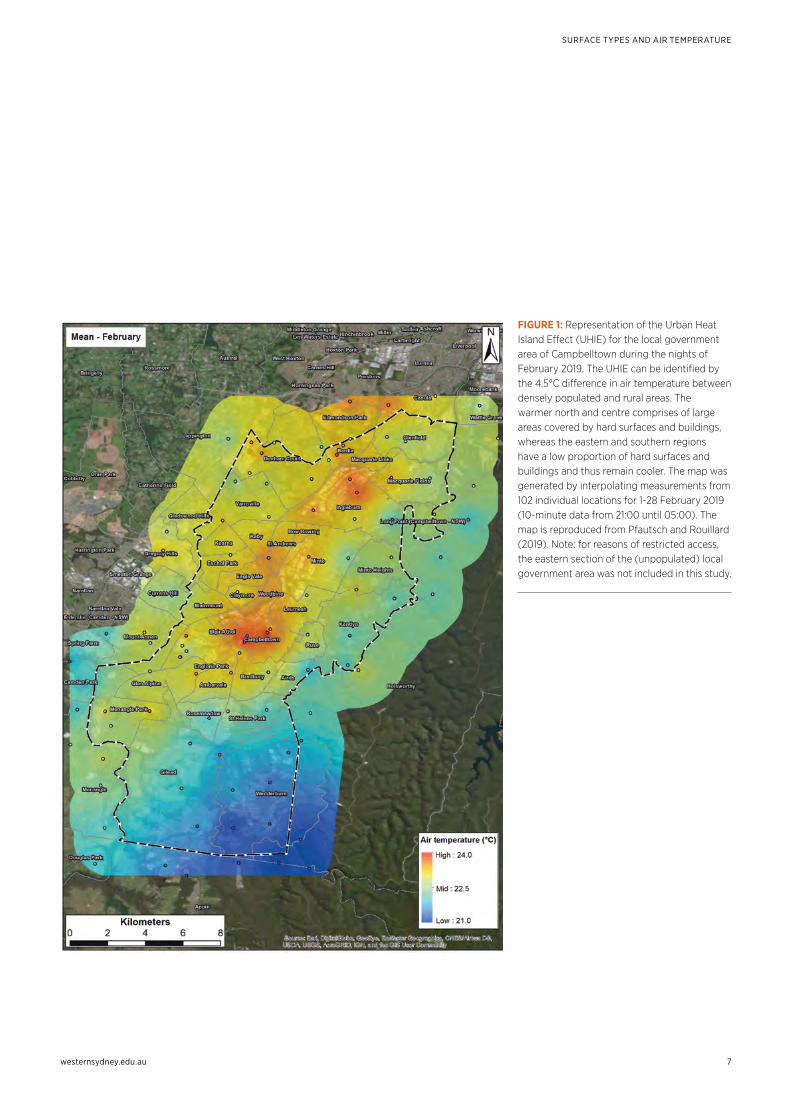
1. INTRODUCTIONSoil sealing, the process whereby an open, pervious surface that would otherwise be covered by vegetation is partly or completely capped with impervious surface materials like asphalt, concrete, or bricks, represents the most severe form of land conversion (European Commission 2012). This process results in greater absorption of solar energy, increased heat storage and slowed emission of stored energy. At a city-scale, this alteration of energy budgets leads to well documented Urban Heat Island Effects that leave cities warmer compared to surrounding rural land (Oke 1973). The process of urbanisation and associated soil sealing represents possibly the single most important anthropogenic impact on global surface climate (Zhao et al. 2014).
Urban Heat Island Effects have been documented for hundreds of cities in Asia (Hung et al. 2006, Roth et al. 2012), North
America (Lowe et al. 2006, Solecki et al. 2011, Wang et al. 2016a), Europe (Ward et al. 2016), and Australia (Santamouris 2015). Recently,
this effect was also documented for the local government area (LGA) of Campbelltown (Pfautsch and Rouillard 2019) (Figure 1).
westernsydney.edu.au
SURFACE TYPES AND AIR TEMPERATURE
7
FIGURE 1: Representation of the Urban Heat Island Effect (UHIE) for the local government area of Campbelltown during the nights of February 2019. The UHIE can be identified by the 4.5°C difference in air temperature between densely populated and rural areas. The warmer north and centre comprises of large areas covered by hard surfaces and buildings, whereas the eastern and southern regions have a low proportion of hard surfaces and buildings and thus remain cooler. The map was generated by interpolating measurements from 102 individual locations for 1-28 February 2019 (10-minute data from 21:00 until 05:00). The map is reproduced from Pfautsch and Rouillard (2019). Note: for reasons of restricted access, the eastern section of the (unpopulated) local government area was not included in this study.
Western Sydney University8
WESTERN SYDNEY UNIVERSITY
summer heat were provided in the report “Benchmarking Heat across Campbelltown City, NSW”, available for download at: https://doi.org/10.26183/5d81cc131f041. The study demonstrated that local Urban Heat Island Effects can be captured and reproduced accurately using the data from a dense network of air temperature loggers. Figure 1 represents such a reproducion.
The analyses of the project revealed that urban communities living in the suburbs of Campbelltown City are exposed to extreme summer heat much more frequently than documented by nearby meteorological stations. Yet, the origin of the variability of temperature variation observed across the LGA was not assessed further. The present report closes this gap by analysing the influence of different surface types and their relative cover in the vicinity of the 102 measurement locations.
Evidence presented here, and recommendations derived from it will advance the understanding of how the spatial composition of urban and peri-urban landscapes impacts urban microclimate of a large tract of land in Western Sydney that is representative for the region. In light of anticipated urban development in this region, and the prospect of increasing summer heat, the present report offers practical solutions to improve the climate resilience of local communities. Armed with this knowledge, it will be possible to formulate evidence-based guidelines, policies and management strategies that increase the thermal performance of existing built-up space and inform planning and development of new suburbs.
the overpass by a satellite or aeroplane. Thus, LST cannot be used to analyse important thermo-dynamic processes in urban space like air movement and evaporative cooling. One example for these important processes is nighttime cooling and how the magnitude of cooling depends on the composition of urban fabrics. Thirdly, analyses of full temperature ranges of common urban surface materials are limited by the resolution of individual pixels from remote sensing products (Song et al. 2014, Wang et al. 2016b). The reason for this effect is that surface temperature will be averaged across each pixel, which results in the loss of information about location specific maximum and minimum LST.
Sophisticated assessments of remotely sensed LST can provide highly valuable information at relatively large spatial scales. However, understanding how the configuration of urban surface space impacts microclimates at the neighbourhood scale requires other techniques, such as analyses of local microclimates and related energy budgets (e.g., Coutts et al. 2007). Such microclimate studies will rely on measurements of near-surface air temperature and are the method of choice when assessing the direct effects of Urban Heat Island Effects (Schwarz et al. 2012). Assessments of near-surface air temperatures allow documenting microclimatic variation that local communities actually experience (e.g., Krayenhoff et al. 2020, Ziter et al. 2019). However, no method comes without limitations. It is well known that air temperature in urban environments can vary greatly and this variation is rarely captured due to the lack of a systematic network of meteorological stations. Research has shown that using data from such stations has a limited capacity to capture the apparent variation of near-surface air temperatures of urban landscapes (Morabito et al. 2015).
This issue was resolved by the joint project of Western Sydney University and Campbelltown City Council during the summer of 2018/19. The project collected detailed measurements of near-surface air temperatures at 102 locations within and beyond the boundaries of the LGA. Analyses of these measurements and recommendations for heat-smart urban planning and strategies to mitigate
Urban Heat Island Effects are predominately studied remotely. The necessary data are generated using instruments carried by orbiting satellites or fixed-wing aeroplanes and imported into geo-spatial information systems that can produce maps depicting the land surface temperature (LST) of cities and metropolitan regions. When LST is documented at high spatial resolution, assessments of the relationship between surface temperature and surface cover are possible by overlaying different layers of mapped information. Usually, these analyses report positive correlations between LST and grey infrastructure (i.e., the build-up urban space made up by roads and buildings) and demonstrate how an increasing cover of hard surfaces and buildings promotes urban warming (e.g., Estoque et al. 2017, Morabito et al. 2016).
Compared to hard surfaces, urban space covered by green infrastructure usually has a lower LST (Estoque et al. 2017) and different types of green surface cover like grass, shrubs or tall trees will have different cooling effects on LST (Duncan et al. 2019). Warming effects of hard surfaces and cooling effects from vegetation are usually linearly related to their relative cover (Morabito et al. 2016, Estoque et al. 2017), which indicates that LST can be influenced by reducing or expanding certain surface types. Indeed, a study found that by replacing 20% vegetation cover across central Manchester in the UK with asphalt would increase mean LST by nearly 5°C, while adding 5% green space in the form of mature trees would reduce LST by about 1°C (Skelhorn et al. 2014). This is a striking example of how urban surface cover influences thermal conditions in built-up space. Nevertheless, using LST to analyse urban heat has three main disadvantages.
Firstly, LST only allows an indirect measure of Urban Heat Island Effects, because it is using surface temperature data. Analysis of LST will lead to calculation of temperatures that include many locations where humans would not regularly spend much time (e.g., roofs, roads). Secondly, using remotely sensed data will provide a static representation of the thermal environment during the time of
westernsydney.edu.au
SURFACE TYPES AND AIR TEMPERATURE
9
Western Sydney University10
WESTERN SYDNEY UNIVERSITY
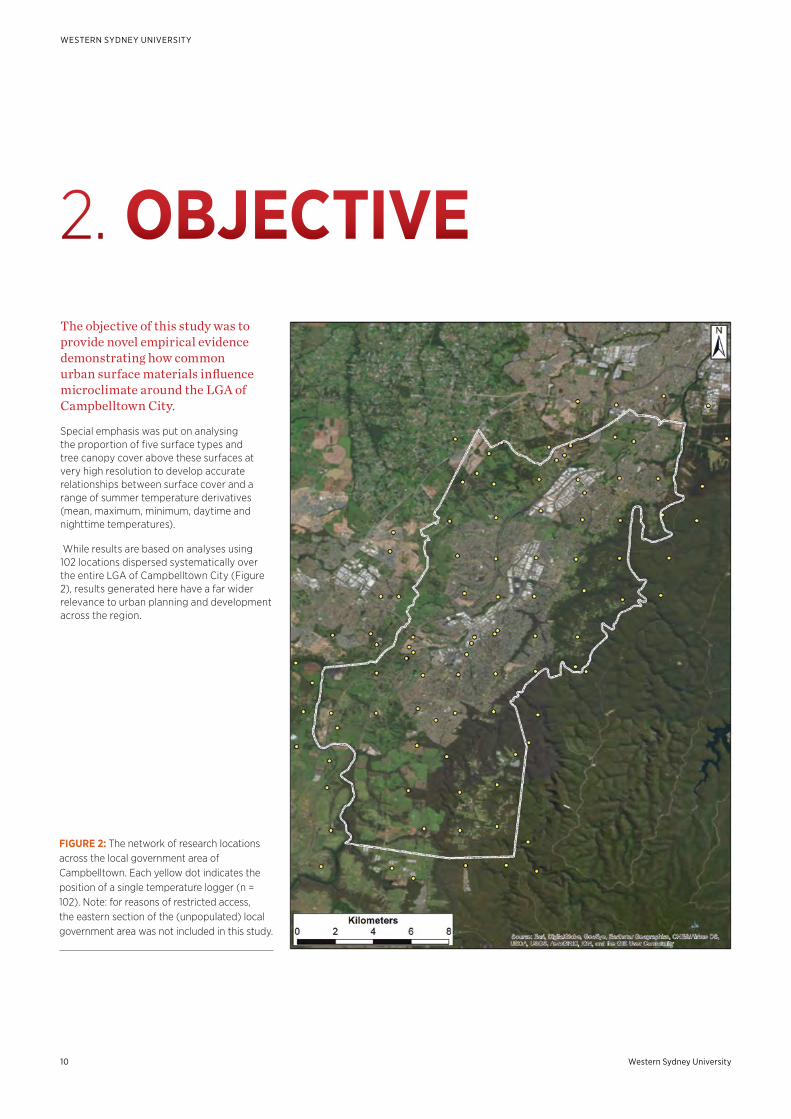
The objective of this study was to provide novel empirical evidence demonstrating how common urban surface materials influence microclimate around the LGA of Campbelltown City.
Special emphasis was put on analysing the proportion of five surface types and tree canopy cover above these surfaces at very high resolution to develop accurate relationships between surface cover and a range of summer temperature derivatives (mean, maximum, minimum, daytime and nighttime temperatures).
While results are based on analyses using 102 locations dispersed systematically over the entire LGA of Campbelltown City (Figure 2), results generated here have a far wider relevance to urban planning and development across the region.
2. OBJECTIVE
FIGURE 2: The network of research locations across the local government area of Campbelltown. Each yellow dot indicates the position of a single temperature logger (n = 102). Note: for reasons of restricted access, the eastern section of the (unpopulated) local government area was not included in this study.
westernsydney.edu.au
SURFACE TYPES AND AIR TEMPERATURE
11
3. METHODOLOGYTree canopy cover as sixth category was determined separately as layer that would sit above one or more of the surface types (Figure 4).
The following procedure was used to determine the area of each surface type:
1. A 50 m circle was drawn using the location of the logger as central reference point; this object was produced using the circle function in Nearmap. Surface area of the circle covered 7,854 m2.
2. The polygon tool was used to trace the outline of the circle. This was necessary, as other polygons could only be drawn upon polygons, but not objects produced using the circle tool (internal limitation of Nearmap). Redrawing the circular area resulted in slight deviations of ±1.4% from the ideal circular area.
3. Individual polygons that delineated each plot or parcel of the five surface types were drawn manually and their area was noted. If areas under tree canopies were either covered by unvegetated or vegetated surfaces was determined by assessing the quality of ground cover vegetation in the selected map, and when necessary also in other Nearmap images representing similar summer conditions in previous years. Where surrounding ground vegetation looked sparse (e.g., in native bushland around Holsworthy), all surface type was quantified as type 2 ‘unvegetated space’.
4. The absolute area of each surface type was calculated by summing the individual area of polygons for each of the five categories. The relative area of each surface type was calculated by dividing its summed area by the area of the entire circular area, multiplied by 100.
5. Finally, polygons delineating tree canopies were drawn on top of all surface type polygons. Shrubs with a surface area <4m2 were not counted at tree canopy. Larger shrubs with tree-like characteristics were considered canopy.
3.2 GEO-SPATIAL ANALYSESThe exact position of a tree or light pole was determined in Nearmap (Barangaroo, Sydney, Australia). This subscription-only software provides access to high-resolution aerial images that cover Western Sydney, including the Campbelltown region. Regular flights are conducted that capture the area at 5.8-7.5 cm ground sample distance. The resulting maps are typically accurate to ±15 cm for distances up to 200 m. More information about the accuracy of the maps used for the analyses here can be found at: https://docs.nearmap.com/display/ND/Accuracy. The map produced by an overpass in early March 2019 was used for the analyses presented here.
At each of the 102 locations, the absolute and relative area of five different surface types as well as tree canopy cover was determined manually (Figure 3). The minimum area of individual objects and tree canopies included in these analyses was less than 2 m2. This high level of precision produced very accurate estimates for each urban surface type. Where necessary, Google Street View was used to identify surface types obscured by tree canopies. Individual objects and surface polygons were clustered into five surface types:
1. Vegetated, green open space (lawns, pastures, shrubs, playing fields, gardens, vegetated median strips, parks,etc.)
2. Non-vegetated open space (bare soil, dry ground vegetation, etc.)
3. Hard ground surfaces (roads, carparks, pavements, paths, driveways, etc.)
4. Buildings (represented by their roof tops)5. Blue space (swimming pools, waterways,
etc.)
3.1 STUDY SITESFor the 2019 study that assessed variation in near-surface air temperatures across the LGA, data was collected at 102 sites from Edmondson Park in the north to Wedderburn in the south of the Campbelltown City LGA. At each site, one microclimate data logger was installed, usually on a branch of the lower canopy of a tree (2.5-3 m above ground). In recently build suburbs where no sufficiently large tree was present, loggers were mounted to the horizontal arm of a light pole using a hydraulic lift. Details describing the data logger, its accuracy and data recording intervals were provided in Pfautsch and Rouillard (2019). Procedures for installation of the loggers can also be found in this report.
During installation of the loggers, each site was geo-tagged using satellite based global positioning information. This information was used to identify the exact position of each site (depicted in Figure 2). Sites were located in native bushland, national parks, rural and peri-urban settings, as well as industrial, commercial and residential streets in new and established suburbs. In addition, carparks, parks, playgrounds and school yards were also represented, providing the largest possible cross-section of typologies found throughout the LGA of Campbelltown.
Western Sydney University12
WESTERN SYDNEY UNIVERSITY
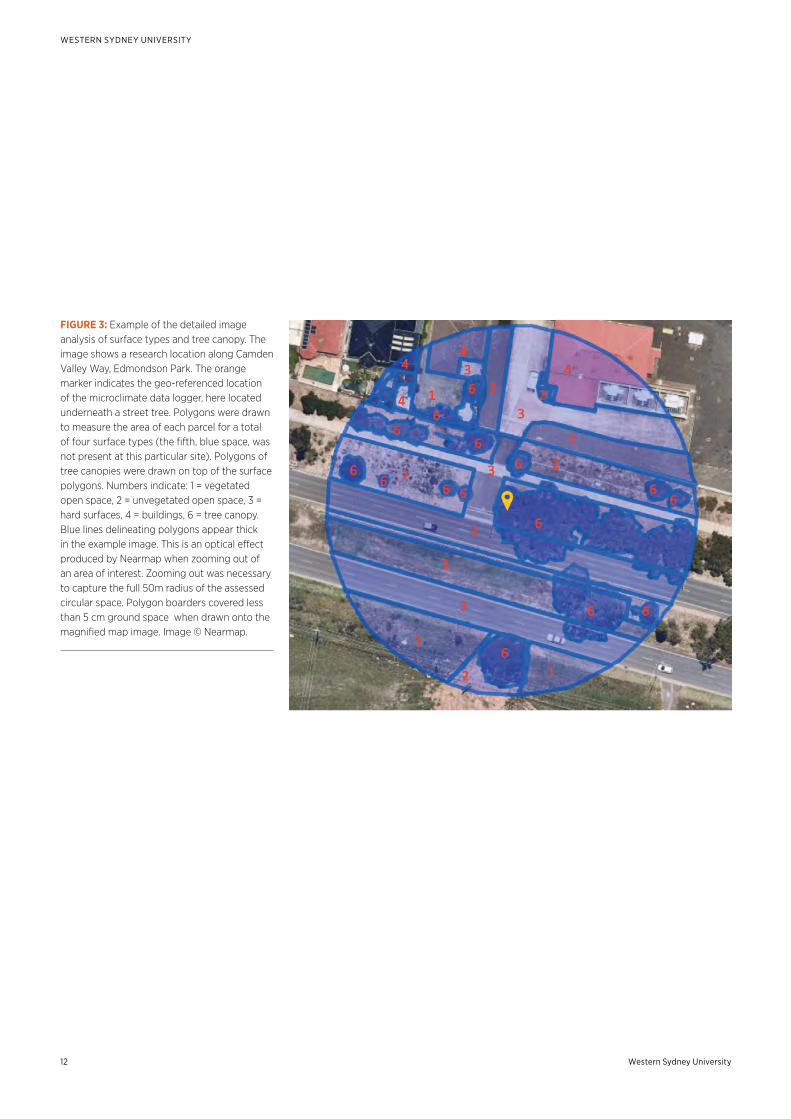
FIGURE 3: Example of the detailed image analysis of surface types and tree canopy. The image shows a research location along Camden Valley Way, Edmondson Park. The orange marker indicates the geo-referenced location of the microclimate data logger, here located underneath a street tree. Polygons were drawn to measure the area of each parcel for a total of four surface types (the fifth, blue space, was not present at this particular site). Polygons of tree canopies were drawn on top of the surface polygons. Numbers indicate: 1 = vegetated open space, 2 = unvegetated open space, 3 = hard surfaces, 4 = buildings, 6 = tree canopy. Blue lines delineating polygons appear thick in the example image. This is an optical effect produced by Nearmap when zooming out of an area of interest. Zooming out was necessary to capture the full 50m radius of the assessed circular space. Polygon boarders covered less than 5 cm ground space when drawn onto the magnified map image. Image © Nearmap.
westernsydney.edu.au
SURFACE TYPES AND AIR TEMPERATURE
13
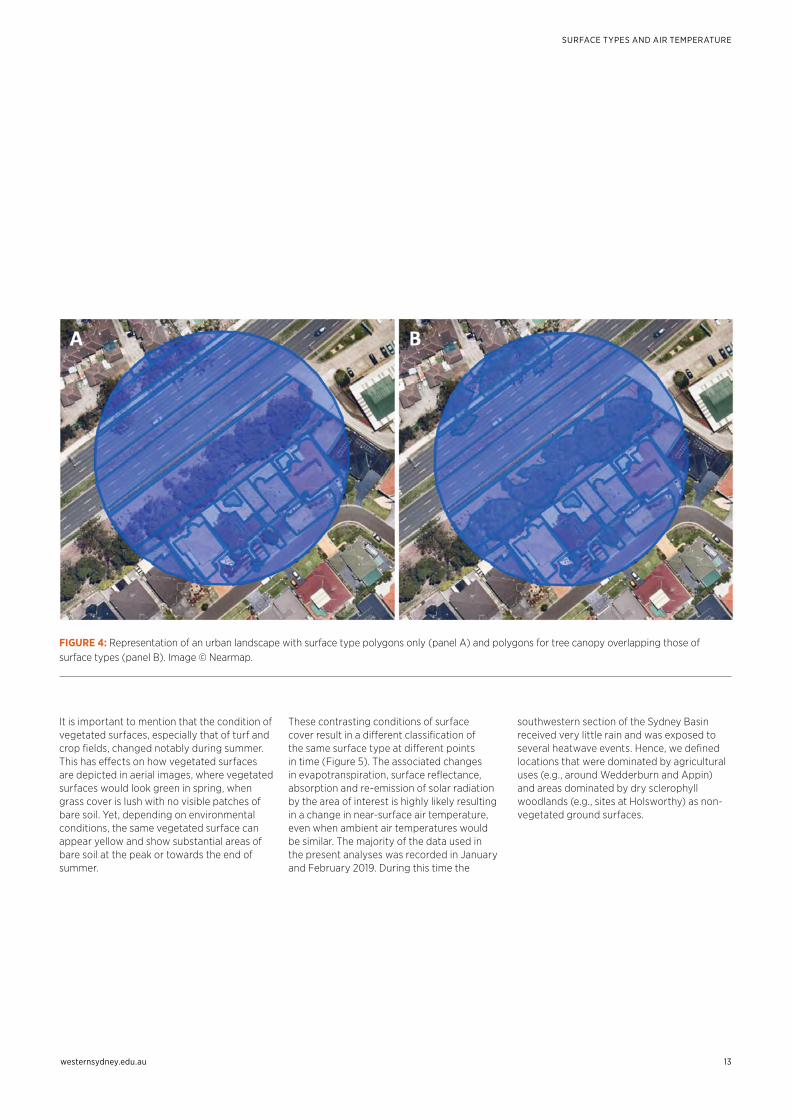
FIGURE 4: Representation of an urban landscape with surface type polygons only (panel A) and polygons for tree canopy overlapping those of surface types (panel B). Image © Nearmap.
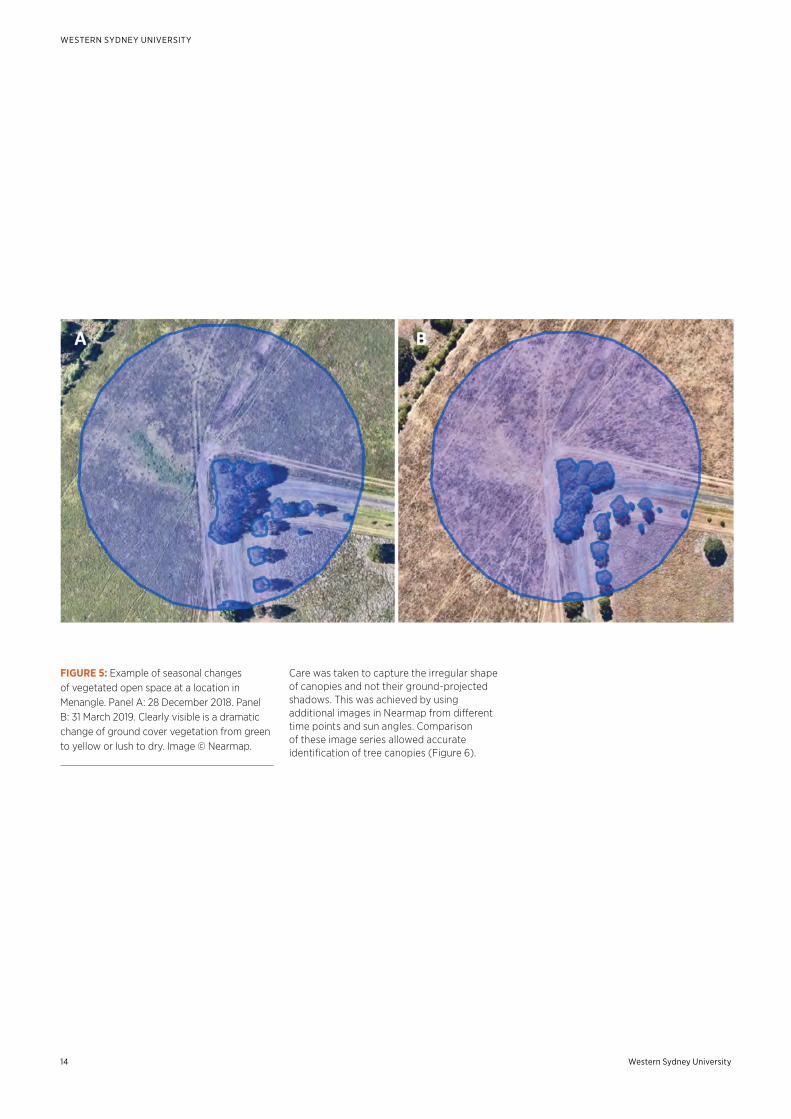
It is important to mention that the condition of vegetated surfaces, especially that of turf and crop fields, changed notably during summer. This has effects on how vegetated surfaces are depicted in aerial images, where vegetated surfaces would look green in spring, when grass cover is lush with no visible patches of bare soil. Yet, depending on environmental conditions, the same vegetated surface can appear yellow and show substantial areas of bare soil at the peak or towards the end of summer.
These contrasting conditions of surface cover result in a different classification of the same surface type at different points in time (Figure 5). The associated changes in evapotranspiration, surface reflectance, absorption and re-emission of solar radiation by the area of interest is highly likely resulting in a change in near-surface air temperature, even when ambient air temperatures would be similar. The majority of the data used in the present analyses was recorded in January and February 2019. During this time the
southwestern section of the Sydney Basin received very little rain and was exposed to several heatwave events. Hence, we defined locations that were dominated by agricultural uses (e.g., around Wedderburn and Appin) and areas dominated by dry sclerophyll woodlands (e.g., sites at Holsworthy) as non-vegetated ground surfaces.
Western Sydney University14
WESTERN SYDNEY UNIVERSITY
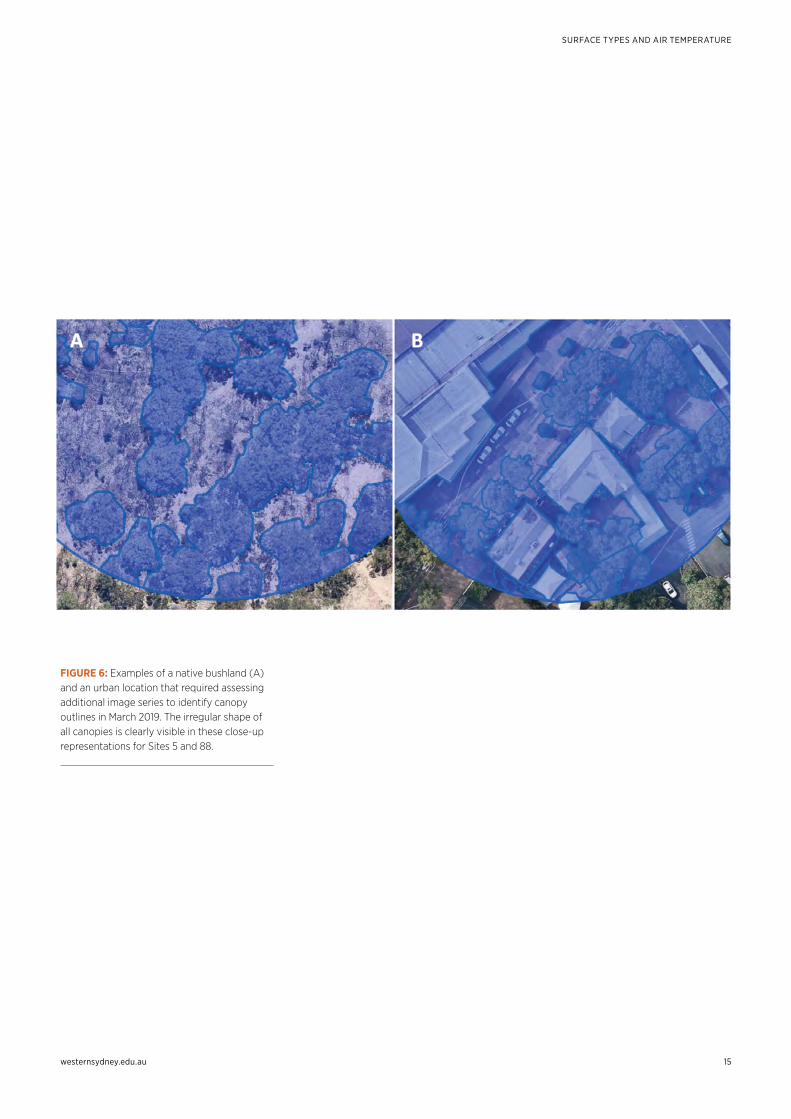
Care was taken to capture the irregular shape of canopies and not their ground-projected shadows. This was achieved by using additional images in Nearmap from different time points and sun angles. Comparison of these image series allowed accurate identification of tree canopies (Figure 6).
FIGURE 5: Example of seasonal changes of vegetated open space at a location in Menangle. Panel A: 28 December 2018. Panel B: 31 March 2019. Clearly visible is a dramatic change of ground cover vegetation from green to yellow or lush to dry. Image © Nearmap.
westernsydney.edu.au
SURFACE TYPES AND AIR TEMPERATURE
15
FIGURE 6: Examples of a native bushland (A) and an urban location that required assessing additional image series to identify canopy outlines in March 2019. The irregular shape of all canopies is clearly visible in these close-up representations for Sites 5 and 88.
Western Sydney University16
WESTERN SYDNEY UNIVERSITY
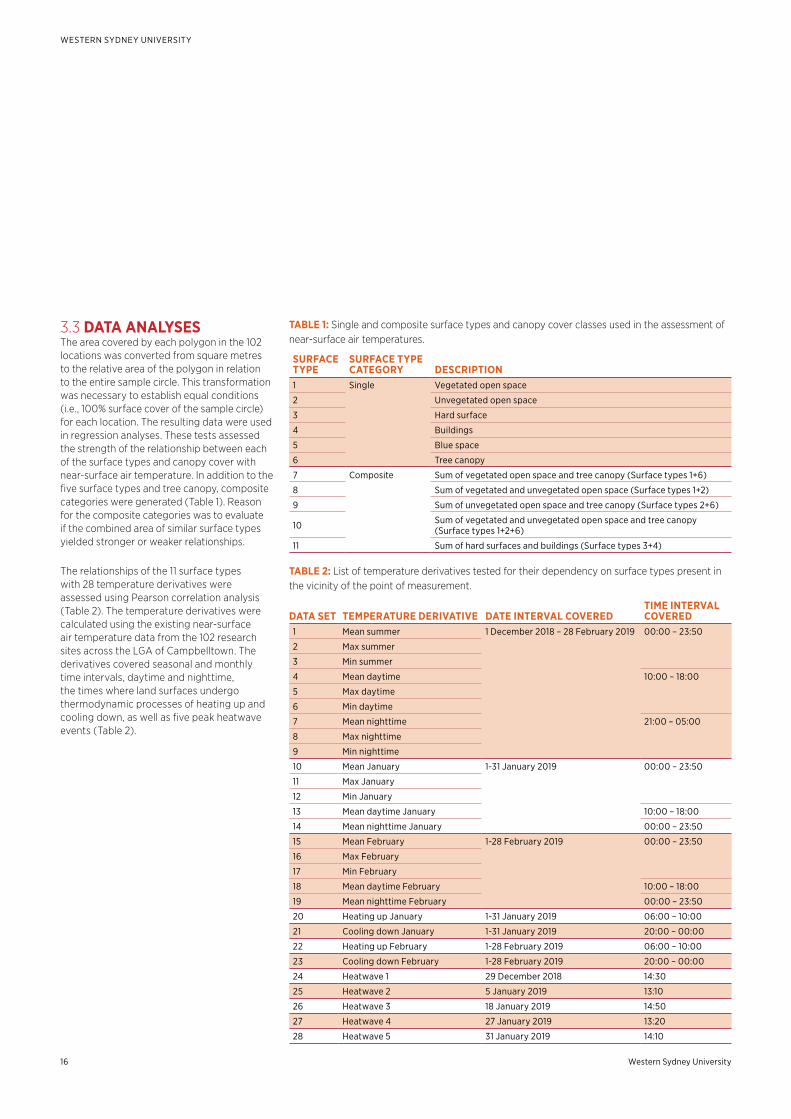
TABLE 1: Single and composite surface types and canopy cover classes used in the assessment of near-surface air temperatures.
SURFACE TYPE
SURFACE TYPE CATEGORY DESCRIPTION
1 Single Vegetated open space
2 Unvegetated open space
3 Hard surface
4 Buildings
5 Blue space
6 Tree canopy
7 Composite Sum of vegetated open space and tree canopy (Surface types 1+6)
8 Sum of vegetated and unvegetated open space (Surface types 1+2)
9 Sum of unvegetated open space and tree canopy (Surface types 2+6)
10 Sum of vegetated and unvegetated open space and tree canopy (Surface types 1+2+6)
11 Sum of hard surfaces and buildings (Surface types 3+4)
3.3 DATA ANALYSESThe area covered by each polygon in the 102 locations was converted from square metres to the relative area of the polygon in relation to the entire sample circle. This transformation was necessary to establish equal conditions (i.e., 100% surface cover of the sample circle) for each location. The resulting data were used in regression analyses. These tests assessed the strength of the relationship between each of the surface types and canopy cover with near-surface air temperature. In addition to the five surface types and tree canopy, composite categories were generated (Table 1). Reason for the composite categories was to evaluate if the combined area of similar surface types yielded stronger or weaker relationships.
The relationships of the 11 surface types with 28 temperature derivatives were assessed using Pearson correlation analysis (Table 2). The temperature derivatives were calculated using the existing near-surface air temperature data from the 102 research sites across the LGA of Campbelltown. The derivatives covered seasonal and monthly time intervals, daytime and nighttime, the times where land surfaces undergo thermodynamic processes of heating up and cooling down, as well as five peak heatwave events (Table 2).
TABLE 2: List of temperature derivatives tested for their dependency on surface types present in the vicinity of the point of measurement.
DATA SET TEMPERATURE DERIVATIVE DATE INTERVAL COVEREDTIME INTERVAL COVERED
1 Mean summer 1 December 2018 – 28 February 2019 00:00 – 23:50
2 Max summer
3 Min summer
4 Mean daytime 10:00 – 18:00
5 Max daytime
6 Min daytime
7 Mean nighttime 21:00 – 05:00
8 Max nighttime
9 Min nighttime
10 Mean January 1-31 January 2019 00:00 – 23:50
11 Max January
12 Min January
13 Mean daytime January 10:00 – 18:00
14 Mean nighttime January 00:00 – 23:50
15 Mean February 1-28 February 2019 00:00 – 23:50
16 Max February
17 Min February
18 Mean daytime February 10:00 – 18:00
19 Mean nighttime February 00:00 – 23:50
20 Heating up January 1-31 January 2019 06:00 – 10:00
21 Cooling down January 1-31 January 2019 20:00 – 00:00
22 Heating up February 1-28 February 2019 06:00 – 10:00
23 Cooling down February 1-28 February 2019 20:00 – 00:00
24 Heatwave 1 29 December 2018 14:30
25 Heatwave 2 5 January 2019 13:10
26 Heatwave 3 18 January 2019 14:50
27 Heatwave 4 27 January 2019 13:20
28 Heatwave 5 31 January 2019 14:10
westernsydney.edu.au
SURFACE TYPES AND AIR TEMPERATURE
17
A total of 308 individual models were analysed for their strength in predicting near-surface air temperatures based on the variation in relative area covered by any single or composite surface type. The strength of the resulting relationships was analysed using a density ellipse function with a 95% coverage. The strength of the resulting relationship between independent (surface types) and dependent (temperature derivatives) variables was expressed by the Pearson correlation coefficient (r, values range from -1 to +1). Statistical significance was given when the probability level (p) was below 0.05.
In addition, relationships between individual surface types and temperature derivatives were assessed using correlation analyses to estimate the level of cooling or warming that can be expected when modifying the area of a specific surface type or tree canopy. The predictive strength of these bivariate relationships was expressed by the coefficient of determination (R2). Relationships were statistically significant when p was below 0.05.
Western Sydney University18
WESTERN SYDNEY UNIVERSITY
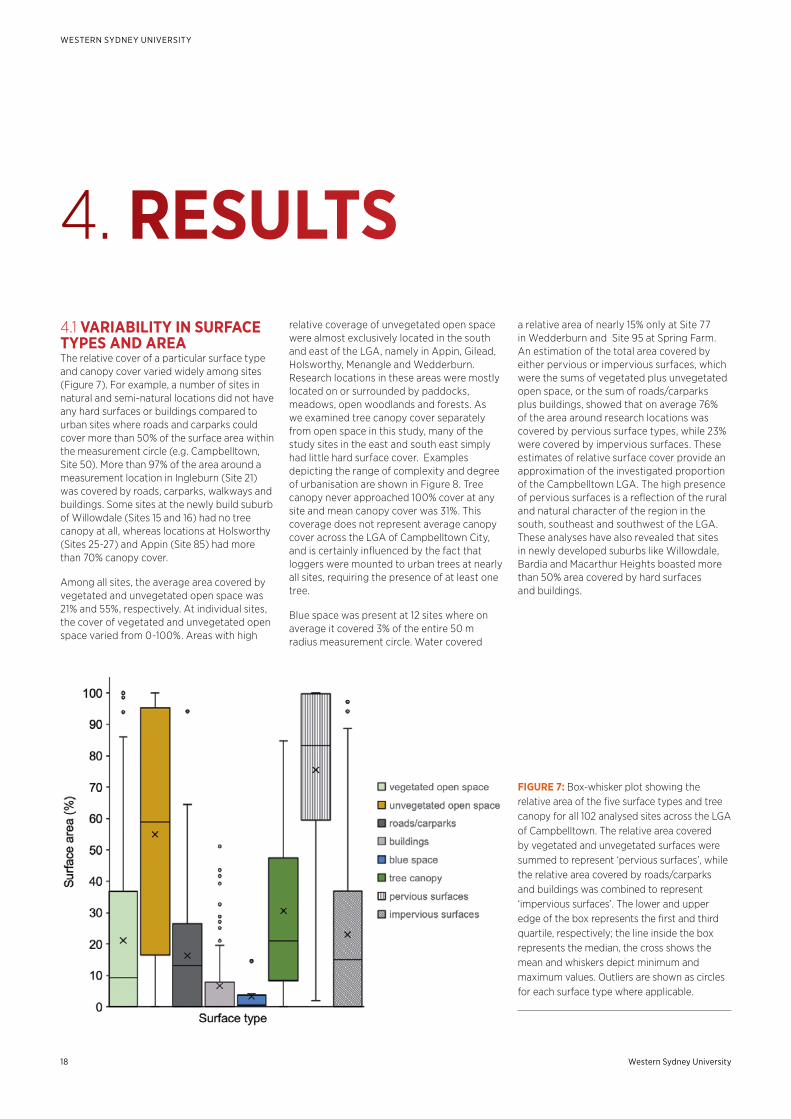
FIGURE 7: Box-whisker plot showing the relative area of the five surface types and tree canopy for all 102 analysed sites across the LGA of Campbelltown. The relative area covered by vegetated and unvegetated surfaces were summed to represent ‘pervious surfaces’, while the relative area covered by roads/carparks and buildings was combined to represent ‘impervious surfaces’. The lower and upper edge of the box represents the first and third quartile, respectively; the line inside the box represents the median, the cross shows the mean and whiskers depict minimum and maximum values. Outliers are shown as circles for each surface type where applicable.
4.1 VARIABILITY IN SURFACE TYPES AND AREAThe relative cover of a particular surface type and canopy cover varied widely among sites (Figure 7). For example, a number of sites in natural and semi-natural locations did not have any hard surfaces or buildings compared to urban sites where roads and carparks could cover more than 50% of the surface area within the measurement circle (e.g. Campbelltown, Site 50). More than 97% of the area around a measurement location in Ingleburn (Site 21) was covered by roads, carparks, walkways and buildings. Some sites at the newly build suburb of Willowdale (Sites 15 and 16) had no tree canopy at all, whereas locations at Holsworthy (Sites 25-27) and Appin (Site 85) had more than 70% canopy cover.
Among all sites, the average area covered by vegetated and unvegetated open space was 21% and 55%, respectively. At individual sites, the cover of vegetated and unvegetated open space varied from 0-100%. Areas with high
relative coverage of unvegetated open space were almost exclusively located in the south and east of the LGA, namely in Appin, Gilead, Holsworthy, Menangle and Wedderburn. Research locations in these areas were mostly located on or surrounded by paddocks, meadows, open woodlands and forests. As we examined tree canopy cover separately from open space in this study, many of the study sites in the east and south east simply had little hard surface cover. Examples depicting the range of complexity and degree of urbanisation are shown in Figure 8. Tree canopy never approached 100% cover at any site and mean canopy cover was 31%. This coverage does not represent average canopy cover across the LGA of Campbelltown City, and is certainly influenced by the fact that loggers were mounted to urban trees at nearly all sites, requiring the presence of at least one tree.
Blue space was present at 12 sites where on average it covered 3% of the entire 50 m radius measurement circle. Water covered
a relative area of nearly 15% only at Site 77 in Wedderburn and Site 95 at Spring Farm. An estimation of the total area covered by either pervious or impervious surfaces, which were the sums of vegetated plus unvegetated open space, or the sum of roads/carparks plus buildings, showed that on average 76% of the area around research locations was covered by pervious surface types, while 23% were covered by impervious surfaces. These estimates of relative surface cover provide an approximation of the investigated proportion of the Campbelltown LGA. The high presence of pervious surfaces is a reflection of the rural and natural character of the region in the south, southeast and southwest of the LGA. These analyses have also revealed that sites in newly developed suburbs like Willowdale, Bardia and Macarthur Heights boasted more than 50% area covered by hard surfaces and buildings.
4. RESULTS
westernsydney.edu.au
SURFACE TYPES AND AIR TEMPERATURE
19
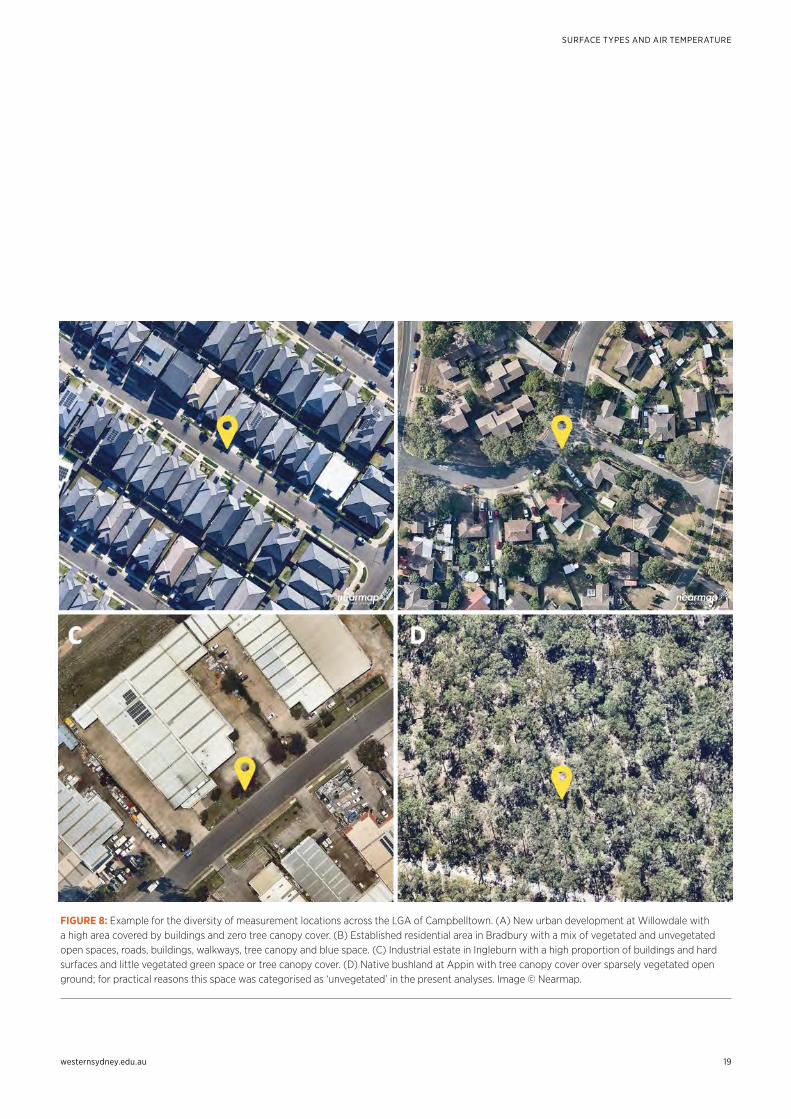
FIGURE 8: Example for the diversity of measurement locations across the LGA of Campbelltown. (A) New urban development at Willowdale with a high area covered by buildings and zero tree canopy cover. (B) Established residential area in Bradbury with a mix of vegetated and unvegetated open spaces, roads, buildings, walkways, tree canopy and blue space. (C) Industrial estate in Ingleburn with a high proportion of buildings and hard surfaces and little vegetated green space or tree canopy cover. (D) Native bushland at Appin with tree canopy cover over sparsely vegetated open ground; for practical reasons this space was categorised as ‘unvegetated’ in the present analyses. Image © Nearmap.
Western Sydney University20
WESTERN SYDNEY UNIVERSITY
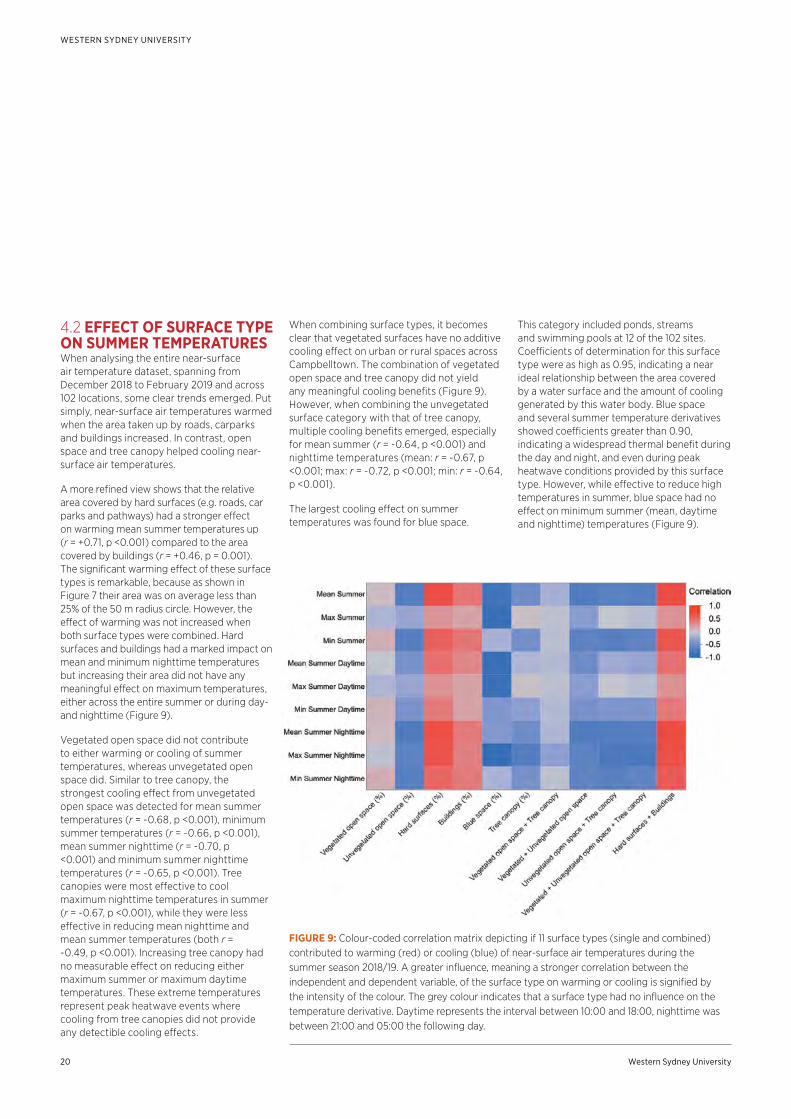
When combining surface types, it becomes clear that vegetated surfaces have no additive cooling effect on urban or rural spaces across Campbelltown. The combination of vegetated open space and tree canopy did not yield any meaningful cooling benefits (Figure 9). However, when combining the unvegetated surface category with that of tree canopy, multiple cooling benefits emerged, especially for mean summer (r = -0.64, p <0.001) and nighttime temperatures (mean: r = -0.67, p <0.001; max: r = -0.72, p <0.001; min: r = -0.64, p <0.001).
The largest cooling effect on summer temperatures was found for blue space.
This category included ponds, streams and swimming pools at 12 of the 102 sites. Coefficients of determination for this surface type were as high as 0.95, indicating a near ideal relationship between the area covered by a water surface and the amount of cooling generated by this water body. Blue space and several summer temperature derivatives showed coefficients greater than 0.90, indicating a widespread thermal benefit during the day and night, and even during peak heatwave conditions provided by this surface type. However, while effective to reduce high temperatures in summer, blue space had no effect on minimum summer (mean, daytime and nighttime) temperatures (Figure 9).
4.2 EFFECT OF SURFACE TYPE ON SUMMER TEMPERATURESWhen analysing the entire near-surface air temperature dataset, spanning from December 2018 to February 2019 and across 102 locations, some clear trends emerged. Put simply, near-surface air temperatures warmed when the area taken up by roads, carparks and buildings increased. In contrast, open space and tree canopy helped cooling near-surface air temperatures.
A more refined view shows that the relative area covered by hard surfaces (e.g. roads, car parks and pathways) had a stronger effect on warming mean summer temperatures up (r = +0.71, p <0.001) compared to the area covered by buildings (r = +0.46, p = 0.001). The significant warming effect of these surface types is remarkable, because as shown in Figure 7 their area was on average less than 25% of the 50 m radius circle. However, the effect of warming was not increased when both surface types were combined. Hard surfaces and buildings had a marked impact on mean and minimum nighttime temperatures but increasing their area did not have any meaningful effect on maximum temperatures, either across the entire summer or during day- and nighttime (Figure 9).
Vegetated open space did not contribute to either warming or cooling of summer temperatures, whereas unvegetated open space did. Similar to tree canopy, the strongest cooling effect from unvegetated open space was detected for mean summer temperatures (r = -0.68, p <0.001), minimum summer temperatures (r = -0.66, p <0.001), mean summer nighttime (r = -0.70, p <0.001) and minimum summer nighttime temperatures (r = -0.65, p <0.001). Tree canopies were most effective to cool maximum nighttime temperatures in summer (r = -0.67, p <0.001), while they were less effective in reducing mean nighttime and mean summer temperatures (both r = -0.49, p <0.001). Increasing tree canopy had no measurable effect on reducing either maximum summer or maximum daytime temperatures. These extreme temperatures represent peak heatwave events where cooling from tree canopies did not provide any detectible cooling effects.
FIGURE 9: Colour-coded correlation matrix depicting if 11 surface types (single and combined) contributed to warming (red) or cooling (blue) of near-surface air temperatures during the summer season 2018/19. A greater influence, meaning a stronger correlation between the independent and dependent variable, of the surface type on warming or cooling is signified by the intensity of the colour. The grey colour indicates that a surface type had no influence on the temperature derivative. Daytime represents the interval between 10:00 and 18:00, nighttime was between 21:00 and 05:00 the following day.
westernsydney.edu.au
SURFACE TYPES AND AIR TEMPERATURE
21
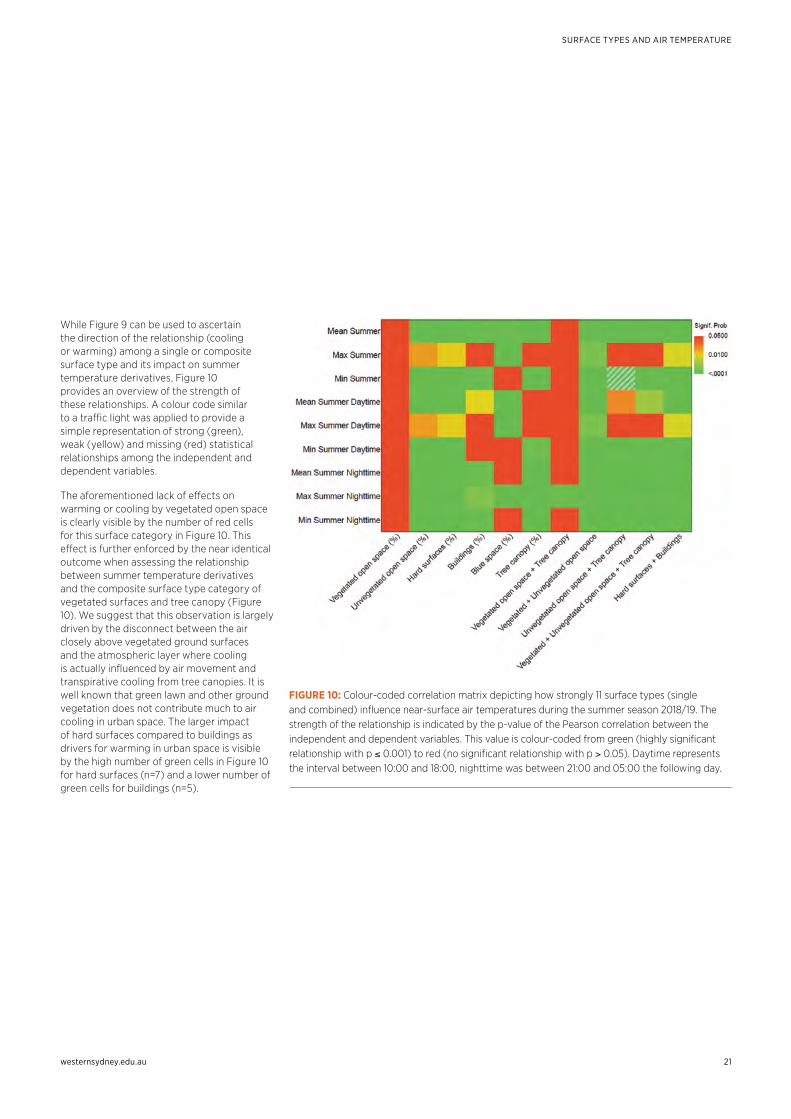
FIGURE 10: Colour-coded correlation matrix depicting how strongly 11 surface types (single and combined) influence near-surface air temperatures during the summer season 2018/19. The strength of the relationship is indicated by the p-value of the Pearson correlation between the independent and dependent variables. This value is colour-coded from green (highly significant relationship with p ≤ 0.001) to red (no significant relationship with p > 0.05). Daytime represents the interval between 10:00 and 18:00, nighttime was between 21:00 and 05:00 the following day.
While Figure 9 can be used to ascertain the direction of the relationship (cooling or warming) among a single or composite surface type and its impact on summer temperature derivatives, Figure 10 provides an overview of the strength of these relationships. A colour code similar to a traffic light was applied to provide a simple representation of strong (green), weak (yellow) and missing (red) statistical relationships among the independent and dependent variables.
The aforementioned lack of effects on warming or cooling by vegetated open space is clearly visible by the number of red cells for this surface category in Figure 10. This effect is further enforced by the near identical outcome when assessing the relationship between summer temperature derivatives and the composite surface type category of vegetated surfaces and tree canopy (Figure 10). We suggest that this observation is largely driven by the disconnect between the air closely above vegetated ground surfaces and the atmospheric layer where cooling is actually influenced by air movement and transpirative cooling from tree canopies. It is well known that green lawn and other ground vegetation does not contribute much to air cooling in urban space. The larger impact of hard surfaces compared to buildings as drivers for warming in urban space is visible by the high number of green cells in Figure 10 for hard surfaces (n=7) and a lower number of green cells for buildings (n=5).
Western Sydney University22
WESTERN SYDNEY UNIVERSITY
area of unvegetated open space resulted in higher warming during the morning, while a larger area of hard surfaces and buildings resulted in lowering the air temperature differentials. The reverse effect was captured for the nighttime interval, where unvegetated open space allowed for fast cooling, while hard surfaces and buildings warmed air temperatures.
The opposite trends of warming and cooling air masses by the different surface types can be explained by the thermal mass contained in the different surface types. Bare soil has a low thermal mass, resulting in fast absorption and release of solar energy. This surface type will heat up quickly during the morning and release stored energy as sensible heat into the surrounding environment, resulting in warming air temperatures. Asphalt, concrete or bricks have a higher thermal mass that takes longer to heat up in the morning, where solar energy is absorbed and not re-radiated into the surrounding environment. Thus, a high cover of these materials results in lower temperature differentials in the morning. However, while the low thermal mass of bare soil means that after sunset this surface type cools down quickly, the materials with high thermal mass will continue to re-radiate stored solar energy whereby they continue to warm the surrounding air during the night. Another textbook example for the origin of Urban Heat Island effects captured by these analyses.
observation that impervious surfaces (hard surfaces and buildings) have a very high impact on warming summer temperatures at night, even though they are representing only a small fraction of surface area. This effect is a textbook illustration of the Urban Heat Island effect at microscale.
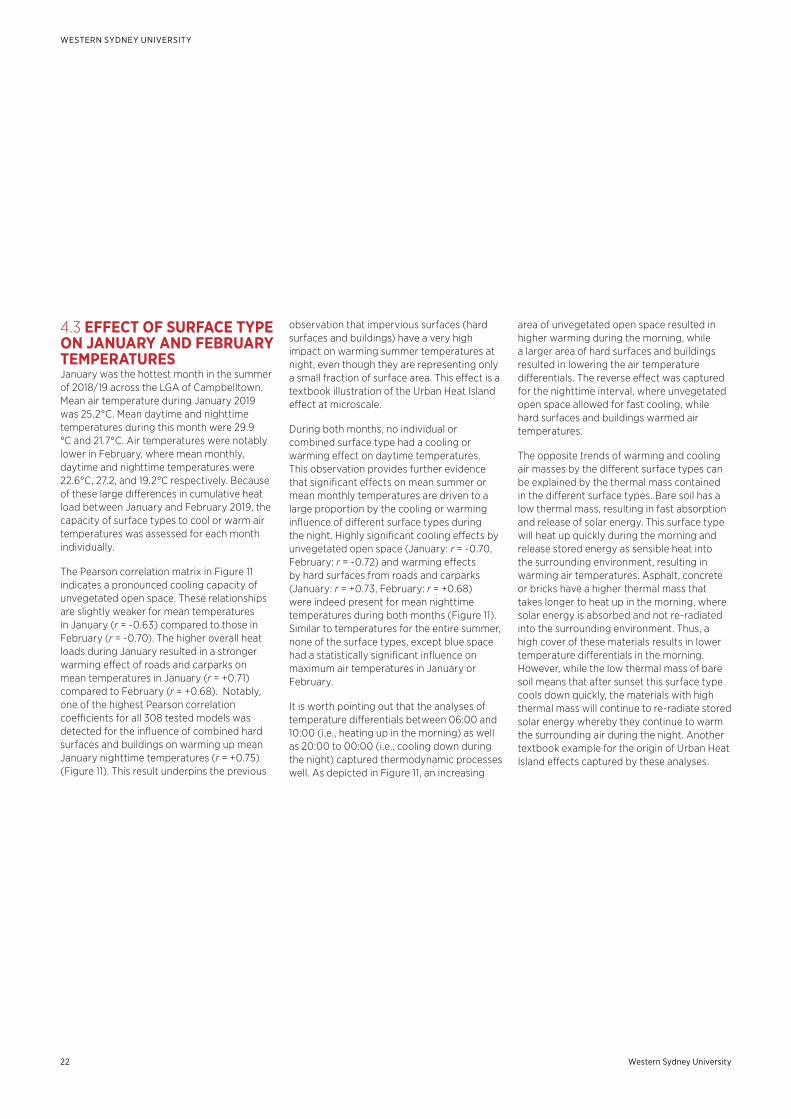
During both months, no individual or combined surface type had a cooling or warming effect on daytime temperatures. This observation provides further evidence that significant effects on mean summer or mean monthly temperatures are driven to a large proportion by the cooling or warming influence of different surface types during the night. Highly significant cooling effects by unvegetated open space (January: r = -0.70, February: r = -0.72) and warming effects by hard surfaces from roads and carparks (January: r = +0.73, February: r = +0.68) were indeed present for mean nighttime temperatures during both months (Figure 11). Similar to temperatures for the entire summer, none of the surface types, except blue space had a statistically significant influence on maximum air temperatures in January or February.
It is worth pointing out that the analyses of temperature differentials between 06:00 and 10:00 (i.e., heating up in the morning) as well as 20:00 to 00:00 (i.e., cooling down during the night) captured thermodynamic processes well. As depicted in Figure 11, an increasing
4.3 EFFECT OF SURFACE TYPE ON JANUARY AND FEBRUARY TEMPERATURESJanuary was the hottest month in the summer of 2018/19 across the LGA of Campbelltown. Mean air temperature during January 2019 was 25.2°C. Mean daytime and nighttime temperatures during this month were 29.9 °C and 21.7°C. Air temperatures were notably lower in February, where mean monthly, daytime and nighttime temperatures were 22.6°C, 27.2, and 19.2°C respectively. Because of these large differences in cumulative heat load between January and February 2019, the capacity of surface types to cool or warm air temperatures was assessed for each month individually.
The Pearson correlation matrix in Figure 11 indicates a pronounced cooling capacity of unvegetated open space. These relationships are slightly weaker for mean temperatures in January (r = -0.63) compared to those in February (r = -0.70). The higher overall heat loads during January resulted in a stronger warming effect of roads and carparks on mean temperatures in January (r = +0.71) compared to February (r = +0.68). Notably, one of the highest Pearson correlation coefficients for all 308 tested models was detected for the influence of combined hard surfaces and buildings on warming up mean January nighttime temperatures (r = +0.75) (Figure 11). This result underpins the previous
westernsydney.edu.au
SURFACE TYPES AND AIR TEMPERATURE
23
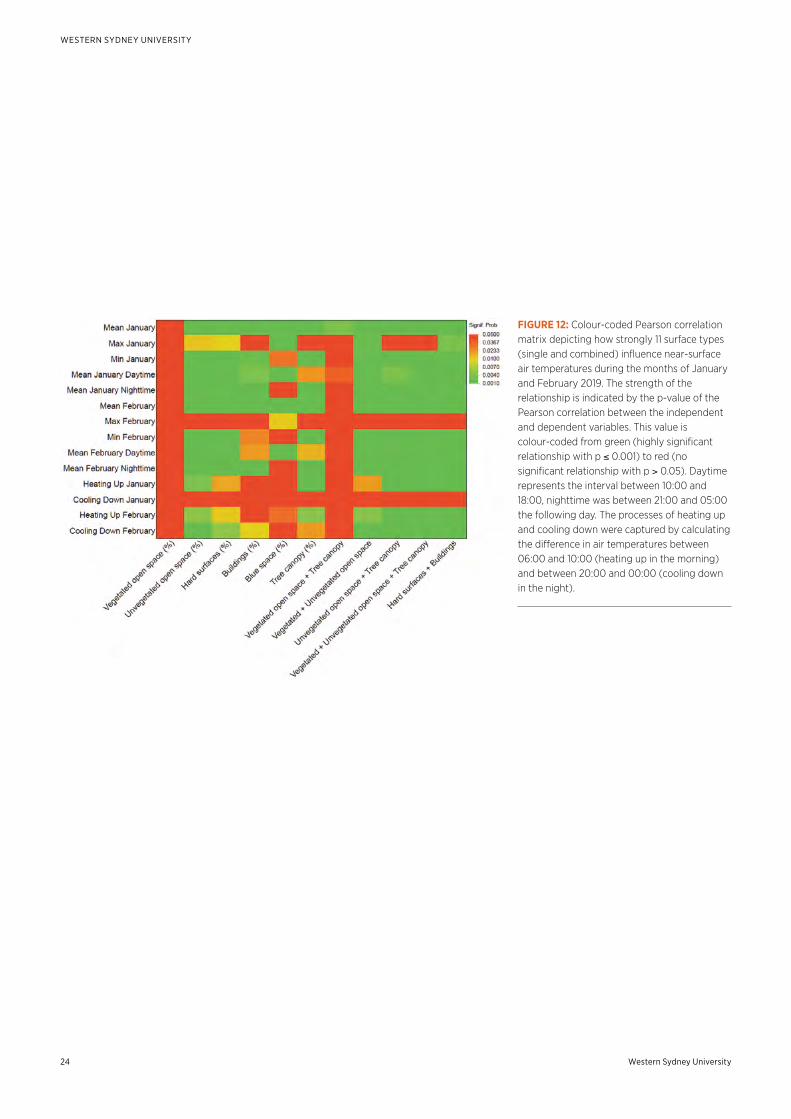
The Pearson correlation coefficients for blue space were relatively high, especially for mean January (r = -0.91) and maximum January (r = -0.94) temperatures (Figure 11). As depicted in Figure 12, both relationships were highly significant, yet must be interpreted with caution due to the relatively low number of sites with blue space (n = 12). In contrast, the cooling capacity of open spaces (vegetated plus non-vegetated) and tree canopy was both strong (as indicated in Figure 11) and highly significant (Figure 12). Nearly all 102 sites were included in these combined categories, providing very high confidence in the cooling capacity of open spaces and tree canopy.
FIGURE 11: Colour-coded correlation matrix depicting if 11 surface types (single and combined) contributed to warming (red) or cooling (blue) of near-surface air temperatures during January and February 2019. A greater influence, meaning a stronger correlation between the independent and dependent variable, of the surface type on warming or cooling is signified by the intensity of the colour. The grey colour indicates that a surface type had no influence on the temperature derivative. Daytime represents the interval between 10:00 and 18:00, nighttime was between 21:00 and 05:00 the following day.
Western Sydney University24
WESTERN SYDNEY UNIVERSITY
FIGURE 12: Colour-coded Pearson correlation matrix depicting how strongly 11 surface types (single and combined) influence near-surface air temperatures during the months of January and February 2019. The strength of the relationship is indicated by the p-value of the Pearson correlation between the independent and dependent variables. This value is colour-coded from green (highly significant relationship with p ≤ 0.001) to red (no significant relationship with p > 0.05). Daytime represents the interval between 10:00 and 18:00, nighttime was between 21:00 and 05:00 the following day. The processes of heating up and cooling down were captured by calculating the difference in air temperatures between 06:00 and 10:00 (heating up in the morning) and between 20:00 and 00:00 (cooling down in the night).
westernsydney.edu.au
SURFACE TYPES AND AIR TEMPERATURE
25
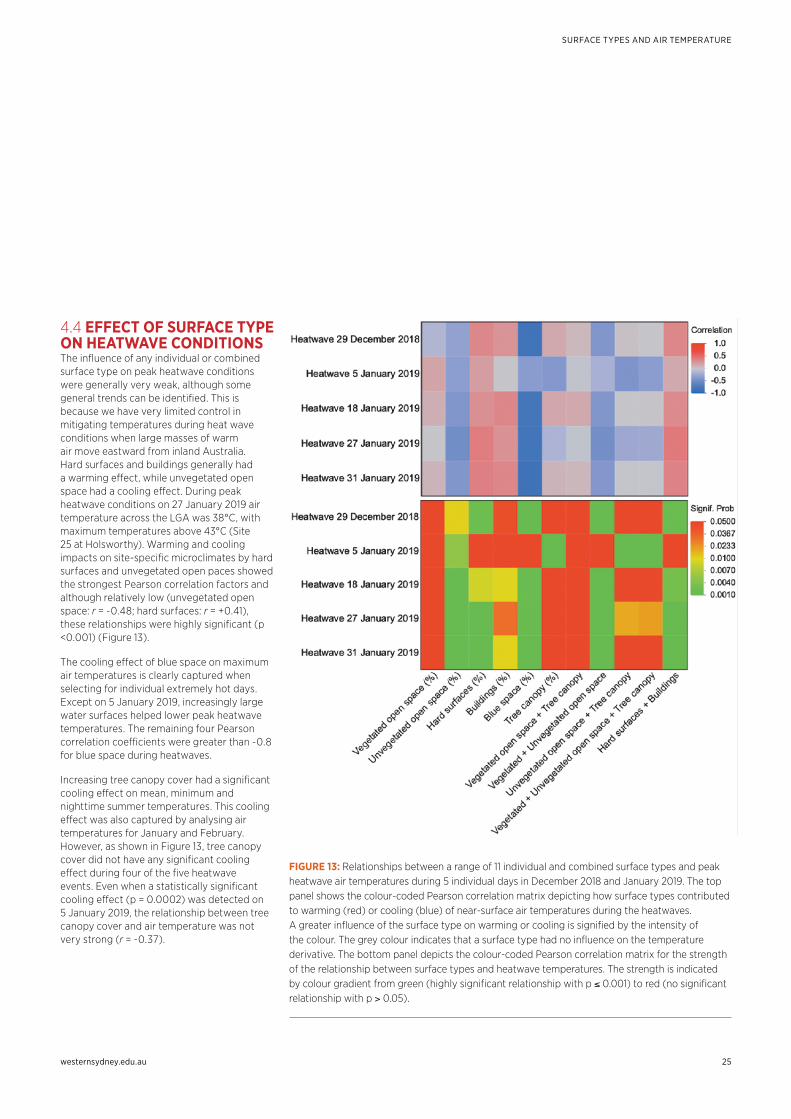
FIGURE 13: Relationships between a range of 11 individual and combined surface types and peak heatwave air temperatures during 5 individual days in December 2018 and January 2019. The top panel shows the colour-coded Pearson correlation matrix depicting how surface types contributed to warming (red) or cooling (blue) of near-surface air temperatures during the heatwaves. A greater influence of the surface type on warming or cooling is signified by the intensity of the colour. The grey colour indicates that a surface type had no influence on the temperature derivative. The bottom panel depicts the colour-coded Pearson correlation matrix for the strength of the relationship between surface types and heatwave temperatures. The strength is indicated by colour gradient from green (highly significant relationship with p ≤ 0.001) to red (no significant relationship with p > 0.05).
4.4 EFFECT OF SURFACE TYPE ON HEATWAVE CONDITIONSThe influence of any individual or combined surface type on peak heatwave conditions were generally very weak, although some general trends can be identified. This is because we have very limited control in mitigating temperatures during heat wave conditions when large masses of warm air move eastward from inland Australia. Hard surfaces and buildings generally had a warming effect, while unvegetated open space had a cooling effect. During peak heatwave conditions on 27 January 2019 air temperature across the LGA was 38°C, with maximum temperatures above 43°C (Site 25 at Holsworthy). Warming and cooling impacts on site-specific microclimates by hard surfaces and unvegetated open paces showed the strongest Pearson correlation factors and although relatively low (unvegetated open space: r = -0.48; hard surfaces: r = +0.41), these relationships were highly significant (p <0.001) (Figure 13).
The cooling effect of blue space on maximum air temperatures is clearly captured when selecting for individual extremely hot days. Except on 5 January 2019, increasingly large water surfaces helped lower peak heatwave temperatures. The remaining four Pearson correlation coefficients were greater than -0.8 for blue space during heatwaves.
Increasing tree canopy cover had a significant cooling effect on mean, minimum and nighttime summer temperatures. This cooling effect was also captured by analysing air temperatures for January and February. However, as shown in Figure 13, tree canopy cover did not have any significant cooling effect during four of the five heatwave events. Even when a statistically significant cooling effect (p = 0.0002) was detected on 5 January 2019, the relationship between tree canopy cover and air temperature was not very strong (r = -0.37).
Western Sydney University26
WESTERN SYDNEY UNIVERSITY
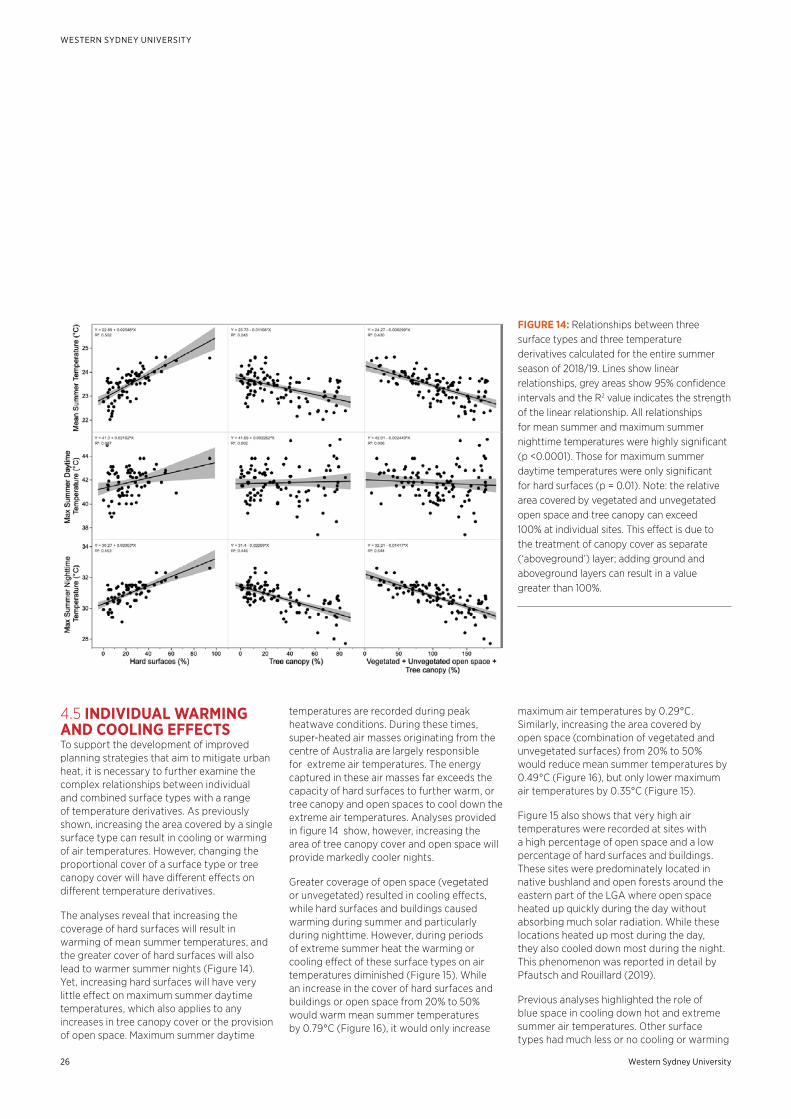
FIGURE 14: Relationships between three surface types and three temperature derivatives calculated for the entire summer season of 2018/19. Lines show linear relationships, grey areas show 95% confidence intervals and the R2 value indicates the strength of the linear relationship. All relationships for mean summer and maximum summer nighttime temperatures were highly significant (p <0.0001). Those for maximum summer daytime temperatures were only significant for hard surfaces (p = 0.01). Note: the relative area covered by vegetated and unvegetated open space and tree canopy can exceed 100% at individual sites. This effect is due to the treatment of canopy cover as separate (‘aboveground’) layer; adding ground and aboveground layers can result in a value greater than 100%.
4.5 INDIVIDUAL WARMING AND COOLING EFFECTS To support the development of improved planning strategies that aim to mitigate urban heat, it is necessary to further examine the complex relationships between individual and combined surface types with a range of temperature derivatives. As previously shown, increasing the area covered by a single surface type can result in cooling or warming of air temperatures. However, changing the proportional cover of a surface type or tree canopy cover will have different effects on different temperature derivatives.
The analyses reveal that increasing the coverage of hard surfaces will result in warming of mean summer temperatures, and the greater cover of hard surfaces will also lead to warmer summer nights (Figure 14). Yet, increasing hard surfaces will have very little effect on maximum summer daytime temperatures, which also applies to any increases in tree canopy cover or the provision of open space. Maximum summer daytime
temperatures are recorded during peak heatwave conditions. During these times, super-heated air masses originating from the centre of Australia are largely responsible for extreme air temperatures. The energy captured in these air masses far exceeds the capacity of hard surfaces to further warm, or tree canopy and open spaces to cool down the extreme air temperatures. Analyses provided in figure 14 show, however, increasing the area of tree canopy cover and open space will provide markedly cooler nights.
Greater coverage of open space (vegetated or unvegetated) resulted in cooling effects, while hard surfaces and buildings caused warming during summer and particularly during nighttime. However, during periods of extreme summer heat the warming or cooling effect of these surface types on air temperatures diminished (Figure 15). While an increase in the cover of hard surfaces and buildings or open space from 20% to 50% would warm mean summer temperatures by 0.79°C (Figure 16), it would only increase
maximum air temperatures by 0.29°C. Similarly, increasing the area covered by open space (combination of vegetated and unvegetated surfaces) from 20% to 50% would reduce mean summer temperatures by 0.49°C (Figure 16), but only lower maximum air temperatures by 0.35°C (Figure 15).
Figure 15 also shows that very high air temperatures were recorded at sites with a high percentage of open space and a low percentage of hard surfaces and buildings. These sites were predominately located in native bushland and open forests around the eastern part of the LGA where open space heated up quickly during the day without absorbing much solar radiation. While these locations heated up most during the day, they also cooled down most during the night. This phenomenon was reported in detail by Pfautsch and Rouillard (2019).
Previous analyses highlighted the role of blue space in cooling down hot and extreme summer air temperatures. Other surface types had much less or no cooling or warming
westernsydney.edu.au
SURFACE TYPES AND AIR TEMPERATURE
27
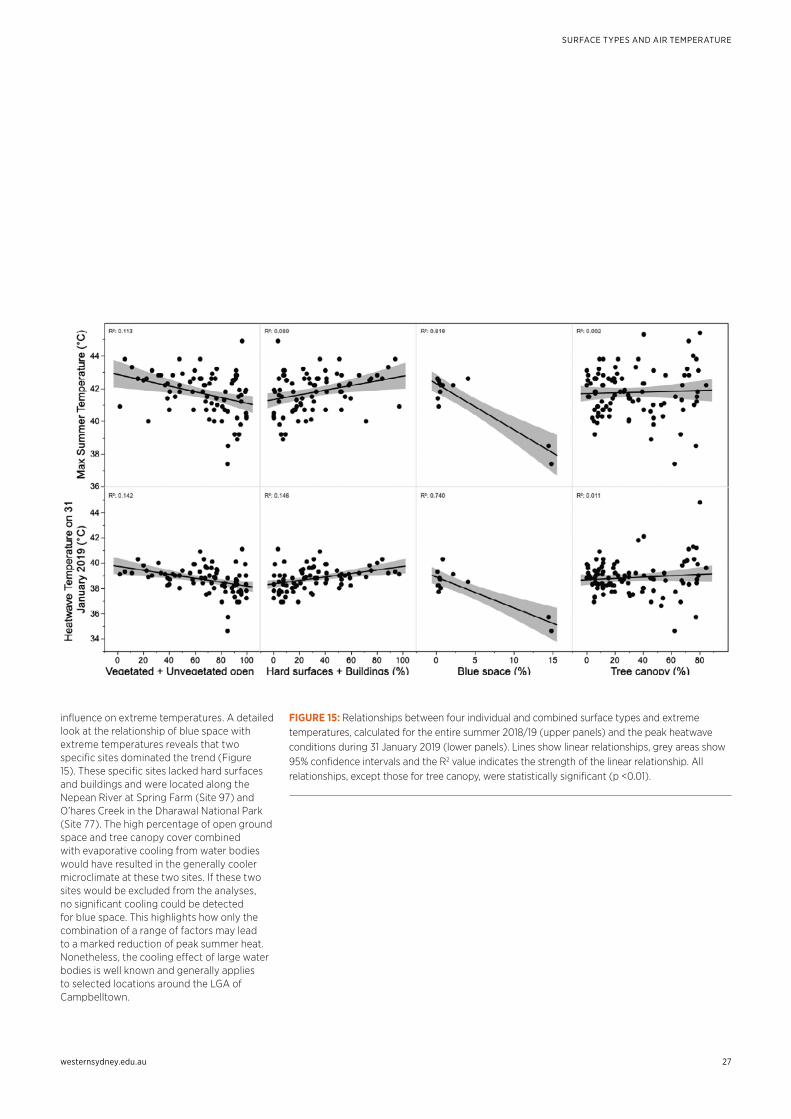
FIGURE 15: Relationships between four individual and combined surface types and extreme temperatures, calculated for the entire summer 2018/19 (upper panels) and the peak heatwave conditions during 31 January 2019 (lower panels). Lines show linear relationships, grey areas show 95% confidence intervals and the R2 value indicates the strength of the linear relationship. All relationships, except those for tree canopy, were statistically significant (p <0.01).
influence on extreme temperatures. A detailed look at the relationship of blue space with extreme temperatures reveals that two specific sites dominated the trend (Figure 15). These specific sites lacked hard surfaces and buildings and were located along the Nepean River at Spring Farm (Site 97) and O’hares Creek in the Dharawal National Park (Site 77). The high percentage of open ground space and tree canopy cover combined with evaporative cooling from water bodies would have resulted in the generally cooler microclimate at these two sites. If these two sites would be excluded from the analyses, no significant cooling could be detected for blue space. This highlights how only the combination of a range of factors may lead to a marked reduction of peak summer heat. Nonetheless, the cooling effect of large water bodies is well known and generally applies to selected locations around the LGA of Campbelltown.
Western Sydney University28
WESTERN SYDNEY UNIVERSITY
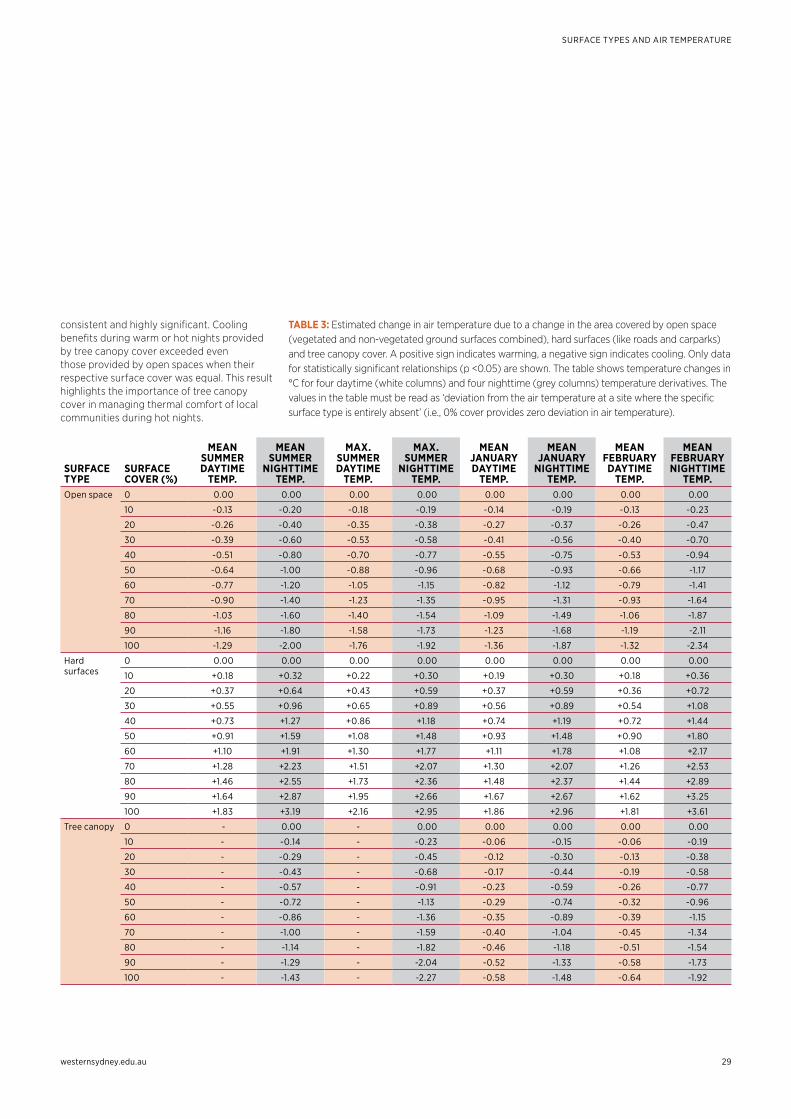
well as to mean daytime and nighttime temperatures calculated for the months of January and February 2019. These relationships demonstrate that increasing either unvegetated or vegetated open space from 10% to 50% cover will lower mean summer daytime temperatures by 0.51°C, and reduce mean summer nighttime temperatures by 0.80°C (Table 3).
Reductions in daytime and nighttime temperature provided by increasing open space were small compared to the increases in air temperatures as a result of expanding the area covered by hard surfaces. When increasing the coverage of hard surfaces from 10% to 40%, mean daytime temperatures during summer will increase 0.73°C and nighttime temperatures go up by 1.27°C (Table 3). Due to the steeper slope and intercept of the regressions for hard surfaces the warming effect of hard surfaces largely exceeded any
cooling benefits of open space at the high end of relative surface cover. This means that at a hypothetical site with equal cover of open space and hard surfaces, temperatures will increase. As a result of the steeper slope and intercept combined with the greater influence of hard surfaces on nighttime warming indicates that effective cooling at sites that contain both surface types can only be achieved once the ratio of open space to hard surfaces is 2:1 or greater.
As mentioned earlier, the impact of daytime cooling by increased tree canopy cover will be relatively small. Analyses of the data indicate that there was no effect of tree canopy on either mean or maximum daytime temperatures and the relationships with daytime temperatures in January and February 2019 were considerably weak. However, the cooling effect through canopy cover on nighttime air temperatures was
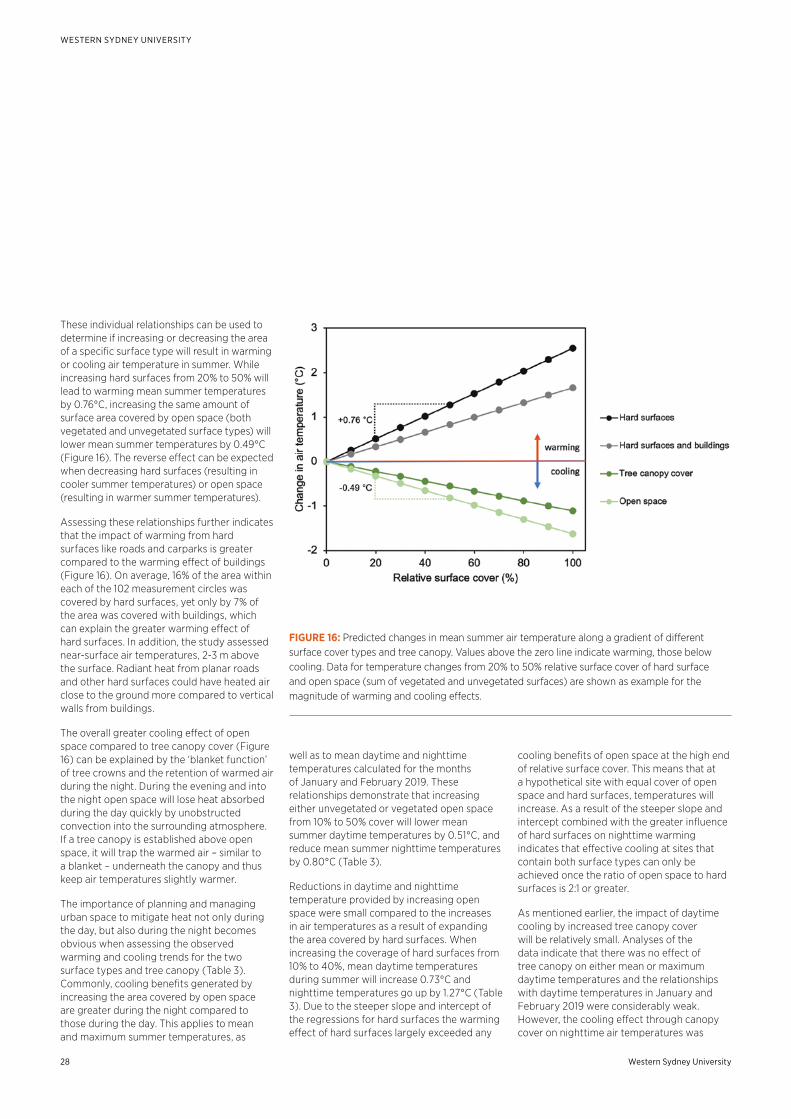
FIGURE 16: Predicted changes in mean summer air temperature along a gradient of different surface cover types and tree canopy. Values above the zero line indicate warming, those below cooling. Data for temperature changes from 20% to 50% relative surface cover of hard surface and open space (sum of vegetated and unvegetated surfaces) are shown as example for the magnitude of warming and cooling effects.
These individual relationships can be used to determine if increasing or decreasing the area of a specific surface type will result in warming or cooling air temperature in summer. While increasing hard surfaces from 20% to 50% will lead to warming mean summer temperatures by 0.76°C, increasing the same amount of surface area covered by open space (both vegetated and unvegetated surface types) will lower mean summer temperatures by 0.49°C (Figure 16). The reverse effect can be expected when decreasing hard surfaces (resulting in cooler summer temperatures) or open space (resulting in warmer summer temperatures).
Assessing these relationships further indicates that the impact of warming from hard surfaces like roads and carparks is greater compared to the warming effect of buildings (Figure 16). On average, 16% of the area within each of the 102 measurement circles was covered by hard surfaces, yet only by 7% of the area was covered with buildings, which can explain the greater warming effect of hard surfaces. In addition, the study assessed near-surface air temperatures, 2-3 m above the surface. Radiant heat from planar roads and other hard surfaces could have heated air close to the ground more compared to vertical walls from buildings.
The overall greater cooling effect of open space compared to tree canopy cover (Figure 16) can be explained by the ‘blanket function’ of tree crowns and the retention of warmed air during the night. During the evening and into the night open space will lose heat absorbed during the day quickly by unobstructed convection into the surrounding atmosphere. If a tree canopy is established above open space, it will trap the warmed air – similar to a blanket – underneath the canopy and thus keep air temperatures slightly warmer.
The importance of planning and managing urban space to mitigate heat not only during the day, but also during the night becomes obvious when assessing the observed warming and cooling trends for the two surface types and tree canopy (Table 3). Commonly, cooling benefits generated by increasing the area covered by open space are greater during the night compared to those during the day. This applies to mean and maximum summer temperatures, as
westernsydney.edu.au
SURFACE TYPES AND AIR TEMPERATURE
29
consistent and highly significant. Cooling benefits during warm or hot nights provided by tree canopy cover exceeded even those provided by open spaces when their respective surface cover was equal. This result highlights the importance of tree canopy cover in managing thermal comfort of local communities during hot nights.
SURFACE TYPE
SURFACE COVER (%)
MEAN SUMMER DAYTIME
TEMP.
MEAN SUMMER
NIGHTTIME TEMP.
MAX. SUMMER DAYTIME
TEMP.
MAX. SUMMER
NIGHTTIME TEMP.
MEAN JANUARY DAYTIME
TEMP.
MEAN JANUARY
NIGHTTIME TEMP.
MEAN FEBRUARY DAYTIME
TEMP.
MEAN FEBRUARY NIGHTTIME
TEMP.Open space 0 0.00 0.00 0.00 0.00 0.00 0.00 0.00 0.00
10 -0.13 -0.20 -0.18 -0.19 -0.14 -0.19 -0.13 -0.23
20 -0.26 -0.40 -0.35 -0.38 -0.27 -0.37 -0.26 -0.47
30 -0.39 -0.60 -0.53 -0.58 -0.41 -0.56 -0.40 -0.70
40 -0.51 -0.80 -0.70 -0.77 -0.55 -0.75 -0.53 -0.94
50 -0.64 -1.00 -0.88 -0.96 -0.68 -0.93 -0.66 -1.17
60 -0.77 -1.20 -1.05 -1.15 -0.82 -1.12 -0.79 -1.41
70 -0.90 -1.40 -1.23 -1.35 -0.95 -1.31 -0.93 -1.64
80 -1.03 -1.60 -1.40 -1.54 -1.09 -1.49 -1.06 -1.87
90 -1.16 -1.80 -1.58 -1.73 -1.23 -1.68 -1.19 -2.11
100 -1.29 -2.00 -1.76 -1.92 -1.36 -1.87 -1.32 -2.34
Hard surfaces
0 0.00 0.00 0.00 0.00 0.00 0.00 0.00 0.00
10 +0.18 +0.32 +0.22 +0.30 +0.19 +0.30 +0.18 +0.36
20 +0.37 +0.64 +0.43 +0.59 +0.37 +0.59 +0.36 +0.72
30 +0.55 +0.96 +0.65 +0.89 +0.56 +0.89 +0.54 +1.08
40 +0.73 +1.27 +0.86 +1.18 +0.74 +1.19 +0.72 +1.44
50 +0.91 +1.59 +1.08 +1.48 +0.93 +1.48 +0.90 +1.80
60 +1.10 +1.91 +1.30 +1.77 +1.11 +1.78 +1.08 +2.17
70 +1.28 +2.23 +1.51 +2.07 +1.30 +2.07 +1.26 +2.53
80 +1.46 +2.55 +1.73 +2.36 +1.48 +2.37 +1.44 +2.89
90 +1.64 +2.87 +1.95 +2.66 +1.67 +2.67 +1.62 +3.25
100 +1.83 +3.19 +2.16 +2.95 +1.86 +2.96 +1.81 +3.61
Tree canopy 0 - 0.00 - 0.00 0.00 0.00 0.00 0.00
10 - -0.14 - -0.23 -0.06 -0.15 -0.06 -0.19
20 - -0.29 - -0.45 -0.12 -0.30 -0.13 -0.38
30 - -0.43 - -0.68 -0.17 -0.44 -0.19 -0.58
40 - -0.57 - -0.91 -0.23 -0.59 -0.26 -0.77
50 - -0.72 - -1.13 -0.29 -0.74 -0.32 -0.96
60 - -0.86 - -1.36 -0.35 -0.89 -0.39 -1.15
70 - -1.00 - -1.59 -0.40 -1.04 -0.45 -1.34
80 - -1.14 - -1.82 -0.46 -1.18 -0.51 -1.54
90 - -1.29 - -2.04 -0.52 -1.33 -0.58 -1.73
100 - -1.43 - -2.27 -0.58 -1.48 -0.64 -1.92
TABLE 3: Estimated change in air temperature due to a change in the area covered by open space (vegetated and non-vegetated ground surfaces combined), hard surfaces (like roads and carparks) and tree canopy cover. A positive sign indicates warming, a negative sign indicates cooling. Only data for statistically significant relationships (p <0.05) are shown. The table shows temperature changes in °C for four daytime (white columns) and four nighttime (grey columns) temperature derivatives. The values in the table must be read as ‘deviation from the air temperature at a site where the specific surface type is entirely absent’ (i.e., 0% cover provides zero deviation in air temperature).
Western Sydney University30
WESTERN SYDNEY UNIVERSITY
frequently compared to suburbs where the proportion of open space and canopy cover is greater. A promising strategy to reduce the cover of hard surfaces and buildings is known as ‘smart density’. It promotes a combination of compact building structure and heat-adverse building design (Middel et al. 2014). When applying the principle findings of the present study, the term can be expanded to ‘heat-smart density’ that will increase resilience of local communities against heat by providing ample space for green and blue infrastructure, while medium- and high-rise buildings are designed to provide maximum shade on hard surfaces and adjacent buildings. Underground carparks would further reduce the area of hard surface that absorbs solar radiation during the day and emits sensible heat during the night.
To reduce the amount of heat contributed by hard surfaces and buildings to urban microclimates, and based on findings of the present report it is recommended that:
1. The area covered by hard surfaces is reduced wherever land use allows a transformation to open, pervious surface
2. Where such a transformation is not possible, strategies to reduce the exposure of hard surfaces to solar radiation are applied (e.g. shading)
3. Where shading of hard surfaces is not possible, strategies to increase the surface albedo (e.g., reflective surface coating) or change the surface material (e.g., replacing dark asphalt with light concrete or crushed/compacted sandstone) are applied
4. The area of new hard surfaces constructed during greenfield development is reduced to the absolute minimum
5. Mandate the implementation of recommendations 2, 3 and 4 for the approval of new greenfield development to mitigate heat from the get-go
5.1 REDUCE WARMINGIn agreement with international research (e.g., Guo et al. 2016, Jenerette et al. 2016, Morabito et al. 2016), the present work clearly identified the warming potential of typical grey urban infrastructure, such as roads, carparks, walkways, driveways and buildings. On average these hard surfaces covered only 23% of the surface space present at the 102 sites, but their impact on warming air temperatures was undeniable. Hard surfaces and buildings were the only two surface categories for which a persistent and significant warming effect on microclimates was detected. Increasing their area will lead to warmer mean and maximum summer air temperatures, with especially pronounced effects on nighttime air temperatures.
The strong warming of nighttime air temperature, as well as the slower heating of air temperatures during the morning at locations where hard surfaces and buildings covered a large proportion of the surface illustrates the well-known Urban Heat Island Effect at microscale. It is well documented that pronounced Urban Heat Island Effects, and especially nighttime heat during heatwave events, lead to increased hospital admissions and rising mortality rates (e.g., Åström et al. 2011, Zhang et al. 2012). Hence, strategies that aim at reducing nighttime heat have a positive effect on local communities, where those most vulnerable to heat will experience the greatest benefits (Harlan et al., 2006). This group includes the elderly, very young children, immobile and chronically sick people and those that do not have the financial means to pay for air conditioning.
Suburbs developed in the past decade across in the western part of the Campbelltown LGA and other regions in Western Sydney have an alarmingly low cover of open space and green infrastructure but a high cover of hard surfaces and buildings. Data presented here evidences that this type of suburban development will leave local communities exposed to high and extreme heat loads more
This research project assessed if and how different surface types and also tree canopy cover influence air temperatures across the LGA of Campbelltown City in the summer of 2018/19. More than 1.2 million measurements of near-surface air temperature were used to investigate microclimate effects at 102 sites. General climate trends and distinctive heat-related patterns across these sites were described in an earlier report (Pfautsch and Rouillard 2019).
5. RECOMMENDATIONS
westernsydney.edu.au
SURFACE TYPES AND AIR TEMPERATURE
31
Pacific Oceans. These systems are immune to the potential impact of artificial water bodies in Western Sydney.
As suggested by the Sydney Water Corporation (2017), other techniques and technologies that involve water for cooling seem more feasible. These include implementing water-based technologies into local planning and enforce water sensitive urban design in Development Control Plans (DCPs) and Local Environmental Plans (LEPs). Further, construction of small-scale water bodies and protection and revitalisation of existing local creek lines can become mandatory elements for the approval of greenfield development. Responsible and progressive urban planning and assessments of environmental impacts should have a strong emphasis on protecting and recycling local water sources with the goal to provide water for a range of local cooling strategies.
5.4 REGULATING URBAN TEMPERATURES WITH TREE CANOPYAnalyses presented here document a weak cooling capacity of tree canopies. Tree canopy cover did not reduce mean summer or maximum daytime air temperatures. However, significant cooling was provided by tree canopy cover during the night. At the same time, the analyses also documented a ‘blanket effect’ of tree canopies that traps warm air during the night. Both processes are not in conflict with each other and can be explained by differences in effect size.
Mixing of air during the day will result in very similar air temperatures underneath trees compared to surrounding unshaded space. The mixing effect explains why expanding tree canopy cover generates little cooling benefits on air temperatures during the day. However, canopy shade reduces the amount of heat absorbed by surfaces during the day, which in turn will result in cooler air temperatures at the beginning of the night and less emission of heat during the night. This effect is relatively large in size and it is at night when the cooling benefits of canopy shade become apparent. A smaller residual effect of tree canopy cover trapping warm air during the night remains,
Based on the omnipresent cooling capacity of open spaces in summer, it is recommended that:1. Open space is retained wherever possible
2. Unused or obsolete areas covered by hard surfaces are transformed to open space
3. Additional tree plantings in open space are concentrated to the edges of the area, where additional thermal benefits can be generated by shading adjoining hard surfaces like roads, walkways and carparks
4. Policies are developed that mandate the minimum proportion of 2:1 for open space and hard surfaces in greenfield development
5.3 THE ROLE OF BLUE SPACEAlthough the capacity of blue space to cool urban microclimates has been documented in other research reports (e.g., Sun et al. 2012, Sun and Chen 2012, Hongyu et al. 2016), including for Western Sydney (Sydney Water Corporation 2017), care must be taken when interpreting the results around blue space in this report. The strong cooling capacity of water bodies was driven by two locations out of a total of 12. Both locations were near large water bodies that represent an exception, rather than a common feature in the southwestern part of the Sydney Basin.
Enhancing the cooling benefits of blue space in the area of Campbelltown would require the constructions of large artificial water bodies. The chance to realise such infrastructure projects seems very low for a number of reasons. First, capital investment to acquire the necessary land may be cost prohibitive. Second, the amount of water necessary to fill and maintain large artificial water bodies may not be available. Third, environmental conditions that precede extreme heat and heatwaves are prolonged periods of low rainfall and hot surface soils, which would put pressure on artificial water bodies through high rates of evaporation and the lack of recharge. And fourth, heatwaves that impact Western Sydney have their origin in central Australia. Synoptic patterns over this vast landmass depend on conditions generated by climate systems over the Arctic, Indian and
5.2 INCREASE COOLINGIn contrast to the warming effect of hard surfaces and buildings, a ubiquitous cooling benefit was documented especially for unvegetated open space. However, the contribution to cooling differed markedly if a surface was covered by vegetation or not. The separate analyses of thermal benefits from these surface types revealed that relatively bare surfaces provided far greater cooling benefits compared to surfaces covered with green lawns and other ground vegetation. This seems counterintuitive and requires further assessment.
For the present work, aerial images were used to classify and measure surface types at each site. High resolution imagery was available for late December 2018 and late March 2019. Both dates were outside the core research interval of January and February. While imagery from December shows widespread green cover of open spaces, the March imagery shows that the same surfaces in yellow and brown colours, indicating that ground cover vegetation had suffered from the hot and dry conditions starting in late December (i.e., Boxing Day heatwave 2018). These conditions lasted until the beginning of March. The March image was used for the present analyses, because ground vegetation in this image was more representative for dry, hot summer conditions. This will inevitably have resulted in assigning the ‘unvegetated surface’ category to many grassed or otherwise vegetated areas.
Analyses are provided for both individual surface types and in most cases also for their combined effect on near-surface air temperatures (or in combination with tree canopy). These analyses show outright cooling benefits of what was termed ‘open space’ throughout the present report. Open space was shown to reduce mean and maximum summer temperatures and also help cool down daytime and nighttime temperatures. Open space also helped in cooling down these temperatures more compared to tree canopy cover. This result underlines the importance of retaining non-treed open space in urban landscapes, as these spaces maximise cooling benefits during the night where stored surface heat can escape unobstructed into the lower atmosphere.
5. RECOMMENDATIONS
Western Sydney University32
WESTERN SYDNEY UNIVERSITY
5.5 LOW CAPACITY TO REDUCE HEATWAVE TEMPERATURESLastly, the present work provides evidence that the capacity to lower peak heatwave temperatures by modifying the configuration of urban surface area and tree canopy cover is very limited. Expanding the area of tree canopy did not result in a systematic cooling effect and was shown to be ineffective during four of five days where air temperatures at many of the 102 locations were above 40°C. Cooling benefits during extreme heat were only provided by blue space. The cooling capacity of large water bodies has been demonstrated in modelling studies. However, constructing large artificial water bodies, designed to lower peak heatwave temperatures is not practical for a number of reasons described above.
Recent climate predictions for south-eastern Australia point towards increasing summer heat and more frequent, lasting and extreme heatwaves. It is recommended that other means are developed to protect local populations and economies from peak heatwave conditions. These means should include Heat Emergency Plans that detail trigger points, and mechanisms to provide respite to the community (Zhang et al. 2012). While such plans represent a vital strategy to cope with increasing risks of extreme heat, they are beyond the scope of the present work.
signified by the greater cooling effect of open space where canopy cover is low or absent (see Figure 16). This clarifies how tree canopy cover provides both, a larger cooling effect by shading urban space during the day that keeps nighttime air temperatures lower due to reduced emission of stored heat and a smaller warming effect through trapping warm air at night.
Based on the findings of the present work and other published research it is recommended to:1. Tighten existing guidelines and policies to
slow current rates of loss of mature urban trees that provide the largest cooling benefits through surface shading
2. Tree removal permits become mandatory when removing any trees
3. Focus active management on existing younger trees to support crown development and canopy expansion
4. Introduce and maintain additional trees into urban space, especially where these trees will shade hard surfaces
5. Move tree plantings towards the edges of open space that can provide valuable nighttime cooling (and tree canopy cover would trap warm air)
The present work has also highlighted that the cooling effect of open space is greater compared to that of tree canopies, providing an incentive to look elsewhere for cooling opportunities that unlike tree crowns do not require years or decades to unfold their potential to mitigate urban heat (e.g., green trellises, artificial shade structures). Still, urban trees deliver many benefits other than cooling, which makes them the most valuable urban green infrastructure asset in urban landscapes.
westernsydney.edu.au
SURFACE TYPES AND AIR TEMPERATURE
33
Western Sydney University34
WESTERN SYDNEY UNIVERSITY
Many options are available to plan and develop the cities and towns of tomorrow. Based on the present analyses, ‘heat-smart density’ seems a promising candidate for Western Sydney. In this fast-growing region of the Sydney Basin, development needs to provide homes for many thousands of new residents. At the same time the required buildings must be less dependent on electricity to provide thermal comfort for their residents and the suburban spaces must be better designed to help local communities to thrive.
The time to build these settlements is now. This report helps to do it.
Here, estimates of cooling and warming of microclimates in urban space were calculated based on the relative cover of five common surface types and tree canopy cover. These estimates can be used to develop improved policy and planning frameworks that incorporate the thermal effects of surface cover on urban microclimates.
In the past decade, heat-smart urban design was largely ignored across Western Sydney. Yet, heat-smart urban design is becoming increasingly important to mitigate the effects of warming summers.
6. CONCLUSION
westernsydney.edu.au
SURFACE TYPES AND AIR TEMPERATURE
35
Environmental Hazards 6, 39-49.
Song J., Du S., Feng X., Guo L. (2014) The relationships between landscape compositions and land surface temperature: quantifying their resolution sensitivity with spatial regression models. Landscape and Urban Planning 123, 145-157.
Sun R.H., Chen A.L., Chen D.L., Lu Y.H. (2012) Cooling effects of wetlands in an urban region: the case of Beijing. Ecological Indicators 20, 57-64.
Sun R.H., Chen L.D. (2012) How can urban water bodies be designed for climate adaptation? Landscape and Urban Planning 105, 27-33.
Sydney Water Corporation (2017) Cooling Western Sydney – a strategic study on the role of water in mitigating urban heat in Western Sydney. Sydney Water Corporation, 24 p.
Wang Y., Berardi U., Akbari, H. (2016a) Comparing the effects of urban heat island mitigation strategies for Toronto, Canada. Energy and Buildings 114, 2-19.
Wang J., Qinming Z., Guo H., Jin Z. (2016b) Characterizing the spatial dynalics of land surface temperature-impervious surface fraction relationship. International Journal of Applied Observation and Geoinformation 45, 55-65.
Ward K., Lauf S., Kleinschmit B., Endlicher W. (2016) Heat waves and urban heat islands in Europe: A review of relevant drivers. Science of the Total Environment 569-570, 527-539.
Zhang K., Rood R.B., Michailidis G., Oswald E.M., Schwartz J.D., Zanobetti A., Ebi K.L., O’Neill M.S. (2012) Comparing exposure metrics for classifying ‘dangerous heat’ in heat wave and health warning systems. Environment International 46, 23-29.
Zhao, L., Lee, X., Smith, R.B., Oleson, K., 2014. Strong contributions of local background climate to urban heat islands. Nature 511, 216–219.
Ziter, C.D., Pedersen, E.J., Kucharik, C.J., Turner, M.G., 2019. Scale-dependent interactions between tree canopy cover and impervious surfaces reduce daytime urban heat during summer. Proceedings of the National Academy of Science of the United States 116, 7575–7580.
impacts on pedestrian-level climate. Urban Climate 32, 100590.
Lowe S.A. (2016) An energy and mortality impact assessment of the urban heat island in the US. Environmental Impact Assessments 56, 139-144.
Middel A., Häb K., Brazel A.J., Martin C.A., Guhathakurta S. (2014) Impact of urban form and design on mid-afternoon microclimate in Phoenix Local Climate Zones. Landscape and Urban Planning 122, 16-28.
Morabito M., Crisci A., Gioli B., Gualtieri G., Toscano P., Di Stefano V., Orlandini S., Gensini, G.F. (2015) Urban-hazard risk analysis: mapping of heat-related risks in the elderly in major Italian cities. PLoS One 10, e0127277.
Morabito M., Crisci A., Messeri A., Orlandini S., Raschi A., Maracchi G., Munafò M. (2016) The impact of built-up surfaces on land surface temperatures in Italian urban areas. Science of the Total Environment 551-552, 317-326.
Oke T., 1973. City size and the urban heat island. Atmosphere and Environment 1967, 769-779.
Pfautsch, S., Rouillard, S. 2019. Benchmarking heat across Campbelltown, New South Wales. Western Sydney University, 60p.
Roth M., Chow W.T.L. (2012) A historical review and assessment of urban heat island research in Singapore. Singapore Journal of Tropical Geography 33, 381-397
Santamouris M. (2015) Analyzing the heat island magnitude and characteristics in one hundred Asian and Australian cities and regions. Science of the Total Environment 512-513, 582-598.
Schwarz N., Schlink U., Franck U., Großmann K. (2012) Relationship of land surface and air temperatures and its implications for quantifying urban heat island indicators – an application for the city of Leipzig (Germany). Ecological Indicators 18, 693-704.
Skelhorn C., Lindley S., Levermore G. (2014) The impact of vegetation types on air and surface temperatures in a temperate city: a final scale assessment in Manchester, UK. Landscape and Urban Planning 121, 129-140.
Solecki W.D., Rosenzweig C., Parshall L., Pope G., Clark M., Cox J., Wiencke M. (2011) Mitigation of the heat island effect in urban New Jersey.
Åström D.O., Forsberg B., Rocklöv J. (2011) Heat wave impact on morbidity and mortality in the elderly population: a review of recent studies. Maturitas 69, 99-105.
Coutts A.M., Beringer J., Tapper, N.J. (2007) Impact of increasing urban density on local climate: spatial and temporal variations in the surface energy balance in Melbourne, Australia. Journal of Applied Meteorology and Climatology 46, 477-493.
Duncan J.M.A., Boruff B., Saunders A., Sun Q., Hurley J., Amati M. (2019) Turning down the heat: an enhanced understanding of the relationship between urban vegetation and surface temperature at the city scale. Science of the Total Environment 656, 118-128.
Estoque R.C., Murayama Y., Myint S.W. (2017) Effects of landscape composition and pattern on land surface temperature: an urban heat island study in the megacities of Southeast Asia. Science of the Total Environment 577, 349-359.
European Commission (2012) Guidelines on best practice to limit, mitigate or compensate soil sealing. European Commission, Brussels.
Guo G., Zhuo X., Wu Z., Xiao R., Chen Y. (2016) Characterizing the impact of urban morphology heterogeneity on land surface temperature in Guangzhou, China. Environmental Modelling and Software 84, 427-439.
Harlan S.L., Brazel A.J., Prashad L., Stefanov W.L., Larsen L. (2006) Neighborhood microclimates and vulnerability to heat stress. Social Science and Medicine 63, 2847-2863.
Hung T., Daisuke U., Shiro O., Yoshifumi, Y. (2006) Assessment with satellite data of the urban heat island effects in Asian mega cities. International Journal of Applied Earth Observations 8, 34-48.
Jenerette G.D., Harlan S.L., Buyantuev A., Stefanov W.L., Decelt-Barreto J., Ruddell B.L., Myint S.W., Kaplan S., Li X. (2016) Micro-scale urban surface temperatures are related to land-cover features and residential heat related health impacts in Phoenix, AZ USA. Landscape Ecology 31, 745-760.
Krayenhoff, E.S., JKiang T., Christen A., Martilli A., Oke T.R., Bailey B.N., Nazarin N., Voogt J.A., Giometto M.G., Stastyn A., Crawford B.A. (2020) A multi-layer urban canopy meteorological model with trees (BEP-Street): Street tree
7. REFERENCES
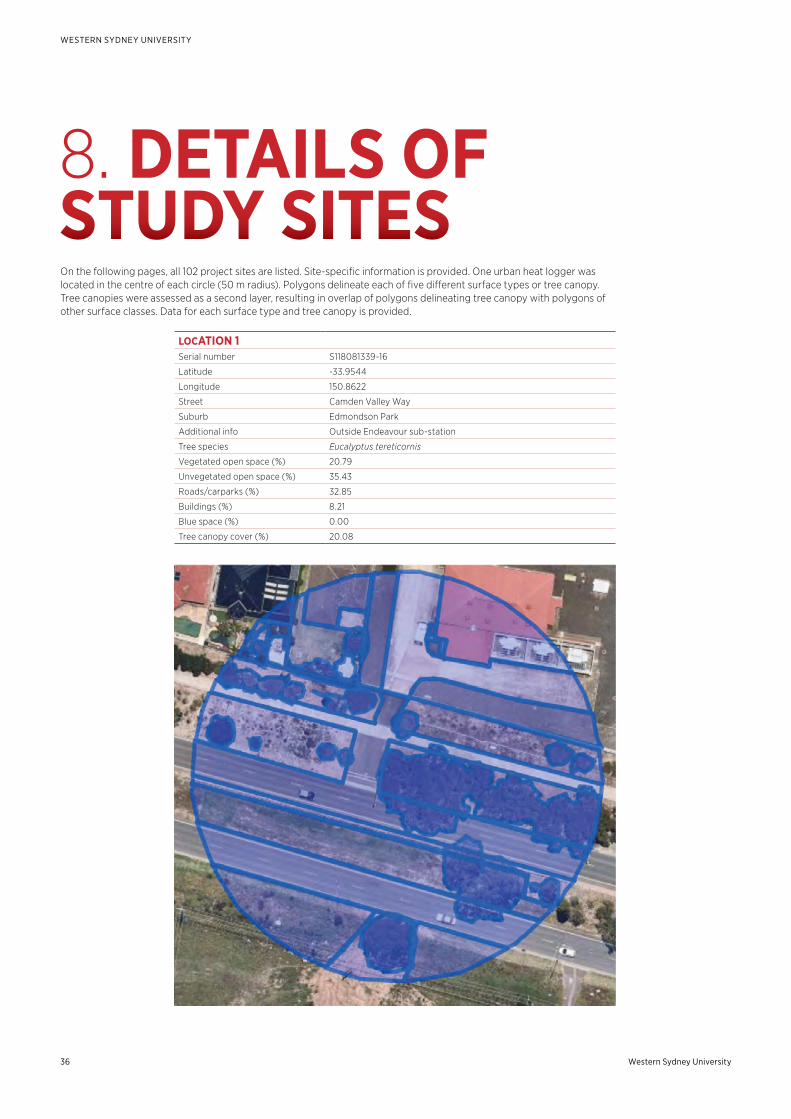
Western Sydney University36
WESTERN SYDNEY UNIVERSITY
On the following pages, all 102 project sites are listed. Site-specific information is provided. One urban heat logger was located in the centre of each circle (50 m radius). Polygons delineate each of five different surface types or tree canopy. Tree canopies were assessed as a second layer, resulting in overlap of polygons delineating tree canopy with polygons of other surface classes. Data for each surface type and tree canopy is provided.
8. DETAILS OF STUDY SITES
LOCATION 1Serial number S118081339-16
Latitude -33.9544
Longitude 150.8622
Street Camden Valley Way
Suburb Edmondson Park
Additional info Outside Endeavour sub-station
Tree species Eucalyptus tereticornis
Vegetated open space (%) 20.79
Unvegetated open space (%) 35.43
Roads/carparks (%) 32.85
Buildings (%) 8.21
Blue space (%) 0.00
Tree canopy cover (%) 20.08
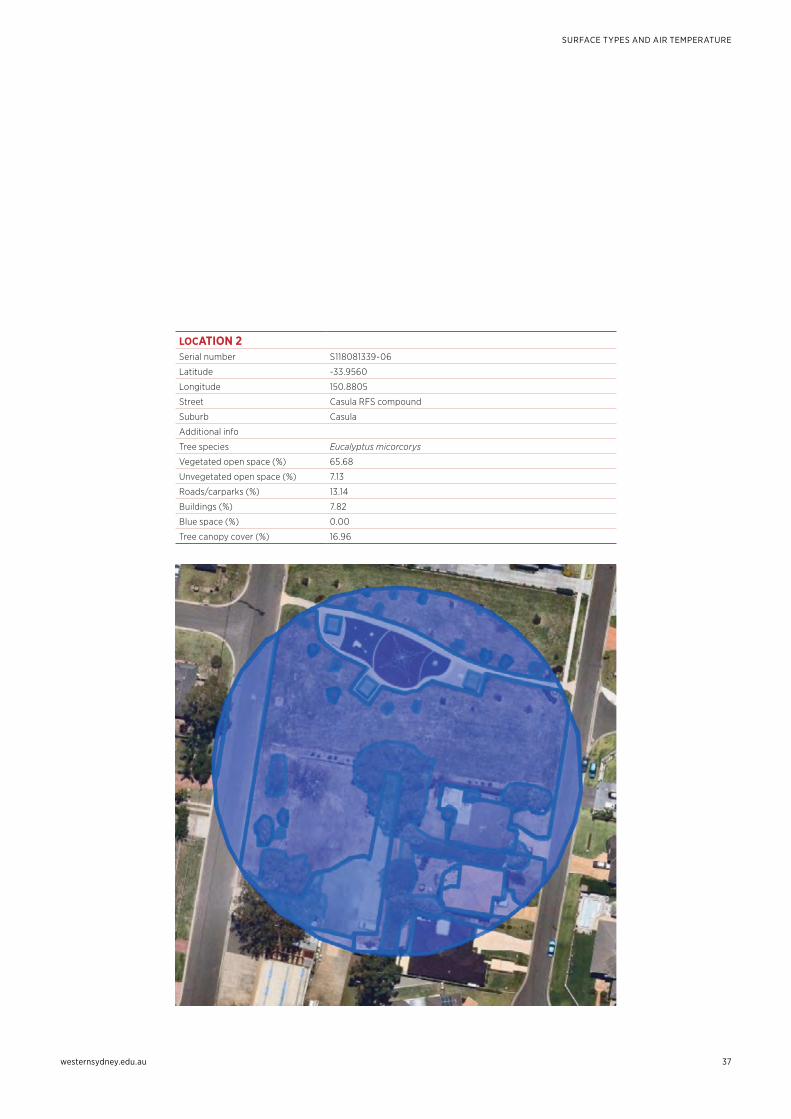
westernsydney.edu.au
SURFACE TYPES AND AIR TEMPERATURE
37
LOCATION 2Serial number S118081339-06
Latitude -33.9560
Longitude 150.8805
Street Casula RFS compound
Suburb Casula
Additional info
Tree species Eucalyptus micorcorys
Vegetated open space (%) 65.68
Unvegetated open space (%) 7.13
Roads/carparks (%) 13.14
Buildings (%) 7.82
Blue space (%) 0.00
Tree canopy cover (%) 16.96
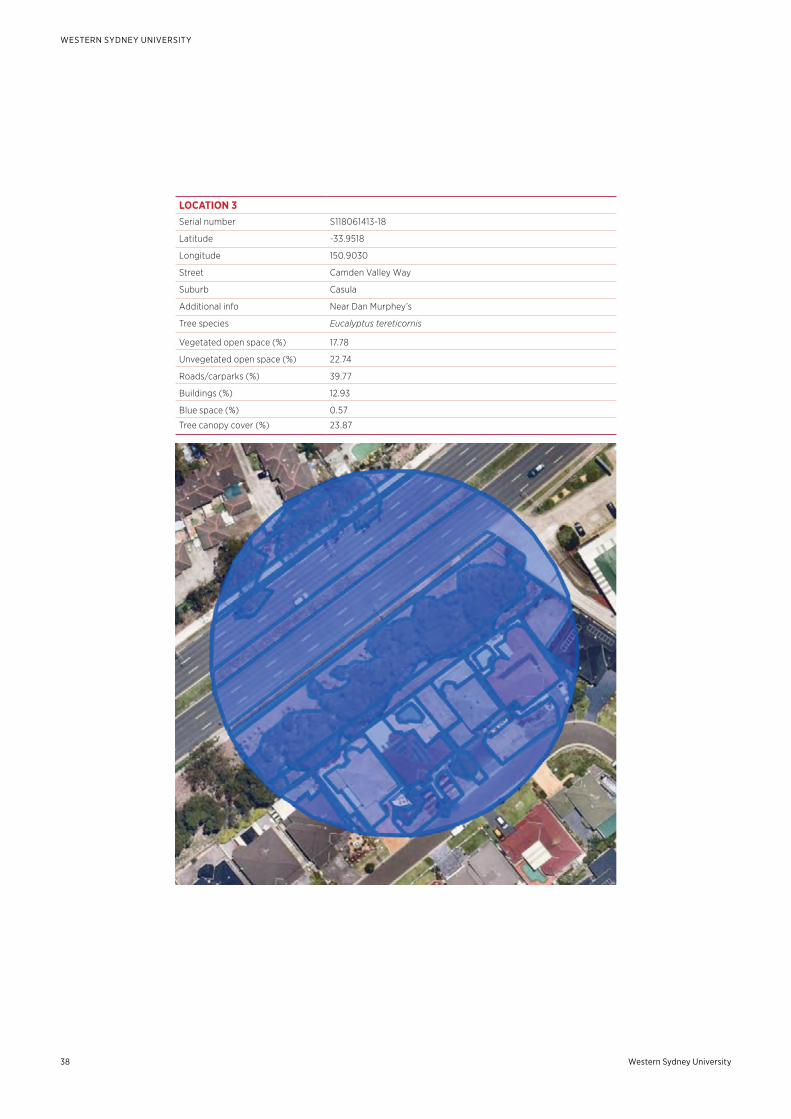
Western Sydney University38
WESTERN SYDNEY UNIVERSITY
LOCATION 3Serial number S118061413-18
Latitude -33.9518
Longitude 150.9030
Street Camden Valley Way
Suburb Casula
Additional info Near Dan Murphey’s
Tree species Eucalyptus tereticornis
Vegetated open space (%) 17.78
Unvegetated open space (%) 22.74
Roads/carparks (%) 39.77
Buildings (%) 12.93
Blue space (%) 0.57
Tree canopy cover (%) 23.87
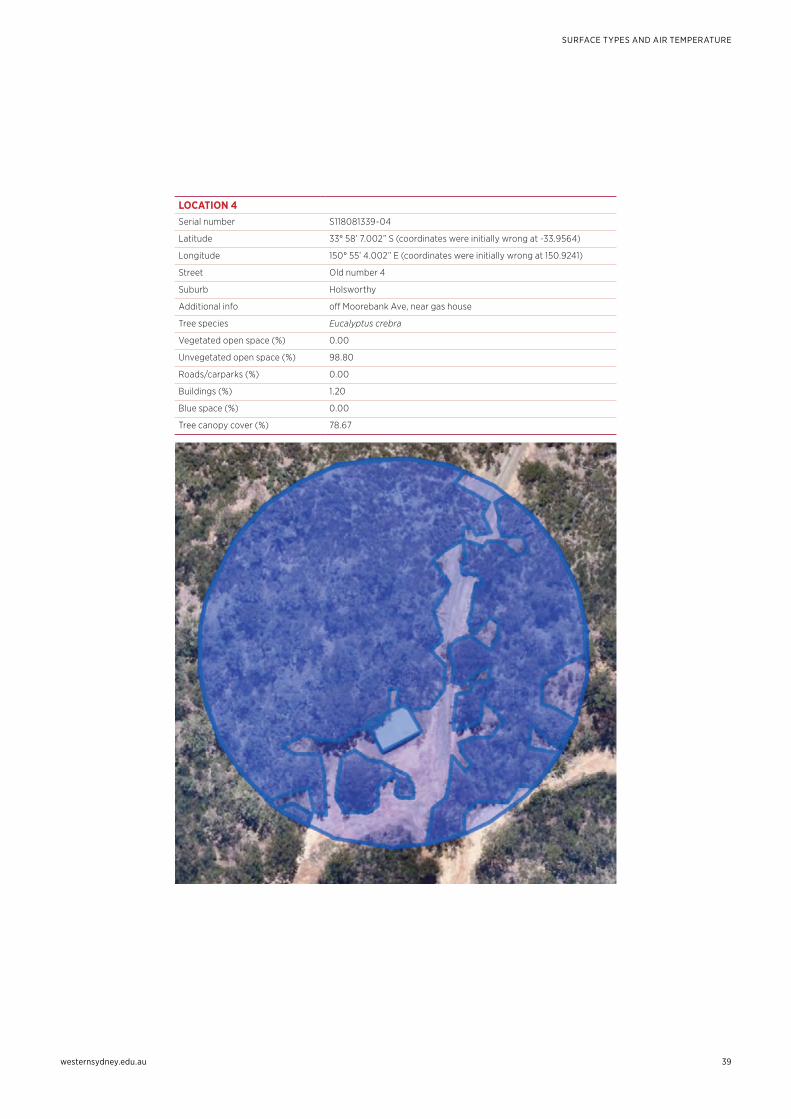
westernsydney.edu.au
SURFACE TYPES AND AIR TEMPERATURE
39
LOCATION 4Serial number S118081339-04
Latitude 33° 58’ 7.002” S (coordinates were initially wrong at -33.9564)
Longitude 150° 55’ 4.002” E (coordinates were initially wrong at 150.9241)
Street Old number 4
Suburb Holsworthy
Additional info off Moorebank Ave, near gas house
Tree species Eucalyptus crebra
Vegetated open space (%) 0.00
Unvegetated open space (%) 98.80
Roads/carparks (%) 0.00
Buildings (%) 1.20
Blue space (%) 0.00
Tree canopy cover (%) 78.67
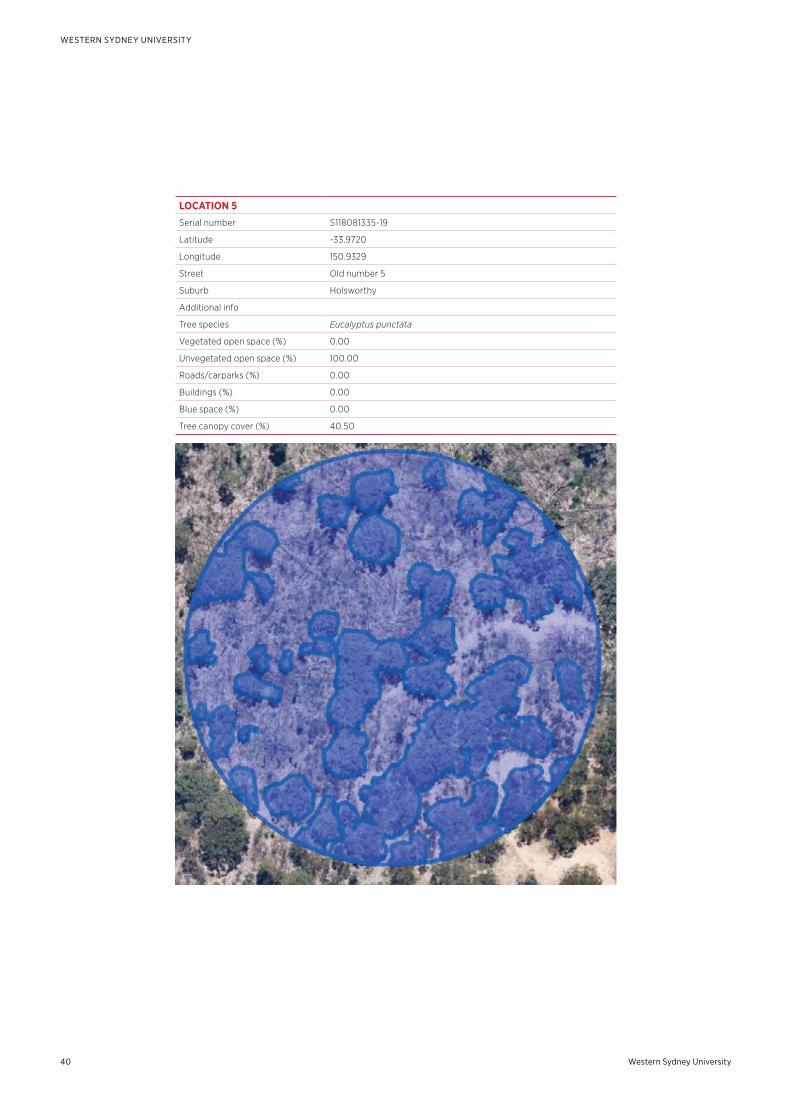
Western Sydney University40
WESTERN SYDNEY UNIVERSITY
LOCATION 5 Serial number S118081335-19
Latitude -33.9720
Longitude 150.9329
Street Old number 5
Suburb Holsworthy
Additional info
Tree species Eucalyptus punctata
Vegetated open space (%) 0.00
Unvegetated open space (%) 100.00
Roads/carparks (%) 0.00
Buildings (%) 0.00
Blue space (%) 0.00
Tree canopy cover (%) 40.50
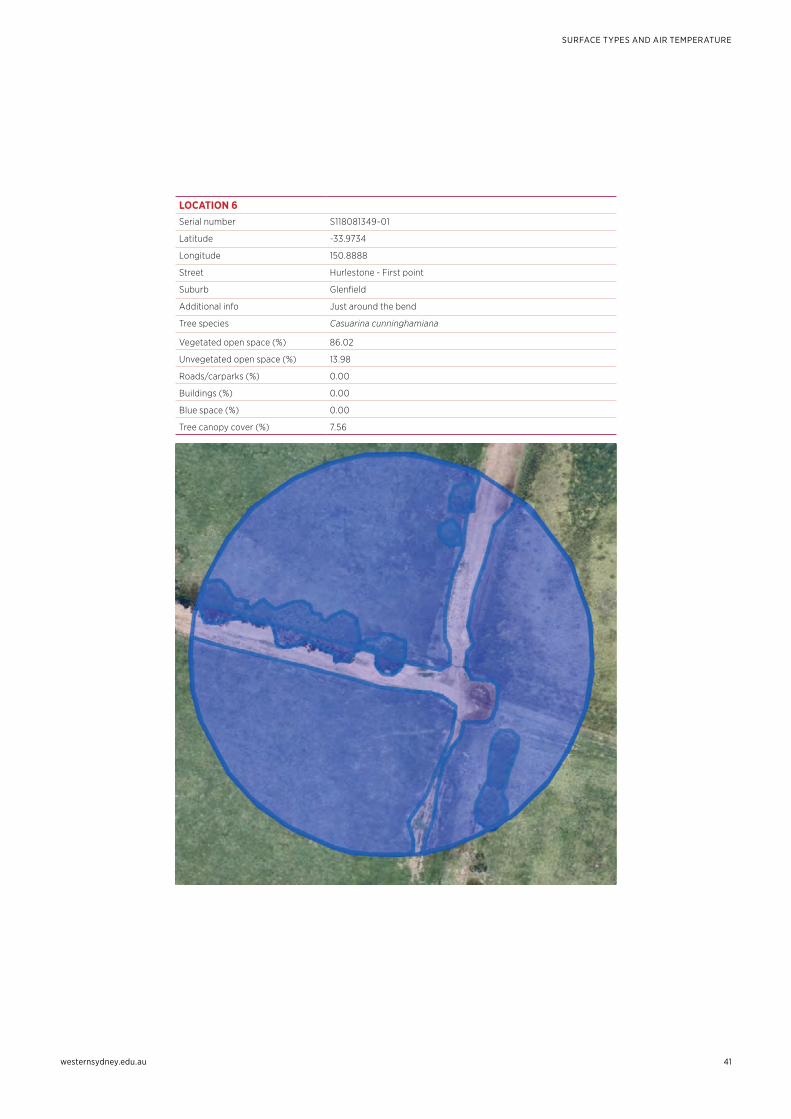
westernsydney.edu.au
SURFACE TYPES AND AIR TEMPERATURE
41
LOCATION 6 Serial number S118081349-01
Latitude -33.9734
Longitude 150.8888
Street Hurlestone - First point
Suburb Glenfield
Additional info Just around the bend
Tree species Casuarina cunninghamiana
Vegetated open space (%) 86.02
Unvegetated open space (%) 13.98
Roads/carparks (%) 0.00
Buildings (%) 0.00
Blue space (%) 0.00
Tree canopy cover (%) 7.56
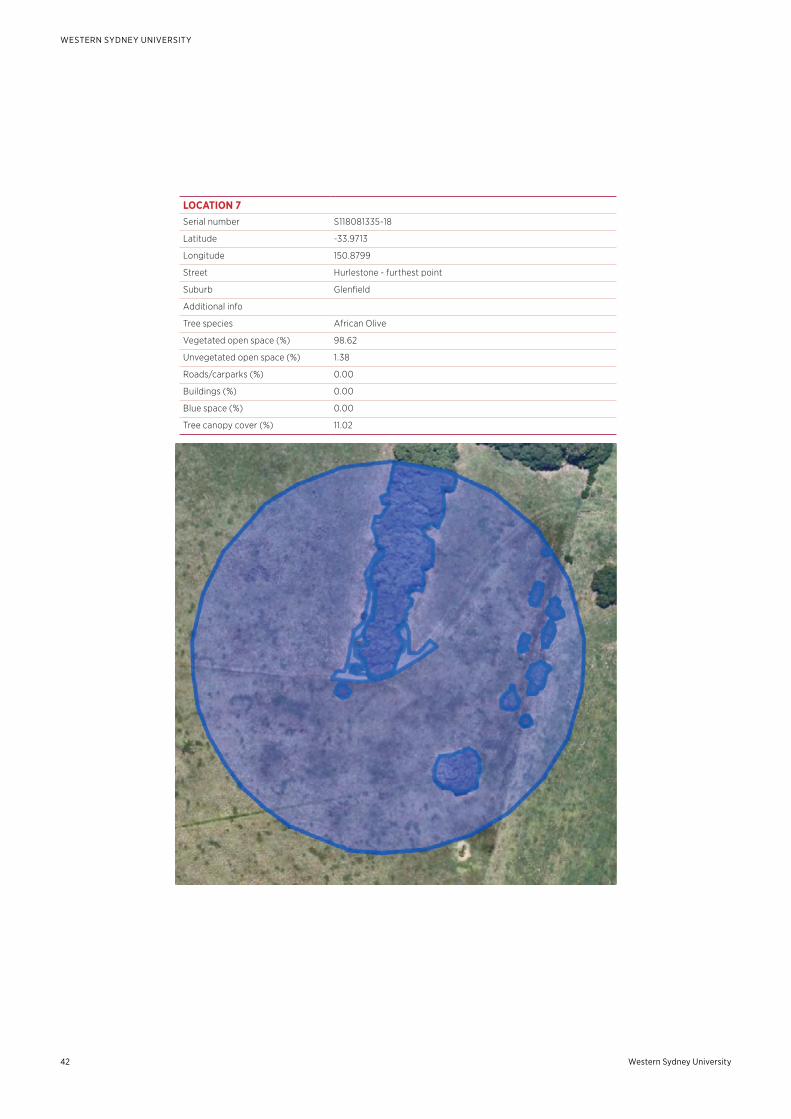
Western Sydney University42
WESTERN SYDNEY UNIVERSITY
LOCATION 7Serial number S118081335-18
Latitude -33.9713
Longitude 150.8799
Street Hurlestone - furthest point
Suburb Glenfield
Additional info
Tree species African Olive
Vegetated open space (%) 98.62
Unvegetated open space (%) 1.38
Roads/carparks (%) 0.00
Buildings (%) 0.00
Blue space (%) 0.00
Tree canopy cover (%) 11.02
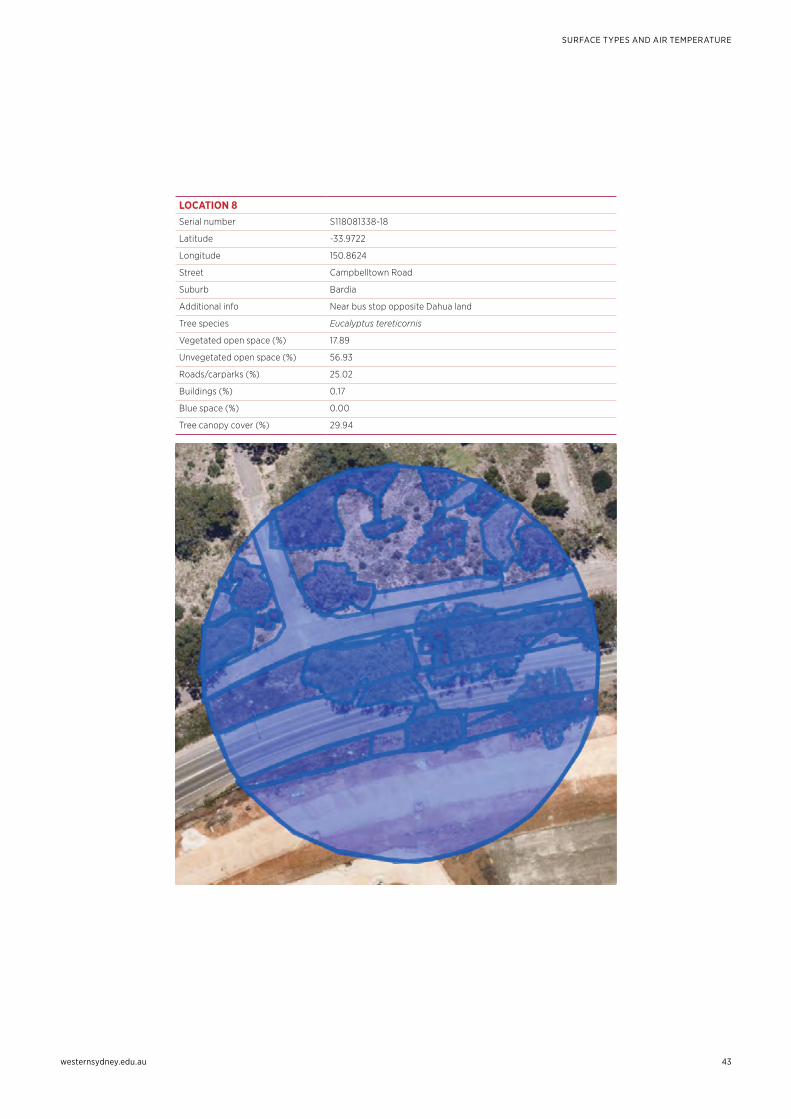
westernsydney.edu.au
SURFACE TYPES AND AIR TEMPERATURE
43
LOCATION 8Serial number S118081338-18
Latitude -33.9722
Longitude 150.8624
Street Campbelltown Road
Suburb Bardia
Additional info Near bus stop opposite Dahua land
Tree species Eucalyptus tereticornis
Vegetated open space (%) 17.89
Unvegetated open space (%) 56.93
Roads/carparks (%) 25.02
Buildings (%) 0.17
Blue space (%) 0.00
Tree canopy cover (%) 29.94
LOCATION 7Serial number S118081335-18
Latitude -33.9713
Longitude 150.8799
Street Hurlestone - furthest point
Suburb Glenfield
Additional info
Tree species African Olive
Vegetated open space (%) 98.62
Unvegetated open space (%) 1.38
Roads/carparks (%) 0.00
Buildings (%) 0.00
Blue space (%) 0.00
Tree canopy cover (%) 11.02
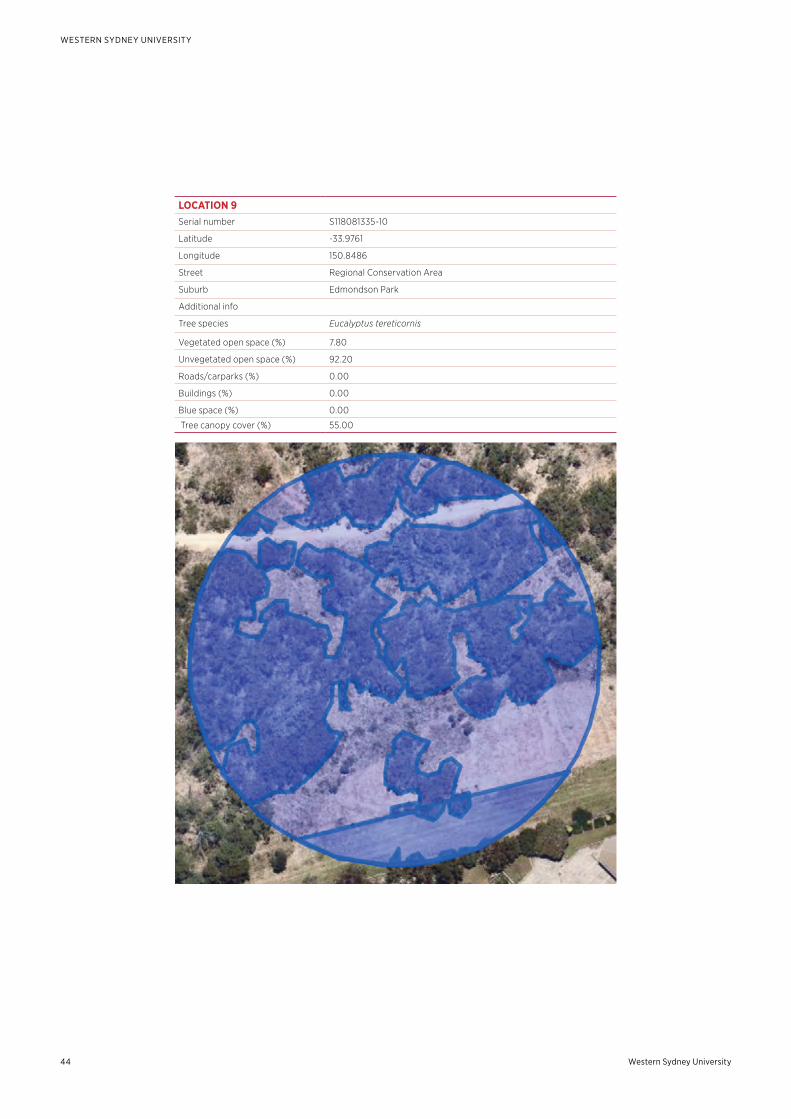
Western Sydney University44
WESTERN SYDNEY UNIVERSITY
LOCATION 9Serial number S118081335-10
Latitude -33.9761
Longitude 150.8486
Street Regional Conservation Area
Suburb Edmondson Park
Additional info
Tree species Eucalyptus tereticornis
Vegetated open space (%) 7.80
Unvegetated open space (%) 92.20
Roads/carparks (%) 0.00
Buildings (%) 0.00
Blue space (%) 0.00
Tree canopy cover (%) 55.00
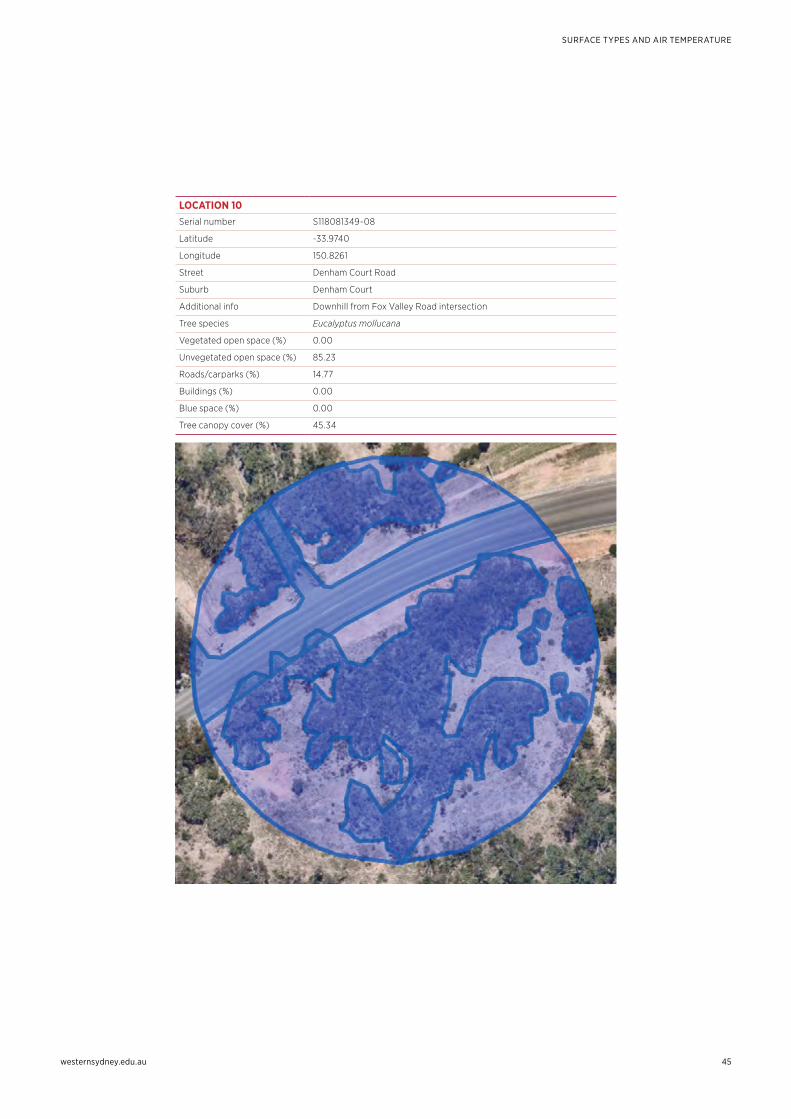
westernsydney.edu.au
SURFACE TYPES AND AIR TEMPERATURE
45
LOCATION 10 Serial number S118081349-08
Latitude -33.9740
Longitude 150.8261
Street Denham Court Road
Suburb Denham Court
Additional info Downhill from Fox Valley Road intersection
Tree species Eucalyptus mollucana
Vegetated open space (%) 0.00
Unvegetated open space (%) 85.23
Roads/carparks (%) 14.77
Buildings (%) 0.00
Blue space (%) 0.00
Tree canopy cover (%) 45.34
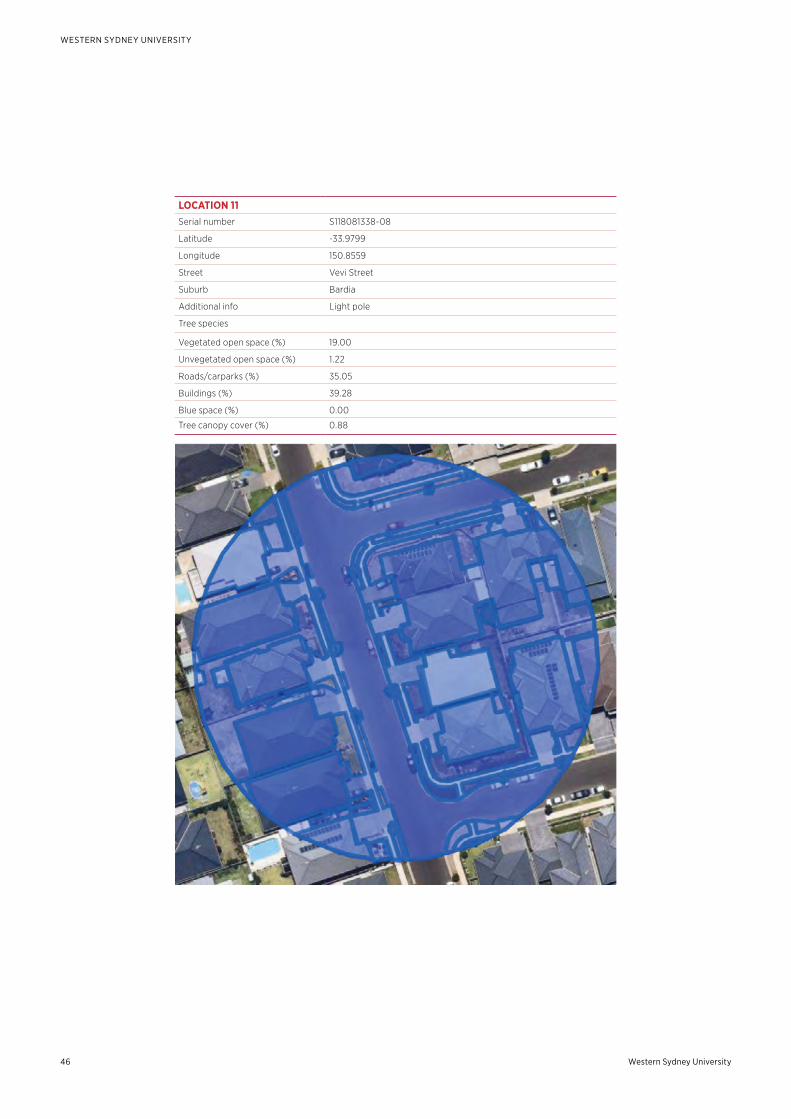
Western Sydney University46
WESTERN SYDNEY UNIVERSITY
LOCATION 11Serial number S118081338-08
Latitude -33.9799
Longitude 150.8559
Street Vevi Street
Suburb Bardia
Additional info Light pole
Tree species
Vegetated open space (%) 19.00
Unvegetated open space (%) 1.22
Roads/carparks (%) 35.05
Buildings (%) 39.28
Blue space (%) 0.00
Tree canopy cover (%) 0.88
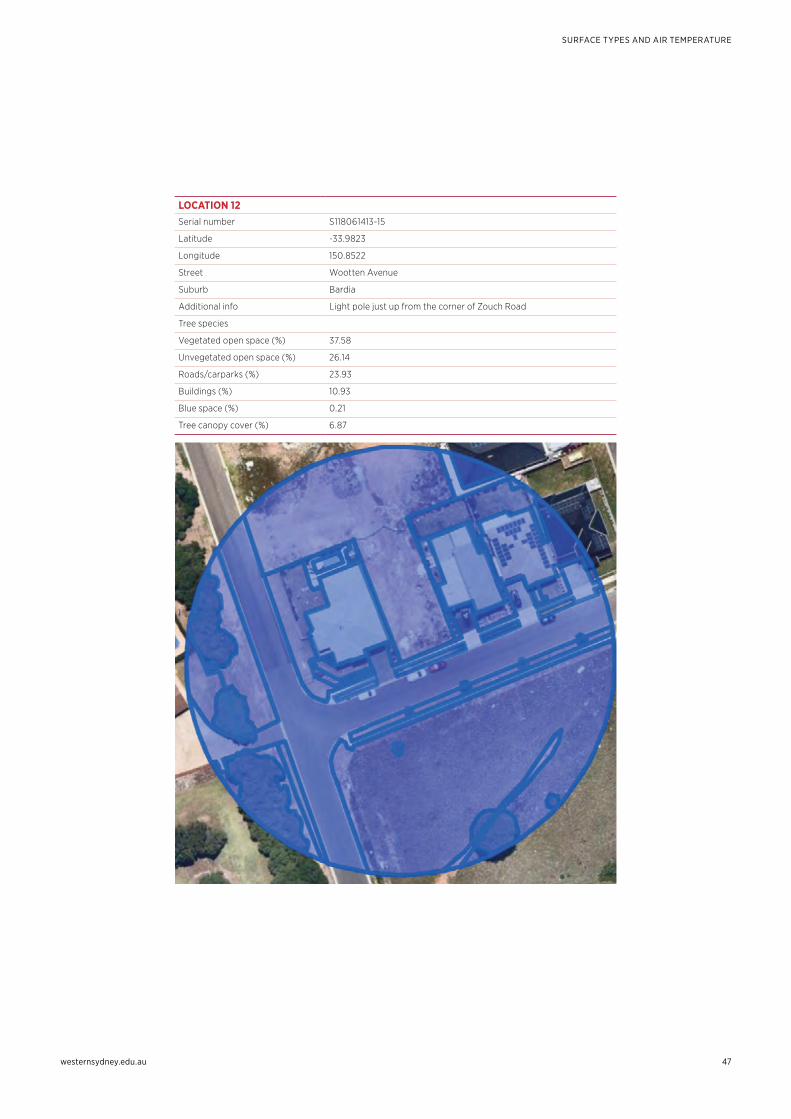
westernsydney.edu.au
SURFACE TYPES AND AIR TEMPERATURE
47
LOCATION 12 Serial number S118061413-15
Latitude -33.9823
Longitude 150.8522
Street Wootten Avenue
Suburb Bardia
Additional info Light pole just up from the corner of Zouch Road
Tree species
Vegetated open space (%) 37.58
Unvegetated open space (%) 26.14
Roads/carparks (%) 23.93
Buildings (%) 10.93
Blue space (%) 0.21
Tree canopy cover (%) 6.87
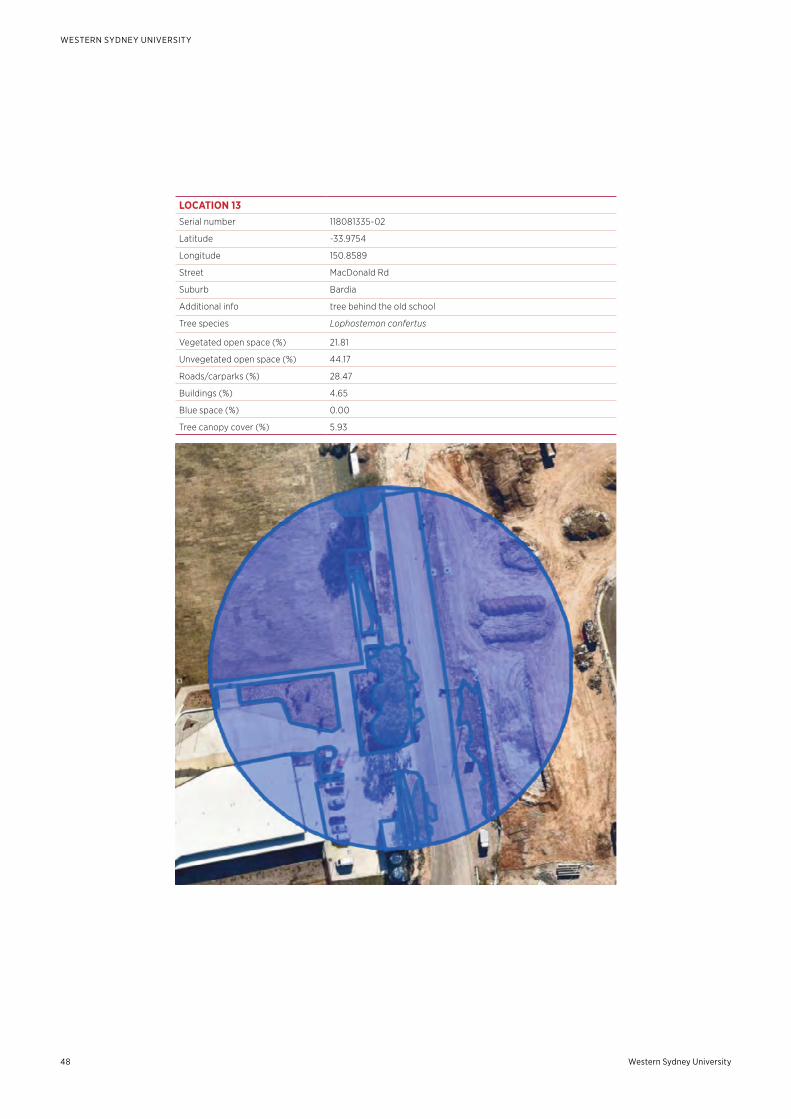
Western Sydney University48
WESTERN SYDNEY UNIVERSITY
LOCATION 13Serial number 118081335-02
Latitude -33.9754
Longitude 150.8589
Street MacDonald Rd
Suburb Bardia
Additional info tree behind the old school
Tree species Lophostemon confertus
Vegetated open space (%) 21.81
Unvegetated open space (%) 44.17
Roads/carparks (%) 28.47
Buildings (%) 4.65
Blue space (%) 0.00
Tree canopy cover (%) 5.93
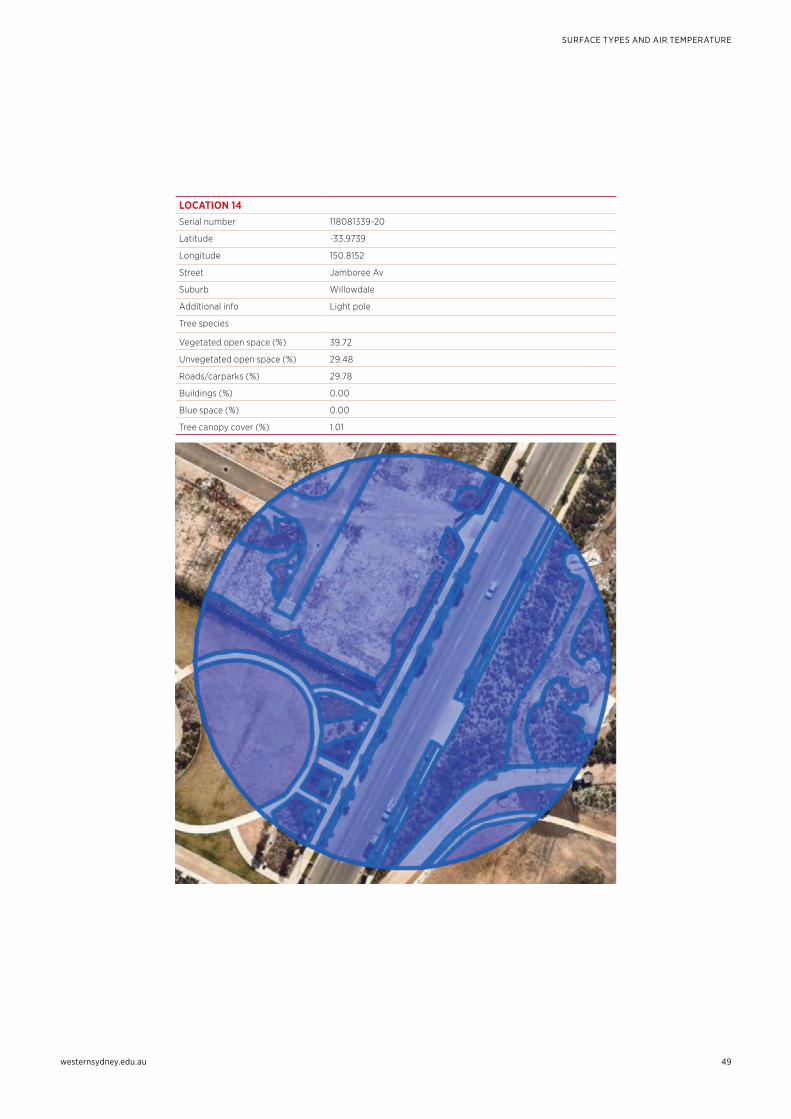
westernsydney.edu.au
SURFACE TYPES AND AIR TEMPERATURE
49
LOCATION 14 Serial number 118081339-20
Latitude -33.9739
Longitude 150.8152
Street Jamboree Av
Suburb Willowdale
Additional info Light pole
Tree species
Vegetated open space (%) 39.72
Unvegetated open space (%) 29.48
Roads/carparks (%) 29.78
Buildings (%) 0.00
Blue space (%) 0.00
Tree canopy cover (%) 1.01
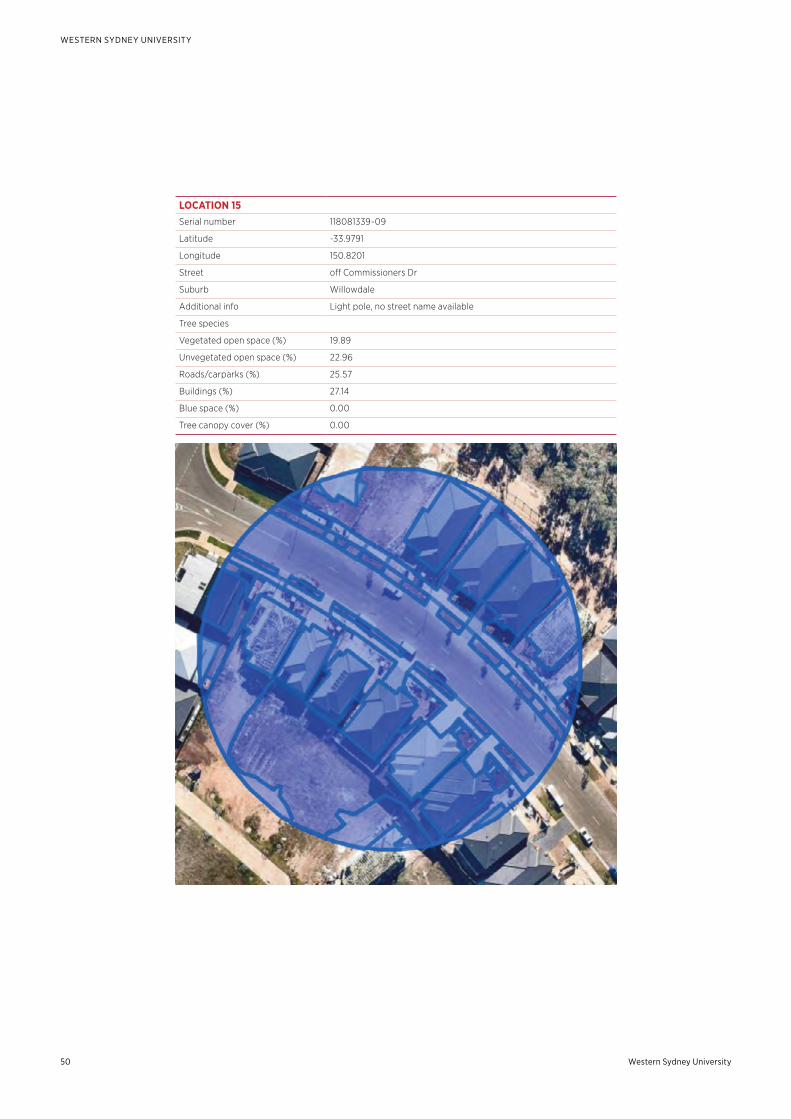
Western Sydney University50
WESTERN SYDNEY UNIVERSITY
LOCATION 15Serial number 118081339-09
Latitude -33.9791
Longitude 150.8201
Street off Commissioners Dr
Suburb Willowdale
Additional info Light pole, no street name available
Tree species
Vegetated open space (%) 19.89
Unvegetated open space (%) 22.96
Roads/carparks (%) 25.57
Buildings (%) 27.14
Blue space (%) 0.00
Tree canopy cover (%) 0.00
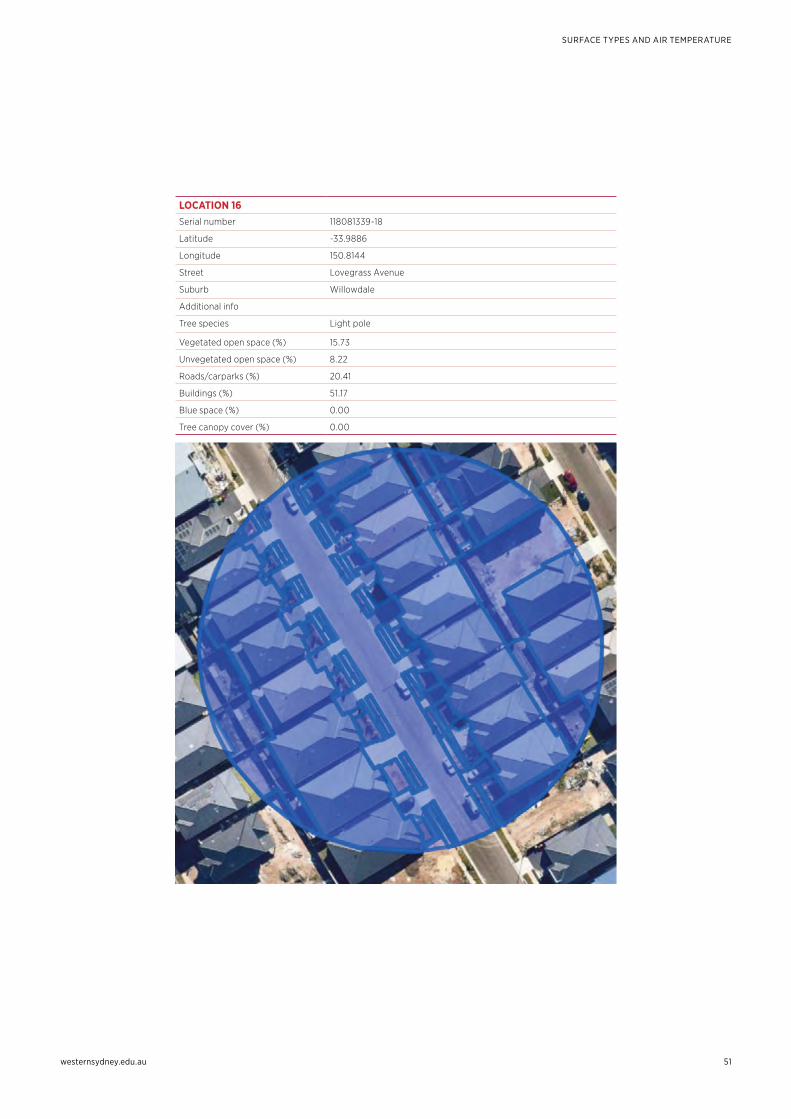
westernsydney.edu.au
SURFACE TYPES AND AIR TEMPERATURE
51
LOCATION 16Serial number 118081339-18
Latitude -33.9886
Longitude 150.8144
Street Lovegrass Avenue
Suburb Willowdale
Additional info
Tree species Light pole
Vegetated open space (%) 15.73
Unvegetated open space (%) 8.22
Roads/carparks (%) 20.41
Buildings (%) 51.17
Blue space (%) 0.00
Tree canopy cover (%) 0.00
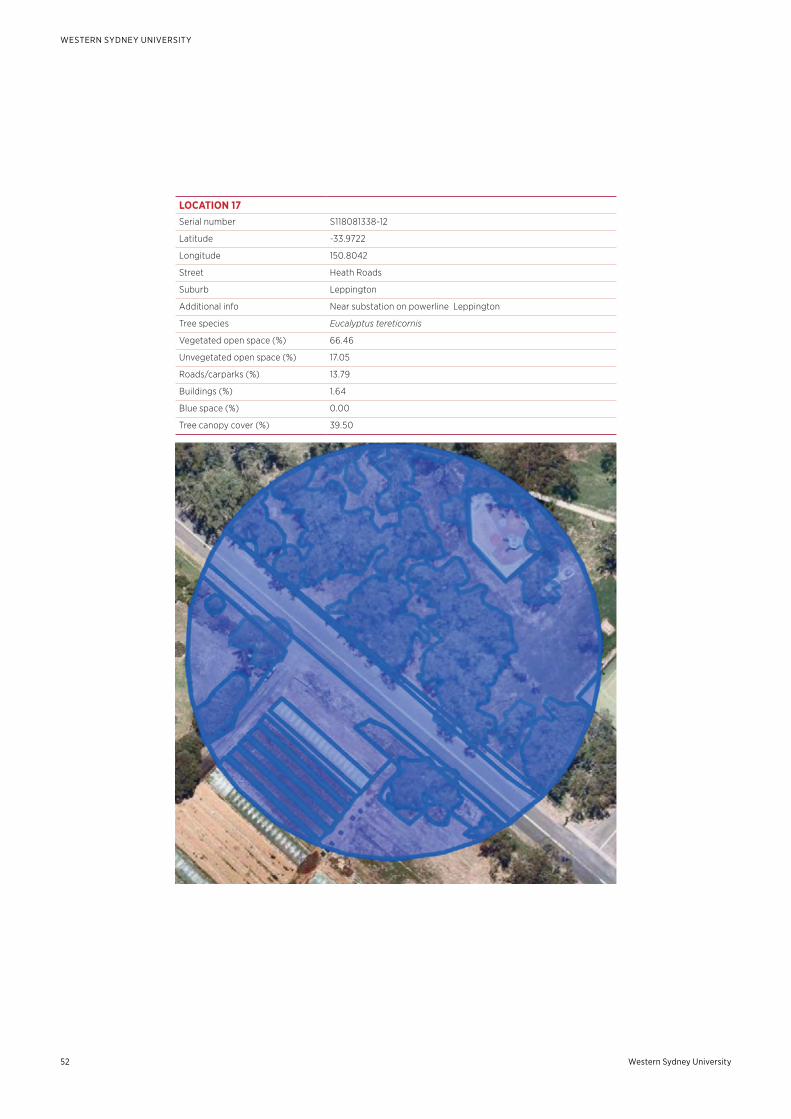
Western Sydney University52
WESTERN SYDNEY UNIVERSITY
LOCATION 17Serial number S118081338-12
Latitude -33.9722
Longitude 150.8042
Street Heath Roads
Suburb Leppington
Additional info Near substation on powerline Leppington
Tree species Eucalyptus tereticornis
Vegetated open space (%) 66.46
Unvegetated open space (%) 17.05
Roads/carparks (%) 13.79
Buildings (%) 1.64
Blue space (%) 0.00
Tree canopy cover (%) 39.50
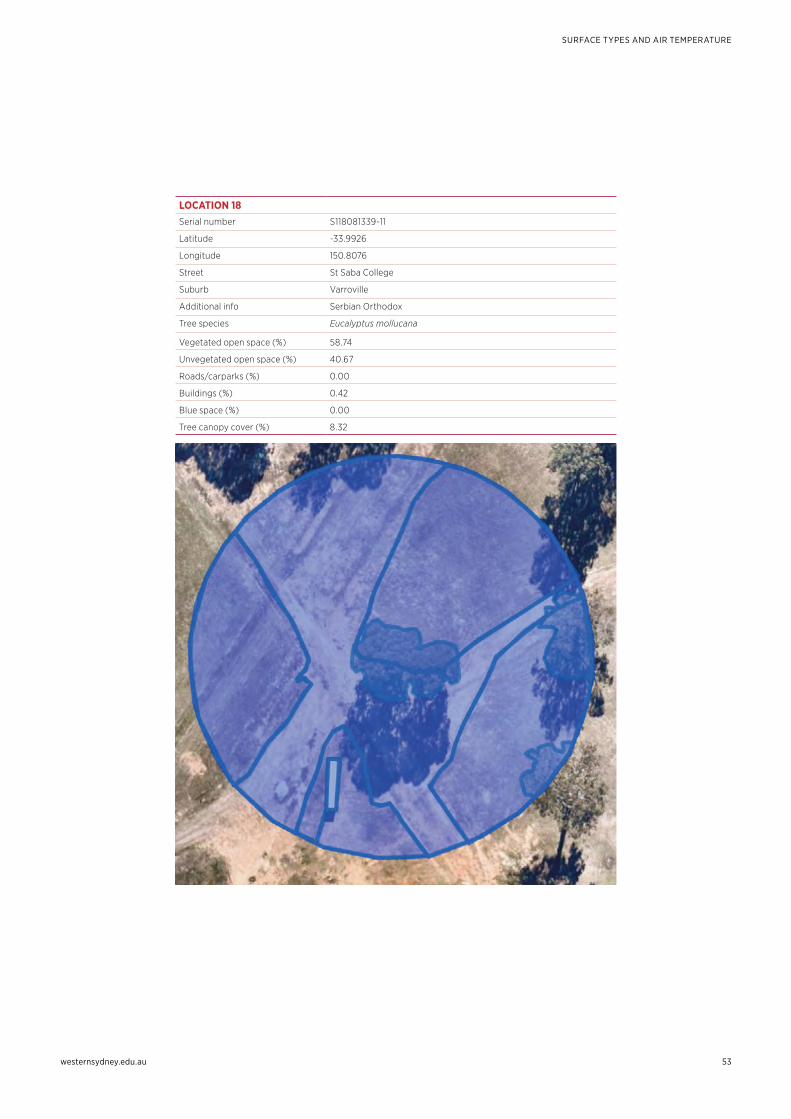
westernsydney.edu.au
SURFACE TYPES AND AIR TEMPERATURE
53
LOCATION 18Serial number S118081339-11
Latitude -33.9926
Longitude 150.8076
Street St Saba College
Suburb Varroville
Additional info Serbian Orthodox
Tree species Eucalyptus mollucana
Vegetated open space (%) 58.74
Unvegetated open space (%) 40.67
Roads/carparks (%) 0.00
Buildings (%) 0.42
Blue space (%) 0.00
Tree canopy cover (%) 8.32
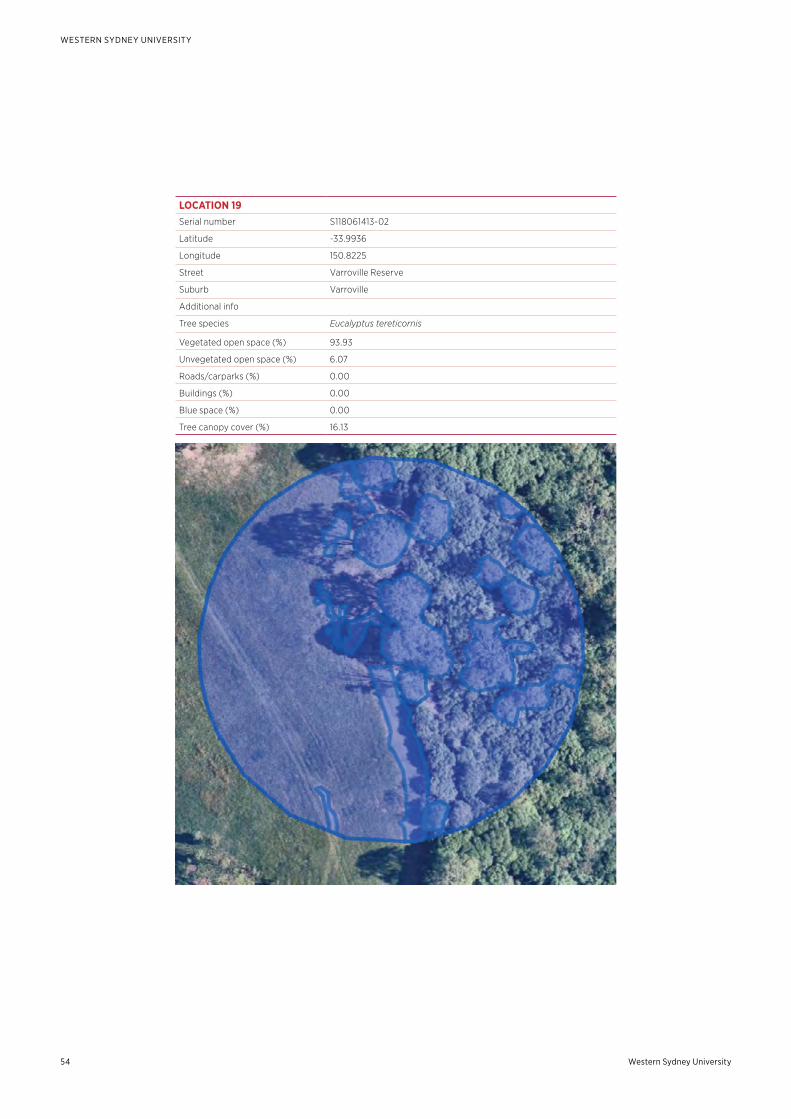
Western Sydney University54
WESTERN SYDNEY UNIVERSITY
LOCATION 19Serial number S118061413-02
Latitude -33.9936
Longitude 150.8225
Street Varroville Reserve
Suburb Varroville
Additional info
Tree species Eucalyptus tereticornis
Vegetated open space (%) 93.93
Unvegetated open space (%) 6.07
Roads/carparks (%) 0.00
Buildings (%) 0.00
Blue space (%) 0.00
Tree canopy cover (%) 16.13
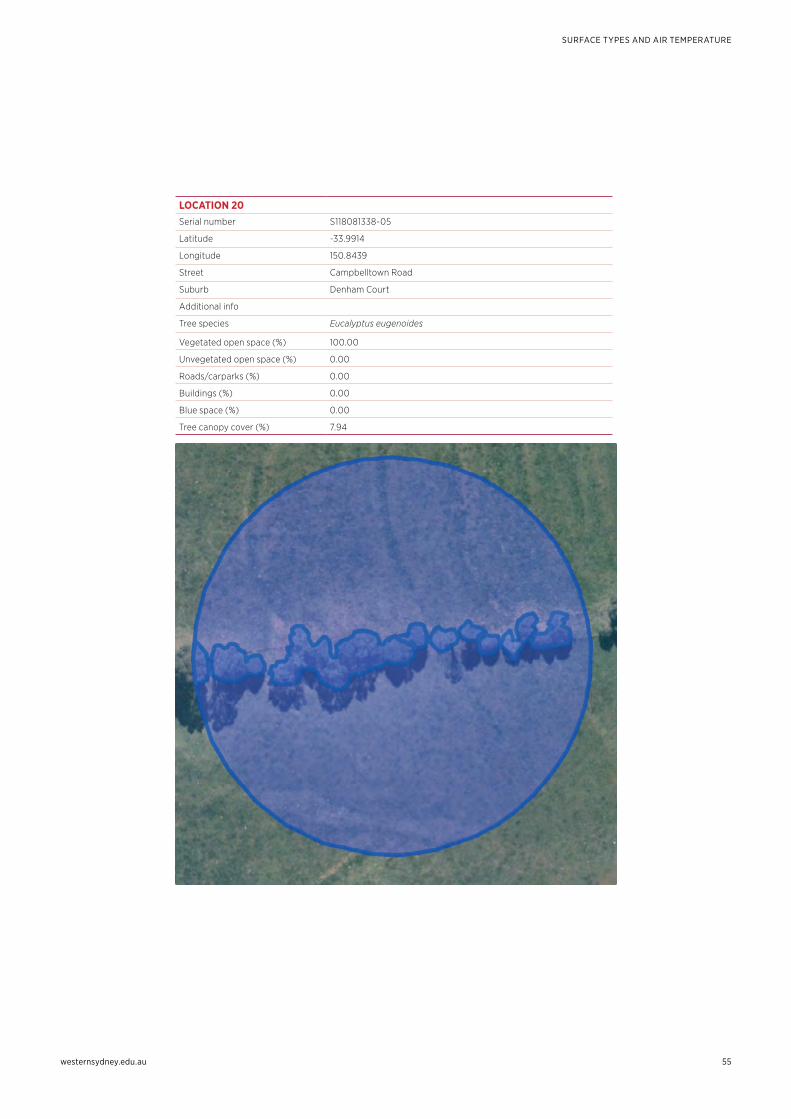
westernsydney.edu.au
SURFACE TYPES AND AIR TEMPERATURE
55
LOCATION 20 Serial number S118081338-05
Latitude -33.9914
Longitude 150.8439
Street Campbelltown Road
Suburb Denham Court
Additional info
Tree species Eucalyptus eugenoides
Vegetated open space (%) 100.00
Unvegetated open space (%) 0.00
Roads/carparks (%) 0.00
Buildings (%) 0.00
Blue space (%) 0.00
Tree canopy cover (%) 7.94
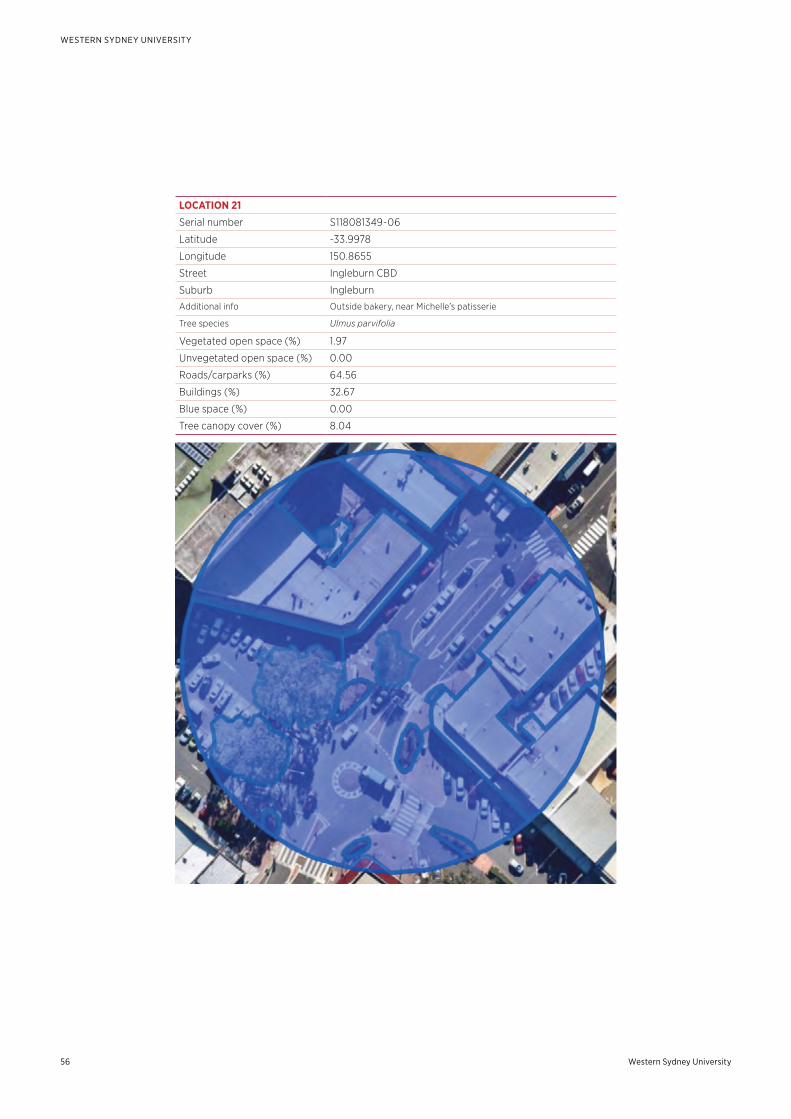
Western Sydney University56
WESTERN SYDNEY UNIVERSITY
LOCATION 21
Serial number S118081349-06
Latitude -33.9978
Longitude 150.8655
Street Ingleburn CBD
Suburb Ingleburn
Additional info Outside bakery, near Michelle’s patisserie
Tree species Ulmus parvifolia
Vegetated open space (%) 1.97
Unvegetated open space (%) 0.00
Roads/carparks (%) 64.56
Buildings (%) 32.67
Blue space (%) 0.00
Tree canopy cover (%) 8.04
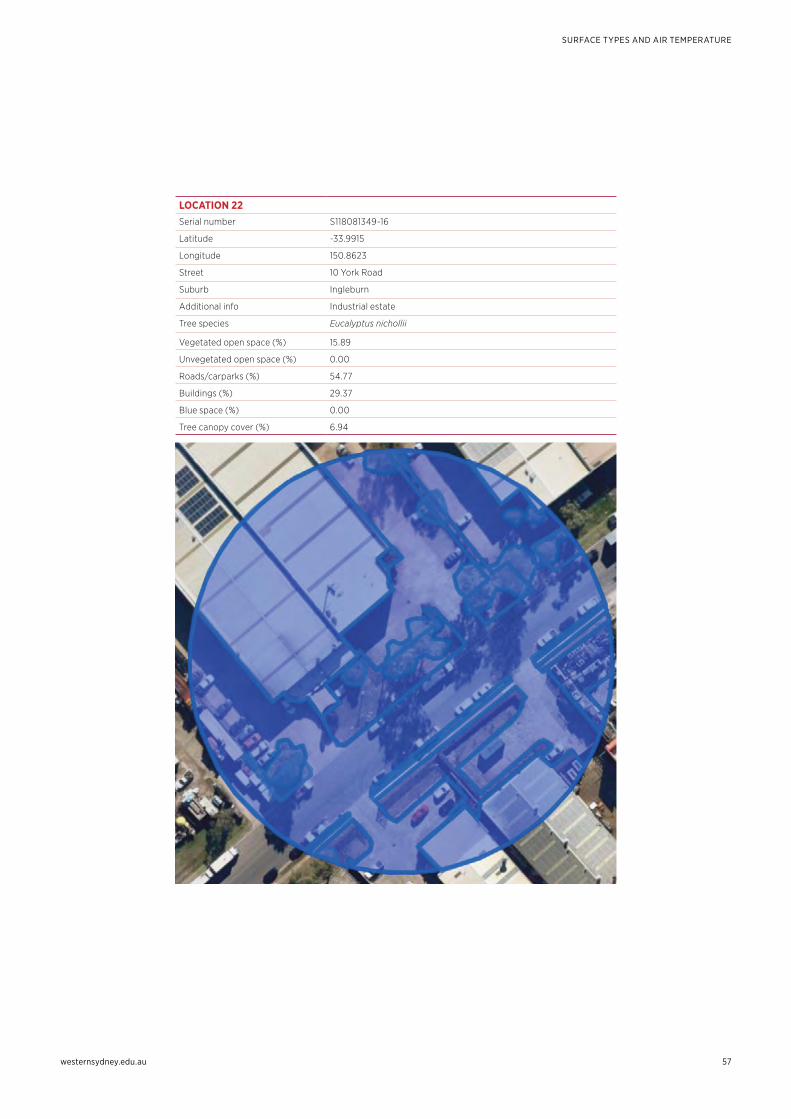
westernsydney.edu.au
SURFACE TYPES AND AIR TEMPERATURE
57
LOCATION 22Serial number S118081349-16
Latitude -33.9915
Longitude 150.8623
Street 10 York Road
Suburb Ingleburn
Additional info Industrial estate
Tree species Eucalyptus nichollii
Vegetated open space (%) 15.89
Unvegetated open space (%) 0.00
Roads/carparks (%) 54.77
Buildings (%) 29.37
Blue space (%) 0.00
Tree canopy cover (%) 6.94
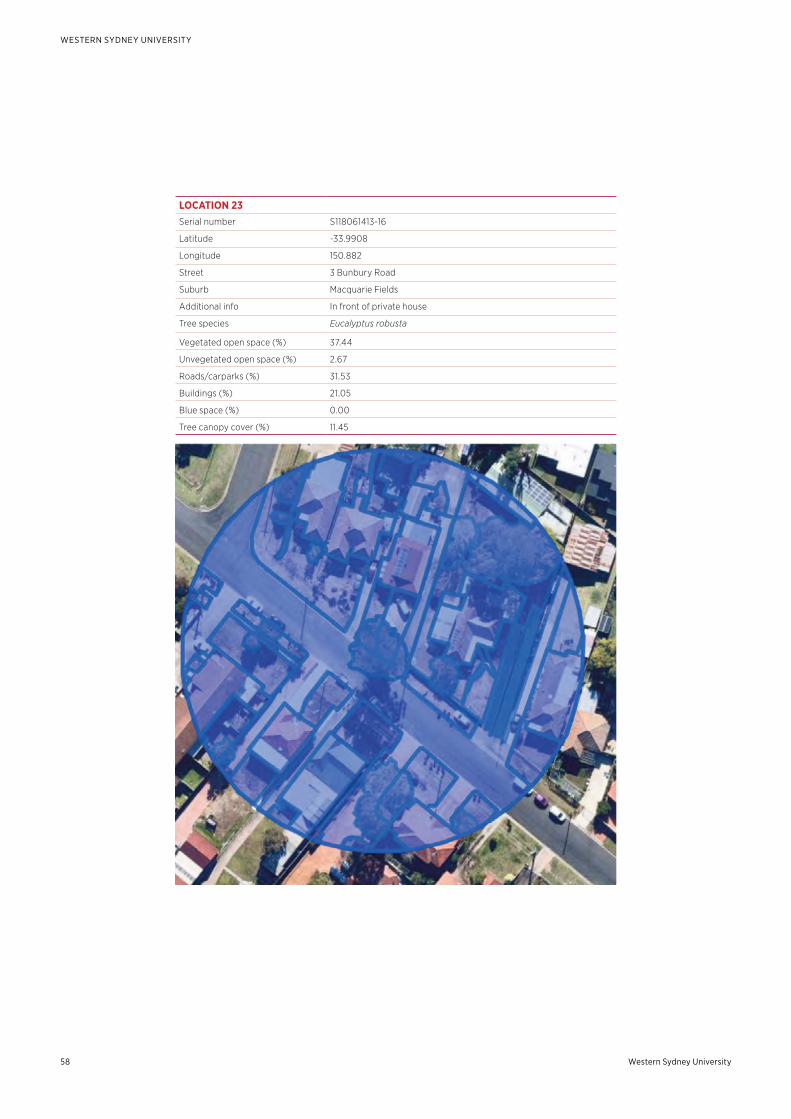
Western Sydney University58
WESTERN SYDNEY UNIVERSITY
LOCATION 23Serial number S118061413-16
Latitude -33.9908
Longitude 150.882
Street 3 Bunbury Road
Suburb Macquarie Fields
Additional info In front of private house
Tree species Eucalyptus robusta
Vegetated open space (%) 37.44
Unvegetated open space (%) 2.67
Roads/carparks (%) 31.53
Buildings (%) 21.05
Blue space (%) 0.00
Tree canopy cover (%) 11.45
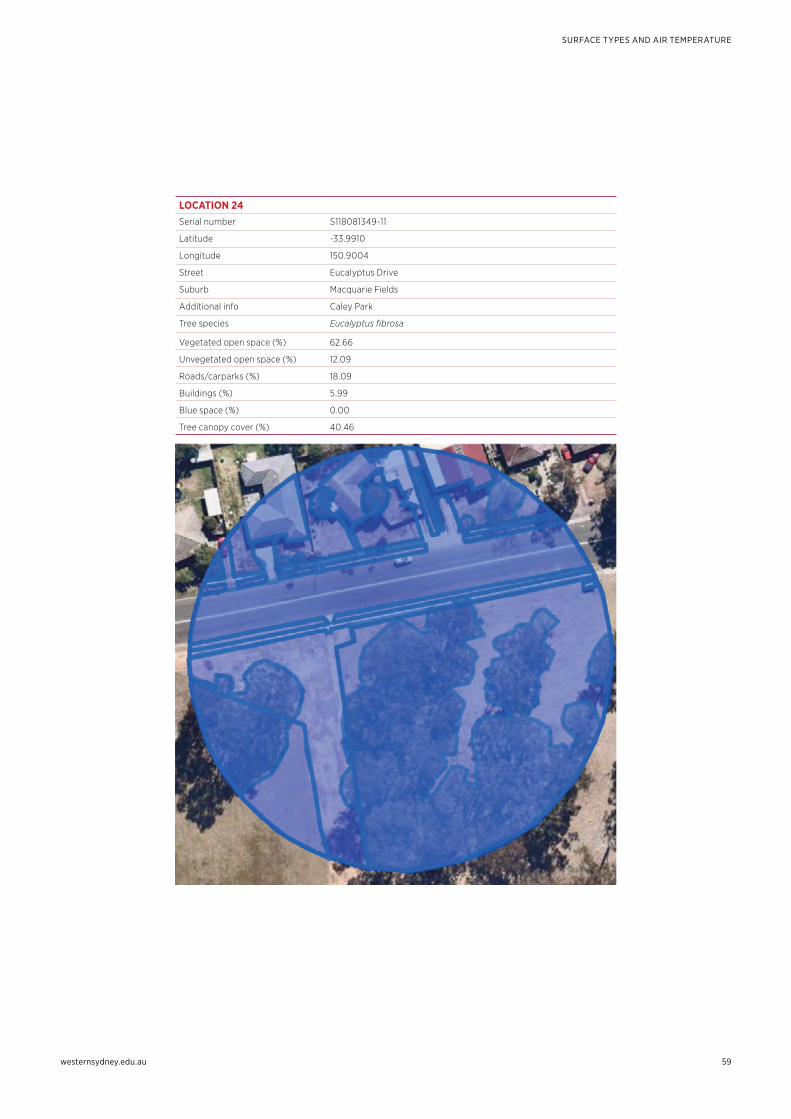
westernsydney.edu.au
SURFACE TYPES AND AIR TEMPERATURE
59
LOCATION 24Serial number S118081349-11
Latitude -33.9910
Longitude 150.9004
Street Eucalyptus Drive
Suburb Macquarie Fields
Additional info Caley Park
Tree species Eucalyptus fibrosa
Vegetated open space (%) 62.66
Unvegetated open space (%) 12.09
Roads/carparks (%) 18.09
Buildings (%) 5.99
Blue space (%) 0.00
Tree canopy cover (%) 40.46
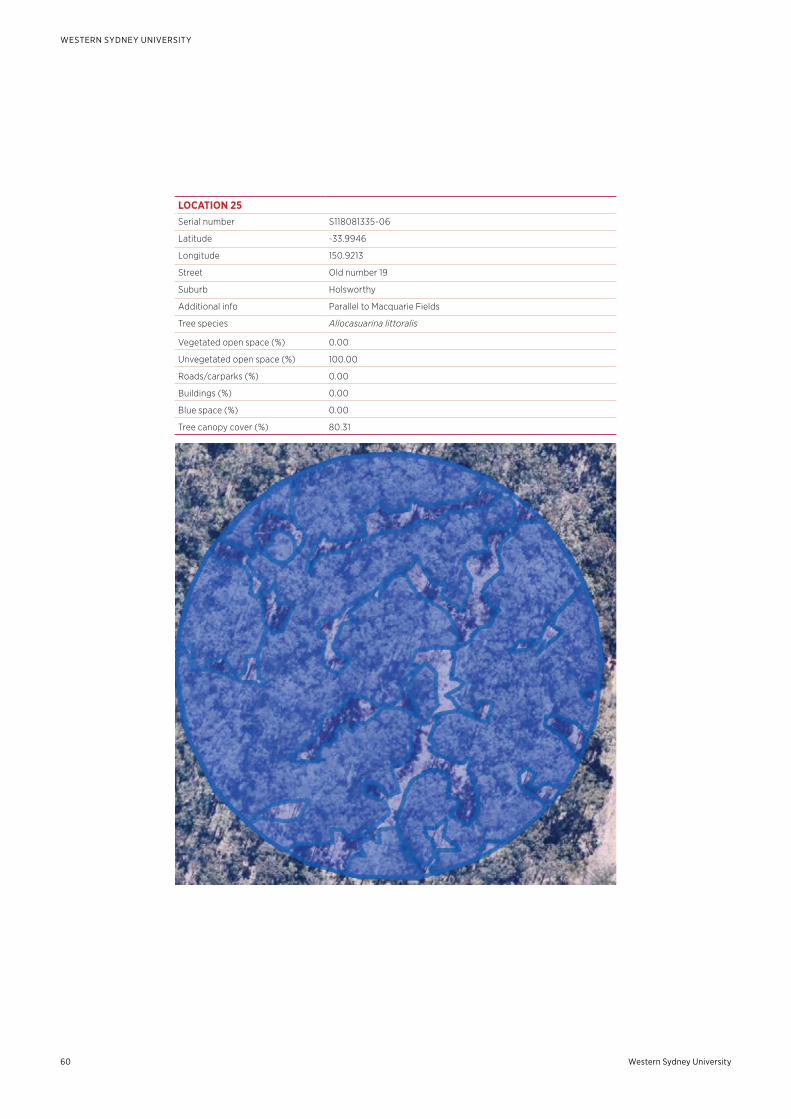
Western Sydney University60
WESTERN SYDNEY UNIVERSITY
LOCATION 25Serial number S118081335-06
Latitude -33.9946
Longitude 150.9213
Street Old number 19
Suburb Holsworthy
Additional info Parallel to Macquarie Fields
Tree species Allocasuarina littoralis
Vegetated open space (%) 0.00
Unvegetated open space (%) 100.00
Roads/carparks (%) 0.00
Buildings (%) 0.00
Blue space (%) 0.00
Tree canopy cover (%) 80.31
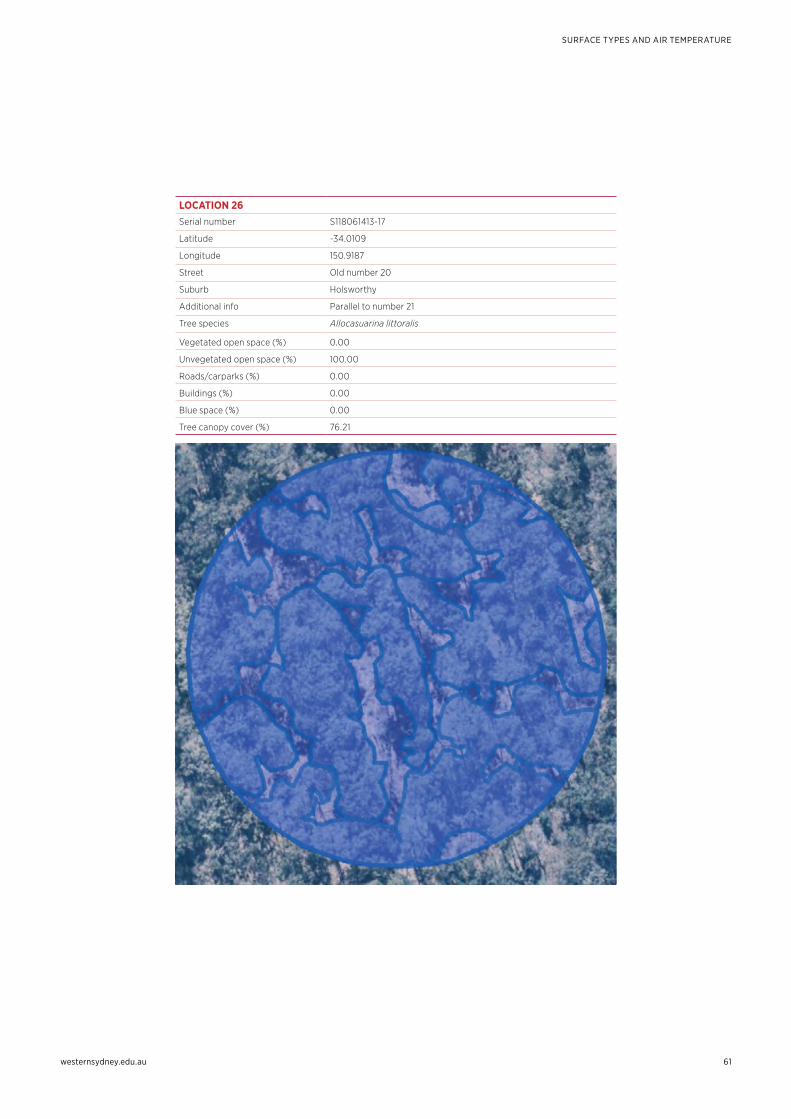
westernsydney.edu.au
SURFACE TYPES AND AIR TEMPERATURE
61
LOCATION 26Serial number S118061413-17
Latitude -34.0109
Longitude 150.9187
Street Old number 20
Suburb Holsworthy
Additional info Parallel to number 21
Tree species Allocasuarina littoralis
Vegetated open space (%) 0.00
Unvegetated open space (%) 100.00
Roads/carparks (%) 0.00
Buildings (%) 0.00
Blue space (%) 0.00
Tree canopy cover (%) 76.21
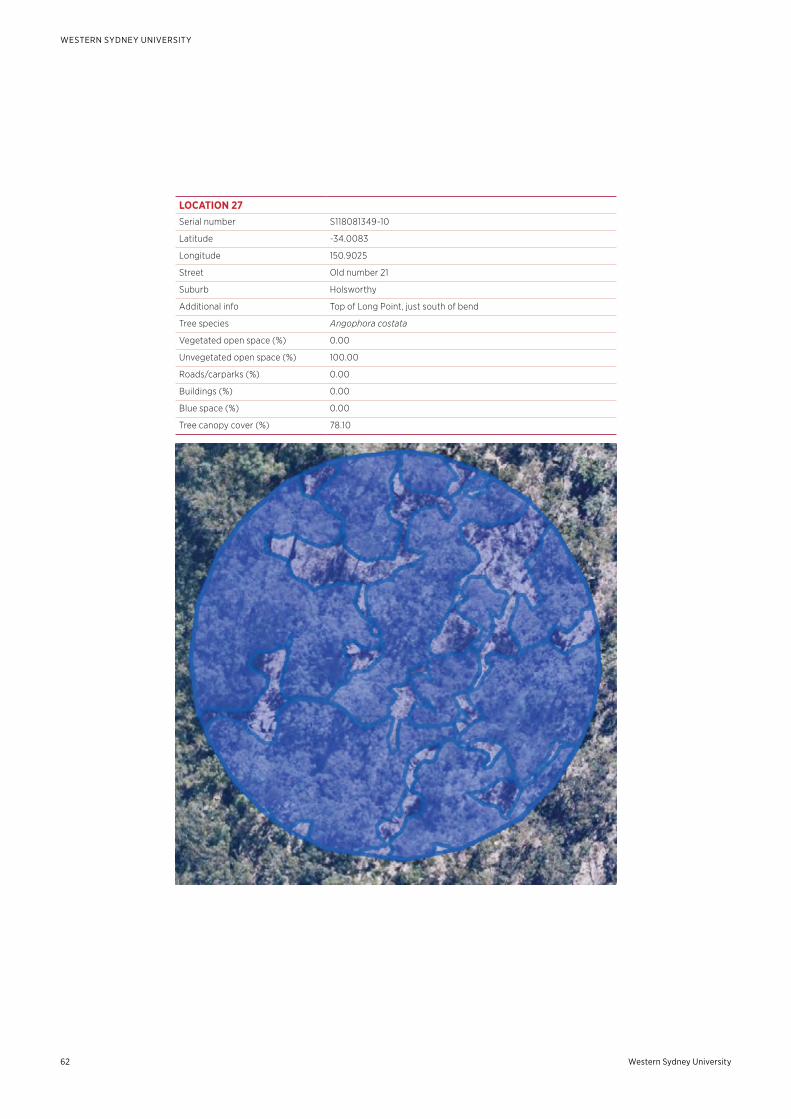
Western Sydney University62
WESTERN SYDNEY UNIVERSITY
LOCATION 27Serial number S118081349-10
Latitude -34.0083
Longitude 150.9025
Street Old number 21
Suburb Holsworthy
Additional info Top of Long Point, just south of bend
Tree species Angophora costata
Vegetated open space (%) 0.00
Unvegetated open space (%) 100.00
Roads/carparks (%) 0.00
Buildings (%) 0.00
Blue space (%) 0.00
Tree canopy cover (%) 78.10
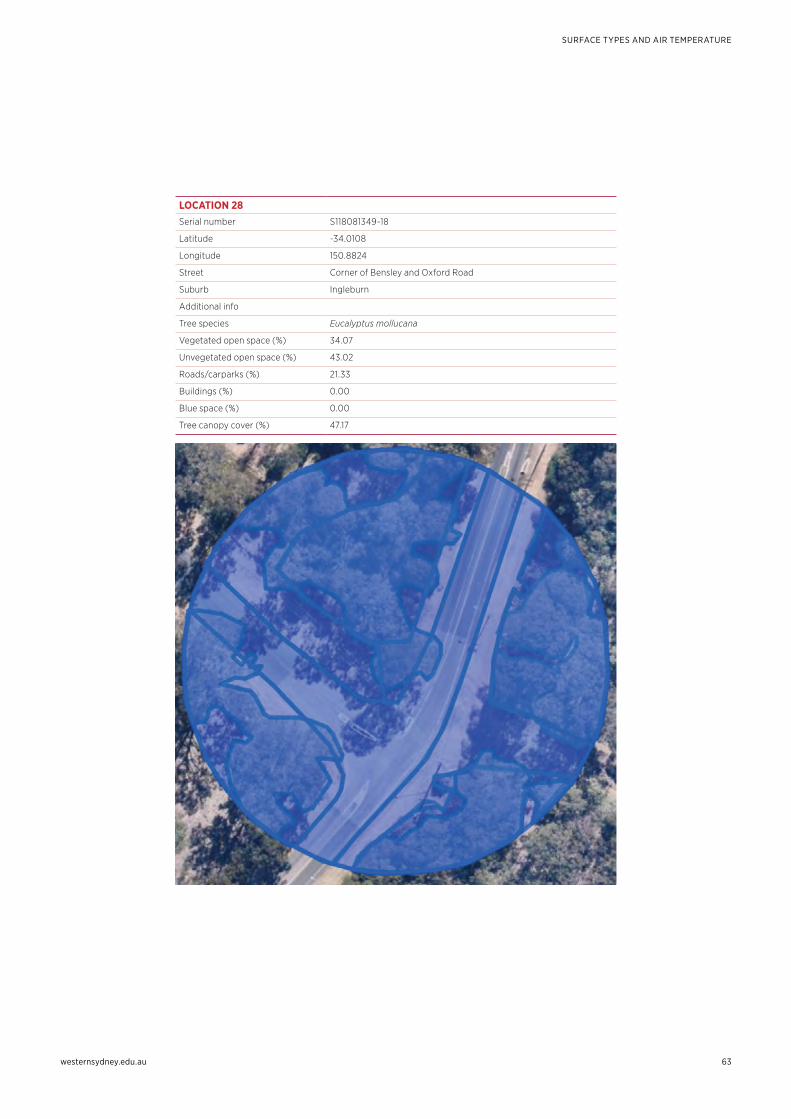
westernsydney.edu.au
SURFACE TYPES AND AIR TEMPERATURE
63
LOCATION 28Serial number S118081349-18
Latitude -34.0108
Longitude 150.8824
Street Corner of Bensley and Oxford Road
Suburb Ingleburn
Additional info
Tree species Eucalyptus mollucana
Vegetated open space (%) 34.07
Unvegetated open space (%) 43.02
Roads/carparks (%) 21.33
Buildings (%) 0.00
Blue space (%) 0.00
Tree canopy cover (%) 47.17
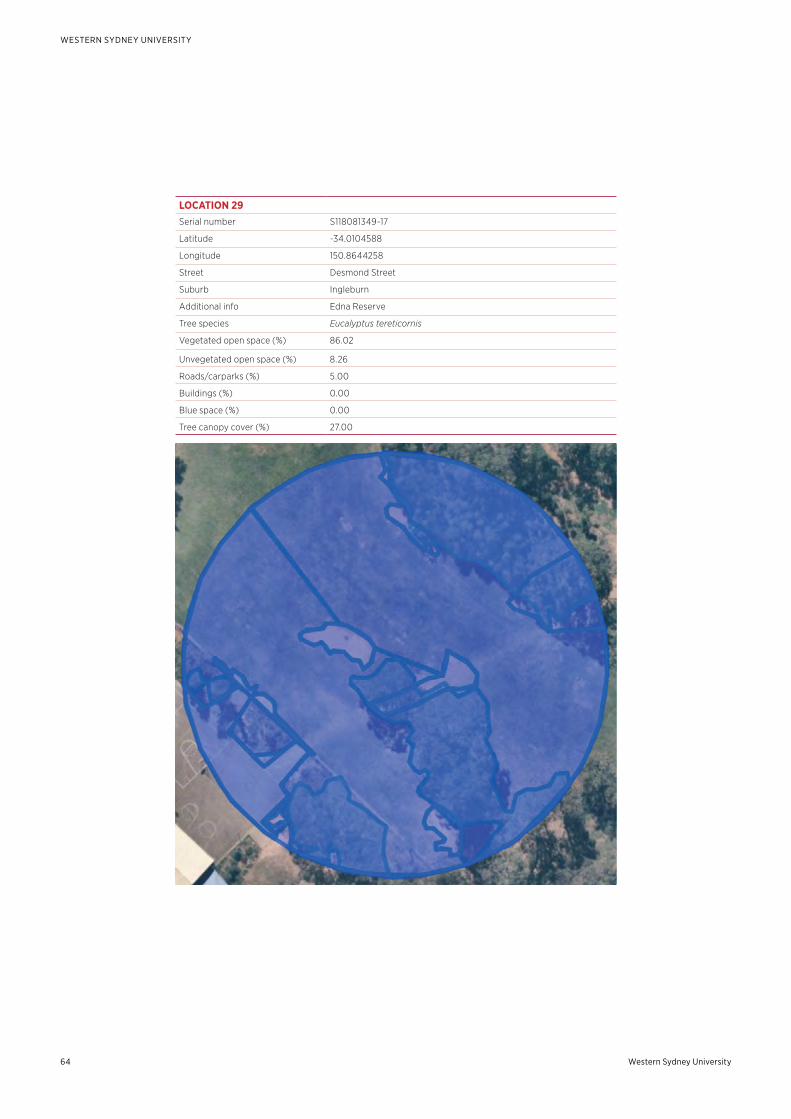
Western Sydney University64
WESTERN SYDNEY UNIVERSITY
LOCATION 29Serial number S118081349-17
Latitude -34.0104588
Longitude 150.8644258
Street Desmond Street
Suburb Ingleburn
Additional info Edna Reserve
Tree species Eucalyptus tereticornis
Vegetated open space (%) 86.02
Unvegetated open space (%) 8.26
Roads/carparks (%) 5.00
Buildings (%) 0.00
Blue space (%) 0.00
Tree canopy cover (%) 27.00
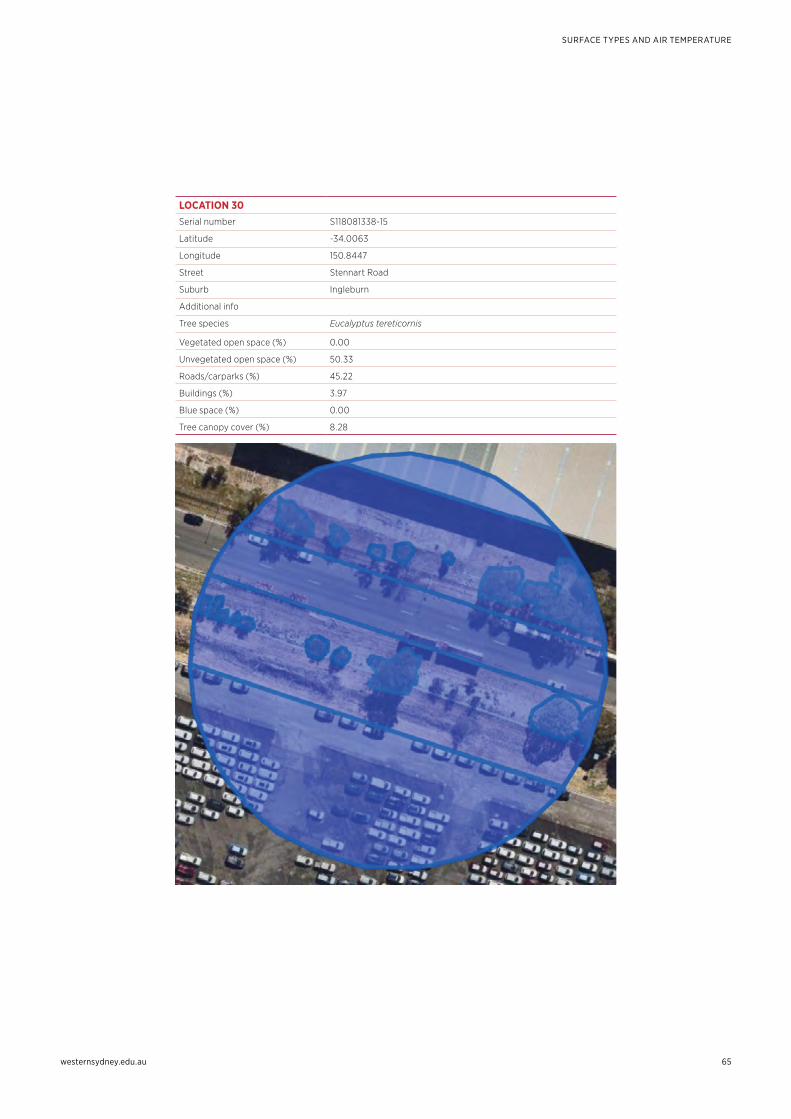
westernsydney.edu.au
SURFACE TYPES AND AIR TEMPERATURE
65
LOCATION 30Serial number S118081338-15
Latitude -34.0063
Longitude 150.8447
Street Stennart Road
Suburb Ingleburn
Additional info
Tree species Eucalyptus tereticornis
Vegetated open space (%) 0.00
Unvegetated open space (%) 50.33
Roads/carparks (%) 45.22
Buildings (%) 3.97
Blue space (%) 0.00
Tree canopy cover (%) 8.28
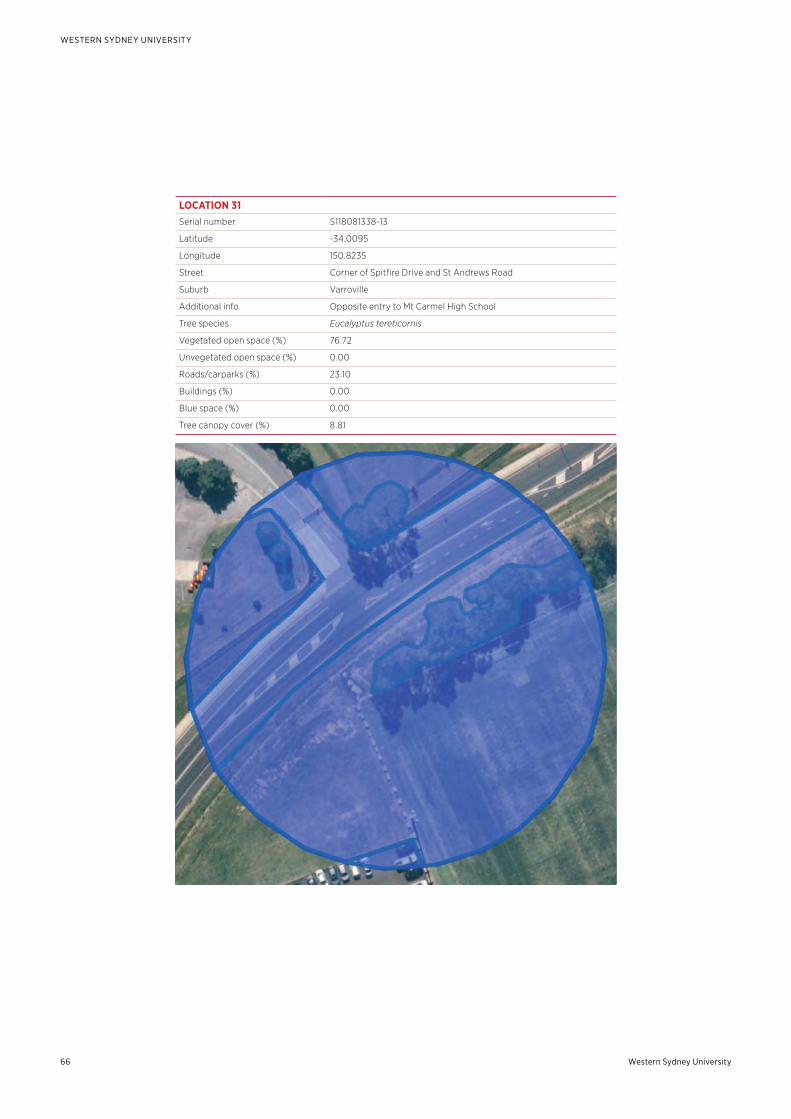
Western Sydney University66
WESTERN SYDNEY UNIVERSITY
LOCATION 31Serial number S118081338-13
Latitude -34.0095
Longitude 150.8235
Street Corner of Spitfire Drive and St Andrews Road
Suburb Varroville
Additional info Opposite entry to Mt Carmel High School
Tree species Eucalyptus tereticornis
Vegetated open space (%) 76.72
Unvegetated open space (%) 0.00
Roads/carparks (%) 23.10
Buildings (%) 0.00
Blue space (%) 0.00
Tree canopy cover (%) 8.81
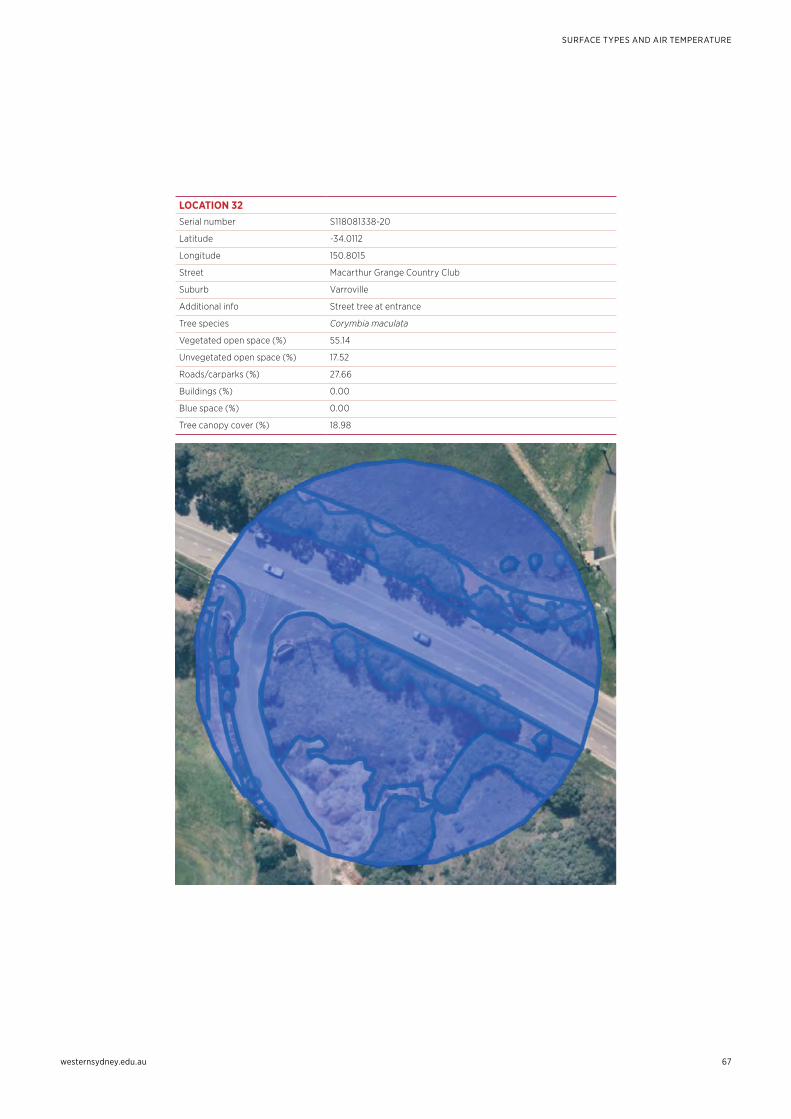
westernsydney.edu.au
SURFACE TYPES AND AIR TEMPERATURE
67
LOCATION 32Serial number S118081338-20
Latitude -34.0112
Longitude 150.8015
Street Macarthur Grange Country Club
Suburb Varroville
Additional info Street tree at entrance
Tree species Corymbia maculata
Vegetated open space (%) 55.14
Unvegetated open space (%) 17.52
Roads/carparks (%) 27.66
Buildings (%) 0.00
Blue space (%) 0.00
Tree canopy cover (%) 18.98
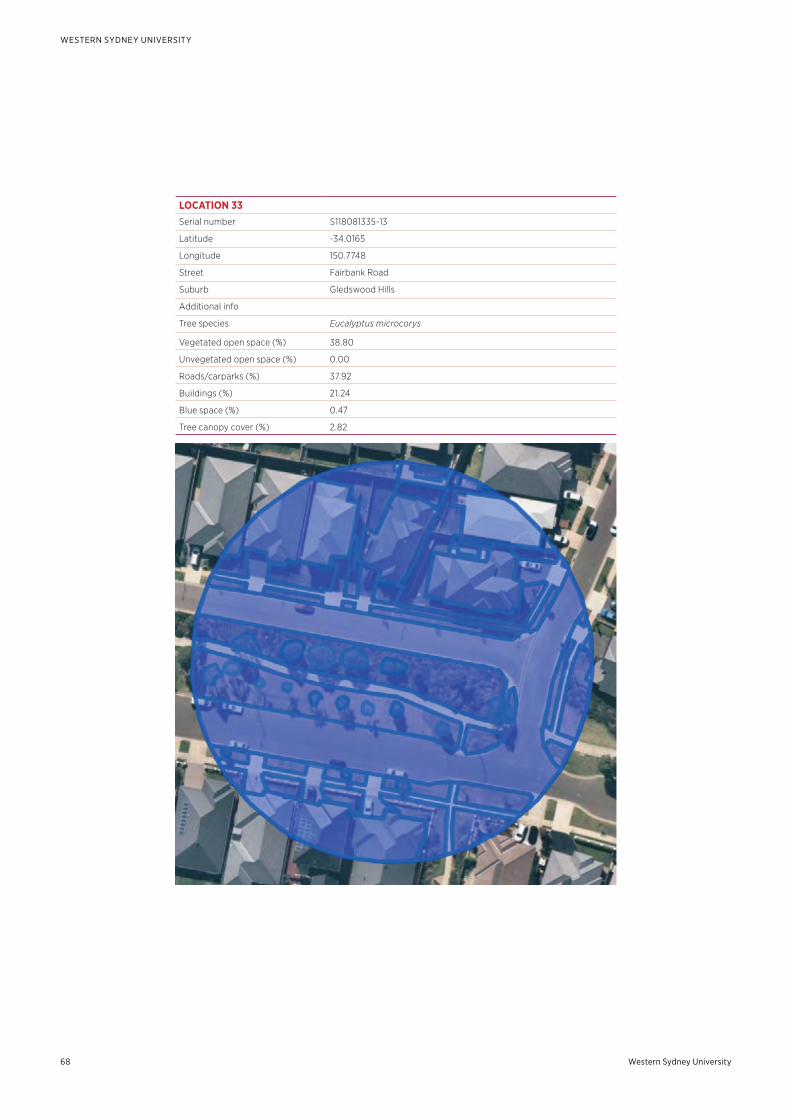
Western Sydney University68
WESTERN SYDNEY UNIVERSITY
LOCATION 33Serial number S118081335-13
Latitude -34.0165
Longitude 150.7748
Street Fairbank Road
Suburb Gledswood Hills
Additional info
Tree species Eucalyptus microcorys
Vegetated open space (%) 38.80
Unvegetated open space (%) 0.00
Roads/carparks (%) 37.92
Buildings (%) 21.24
Blue space (%) 0.47
Tree canopy cover (%) 2.82
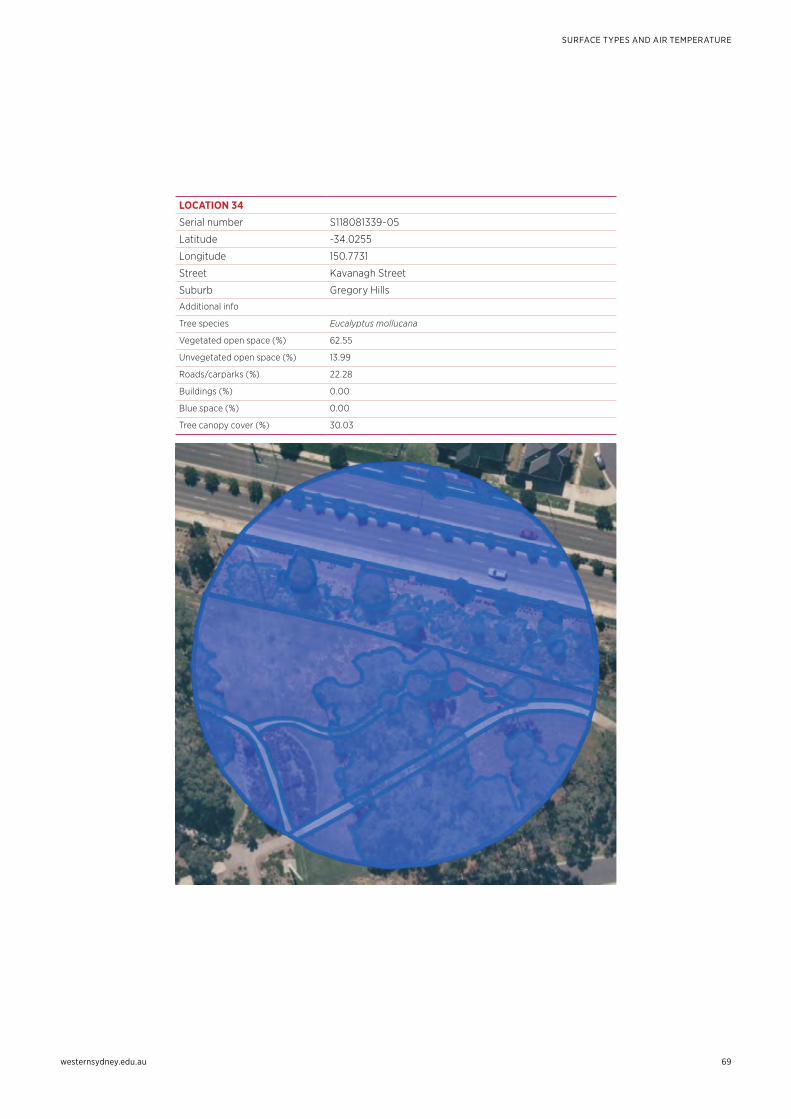
westernsydney.edu.au
SURFACE TYPES AND AIR TEMPERATURE
69
LOCATION 34
Serial number S118081339-05
Latitude -34.0255
Longitude 150.7731
Street Kavanagh Street
Suburb Gregory Hills
Additional info
Tree species Eucalyptus mollucana
Vegetated open space (%) 62.55
Unvegetated open space (%) 13.99
Roads/carparks (%) 22.28
Buildings (%) 0.00
Blue space (%) 0.00
Tree canopy cover (%) 30.03
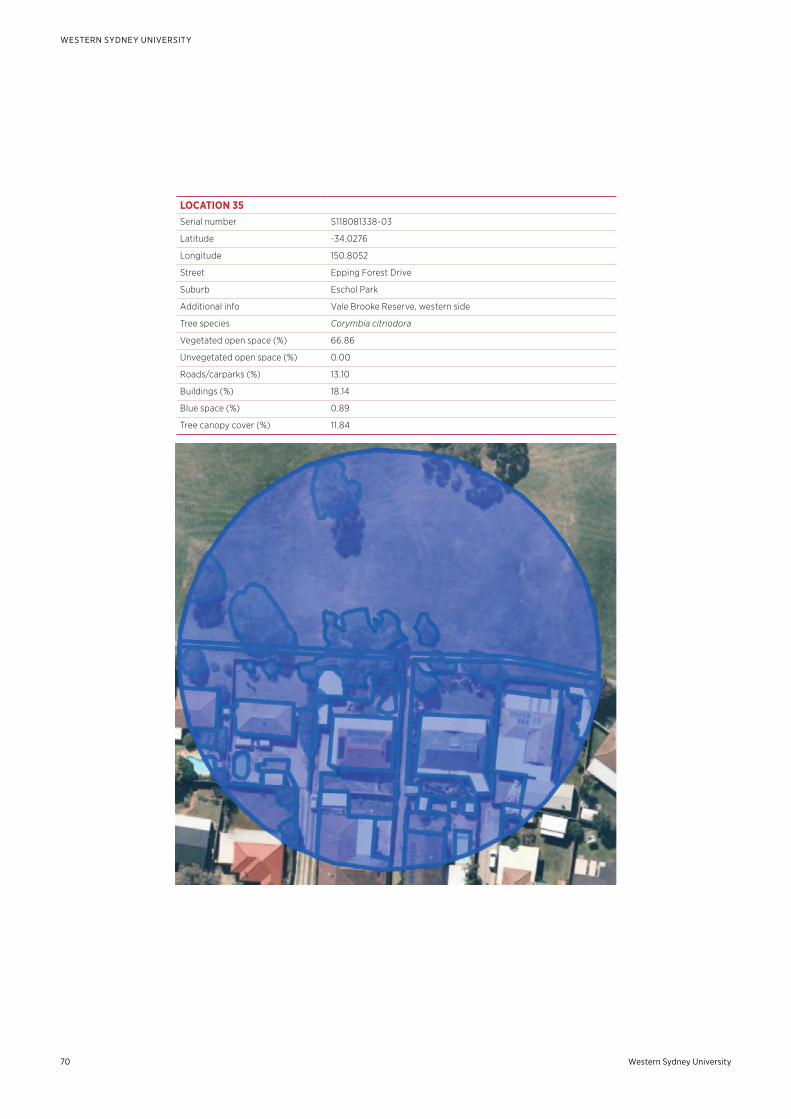
Western Sydney University70
WESTERN SYDNEY UNIVERSITY
LOCATION 35Serial number S118081338-03
Latitude -34.0276
Longitude 150.8052
Street Epping Forest Drive
Suburb Eschol Park
Additional info Vale Brooke Reserve, western side
Tree species Corymbia citriodora
Vegetated open space (%) 66.86
Unvegetated open space (%) 0.00
Roads/carparks (%) 13.10
Buildings (%) 18.14
Blue space (%) 0.89
Tree canopy cover (%) 11.84
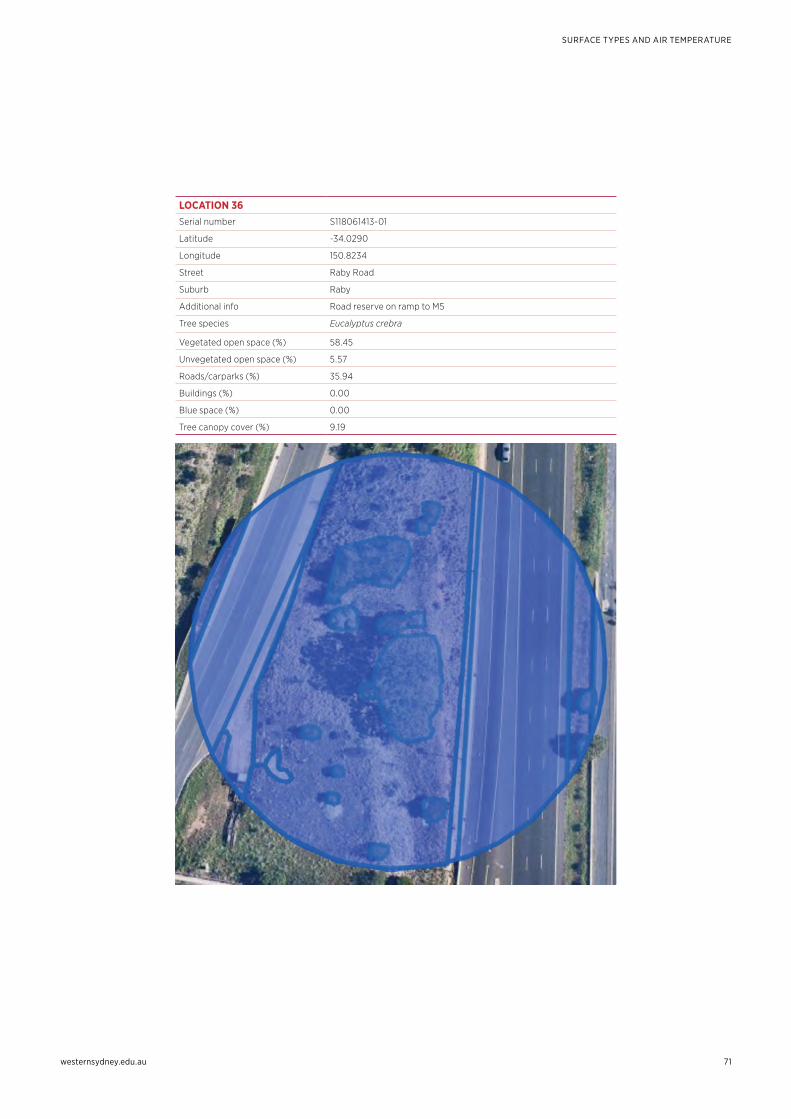
westernsydney.edu.au
SURFACE TYPES AND AIR TEMPERATURE
71
LOCATION 36Serial number S118061413-01
Latitude -34.0290
Longitude 150.8234
Street Raby Road
Suburb Raby
Additional info Road reserve on ramp to M5
Tree species Eucalyptus crebra
Vegetated open space (%) 58.45
Unvegetated open space (%) 5.57
Roads/carparks (%) 35.94
Buildings (%) 0.00
Blue space (%) 0.00
Tree canopy cover (%) 9.19
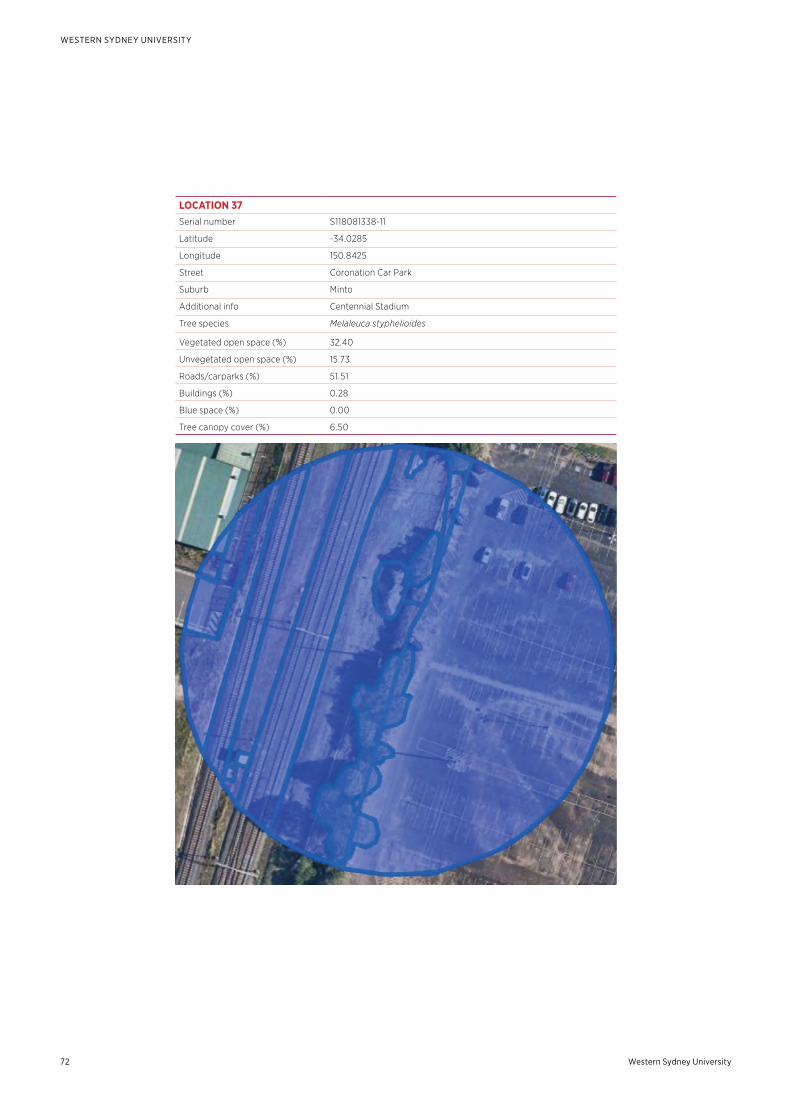
Western Sydney University72
WESTERN SYDNEY UNIVERSITY
LOCATION 37Serial number S118081338-11
Latitude -34.0285
Longitude 150.8425
Street Coronation Car Park
Suburb Minto
Additional info Centennial Stadium
Tree species Melaleuca styphelioides
Vegetated open space (%) 32.40
Unvegetated open space (%) 15.73
Roads/carparks (%) 51.51
Buildings (%) 0.28
Blue space (%) 0.00
Tree canopy cover (%) 6.50
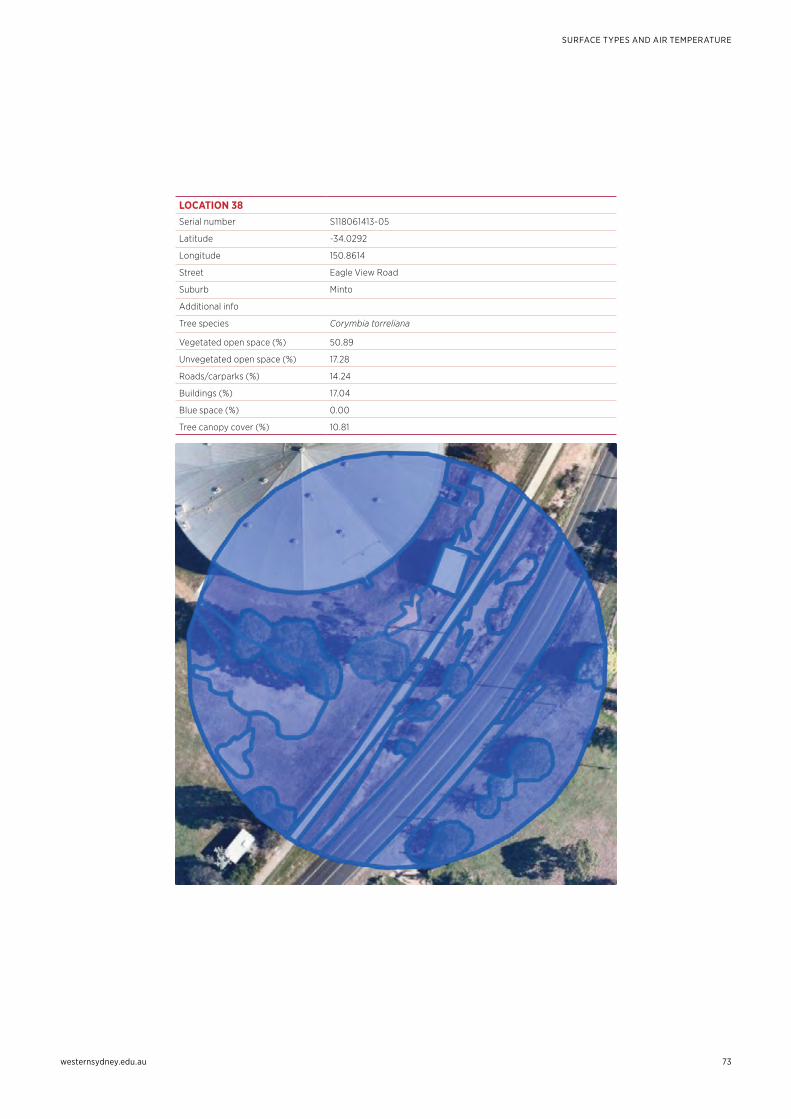
westernsydney.edu.au
SURFACE TYPES AND AIR TEMPERATURE
73
LOCATION 38Serial number S118061413-05
Latitude -34.0292
Longitude 150.8614
Street Eagle View Road
Suburb Minto
Additional info
Tree species Corymbia torreliana
Vegetated open space (%) 50.89
Unvegetated open space (%) 17.28
Roads/carparks (%) 14.24
Buildings (%) 17.04
Blue space (%) 0.00
Tree canopy cover (%) 10.81
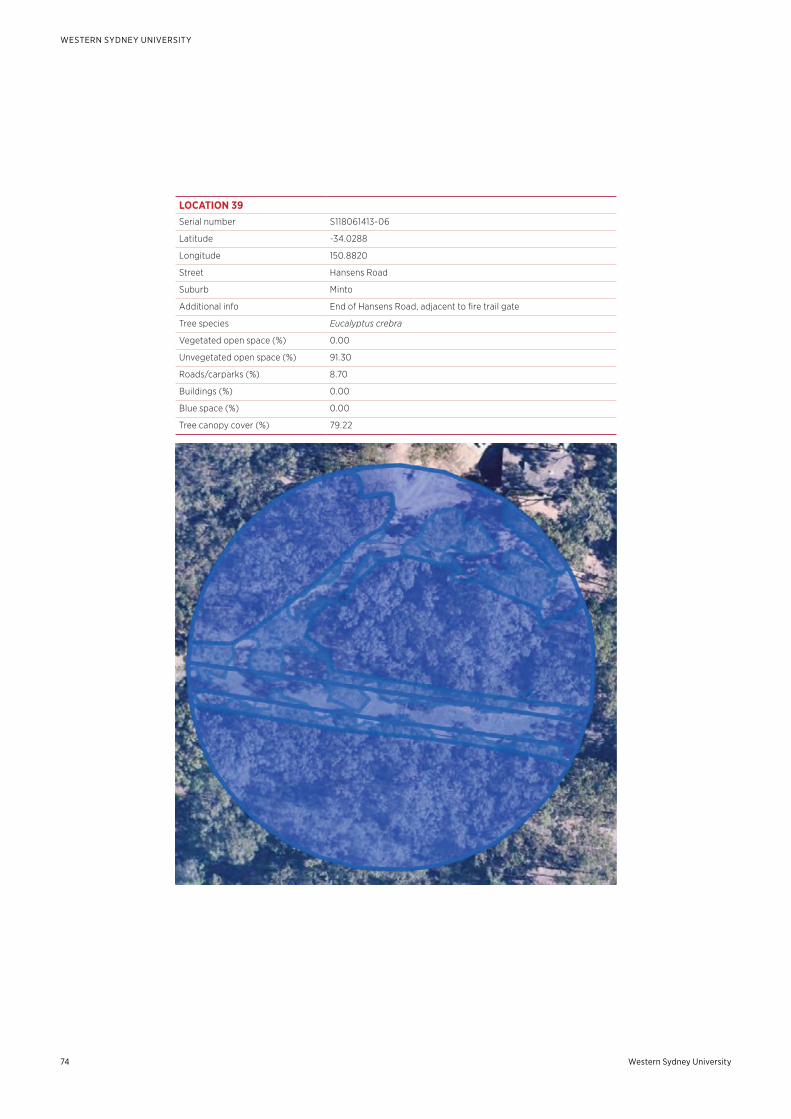
Western Sydney University74
WESTERN SYDNEY UNIVERSITY
LOCATION 39Serial number S118061413-06
Latitude -34.0288
Longitude 150.8820
Street Hansens Road
Suburb Minto
Additional info End of Hansens Road, adjacent to fire trail gate
Tree species Eucalyptus crebra
Vegetated open space (%) 0.00
Unvegetated open space (%) 91.30
Roads/carparks (%) 8.70
Buildings (%) 0.00
Blue space (%) 0.00
Tree canopy cover (%) 79.22
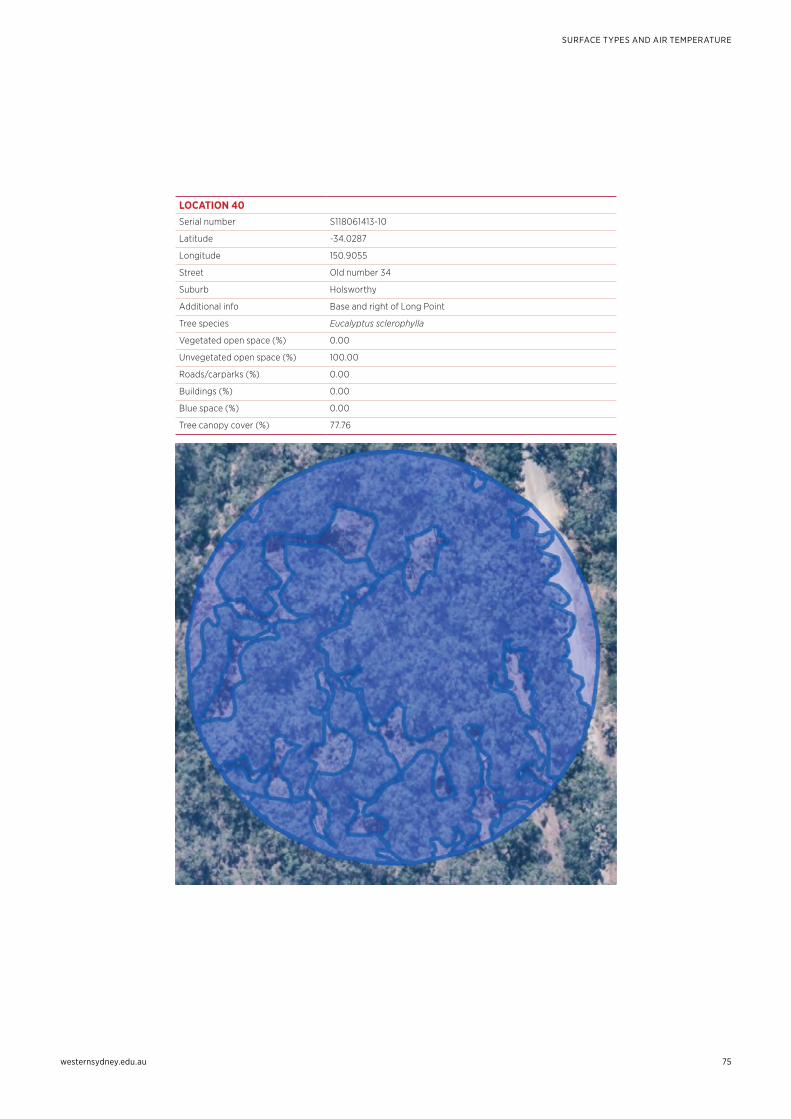
westernsydney.edu.au
SURFACE TYPES AND AIR TEMPERATURE
75
LOCATION 40Serial number S118061413-10
Latitude -34.0287
Longitude 150.9055
Street Old number 34
Suburb Holsworthy
Additional info Base and right of Long Point
Tree species Eucalyptus sclerophylla
Vegetated open space (%) 0.00
Unvegetated open space (%) 100.00
Roads/carparks (%) 0.00
Buildings (%) 0.00
Blue space (%) 0.00
Tree canopy cover (%) 77.76
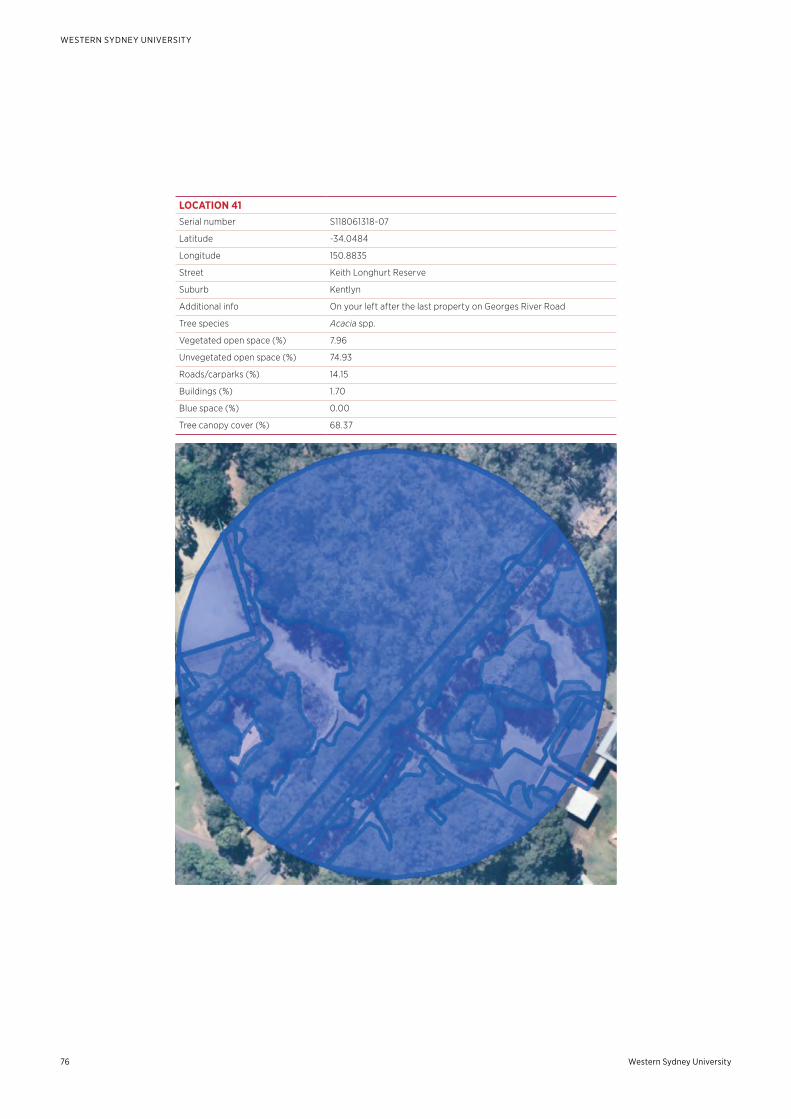
Western Sydney University76
WESTERN SYDNEY UNIVERSITY
LOCATION 41Serial number S118061318-07
Latitude -34.0484
Longitude 150.8835
Street Keith Longhurt Reserve
Suburb Kentlyn
Additional info On your left after the last property on Georges River Road
Tree species Acacia spp.
Vegetated open space (%) 7.96
Unvegetated open space (%) 74.93
Roads/carparks (%) 14.15
Buildings (%) 1.70
Blue space (%) 0.00
Tree canopy cover (%) 68.37
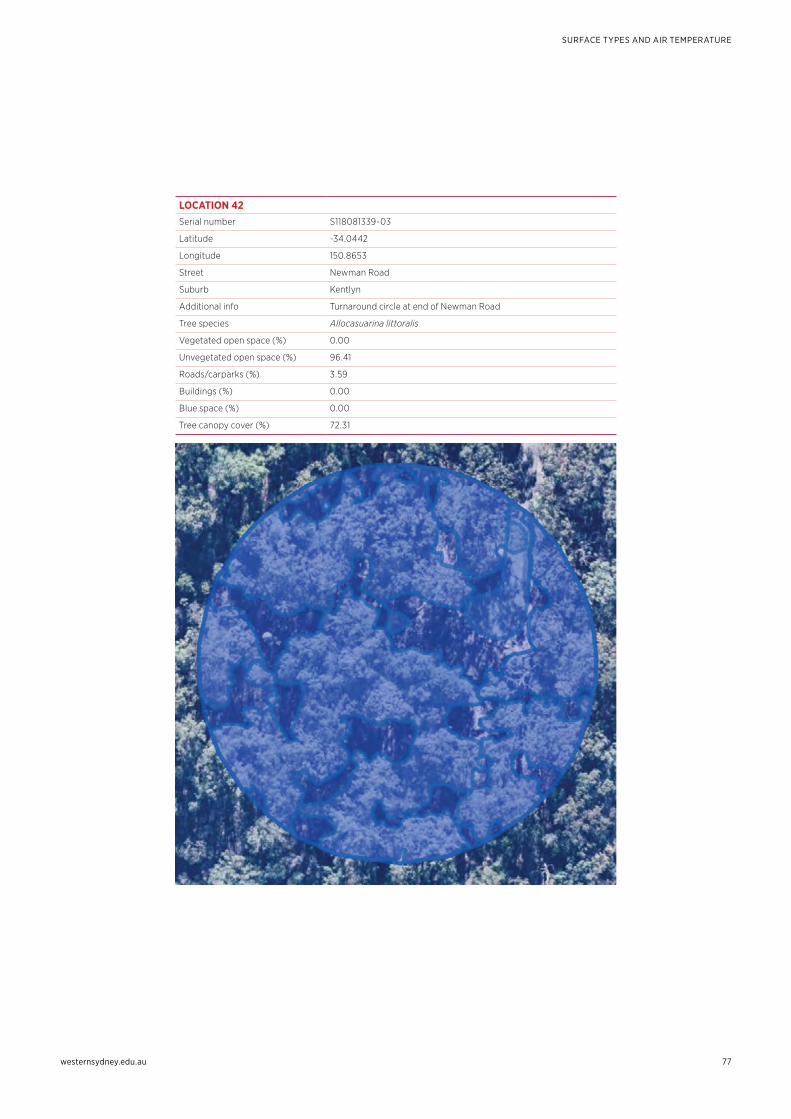
westernsydney.edu.au
SURFACE TYPES AND AIR TEMPERATURE
77
LOCATION 42Serial number S118081339-03
Latitude -34.0442
Longitude 150.8653
Street Newman Road
Suburb Kentlyn
Additional info Turnaround circle at end of Newman Road
Tree species Allocasuarina littoralis
Vegetated open space (%) 0.00
Unvegetated open space (%) 96.41
Roads/carparks (%) 3.59
Buildings (%) 0.00
Blue space (%) 0.00
Tree canopy cover (%) 72.31
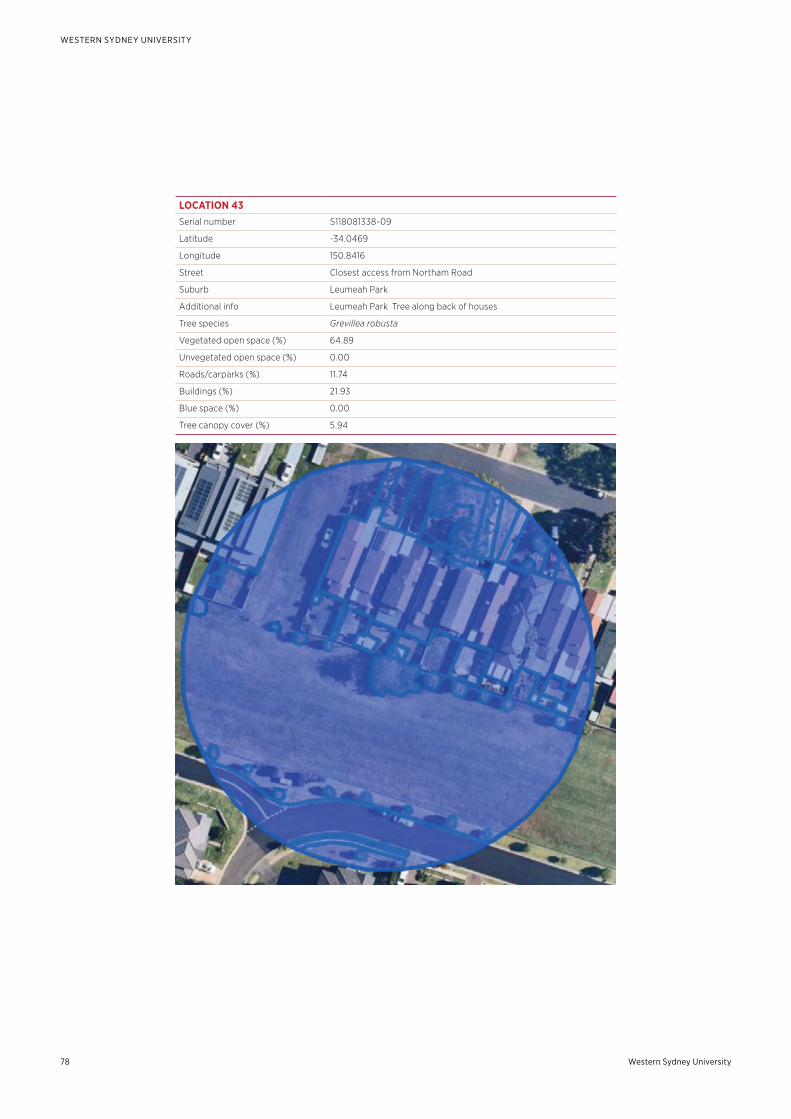
Western Sydney University78
WESTERN SYDNEY UNIVERSITY
LOCATION 43Serial number S118081338-09
Latitude -34.0469
Longitude 150.8416
Street Closest access from Northam Road
Suburb Leumeah Park
Additional info Leumeah Park Tree along back of houses
Tree species Grevillea robusta
Vegetated open space (%) 64.89
Unvegetated open space (%) 0.00
Roads/carparks (%) 11.74
Buildings (%) 21.93
Blue space (%) 0.00
Tree canopy cover (%) 5.94
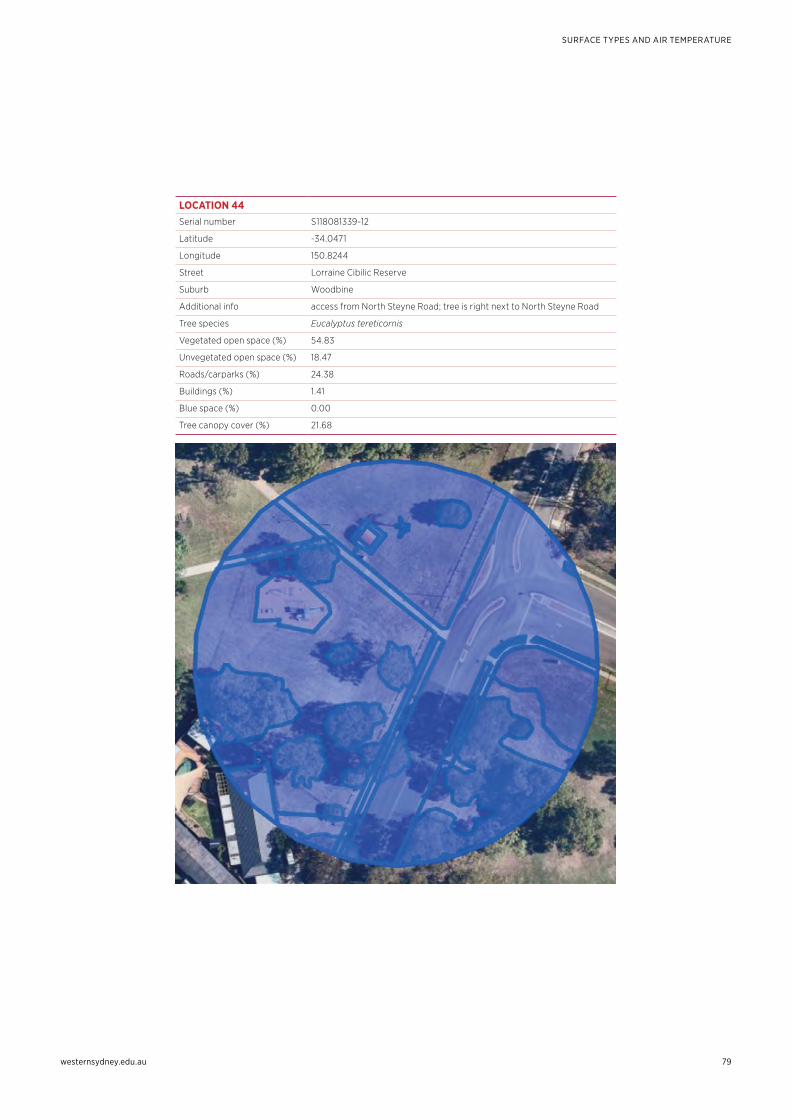
westernsydney.edu.au
SURFACE TYPES AND AIR TEMPERATURE
79
LOCATION 44Serial number S118081339-12
Latitude -34.0471
Longitude 150.8244
Street Lorraine Cibilic Reserve
Suburb Woodbine
Additional info access from North Steyne Road; tree is right next to North Steyne Road
Tree species Eucalyptus tereticornis
Vegetated open space (%) 54.83
Unvegetated open space (%) 18.47
Roads/carparks (%) 24.38
Buildings (%) 1.41
Blue space (%) 0.00
Tree canopy cover (%) 21.68
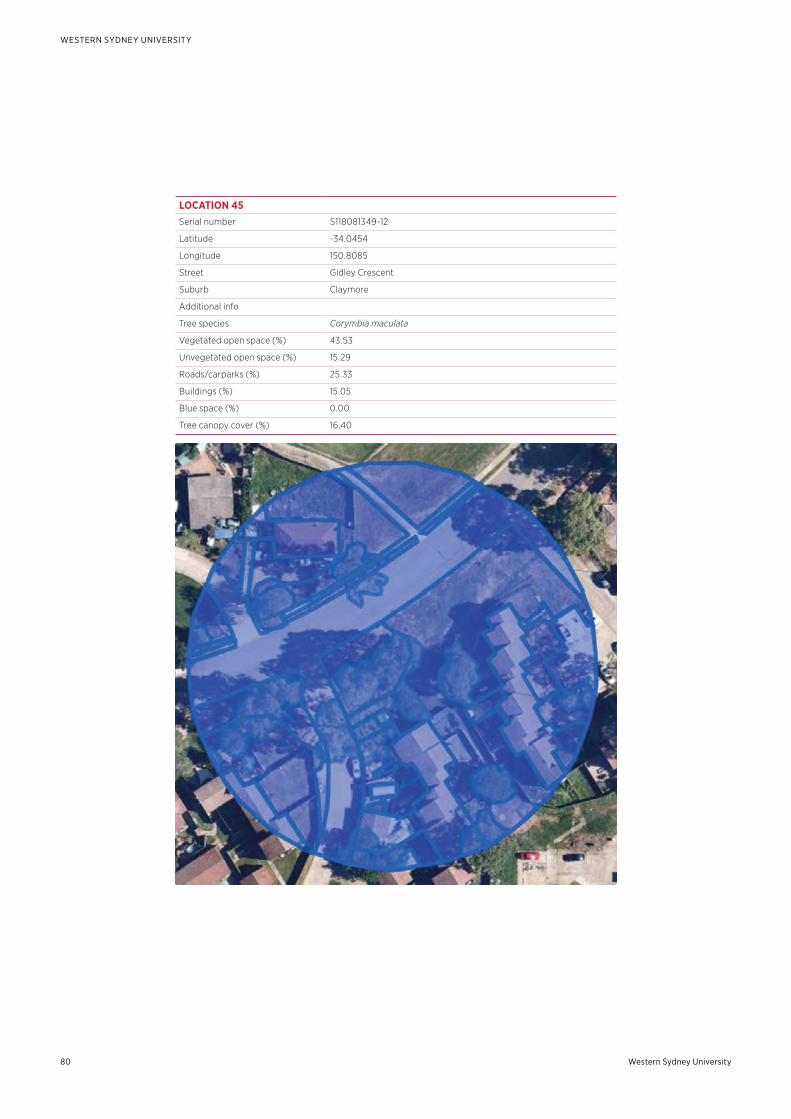
Western Sydney University80
WESTERN SYDNEY UNIVERSITY
LOCATION 45Serial number S118081349-12
Latitude -34.0454
Longitude 150.8085
Street Gidley Crescent
Suburb Claymore
Additional info
Tree species Corymbia maculata
Vegetated open space (%) 43.53
Unvegetated open space (%) 15.29
Roads/carparks (%) 25.33
Buildings (%) 15.05
Blue space (%) 0.00
Tree canopy cover (%) 16.40
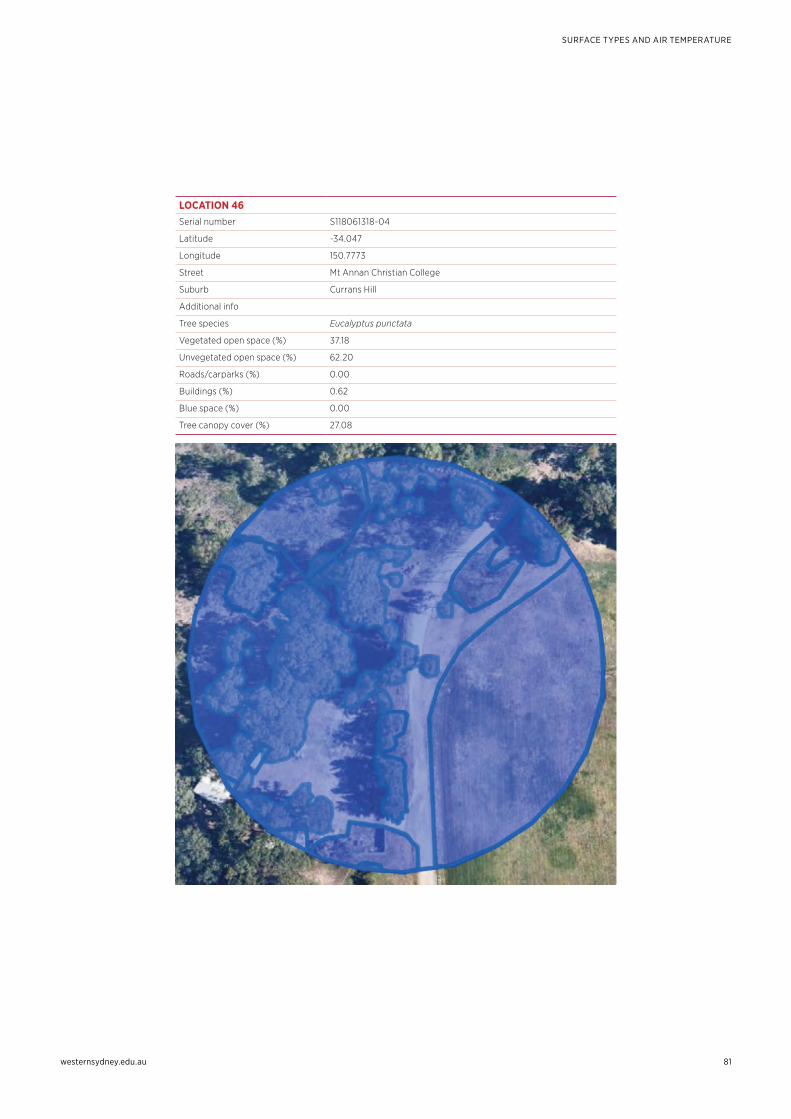
westernsydney.edu.au
SURFACE TYPES AND AIR TEMPERATURE
81
LOCATION 46Serial number S118061318-04
Latitude -34.047
Longitude 150.7773
Street Mt Annan Christian College
Suburb Currans Hill
Additional info
Tree species Eucalyptus punctata
Vegetated open space (%) 37.18
Unvegetated open space (%) 62.20
Roads/carparks (%) 0.00
Buildings (%) 0.62
Blue space (%) 0.00
Tree canopy cover (%) 27.08
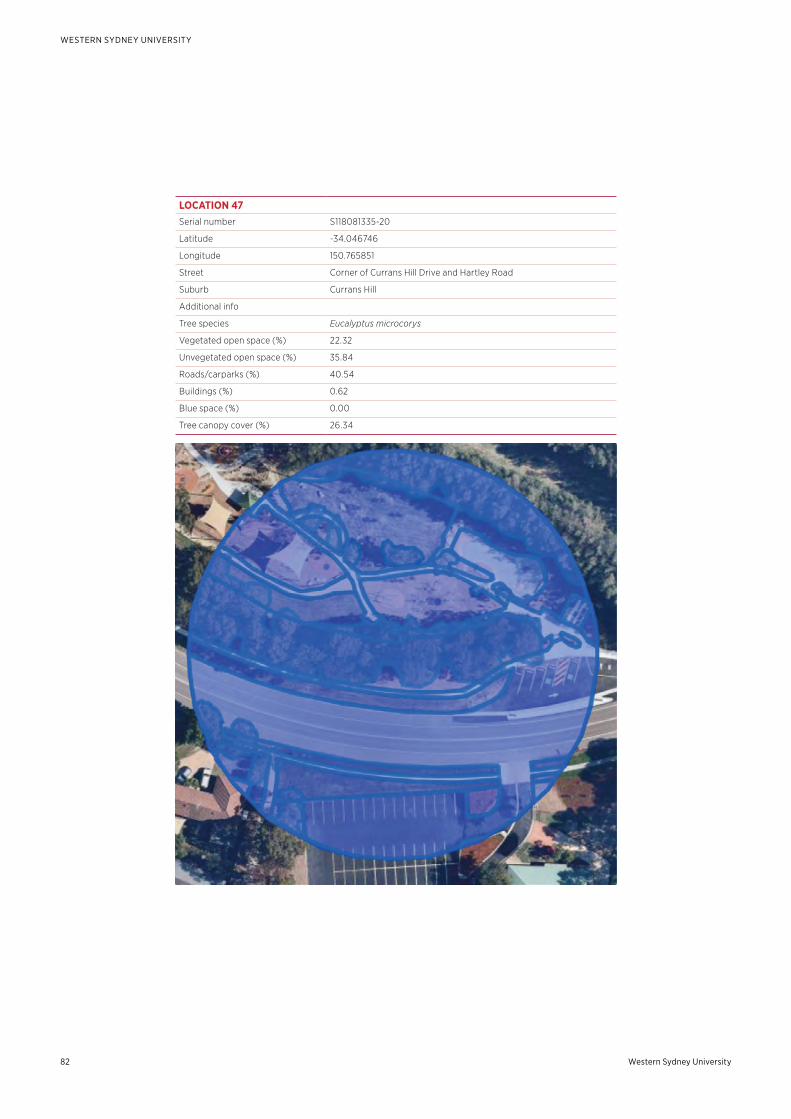
Western Sydney University82
WESTERN SYDNEY UNIVERSITY
LOCATION 47Serial number S118081335-20
Latitude -34.046746
Longitude 150.765851
Street Corner of Currans Hill Drive and Hartley Road
Suburb Currans Hill
Additional info
Tree species Eucalyptus microcorys
Vegetated open space (%) 22.32
Unvegetated open space (%) 35.84
Roads/carparks (%) 40.54
Buildings (%) 0.62
Blue space (%) 0.00
Tree canopy cover (%) 26.34
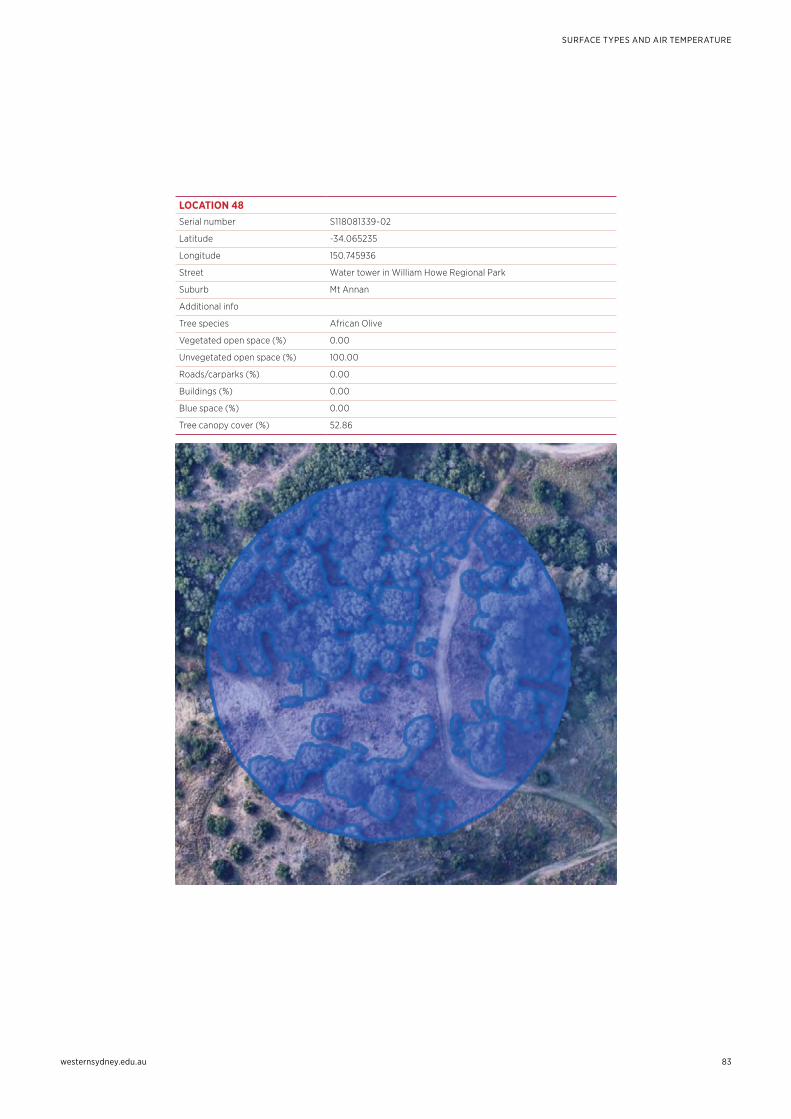
westernsydney.edu.au
SURFACE TYPES AND AIR TEMPERATURE
83
LOCATION 48Serial number S118081339-02
Latitude -34.065235
Longitude 150.745936
Street Water tower in William Howe Regional Park
Suburb Mt Annan
Additional info
Tree species African Olive
Vegetated open space (%) 0.00
Unvegetated open space (%) 100.00
Roads/carparks (%) 0.00
Buildings (%) 0.00
Blue space (%) 0.00
Tree canopy cover (%) 52.86
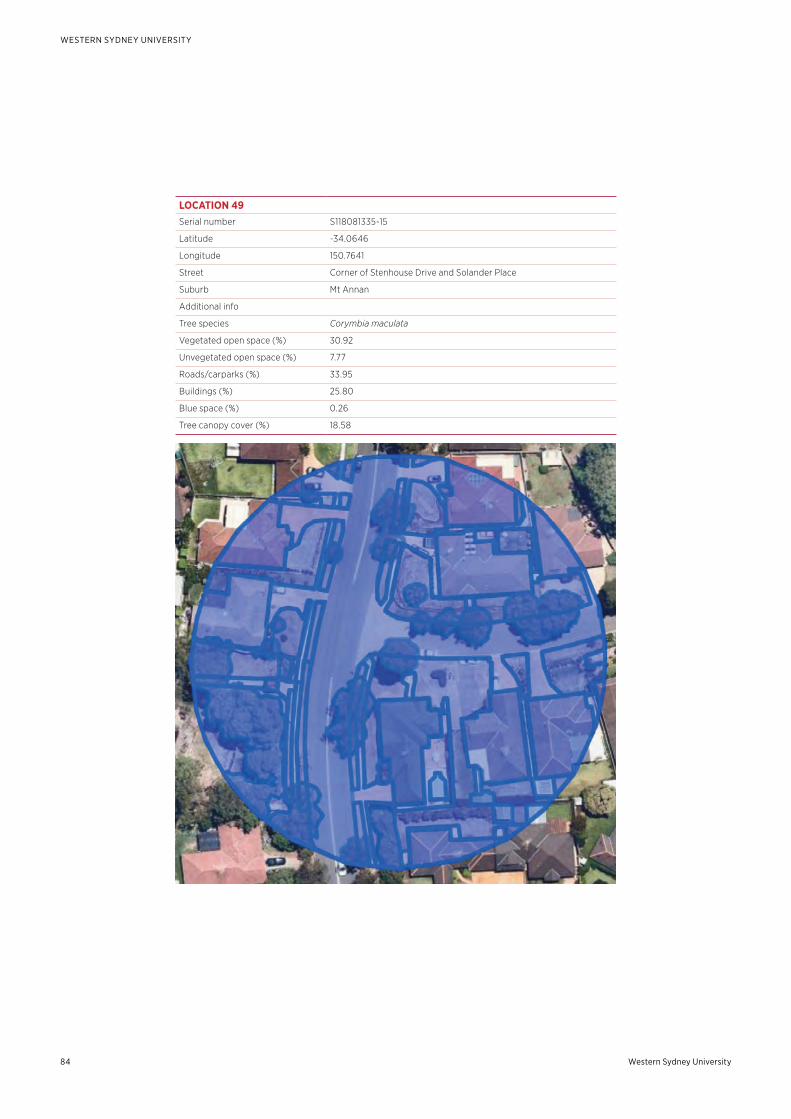
Western Sydney University84
WESTERN SYDNEY UNIVERSITY
LOCATION 49Serial number S118081335-15
Latitude -34.0646
Longitude 150.7641
Street Corner of Stenhouse Drive and Solander Place
Suburb Mt Annan
Additional info
Tree species Corymbia maculata
Vegetated open space (%) 30.92
Unvegetated open space (%) 7.77
Roads/carparks (%) 33.95
Buildings (%) 25.80
Blue space (%) 0.26
Tree canopy cover (%) 18.58
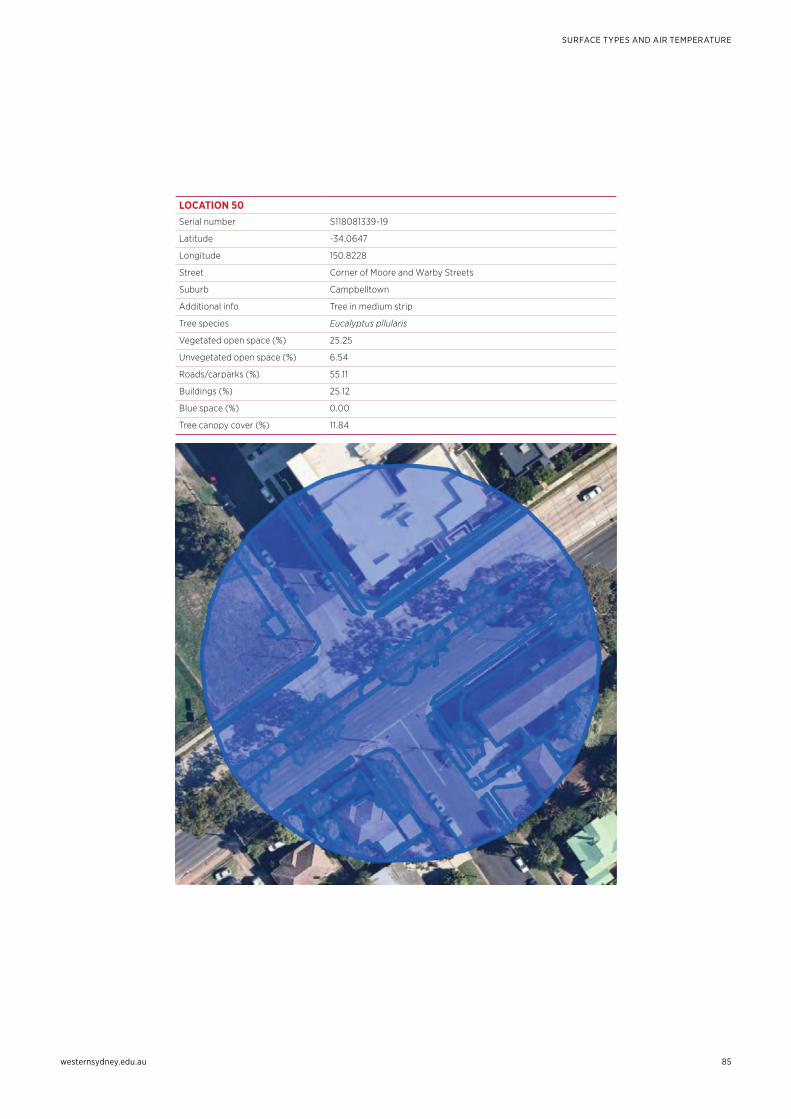
westernsydney.edu.au
SURFACE TYPES AND AIR TEMPERATURE
85
LOCATION 50Serial number S118081339-19
Latitude -34.0647
Longitude 150.8228
Street Corner of Moore and Warby Streets
Suburb Campbelltown
Additional info Tree in medium strip
Tree species Eucalyptus pllularis
Vegetated open space (%) 25.25
Unvegetated open space (%) 6.54
Roads/carparks (%) 55.11
Buildings (%) 25.12
Blue space (%) 0.00
Tree canopy cover (%) 11.84
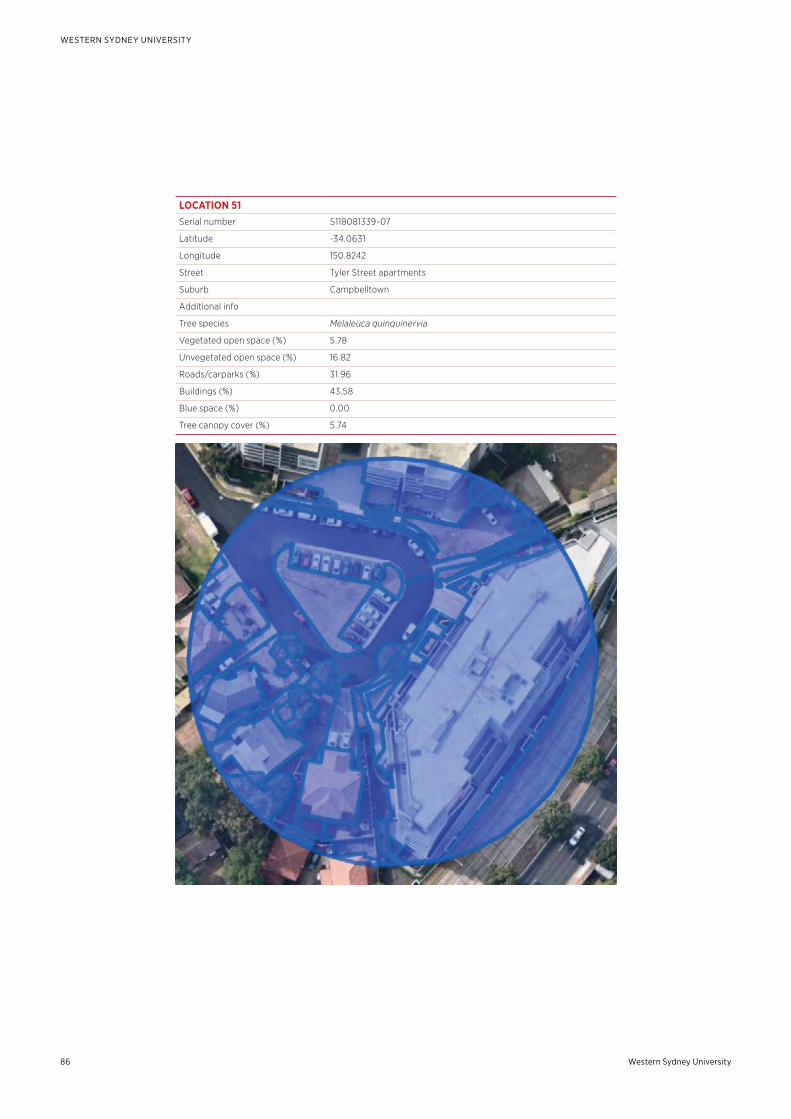
Western Sydney University86
WESTERN SYDNEY UNIVERSITY
LOCATION 51Serial number S118081339-07
Latitude -34.0631
Longitude 150.8242
Street Tyler Street apartments
Suburb Campbelltown
Additional info
Tree species Melaleuca quinquinervia
Vegetated open space (%) 5.78
Unvegetated open space (%) 16.82
Roads/carparks (%) 31.96
Buildings (%) 43.58
Blue space (%) 0.00
Tree canopy cover (%) 5.74
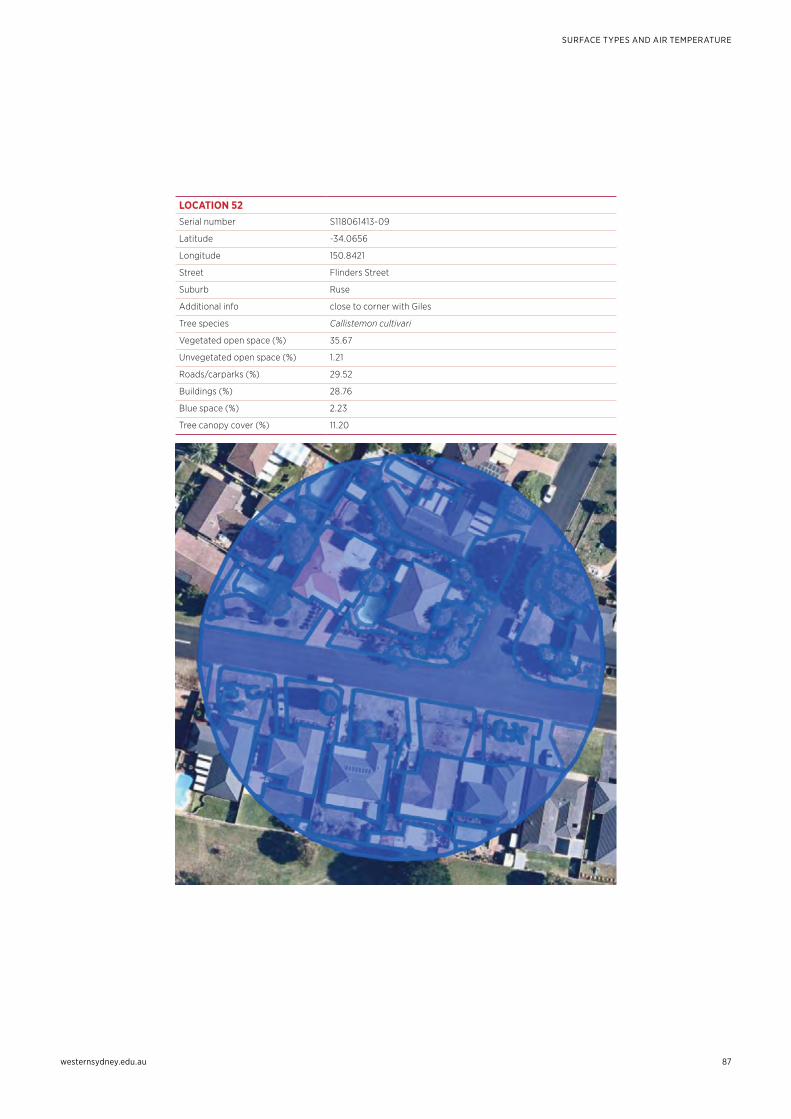
westernsydney.edu.au
SURFACE TYPES AND AIR TEMPERATURE
87
LOCATION 52Serial number S118061413-09
Latitude -34.0656
Longitude 150.8421
Street Flinders Street
Suburb Ruse
Additional info close to corner with Giles
Tree species Callistemon cultivari
Vegetated open space (%) 35.67
Unvegetated open space (%) 1.21
Roads/carparks (%) 29.52
Buildings (%) 28.76
Blue space (%) 2.23
Tree canopy cover (%) 11.20
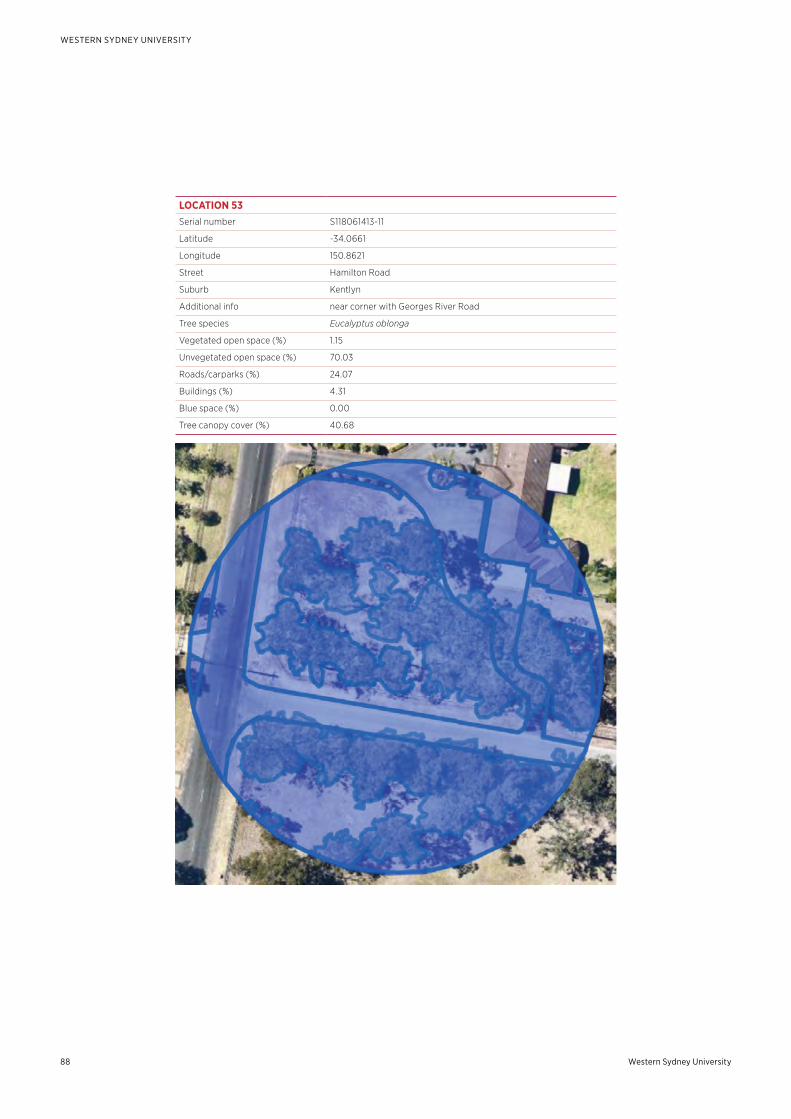
Western Sydney University88
WESTERN SYDNEY UNIVERSITY
LOCATION 53Serial number S118061413-11
Latitude -34.0661
Longitude 150.8621
Street Hamilton Road
Suburb Kentlyn
Additional info near corner with Georges River Road
Tree species Eucalyptus oblonga
Vegetated open space (%) 1.15
Unvegetated open space (%) 70.03
Roads/carparks (%) 24.07
Buildings (%) 4.31
Blue space (%) 0.00
Tree canopy cover (%) 40.68
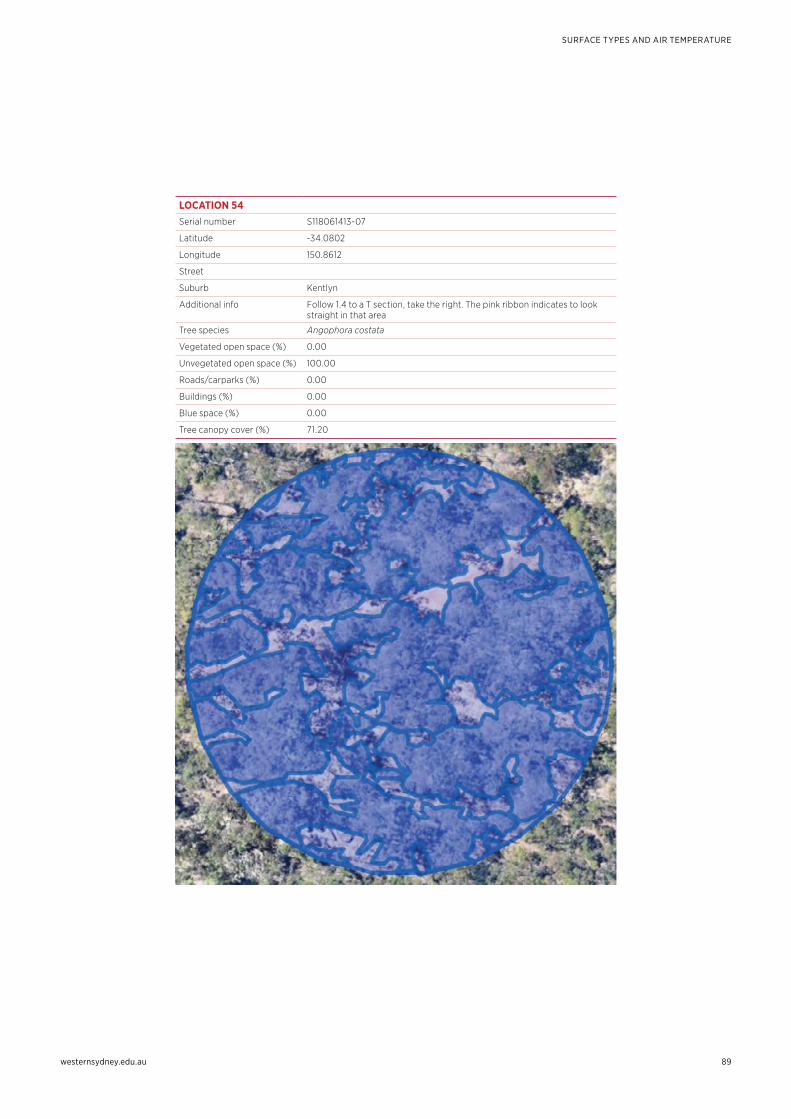
westernsydney.edu.au
SURFACE TYPES AND AIR TEMPERATURE
89
LOCATION 54Serial number S118061413-07
Latitude -34.0802
Longitude 150.8612
Street
Suburb Kentlyn
Additional info Follow 1.4 to a T section, take the right. The pink ribbon indicates to look straight in that area
Tree species Angophora costata
Vegetated open space (%) 0.00
Unvegetated open space (%) 100.00
Roads/carparks (%) 0.00
Buildings (%) 0.00
Blue space (%) 0.00
Tree canopy cover (%) 71.20
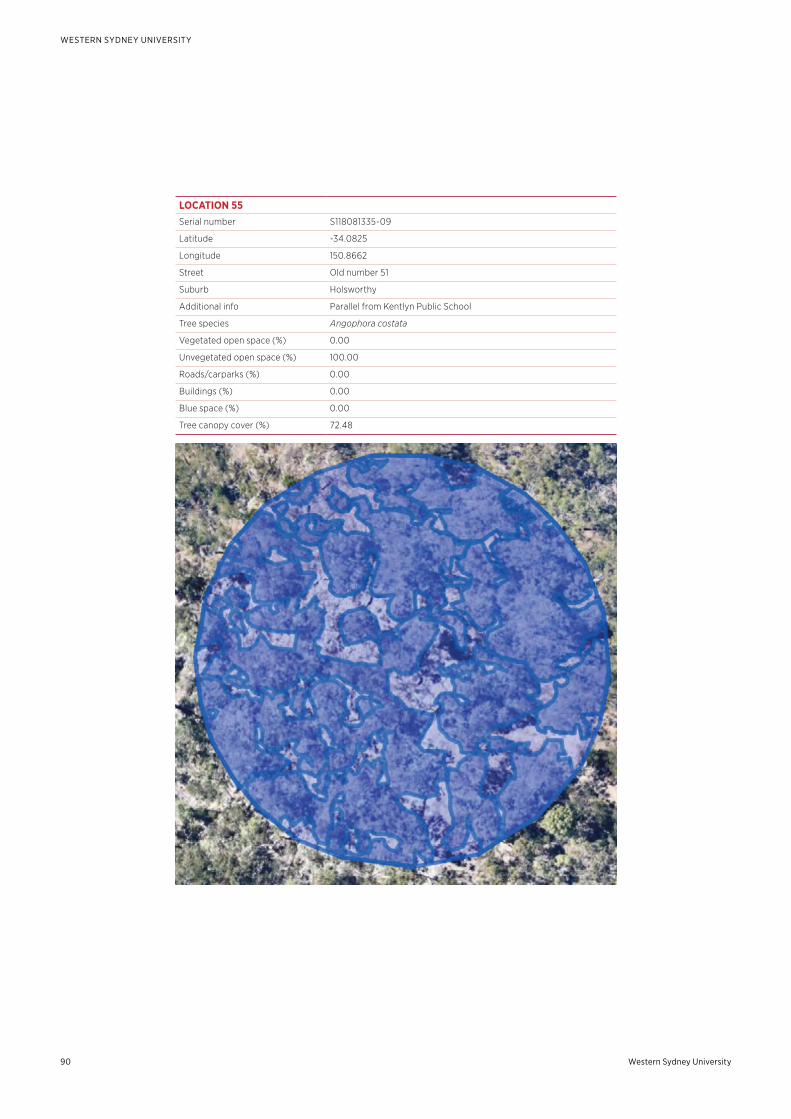
Western Sydney University90
WESTERN SYDNEY UNIVERSITY
LOCATION 55Serial number S118081335-09
Latitude -34.0825
Longitude 150.8662
Street Old number 51
Suburb Holsworthy
Additional info Parallel from Kentlyn Public School
Tree species Angophora costata
Vegetated open space (%) 0.00
Unvegetated open space (%) 100.00
Roads/carparks (%) 0.00
Buildings (%) 0.00
Blue space (%) 0.00
Tree canopy cover (%) 72.48
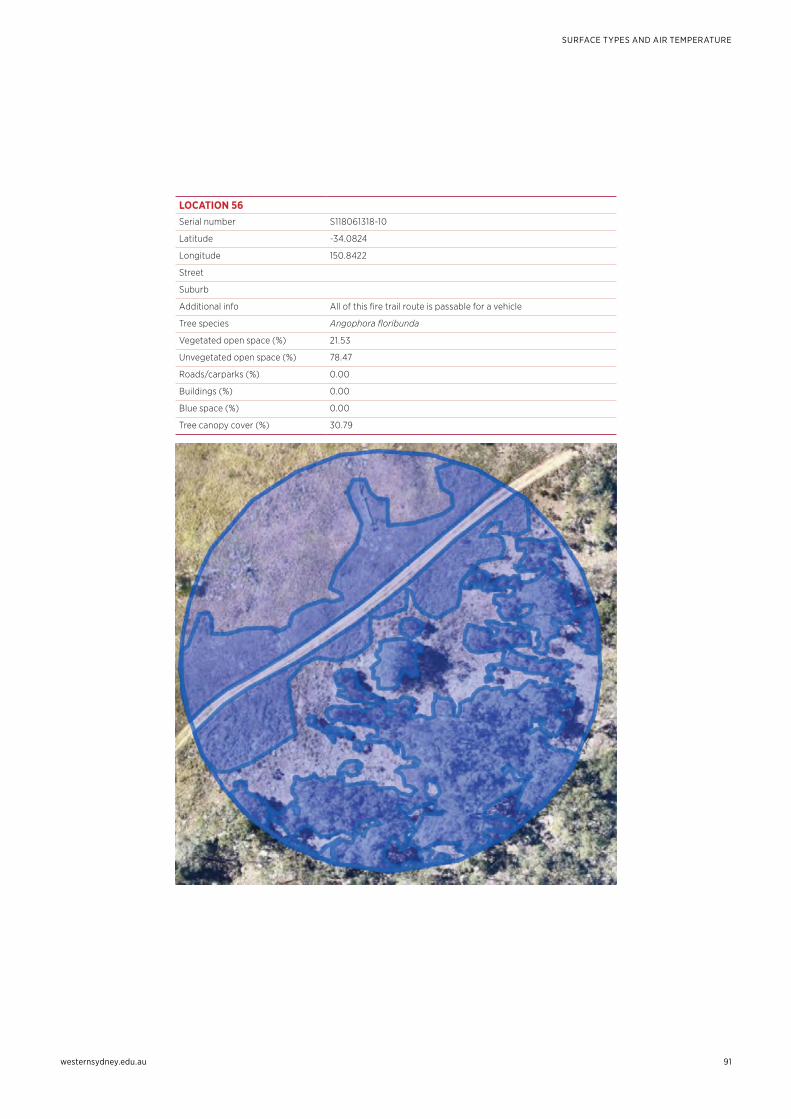
westernsydney.edu.au
SURFACE TYPES AND AIR TEMPERATURE
91
LOCATION 56Serial number S118061318-10
Latitude -34.0824
Longitude 150.8422
Street
Suburb
Additional info All of this fire trail route is passable for a vehicle
Tree species Angophora floribunda
Vegetated open space (%) 21.53
Unvegetated open space (%) 78.47
Roads/carparks (%) 0.00
Buildings (%) 0.00
Blue space (%) 0.00
Tree canopy cover (%) 30.79
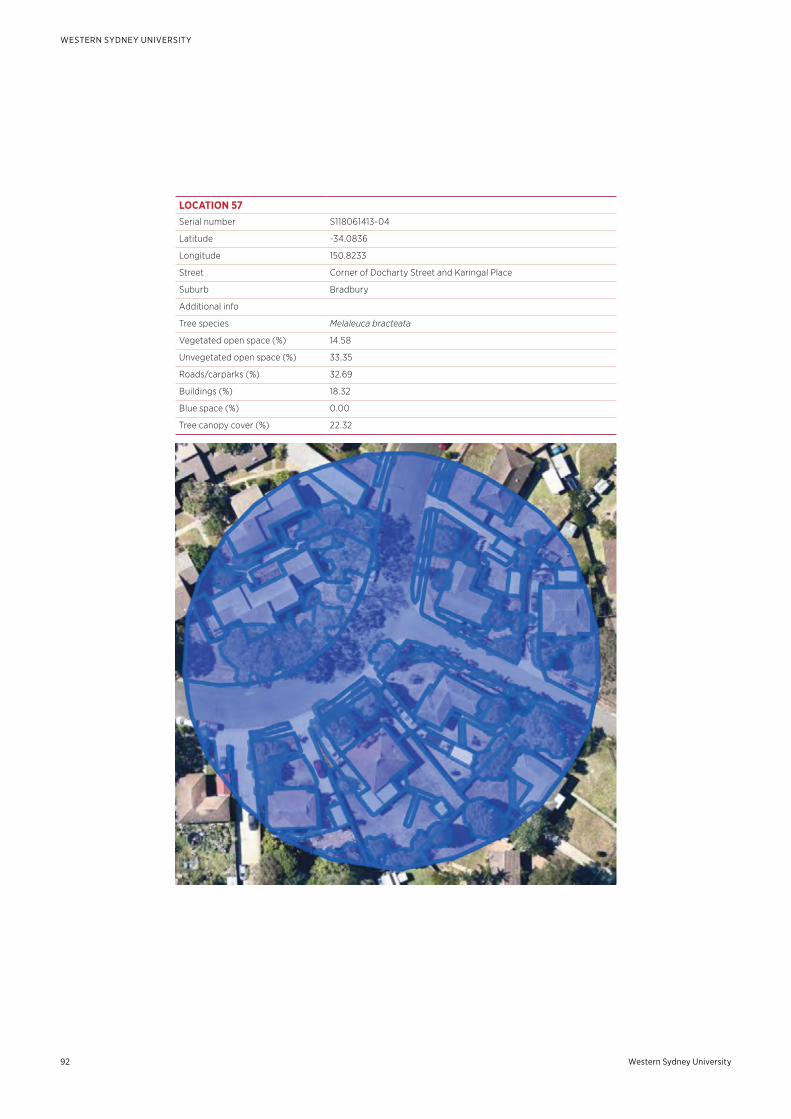
Western Sydney University92
WESTERN SYDNEY UNIVERSITY
LOCATION 57Serial number S118061413-04
Latitude -34.0836
Longitude 150.8233
Street Corner of Docharty Street and Karingal Place
Suburb Bradbury
Additional info
Tree species Melaleuca bracteata
Vegetated open space (%) 14.58
Unvegetated open space (%) 33.35
Roads/carparks (%) 32.69
Buildings (%) 18.32
Blue space (%) 0.00
Tree canopy cover (%) 22.32
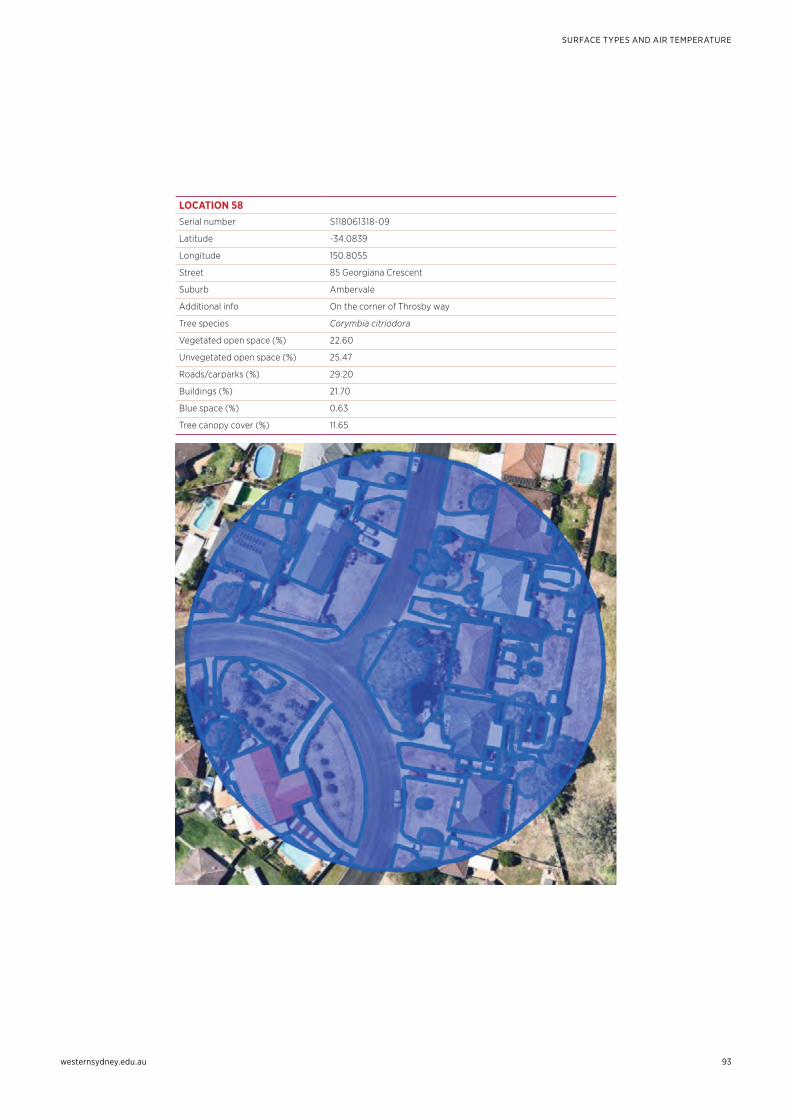
westernsydney.edu.au
SURFACE TYPES AND AIR TEMPERATURE
93
LOCATION 58Serial number S118061318-09
Latitude -34.0839
Longitude 150.8055
Street 85 Georgiana Crescent
Suburb Ambervale
Additional info On the corner of Throsby way
Tree species Corymbia citriodora
Vegetated open space (%) 22.60
Unvegetated open space (%) 25.47
Roads/carparks (%) 29.20
Buildings (%) 21.70
Blue space (%) 0.63
Tree canopy cover (%) 11.65
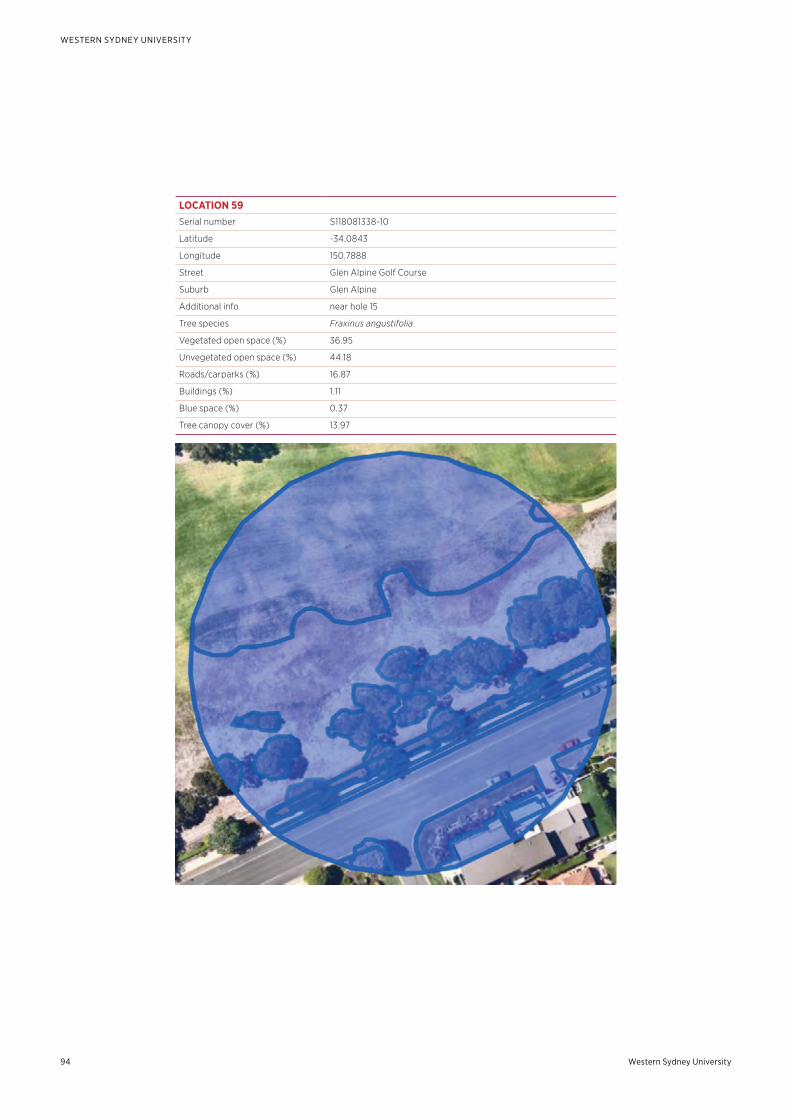
Western Sydney University94
WESTERN SYDNEY UNIVERSITY
LOCATION 59Serial number S118081338-10
Latitude -34.0843
Longitude 150.7888
Street Glen Alpine Golf Course
Suburb Glen Alpine
Additional info near hole 15
Tree species Fraxinus angustifolia
Vegetated open space (%) 36.95
Unvegetated open space (%) 44.18
Roads/carparks (%) 16.87
Buildings (%) 1.11
Blue space (%) 0.37
Tree canopy cover (%) 13.97
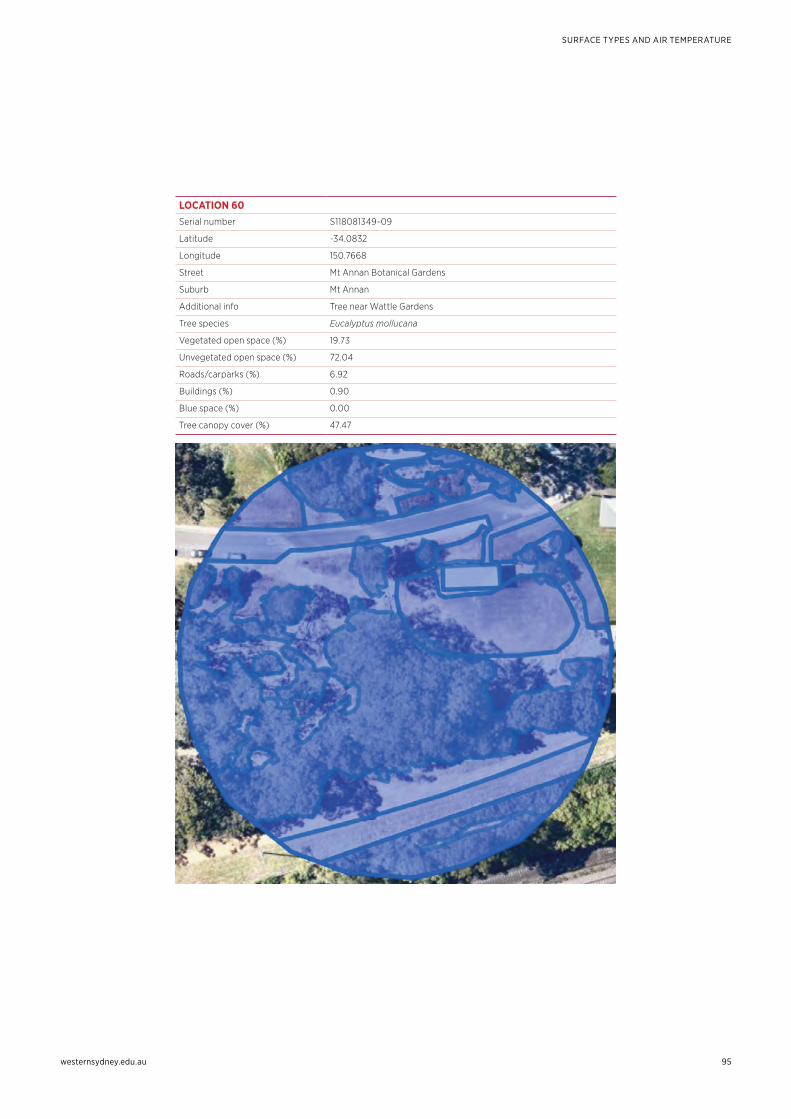
westernsydney.edu.au
SURFACE TYPES AND AIR TEMPERATURE
95
LOCATION 60Serial number S118081349-09
Latitude -34.0832
Longitude 150.7668
Street Mt Annan Botanical Gardens
Suburb Mt Annan
Additional info Tree near Wattle Gardens
Tree species Eucalyptus mollucana
Vegetated open space (%) 19.73
Unvegetated open space (%) 72.04
Roads/carparks (%) 6.92
Buildings (%) 0.90
Blue space (%) 0.00
Tree canopy cover (%) 47.47
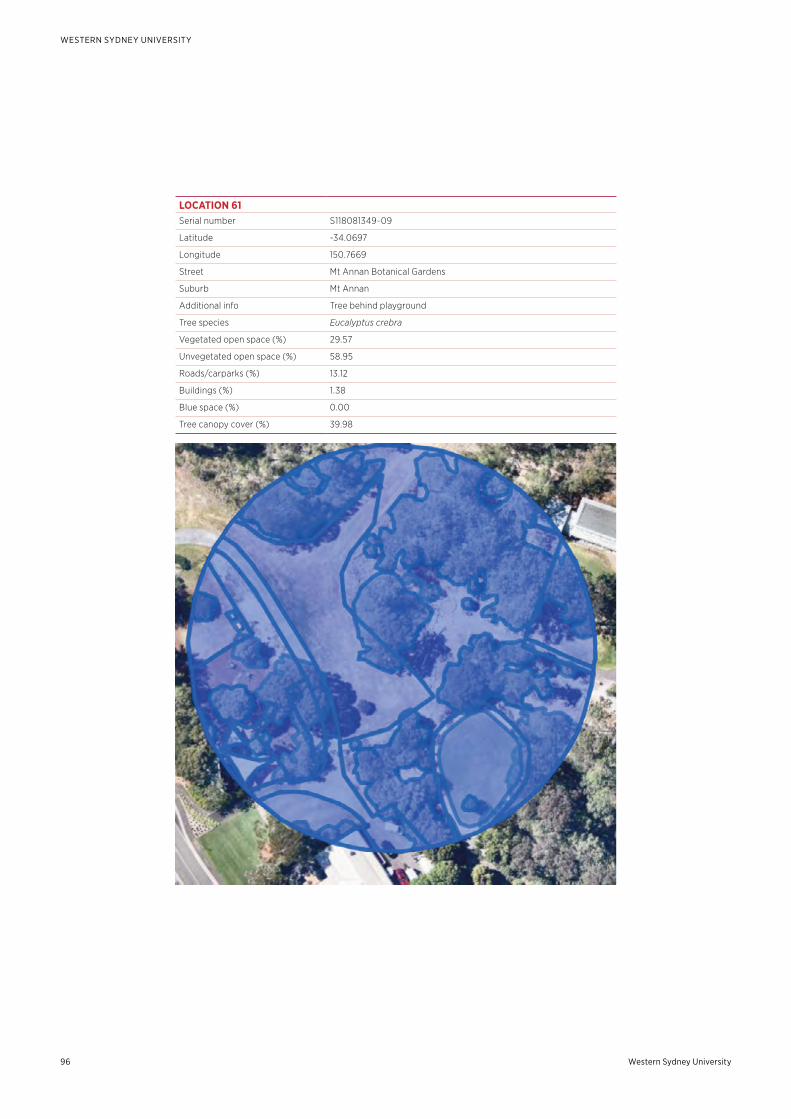
Western Sydney University96
WESTERN SYDNEY UNIVERSITY
LOCATION 61Serial number S118081349-09
Latitude -34.0697
Longitude 150.7669
Street Mt Annan Botanical Gardens
Suburb Mt Annan
Additional info Tree behind playground
Tree species Eucalyptus crebra
Vegetated open space (%) 29.57
Unvegetated open space (%) 58.95
Roads/carparks (%) 13.12
Buildings (%) 1.38
Blue space (%) 0.00
Tree canopy cover (%) 39.98
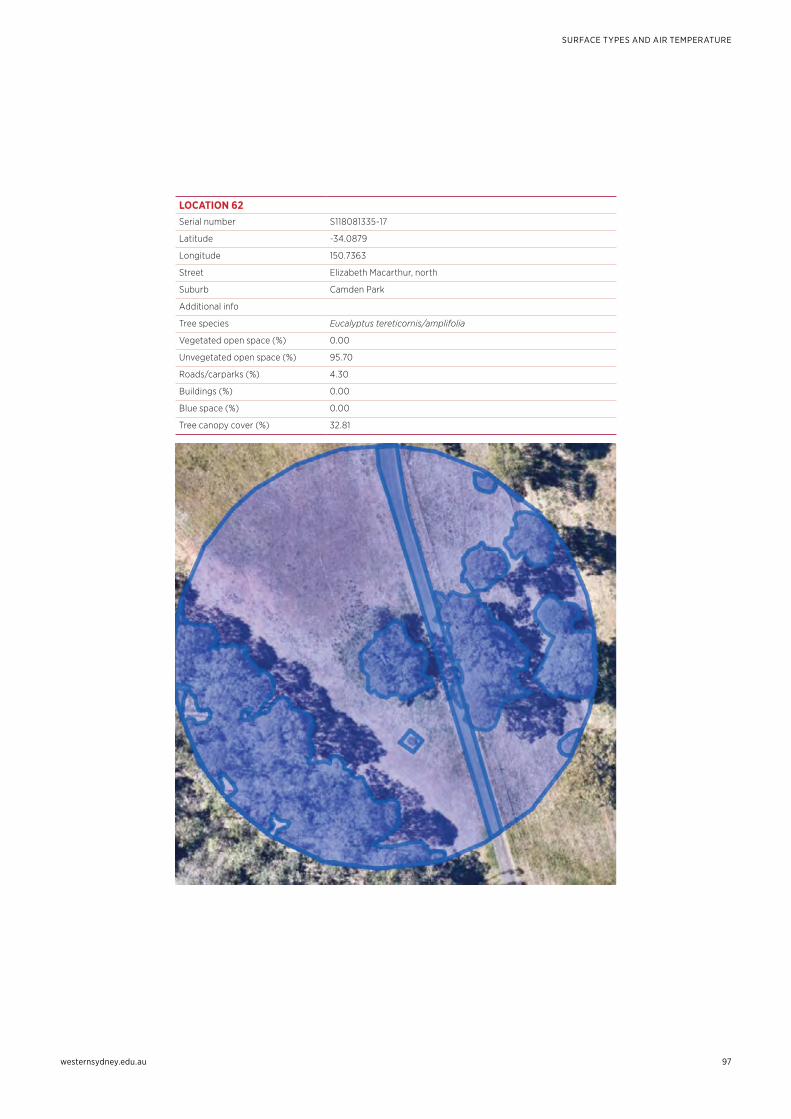
westernsydney.edu.au
SURFACE TYPES AND AIR TEMPERATURE
97
LOCATION 62Serial number S118081335-17
Latitude -34.0879
Longitude 150.7363
Street Elizabeth Macarthur, north
Suburb Camden Park
Additional info
Tree species Eucalyptus tereticornis/amplifolia
Vegetated open space (%) 0.00
Unvegetated open space (%) 95.70
Roads/carparks (%) 4.30
Buildings (%) 0.00
Blue space (%) 0.00
Tree canopy cover (%) 32.81
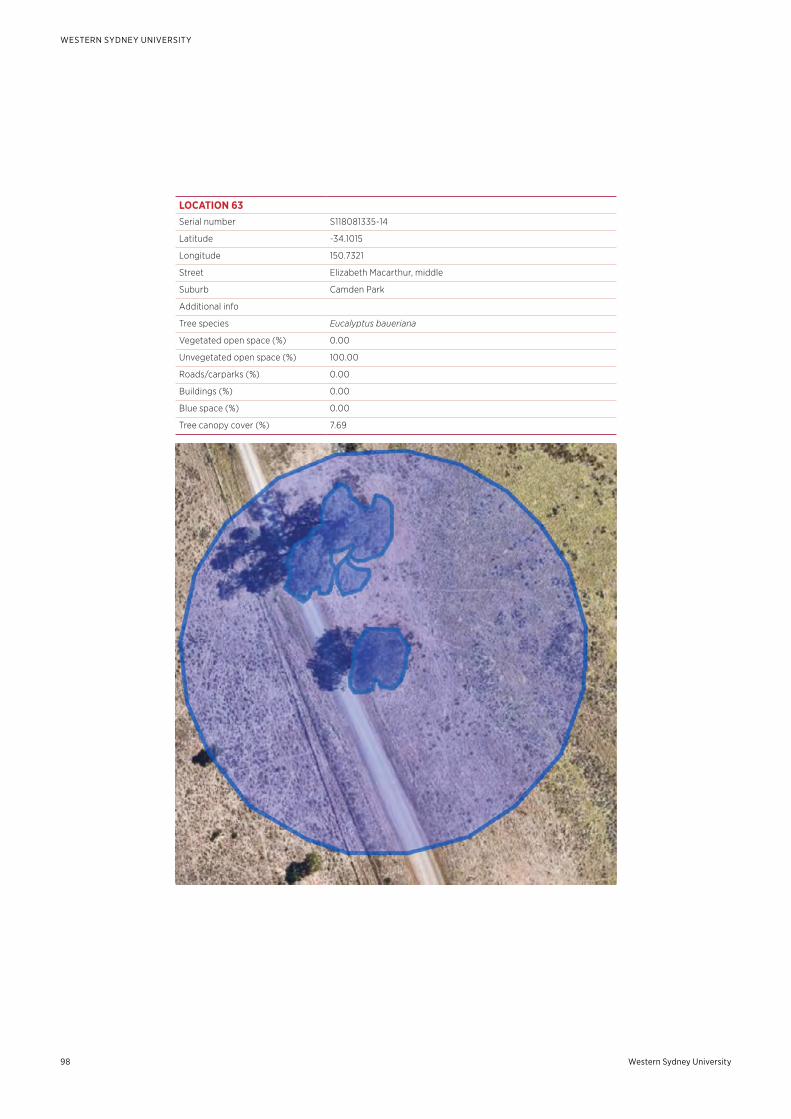
Western Sydney University98
WESTERN SYDNEY UNIVERSITY
LOCATION 63Serial number S118081335-14
Latitude -34.1015
Longitude 150.7321
Street Elizabeth Macarthur, middle
Suburb Camden Park
Additional info
Tree species Eucalyptus baueriana
Vegetated open space (%) 0.00
Unvegetated open space (%) 100.00
Roads/carparks (%) 0.00
Buildings (%) 0.00
Blue space (%) 0.00
Tree canopy cover (%) 7.69
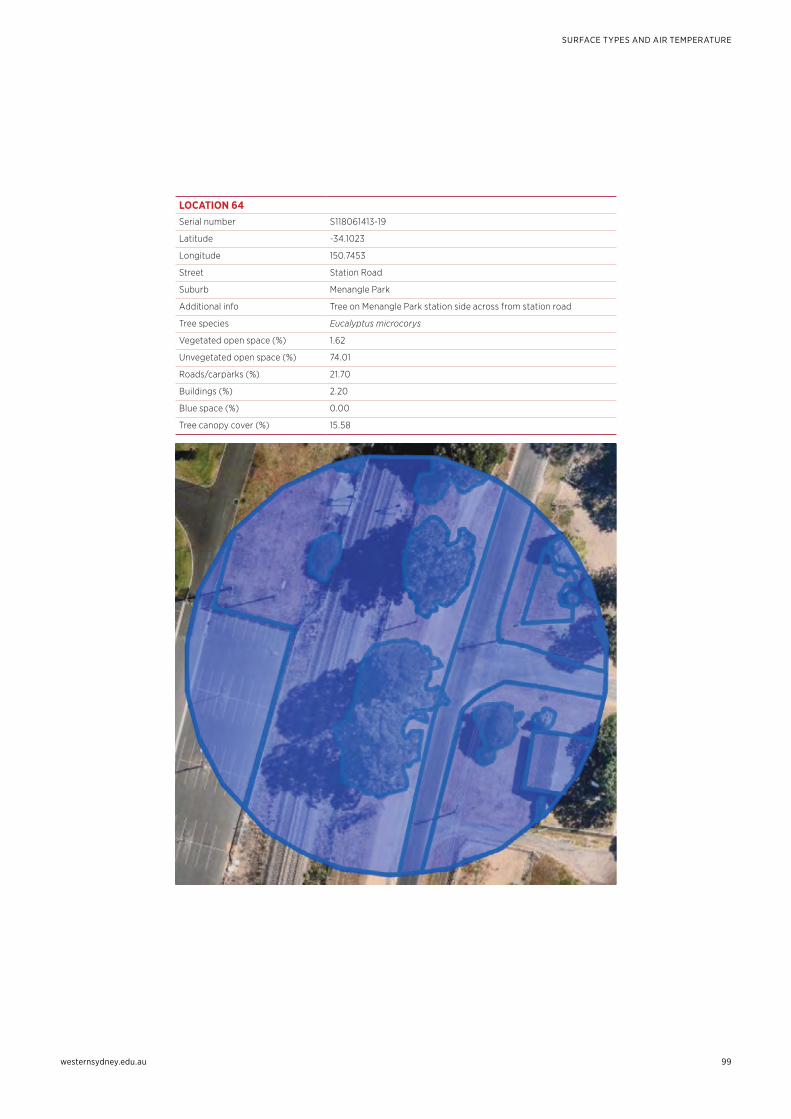
westernsydney.edu.au
SURFACE TYPES AND AIR TEMPERATURE
99
LOCATION 64Serial number S118061413-19
Latitude -34.1023
Longitude 150.7453
Street Station Road
Suburb Menangle Park
Additional info Tree on Menangle Park station side across from station road
Tree species Eucalyptus microcorys
Vegetated open space (%) 1.62
Unvegetated open space (%) 74.01
Roads/carparks (%) 21.70
Buildings (%) 2.20
Blue space (%) 0.00
Tree canopy cover (%) 15.58
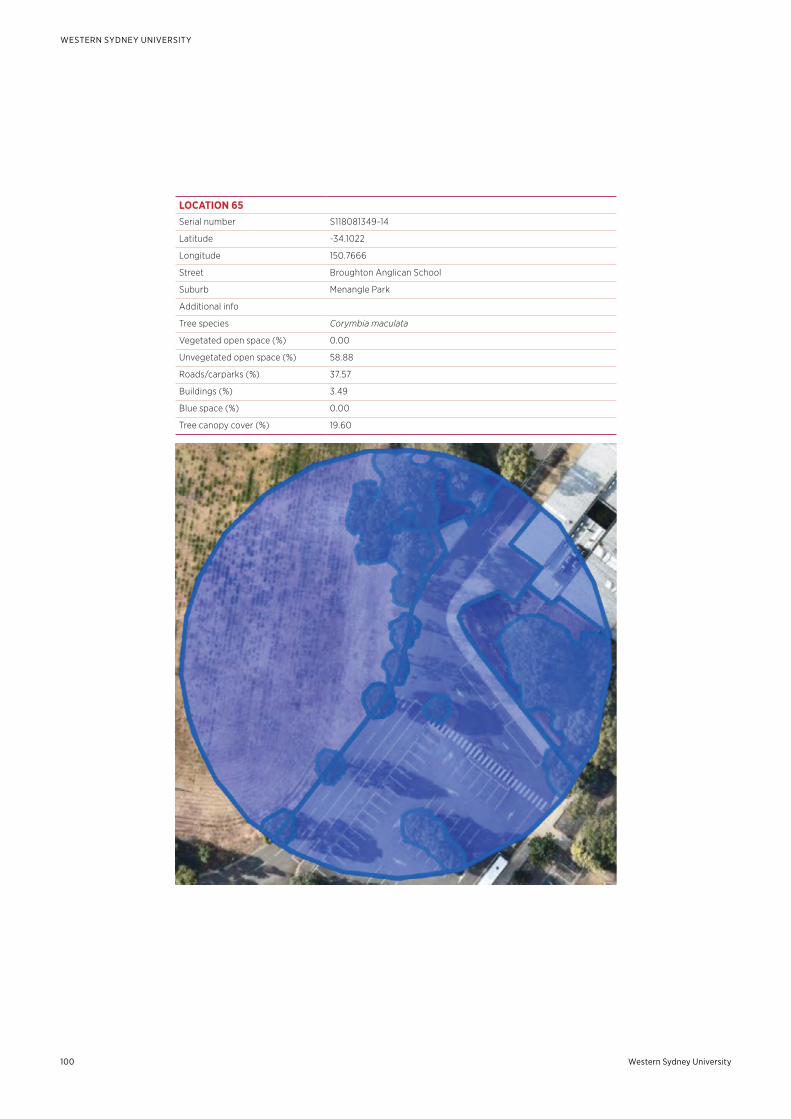
Western Sydney University100
WESTERN SYDNEY UNIVERSITY
LOCATION 65Serial number S118081349-14
Latitude -34.1022
Longitude 150.7666
Street Broughton Anglican School
Suburb Menangle Park
Additional info
Tree species Corymbia maculata
Vegetated open space (%) 0.00
Unvegetated open space (%) 58.88
Roads/carparks (%) 37.57
Buildings (%) 3.49
Blue space (%) 0.00
Tree canopy cover (%) 19.60
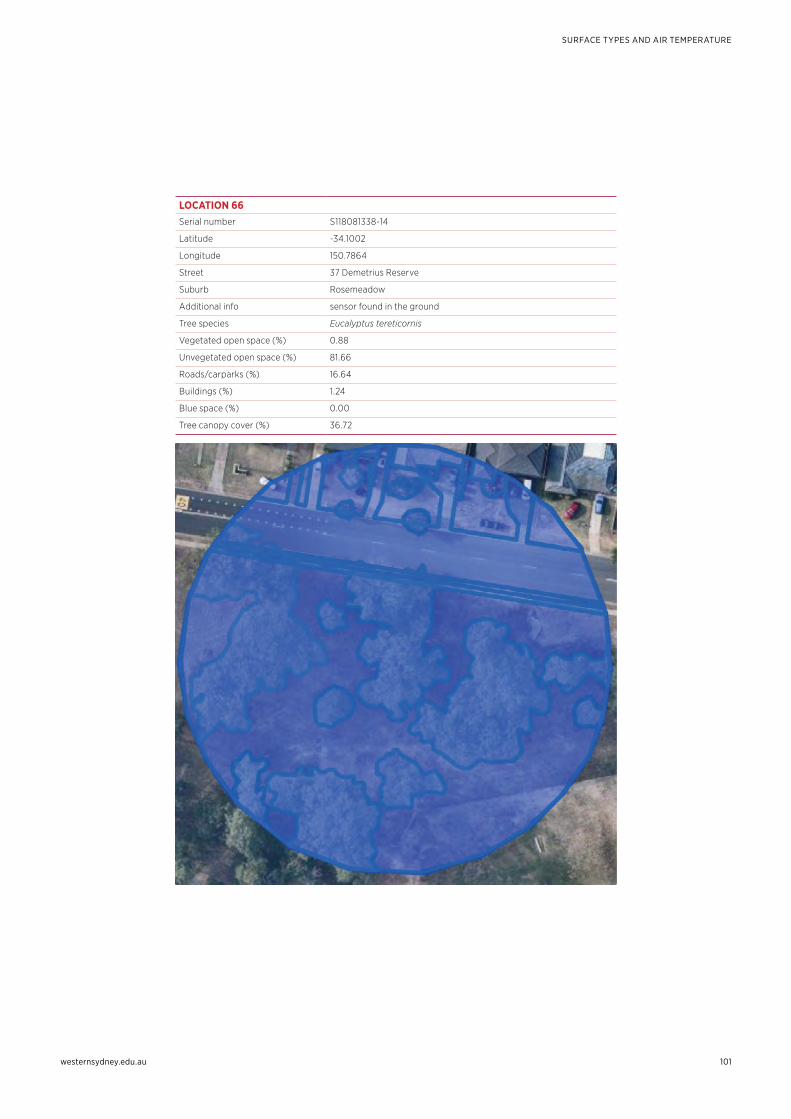
westernsydney.edu.au
SURFACE TYPES AND AIR TEMPERATURE
101
LOCATION 66Serial number S118081338-14
Latitude -34.1002
Longitude 150.7864
Street 37 Demetrius Reserve
Suburb Rosemeadow
Additional info sensor found in the ground
Tree species Eucalyptus tereticornis
Vegetated open space (%) 0.88
Unvegetated open space (%) 81.66
Roads/carparks (%) 16.64
Buildings (%) 1.24
Blue space (%) 0.00
Tree canopy cover (%) 36.72
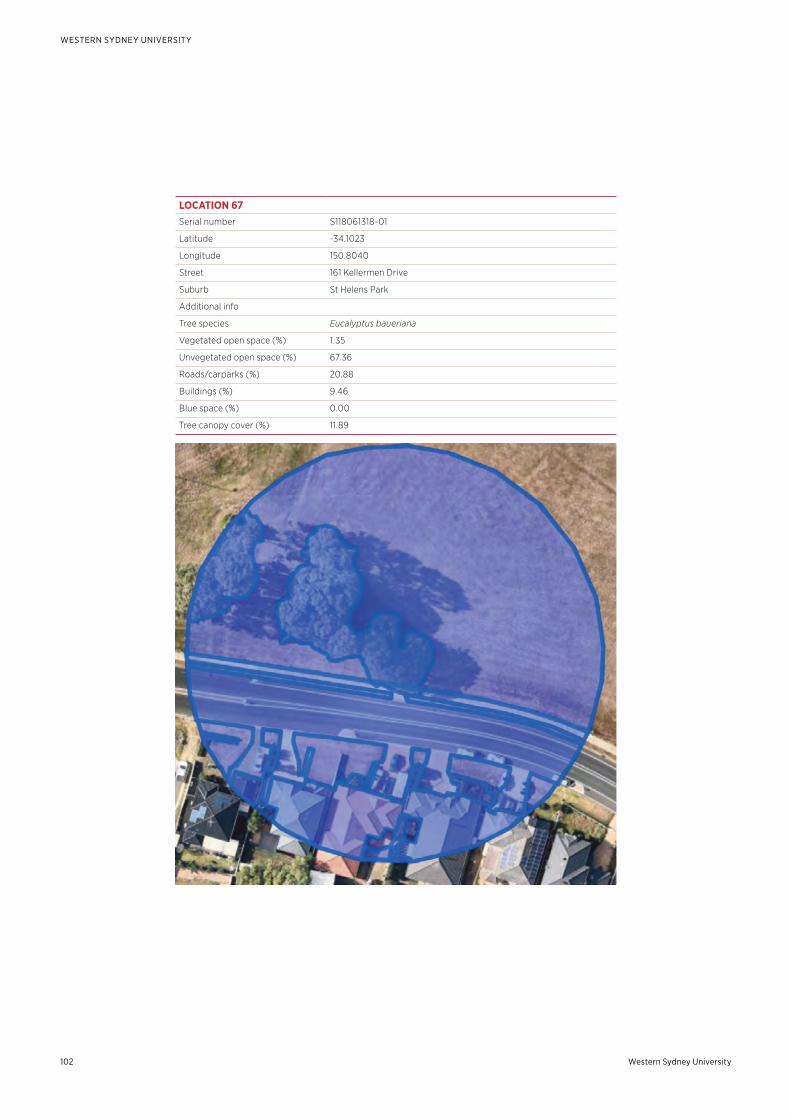
Western Sydney University102
WESTERN SYDNEY UNIVERSITY
LOCATION 67Serial number S118061318-01
Latitude -34.1023
Longitude 150.8040
Street 161 Kellermen Drive
Suburb St Helens Park
Additional info
Tree species Eucalyptus baueriana
Vegetated open space (%) 1.35
Unvegetated open space (%) 67.36
Roads/carparks (%) 20.88
Buildings (%) 9.46
Blue space (%) 0.00
Tree canopy cover (%) 11.89
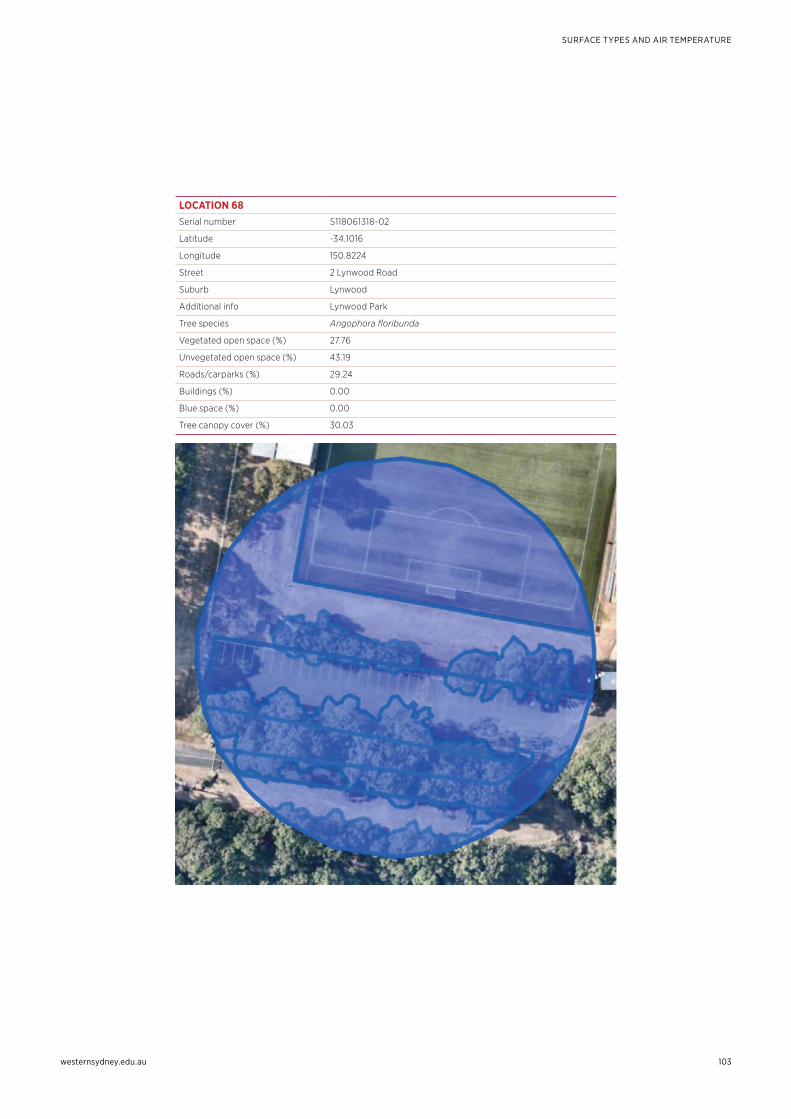
westernsydney.edu.au
SURFACE TYPES AND AIR TEMPERATURE
103
LOCATION 68Serial number S118061318-02
Latitude -34.1016
Longitude 150.8224
Street 2 Lynwood Road
Suburb Lynwood
Additional info Lynwood Park
Tree species Angophora floribunda
Vegetated open space (%) 27.76
Unvegetated open space (%) 43.19
Roads/carparks (%) 29.24
Buildings (%) 0.00
Blue space (%) 0.00
Tree canopy cover (%) 30.03
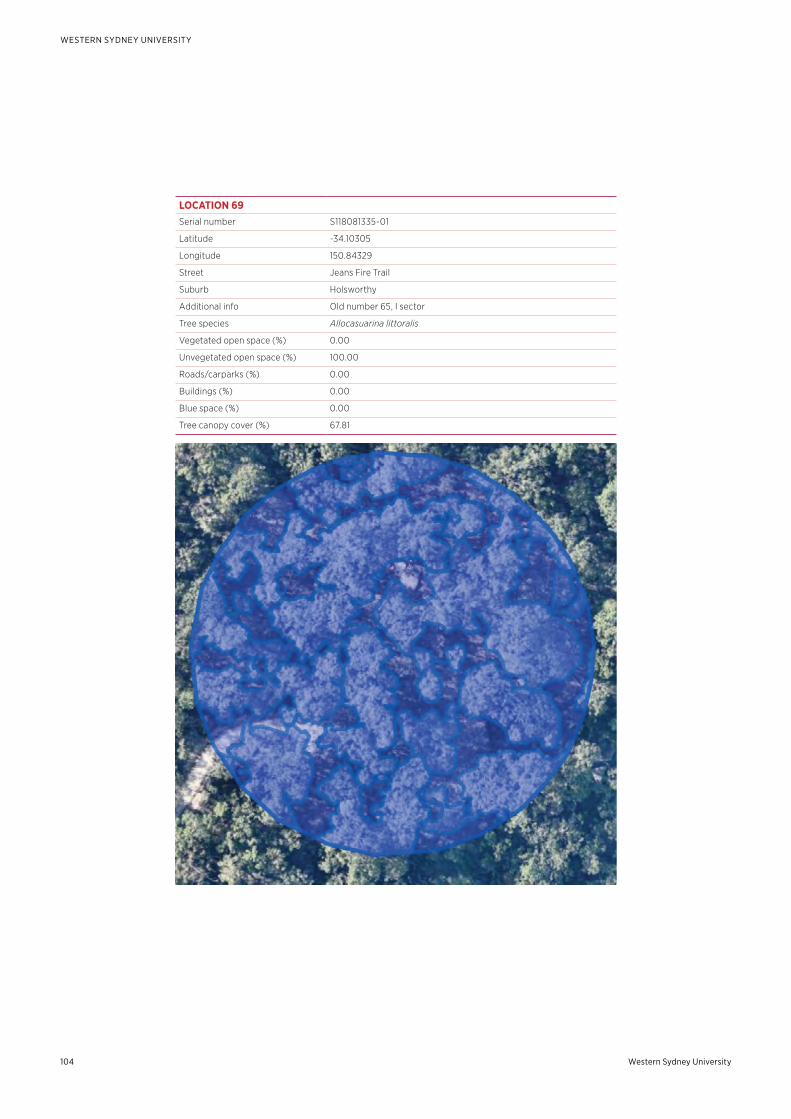
Western Sydney University104
WESTERN SYDNEY UNIVERSITY
LOCATION 69Serial number S118081335-01
Latitude -34.10305
Longitude 150.84329
Street Jeans Fire Trail
Suburb Holsworthy
Additional info Old number 65, I sector
Tree species Allocasuarina littoralis
Vegetated open space (%) 0.00
Unvegetated open space (%) 100.00
Roads/carparks (%) 0.00
Buildings (%) 0.00
Blue space (%) 0.00
Tree canopy cover (%) 67.81
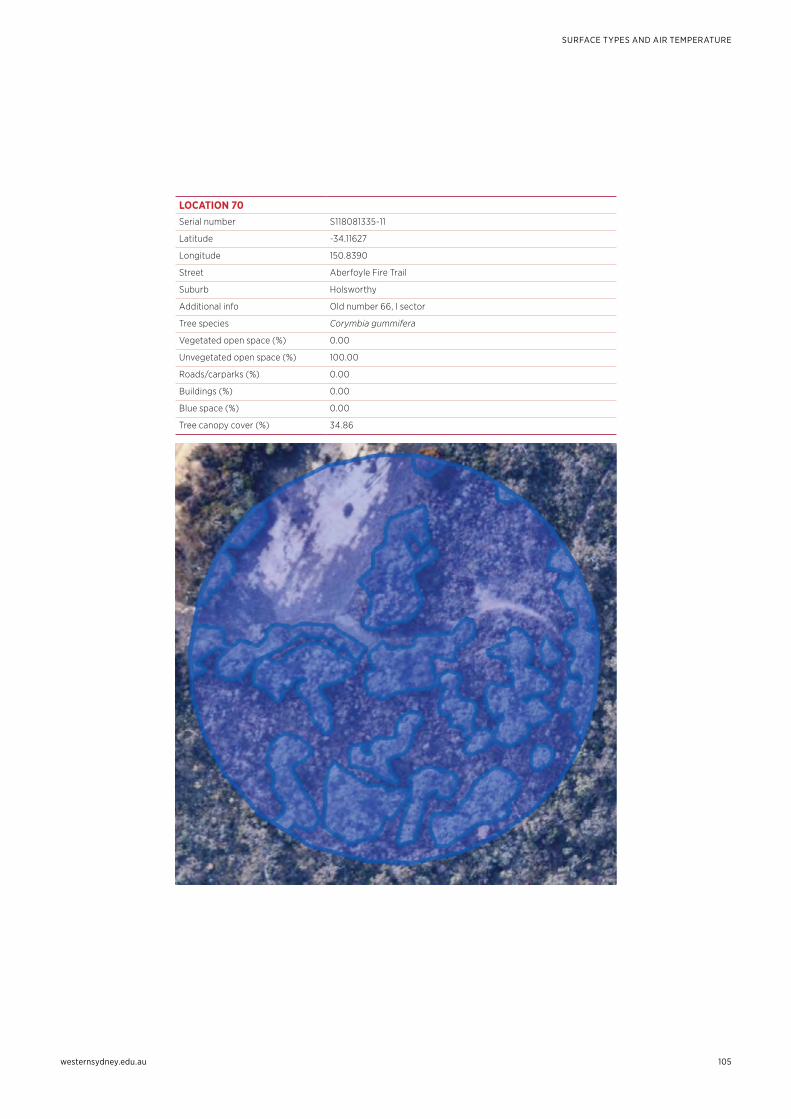
westernsydney.edu.au
SURFACE TYPES AND AIR TEMPERATURE
105
LOCATION 70Serial number S118081335-11
Latitude -34.11627
Longitude 150.8390
Street Aberfoyle Fire Trail
Suburb Holsworthy
Additional info Old number 66, I sector
Tree species Corymbia gummifera
Vegetated open space (%) 0.00
Unvegetated open space (%) 100.00
Roads/carparks (%) 0.00
Buildings (%) 0.00
Blue space (%) 0.00
Tree canopy cover (%) 34.86
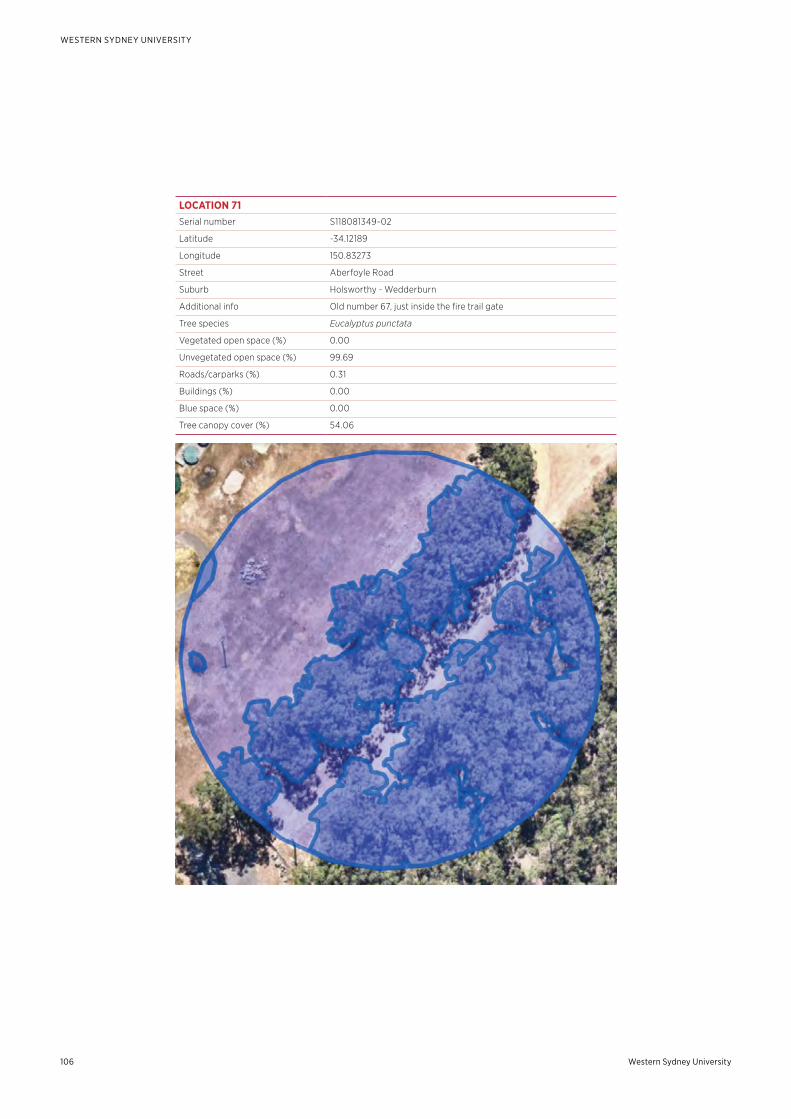
Western Sydney University106
WESTERN SYDNEY UNIVERSITY
LOCATION 71Serial number S118081349-02
Latitude -34.12189
Longitude 150.83273
Street Aberfoyle Road
Suburb Holsworthy - Wedderburn
Additional info Old number 67, just inside the fire trail gate
Tree species Eucalyptus punctata
Vegetated open space (%) 0.00
Unvegetated open space (%) 99.69
Roads/carparks (%) 0.31
Buildings (%) 0.00
Blue space (%) 0.00
Tree canopy cover (%) 54.06
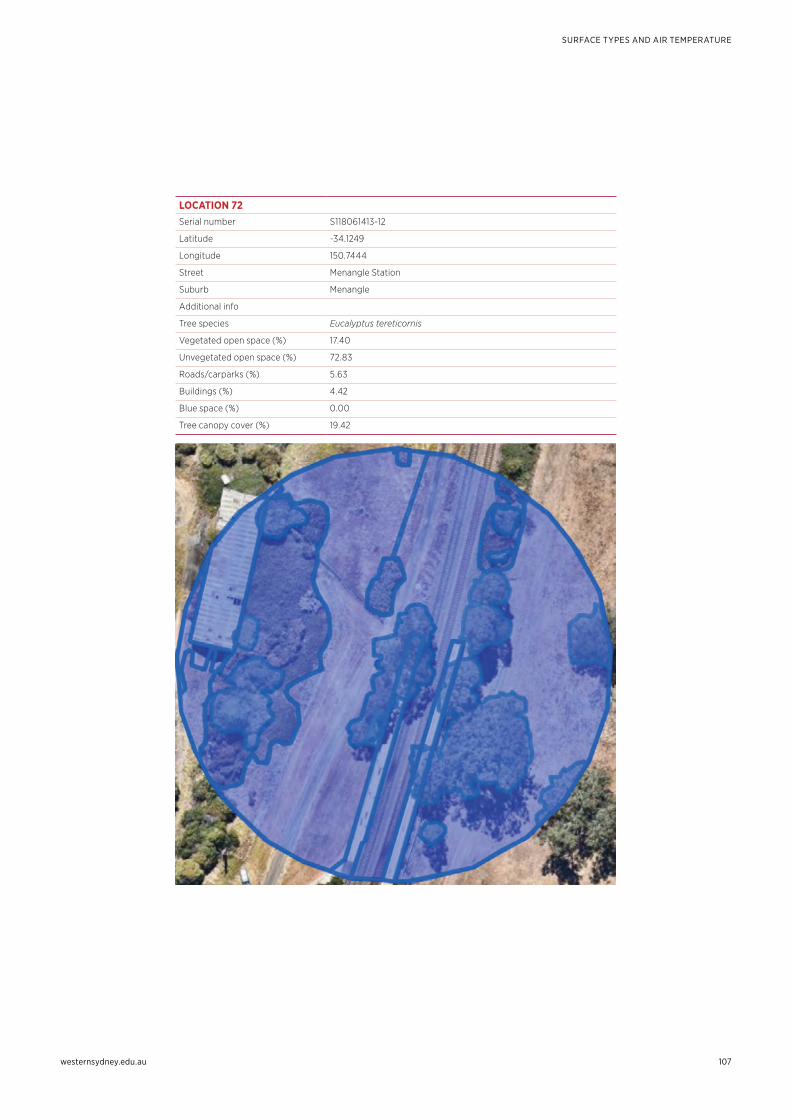
westernsydney.edu.au
SURFACE TYPES AND AIR TEMPERATURE
107
LOCATION 72Serial number S118061413-12
Latitude -34.1249
Longitude 150.7444
Street Menangle Station
Suburb Menangle
Additional info
Tree species Eucalyptus tereticornis
Vegetated open space (%) 17.40
Unvegetated open space (%) 72.83
Roads/carparks (%) 5.63
Buildings (%) 4.42
Blue space (%) 0.00
Tree canopy cover (%) 19.42
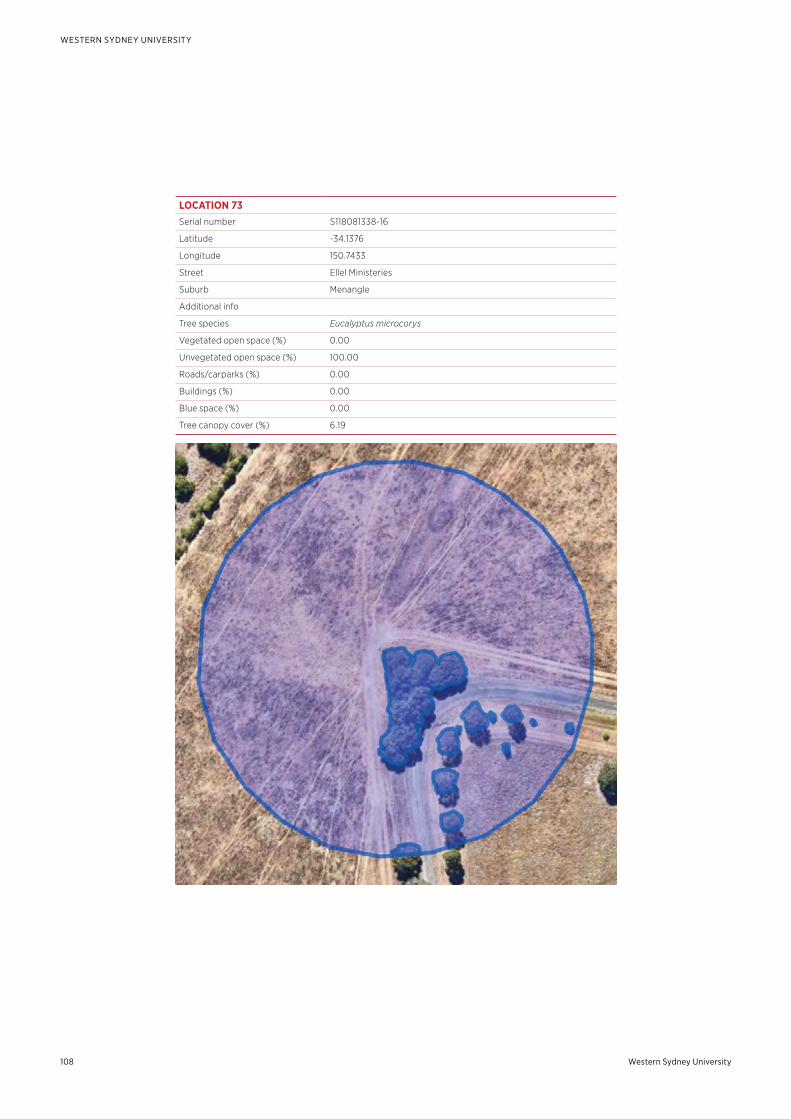
Western Sydney University108
WESTERN SYDNEY UNIVERSITY
LOCATION 73Serial number S118081338-16
Latitude -34.1376
Longitude 150.7433
Street Ellel Ministeries
Suburb Menangle
Additional info
Tree species Eucalyptus microcorys
Vegetated open space (%) 0.00
Unvegetated open space (%) 100.00
Roads/carparks (%) 0.00
Buildings (%) 0.00
Blue space (%) 0.00
Tree canopy cover (%) 6.19
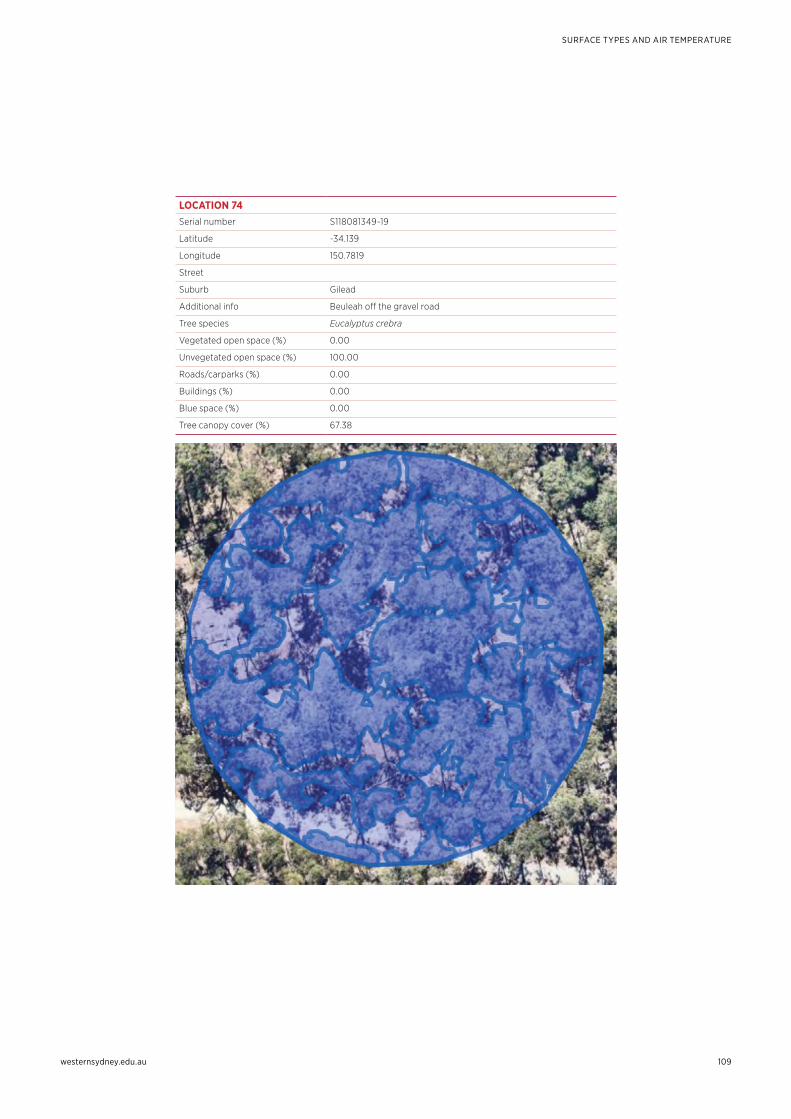
westernsydney.edu.au
SURFACE TYPES AND AIR TEMPERATURE
109
LOCATION 74Serial number S118081349-19
Latitude -34.139
Longitude 150.7819
Street
Suburb Gilead
Additional info Beuleah off the gravel road
Tree species Eucalyptus crebra
Vegetated open space (%) 0.00
Unvegetated open space (%) 100.00
Roads/carparks (%) 0.00
Buildings (%) 0.00
Blue space (%) 0.00
Tree canopy cover (%) 67.38
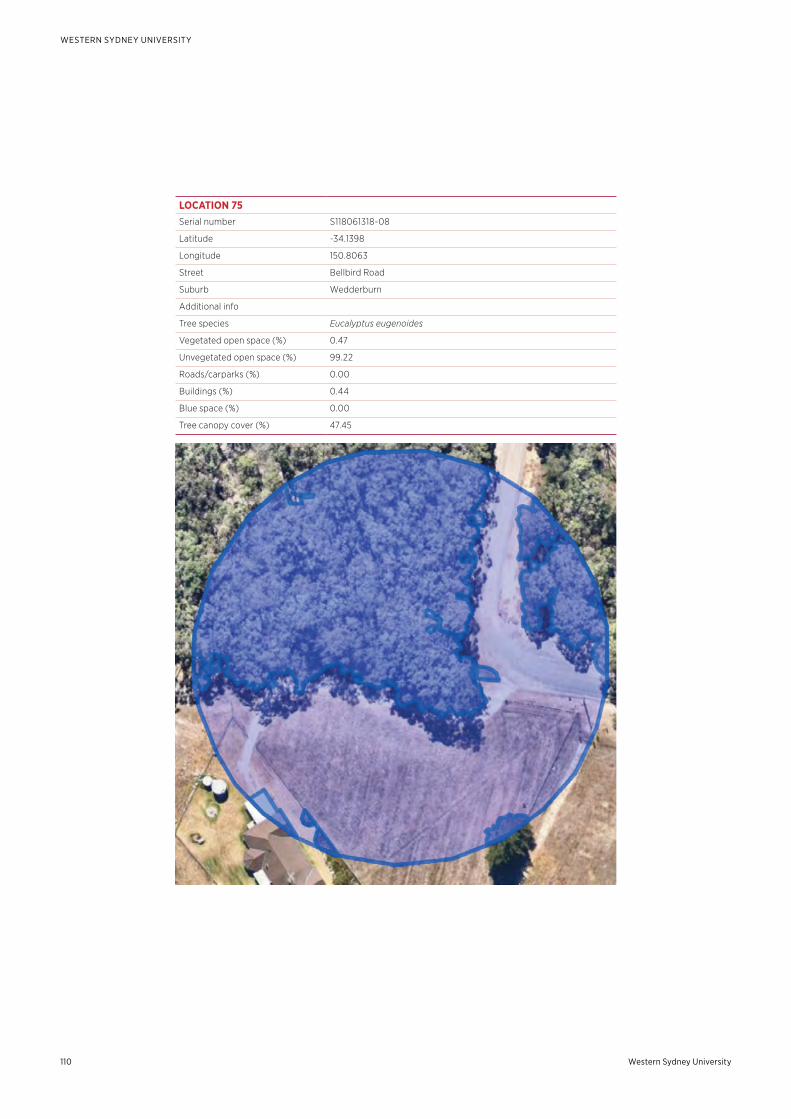
Western Sydney University110
WESTERN SYDNEY UNIVERSITY
LOCATION 75Serial number S118061318-08
Latitude -34.1398
Longitude 150.8063
Street Bellbird Road
Suburb Wedderburn
Additional info
Tree species Eucalyptus eugenoides
Vegetated open space (%) 0.47
Unvegetated open space (%) 99.22
Roads/carparks (%) 0.00
Buildings (%) 0.44
Blue space (%) 0.00
Tree canopy cover (%) 47.45
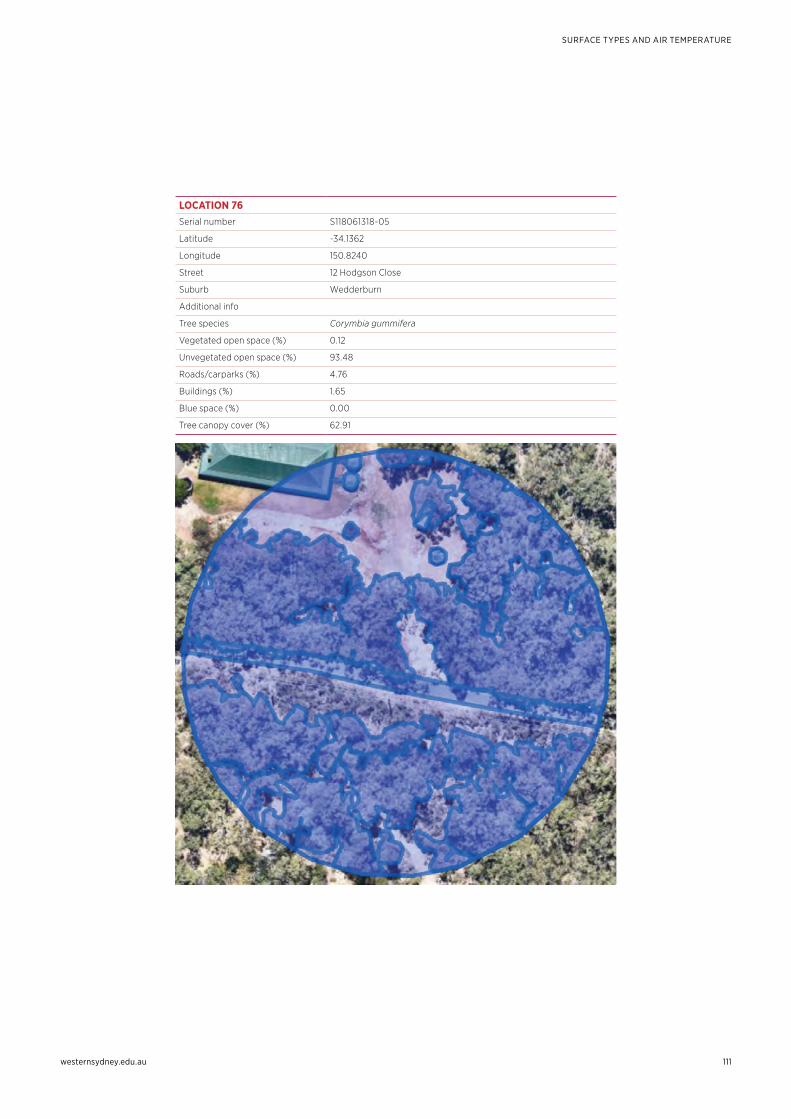
westernsydney.edu.au
SURFACE TYPES AND AIR TEMPERATURE
111
LOCATION 76Serial number S118061318-05
Latitude -34.1362
Longitude 150.8240
Street 12 Hodgson Close
Suburb Wedderburn
Additional info
Tree species Corymbia gummifera
Vegetated open space (%) 0.12
Unvegetated open space (%) 93.48
Roads/carparks (%) 4.76
Buildings (%) 1.65
Blue space (%) 0.00
Tree canopy cover (%) 62.91
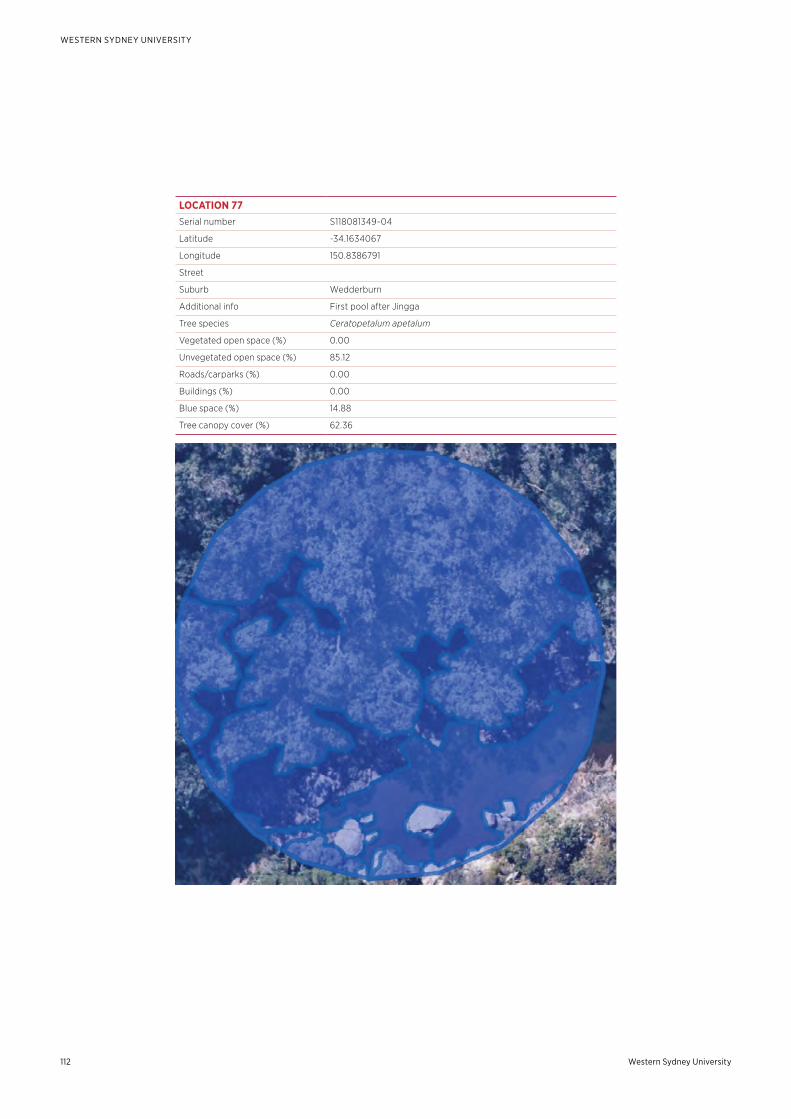
Western Sydney University112
WESTERN SYDNEY UNIVERSITY
LOCATION 77Serial number S118081349-04
Latitude -34.1634067
Longitude 150.8386791
Street
Suburb Wedderburn
Additional info First pool after Jingga
Tree species Ceratopetalum apetalum
Vegetated open space (%) 0.00
Unvegetated open space (%) 85.12
Roads/carparks (%) 0.00
Buildings (%) 0.00
Blue space (%) 14.88
Tree canopy cover (%) 62.36
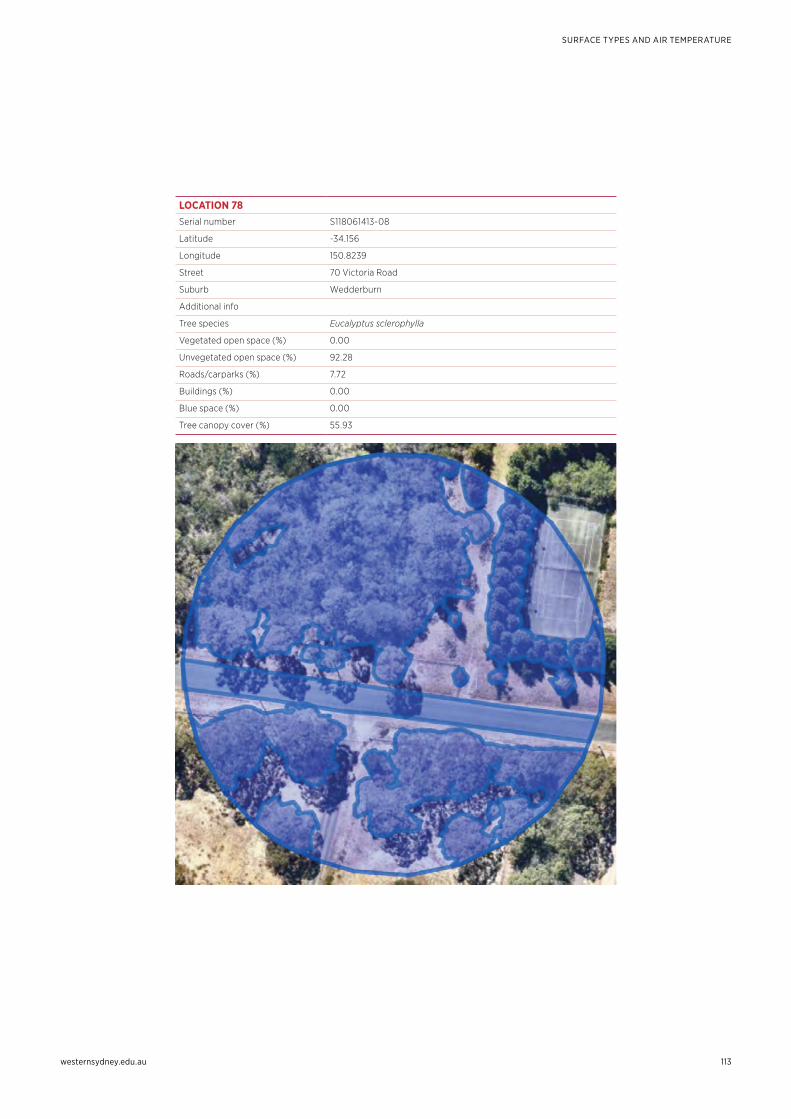
westernsydney.edu.au
SURFACE TYPES AND AIR TEMPERATURE
113
LOCATION 78Serial number S118061413-08
Latitude -34.156
Longitude 150.8239
Street 70 Victoria Road
Suburb Wedderburn
Additional info
Tree species Eucalyptus sclerophylla
Vegetated open space (%) 0.00
Unvegetated open space (%) 92.28
Roads/carparks (%) 7.72
Buildings (%) 0.00
Blue space (%) 0.00
Tree canopy cover (%) 55.93
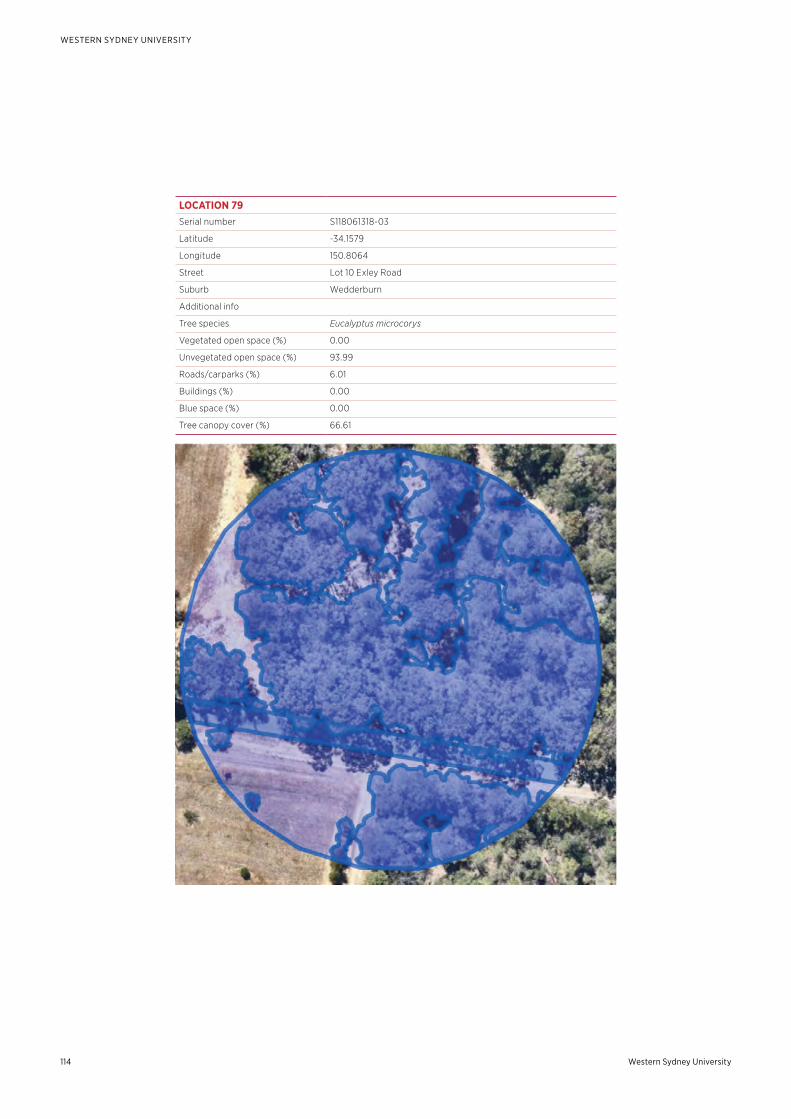
Western Sydney University114
WESTERN SYDNEY UNIVERSITY
LOCATION 79Serial number S118061318-03
Latitude -34.1579
Longitude 150.8064
Street Lot 10 Exley Road
Suburb Wedderburn
Additional info
Tree species Eucalyptus microcorys
Vegetated open space (%) 0.00
Unvegetated open space (%) 93.99
Roads/carparks (%) 6.01
Buildings (%) 0.00
Blue space (%) 0.00
Tree canopy cover (%) 66.61
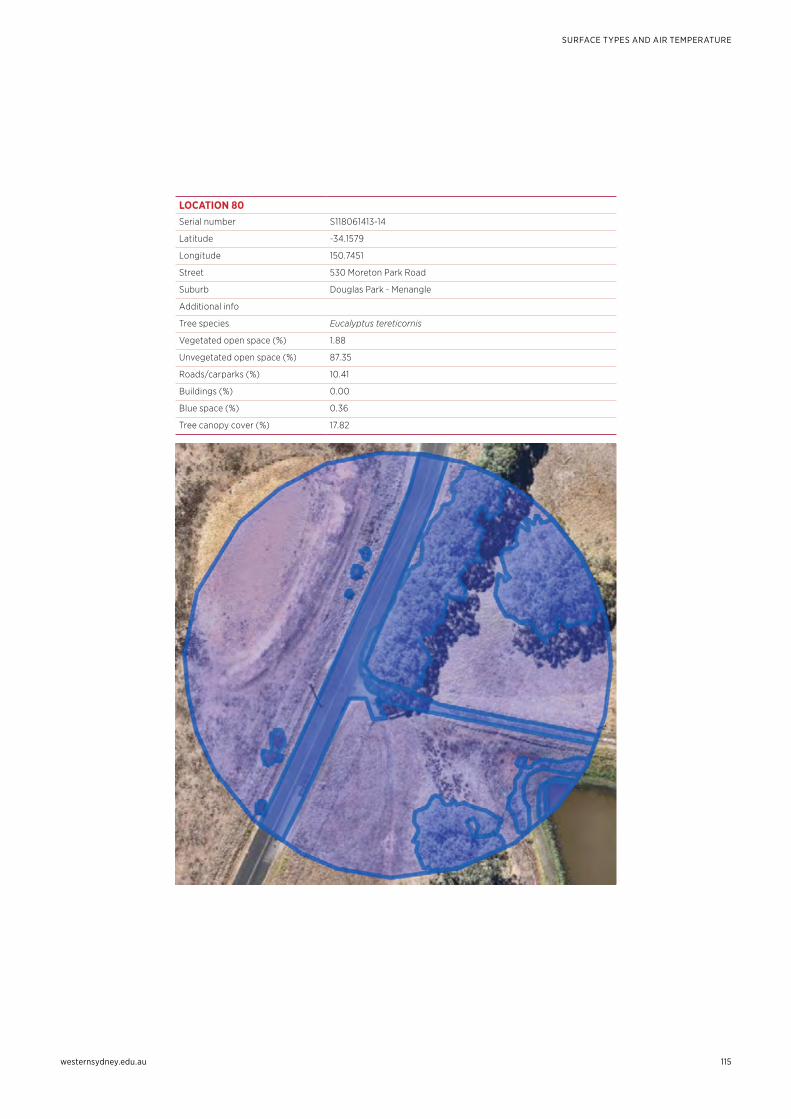
westernsydney.edu.au
SURFACE TYPES AND AIR TEMPERATURE
115
LOCATION 80Serial number S118061413-14
Latitude -34.1579
Longitude 150.7451
Street 530 Moreton Park Road
Suburb Douglas Park - Menangle
Additional info
Tree species Eucalyptus tereticornis
Vegetated open space (%) 1.88
Unvegetated open space (%) 87.35
Roads/carparks (%) 10.41
Buildings (%) 0.00
Blue space (%) 0.36
Tree canopy cover (%) 17.82
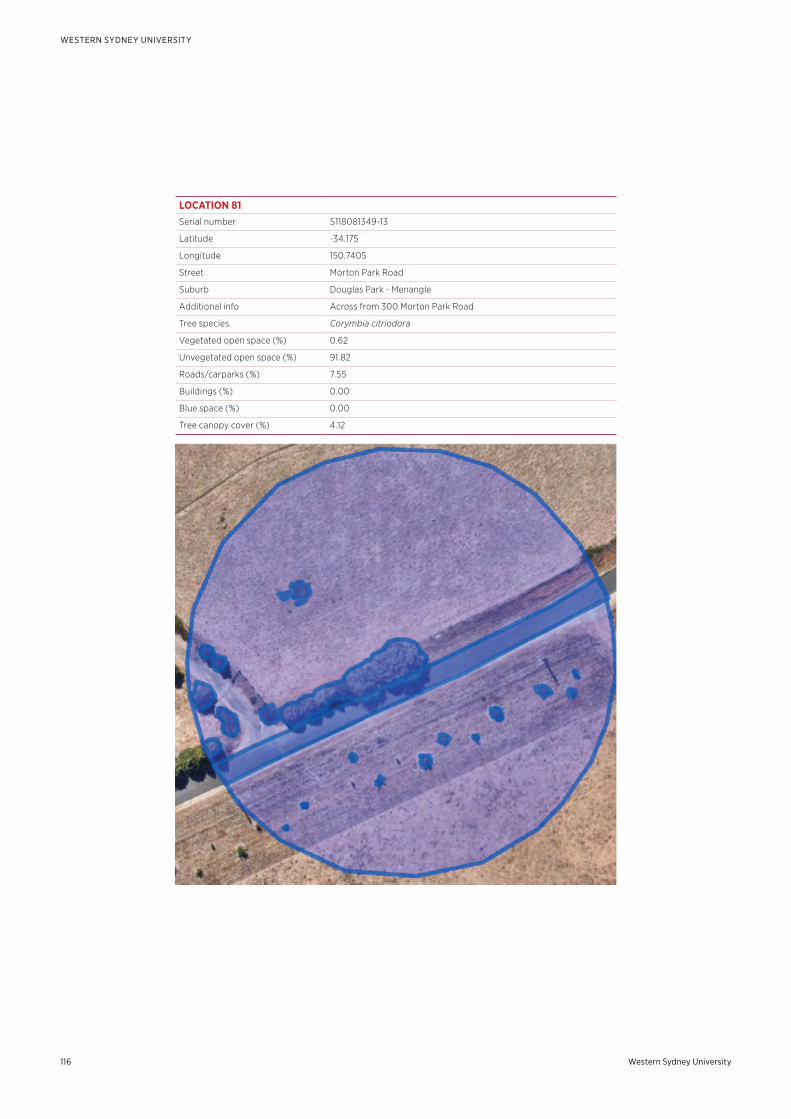
Western Sydney University116
WESTERN SYDNEY UNIVERSITY
LOCATION 81Serial number S118081349-13
Latitude -34.175
Longitude 150.7405
Street Morton Park Road
Suburb Douglas Park - Menangle
Additional info Across from 300 Morton Park Road
Tree species Corymbia citriodora
Vegetated open space (%) 0.62
Unvegetated open space (%) 91.82
Roads/carparks (%) 7.55
Buildings (%) 0.00
Blue space (%) 0.00
Tree canopy cover (%) 4.12
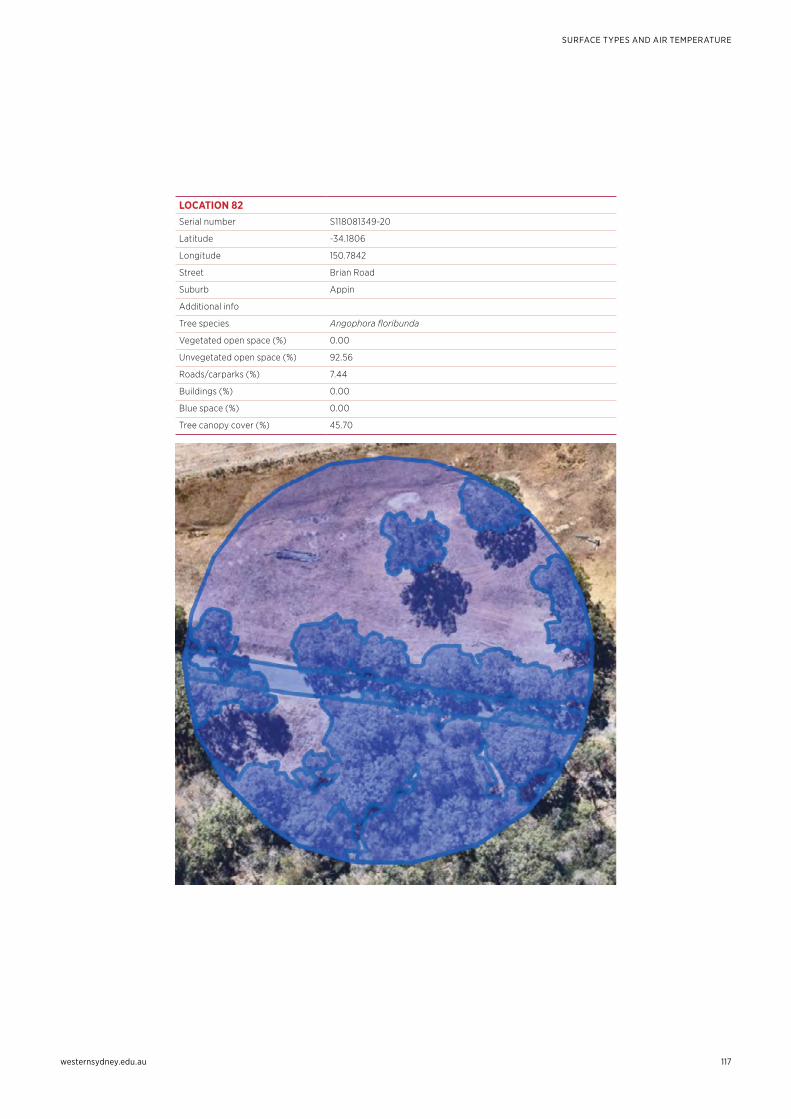
westernsydney.edu.au
SURFACE TYPES AND AIR TEMPERATURE
117
LOCATION 82Serial number S118081349-20
Latitude -34.1806
Longitude 150.7842
Street Brian Road
Suburb Appin
Additional info
Tree species Angophora floribunda
Vegetated open space (%) 0.00
Unvegetated open space (%) 92.56
Roads/carparks (%) 7.44
Buildings (%) 0.00
Blue space (%) 0.00
Tree canopy cover (%) 45.70
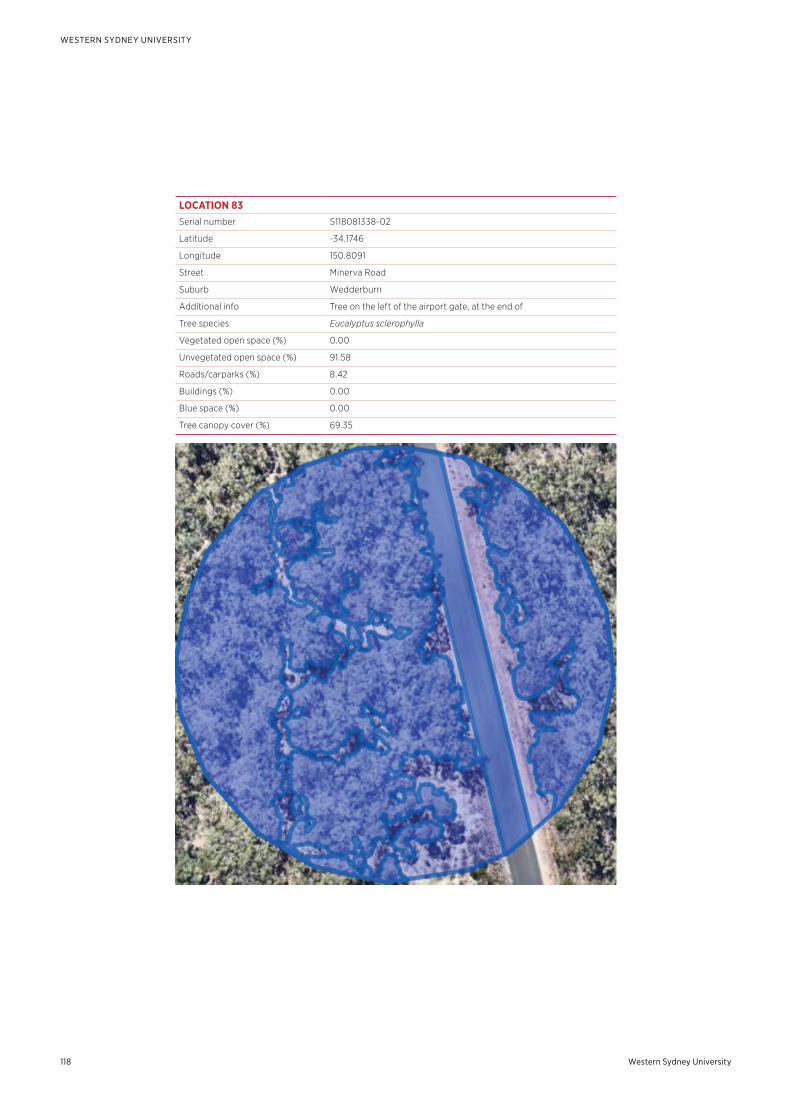
Western Sydney University118
WESTERN SYDNEY UNIVERSITY
LOCATION 83Serial number S118081338-02
Latitude -34.1746
Longitude 150.8091
Street Minerva Road
Suburb Wedderburn
Additional info Tree on the left of the airport gate, at the end of
Tree species Eucalyptus sclerophylla
Vegetated open space (%) 0.00
Unvegetated open space (%) 91.58
Roads/carparks (%) 8.42
Buildings (%) 0.00
Blue space (%) 0.00
Tree canopy cover (%) 69.35
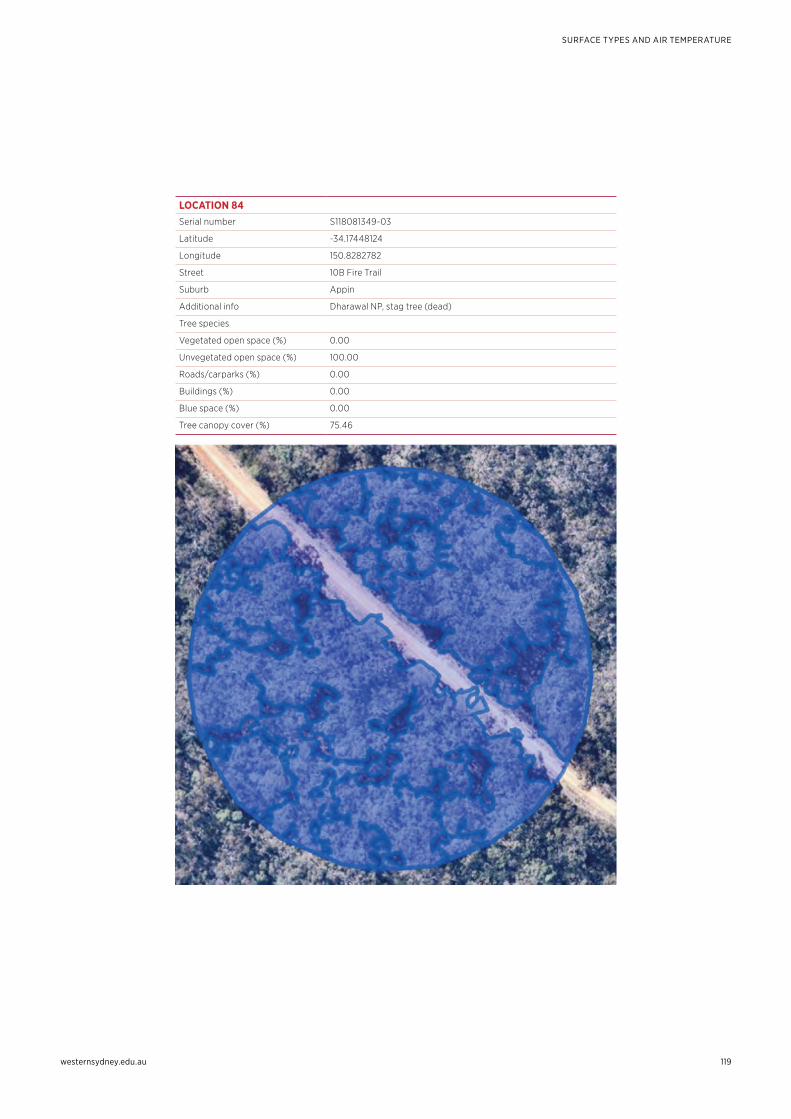
westernsydney.edu.au
SURFACE TYPES AND AIR TEMPERATURE
119
LOCATION 84Serial number S118081349-03
Latitude -34.17448124
Longitude 150.8282782
Street 10B Fire Trail
Suburb Appin
Additional info Dharawal NP, stag tree (dead)
Tree species
Vegetated open space (%) 0.00
Unvegetated open space (%) 100.00
Roads/carparks (%) 0.00
Buildings (%) 0.00
Blue space (%) 0.00
Tree canopy cover (%) 75.46
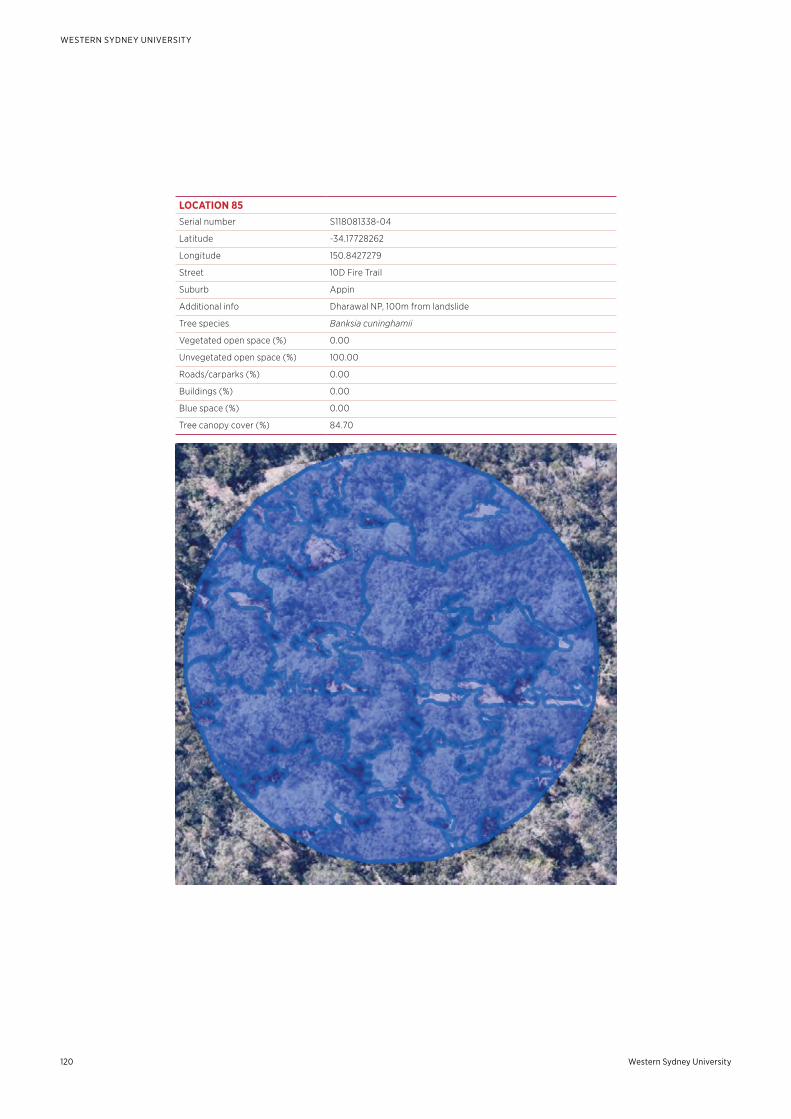
Western Sydney University120
WESTERN SYDNEY UNIVERSITY
LOCATION 85Serial number S118081338-04
Latitude -34.17728262
Longitude 150.8427279
Street 10D Fire Trail
Suburb Appin
Additional info Dharawal NP, 100m from landslide
Tree species Banksia cuninghamii
Vegetated open space (%) 0.00
Unvegetated open space (%) 100.00
Roads/carparks (%) 0.00
Buildings (%) 0.00
Blue space (%) 0.00
Tree canopy cover (%) 84.70
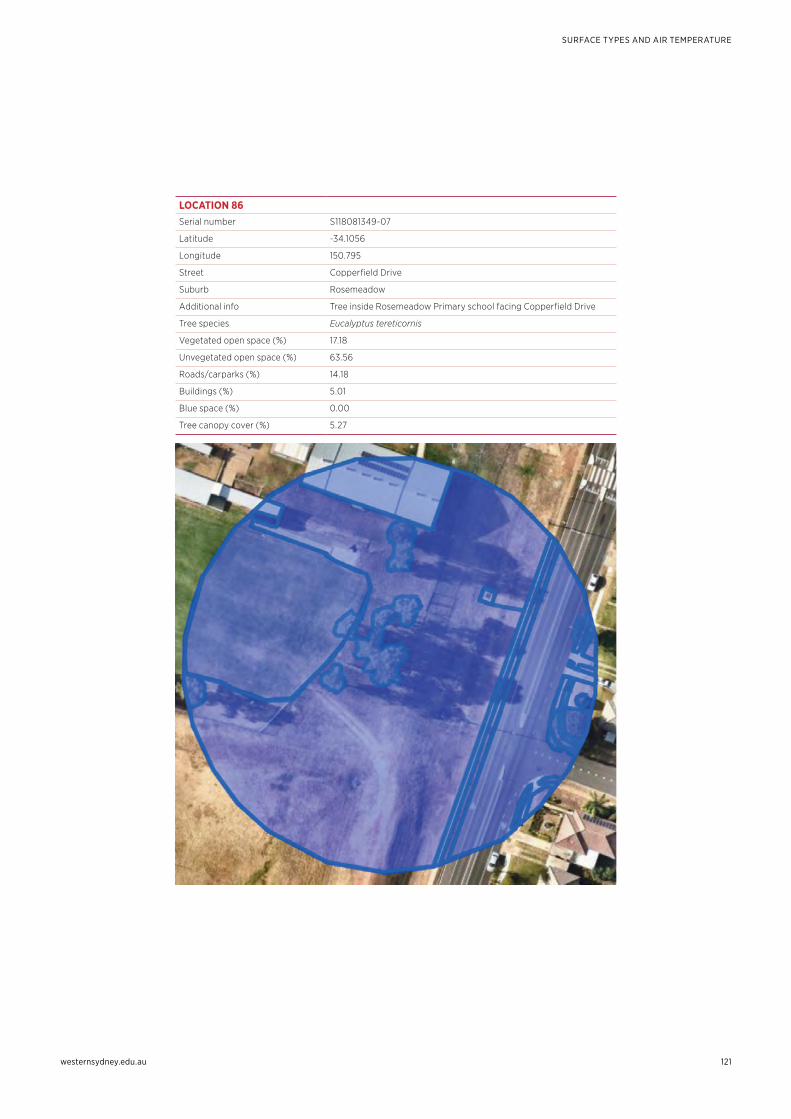
westernsydney.edu.au
SURFACE TYPES AND AIR TEMPERATURE
121
LOCATION 86Serial number S118081349-07
Latitude -34.1056
Longitude 150.795
Street Copperfield Drive
Suburb Rosemeadow
Additional info Tree inside Rosemeadow Primary school facing Copperfield Drive
Tree species Eucalyptus tereticornis
Vegetated open space (%) 17.18
Unvegetated open space (%) 63.56
Roads/carparks (%) 14.18
Buildings (%) 5.01
Blue space (%) 0.00
Tree canopy cover (%) 5.27
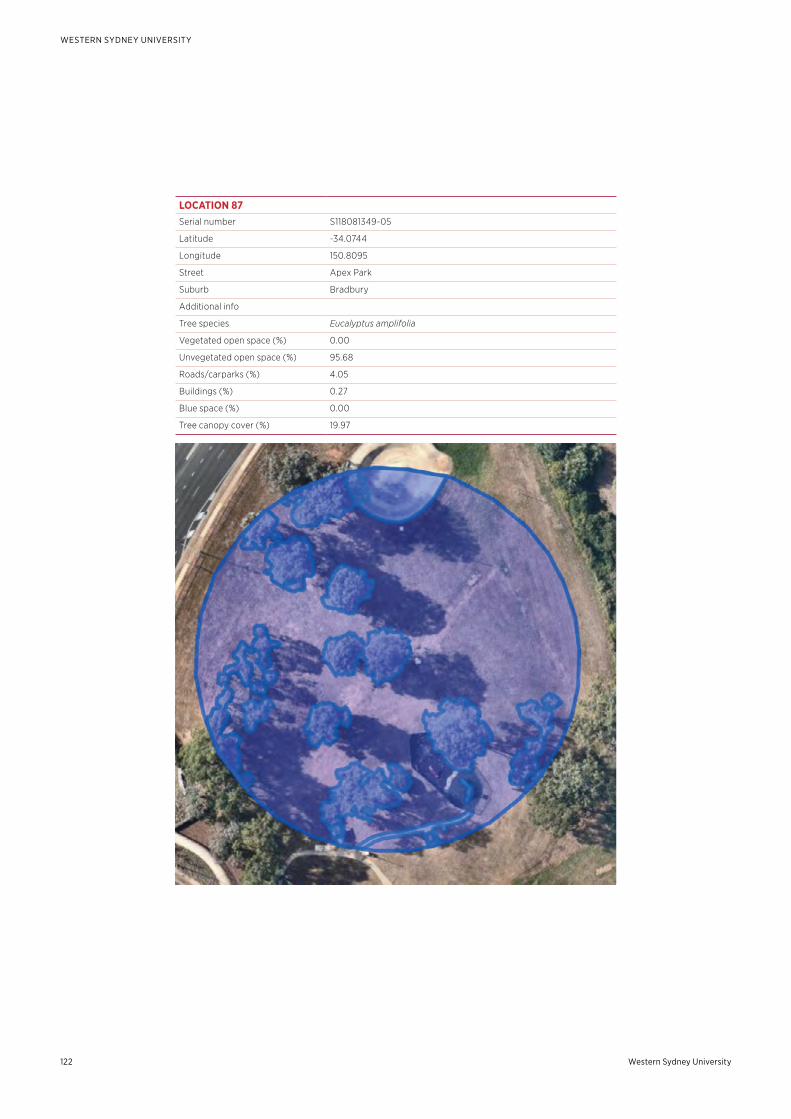
Western Sydney University122
WESTERN SYDNEY UNIVERSITY
LOCATION 87Serial number S118081349-05
Latitude -34.0744
Longitude 150.8095
Street Apex Park
Suburb Bradbury
Additional info
Tree species Eucalyptus amplifolia
Vegetated open space (%) 0.00
Unvegetated open space (%) 95.68
Roads/carparks (%) 4.05
Buildings (%) 0.27
Blue space (%) 0.00
Tree canopy cover (%) 19.97
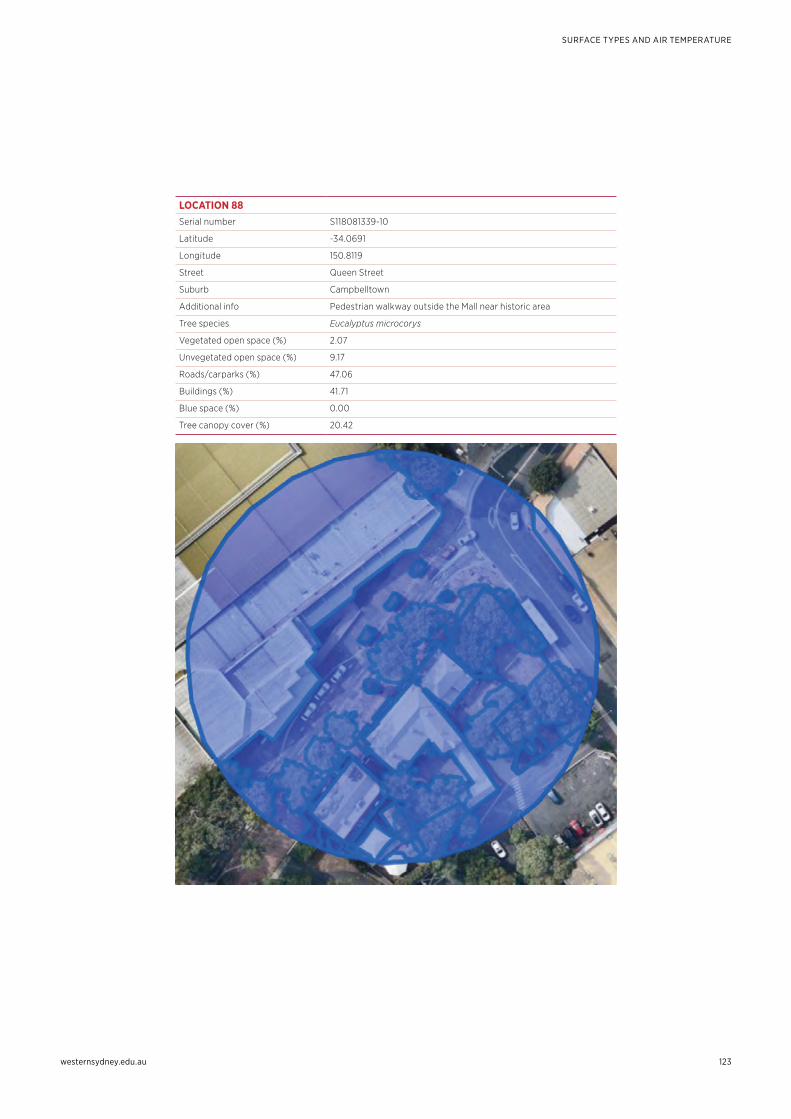
westernsydney.edu.au
SURFACE TYPES AND AIR TEMPERATURE
123
LOCATION 88Serial number S118081339-10
Latitude -34.0691
Longitude 150.8119
Street Queen Street
Suburb Campbelltown
Additional info Pedestrian walkway outside the Mall near historic area
Tree species Eucalyptus microcorys
Vegetated open space (%) 2.07
Unvegetated open space (%) 9.17
Roads/carparks (%) 47.06
Buildings (%) 41.71
Blue space (%) 0.00
Tree canopy cover (%) 20.42
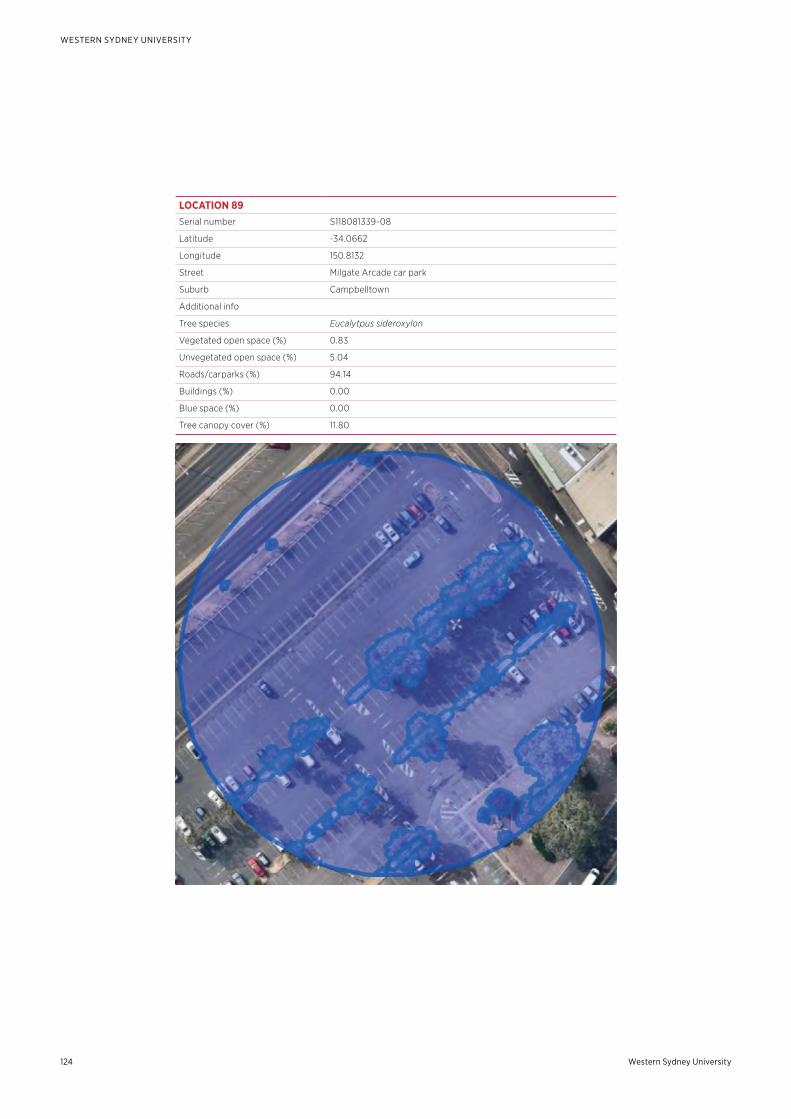
Western Sydney University124
WESTERN SYDNEY UNIVERSITY
LOCATION 89Serial number S118081339-08
Latitude -34.0662
Longitude 150.8132
Street Milgate Arcade car park
Suburb Campbelltown
Additional info
Tree species Eucalytpus sideroxylon
Vegetated open space (%) 0.83
Unvegetated open space (%) 5.04
Roads/carparks (%) 94.14
Buildings (%) 0.00
Blue space (%) 0.00
Tree canopy cover (%) 11.80
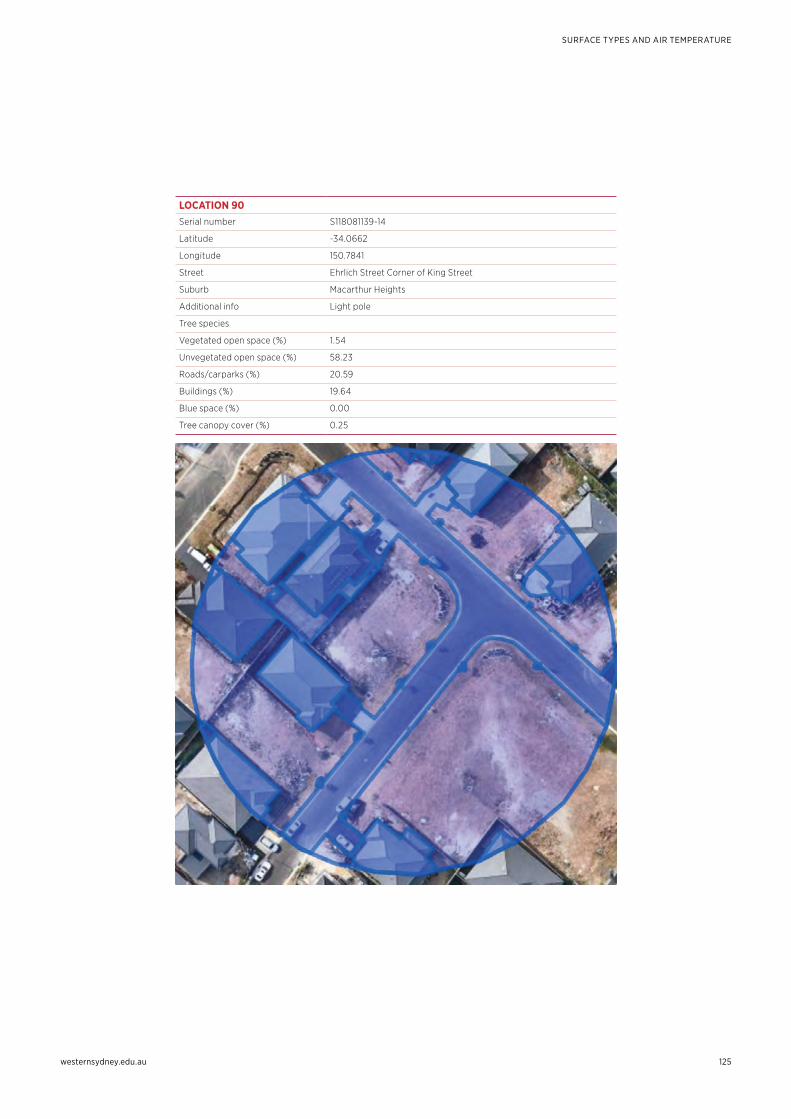
westernsydney.edu.au
SURFACE TYPES AND AIR TEMPERATURE
125
LOCATION 90Serial number S118081139-14
Latitude -34.0662
Longitude 150.7841
Street Ehrlich Street Corner of King Street
Suburb Macarthur Heights
Additional info Light pole
Tree species
Vegetated open space (%) 1.54
Unvegetated open space (%) 58.23
Roads/carparks (%) 20.59
Buildings (%) 19.64
Blue space (%) 0.00
Tree canopy cover (%) 0.25
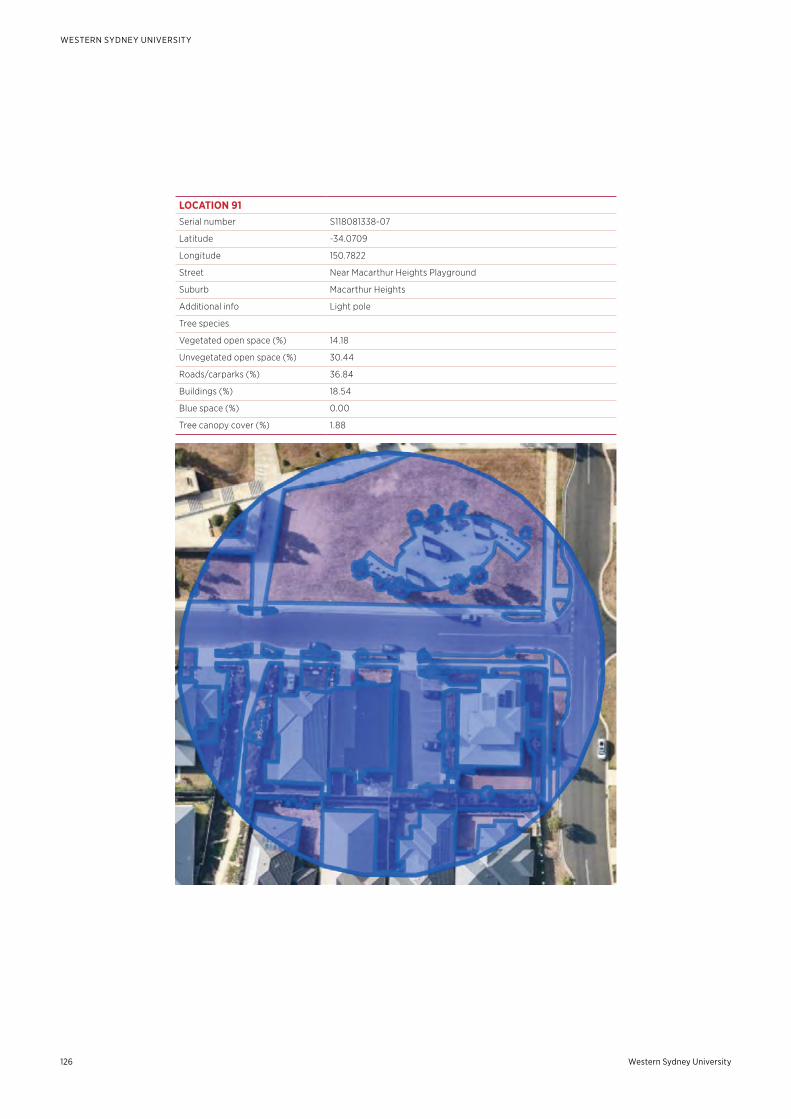
Western Sydney University126
WESTERN SYDNEY UNIVERSITY
LOCATION 91Serial number S118081338-07
Latitude -34.0709
Longitude 150.7822
Street Near Macarthur Heights Playground
Suburb Macarthur Heights
Additional info Light pole
Tree species
Vegetated open space (%) 14.18
Unvegetated open space (%) 30.44
Roads/carparks (%) 36.84
Buildings (%) 18.54
Blue space (%) 0.00
Tree canopy cover (%) 1.88
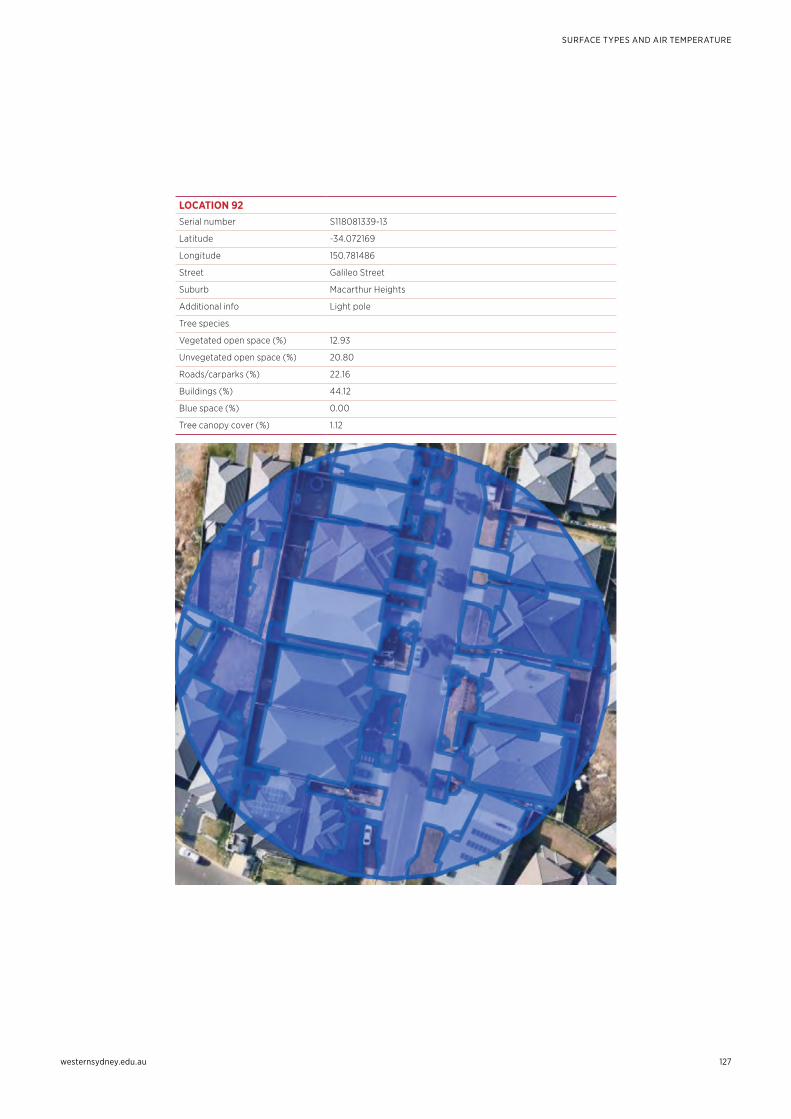
westernsydney.edu.au
SURFACE TYPES AND AIR TEMPERATURE
127
LOCATION 92Serial number S118081339-13
Latitude -34.072169
Longitude 150.781486
Street Galileo Street
Suburb Macarthur Heights
Additional info Light pole
Tree species
Vegetated open space (%) 12.93
Unvegetated open space (%) 20.80
Roads/carparks (%) 22.16
Buildings (%) 44.12
Blue space (%) 0.00
Tree canopy cover (%) 1.12
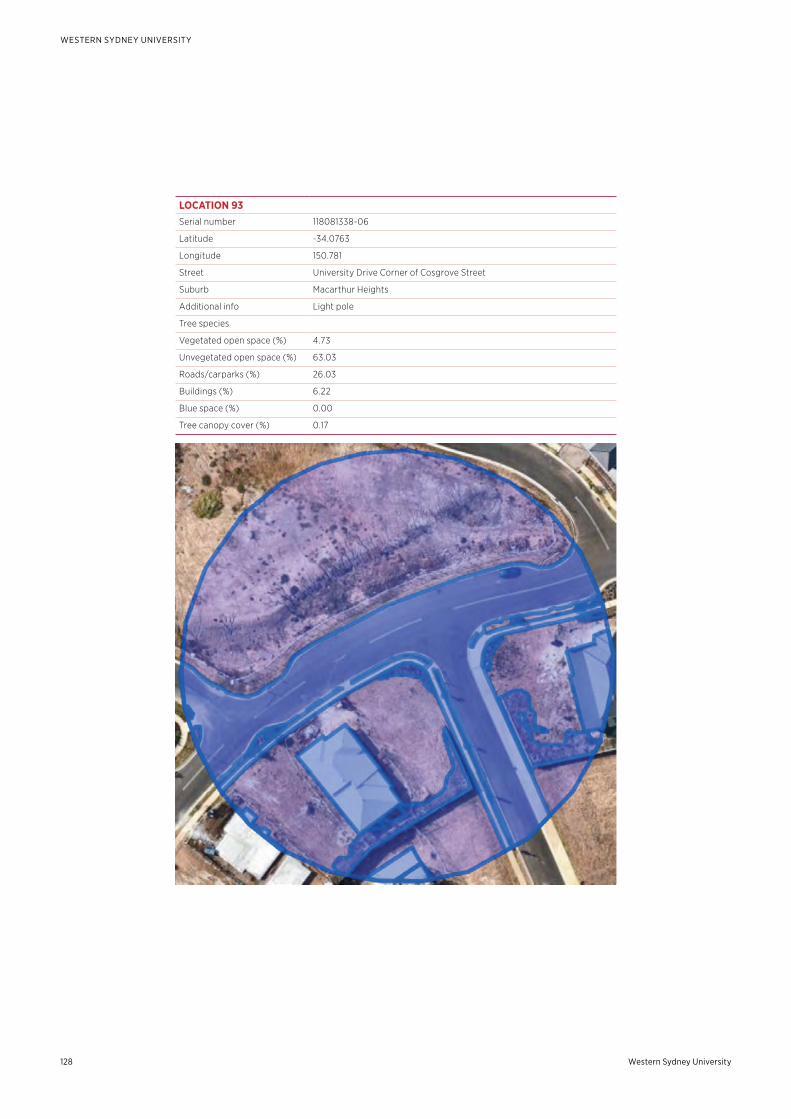
Western Sydney University128
WESTERN SYDNEY UNIVERSITY
LOCATION 93Serial number 118081338-06
Latitude -34.0763
Longitude 150.781
Street University Drive Corner of Cosgrove Street
Suburb Macarthur Heights
Additional info Light pole
Tree species
Vegetated open space (%) 4.73
Unvegetated open space (%) 63.03
Roads/carparks (%) 26.03
Buildings (%) 6.22
Blue space (%) 0.00
Tree canopy cover (%) 0.17
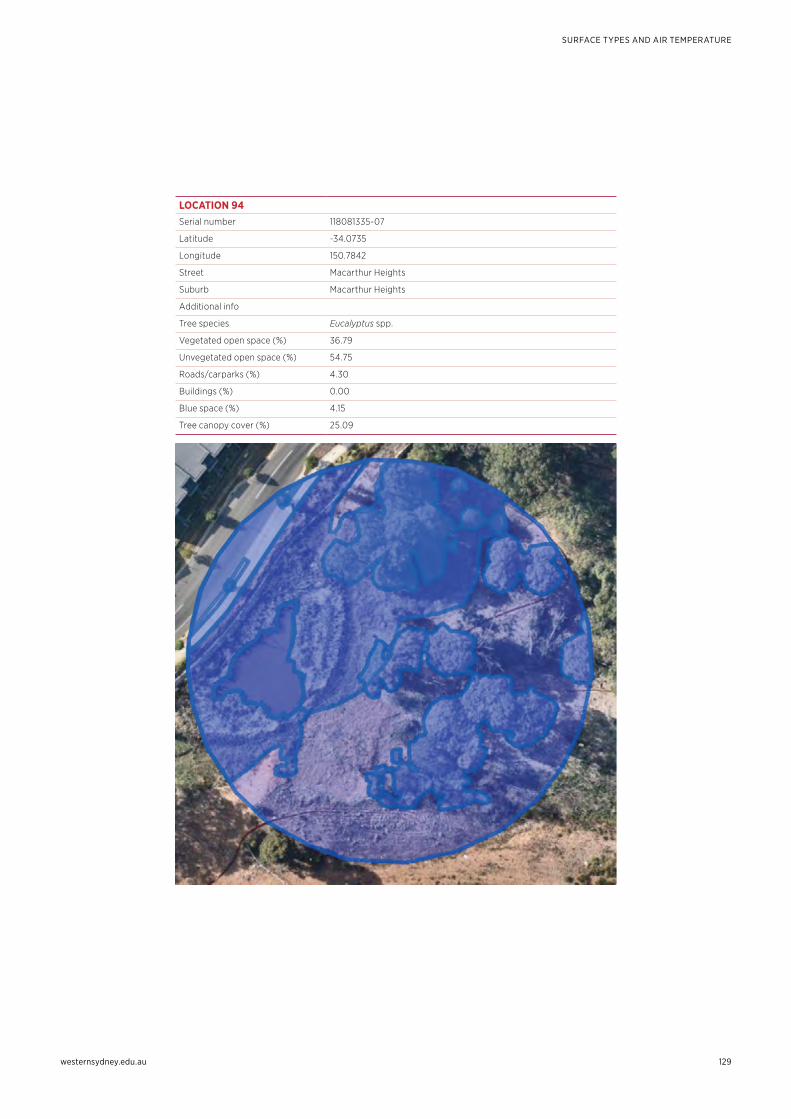
westernsydney.edu.au
SURFACE TYPES AND AIR TEMPERATURE
129
LOCATION 94Serial number 118081335-07
Latitude -34.0735
Longitude 150.7842
Street Macarthur Heights
Suburb Macarthur Heights
Additional info
Tree species Eucalyptus spp.
Vegetated open space (%) 36.79
Unvegetated open space (%) 54.75
Roads/carparks (%) 4.30
Buildings (%) 0.00
Blue space (%) 4.15
Tree canopy cover (%) 25.09
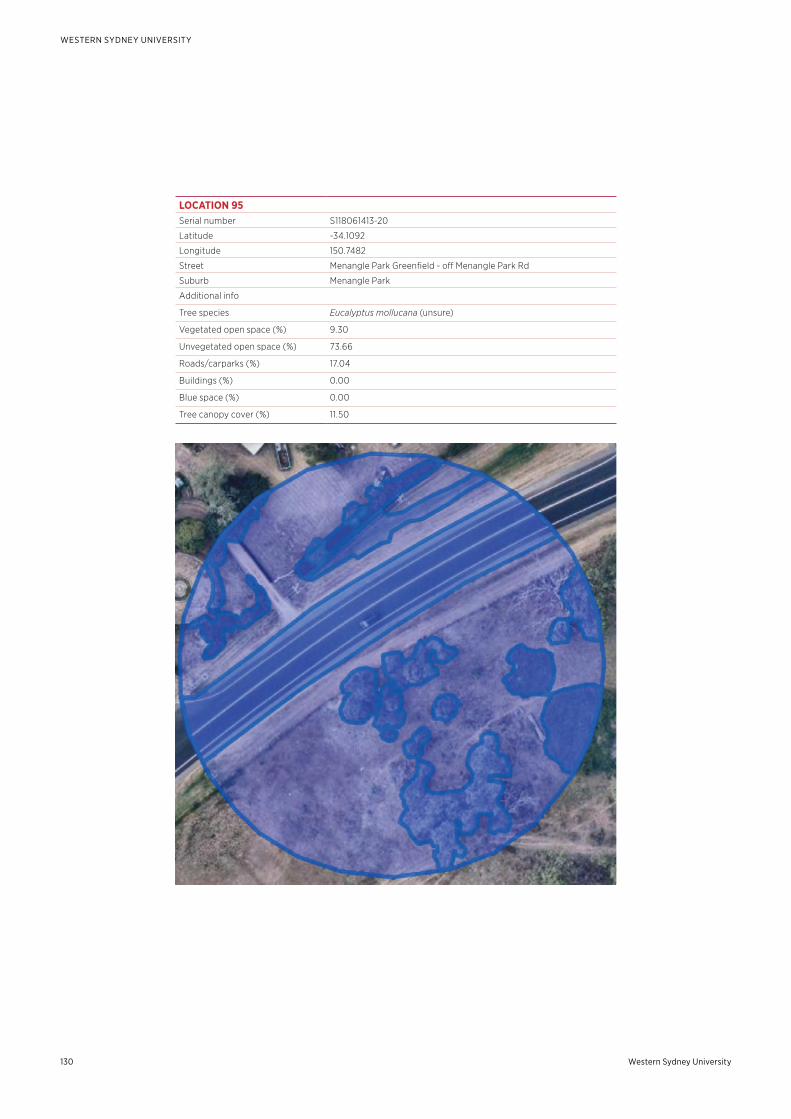
Western Sydney University130
WESTERN SYDNEY UNIVERSITY
LOCATION 95Serial number S118061413-20
Latitude -34.1092
Longitude 150.7482
Street Menangle Park Greenfield - off Menangle Park Rd
Suburb Menangle Park
Additional info
Tree species Eucalyptus mollucana (unsure)
Vegetated open space (%) 9.30
Unvegetated open space (%) 73.66
Roads/carparks (%) 17.04
Buildings (%) 0.00
Blue space (%) 0.00
Tree canopy cover (%) 11.50
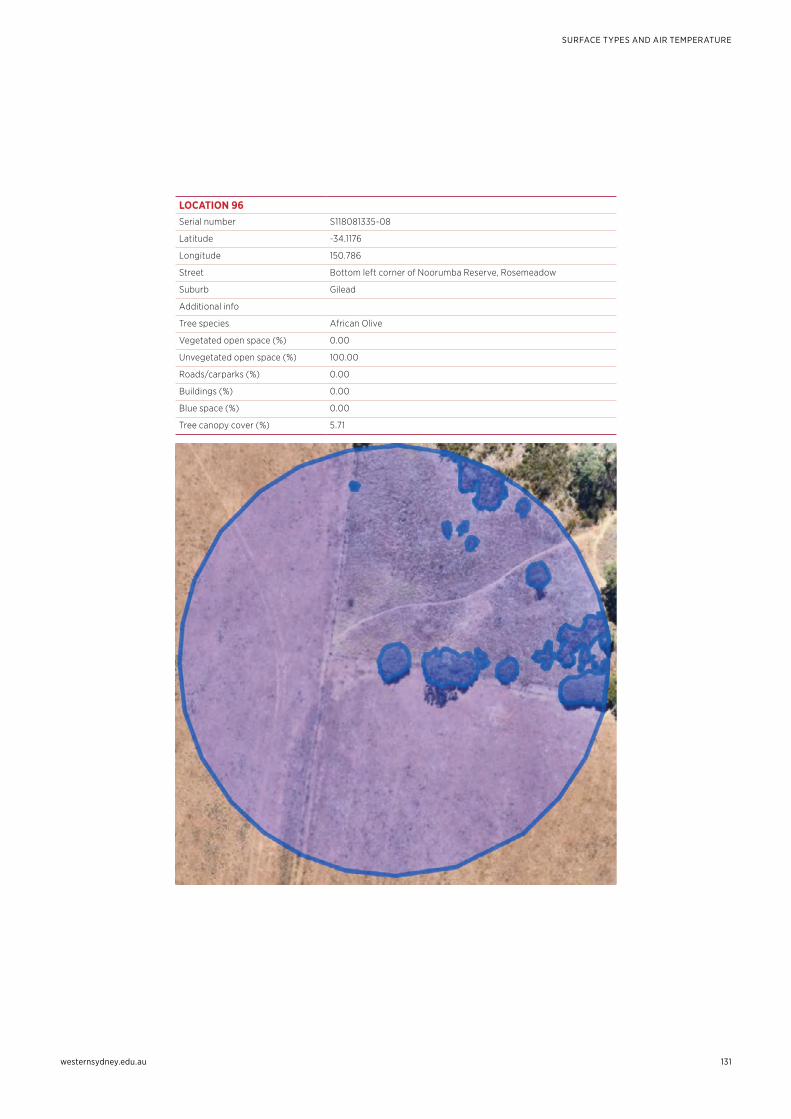
westernsydney.edu.au
SURFACE TYPES AND AIR TEMPERATURE
131
LOCATION 96Serial number S118081335-08
Latitude -34.1176
Longitude 150.786
Street Bottom left corner of Noorumba Reserve, Rosemeadow
Suburb Gilead
Additional info
Tree species African Olive
Vegetated open space (%) 0.00
Unvegetated open space (%) 100.00
Roads/carparks (%) 0.00
Buildings (%) 0.00
Blue space (%) 0.00
Tree canopy cover (%) 5.71
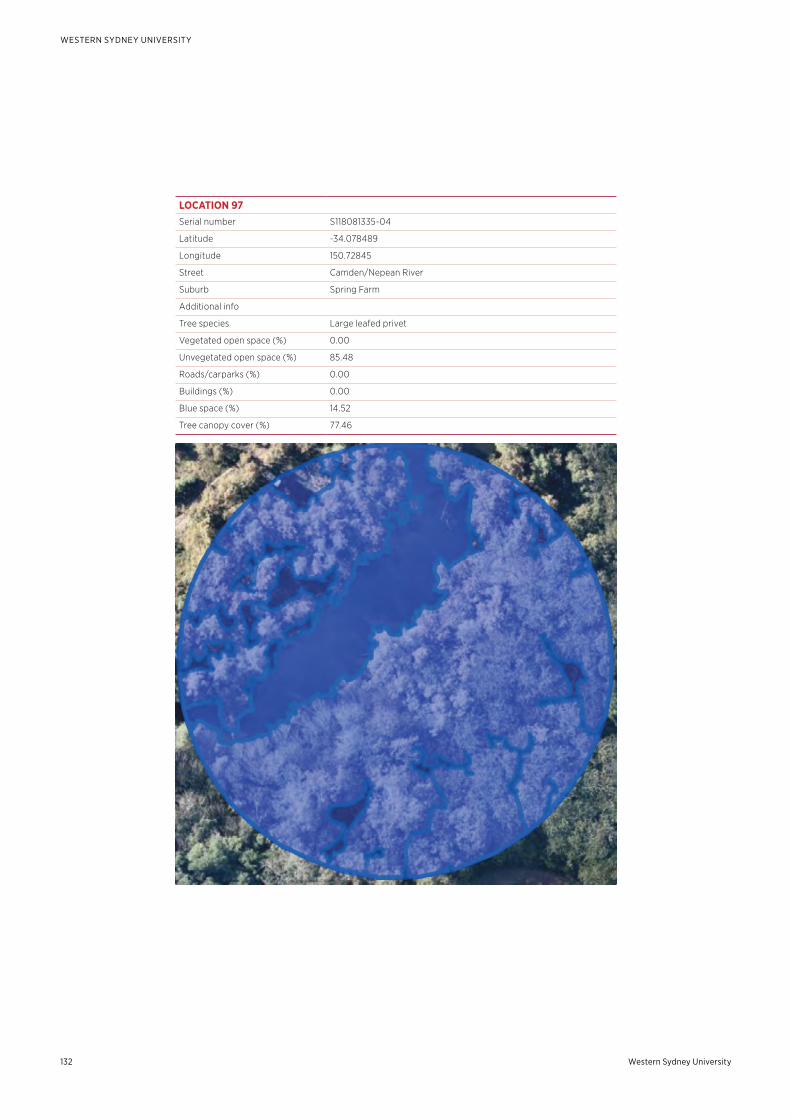
Western Sydney University132
WESTERN SYDNEY UNIVERSITY
LOCATION 97Serial number S118081335-04
Latitude -34.078489
Longitude 150.72845
Street Camden/Nepean River
Suburb Spring Farm
Additional info
Tree species Large leafed privet
Vegetated open space (%) 0.00
Unvegetated open space (%) 85.48
Roads/carparks (%) 0.00
Buildings (%) 0.00
Blue space (%) 14.52
Tree canopy cover (%) 77.46
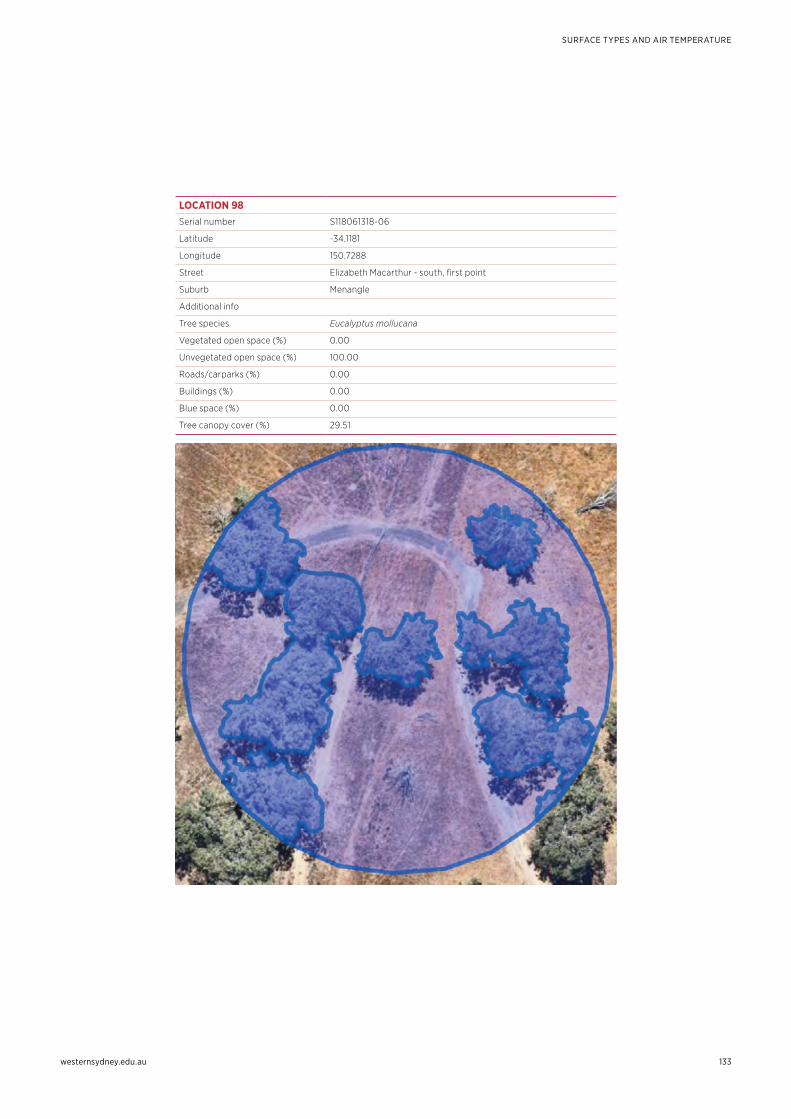
westernsydney.edu.au
SURFACE TYPES AND AIR TEMPERATURE
133
LOCATION 98Serial number S118061318-06
Latitude -34.1181
Longitude 150.7288
Street Elizabeth Macarthur - south, first point
Suburb Menangle
Additional info
Tree species Eucalyptus mollucana
Vegetated open space (%) 0.00
Unvegetated open space (%) 100.00
Roads/carparks (%) 0.00
Buildings (%) 0.00
Blue space (%) 0.00
Tree canopy cover (%) 29.51
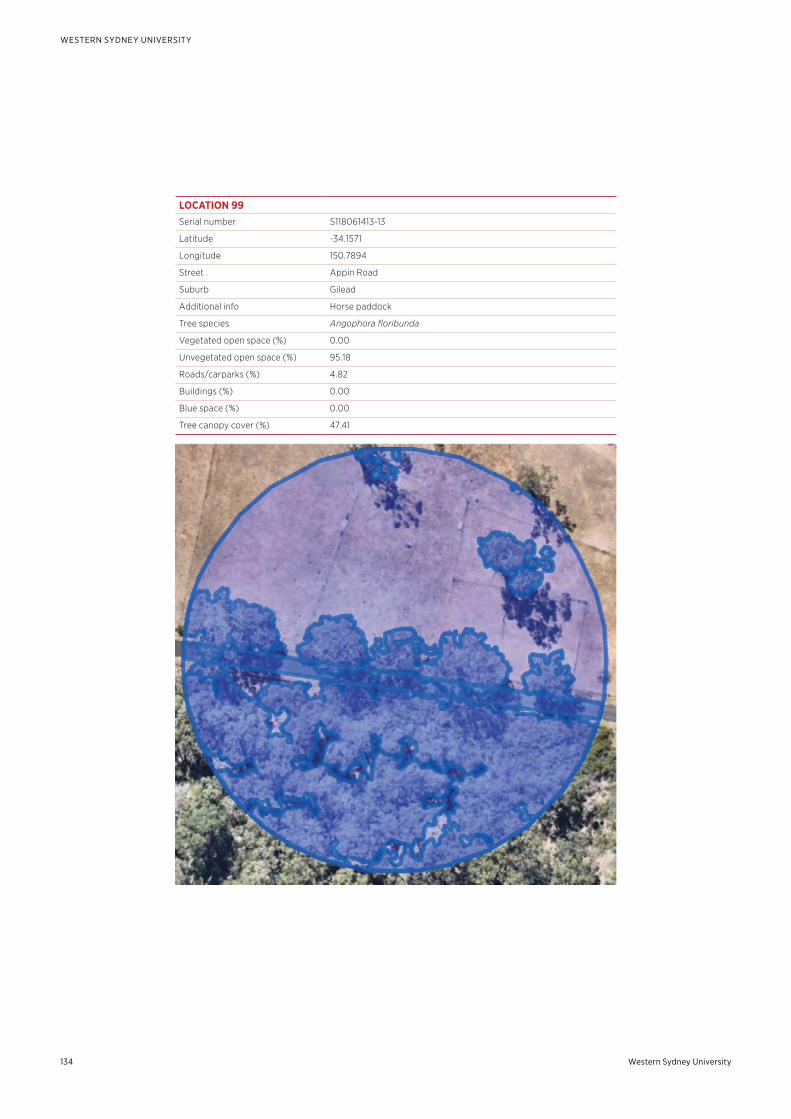
Western Sydney University134
WESTERN SYDNEY UNIVERSITY
LOCATION 99Serial number S118061413-13
Latitude -34.1571
Longitude 150.7894
Street Appin Road
Suburb Gilead
Additional info Horse paddock
Tree species Angophora floribunda
Vegetated open space (%) 0.00
Unvegetated open space (%) 95.18
Roads/carparks (%) 4.82
Buildings (%) 0.00
Blue space (%) 0.00
Tree canopy cover (%) 47.41
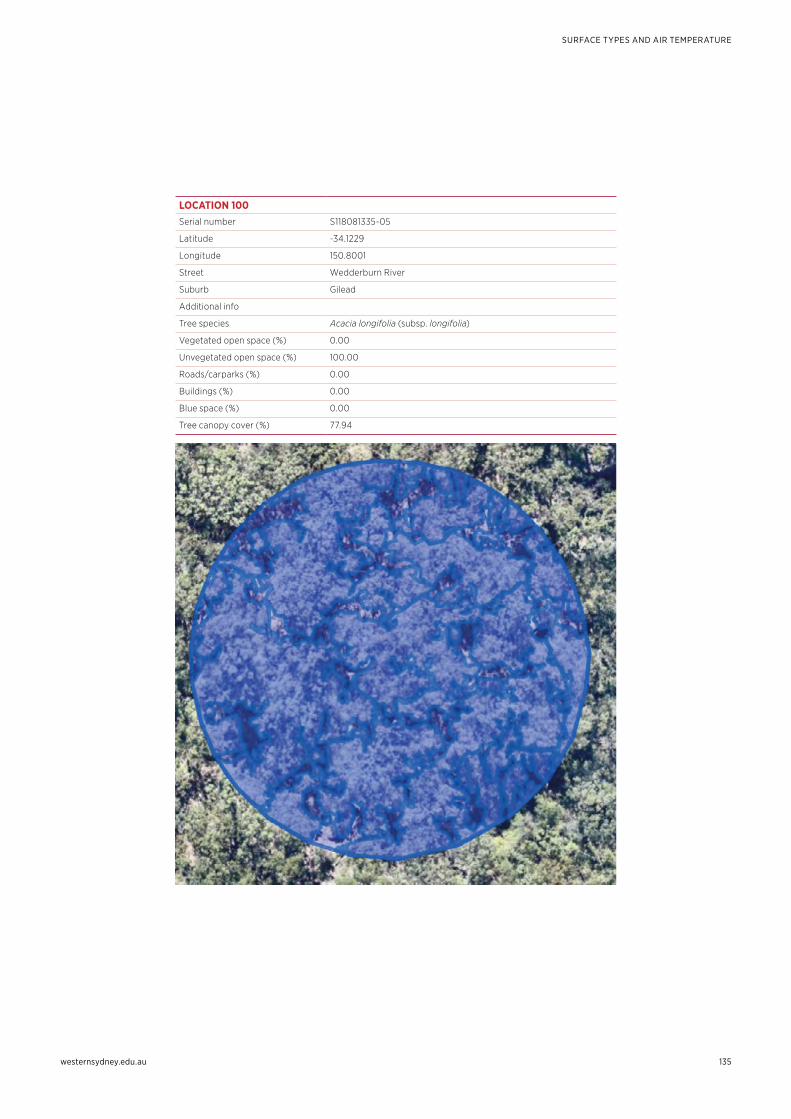
westernsydney.edu.au
SURFACE TYPES AND AIR TEMPERATURE
135
LOCATION 100Serial number S118081335-05
Latitude -34.1229
Longitude 150.8001
Street Wedderburn River
Suburb Gilead
Additional info
Tree species Acacia longifolia (subsp. longifolia)
Vegetated open space (%) 0.00
Unvegetated open space (%) 100.00
Roads/carparks (%) 0.00
Buildings (%) 0.00
Blue space (%) 0.00
Tree canopy cover (%) 77.94
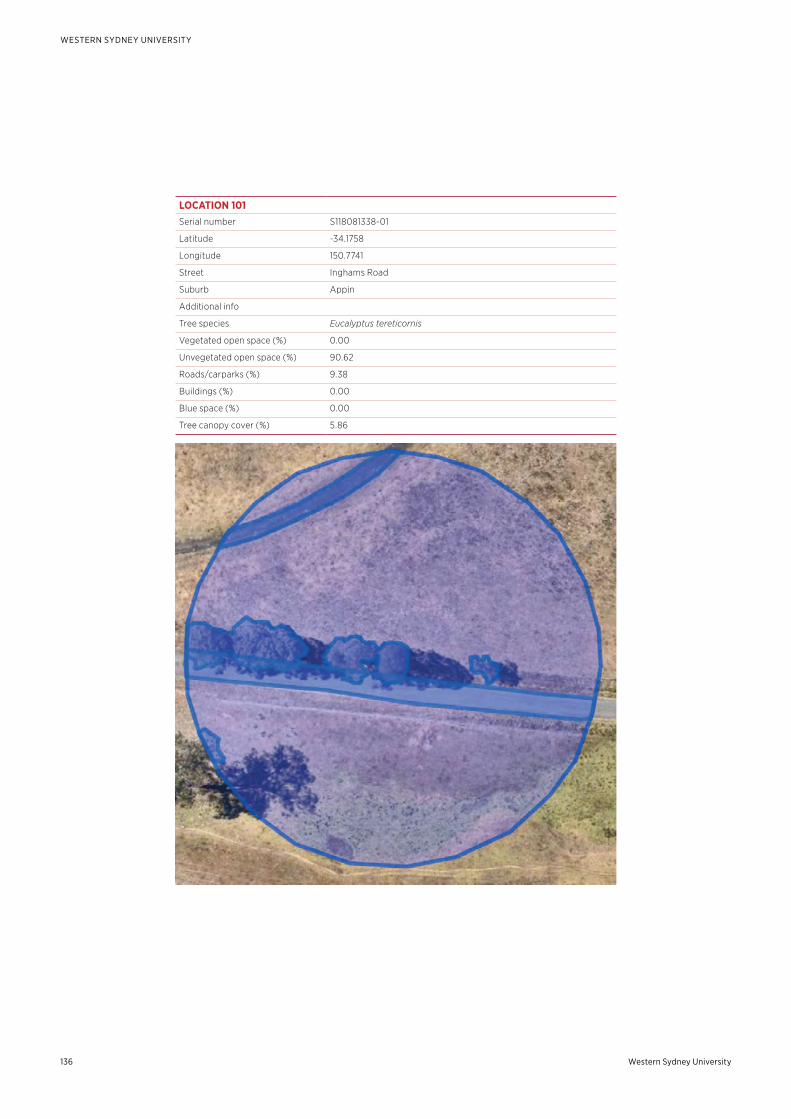
Western Sydney University136
WESTERN SYDNEY UNIVERSITY
LOCATION 101Serial number S118081338-01
Latitude -34.1758
Longitude 150.7741
Street Inghams Road
Suburb Appin
Additional info
Tree species Eucalyptus tereticornis
Vegetated open space (%) 0.00
Unvegetated open space (%) 90.62
Roads/carparks (%) 9.38
Buildings (%) 0.00
Blue space (%) 0.00
Tree canopy cover (%) 5.86
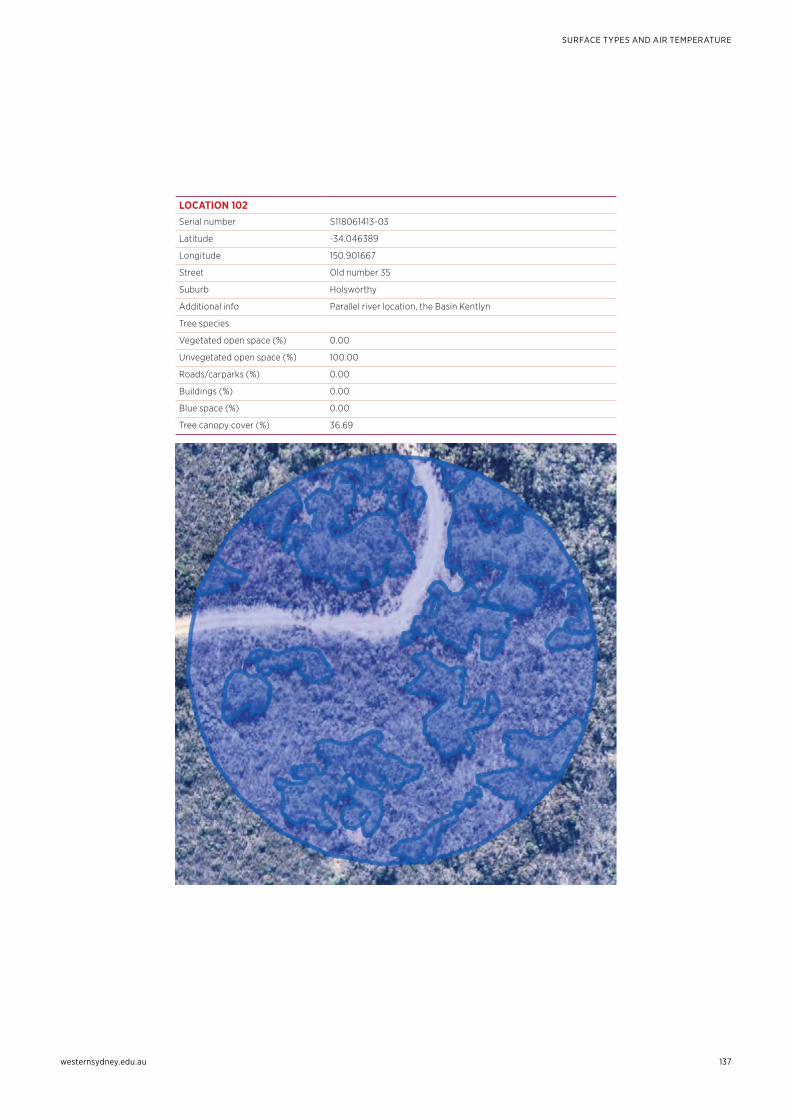
westernsydney.edu.au
SURFACE TYPES AND AIR TEMPERATURE
137
LOCATION 102Serial number S118061413-03
Latitude -34.046389
Longitude 150.901667
Street Old number 35
Suburb Holsworthy
Additional info Parallel river location, the Basin Kentlyn
Tree species
Vegetated open space (%) 0.00
Unvegetated open space (%) 100.00
Roads/carparks (%) 0.00
Buildings (%) 0.00
Blue space (%) 0.00
Tree canopy cover (%) 36.69

Western Sydney University138
WESTERN SYDNEY UNIVERSITY

westernsydney.edu.au
SURFACE TYPES AND AIR TEMPERATURE
139

WESTERNSYDNEY.EDU.AU
CONTACT USWestern Sydney University,
Locked Bag 1797, Penrith, NSW 2751
Related Documents