THE IMPACT OF PLANT VARIETY PROTECTION SYSTEM IN KENYA EVANS O. SIKINYI HEAD, SEED CERTIFICATION & PLANT VARIETY PROTECTION 2ND WORLD SEED CONFERENCE, SEPT 8-11, 2009 ROME

Welcome message from author
This document is posted to help you gain knowledge. Please leave a comment to let me know what you think about it! Share it to your friends and learn new things together.
Transcript
THE IMPACT OF PLANT VARIETY PROTECTION
SYSTEM IN KENYA
EVANS O. SIKINYI
HEAD, SEED CERTIFICATION & PLANT VARIETY
PROTECTION
2ND WORLD SEED CONFERENCE, SEPT 8-11, 2009
ROME
OUTLINE
ROLE OF AGRICULTURE IN KENYA
THE CHALLENGES TO AGRICULTURE
FACING THE CHALLENGES
IMPACT OF PVP
CONCLUSIONS
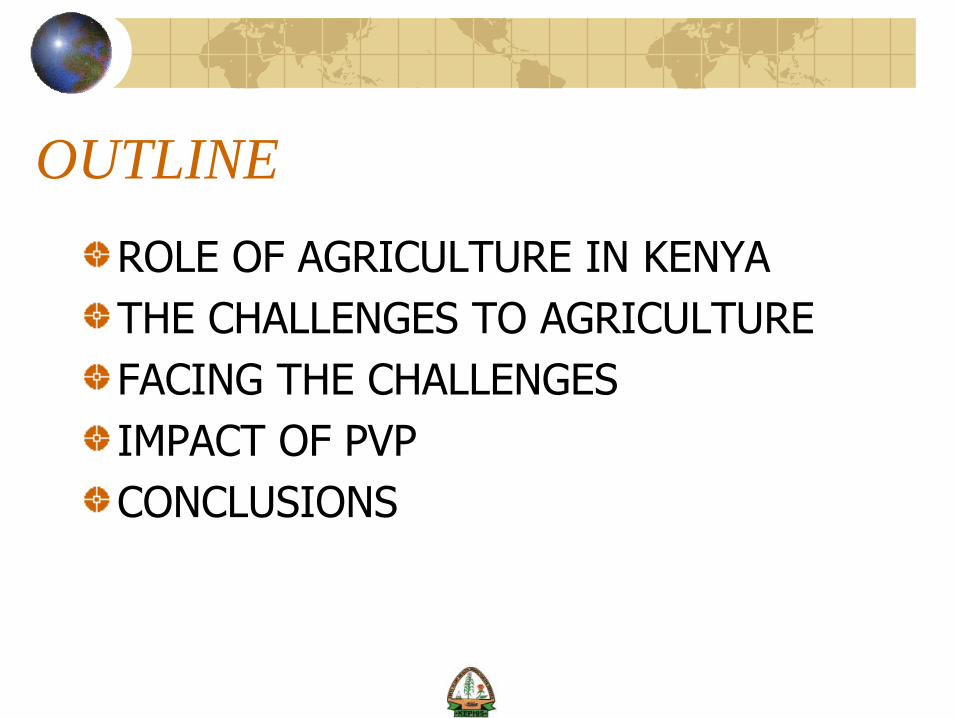
UPOV Membership/Territories covered
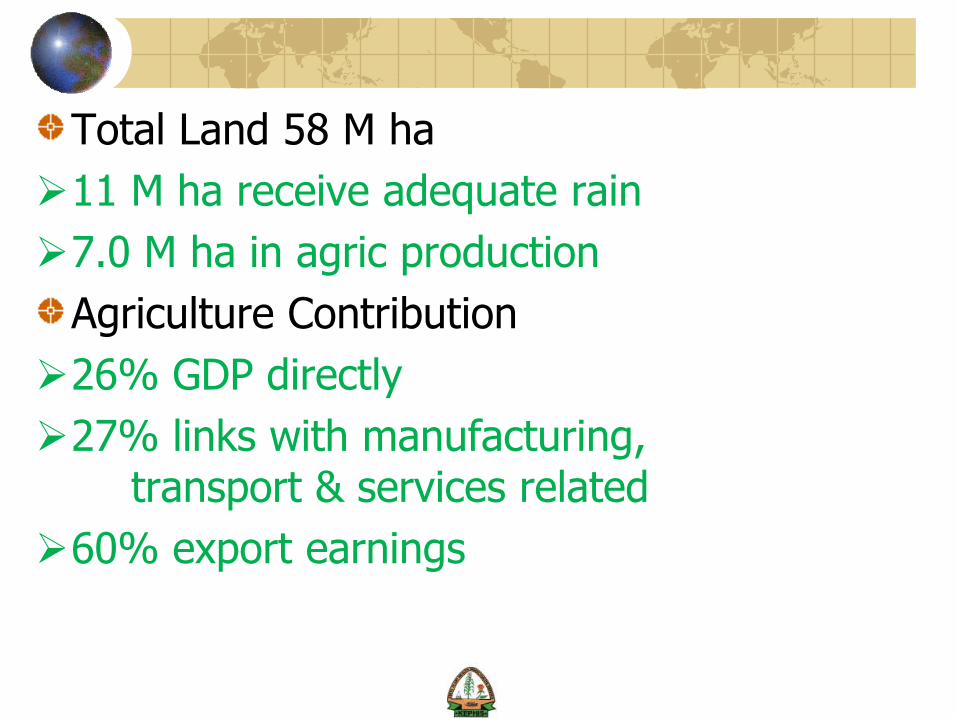
Total Land 58 M ha
11 M ha receive adequate rain
7.0 M ha in agric production
Agriculture Contribution
26% GDP directly
27% links with manufacturing, transport & services related
60% export earnings
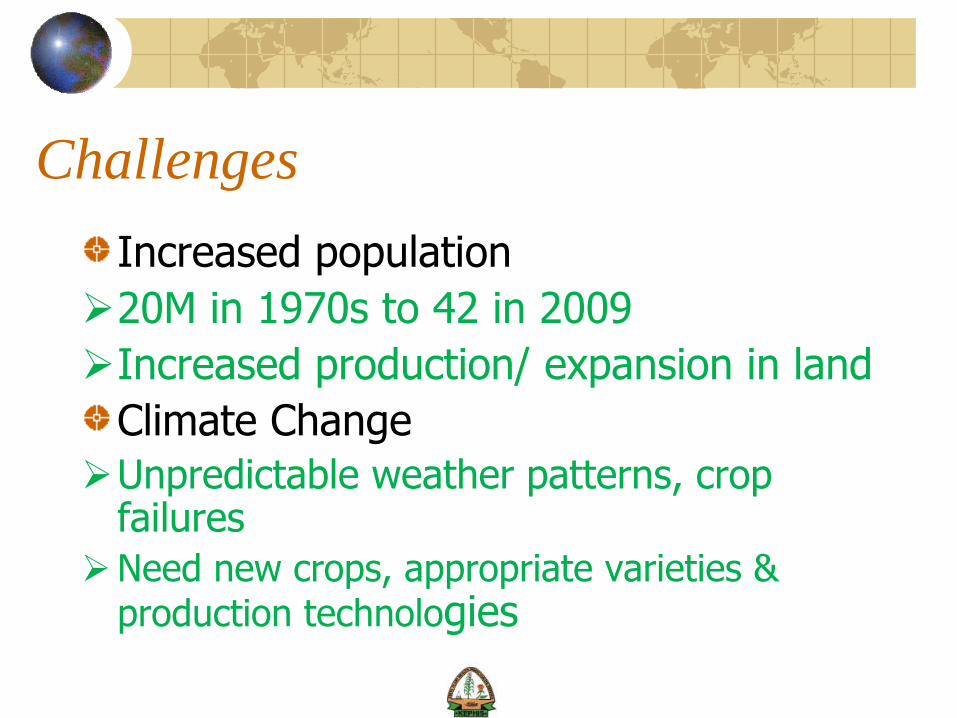
Challenges
Increased population
20M in 1970s to 42 in 2009
Increased production/ expansion in land
Climate Change
Unpredictable weather patterns, crop failures
Need new crops, appropriate varieties & production technologies
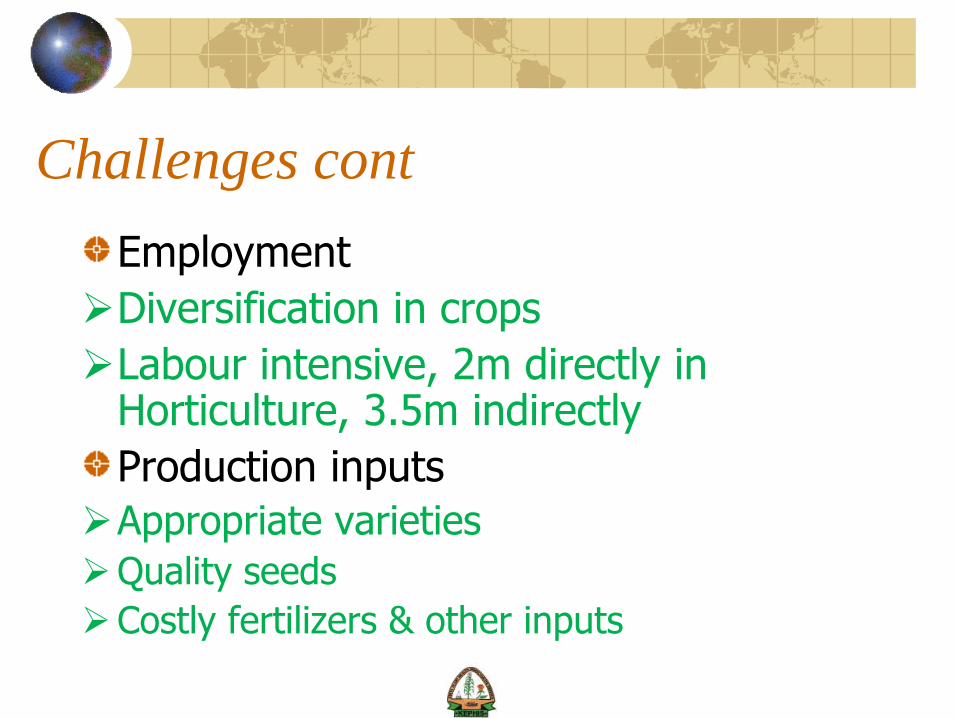
Challenges cont
Employment
Diversification in crops
Labour intensive, 2m directly in Horticulture, 3.5m indirectly
Production inputs
Appropriate varieties
Quality seeds
Costly fertilizers & other inputs
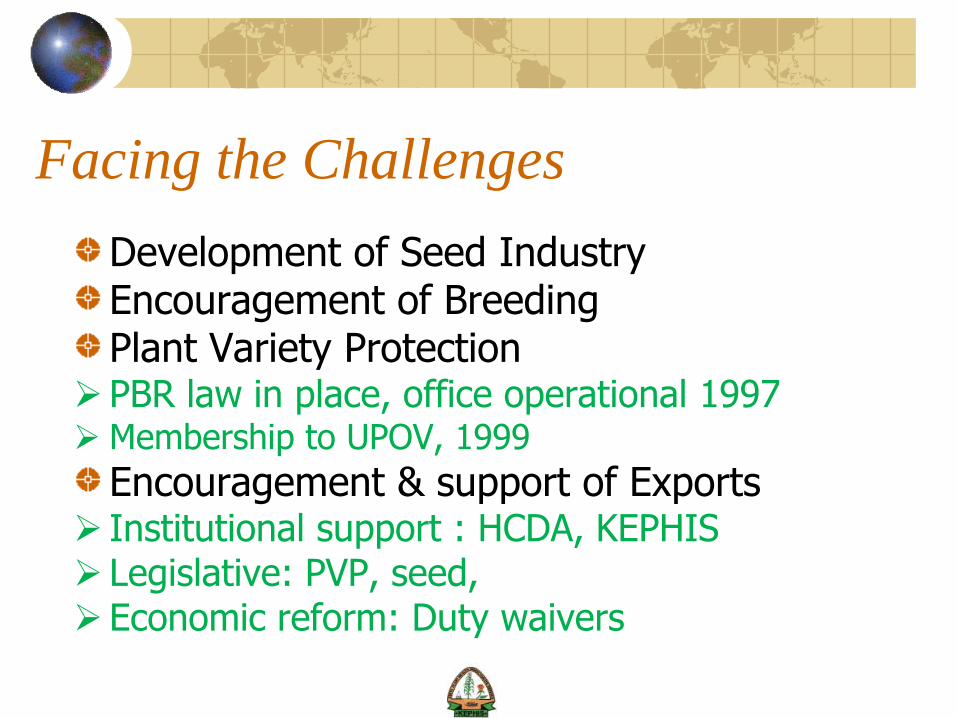
Facing the Challenges
Development of Seed IndustryEncouragement of BreedingPlant Variety Protection
PBR law in place, office operational 1997 Membership to UPOV, 1999
Encouragement & support of Exports Institutional support : HCDA, KEPHIS Legislative: PVP, seed, Economic reform: Duty waivers
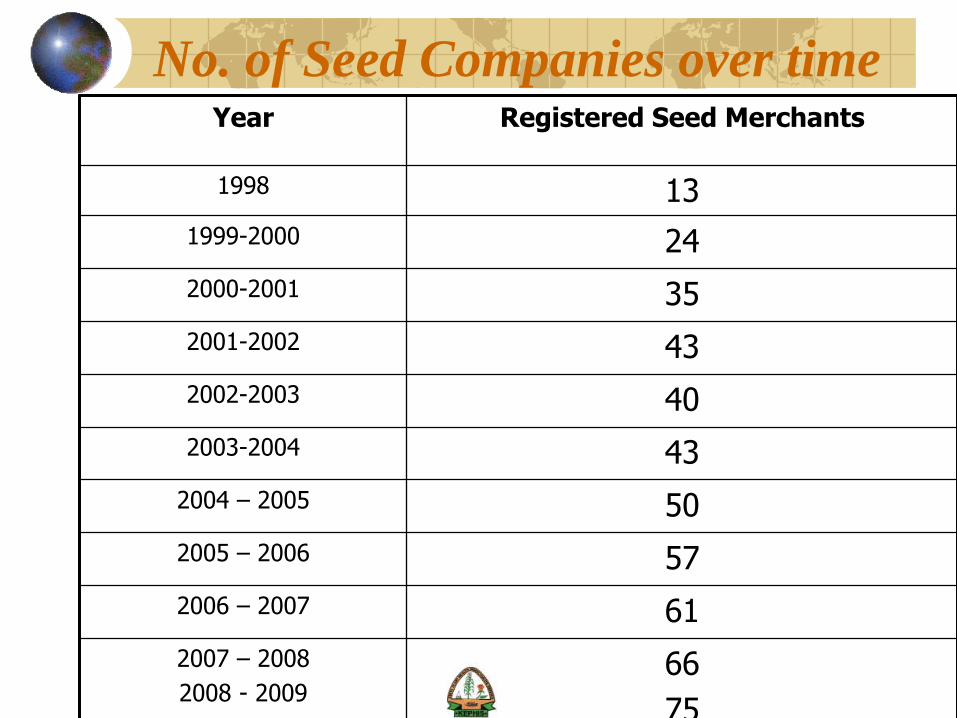
No. of Seed Companies over timeYear Registered Seed Merchants
1998 13
1999-2000 24
2000-2001 35
2001-2002 43
2002-2003 40
2003-2004 43
2004 – 2005 50
2005 – 2006 57
2006 – 2007 61
2007 – 2008
2008 - 200966
75
PVP implementation challenges
Legislation
Time to review or make regulations
IP Awareness
Breeders, institutions, policy makers
Lack of Institutional IP policyBreeders, institutions
Capacity, Human & infrastructure
Impact of PVP in Kenya
Enhanced Access to foreign and number of new varieties
Increased production
Increased choice
Production in new frontiers
Germplasm for further breeding
Encouragement of domestic breeders
Increased number of applications
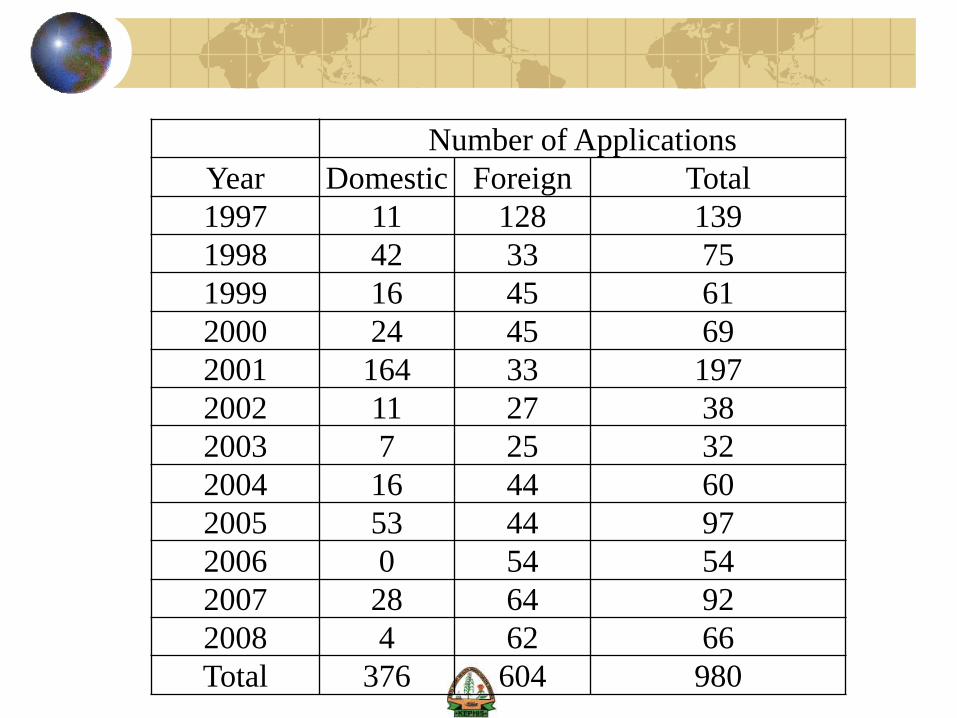
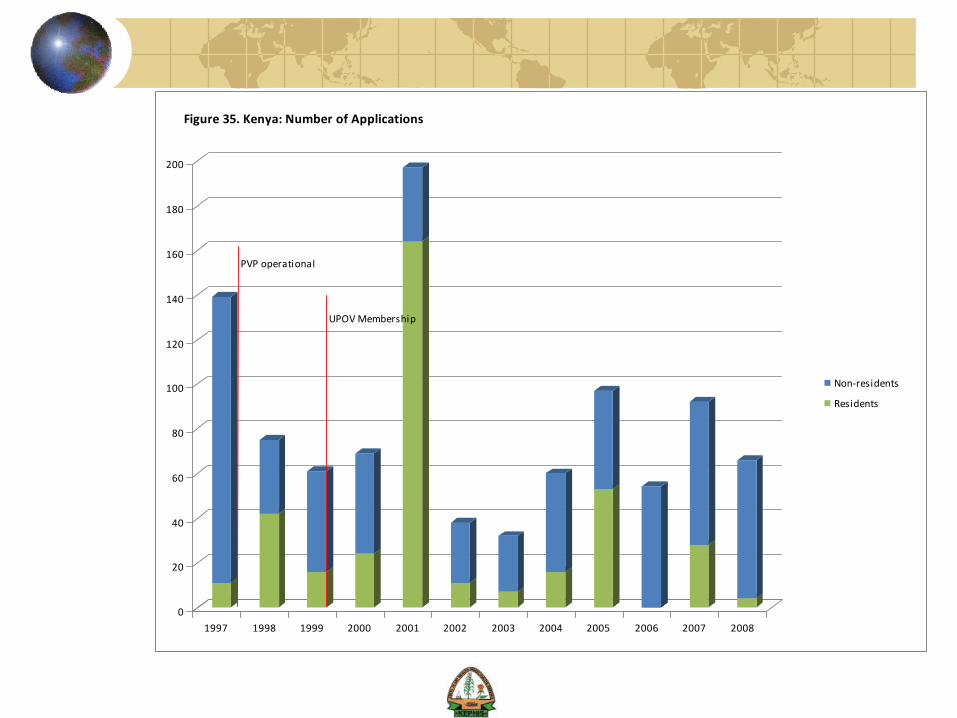
Number of Applications
Year Domestic Foreign Total
1997 11 128 139
1998 42 33 75
1999 16 45 61
2000 24 45 69
2001 164 33 197
2002 11 27 38
2003 7 25 32
2004 16 44 60
2005 53 44 97
2006 0 54 54
2007 28 64 92
2008 4 62 66
Total 376 604 980
0
20
40
60
80
100
120
140
160
180
200
1997 1998 1999 2000 2001 2002 2003 2004 2005 2006 2007 2008
Figure 35. Kenya: Number of Applications
Non-residents
Residents
PVP operational
UPOV Membership
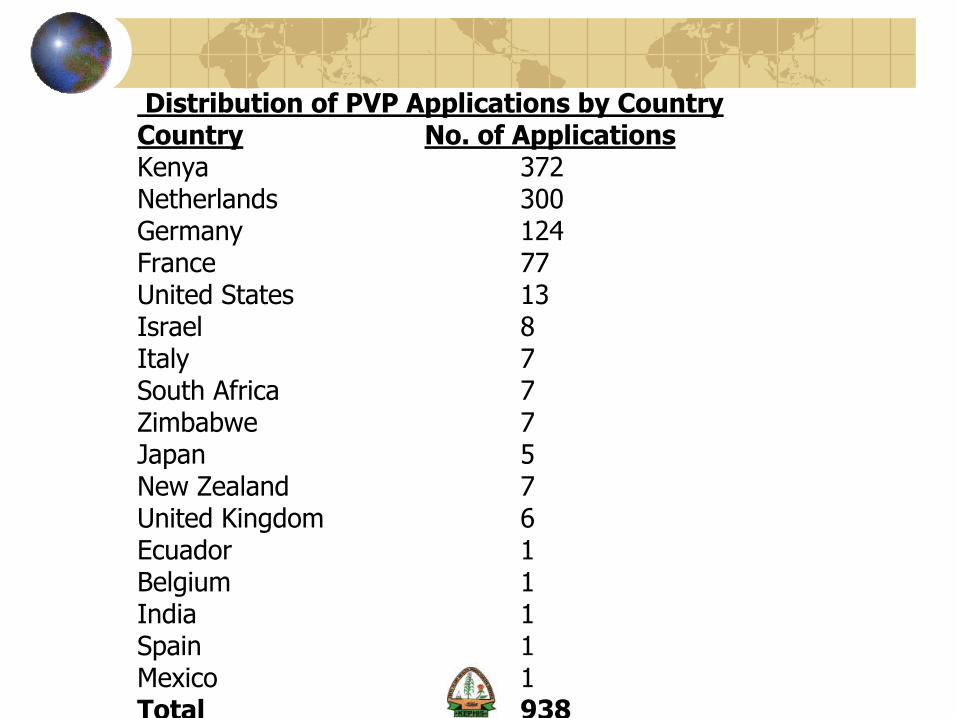
Distribution of PVP Applications by CountryCountry No. of ApplicationsKenya 372Netherlands 300Germany 124France 77United States 13Israel 8Italy 7South Africa 7Zimbabwe 7Japan 5New Zealand 7United Kingdom 6Ecuador 1Belgium 1India 1Spain 1Mexico 1Total 938
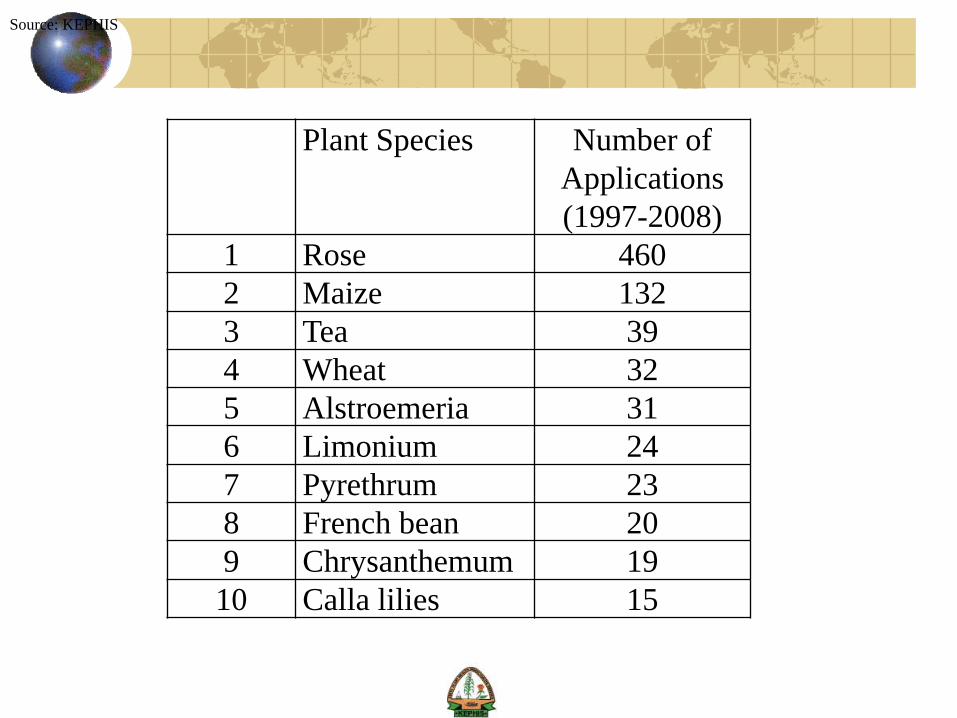
Plant Species Number of
Applications
(1997-2008)
1 Rose 460
2 Maize 132
3 Tea 39
4 Wheat 32
5 Alstroemeria 31
6 Limonium 24
7 Pyrethrum 23
8 French bean 20
9 Chrysanthemum 19
10 Calla lilies 15
Source: KEPHIS
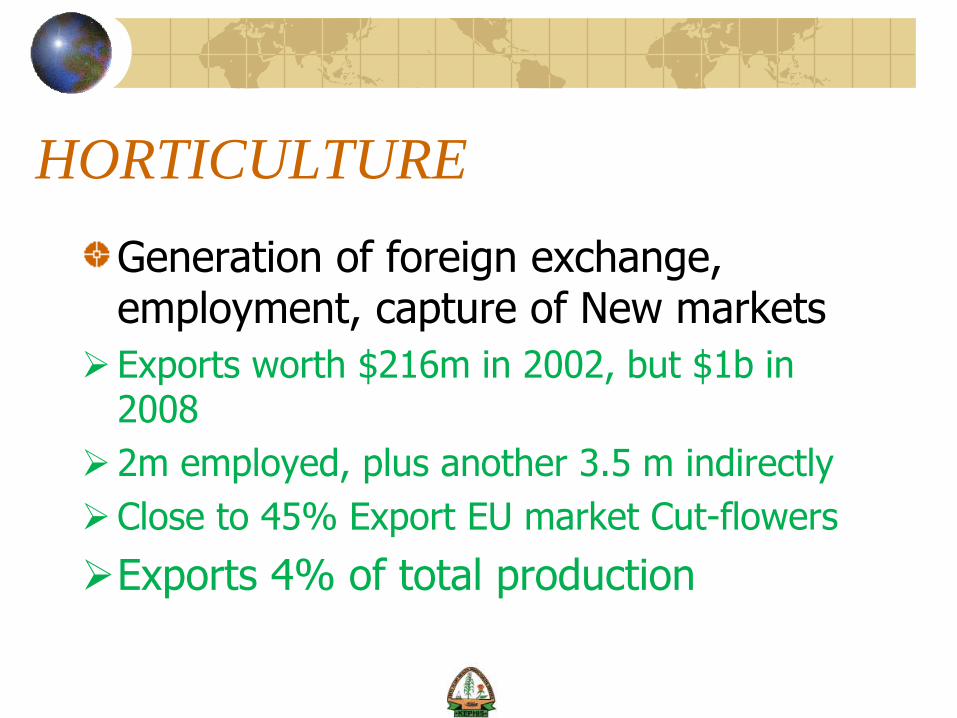
HORTICULTURE
Generation of foreign exchange, employment, capture of New markets
Exports worth $216m in 2002, but $1b in 2008
2m employed, plus another 3.5 m indirectly
Close to 45% Export EU market Cut-flowers
Exports 4% of total production

-
20,000
40,000
60,000
80,000
100,000
120,000
140,000
0
5
10
15
20
25
30
35
40
45
1987
1989
1991
1993
1995
1997
1999
2001
2003
2004
2005
2006
2007
2008
Vo
lum
e (to
ns)
Valu
e (B
illi
on
Ksh
s)
Figure 2: Export of Kenyan Cut Flowers
Value (Billion (Kshs.)
Volume (Tons)
PVP Operational
UPOV Membership
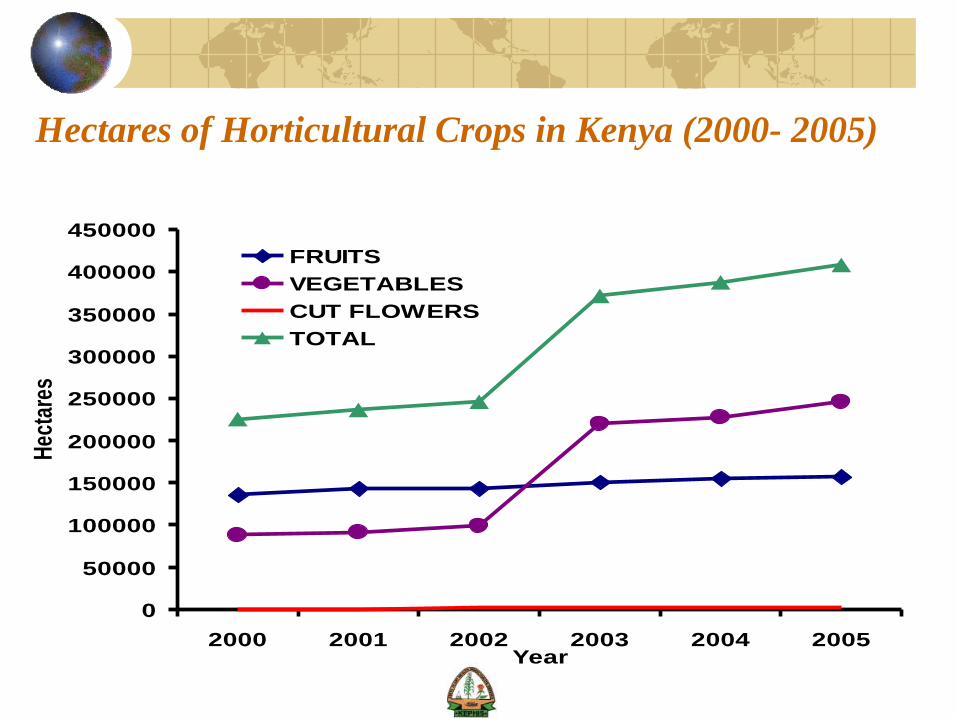
Hectares of Horticultural Crops in Kenya (2000- 2005)
0
50000
100000
150000
200000
250000
300000
350000
400000
450000
2000 2001 2002 2003 2004 2005Year
Hec
tare
s
FRUITS
VEGETABLES
CUT FLOWERS
TOTAL
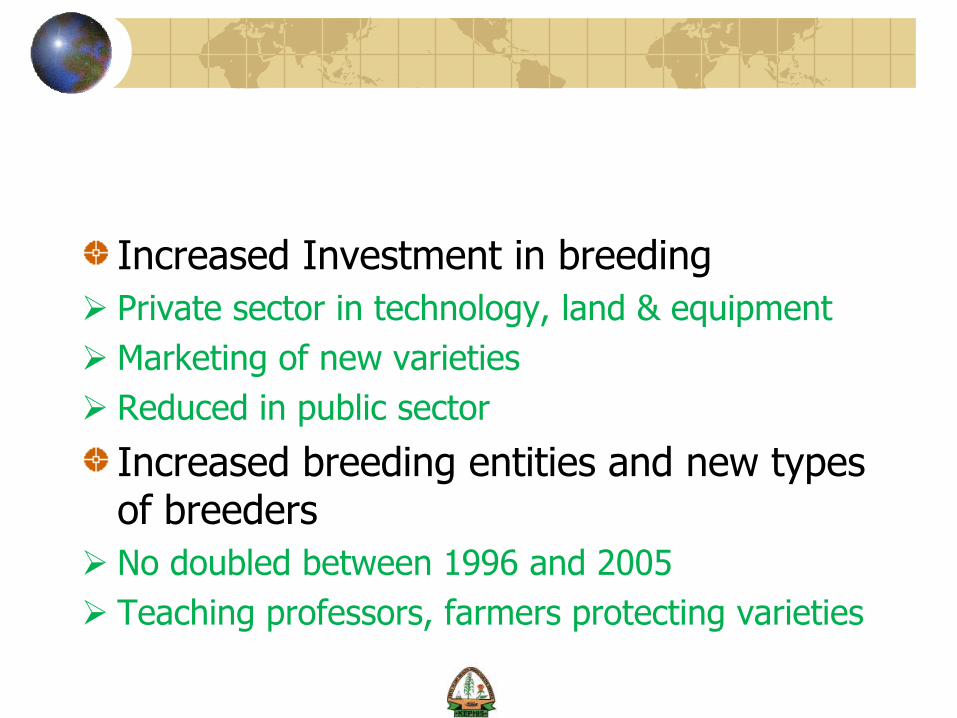
Increased Investment in breeding
Private sector in technology, land & equipment
Marketing of new varieties
Reduced in public sector
Increased breeding entities and new types of breeders
No doubled between 1996 and 2005
Teaching professors, farmers protecting varieties
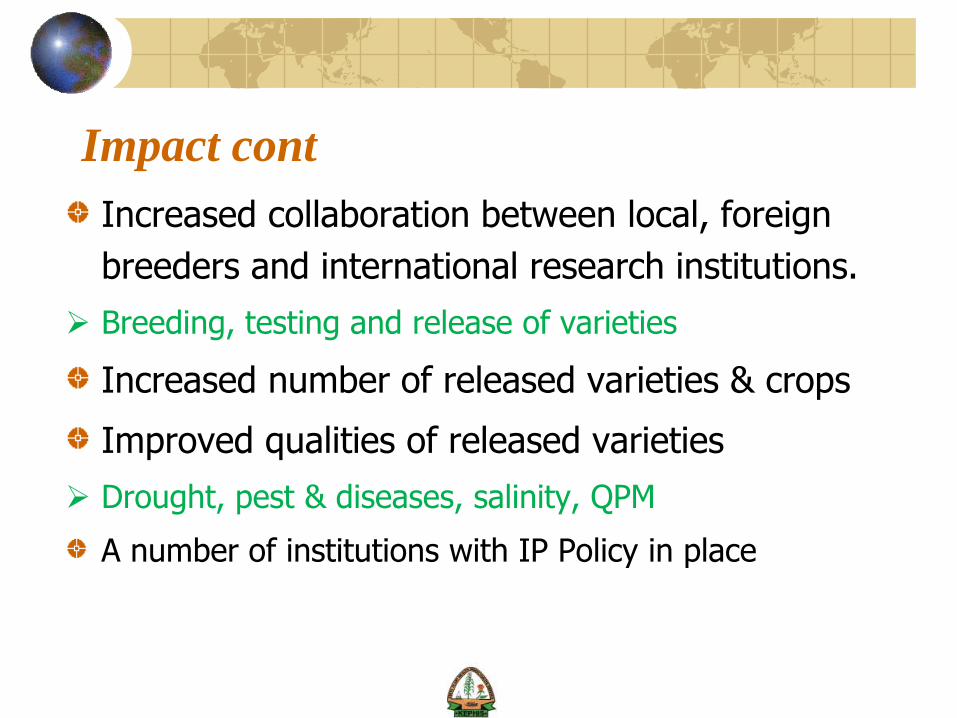
Increased collaboration between local, foreign
breeders and international research institutions.
Breeding, testing and release of varieties
Increased number of released varieties & crops
Improved qualities of released varieties
Drought, pest & diseases, salinity, QPM
A number of institutions with IP Policy in place
Impact cont
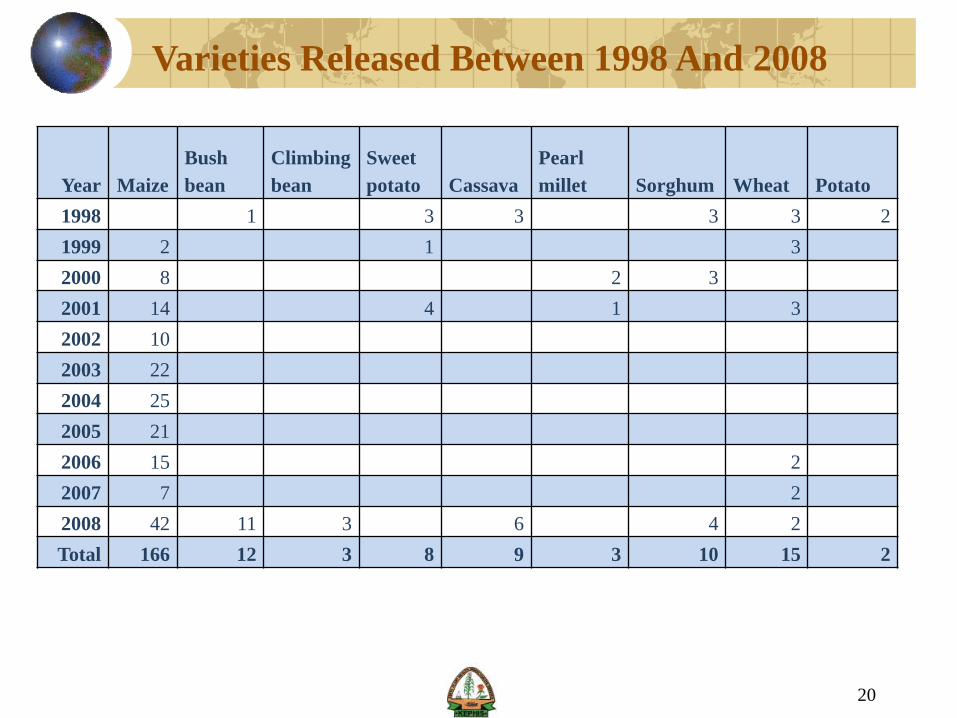
Year Maize
Bush
bean
Climbing
bean
Sweet
potato Cassava
Pearl
millet Sorghum Wheat Potato
1998 1 3 3 3 3 2
1999 2 1 3
2000 8 2 3
2001 14 4 1 3
2002 10
2003 22
2004 25
2005 21
2006 15 2
2007 7 2
2008 42 11 3 6 4 2
Total 166 12 3 8 9 3 10 15 2
20
Varieties Released Between 1998 And 2008
Many challenges due to changing World
PVP introduction has contributed to increased Breeding,
testing and release of varieties and crops, introduction of
superior foreign varieties, to meet the demands
Resulted in increased production, foreign exchange
earnings, employment
A vibrant seed industry
Plays a major role in meeting the challenges of the
changing world
Conclusions and Summary
THANK YOU
Related Documents