This article was downloaded by: [Farha Ghapar] On: 08 May 2014, At: 06:10 Publisher: Routledge Informa Ltd Registered in England and Wales Registered Number: 1072954 Registered office: Mortimer House, 37-41 Mortimer Street, London W1T 3JH, UK Journal of the Asia Pacific Economy Publication details, including instructions for authors and subscription information: http://www.tandfonline.com/loi/rjap20 The impact of patenting activity on the financial performance of Malaysian firms Farha Ghapar a , Robert Brooks b & Russell Smyth c a Department of Economics, Universiti Teknologi MARA, Johor, Malaysia b Department of Econometrics and Business Statistics, Monash University, Caulfield, Australia c Department of Economics and Centre for Development Economics, Monash University, Clayton, Australia Published online: 17 Apr 2014. To cite this article: Farha Ghapar, Robert Brooks & Russell Smyth (2014) The impact of patenting activity on the financial performance of Malaysian firms, Journal of the Asia Pacific Economy, 19:3, 445-463, DOI: 10.1080/13547860.2014.908536 To link to this article: http://dx.doi.org/10.1080/13547860.2014.908536 PLEASE SCROLL DOWN FOR ARTICLE Taylor & Francis makes every effort to ensure the accuracy of all the information (the “Content”) contained in the publications on our platform. However, Taylor & Francis, our agents, and our licensors make no representations or warranties whatsoever as to the accuracy, completeness, or suitability for any purpose of the Content. Any opinions and views expressed in this publication are the opinions and views of the authors, and are not the views of or endorsed by Taylor & Francis. The accuracy of the Content should not be relied upon and should be independently verified with primary sources of information. Taylor and Francis shall not be liable for any losses, actions, claims, proceedings, demands, costs, expenses, damages, and other liabilities whatsoever or howsoever caused arising directly or indirectly in connection with, in relation to or arising out of the use of the Content. This article may be used for research, teaching, and private study purposes. Any substantial or systematic reproduction, redistribution, reselling, loan, sub-licensing, systematic supply, or distribution in any form to anyone is expressly forbidden. Terms &

Welcome message from author
This document is posted to help you gain knowledge. Please leave a comment to let me know what you think about it! Share it to your friends and learn new things together.
Transcript
This article was downloaded by: [Farha Ghapar]On: 08 May 2014, At: 06:10Publisher: RoutledgeInforma Ltd Registered in England and Wales Registered Number: 1072954 Registeredoffice: Mortimer House, 37-41 Mortimer Street, London W1T 3JH, UK
Journal of the Asia Pacific EconomyPublication details, including instructions for authors andsubscription information:http://www.tandfonline.com/loi/rjap20
The impact of patenting activity onthe financial performance of MalaysianfirmsFarha Ghapara, Robert Brooksb & Russell Smythc
a Department of Economics, Universiti Teknologi MARA, Johor,Malaysiab Department of Econometrics and Business Statistics, MonashUniversity, Caulfield, Australiac Department of Economics and Centre for DevelopmentEconomics, Monash University, Clayton, AustraliaPublished online: 17 Apr 2014.
To cite this article: Farha Ghapar, Robert Brooks & Russell Smyth (2014) The impact of patentingactivity on the financial performance of Malaysian firms, Journal of the Asia Pacific Economy, 19:3,445-463, DOI: 10.1080/13547860.2014.908536
To link to this article: http://dx.doi.org/10.1080/13547860.2014.908536
PLEASE SCROLL DOWN FOR ARTICLE
Taylor & Francis makes every effort to ensure the accuracy of all the information (the“Content”) contained in the publications on our platform. However, Taylor & Francis,our agents, and our licensors make no representations or warranties whatsoever as tothe accuracy, completeness, or suitability for any purpose of the Content. Any opinionsand views expressed in this publication are the opinions and views of the authors,and are not the views of or endorsed by Taylor & Francis. The accuracy of the Contentshould not be relied upon and should be independently verified with primary sourcesof information. Taylor and Francis shall not be liable for any losses, actions, claims,proceedings, demands, costs, expenses, damages, and other liabilities whatsoever orhowsoever caused arising directly or indirectly in connection with, in relation to or arisingout of the use of the Content.
This article may be used for research, teaching, and private study purposes. Anysubstantial or systematic reproduction, redistribution, reselling, loan, sub-licensing,systematic supply, or distribution in any form to anyone is expressly forbidden. Terms &

Conditions of access and use can be found at http://www.tandfonline.com/page/terms-and-conditions
Dow
nloa
ded
by [
Farh
a G
hapa
r] a
t 06:
10 0
8 M
ay 2
014
The impact of patenting activity on the financial performance
of Malaysian firms
Farha Ghapara, Robert Brooksb and Russell Smythc*
aDepartment of Economics, Universiti Teknologi MARA, Johor, Malaysia; bDepartment ofEconometrics and Business Statistics, Monash University, Caulfield, Australia; cDepartment ofEconomics and Centre for Development Economics, Monash University, Clayton, Australia
This study analyses the relationship between patenting activity and financialperformance at the Malaysian firm level for firms that have been granted patents inMalaysia and the United States of America. We adopt the patent renewal and profitmaximization model as our theoretical underpinning for this study. The patentingactivity variables are measured based on the patent renewal system and the financialperformance variables are measured based on the profit margin. The sample ismanufacturing firms. We utilize a panel data-set spanning from 1994 to 2008 and themodel is estimated using panel least squares, fixed effects, random effects andgeneralized method of moments with various types of effects specifications andtransformations. The key finding from the empirical study is that there is a significantrelationship between patenting activity and financial performance at the Malaysianfirm level, but that the impact is rather small and that the signs on the coefficients aremixed. This result may reflect the level of competition that the firms faced over theperiod of the study, even though patenting is well known for giving firms somemonopoly power.
Keywords: patenting; patent renewal; firm financial performance; panel data model
JEL codes: K11; O31; O32; O34
1. Introduction
While patenting activity is common in advanced economies, this is not the case in emerg-
ing economies. This situation is not surprising given that patenting is a costly activity
(Schmookler 1966). Patent applications attract fees and, if a patent is granted, more costs
then accrue to maintain the patent (Griliches 1990). To complicate matters, a patent is
also territorial in nature (WIPO 2006, 2007; MyIPO 2008), which means that there are
extra costs involved to secure protection for the firm’s intellectual property (IP) in differ-
ent countries. Therefore, it is only firms for which the benefits exceed the costs involved
in the patenting activity that have an incentive to patent their innovation (Schumpeter
1942). Such firms register patents across territories in order to maximize the net returns to
their IP (Stoddard and Danielsen 2008).
Within a profit maximizing paradigm, a firm that has undertaken patenting activity
must have projected benefits beyond the costs of patenting the product (Schumpeter
1942). Indeed, the monopoly power resulting from the patenting activity may have a sig-
nificant positive impact on the firm’s financial performance. A patent can also be a pro-
cess, rather than a product (WIPO 2006). Consequently, some firms patent products and
processes either to be sold in the market or to be used in house. The former may maximize
*Corresponding author. Email: [email protected]
� 2014 Taylor & Francis
Journal of the Asia Pacific Economy, 2014
Vol. 19, No. 3, 445–463, http://dx.doi.org/10.1080/13547860.2014.908536
Dow
nloa
ded
by [
Farh
a G
hapa
r] a
t 06:
10 0
8 M
ay 2
014
the firm’s sales revenue in order to maximize profits, while the latter may serve as a
means to reduce business costs in order to maximize profits (Van Triest and Vis 2007).
Hence, patenting an invention represents a profit-maximizing strategy, both in the short
and long run. Empirically, however, when dealing with Malaysian firms that are still in
their infancy with respect to patenting activity (Ghapar 2009), the financial returns to
these firms from undertaking patenting activity are yet to be established.
The purpose of this study is to analyse the relationship between patenting activity and
financial performance. We do so for Malaysian manufacturing firms which have been
granted patents at a time when there are a dearth of studies for emerging economies
(Chandran and Wong 2011). Empirical studies have examined the relationship between
firms’ patenting activity and their financial performance in developed market economies.
The magnitude of the relationship estimated in existing studies depends on the method of
estimation and specification used. Most of the extant studies have found a positive rela-
tionship (Hall, Thoma, and Torrisi 2007; Connolly and Hirschey 1988; Griliches 1981),
but some have found a negative relationship (Hall, Jaffe, and Trajtenberg 2005). Other
studies have found no statistically significant relationship at all (Coombs and Bierly
2006; Griffith, Jensen, and Webster 2005; Geroski, Machin, and Walters 1997). However,
the issue has not been examined with Malaysian firm data. This study focuses on patent-
ing activity in Malaysia and the United States (US). The choice of the US is motivated by
the fact that it has been Malaysia’s largest trading partner since the 1990s (Malaysia
1996, 2001, 2006). In addition, our analysis also extends the literature that has explored
the link between research and development (R&D) expenditure, technological capabili-
ties and firm performance in emerging markets. For example, Sharma (2012) explores
R&D and firm performance in the Indian pharmaceutical industry. Rasiah (2010) explores
technological development and catch up in the Malaysian electronics industry. Our
research extends this literature by focusing on a specific manifestation of R&D and tech-
nological development, specifically the granting of patents, and whether that specific
manifestation is also positive for firm’s performance.
Beginning with seminal studies such as Griliches (1981) and Schankerman and Pakes
(1986), the economics of patents have developed considerably over the last few decades
(see e.g. Bessen 2008, 2009; Harhoff, Scherer, and Vopel 2003; Gambardella, Harhoff,
and Verspagen 2008; Neuh€ausler et al. 2011; Schubert 2011). While some previous
empirical studies have measured patenting activity based on a simple patent count
(Griliches 1981), we utilize a patent renewal model (Schankerman and Pakes 1986).
While some previous empirical studies have adopted the market valuation model (Hall,
Thoma, and Torrisi 2007), we use the profit maximization model (Rogers 2002), which
means that we measure financial performance based on the profit margin. The advantage
of doing this is that a patent has to undergo a specific patent system, for which in this
study the patent renewal model is our focus. The analysis in this study captures the impact
of the firm’s financial performance at different stages of the patent system. This represents
an advantage over analysing patents as a simple patent count. The measurement of
accounting profits, via the profit margin, has advantages over employing market values of
economic returns in emerging markets, such as Malaysia, given that the securities market
is in its relative infancy and, thus, might not accurately predict future economic profits
(Tuck 2005; Mueller 1990; Bauman 1989).
2. Institutional background
Of more than 37,000 patents granted in Malaysia, 2344 patents have been granted to
either private or public firms, while the others were granted to public or private
446 F. Ghapar et al.
Dow
nloa
ded
by [
Farh
a G
hapa
r] a
t 06:
10 0
8 M
ay 2
014
institutions and individuals. Table 1 indicates that private firms represented 88% of patent
applications by firms. Of the patents granted to firms, private firms received 94%. That
private firms dominate patent activity among firms in Malaysia is to be expected, given
that there are a larger number of privately limited firms than publicly listed firms regis-
tered in Malaysia. Of nearly 800,000 registered local firms in Malaysia, as reported to the
Companies Commission of Malaysia (SSM 2010), only 976 are listed on Bursa Malaysia
(Bursa Malaysia 2010).1
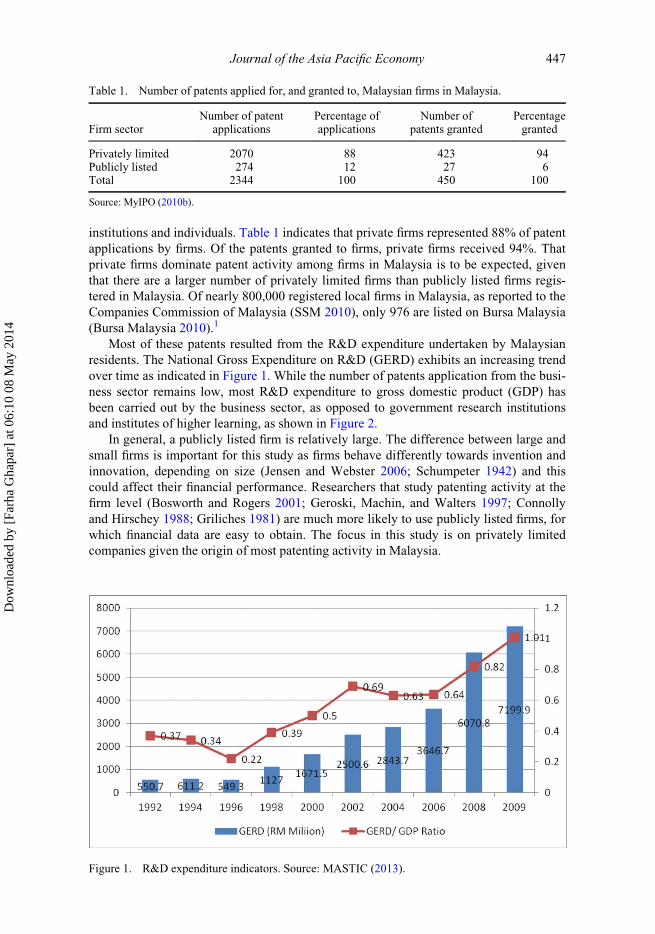
Most of these patents resulted from the R&D expenditure undertaken by Malaysian
residents. The National Gross Expenditure on R&D (GERD) exhibits an increasing trend
over time as indicated in Figure 1. While the number of patents application from the busi-
ness sector remains low, most R&D expenditure to gross domestic product (GDP) has
been carried out by the business sector, as opposed to government research institutions
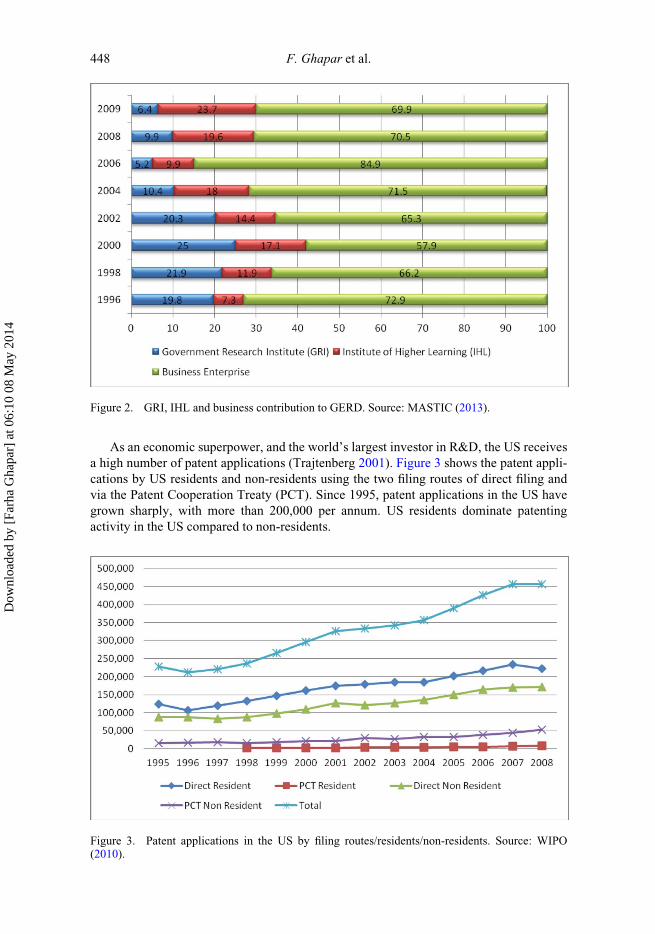
and institutes of higher learning, as shown in Figure 2.
In general, a publicly listed firm is relatively large. The difference between large and
small firms is important for this study as firms behave differently towards invention and
innovation, depending on size (Jensen and Webster 2006; Schumpeter 1942) and this
could affect their financial performance. Researchers that study patenting activity at the
firm level (Bosworth and Rogers 2001; Geroski, Machin, and Walters 1997; Connolly
and Hirschey 1988; Griliches 1981) are much more likely to use publicly listed firms, for
which financial data are easy to obtain. The focus in this study is on privately limited
companies given the origin of most patenting activity in Malaysia.
Table 1. Number of patents applied for, and granted to, Malaysian firms in Malaysia.
Firm sectorNumber of patent
applicationsPercentage ofapplications
Number ofpatents granted
Percentagegranted
Privately limited 2070 88 423 94Publicly listed 274 12 27 6Total 2344 100 450 100
Source: MyIPO (2010b).
Figure 1. R&D expenditure indicators. Source: MASTIC (2013).
Journal of the Asia Pacific Economy 447
Dow
nloa
ded
by [
Farh
a G
hapa
r] a
t 06:
10 0
8 M
ay 2
014
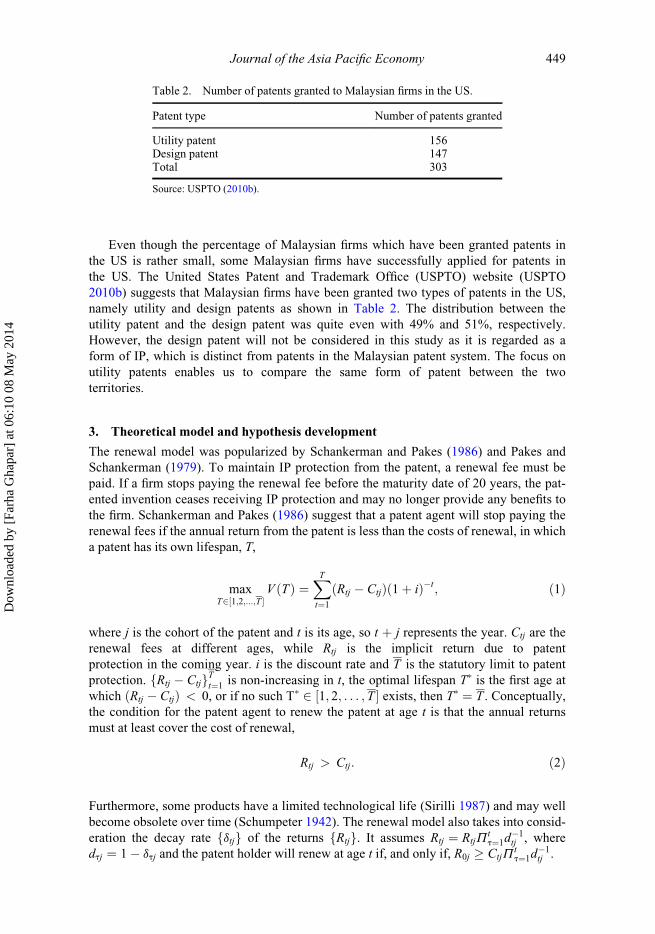
As an economic superpower, and the world’s largest investor in R&D, the US receives
a high number of patent applications (Trajtenberg 2001). Figure 3 shows the patent appli-
cations by US residents and non-residents using the two filing routes of direct filing and
via the Patent Cooperation Treaty (PCT). Since 1995, patent applications in the US have
grown sharply, with more than 200,000 per annum. US residents dominate patenting
activity in the US compared to non-residents.
Figure 2. GRI, IHL and business contribution to GERD. Source: MASTIC (2013).
Figure 3. Patent applications in the US by filing routes/residents/non-residents. Source: WIPO(2010).
448 F. Ghapar et al.
Dow
nloa
ded
by [
Farh
a G
hapa
r] a
t 06:
10 0
8 M
ay 2
014
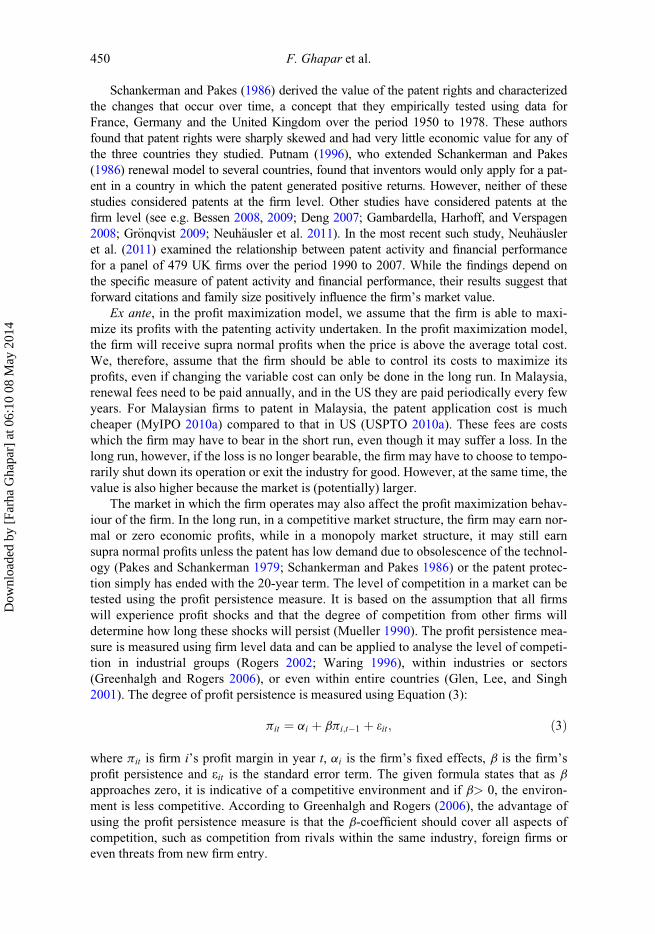
Even though the percentage of Malaysian firms which have been granted patents in
the US is rather small, some Malaysian firms have successfully applied for patents in
the US. The United States Patent and Trademark Office (USPTO) website (USPTO
2010b) suggests that Malaysian firms have been granted two types of patents in the US,
namely utility and design patents as shown in Table 2. The distribution between the
utility patent and the design patent was quite even with 49% and 51%, respectively.
However, the design patent will not be considered in this study as it is regarded as a
form of IP, which is distinct from patents in the Malaysian patent system. The focus on
utility patents enables us to compare the same form of patent between the two
territories.
3. Theoretical model and hypothesis development
The renewal model was popularized by Schankerman and Pakes (1986) and Pakes and
Schankerman (1979). To maintain IP protection from the patent, a renewal fee must be
paid. If a firm stops paying the renewal fee before the maturity date of 20 years, the pat-
ented invention ceases receiving IP protection and may no longer provide any benefits to
the firm. Schankerman and Pakes (1986) suggest that a patent agent will stop paying the
renewal fees if the annual return from the patent is less than the costs of renewal, in which
a patent has its own lifespan, T,
maxT2½1;2;:::;T �
V ðTÞ ¼XT
t¼1
ðRtj � CtjÞð1þ iÞ�t; ð1Þ
where j is the cohort of the patent and t is its age, so t þ j represents the year. Ctj are the
renewal fees at different ages, while Rtj is the implicit return due to patent
protection in the coming year. i is the discount rate and T is the statutory limit to patent
protection. fRtj � CtjgTt¼1is non-increasing in t, the optimal lifespan T� is the first age at
which ðRtj � CtjÞ < 0, or if no such T� 2 ½1; 2; . . . ; T � exists, then T� ¼ T . Conceptually,
the condition for the patent agent to renew the patent at age t is that the annual returns
must at least cover the cost of renewal,
Rtj > Ctj: ð2Þ
Furthermore, some products have a limited technological life (Sirilli 1987) and may well
become obsolete over time (Schumpeter 1942). The renewal model also takes into consid-
eration the decay rate fdtjg of the returns fRtjg. It assumes Rtj ¼ RtjPtt¼1d
�1tj , where
dtj ¼ 1� dtj and the patent holder will renew at age t if, and only if, R0j � CtjPtt¼1d
�1tj .
Table 2. Number of patents granted to Malaysian firms in the US.
Patent type Number of patents granted
Utility patent 156Design patent 147Total 303
Source: USPTO (2010b).
Journal of the Asia Pacific Economy 449
Dow
nloa
ded
by [
Farh
a G
hapa
r] a
t 06:
10 0
8 M
ay 2
014
Schankerman and Pakes (1986) derived the value of the patent rights and characterized
the changes that occur over time, a concept that they empirically tested using data for
France, Germany and the United Kingdom over the period 1950 to 1978. These authors
found that patent rights were sharply skewed and had very little economic value for any of
the three countries they studied. Putnam (1996), who extended Schankerman and Pakes
(1986) renewal model to several countries, found that inventors would only apply for a pat-
ent in a country in which the patent generated positive returns. However, neither of these
studies considered patents at the firm level. Other studies have considered patents at the
firm level (see e.g. Bessen 2008, 2009; Deng 2007; Gambardella, Harhoff, and Verspagen
2008; Gr€onqvist 2009; Neuh€ausler et al. 2011). In the most recent such study, Neuh€ausleret al. (2011) examined the relationship between patent activity and financial performance
for a panel of 479 UK firms over the period 1990 to 2007. While the findings depend on
the specific measure of patent activity and financial performance, their results suggest that
forward citations and family size positively influence the firm’s market value.
Ex ante, in the profit maximization model, we assume that the firm is able to maxi-
mize its profits with the patenting activity undertaken. In the profit maximization model,
the firm will receive supra normal profits when the price is above the average total cost.
We, therefore, assume that the firm should be able to control its costs to maximize its
profits, even if changing the variable cost can only be done in the long run. In Malaysia,
renewal fees need to be paid annually, and in the US they are paid periodically every few
years. For Malaysian firms to patent in Malaysia, the patent application cost is much
cheaper (MyIPO 2010a) compared to that in US (USPTO 2010a). These fees are costs
which the firm may have to bear in the short run, even though it may suffer a loss. In the
long run, however, if the loss is no longer bearable, the firm may have to choose to tempo-
rarily shut down its operation or exit the industry for good. However, at the same time, the
value is also higher because the market is (potentially) larger.
The market in which the firm operates may also affect the profit maximization behav-
iour of the firm. In the long run, in a competitive market structure, the firm may earn nor-
mal or zero economic profits, while in a monopoly market structure, it may still earn
supra normal profits unless the patent has low demand due to obsolescence of the technol-
ogy (Pakes and Schankerman 1979; Schankerman and Pakes 1986) or the patent protec-
tion simply has ended with the 20-year term. The level of competition in a market can be
tested using the profit persistence measure. It is based on the assumption that all firms
will experience profit shocks and that the degree of competition from other firms will
determine how long these shocks will persist (Mueller 1990). The profit persistence mea-
sure is measured using firm level data and can be applied to analyse the level of competi-
tion in industrial groups (Rogers 2002; Waring 1996), within industries or sectors
(Greenhalgh and Rogers 2006), or even within entire countries (Glen, Lee, and Singh
2001). The degree of profit persistence is measured using Equation (3):
pit ¼ ai þ bpi;t�1 þ eit; ð3Þ
where pit is firm i’s profit margin in year t, ai is the firm’s fixed effects, b is the firm’s
profit persistence and eit is the standard error term. The given formula states that as b
approaches zero, it is indicative of a competitive environment and if b> 0, the environ-
ment is less competitive. According to Greenhalgh and Rogers (2006), the advantage of
using the profit persistence measure is that the b-coefficient should cover all aspects of
competition, such as competition from rivals within the same industry, foreign firms or
even threats from new firm entry.
450 F. Ghapar et al.
Dow
nloa
ded
by [
Farh
a G
hapa
r] a
t 06:
10 0
8 M
ay 2
014
This leads us to test the following hypothesis:
H1: There is a positive relationship between patents granted to a firm in Malaysia and the UnitedStates and the financial performance of the firm.
4. Data and methods
The data
The sample used in the empirical study consists of Malaysian manufacturing firms, which
have been granted patents by the Intellectual Property Corporation of Malaysia (MyIPO)
and/or the USPTO. The patent data were obtained from the MyIPO office in Malaysia
and the USPTO website, while the financial performance data were taken from the Com-
panies Commission of Malaysia (CCM).
The data provided by MyIPO are based on the name of the assignee. We are only
interested in those Malaysian firms which have been granted patents. We found 37,161
patents granted in Malaysia, based on the name of the assignee. For the purposes of this
study, a Malaysian firm was defined as a privately limited or publicly listed firm incorpo-
rated in Malaysia. Such firms were identified from MyIPO as follows. If a privately lim-
ited firm is incorporated in Malaysia, at the end of the firm’s name the words Sendirian
Berhad or the abbreviation Sdn. Bhd. appear, while the name of a publicly listed firm is
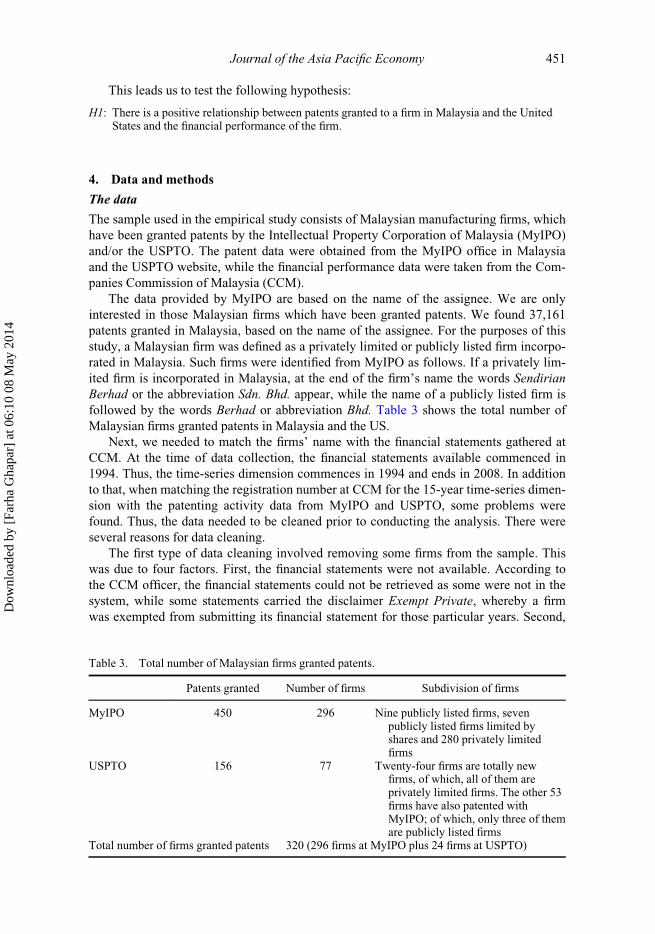
followed by the words Berhad or abbreviation Bhd. Table 3 shows the total number of
Malaysian firms granted patents in Malaysia and the US.
Next, we needed to match the firms’ name with the financial statements gathered at
CCM. At the time of data collection, the financial statements available commenced in
1994. Thus, the time-series dimension commences in 1994 and ends in 2008. In addition
to that, when matching the registration number at CCM for the 15-year time-series dimen-
sion with the patenting activity data from MyIPO and USPTO, some problems were
found. Thus, the data needed to be cleaned prior to conducting the analysis. There were
several reasons for data cleaning.
The first type of data cleaning involved removing some firms from the sample. This
was due to four factors. First, the financial statements were not available. According to
the CCM officer, the financial statements could not be retrieved as some were not in the
system, while some statements carried the disclaimer Exempt Private, whereby a firm
was exempted from submitting its financial statement for those particular years. Second,
Table 3. Total number of Malaysian firms granted patents.
Patents granted Number of firms Subdivision of firms
MyIPO 450 296 Nine publicly listed firms, sevenpublicly listed firms limited byshares and 280 privately limitedfirms
USPTO 156 77 Twenty-four firms are totally newfirms, of which, all of them areprivately limited firms. The other 53firms have also patented withMyIPO; of which, only three of themare publicly listed firms
Total number of firms granted patents 320 (296 firms at MyIPO plus 24 firms at USPTO)
Journal of the Asia Pacific Economy 451
Dow
nloa
ded
by [
Farh
a G
hapa
r] a
t 06:
10 0
8 M
ay 2
014
there were only one or two years of financial statements available for the firm. Third, pat-
ent application or granted dates could not be matched between data at MyIPO/USPTO
and CCM; and fourth, there were financial statements with no sales, which may have
been due to the firm being dormant.
The second type of data cleaning involved removing some observations for firms.
This occurred, first, in the early years of a firm’s life in which it had no sales, which may
have been associated with the firm’s start-up; and second, where there were large jumps
in sales from one year to the next. The final type of data cleaning involved using extrapo-
lation to add financial data for 42 observations in 27 firms out of a total of 2225 observa-
tions and 203 firms. Thus, there were 203 firms that had been granted patents in MyIPO
and USPTO from 1994 to 2008.
Our focus is on Malaysian manufacturing firms. Malaysia’s manufacturing sector con-
tains its largest exporting industries compared to other industries (Malaysia 1996, 2001,
2006). And the manufacturing sector is typically regarded as having more patenting activ-
ity than other sectors (Jensen and Webster 2006; Posner 2005). To identify manufacturing
firms, we matched our sample of firms following cleaning with the industrial classifica-
tion standards from the Small Medium Industries Development Corporation of Malaysia
(SMIDEC) and Malaysian Industrial Development Authority (MIDA). This process iden-
tified 149 manufacturing firms in the sample. Table 4 shows the total number of
manufacturing firms following data cleaning.
Econometric method
We employed a panel data model with a time-series dimension of 15 years from 1994 to
2008 and a cross-section dimension of 149 manufacturing firms. However, not all of the
149 manufacturing firms had 15 years of complete financial statements from 1994 to
2008; hence, we employ an unbalanced panel data model with 1694 observations in the
sample.
The basic regression model for the panel data is shown in the following:
Yit ¼ aþ bXit þ uit; ð5Þ
where i denotes cross sections and t denotes time periods with i ¼ 1, 2, . . . , N, and t ¼ 1,
2, . . . , T. a and b are the parameters and X is a vector of explanatory variables. Under the
error components specification, the disturbance term takes the form of
uit ¼ mi þ vit; ð6Þ
Table 4. Total number of firms following data cleaning.
Explanation Number of firms
The number of firms granted patents at MyIPO and USPTO 320 firmsFirms with matched patent data from MyIPO and USPTO with the
registration code at CCM280 matched firms
Firms extracted following data cleaning 77 firms extractedTotal number of firms following data cleaning 203 firmsTotal number of manufacturing firms following data cleaning 149 firms
452 F. Ghapar et al.
Dow
nloa
ded
by [
Farh
a G
hapa
r] a
t 06:
10 0
8 M
ay 2
014
where mi represents the cross-section specific components, regarded as time invariant
(Baltagi 2008) and vit are the remainder effects. In addition to standard panel least squares
(PLS), we employed both fixed and random effects estimation where ui is treated differ-
ently between the two estimation methods. The fixed effects model (FEM) allows the uicross-section specific error component to be correlated with the explanatory variables,
while the random effects model (REM) assumes that mi are not correlated with each other
(Gujarati 2003).
We employ an autoregressive model. Previous studies (Griffith, Jensen, and Webster
2005; Coombs and Bierly 2006) that have studied accounting-based financial perfor-
mance with regards to patenting activity have not taken into consideration the autoregres-
sive specification, except for one study by Geroski, Machin, and Walters (1997). These
authors argue that the dynamic panel model is needed in their study, as their accounting-
based measure also depends on past growth rates. Since we employed an accounting-
based measure as our dependent variable, the dynamic panel model was also adopted in
our study. The equation for the autoregressive model is
yit ¼ dyi;t�1 þ xitbþ mi þ vit; ð7Þ
where yi;t�1 is the past value of the dependent variable, d is the parameter for the past
value of yi;t�1, b is the coefficient for the explanatory variable xit. mi is the cross-section
specific error component, while the vit’s are the error terms with the assumption
EðuitÞ � Nð0;s2Þ.To estimate the autoregressive model, we use generalized method of moments
(GMM), as GMM produces substantial efficiency gains (Judson and Owen 1999; Arellano
and Bond 1991). There are many approaches to GMM estimation, but, in this study, we
focused only on two basic approaches, specifically Arellano and Bond (1991) and Are-
llano and Bover (1995). They differ in terms of how the individual effects are modelled.
A transformation is applied to the specification of a dynamic panel model to remove the
cross-section fixed effects. Arellano and Bond (1991) use differencing, while Arellano
and Bover (1995) use orthogonal deviations.
Empirical specification
Combining the profit maximization model and patent renewal model, as the theoretical
underpinning of this study, the basic econometric model is established in Equation (8):
yit ¼ c0 þ b1APPMit þ b2GRANMit þ b3APPSit þ b4GRANSit þ d1LNTGAit
þ d2NAGEit þ mit;
ð8Þ
where yit represents the profit margin. c0 is the constant; APPM and GRANM are, respec-
tively, the number of patent applications and patents granted in Malaysia; APPS and
GRANS are, respectively, the number of patent applications and patents granted in the
US; LNTGA is the tangible assets of the firm, which has been transformed into logs; and,
finally, NAGE is the firm’s age since incorporation. i ¼ 1,2,3,. . . , N denote specific firms
over t ¼ 1,2,3,. . . , T time periods with mit ¼ ui þ vit where u’s describe the firm-specific
time invariant effect, and v’s are the idiosyncratic error terms. The idiosyncratic error
terms are assumed to be normally distributed and to be independent of each other. Each
Journal of the Asia Pacific Economy 453
Dow
nloa
ded
by [
Farh
a G
hapa
r] a
t 06:
10 0
8 M
ay 2
014
of the variables is defined, and the descriptive statistics for each of the variables is pre-
sented, in Table 5.
The dependent variable is a continuous variable. The figures were taken from sales
and profits in the financial statements at CCM. The financial data has been log trans-
formed to overcome potential violations of the equal variance assumptions. This includes
one of the control variables which is LNTGA, representing firm size measured using the
firm’s tangible assets taken from the firm’s financial statements. NAGE is another control
variable and represents the firm’s age, measured using the number of years since incorpo-
ration until the end of availability of financial data for the analysis. Thus, if the firm was
incorporated in 1990 and the availability of the firm’s financial data was until 2008, the
NAGE would be 19 years.
The profit maximization model takes into account the sales revenue and cost, as well
as market conditions, in order for the firm to maximize its profits. The profit margin meas-
ures how much profit that the firm receives given its sales. It also shows how much the
market values the patented invention, since sales may represent demand and supply (Ernst
2001; Scherer 1965), which determine the price and quantity. In studying two patent terri-
tories (Malaysia and the US), the demand for the patented invention may differ. There are
empirical studies that signify that the market demand for patented inventions in the US is
high during a period of economic growth, but declines during economic recession
(Nicholas 2010; Sokoloff and Khan 1990). There is a lack of comparable studies for
Malaysia. In addition, profits indicate the ability of the firm to contain its costs in the short
run and long run, depending on the market structure that the firm faces in order to maxi-
mize its profits (Greenhalgh and Rogers 2006; Rogers 2002).
APPM and APPS are the number of patent application stocks based on the patent
application measured in Malaysia and the US, respectively, which are still pending to be
granted. GRANM and GRANS are the number of patents granted which have active life
spans. These variables are measured based on the number of patent stocks as a fraction of
365 days. For example, if a patent was applied for on 24 July 1999, the stock of the appli-
cation for 1999 is 161/365 days, equivalent to 0.44 years of application stock. For subse-
quent years, the number of that particular patent pending to be granted is one, which is
365/365 days, until it is granted. Once the patent is granted, let us say on 14 May 2003,
its application stock for that year would be 133/365 days, equivalent to 0.36 years of
application stock or APPM. This means that after this date (14 May 2003), the patent
application stock of this firm is zero, which indicates that it is no longer pending to be
granted. GRANM will be calculated from this date (14 May 2003) until 31 December
2008, similarly based on the number of granted stocks as a fraction of 365 days.
Since the annual renewal fee payment for patents are not available from MyIPO, we
replaced this with other information on the latest year of renewal of the patent’s legal sta-
tus. We divided legal status into three categories, in which the first two covered, respec-
tively, active and inactive patents granted and the third covered patent applications.
Differences in measurement relate to when the patent was granted and when the renewal
fees were paid. The lifespan of active patents were calculated until the end of 2008, while
non-active patents were assumed to be active for a period of five years from when
granted. Treating non-active patents in this manner is common in the literature (Schanker-
man and Pakes 1986; Schmookler 1966), given that most patents remain active for a five-
year period. One reason for this is strategic patenting that emerged in the 1990s (Posner
2005). Some patent applications are not pushed to grant as the value is already gained by
the application itself (Gambardella, Giuri, and Luzzi 2007). Another reason is that there
is a large backlog of patents pending around the world, meaning that some would take
454 F. Ghapar et al.
Dow
nloa
ded
by [
Farh
a G
hapa
r] a
t 06:
10 0
8 M
ay 2
014
more than five years to be granted (Michael 2005), by which time, the patent may have
become depreciated in value or become obsolete.
However, for patents classified as ‘protection ended’ in the non-active patent cate-
gory, the renewal of the patent was calculated for 20 years from the date granted, given
this is the maximum period of protection. For patents in the US, no renewal data is avail-
able on the USPTO website. Thus, we assumed that the patent was renewed until 2008.
This assumption was based on anecdotal evidence gleaned from in-depth interviews with
three Malaysian firms which had patents in both Malaysia and the US, which were con-
ducted in 2010.2
The measurement of patents pending in both Malaysia and the US was calculated until
the end of 2008. The one exception was patents that were withdrawn. Normally, in
Malaysia, once a patent application is withdrawn, there is no more follow up by MyIPO.
Thus, the legal status of ‘withdrawn’ was calculated as patent application stock for only
two years.
5. Findings
We commence with diagnostic tests for multicollinearity, autocorrelation, heteroskedasticity
and misspecification. The correlation matrices, which are not reported, suggested that all
of the pairwise correlations were less than 0.6. The Durbin–Watson test indicated that the
panel model suffered from autocorrelation. Therefore, in the static model, we corrected
for first-order serial correlation with autoregressive errors of order 1 (AR(1)). In the
dynamic panel model, we use GMM estimation in which the autocorrelation problems
are addressed in the estimation. We use the White cross-section coefficient covariance
method to correct for heteroskedasticity in the static panel model, and White period cor-
rection in the dynamic panel model. We conducted the Hausman test to determine
whether the fixed or random effects model should be preferred. The Hausman test rejects
the random effects model at the 1% significance level with the cross-section fixed effects
specification, but not with the period random effects specification. We also analysed the
level of competition facing manufacturing and non-manufacturing firms. The results,
reported in Table 6, show that the manufacturing firms were more competitive (exhibiting
lower levels of persistence) relative to both a full sample and non-manufacturing sub-
sample.
Table 5. Descriptive statistics.
Manufacturing firms
Label Description Mean Std. dev.
LNPM Log of firm’s profit margin �2.84 1.20APPM Number of Malaysian patent applications pending as
a fraction of 365 days1.06 2.54
GRANM Number of active Malaysian patents granted as afraction of 365 days
0.37 0.83
APPS Number of US patent applications pending as afraction of 365 days
0.16 1.05
GRANS Number of active US patent applications as a fractionof 365 days
0.16 0.67
LNTGA Log of firm’s tangible assets 16.70 2.23NAGE Firm’s age since incorporation 21.77 8.55
Journal of the Asia Pacific Economy 455
Dow
nloa
ded
by [
Farh
a G
hapa
r] a
t 06:
10 0
8 M
ay 2
014
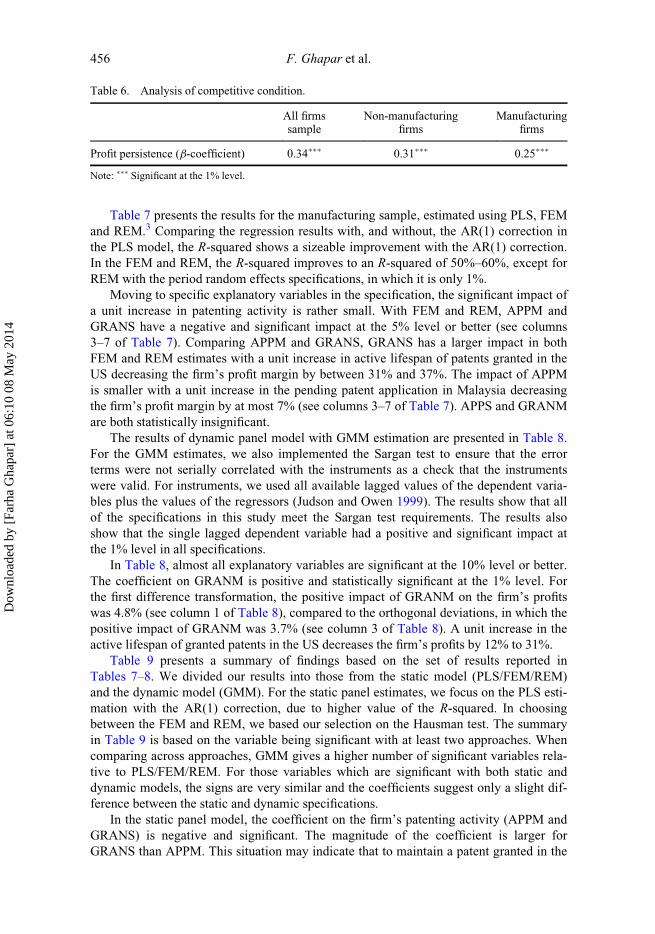
Table 7 presents the results for the manufacturing sample, estimated using PLS, FEM
and REM.3 Comparing the regression results with, and without, the AR(1) correction in
the PLS model, the R-squared shows a sizeable improvement with the AR(1) correction.
In the FEM and REM, the R-squared improves to an R-squared of 50%–60%, except for
REM with the period random effects specifications, in which it is only 1%.
Moving to specific explanatory variables in the specification, the significant impact of
a unit increase in patenting activity is rather small. With FEM and REM, APPM and
GRANS have a negative and significant impact at the 5% level or better (see columns
3–7 of Table 7). Comparing APPM and GRANS, GRANS has a larger impact in both
FEM and REM estimates with a unit increase in active lifespan of patents granted in the
US decreasing the firm’s profit margin by between 31% and 37%. The impact of APPM
is smaller with a unit increase in the pending patent application in Malaysia decreasing
the firm’s profit margin by at most 7% (see columns 3–7 of Table 7). APPS and GRANM
are both statistically insignificant.
The results of dynamic panel model with GMM estimation are presented in Table 8.
For the GMM estimates, we also implemented the Sargan test to ensure that the error
terms were not serially correlated with the instruments as a check that the instruments
were valid. For instruments, we used all available lagged values of the dependent varia-
bles plus the values of the regressors (Judson and Owen 1999). The results show that all
of the specifications in this study meet the Sargan test requirements. The results also
show that the single lagged dependent variable had a positive and significant impact at
the 1% level in all specifications.
In Table 8, almost all explanatory variables are significant at the 10% level or better.
The coefficient on GRANM is positive and statistically significant at the 1% level. For
the first difference transformation, the positive impact of GRANM on the firm’s profits
was 4.8% (see column 1 of Table 8), compared to the orthogonal deviations, in which the
positive impact of GRANM was 3.7% (see column 3 of Table 8). A unit increase in the
active lifespan of granted patents in the US decreases the firm’s profits by 12% to 31%.
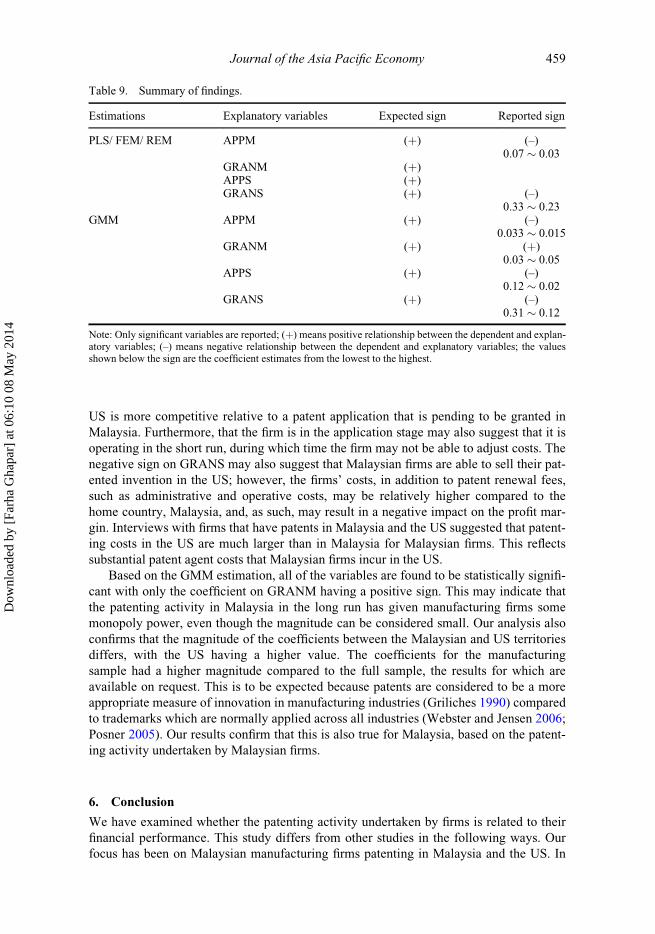
Table 9 presents a summary of findings based on the set of results reported in
Tables 7–8. We divided our results into those from the static model (PLS/FEM/REM)
and the dynamic model (GMM). For the static panel estimates, we focus on the PLS esti-
mation with the AR(1) correction, due to higher value of the R-squared. In choosing
between the FEM and REM, we based our selection on the Hausman test. The summary
in Table 9 is based on the variable being significant with at least two approaches. When
comparing across approaches, GMM gives a higher number of significant variables rela-
tive to PLS/FEM/REM. For those variables which are significant with both static and
dynamic models, the signs are very similar and the coefficients suggest only a slight dif-
ference between the static and dynamic specifications.
In the static panel model, the coefficient on the firm’s patenting activity (APPM and
GRANS) is negative and significant. The magnitude of the coefficient is larger for
GRANS than APPM. This situation may indicate that to maintain a patent granted in the
Table 6. Analysis of competitive condition.
All firmssample
Non-manufacturingfirms
Manufacturingfirms
Profit persistence (b-coefficient) 0.34��� 0.31��� 0.25���
Note: ��� Significant at the 1% level.
456 F. Ghapar et al.
Dow
nloa
ded
by [
Farh
a G
hapa
r] a
t 06:
10 0
8 M
ay 2
014
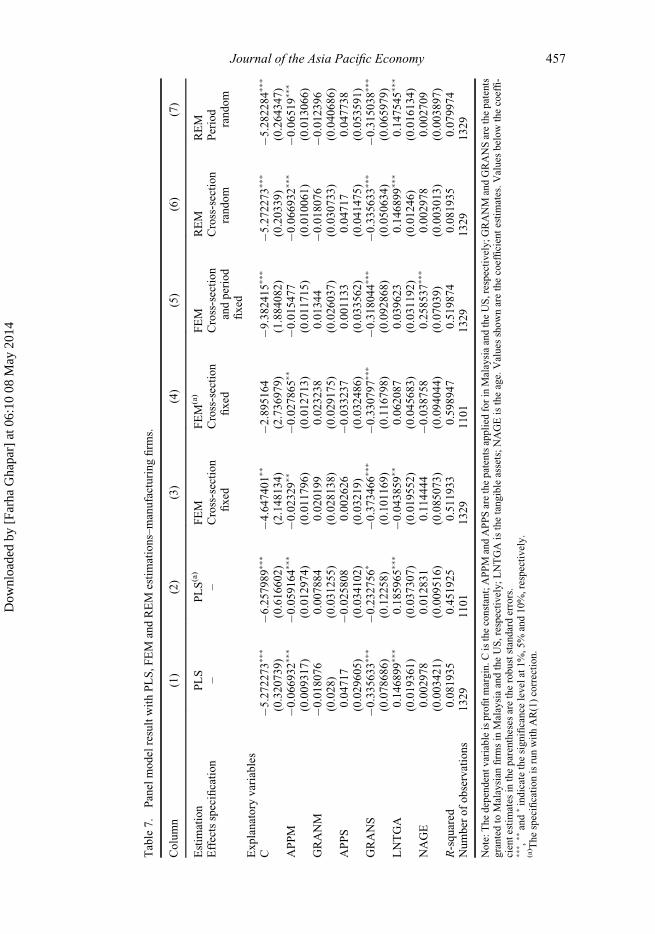
Table7.
PanelmodelresultwithPLS,FEM
andREM
estimations–manufacturingfirm
s.
Column
(1)
(2)
(3)
(4)
(5)
(6)
(7)
Estim
ation
PLS
PLS(a)
FEM
FEM
(a)
FEM
REM
REM
Effectsspecification
––
Cross-section
fixed
Cross-section
fixed
Cross-section
andperiod
fixed
Cross-section
random
Period
random
Explanatory
variables
C�5
.272273��
��6
.257989��
��4
.647401��
�2.895164
�9.382415��
��5
.272273��
��5
.282284��
�
(0.320739)
(0.616602)
(2.148134)
(2.736979)
(1.884082)
(0.20339)
(0.264347)
APPM
�0.066932��
��0
.059164��
��0
.02329��
�0.027865��
�0.015477
�0.066932��
��0
.06519��
�
(0.009317)
(0.012974)
(0.011796)
(0.012713)
(0.011715)
(0.010061)
(0.013066)
GRANM
�0.018076
0.007884
0.020199
0.023238
0.01344
�0.018076
�0.012396
(0.028)
(0.031255)
(0.028138)
(0.029175)
(0.026037)
(0.030733)
(0.040686)
APPS
0.04717
�0.025808
0.002626
�0.033237
0.001133
0.04717
0.047738
(0.029605)
(0.034102)
(0.03219)
(0.032486)
(0.033562)
(0.041475)
(0.053591)
GRANS
�0.335633��
��0
.232756�
�0.373466��
��0
.330797��
��0
.318044��
��0
.335633��
��0
.315038��
�
(0.078686)
(0.12258)
(0.101169)
(0.116798)
(0.092868)
(0.050634)
(0.065979)
LNTGA
0.146899��
�0.185965��
��0
.043859��
0.062087
0.039623
0.146899��
�0.147545��
�
(0.019361)
(0.037307)
(0.019552)
(0.045683)
(0.031192)
(0.01246)
(0.016134)
NAGE
0.002978
0.012831
0.114444
�0.038758
0.258537��
�0.002978
0.002709
(0.003421)
(0.009516)
(0.085073)
(0.094044)
(0.07039)
(0.003013)
(0.003897)
R-squared
0.081935
0.451925
0.511933
0.598947
0.519874
0.081935
0.079974
Number
ofobservations
1329
1101
1329
1101
1329
1329
1329
Note:Thedependentvariableisprofitmargin.Cistheconstant;APPM
andAPPSarethepatentsapplied
forin
MalaysiaandtheUS,respectively;GRANM
andGRANSarethepatents
grantedto
Malaysian
firm
sin
MalaysiaandtheUS,respectively;LNTGAisthetangibleassets;NAGEistheage.Values
shownarethecoefficientestimates.Values
belowthecoeffi-
cientestimates
intheparentheses
aretherobuststandarderrors.
��� ,
��and�indicatethesignificance
levelat1%,5%
and10%,respectively.
(a) ThespecificationisrunwithAR(1)correction.
Journal of the Asia Pacific Economy 457
Dow
nloa
ded
by [
Farh
a G
hapa
r] a
t 06:
10 0
8 M
ay 2
014
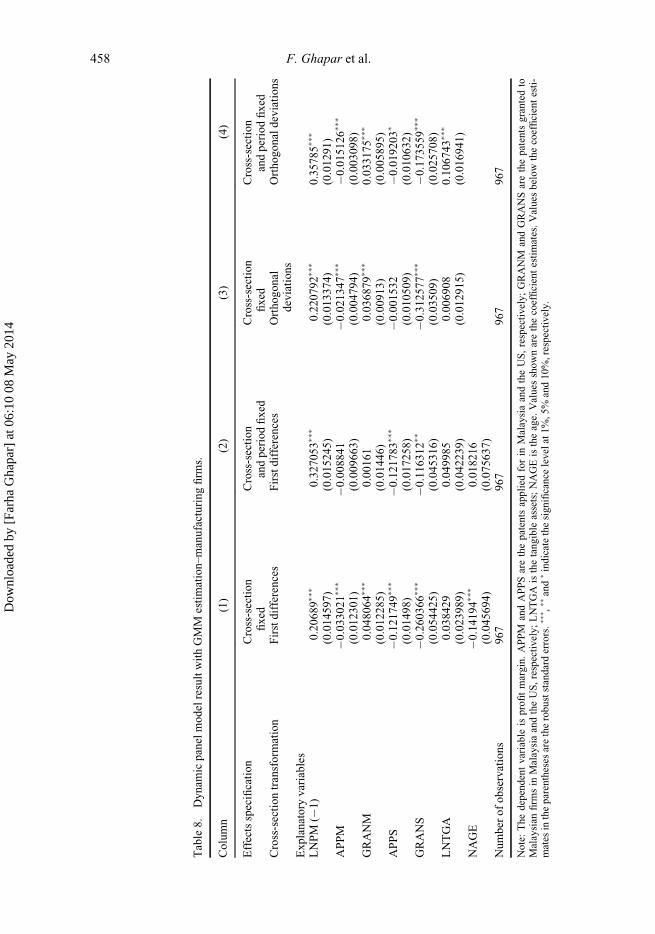
Table8.
Dynam
icpanelmodelresultwithGMM
estimation–manufacturingfirm
s.
Column
(1)
(2)
(3)
(4)
Effectsspecification
Cross-section
fixed
Cross-section
andperiodfixed
Cross-section
fixed
Cross-section
andperiodfixed
Cross-sectiontransform
ation
Firstdifferences
Firstdifferences
Orthogonal
deviations
Orthogonaldeviations
Explanatory
variables
LNPM
(�1)
0.20689��
�0.327053��
�0.220792��
�0.35785��
�
(0.014597)
(0.015245)
(0.013374)
(0.01291)
APPM
�0.033021��
��0
.008841
�0.021347��
��0
.015126��
�
(0.012301)
(0.009663)
(0.004794)
(0.003098)
GRANM
0.048064��
�0.00161
0.036879��
�0.033175��
�
(0.012285)
(0.01446)
(0.00913)
(0.005895)
APPS
�0.121749��
��0
.121783��
��0
.001532
�0.019203�
(0.01498)
(0.017258)
(0.010509)
(0.010632)
GRANS
�0.260366��
��0
.116312��
�0.312577��
��0
.173559��
�
(0.054425)
(0.045316)
(0.03509)
(0.025708)
LNTGA
0.038429
0.049985
0.006908
0.106743��
�
(0.023989)
(0.042239)
(0.012915)
(0.016941)
NAGE
�0.14194��
�0.018216
(0.045694)
(0.075637)
Number
ofobservations
967
967
967
967
Note:Thedependentvariable
isprofitmargin.APPM
andAPPSarethepatentsapplied
forin
MalaysiaandtheUS,respectively;GRANM
andGRANSarethepatentsgrantedto
Malaysian
firm
sin
MalaysiaandtheUS,respectively;LNTGA
isthetangible
assets;NAGEistheage.Values
shownarethecoefficientestimates.Values
below
thecoefficientesti-
mates
intheparentheses
aretherobuststandarderrors.��� ,
��and�indicatethesignificance
levelat1%,5%
and10%,respectively.
458 F. Ghapar et al.
Dow
nloa
ded
by [
Farh
a G
hapa
r] a
t 06:
10 0
8 M
ay 2
014
US is more competitive relative to a patent application that is pending to be granted in
Malaysia. Furthermore, that the firm is in the application stage may also suggest that it is
operating in the short run, during which time the firm may not be able to adjust costs. The
negative sign on GRANS may also suggest that Malaysian firms are able to sell their pat-
ented invention in the US; however, the firms’ costs, in addition to patent renewal fees,
such as administrative and operative costs, may be relatively higher compared to the
home country, Malaysia, and, as such, may result in a negative impact on the profit mar-
gin. Interviews with firms that have patents in Malaysia and the US suggested that patent-
ing costs in the US are much larger than in Malaysia for Malaysian firms. This reflects
substantial patent agent costs that Malaysian firms incur in the US.
Based on the GMM estimation, all of the variables are found to be statistically signifi-
cant with only the coefficient on GRANM having a positive sign. This may indicate that
the patenting activity in Malaysia in the long run has given manufacturing firms some
monopoly power, even though the magnitude can be considered small. Our analysis also
confirms that the magnitude of the coefficients between the Malaysian and US territories
differs, with the US having a higher value. The coefficients for the manufacturing
sample had a higher magnitude compared to the full sample, the results for which are
available on request. This is to be expected because patents are considered to be a more
appropriate measure of innovation in manufacturing industries (Griliches 1990) compared
to trademarks which are normally applied across all industries (Webster and Jensen 2006;
Posner 2005). Our results confirm that this is also true for Malaysia, based on the patent-
ing activity undertaken by Malaysian firms.
6. Conclusion
We have examined whether the patenting activity undertaken by firms is related to their
financial performance. This study differs from other studies in the following ways. Our
focus has been on Malaysian manufacturing firms patenting in Malaysia and the US. In
Table 9. Summary of findings.
Estimations Explanatory variables Expected sign Reported sign
PLS/ FEM/ REM APPM (þ) (–)0.07 � 0.03
GRANM (þ)APPS (þ)GRANS (þ) (–)
0.33 � 0.23GMM APPM (þ) (–)
0.033 � 0.015GRANM (þ) (þ)
0.03 � 0.05APPS (þ) (–)
0.12 � 0.02GRANS (þ) (–)
0.31 � 0.12
Note: Only significant variables are reported; (þ) means positive relationship between the dependent and explan-atory variables; (–) means negative relationship between the dependent and explanatory variables; the valuesshown below the sign are the coefficient estimates from the lowest to the highest.
Journal of the Asia Pacific Economy 459
Dow
nloa
ded
by [
Farh
a G
hapa
r] a
t 06:
10 0
8 M
ay 2
014
contrast, most existing studies are for firms from developed countries. While other stud-
ies have used market-based financial performance, we have used accounting-based
financial performance. We have suggested that this is appropriate when the securities
market is in its relative infancy. Patenting data are more limited for developing coun-
tries. The measures of the patenting activity that are based within the patent system in
this study were also modified to allow for the limited availability of data. The key find-
ing is that there is a significant relationship between patenting activity and financial per-
formance at the Malaysian firm level for manufacturing firms that have been granted
patents in Malaysia and the US. However, the impact is small and is only positive for
patenting activity undertaken in Malaysia. This situation may be due to the more com-
petitive market in the US as well as being at the early stage of the patent application
process.
Avenues exist for the Malaysian government to increase patenting activity. First, the
Ministry of Science Technology and Innovation of Malaysia (MOSTI) could re-evaluate
its decision on grants given to private parties, in order to increase the commercialization
rate. Many earlier grants on innovation were given by MOSTI to public organizations,
such as universities or research institutions, which had not been commercialized or, if
they were, the commercialization rate from the invented products was very small,
accounting for only about 5% (Malaysia 2001). This is not surprising because, unlike pri-
vate firms, such institutions are not profit maximizing. Second, while MyIPO has done
much to promote awareness of IP rights to the Malaysian public, public awareness has
mostly been concentrated on trademarks, rather than patents.
The patent system protects firms so that their inventions cannot be imitated by others.
If other firms are interested, the system allows legal avenues to use the inventions through
licensing. As such, the patent system actually assists both parties in a beneficial manner.
Nevertheless, the patent system mostly benefits the patent holder and works well in a
country that practices tight IP rights (Teece 2005). Hence, this study may also alert
MyIPO and the Malaysian government to the benefits of having a good infrastructure in
place in relation to the patent system, as the patent system in Malaysia is still in an embry-
onic state (Hamsawi 2007).
Acknowledgements
Earlier versions of this article were presented at the Seminar Hasil Penyelidikan Kementerian Pen-gajian Tinggi, Akademi Kepimpinan Pengajian Tinggi (AKEPT), Lebih Enstek, Bandar Enstek,Negeri Sembilan and at the Academic Conference UiTM Johor 2012, Gambang Resort City, Kuan-tan. We thank participants and an anonymous referee for helpful comments on earlier versions ofthis article.
Notes
1. Bursa Malaysia was formerly known as the Kuala Lumpur Stock Exchange.2. This assumption is also supported by evidence gleaned from entering data on patents for
Malaysian companies at the USPTO into the USPTO maintenance fee status site: https://ramps.uspto.gov/eram/patentMaintFees.do. We find that of 122 patents of Malaysian companies forwhich we were able to ascertain information using this method that 77 per cent continued pay-ing renewal fees as of July 2013.
3. The results for the sample of 320 manufacturing and non-manufacturing firms and the non-manufacturing sub-sample are quantitatively similar and are available in the working paper ver-sion of this article (Ghapar, Brooks, and Smyth 2013).
460 F. Ghapar et al.
Dow
nloa
ded
by [
Farh
a G
hapa
r] a
t 06:
10 0
8 M
ay 2
014
Notes on contributors
Farha Ghapar is a senior lecturer in the Department of Economics, Universiti Teknologi MARA,Johor, Malaysia. She recently completed her Ph.D. degree at Monash University. Her thesis was onthe relationship between patenting and the financial performance of Malaysian firms.
Rob Brooks is the deputy dean (Education) in the Faculty of Business and Economics and professorof econometrics, Monash University. He has published extensively in the broad area of financialeconometrics.
Russell Smyth is the head of the Department of Economics and professor of economics, MonashUniversity. He has published extensively in development economics and law and economics, with aparticular focus on Asia.
References
Arellano, M., and Bond, S. 1991. “Some Tests of Specification for Panel Data: Monte Carlo Evi-dence and an Application to Employment Equations.” The Review of Economic Studies 58 (2):277–297.
Arellano, M., and Bover, O. 1995. “Another Look at the Instrumental Variable Estimation of Error-Components Models.” Journal of Econometrics 68 (1): 29–51.
Baltagi, B.H. 2008. Econometric Analysis of Panel Data. 4th ed. Sussex: John Wiley & Sons Ltd.Bauman, W.S. 1989. “Investment Research Analysis in an Emerging Market: Singapore and
Malaysia.” Financial Analysts Journal 45 (6): 60–67.Bessen, J. 2008. “The Value of US Patents by Owner and Patent Characteristics.” Research Policy
37 (5): 932–945.Bessen, J. 2009. “Estimates of Patent Rents from Firm Market Value.” Research Policy 38 (10):
1604–1616.Bosworth, D.L., and Rogers, M. 2001. “Market Value, R&D and Intellectual Property: An Empiri-
cal Analysis of Large Australian Firms.” Economic Record 77 (239): 323–337.Bursa Malaysia. 2010. “List of Companies.” (retrieved on 10 October 2010) http://www.klse.com.
my/website/bm/listed_companies/list_of_companies/.Chandran, V.G.R., and Wong, C.-Y. 2011. “Patenting Activities by Developing Countries: The
Case of Malaysia.”World Patent Information 33 (1): 51–57.Connolly, R.A., and Hirschey, M. 1988. “Market Value and Patents.” Economics Letters 27: 83.Coombs, J.E., and Bierly, P.E. 2006. “Measuring Technological Capability and Performance.” R&D
Management 36 (4): 421–438.Deng, Y. 2007. “Private Value of European Patents.” European Economic Review 51 (7): 1785–1812.Ernst, H. 2001. “Patent Applications and Subsequent Changes of Performance: Evidence from
Time-Series Cross-Section Analyses on the Firm Level.” Research Policy 30 (1): 143–157.Gambardella, A., Giuri, P., and Luzzi, A. 2007. “The Market for Patents in Europe.” Research Pol-
icy 36: 1163.Gambardella, A., Harhoff, D., and Verspagen, B. 2008. “The Value of European Patents.” European
Management Review 5 (2): Summer. 69–84.Geroski, P.A., Machin, S.J., and Walters, C.F. 1997. “Corporate Growth and Profitability.” The
Journal of Industrial Economics 45 (2): 171–189.Ghapar, F.A. 2009. “The Future of Innovation is Inspired by the Intellectual Property System.” In
The Future of Innovation, edited by B.V. Stamm and A. Trifilova, 454–455. Surrey: GowerPublishing.
Ghapar, F.A., Brooks, R., and Smyth, R. 2013. “The Impact of Patenting Activity on the FinancialPerformance of Malaysian Firms.” Monash University Department of Economics DiscussionPaper 22/13. Melbourne: Department of Economics, Monash University.
Glen, J., Lee, K., and Singh, A.. 2001. “Persistence of Profitability and Competition in EmergingMarkets.” Economics Letters 72 (2): 247–253.
Greenhalgh, C., and Rogers, M. 2006. “The Value of Innovation: The Interaction of Competition,R&D and IP.” Research Policy 35: 562.
Griffith, W., Jensen, P.H., and Webster, E. 2005. “The Effect on Firm Profits of the Stock of Intel-lectual Property Rights.” Melbourne Institute Working Paper Series 4/05. Melbourne: Mel-bourne Institute of Applied Economics and Social Research, University of Melbourne.
Journal of the Asia Pacific Economy 461
Dow
nloa
ded
by [
Farh
a G
hapa
r] a
t 06:
10 0
8 M
ay 2
014
Griliches, Z. 1981. “Market Value, R&D, and Patents.” Economics Letters 7: 183–187.Griliches, Z. 1990. “Patent Statistics as Economic Indicators: A Survey.” Journal of Economic Lit-
erature 28 (4): 1661–1707.Gr€onqvist, C. 2009. “The Private Value of Patents by Patent Characteristics: Evidence from
Finland.” Journal of Technology Transfer 34 (2): 159–168.Gujarati, D.N. 2003. Basic Econometrics. 4th ed. New York: McGraw-Hill.Hall, B.H., Jaffe, A., and Trajtenberg, M. 2005. “Market Value and Patent Citations.” The Rand
Journal of Economics 36 (1): 16–38.Hall, B.H., Thoma, G., and Torrisi, S. 2007. “The Market Value of Patents and R&D: Evidence
from European Firms.” NBER Working Paper Series 13426. Cambridge, MA: National Bureauof Economics Research.
Hamsawi, R. 2007. “Intellectual Property Court Helps Boost Economic Growth.” The New StraitsTimes, October 31.
Harhoff, D., Scherer, F.M., and Vopel, K. 2003. “Citations, Family Size, Opposition and the Valueof Patent Rights.” Research Policy 32 (8): Summer. 1343–1363.
Jensen, P.H., and Webster, E. 2006. “Firm Size and the Use of IP Rights.” Economic Record 82(256): 44–55.
Judson, R.A., and A.L. Owen. 1999. “Estimating Dynamic Panel Data Models: A Guide for Macro-economists.” Economics Letters 65 (1): 9–15.
Malaysia. 1996. Seventh Malaysia Plan (1996–2000). Kuala Lumpur: Government Printers.Malaysia. 2001. Eighth Malaysia Plan (2001–2005). Kuala Lumpur: Government Printers.Malaysia. 2006. Ninth Malaysia Plan (2006–2010). Kuala Lumpur: Government Printers.MASTIC. 2013. “National Research and Development (R&D) Survey.” R(retrieved on 26 June
2013) http://www.mastic.gov.my/en/web/guest/statistik-kajian-rnd-kebangsaan.Michael, T. 2005. “Slow-Going at the Patent Office.” Innovation: America’s Journal of Technology
Commercialization 3 (1): 5–6.Mueller, D.C. 1990. The Dynamics of Company Profits: An International Comparison. Cambridge:
Cambridge University Press.MyIPO. 2008. IP Commercialization, Franchise & License. Paper presented at the Hari Harta Inte-
lek Negara, Kuala Lumpur, 2008.MyIPO. 2010a. “Patent Forms & Related Fees.” (retrieved on 25 September 2010) http://www.
myipo.gov.my/en/patent/form-a-related-fees.html.MyIPO. 2010b. “Patent Statistics.” (retrieved on 25 September 2010) http://www.myipo.gov.my/en/
ip-statistics/160.html.Nicholas, T. 2010. “The Role of Independent Invention in U.S. Technological Development, 1880–
1930.” The Journal of Economic History 70 (1): 57–82.Neuh€ausler, P., Frietsch, R., T. Schubert, and Blind, K. 2011. Patents and the Financial Perfor-
mance of Firms: An Analysis Based on Stock Market Data, Karlsruhe: Fraunhofer ISI.Pakes, A., and Schankerman, M. 1979. “The Rate of Obsolescene of Patents, Research Gestation
Lags, and the Private Rate of Return to Research Resources”. NBER Working Paper Series346. Cambridge, MA: National Bureau of Economics Research.
Posner, R.A. 2005. “Intellectual Property: The Law and Economics Approach.” The Journal of Eco-nomic Perspectives 19 (2): 57–73.
Putnam, J. 1996. “The Value of International Patent Rights.” PhD diss., Yale University.Rasiah, R. 2010. “Are Electronics Firms in Malaysia Catching up the Technology Ladder?” Journal
of the Asia Pacific Economy 15 (3): 301–319.Rogers, M. 2002. “Firm Performance and Investment in R&D and Intellectual Property.” Mel-
bourne Institute Working Paper Series 15/02. Melbourne: Department of Economics MonashUniversity.
Schankerman, M., and Pakes, A. 1986. “Estimates of the Value of Patent Rights in European Coun-tries During the Post-1950 Period.” The Economic Journal, 96 (384): 1052–1076.
Scherer, F.M. 1965. “Corporate Inventive Output, Profits, and Growth.” The Journal of PoliticalEconomy, 73 (3): 290–297.
Schmookler, J. 1966. Invention and Economic Growth. Cambridge: Harvard University Press.Schubert, T. 2011. “Assessing the Value of Patent Portfolios: An International Country
Comparison.” Scientometrics, 88, Summer. 787–804.Schumpeter, J.A. 1942. Capitalism, Socialism and Democracy. New York: Harper & Row.
462 F. Ghapar et al.
Dow
nloa
ded
by [
Farh
a G
hapa
r] a
t 06:
10 0
8 M
ay 2
014
Sharma, C. 2012. “R&D and Firm Performance: Evidence from the Indian PharmaceuticalIndustry.” Journal of the Asia Pacific Economy 17 (2): 332–342.
Sirilli, G. 1987. “Patents and Inventors: An Empirical Study.” Research Policy, 16 (2–4): 157–174.Sokoloff, K.L., and Khan, B.Z. 1990. “The Democratization of Invention During Early Industriali-
zation: Evidence from the United States, 1790-1846.” The Journal of Economic History 50 (2):363–378.
SSM. 2010. “Statistics: Total Number of Companies and Business Registered.” (retrieved on10 October 2010) http://www.ssm.com.my/en/statistics.php.
Stoddard, S.L., and Danielsen, A.J. 2008. “What Makes an Idea or Discovery Marketable– andApproaches to Maximize Success.” Surgery 143 (2): 161–164.
Teece, D.J. 2005. “Technology and Technology Transfer: Mansfieldian Inspirations and SubsequentDevelopments.” Journal of Technology Transfer 30 (1–2): 17–33.
Trajtenberg, M. 2001. “Innovation in Israel 1968–1997: A Comparative Analysis Using PatentData.” Research Policy 30 (3): 363–389.
Tuck, C.E. 2005. “A Quality Award and Stock Market Reaction: Evidence from Malaysia.” TotalQuality Management 16 (6): 681–691.
USPTO. 2010a. “United States Patent and Trademark Office Fee Schedule.” (retrieved on 15 June2010) http://www.uspto.gov/web/offices/ac/qs/ope/fee2009september15.htm.
USPTO. 2010b. “USPTO Patents Full-Text and Image Database.” (retrieved on 7 August 2010)http://patft.uspto.gov/netahtml/PTO/search-adv.htm.
Van Triest, S., and Vis, W. 2007. “Valuing Patents on Cost-Reducing Technology: A Case Study.”International Journal of Production Economics 105 (1): 282–292.
Waring, G.F. 1996. “Industry Differences in the Persistence of Firm-Specific Returns.” The Ameri-can Economic Review 86 (5): 1253–1265.
Webster, E., and Jensen, P.H. 2006. “Investment in Intangible Capital: An Enterprise Perspective.”Economic Record 82 (256): 82–96.
WIPO. 2006. An Introduction to Patents for Small and Medium-Sized Enterprises. Vol. 3 of Invent-ing the Future. Switzerland: World Intellectual Property Organization.
WIPO. 2007. Recent Developments in the PCT System. Paper presented at the WIPO NationalWorkshop on Patent Cooperation Treaty (PCT), Johor Bahru, Malaysia.
WIPO. 2010. Intellectual Property Statistics. (retrieved on 1 October 2010) http://www.wipo.int/ipstats/en/.
Journal of the Asia Pacific Economy 463
Dow
nloa
ded
by [
Farh
a G
hapa
r] a
t 06:
10 0
8 M
ay 2
014
Related Documents