The Impact of Passenger Mix on Reported ‘‘Hub Premiums’’ in the U.S. Airline Industry Darin Lee* and Marı ´a Jose ´ Luengo-Prado This paper analyzes U.S. airline price and passenger data disaggregated at the fare class level for the year 2000. We find that although average prices to and from most airlines’ hubs tend to be higher than those throughout the remainder of their systems, much of the difference can be explained by passenger mix (i.e., the proportion of leisure versus business passengers). Our results suggest, therefore, that many of the reported ‘‘hub premiums’’ in the previous literature may be overstated. JEL Classification: L11, L93 1. Introduction One of the most actively debated issues in the U.S. airline industry since its deregulation in 1978 has centered around the prices charged by network airlines for service to and from their hub airports. This topic, known as the ‘‘hub premium’’ debate, stems from the belief held by many travelers that they are being overcharged by network airlines on flights to and from their respective hubs. 1 In addition to much anecdotal evidence, numerous U.S. Government studies (e.g., U.S. Department of Transportation 1990; U.S. General Accounting Office 1990; U.S. General Accounting Office 1999) have found that average fares at concentrated hub airports tend to be higher—often substantially— than at other nonhub airports. For example, the U.S. General Accounting Office (1999) reported that average fares at one hub were 83% higher than the national average, and another recent study (U.S. Department of Transportation 2001) went so far as to refer to hubs as ‘‘pockets of pain.’’ The existing literature has studied and attempted to quantify the hub premium using—for the most part—one of two approaches. One set of studies (e.g., Morrison and Winston 1995; Morrison and Winston 2000) analyzes a cross section of airports and relates airport concentration to average fares. These studies improve on initial studies by the U.S. General Accounting Office (1990) and the U.S. Department of Transportation (1990) by attempting to control for factors known to impact average fares, such as average distance, the proportion of connecting passengers, and frequent flyer * LECG, LLC, 350 Massachusetts Avenue, Suite 300, Cambridge, MA 02139, USA; E-mail: [email protected]. Department of Economics, Northeastern University, 301 Lake Hall, Boston, MA 02115-5000, USA; E-mail: [email protected]; corresponding author. The authors thank Jan Brueckner, Dan Kasper, seminar participants at the Federal Reserve Bank of Chicago, conference participants at the 2003 International Industrial Organization Conference, and two anonymous referees for helpful comments. The views presented in this paper are those of the authors and do not reflect those of LECG, LLC. Received November 2003; accepted March 2005. 1 See, for example, ‘‘High Air Fares Getting Attention,’’ Cincinnati Enquirer, December 20, 1999, ‘‘Flying Into Pockets of Pain: How Hub Airports Keep Fares High,’’ USA Today, February 23, 1998, or ‘‘Behind These Sky-High Fares,’’ Denver Business Journal, April 30, 1999. 372 Southern Economic Journal 2005, 72(2), 372–394

Welcome message from author
This document is posted to help you gain knowledge. Please leave a comment to let me know what you think about it! Share it to your friends and learn new things together.
Transcript

The Impact of Passenger Mix onReported ‘‘Hub Premiums’’ in theU.S. Airline Industry
Darin Lee* and Marıa Jose Luengo-Prado�
This paper analyzes U.S. airline price and passenger data disaggregated at the fare class level for the
year 2000. We find that although average prices to and from most airlines’ hubs tend to be higher than
those throughout the remainder of their systems, much of the difference can be explained by
passenger mix (i.e., the proportion of leisure versus business passengers). Our results suggest,
therefore, that many of the reported ‘‘hub premiums’’ in the previous literature may be overstated.
JEL Classification: L11, L93
1. Introduction
One of the most actively debated issues in the U.S. airline industry since its deregulation in 1978
has centered around the prices charged by network airlines for service to and from their hub airports.
This topic, known as the ‘‘hub premium’’ debate, stems from the belief held by many travelers that
they are being overcharged by network airlines on flights to and from their respective hubs.1 In
addition to much anecdotal evidence, numerous U.S. Government studies (e.g., U.S. Department of
Transportation 1990; U.S. General Accounting Office 1990; U.S. General Accounting Office 1999)
have found that average fares at concentrated hub airports tend to be higher—often substantially—
than at other nonhub airports. For example, the U.S. General Accounting Office (1999) reported that
average fares at one hub were 83% higher than the national average, and another recent study (U.S.
Department of Transportation 2001) went so far as to refer to hubs as ‘‘pockets of pain.’’
The existing literature has studied and attempted to quantify the hub premium using—for the
most part—one of two approaches. One set of studies (e.g., Morrison and Winston 1995; Morrison
and Winston 2000) analyzes a cross section of airports and relates airport concentration to average
fares. These studies improve on initial studies by the U.S. General Accounting Office (1990) and the
U.S. Department of Transportation (1990) by attempting to control for factors known to impact
average fares, such as average distance, the proportion of connecting passengers, and frequent flyer
* LECG, LLC, 350 Massachusetts Avenue, Suite 300, Cambridge, MA 02139, USA; E-mail: [email protected].
� Department of Economics, Northeastern University, 301 Lake Hall, Boston, MA 02115-5000, USA; E-mail:
[email protected]; corresponding author.
The authors thank Jan Brueckner, Dan Kasper, seminar participants at the Federal Reserve Bank of Chicago, conference
participants at the 2003 International Industrial Organization Conference, and two anonymous referees for helpful comments.
The views presented in this paper are those of the authors and do not reflect those of LECG, LLC.
Received November 2003; accepted March 2005.1 See, for example, ‘‘High Air Fares Getting Attention,’’ Cincinnati Enquirer, December 20, 1999, ‘‘Flying Into Pockets of Pain:
How Hub Airports Keep Fares High,’’ USA Today, February 23, 1998, or ‘‘Behind These Sky-High Fares,’’ Denver Business
Journal, April 30, 1999.
372
Southern Economic Journal 2005, 72(2), 372–394

tickets. A second set of studies (e.g., Borenstein 1989; Evans and Kessides 1993) disaggregates data at
the carrier and market level, thus controlling for structural differences between markets, and attempts
to distinguish between market and airport characteristics as sources of potential pricing power.2 In
general, this latter group of studies argues that high concentration by a single airline at an airport can
lead to entry barriers in the form of frequent flyer programs, travel agency commission overrides, and
long-term leases on gates and airport facilities, among others, thus dampening nonstop competition
and allowing the hub airline to charge supracompetitive fares. Borenstein (1989) also suggests that
ownership of computer reservation systems (CRSs) serves as an entry barrier by allowing large
network airlines to bias the information presented to both travelers and travel agents in favor of their
own service.3
None of the mentioned studies, however, has directly controlled for the passenger mix (the
proportion of leisure versus business travelers)—which is known to affect average fares—and thus,
the estimation results in studies such as Borenstein (1989) and Evans and Kessides (1993) may suffer
from omitted variable bias. Network airlines have long argued that average fares are higher in markets
to and from their hubs compared to other markets within their networks because a greater proportion
of passengers traveling to and from their hubs are business travelers, purchasing more flexible—and
much more expensive—unrestricted tickets. Unrestricted tickets offer a number of attributes that make
them both more attractive to customers as well as more costly for airlines to provide. For example,
unrestricted tickets may be changed without any fees, are fully refundable, can be purchased at the last
minute, and, depending on the airline and/or the traveler’s frequent flyer status, may provide the
traveler with a free first-class upgrade. Because unrestricted tickets can cost several times as much as
restricted coach tickets, network airlines argue that even a few extra unrestricted passengers per flight
can have a relatively large impact on average fares. For example, an Expedia.com search for restricted,
roundtrip, nonstop coach class tickets between Boston and Los Angeles yielded fares of $281, $295,
and $295 on Delta, American, and United, respectively. For unrestricted coach class tickets on the
same flights, the fare was $2583.50 on the same three carriers.4
Most recent hub premium studies acknowledge that passenger mix may impact average fares, so
it is somewhat surprising that only one study (Gordon and Jenkins 2000) has explicitly attempted to
control for this factor.5 Using proprietary data from Northwest Airlines, the authors found that after
controlling for passenger mix, distance, and the number of stops, Northwest’s hub passengers receive
a hub discount compared to Northwest’s passengers traveling throughout the rest of its network. This
study, however, only focuses on Northwest Airlines, and its methodology has been subject to criticism
(for example, the authors treat passengers connecting from one of Northwest’s regional partners as
hub-originating passengers). Thus, after more than a decade of debate, the hub premium controversy
is still largely unresolved, a point echoed in a recent study by the Department of Transportation’s
Volpe Center:
In analyzing these questions, researchers have employed various data sources and measurement
techniques. Their studies also cover different time periods and use varying methods to control for
2 Whereas Borenstein (1989) finds evidence that concentration at either the market or airport level results in higher average fares,
Evans and Kessides (1993), using a fixed-effects approach, find that a high market share at the market level does not
confer pricing power, but high concentration at the airport level does. Other studies in this category include Berry, Carnall,
and Spiller (2006).3 It should be noted that the major U.S. airlines divested the majority of their CRS holdings during the 1990s.4 Search performed on March 20, 2002 for travel April 19–24, 2002.5 Several authors have attempted to indirectly control for passenger mix. For example, Borenstein (1989) includes a tourist index,
and Morrison and Winston (1995) exclude markets to and from popular tourist destinations.
Impact of Passenger Mix on Hub Premiums 373
the factors that influence an airline’s costs and travelers’ demands for their services in order to iso-
late the degree to which airlines can set and maintain fares above competitive levels. None of these
studies, however, has successfully isolated or controlled for differences in airlines’ costs or in pas-
sengers’ willingness to pay for different levels of service. As a result, the extent to which airlines
are able to use ‘‘market power’’ to maintain high fares for trips to and from their hub airports re-
mains controversial. (U.S. Department of Transportation 2000, p. 2.)
The purpose of this paper is to investigate the impact of passenger mix on the hub premium
using fare data that have been disaggregated at the booking class level. To the best of our knowledge,
this study is the first of its kind to use publicly available data that have been disaggregated at the fare
class level.6 At the outset, it is important to note that there is no universally accepted definition of the
hub premium. Some studies are interested in the degree to which average fares (pooling all airlines)
differ at hubs versus other airports (e.g., Morrison and Winston 1995; Morrison and Winston 2000),
whereas others focus on comparing the prices of a network carrier’s hub markets versus the prices of
all airlines in otherwise similar markets (e.g., Borenstein 1989; Evans and Kessides 1993). In this
paper, we define the hub premium explicitly as the ability of a given network airline to charge
passengers in the same fare category more per mile in markets to and from its hubs than on otherwise
similar markets throughout the remainder of its network (i.e., those markets that connect via one of its
hubs or are between two nonhub airports). The prices in markets that neither originate nor terminate at
a hub are widely considered to be good competitive benchmarks because the overwhelming majority
of these markets are ‘‘spoke-to-spoke’’ markets that do not offer nonstop service but provide
competing one-stop service from numerous hubbing carriers. Thus, our approach differs from most
other hub premium studies in that our primary focus is on comparing prices across different markets
for a given airline. By focusing our analysis on the prices of a given airline, we can effectively control
for the variations in cost and quality of service across different airlines. Even among the six ‘‘full
service’’ airlines we consider in this paper, costs and quality of service can differ significantly. For
example, American, Continental, and Delta all use Boeing 737-800 aircraft in two-class configu-
rations. However, Delta and Continental configure their 737-800 aircraft with 154 and 155 seats,
respectively, whereas American uses 134 seats, thus increasing unit costs and improving product
quality.7 Moreover, it is important to emphasize that because the primary focus of our analysis
compares fares within a given carrier, our main results do not depend on whether or not airlines use
the same definitions of fare codes for Department of Transportation reporting purposes, a concern that
has often been expressed by researchers relying on the U.S. Department of Transportation (DOT)
data. For comparative purposes, we also estimate pooled ordinary least squares (OLS), two-stage
least-squares (2SLS) regressions as well as fixed effects models similar to those of Borenstein (1989)
and Evans and Kessides (1993).
In general, we find that much of the observed hub premiums can be explained by passenger mix.
Indeed, controlling for passenger mix reduced the average hub premium at major U.S. hubs (i.e., those
hub airports where over 50% of passengers make connections) from 19.5% to 12.2%. Likewise, we
find evidence that some carriers are successful at extracting additional hub premiums from first,
6 The data relied on by Borenstein (1989) have some disaggregated fare information because he analyzes the 20th, 50th, and 80th
percentile fares. However, the hub premium results reported in his table 1 are limited to average fares. Moreover, the proportion
of leisure and business travelers varies widely across markets, and hence, although the 80th percentile fare may represent
a business traveler in some markets (i.e., Boston to Washington, DC.), it may represent a leisure passenger on others (i.e.,
Buffalo to Orlando). Evans and Kessides (1993) use all ‘‘coach’’ fares; however, the overwhelming majority of ‘‘business’’
fares are in fact unrestricted coach fares, and thus, for all intents and purposes, their sample includes both types of travelers.7 Source: Airline websites.
374 Darin Lee and Marıa Jose Luengo-Prado
business, and unrestricted coach (premium) passengers. In general, our findings are consistent with
Ramsey pricing: leisure travelers have much more price-elastic demand than business travelers, and
thus, the less convenient and lower quality connecting service offered by competing carriers is likely
to have a greater disciplining effect on restricted coach fares than on premium fares for service to and
from hubs.8 Results from pooled estimation also show that indirectly controlling for passenger mix by
using market fixed effects significantly reduces estimated hub premiums.
Although passenger mix is an important element in understanding the hub premium debate, we
stress that our analysis does not account for a number of other quality of service factors—and their
associated time savings—that likely impact average prices at hubs such as greater flight frequency or
preferences for nonstop service. Moreover, our analysis does not consider the effect of frequent flyer
tickets.9 Indeed, in light of the fact that we do not control for these factors, our estimated hub
premiums are likely overstated relative to the constant-quality premiums.
Finally, we emphasize that our results are consistent with the long-observed practice of price
discrimination in the airline industry. However, as has been recently pointed out in the context of the
airline industry (among others), price discrimination need not imply market power (Levine 2002;
Baumol and Swanson 2003). To the contrary, Baumol and Swanson (2003) argue that in markets
where price discrimination is feasible and competitive pressures are suffciently strong, firms with high
fixed costs must price discriminate to ensure their survival.
The remainder of this paper is organized as follows. Section 2 outlines the origins of the hub
premium debate. Section 3 provides an overview of the data used for this study and presents
preliminary findings. Section 4 summarizes the estimation results for individual, pooled, and fixed-
effects regressions by fare class. Section 5 provides concluding remarks.
2. Origins of the Debate
The modern hub premium debate is rooted in airport level summary statistics linking above
average fares at hub airports to various measures of concentration. Consider, for example, Table 1,
which compares the average price per mile charged by hub carriers at their hubs, origin and
destination (O&D) passenger shares, aircraft departure shares across the main U.S. airline hubs, and
the largest 100 nonhub airports.10 The hubs in Table 1 are ordered based on the percentage of the
hubbing carrier’s passengers making connections at the respective airport. Throughout this paper, we
refer to those hubs where the connecting proportion is at least 50% as ‘‘primary hubs,’’ whereas those
hubs with a connecting proportion less than 50% are referred to as ‘‘secondary hubs.’’11
Although Table 1 demonstrates that average prices to and from hubs tend to be higher than those
at other large U.S. airports, studies such as Morrison and Winston (1995) have shown that a simple
comparison of average fares across airports can be misleading because it fails to control for a number
of factors known to impact fares, such as the proportion of passengers traveling nonstop (presumably
a higher-quality product), the proportion of travelers choosing to purchase more flexible—and more
expensive—unrestricted tickets, average distance, frequent flyer awards, and market density. Table 2
8 For discussions of Ramsey pricing in the context of the airline industry, the reader is referred to Levine (2002) or
Transportation Research Board (1999).9 Morrison and Winston (1995) found that controlling for frequent flyer awards (the majority of which are redeemed by
hub-originating passengers) reduces the hub premium by 2.5 percentage points.10 O&D passengers are those who are either beginning or ending their journey at the given airport, and thus, O&D shares exclude
‘‘flow’’ passengers, that is, those who are merely connecting through that airport.11 We also include Chicago O’Hare as a primary hub for United.
Impact of Passenger Mix on Hub Premiums 375

illustrates how some of these factors varied across the networks of the six largest hub-and-spoke
airlines in 2000. For example, Table 2 shows that a considerably higher proportion of passengers
flying to and from hubs fly nonstop compared to nonhub passengers. Likewise, on average, hub
passengers tend to fly shorter distances than their nonhub counterparts. Table 2 is also consistent with
the assertion made by airlines that a greater proportion of passengers traveling to and from hubs
purchase premium tickets compared to passengers in markets neither originating nor terminating at an
airline’s hub (i.e., the system remainder).
One question that comes to mind is whether or not hub cities generate proportionally more
business travelers or whether the higher proportion of premium tickets is simply the result of airlines
using their sophisticated yield-management systems to make fewer discount seats available on flights
to and from their hubs, thereby ‘‘forcing’’ significant numbers of passengers to purchase less
restrictive—and significantly more expensive—premium tickets than they would otherwise want to
purchase. For the purposes of our analysis, we believe that it is reasonable to treat the fare class
a passenger travels in (i.e., restricted coach or premium) as exogenous. The primary reasoning behind
our assumption is as follows. First, it is well understood that hub-and-spoke carriers have successfully
created techniques to differentiate between business and leisure passengers (such as 14- or 21-day
Table 1. Major U.S. Airline Hubs: Some Key Statistics
Hub Carrier Statistics
Hubbing
Carrier
Percentage of
Passengers
Changing Planes
Average Price
Per Mile (cents)
O&D
Passenger
Share (%)
Share of
Domestic Aircraft
Departures (%)
Largest 100 Non-Hubs N/A 10.6 27.1 40.6 38.4
Primary HubsCharlotte (CLT) US Airways 78.4 52.7 68.3 87.2Memphis (MEM) Northwest 76.9 35.4 48.3 72.5Cincinnati (CVG) Delta 75.3 45.9 75.5 90.9Pittsburgh (PIT) US Airways 68.0 53.4 68.3 81.2Atlanta (ATL) Delta 64.7 33.5 61.3 75.8Salt Lake City (SLC) Delta 63.3 19.6 51.0 66.2Dallas (DFW) American 59.2 30.7 54.7 70.4Denver (DEN) United 59.0 29.2 50.0 71.8Houston (IAH) Continental 56.4 28.2 64.6 82.2Minneapolis (MSP) Northwest 53.3 31.0 61.0 81.0Detroit (DTW) Northwest 50.9 35.2 55.9 81.0Chicago O’Hare (ORD) American 50.0 30.2 32.0 43.4Chicago O’Hare (ORD) United 48.9 30.2 44.3 45.1
Secondary HubsPhiladelphia (PHL) US Airways 41.9 44.4 50.8 62.5Cleveland (CLE) Continental 38.5 37.1 46.5 71.6Miami (MIA) American 38.2 22.4 39.2 62.2Washington Dulles (IAD) United 37.6 26.7 41.0 45.9San Francisco (SFO) United 26.5 23.1 44.9 53.3Newark (EWR) Continental 13.1 33.8 53.9 64.0
Calculations using domestic itineraries excluding interline, zero fare, and frequent flyer tickets. O&D Passenger Shares
represent the hub carrier’s market share of all passengers either beginning or ending their journey at the given hub airport. Share
of domestic aircraft departures based on hubbing carrier’s share of mainline aircraft departures at the given hub. Average price
per mile includes all fees and taxes and is based on nonstop distance between airports. Passenger and aircraft departure shares for
the Largest 100 Non-Hubs are computed as the average across airports of the maximum share at each airport. Source: U.S. DOT
T100 and OD1B Databases, 2000.
376 Darin Lee and Marıa Jose Luengo-Prado

advance purchase requirements, ticket refundability, or Saturday-night stay requirements). Therefore,
carriers have (especially in 2000, the year of our data) driven a large wedge between the average
restricted coach fare and average premium fare in most markets. Indeed, in our sample of markets, the
average premium fare is nearly three times as expensive as the average restricted coach fare.12 The
large gap that exists between restricted coach and premium fares implies—in our view—that few
Table 2. Some Possible Explanations for Observed Higher Prices At Hubs
Percentage of
Passengers
Flying Nonstop
Percentage of
Passengers Using
Premium Tickets
Percentage of
Carrier’s Total
O&D Passengers
Median
Passenger
Trip Length
(Miles)
American
Dallas (DFWa) 95.2 27.6 22.8 937Chicago O’Hare (ORDa) 93.8 25.2 17.8 802Miami (MIA) 86.6 21.0 7.0 1,097System Remainder 39.6 19.2 52.4 1,411
Continental
Houston (IAHa) 95.5 9.9 23.8 964Cleveland (CLE) 91.4 14.1 12.5 622Newark (EWR) 95.3 15.1 35.5 1,008System Remainder 3.8 5.0 28.2 1,301
Delta
Cincinnati (CVGa) 87.3 28.9 5.3 623Atlanta (ATLa) 95.1 14.9 24.3 606Salt Lake City (SLCa) 80.0 6.1 6.5 630System Remainder 31.2 9.3 63.9 1,005
Northwest
Memphis (MEMa) 85.0 23.0 5.4 683Minneapolis (MSPa) 93.0 18.0 26.1 980Detroit (DTWa) 93.3 13.4 25.6 534System Remainder 2.0 7.8 42.9 1,182
United
Denver (DENa) 89.3 12.9 16.1 905Chicago O’Hare (ORDa) 93.4 21.6 22.2 837Washington Dulles (IAD) 79.2 17.0 6.3 1,452San Francisco (SFO) 84.3 28.3 18.2 678System Remainder 21.5 16.1 37.2 1,368
US Airways
Charlotte (CLTa) 88.7 44.4 8.0 543Pittsburgh (PITa) 85.2 37.7 9.4 467Philadelphia (PHL) 84.5 33.0 15.0 678System Remainder 37.1 23.7 67.6 722
a Denotes a primary hub for the respective carrier. Calculations using domestic itineraries excluding interline, zero fare, and
frequent flyer tickets. ‘‘Premium’’ tickets include unrestricted coach, business, and first class. System Remainder includes all
passengers not traveling to/from one of the airline’s hubs. ‘‘Percentage of Carrier’s Total O&D Passengers’’ represent the
proportion of the carrier’s total passengers either starting or completing their travel at the given hub. Source: U.S. OD1B and
T100 Databases, 2000.
12 The median ratio (across markets) of the average premium to average restricted coach fare in our dataset is: American (2.28),
Continental (3.28), Delta (2.83), Northwest (2.77), United (2.58), and US Airways (2.23).
Impact of Passenger Mix on Hub Premiums 377

leisure passengers would be willing to purchase premium tickets even if no restricted coach fares were
available.13 Rather, passengers faced with such a large difference in fares would likely choose to fly
on another carrier or take a connecting rather than a nonstop flight. Although we believe it is fairly
unlikely that the ‘‘average’’ restricted coach passenger would be willing to pay the ‘‘average’’
premium fare rather than fly on another carrier or take a connecting flight, what about passengers at
the top end of the restricted coach passenger distribution? Is it possible that they might be forced to
purchase premium tickets as a result of inventory management? Again, we believe the data support
our assumption of fare class exogeneity. This is because there is a fairly significant, discrete jump
between the highest restricted coach fares and the lowest premium fares in most markets. In particular,
we compute the ratio of the 20th percentile premium fare to the 80th percentile restricted coach fare
for each of the markets in our dataset. The mean value of this ratio for the carriers in our dataset was:
American (1.26), Continental (2.34), Delta (1.84), Northwest (1.97), United (1.57), and US Airways
(1.24). This implies that, on average, passengers paying the lowest premium fare in a market are still
paying 70% more than the passengers paying the highest restricted coach fare.14
Moreover, although an analysis of whether or not carriers systematically restrict discount seats
more at their hubs than elsewhere throughout their networks is not possible using U.S. DOT data,
Gordon and Jenkins (2000) also analyzed a snapshot of Northwest’s seat inventory data and found no
evidence that Northwest made fewer discounted seats available in markets to and from its largest hub
(Minneapolis–St. Paul) compared to the remainder of its network.15 Likewise, data from the DOT’s
1995 American Travel Survey confirm that hub cities, in general, generate a lower proportion of
vacation travel than nonhubs. For example, for all travelers in the survey traveling by air, we
computed the proportion, by destination, who stated that the primary purpose of their trip was
‘‘vacation.’’ Of the 18 hub cities listed in Table 2, only four (San Francisco, Denver, Salt Lake City,
and Miami) had vacation proportions above the median value for the 161 MSAs in the survey (0.459),
and eight hub cities were in the bottom quartile. Finally, the rapid growth of low-cost carriers such as
Southwest Airlines and the advent of Internet-based travel websites such as Orbitz or Expedia that
allow travelers to easily search for the lowest available fare across carriers in any given market have
made it much more difficult for network carriers to use their yield-management systems to
systematically force a significant proportion of hub-originating (or -destined) leisure passengers to
purchase less restrictive—and consequently much more expensive—premium tickets.
3. Is There Evidence of a Hub Premium?
Our objective is to determine whether or not the six largest U.S. network airlines systematically
charge higher prices to passengers traveling to and from their hubs compared to those traveling
throughout the remainder of their networks after controlling for fare class, distance, and other factors.
That is, is there evidence of a hub premium?
13 As an example, the average roundtrip premium fare in our dataset for Delta between San Francisco and Cincinnati (its hub) is
$1820, whereas the average restricted coach fare is $436. Likewise, US Airways’ average roundtrip fare between Pittsburgh
(its hub) and Boston was $733 for premium passengers, and only $242 for restricted coach passengers.14 Even the carriers with the lowest ratios—American and US Airways—have fairly large jumps (i.e., 25%) considering the ratio
is between the top quintile of restricted coach fares and the lowest quintile of premium fares.15 In particular, Gordon and Jenkins (2000) analyzed a sample of Northwest’s proprietary inventory data and found that
‘‘on March 13, 1999, 88 percent of discount fares were available for April 1999 travel on Northwest’s Minneapolis hub
routes, slightly more than the 87 percent of the same fares available for the same travel period on routes connecting
through Minneapolis.’’
378 Darin Lee and Marıa Jose Luengo-Prado

Data
The data for this study are taken from the U.S. Department of Transportation’s OD1B Origin and
Destination Survey for the calendar year 2000, which represents a 10% sample of all tickets reported
by U.S. Scheduled Passenger Carriers (a detailed description of how our data set was compiled is
contained in the Appendix). For the purposes of this study, we consider all domestic passengers in 2000
traveling on round-trip and one-way itineraries with three or fewer flight coupons per directional trip
leg.16 Moreover, we excluded zero fare, bulk fare, and frequent flyer itineraries from our analysis. To
account for possible coding errors in the raw DOT data, we also exclude tickets in which the price paid
was less than 2.0 cents per mile for restricted coach and 5.0 cents per mile for unrestricted coach,
business, or first class. From the ‘‘directional’’ itineraries in the OD1B data, we construct nondirectional
airport-pair markets.17 Thus, a market is a unique pair of airports that does not distinguish point of
origin or the particular routing—i.e., nonstop Boston-to-Seattle passengers travel in the same market as
Seattle-to-Boston passengers making a connection in Chicago. Note, therefore, that each market, as we
have defined it, consists of potentially many ‘‘routings,’’ depending on the connecting point(s).
We first aggregate business and unrestricted coach class tickets into a single ‘‘premium’’ fare-
type category. Although the majority of premium tickets in our sample are unrestricted coach tickets,
we believe that it is important to aggregate the three types of tickets together (first, business, and
unrestricted coach) because carriers have largely blurred the distinction among these categories of
premium tickets in many domestic markets. For example, a query for ‘‘Coach (Flexible)’’ tickets
between Atlanta and either Boston or New York’s LaGuardia airport on Delta Air Lines’ website
(Delta.com) returns primarily first class tickets, most of which have the same price as (or are less
expensive than) the unrestricted coach class tickets Delta.com also offers.18 Approximately 82% of all
of the passengers in our sample traveled on restricted coach fares, and roughly 18% used premium
fares. When an itinerary consisted of multiple coupons with different fare classes, the fare class of the
longest distance coupon was used. Because the variance in the number of passengers for a given
carrier across markets is fairly large, we consider only those airline-market pairs where the carrier
served at least 100 restricted coach and 100 premium passengers.
Our measure of price is the price paid per mile, inclusive of all taxes and fees. In computing the
price per mile, we use the nonstop distance between the two endpoint airports because passengers are
not expected to want to pay more for circuitous routings.
Preliminary Findings
Table 3 summarizes the price differences paid by travelers for each of the six largest network
carriers in markets to and from their respective hubs compared to travel throughout the remainder of
their networks by fare class category. The percentage differences from the system remainder
represent, by hub and fare class, the difference that passengers traveling to and from the hub paid
16 A separate flight ‘‘coupon’’ is required for each flight with a unique flight number on a given itinerary. We exclude ‘‘interline’’
passengers (those using multiple marketing carriers on a single itinerary), ‘‘open-jaw’’ (i.e., BOS-LAX-JFK) and ‘‘circle’’ (i.e.,
BOS-LAX-SFO-BOS) itineraries. The proportions of passengers flying on one, two, and three coupon directional legs are
64.25%, 34.33%, and 1.42%, respectively.17 While Evans and Kessides (1993) use ‘‘city-pair’’ markets (i.e., combine airports within a given city), we follow Borenstein
(1989) in using ‘‘airport-pair’’ markets because we are interested in studying potential pricing power to and from particular
hub airports.18 Likewise, a significant number of first-class tickets are sold as ‘‘Y-UP’’ tickets, where passengers pay the full unrestricted
(i.e., ‘‘walk-up’’) coach fare but receive a first-class ticket.
Impact of Passenger Mix on Hub Premiums 379

vis-a-vis passengers traveling throughout the remainder of that airline’s network. In computing
these price differences, we first compute the average price per mile using 250-mile bands for each air-
line to and from each of their hubs as well as throughout the remainder of their respective networks.
We then calculate the percentage price difference at each hub versus that carrier’s system remainder
by mileage band. Finally, we compute the average percentage price difference at each hub by
weighting each of the mileage-band specific price differences by the number of passengers traveling
to or from that hub within the given mileage band. Thus, column (a) of Table 3 indicates, for example,
that US Airways passengers traveling to and from Charlotte (CLT) paid, on average, 51.8% more than
what US Airways’ passengers paid for travel in comparable distance markets that neither originated
nor terminated at any of US Airways’ primary or secondary hubs. This could include, for example,
connecting passengers traveling on US Airways from Austin to Fort Lauderdale or nonstop
passengers traveling from Washington-National to Orlando.
The most direct comparison in the literature to the figures in column (a) of Table 3 are those
reported in Borenstein (1989, table 1). In general, the fare class pooled hub premium figures in
Borenstein (1989) tend to be somewhat higher than those reported in column (a) of Table 3—the
notable exception being US Airways to and from Pittsburgh, which Borenstein (1989) finds to be
16.6% higher than the remainder of USAir’s network, versus 40.5% in our Table 3. This difference is
likely related to USAir’s acquisition of Piedmont Airlines, which was completed in 1989. For the other
hubs that can be compared directly, we find the following [Borenstein 1989, table 1, versus column (a)
Table 3. Price per Mile Percentage Differences from System Remainder
Hubbing
Carrier
All
Passengers (a)
Restricted
Coach (b) Premium (c)
Primary Hubs
Charlotte (CLT) US Airways 51.8 22.5 34.1Cincinnati (CVG) Delta 48.7 26.0 14.8Pittsburgh (PIT) US Airways 40.5 21.7 34.8Denver (DEN) United 40.0 40.7 73.1Dallas (DFW) American 31.0 21.0 28.1Chicago O’Hare (ORD) United 29.1 6.6 59.8Houston (IAH) Continental 20.0 25.9 17.1Chicago O’Hare (ORD) American 20.0 6.4 36.8Minneapolis (MSP) Northwest 12.5 7.9 5.0Atlanta (ATL) Delta 10.7 12.9 9.4Memphis (MEM) Northwest 8.5 0.5 �3.6Salt Lake City (SLC) Delta �12.1 �2.9 �2.5
Secondary Hubs
Washington-Dulles (IAD) United 38.1 35.9 42.6Philadelphia (PHL) US Airways 32.9 24.7 28.9Newark (EWR) Continental 29.6 33.8 19.4Cleveland (CLE) Continental 25.1 28.5 23.7San Francisco (SFO) United 16.0 9.7 8.7Miami (MIA) American 2.1 �4.2 1.5Detroit (DTW) Northwest �3.2 8.9 9.7
Calculations using domestic itineraries excluding interline, zero fare, and frequent flyer tickets. Premium includes first,
business, and unrestricted coach passengers. The sample focuses on city-pair markets where the carrier had at least 100
unrestricted coach and 100 premium passengers. Percentages represent price per mile differences to and from hubs versus system
remainder. Average prices per mile are computed by 250-mile bands and are passenger weighted. Source: U.S. DOT OD1B
Database, 2000.
380 Darin Lee and Marıa Jose Luengo-Prado

in Table 3]: American at DFW (41.8% vs. 31.0%), Delta at ATL (56.1% vs. 10.7%), Northwest at MSP
(21.7% vs. 12.5%), and United at ORD (40.7% vs. 29.1%). Thus, on a fare class aggregated basis, the
unadjusted hub premiums at four of the five airports common to both studies appears to have declined
since 1987 (the date of Borenstein’s data). The large change in the pooled hub premium at Atlanta is
almost certainly related to the growth of low-cost carrier AirTran (formerly ValuJet), which did not
exist in 1987, but whose market share of O&D passengers at Atlanta had reached 14.1% by 2000.
The importance of controlling for passenger mix when attempting to quantify the hub premium
can be seen by comparing column (a) to columns (b) and (c) in Table 3, which summarize the data for
restricted coach and premium passengers separately. For restricted coach passengers (b), we see that
the average percentage differences decline (relative to column a) at 12 of the 19 hubs. For Miami and
Salt Lake City, the average price difference is negative, implying that restricted coach passengers
originating or terminating at these hubs pay less per mile, on average, than their nonhub counterparts.
At other hub airports such as Chicago O’Hare, Minneapolis, and Memphis, the average price
difference is small (i.e., less than 8% for restricted coach passengers). Unlike Gordon and Jenkins
(2000), we do not find—on average—that restricted coach passengers receive a hub discount at
Northwest’s three hubs, although the average premium is very small (i.e., roughly 6%) and is the
lowest among the six carriers. On average, controlling for passenger mix reduces the average price
difference from 25.1% to 15.8% for restricted coach passengers at primary hubs compared to the
pooled (i.e., column a) results. For premium passengers (column c), the average price difference
declines relative to column (a) at 14 of the 19 hubs (including 9 of the 12 primary hubs) but increases
sharply at Chicago O’Hare (for both United and American) and Denver. Our results for Northwest’s
premium passengers are effectively the same as those of Gordon and Jenkins (2000), who found an
average premium of roughly 2–3% across Northwest’s three hubs.
It is important to note that the average price difference can decline—relative to column (a)—for
both restricted coach and premium passengers at a given hub, and that this, in fact, is the case at 9 of
the 19 hubs (and half of the primary hubs) in our sample. This is because premium tickets may cost
several times as much as restricted coach tickets, and as indicated in Table 2, the proportion of
passengers purchasing premium tickets is typically higher for travel to and from hubs than throughout
the remainder of a carrier’s network. When fares are aggregated across passenger types, the higher
proportion of premium fares at the hubs—relative to the system remainder—results in average prices
being biased upward at the hubs relative to the system remainder. Disaggregating passengers by fare
class, however, allows us to remove this bias because premium (or restricted coach) tickets at the hubs
are only being compared to premium (or restricted coach) tickets throughout the system remainder.
Although the results in Table 3 are illuminating, care must be taken in their interpretation. To begin
with, a significantly greater proportion of passengers in the control group (i.e., the system remainder) are
connecting, rather than nonstop, passengers and thus are effectively receiving a lower quality product
than those passengers traveling to and from the various hubs. As seen in Table 2, the percentage of
passengers flying nonstop to and from the 19 hubs in our analysis ranges from 79.2% at Washington-
Dulles to 95.5% at Houston Intercontinental. Conversely, the proportion of the carriers’ passengers
flying nonstop throughout the remainder of their respective networks ranges from roughly 2% on
Northwest to 39.6% on American. Second, during our sample period, United, Delta, and US Airways all
had significant ‘‘low fare’’ divisions in their networks designed to compete directly with Southwest
Airlines and other low-cost carriers. These divisions, known as Shuttle by United, Delta Express, and US
Airways MetroJet, operated in short- and medium-haul markets, primarily along the East and West
Coasts and to and from Florida. Because a disproportionate share of flights operated by these low-fare
divisions neither originated nor terminated at one of their parent carrier’s hubs—the one main exception
Impact of Passenger Mix on Hub Premiums 381
being Shuttle by United at San Francisco (SFO)—the average fares paid by the control group passengers
(i.e., the system remainder) in markets of 1,250 miles or less will tend to be biased downward for these
carriers, thus inflating the hub price differences. Third, the differences at Chicago O’Hare (ORD) vis-a-
vis the remainder of American’s and United’s systems are likely to be biased upward because Chicago
O’Hare was one of four airports in the United States operating under the High Density Rule in 2000, and
thus, prices to and from O’Hare likely reflect the additional cost of acquiring slots or the scarcity rents
caused by government-imposed limits on the number of flights.19 Finally, Table 3 does not reflect the
differences in average market density (the number of O&D passengers per day) across the various
hubs.20 For example, the median density on markets that Delta serves nonstop from Atlanta is 187 per
day, compared to a median market density of 51 per day at Cincinnati. Similarly, the median market densities
at Charlotte and Pittsburgh (US Airways’ two primary hubs) are 127 and 128 passengers per day, respec-
tively, compared to a median density at Philadelphia of 357. Because less dense markets neces-
sitate the use of smaller aircraft with higher per seat-mile operating costs, markets served to and from
hubs in small cities will tend to have higher costs, and hence prices, compared to hubs in larger cities.
In sum, even after controlling for passenger mix and distance, the observed price differences for
travel to and from hubs compared to the remainder of each carrier’s system will tend to be overstated
in columns (b) and (c) because they do not control for a number of factors, many of which impact
product quality or costs. Finally, we should emphasize that care must be taken when comparing the
results of Table 3 across carriers because the premiums at each carrier’s hubs are relative to the prices
paid in the remainder of their own networks. Thus, although a given carrier may have small (or
negative) hub premiums relative to the remainder of its own network, the absolute prices at its hubs
may be higher than at other carriers’ hubs if its overall prices tend to be higher.
4. Estimation of Hub Premiums
Our approach to assess the effect of hubs on airline prices is to estimate a price equation. In this
equation, an appropriate measure of price for a given market and airline is regressed on hub indicators,
measures of competition and control variables that may influence the cost and demand characteristics
in that market. Thus, the price equation can be thought of as a reduced form specification in which
demand and supply characteristics of the market are included as explanatory variables.
In general, the approach used in the literature to estimate airline price equations has been to pool
the data of different carriers together and use firm dummy variables to control for firm-specific effects
19 For the period of analysis in our paper, the High Density Rule (HDR) applied to Chicago O’Hare, Washington National
(DCA), and New York’s LaGuardia (LGA) and JFK airports. In order to operate at these airports, carriers must possess take-
off and landing ‘‘slots.’’ Although many slots were initially grandfathered, a secondary market allows slots to be bought, sold,
and leased. The HDR was lifted at ORD on July 1, 2002.20 It should be noted that there is a subtle but important nuance in the definition of a market’s density. Although density—as we
have defined it—is based on the number of O&D passengers, in a network setting, density is perhaps better measured by total
passengers (O&D in additional to flow) because this ultimately determines suitable equipment type, which in turn influences
costs (Brueckner, Dyer, and Spiller 1992; Brueckner and Spiller 1994). A complete measure of market density, therefore,
would attempt to measure the number of onboard passengers traveling on each of the potential composite spokes that could be
combined to create a feasible routing for the airport pair market. However, limitations in the data reported to the Department of
Transportation make this approach difficult. For example, although onboard passengers are reported at the segment level in the
DOT’s T100 Database, there is no equivalent database for certain commuter carriers (those carriers reporting under the DOT’s
Form 298C), many of which serve as regional codeshare partners for some of the major network carriers. Thus, for the
purposes of this analysis (including the estimations in Section 4), we proxy for density using O&D passengers only.
382 Darin Lee and Marıa Jose Luengo-Prado

such as differences in costs or quality of service. This approach assumes, however, that the effects of
the various right-hand-side variables on prices are constant across all carriers. There may be reasons to
expect, however, that specific competitive factors affect carriers in different ways. For example, the
degree of head-to-head competition from low-cost carriers varies substantially across the different
network carriers, as has the way in which the network carriers have responded to them. Likewise, as
discussed earlier, we suspect that there may be differences in how different carriers report unrestricted
coach passengers to the Department of Transportation.21 A Chow test on our data soundly rejects
pooling, and thus, we begin by estimating ordinary least-square (OLS) and two-stage least squares
(2SLS) models for each of the six large network airlines individually. In addition to the individual
airline regressions, we also estimate pooled OLS, 2SLS, and fixed-effects models for the largest 1,000
markets, so that our results may be compared more directly to those in the literature.
Individual Carrier Regressions
We begin by estimating the following equation for each of our six carriers:
lnðPjÞ ¼ lþ hubj bþ Xjdþ ej ð1Þ
where ln(Pj) is the natural log of the carrier’s average price per mile in market j, l is a constant, hubj is
a matrix of hub dummies, Xj is a matrix of controls, and ej is a random error term assumed to be i.i.d.
with mean zero and variance r2e. We want to determine if airlines systematically charge higher prices
per mile to passengers originating or terminating at one of their hubs—beyond any potential pricing
power conferred by market share—so we include hub dummies in our specification. Specifically, we
include two hub dummies: primary hub and secondary hub. Primary hub equals 1 if either endpoint of
market j is a primary hub (as enumerated in Table 1) for that airline and 0 otherwise. Likewise,
secondary hub equals 1 if either endpoint of market j is a secondary hub for that airline and
0 otherwise. Our approach differs from Borenstein (1989) and Evans and Kessides (1993) in that we
control explicitly for the presence of hubs as opposed to using airport market shares.22 We believe that
this approach may be more revealing than the ones used in previous studies, given the high correlation
between market share and airport market share in the data.23
In order to study the effect of passenger mix on the hub premium, we also run the following
augmented regression:
lnðPjf Þ ¼ lþ a premiumjf þ hubj bþ ðhubj 3 premiumjf Þcþ Xjdþ ej ð2Þ
where f denotes fare class (i.e., for each market we have two observations, one for restricted coach
passengers and one for premium passengers), premiumjf is a dummy variable that takes the value 1 for
premium passengers and 0 otherwise. In this specification, a measures how high premium tickets
21 For example, Continental and Delta have premium passenger proportions of 11.8% and 11.2%, respectively, and American’s
proportion is 22.6%, United’s is 19.8%, and US Airways is 27.8%. Although some variation—based on the types of markets
each carrier serves—is to be expected, we were surprised that Continental’s proportion was so low, given that it derives over
a third of its O&D traffic from the New York City area. If all carriers reported their unrestricted coach passengers using
a ‘‘standard’’ definition, we would expect to see Continental with a proportion of premium passengers more similar to that
of the other carriers.22 Whereas Evans and Kessides (1993) use the simple average of the carrier’s market share of O&D passengers at both
endpoints, Borenstein (1989) uses the weighted average.23 The average correlation is 0.75 for all carriers. The highest correlation is for US Airways (0.78), and lowest for Continental
(0.72).
Impact of Passenger Mix on Hub Premiums 383

are—on average—relative to all of the respective carrier’s tickets in the market, b measures the
average effect of the hub dummy across fare classes, and c measures the incremental effect of the hub
dummy for premium passengers. If, as we suspect, passenger mix is an important determinant of the
hub premium, we expect the estimate of the average hub premium, b, to be lower in Equation 2 than
in Equation 1. Likewise, if airlines are successful at extracting additional hub premiums from their
premium passengers, we would expect the estimated coefficients on c in Equation 2 to be positive.
The matrix of controls, X, includes:
sharej (market share), the carrier’s share of O&D passengers in 2000 in market j. Previous research
(e.g., Borenstein 1989) shows that a high market share for an airline may confer pricing power in
that market, so we expect the coefficient to be positive. In order to deal with the possible endo-
geneity in the determination of prices and market shares in a given market, our 2SLS estimations
instrument for sharej using 1999 market share.24
lowcostj (low-cost competition), a dummy variable that takes the value 1 if low-cost carriers
collectively have greater than a 1% share of O&D passengers in market j and 0 otherwise. We in-
clude in our list of low-cost carriers jetBlue, Frontier, Tower, AirTran, Midway, Legend, National,
Vanguard, Spirit, ProAir, ATA, Southwest, Access Air, and Sun Country.25 Numerous studies
(e.g., Transportation Research Board 1999; Morrison and Winston 2000; Morrison 2001) find that
competition by low-cost carriers has a large impact on the prices of all carriers serving that market,
and thus, we expect the estimated coefficient to be negative.26
lnmilesj (distance), the natural log of nonstop distance for market j. Other things equal, we
expect average price per mile to decline as trip distance increases because the per-mile costs asso-
ciated with a given flight decline sharply as distance increases. We use a market’s nonstop distance
as opposed to itinerary distance because passengers are not expected to be willing to pay more for
circuitous routings.
lnmktpaxj (density), the natural log of total market passengers for all carriers serving market jin 1999. Greater market density allows airlines to exploit well-known economies of density by us-
ing larger, more cost-efficient aircraft (Brueckner, Dyer, and Spiller 1992; Brueckner and
Spiller 1994).
owpropj (one-way tickets), the proportion of the carrier’s passengers purchasing one-way
tickets in market j. We control for the fact that airlines tend to price one-way tickets more expen-
sively (per leg) than round-trip tickets.
Slots. For the period of our analysis, four airports in the United States had government-im-
posed limits on the number of takeoffs and landings that may take place each hour. To account for
the effects of these restrictions on prices (either the scarcity value or the additional cost of acquir-
ing slots), we include dummy variables for each slot-controlled airport, which take the value 1 if
either endpoint of market j is one of the four slot-constrained airports—Chicago O’Hare (ORDj),
Kennedy (JFKj), LaGuardia (LGAj), and Reagan National (DCAj)—and 0 otherwise.
Readers familiar with the literature will note that we do not include nspropj, the proportion of the
carrier’s passengers flying nonstop in market j, as one of our regressors. The reason we exclude it
from this section of our analysis is that we cannot disentangle its effect from that of the various hub
dummies.27 Thus, the estimated coefficients on the hub dummies in these specifications reflect—in
part—differences in the proportion of nonstop service at hubs versus nonhubs in addition to the hub
premium. Indeed, because the overwhelming majority of passengers originating at or destined to hubs
24 We also tried the intramarket rank instrument used by Evans and Kessides (1993), which takes the values 1 and 2 for the
carriers with the largest and second largest market shares, respectively, and takes the value 3 for all other carriers serving that
market. However, we found that 1999 market share provided a better fit.25 The results do not vary significantly if the threshold is set at 5% or 10%.26 We also tried including the market’s Herfindahl index, but it becomes insignificant when the low-cost dummy is included.27 Likewise, we do not include flight frequency as a control variable because the DOT’s flight segment database (the T100
data set) in 2000 excludes a number of regional carriers that are responsible for operating a significant fraction of flights on
behalf of the major carriers in some markets. Therefore, we cannot construct a frequency measure using these data without
significant measurement error.
384 Darin Lee and Marıa Jose Luengo-Prado

travel nonstop—in contrast to nonhub O&D passengers (see Table 2)—our estimated hub premiums
likely overstate the constant-quality premiums.28 Our fixed-effects results reported in Section 4
include nspropj (in one of our specifications) so that we may compare our results with those in the
previous literature.
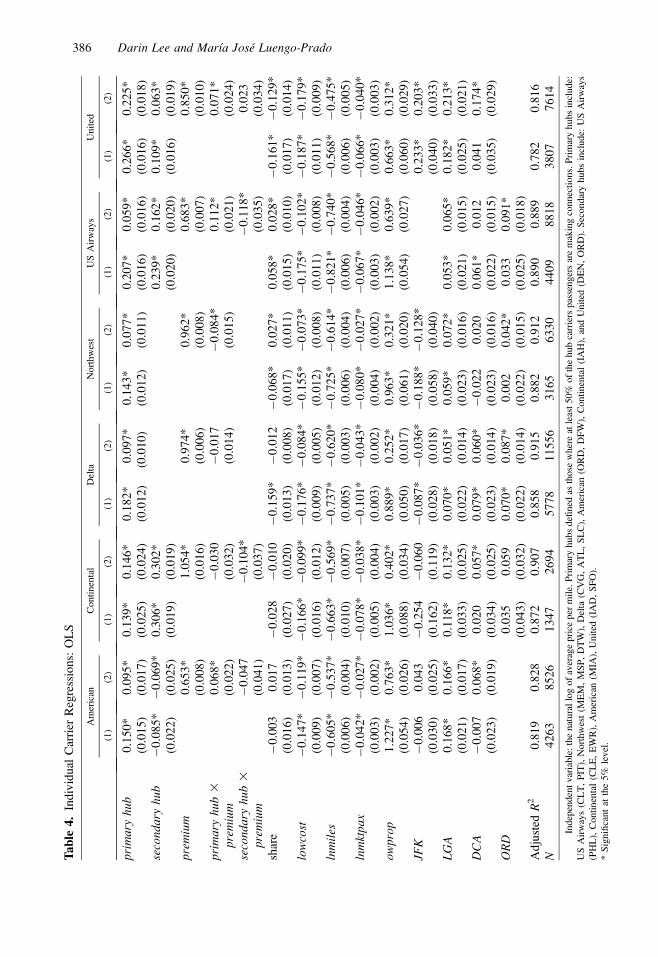
The OLS and 2SLS (instrumenting for sharej) results for the six major network carriers are
summarized in Tables 4 and 5. Note that US Airways did not serve JFK airport in 2000, and because
American and United operate hubs at Chicago O’Hare, the ORD dummy variable is dropped in the
corresponding regressions.
Discussion of Results
When we do not control for passenger mix—columns labeled (1)—the estimated hub premiums
at the primary hubs in our 2SLS estimations (Table 5) range from 14.8% for Continental to 30.0% for
United. Controlling for passenger mix—columns labeled (2)—reduces the hub premiums at the
primary hubs for every carrier with the exception of Continental. For carriers with secondary hubs,
controlling for passenger mix also tends to lower the hub premium (the exception being American’s
Miami hub, where the premium is already negative). Overall, the average hub premium (across
carriers) at the primary hubs falls from 19.5% to 12.2% after controlling for passenger mix; for
secondary hubs, the average premium falls from 16.3% to 13.0%.
Not surprisingly, prices for premium tickets are significantly more expensive than the average
ticket, although the markup on premium tickets varies widely across carriers. For example,
American’s premium tickets are priced 92% higher than its average tickets, but Continental’s
premium tickets are 187% more expensive. We suspect that the large difference among carriers may
be related to which tickets they classify as unrestricted coach tickets for DOT reporting purposes.
Somewhat surprisingly, we do not find that all carriers extract additional hub premiums from
their premium passengers. For example, although American, US Airways, and United all appear to
extract additional premiums from their premium passengers at their primary hubs (ranging from 7%
for American to 12% for US Airways), the hub premium for Northwest’s premium passengers is
lower—on average—by nearly 9%.
In examining the other control variables, our primary interest is in the columns labeled (2) of
Table 5 (2SLS). The estimated coefficients on share are typically positive when significant, with the
exception of United, for which the coefficient is both negative and significant. This somewhat
surprising finding is likely the result of the highly publicized labor problems that United experienced
throughout the summer of 2000, which resulted in the cancellation or delay of thousands of its flights.
For example, data from the Department of Transportation’s Air Travel Consumer Reports for July of
2000 indicates that nearly one-third (31.5%) of United’s scheduled flights arrived late 70% of the time
or more compared to fewer than 1% for both Delta and American. In order to win back customers
following these labor problems, United was forced to discount prices in addition to offering their top
tier frequent flyers additional incentives (double the standard bonus miles) on all flights throughout
the latter half of 2000.29 For other carriers, the impact of higher market share on prices is relatively
modest. For example, prices for Northwest are 2% higher in markets where Northwest has a 75%
market share compared with an otherwise similar market where Northwest has a 25% market share.
28 Although one could conceivably control for this difference by restricting the analysis exclusively to nonstop itineraries, some
hub-and-spoke carriers (in particular Continental and Northwest) offer very little nonstop service in their nonhub markets, and
thus, the comparisons may not be meaningful.29 See, for example, ‘‘United Airlines tries to woo back wary travellers,’’ Cedar Rapids Gazette, September 14, 2000.
Impact of Passenger Mix on Hub Premiums 385
Ta
ble
4.
Ind
ivid
ual
Car
rier
Reg
ress
ion
s:O
LS
Am
eric
anC
onti
nen
tal
Del
taN
ort
hw
est
US
Air
way
sU
nit
ed
(1)
(2)
(1)
(2)
(1)
(2)
(1)
(2)
(1)
(2)
(1)
(2)
prim
ary
hub
0.1
50
*(0
.01
5)
0.0
95
*(0
.01
7)
0.1
39
*(0
.02
5)
0.1
46
*(0
.02
4)
0.1
82
*(0
.01
2)
0.0
97
*(0
.010
)0
.14
3*
(0.0
12
)0
.07
7*
(0.0
11
)0
.20
7*
(0.0
16
)0
.05
9*
(0.0
16
)0
.26
6*
(0.0
16
)0
.22
5*
(0.0
18
)se
cond
ary
hub
�0
.08
5*
(0.0
22
)�
0.0
69
*(0
.02
5)
0.3
06
*(0
.01
9)
0.3
02
*(0
.01
9)
0.2
39
*(0
.02
0)
0.1
62
*(0
.02
0)
0.1
09
*(0
.01
6)
0.0
63
*(0
.01
9)
prem
ium
0.6
53
*(0
.00
8)
1.0
54
*(0
.01
6)
0.9
74
*(0
.00
6)
0.9
62
*(0
.00
8)
0.6
83
*(0
.00
7)
0.8
50
*(0
.01
0)
prim
ary
hub
3
prem
ium
0.0
68
*(0
.02
2)
�0
.03
0(0
.03
2)
�0
.01
7(0
.01
4)
�0
.08
4*
(0.0
15
)0
.11
2*
(0.0
21
)0
.07
1*
(0.0
24
)se
cond
ary
hub
3
prem
ium
�0
.04
7(0
.04
1)
�0
.10
4*
(0.0
37
)�
0.1
18
*(0
.03
5)
0.0
23
(0.0
34
)sh
are
�0
.00
3(0
.01
6)
0.0
17
(0.0
13
)�
0.0
28
(0.0
27
)�
0.0
10
(0.0
20
)�
0.1
59
*(0
.01
3)�
0.0
12
(0.0
08
)�
0.0
68
*(0
.01
7)
0.0
27
*(0
.01
1)
0.0
58
*(0
.01
5)
0.0
28
*(0
.01
0)�
0.1
61
*(0
.01
7)�
0.1
29
*(0
.01
4)
low
cost
�0
.14
7*
(0.0
09
)�
0.1
19
*(0
.00
7)�
0.1
66
*(0
.01
6)�
0.0
99
*(0
.01
2)�
0.1
76
*(0
.00
9)�
0.0
84
*(0
.00
5)�
0.1
55
*(0
.01
2)�
0.0
73
*(0
.00
8)�
0.1
75
*(0
.01
1)�
0.1
02
*(0
.00
8)�
0.1
87
*(0
.01
1)�
0.1
79
*(0
.00
9)
lnm
iles
�0
.60
5*
(0.0
06
)�
0.5
37
*(0
.00
4)�
0.6
63
*(0
.01
0)�
0.5
69
*(0
.00
7)�
0.7
37
*(0
.00
5)�
0.6
20
*(0
.00
3)�
0.7
25
*(0
.00
6)�
0.6
14
*(0
.00
4)�
0.8
21
*(0
.00
6)�
0.7
40
*(0
.00
4)�
0.5
68
*(0
.00
6)�
0.4
75
*(0
.00
5)
lnm
ktpa
x�
0.0
42
*(0
.00
3)�
0.0
27
*(0
.00
2)�
0.0
78
*(0
.00
5)�
0.0
38
*(0
.00
4)�
0.1
01
*(0
.00
3)�
0.0
43
*(0
.00
2)�
0.0
80
*(0
.00
4)�
0.0
27
*(0
.00
2)�
0.0
67
*(0
.00
3)�
0.0
46
*(0
.00
2)�
0.0
66
*(0
.00
3)�
0.0
40
*(0
.00
3)
owpr
op1
.22
7*
(0.0
54
)0
.76
3*
(0.0
26
)1
.03
6*
(0.0
88
)0
.40
2*
(0.0
34
)0
.88
9*
(0.0
50
)0
.25
2*
(0.0
17
)0
.96
3*
(0.0
61
)0
.32
1*
(0.0
20
)1
.13
8*
(0.0
54
)0
.63
9*
(0.0
27
)0
.66
3*
(0.0
60
)0
.31
2*
(0.0
29
)JF
K�
0.0
06
(0.0
30
)0
.04
3(0
.02
5)�
0.2
54
(0.1
62
)�
0.0
60
(0.1
19
)�
0.0
87
*(0
.02
8)�
0.0
36
*(0
.01
8)�
0.1
88
*(0
.05
8)�
0.1
28
*(0
.04
0)
0.2
33
*(0
.04
0)
0.2
03
*(0
.03
3)
LG
A0
.16
8*
(0.0
21
)0
.16
6*
(0.0
17
)0
.11
8*
(0.0
33
)0
.13
2*
(0.0
25
)0
.07
0*
(0.0
22
)0
.05
1*
(0.0
14
)0
.05
9*
(0.0
23
)0
.07
2*
(0.0
16
)0
.05
3*
(0.0
21
)0
.06
5*
(0.0
15
)0
.18
2*
(0.0
25
)0
.21
3*
(0.0
21
)D
CA
�0
.00
7(0
.02
3)
0.0
68
*(0
.01
9)
0.0
20
(0.0
34
)0
.05
7*
(0.0
25
)0
.07
9*
(0.0
23
)0
.06
0*
(0.0
14
)�
0.0
22
(0.0
23
)0
.02
0(0
.01
6)
0.0
61
*(0
.02
2)
0.0
12
(0.0
15
)0
.04
1(0
.03
5)
0.1
74
*(0
.02
9)
OR
D0
.03
5(0
.04
3)
0.0
59
(0.0
32
)0
.07
0*
(0.0
22
)0
.08
7*
(0.0
14
)0
.00
2(0
.02
2)
0.0
42
*(0
.01
5)
0.0
33
(0.0
25
)0
.09
1*
(0.0
18
)A
dju
sted
R2
0.8
19
0.8
28
0.8
72
0.9
07
0.8
58
0.9
15
0.8
82
0.9
12
0.8
90
0.8
89
0.7
82
0.8
16
N4
26
38
52
61
34
72
69
45
77
81
15
56
31
65
63
30
44
09
88
18
38
07
76
14
Indep
enden
tvar
iable
:th
enat
ura
llo
gof
aver
age
pri
ceper
mil
e.P
rim
ary
hubs
defi
ned
asth
ose
wher
eat
leas
t50%
of
the
hub
carr
iers
pas
senger
sar
em
akin
gco
nnec
tions.
Pri
mar
yhubs
incl
ude:
US
Air
way
s(C
LT
,P
IT),
Nort
hw
est
(ME
M,
MS
P,
DT
W),
Del
ta(C
VG
,A
TL
,S
LC
),A
mer
ican
(OR
D,
DF
W),
Conti
nen
tal
(IA
H),
and
Unit
ed(D
EN
,O
RD
).S
econdar
yhub
sin
clude:
US
Air
way
s
(PH
L),
Conti
nen
tal
(CL
E,
EW
R),
Am
eric
an(M
IA),
Unit
ed(I
AD
,S
FO
).
*S
ignifi
cant
atth
e5%
level
.
386 Darin Lee and Marıa Jose Luengo-Prado

Ta
ble
5.
Ind
ivid
ual
Car
rier
Reg
ress
ion
s:2
SL
S
Am
eric
anC
onti
nen
tal
Del
taN
ort
hw
est
US
Air
way
sU
nit
ed
(1)
(2)
(1)
(2)
(1)
(2)
(1)
(2)
(1)
(2)
(1)
(2)
prim
ary
hub
0.1
48
*(0
.01
6)
0.0
95
*(0
.01
7)
0.1
38
*(0
.02
5)
0.1
44
*(0
.02
4)
0.1
75
*(0
.01
2)
0.0
93
*(0
.01
0)
0.1
39
*(0
.01
2)
0.0
73
*(0
.01
1)
0.2
00
*(0
.01
6)
0.0
57
*(0
.01
6)
0.2
63
*(0
.01
6)
0.2
22
*(0
.01
8)
seco
ndar
yhu
b�
0.0
85
*(0
.02
2)
�0
.06
9*
(0.0
25
)0
.30
5*
(0.0
20
)0
.30
0*
(0.0
19
)0
.23
3*
(0.0
21
)0
.16
0*
(0.0
21
)0
.10
6*
(0.0
16
)0
.06
1*
(0.0
19
)pr
emiu
m0
.65
3*
(0.0
08
)1
.05
3*
(0.0
16
)0
.97
3*
(0.0
06
)0
.96
1*
(0.0
08
)0
.68
3*
(0.0
07
)0
.84
9*
(0.0
10
)pr
imar
yhu
b3
prem
ium
0.0
68
*(0
.02
2)
�0
.03
0(0
.03
2)
�0
.01
6(0
.01
4)
�0
.08
4*
(0.0
15
)0
.11
2*
(0.0
21
)0
.07
2*
(0.0
24
)se
cond
ary
hub
3pr
emiu
m�
0.0
47
(0.0
41
)�
0.1
04
*(0
.03
7)
�0
.11
8*
(0.0
35
)0
.02
3(0
.03
4)
shar
e0
.00
2(0
.01
8)
0.0
17
(0.0
15
)�
0.0
25
(0.0
29
)�
0.0
05
(0.0
21
)�
0.1
40
*(0
.01
5)
0.0
00
(0.0
09
)�
0.0
54
*(0
.01
8)
0.0
39
*(0
.01
2)
0.0
82
*(0
.01
6)
0.0
37
*(0
.01
2)
�0
.14
9*
(0.0
19
)�
0.1
19
*(0
.01
5)
low
cost
�0
.14
7*
(0.0
09
)�
0.1
19
*(0
.00
7)
�0
.16
6*
(0.0
16
)�
0.0
99
*(0
.01
2)
�0
.17
5*
(0.0
09
)�
0.0
84
*(0
.00
5)
�0
.15
5*
(0.0
12
)�
0.0
73
*(0
.00
8)
�0
.17
4*
(0.0
11
)�
0.1
02
*(0
.00
8)
�0
.18
6*
(0.0
11
)�
0.1
79
*(0
.00
9)
lnm
iles
�0
.60
5*
(0.0
06
)�
0.5
37
*(0
.00
4)
�0
.66
3*
(0.0
10
)�
0.5
69
*(0
.00
7)
�0
.73
6*
(0.0
05
)�
0.6
20
*(0
.00
3)
�0
.72
4*
(0.0
06
)�
0.6
14
*(0
.00
4)
�0
.81
8*
(0.0
06
)�
0.7
39
*(0
.00
4)
�0
.56
7*
(0.0
06
)�
0.4
75
*(0
.00
5)
lnm
ktpa
x�
0.0
42
*(0
.00
3)
�0
.02
7*
(0.0
03
)�
0.0
77
*(0
.00
5)
�0
.03
8*
(0.0
04
)�
0.0
99
*(0
.00
3)
�0
.04
2*
(0.0
02
)�
0.0
78
*(0
.00
4)
�0
.02
5*
(0.0
03
)�
0.0
64
*(0
.00
3)
�0
.04
5*
(0.0
02
)�
0.0
65
*(0
.00
3)
�0
.03
9*
(0.0
03
)ow
prop
1.2
27
*(0
.05
4)
0.7
63
*(0
.02
6)
1.0
36
*(0
.08
8)
0.4
03
*(0
.03
4)
0.9
05
*(0
.05
0)
0.2
55
*(0
.01
7)
0.9
75
*(0
.06
2)
0.3
25
*(0
.02
0)
1.1
53
*(0
.05
4)
0.6
43
*(0
.28
)0
.66
9*
(0.0
61
)0
.31
4*
(0.0
29
)JF
K�
0.0
07
(0.0
30
)0
.04
3(0
.02
5)
�0
.25
4(0
.16
2)
�0
.05
9(0
.11
9)
�0
.09
0*
(0.0
28
)�
0.0
37
*(0
.01
8)
�0
.18
8*
(0.0
58
)�
0.1
28
*(0
.04
0)
0.2
32
*(0
.04
0)
0.2
03
*(0
.03
3)
LG
A0
.16
8*
(0.0
21
)0
.16
6*
(0.0
17
)0
.11
8*
(0.0
33
)0
.13
2*
(0.0
25
)0
.07
0*
(0.0
22
)0
.05
1*
(0.0
14
)0
.05
8*
(0.0
23
)0
.07
2*
(0.0
16
)0
.04
9*
(0.0
21
)0
.06
3*
(0.0
15
)0
.18
1*
(0.0
26
)0
.21
3*
(0.0
21
)D
CA
�0
.00
8(0
.02
3)
0.0
68
*(0
.01
9)
0.0
20
(0.0
34
)0
.05
7*
(0.0
25
)0
.07
9*
(0.0
23
)0
.06
0*
(0.0
14
)�
0.0
23
(0.0
23
)0
.01
9(0
.01
6)
0.0
57
*(0
.02
2)
0.0
10
(0.0
16
)0
.04
1(0
.03
5)
0.1
75
*(0
.02
9)
OR
D0
.03
5(0
.04
3)
0.0
59
(0.0
32
)0
.06
9*
(0.0
22
)0
.08
7*
(0.0
14
)0
.00
0(0
.02
2)
0.0
40
*(0
.01
5)
0.0
31
(0.0
25
)0
.09
0*
(0.0
18
)A
dju
sted
R2
0.8
19
0.8
28
0.8
72
0.9
07
0.8
58
0.9
15
0.8
81
0.9
12
0.8
89
0.8
89
0.7
82
0.8
16
N4
26
38
52
61
34
72
69
45
77
81
15
56
31
65
63
30
44
09
88
18
38
07
76
14
Indep
enden
tvar
iable
:th
enat
ura
llo
gof
aver
age
pri
ceper
mil
e.P
rim
ary
hubs
defi
ned
asth
ose
wher
eat
leas
t50%
of
the
hub
carr
ier’
spas
senger
sar
em
akin
gco
nnec
tions.
Pri
mar
yhubs
incl
ude:
US
Air
way
s(C
LT
,P
IT),
Nort
hw
est
(ME
M,
MS
P,
DT
W),
Del
ta(C
VG
,A
TL
,S
LC
),A
mer
ican
(OR
D,
DF
W),
Conti
nen
tal
(IA
H)
and
Unit
ed(D
EN
,O
RD
).S
econdar
yhubs
incl
ude:
US
Air
way
s
(PH
L),
Conti
nen
tal
(CL
E,
EW
R),
Am
eric
an(M
IA),
Unit
ed(I
AD
,S
FO
).
*S
ignifi
cant
atth
e5%
level
.
Impact of Passenger Mix on Hub Premiums 387

In contrast, low-cost carriers have a very strong negative impact on prices. Overall, the presence of
a low-cost carrier lowers prices in a market by between 8% and 20%. The estimated coefficients on
lnmiles are consistently negative and significant and indicate that, controlling for other factors,
doubling a flight’s length roughly reduces the price per mile by 50% to 70%. Care must be taken when
interpreting the coefficients on lnmiles because many airline taxes and fees are independent of trip
length and will therefore have a disproportionate impact (per mile) on short flights.
The overall impact of passenger density (lnmktpax) is, as expected, negative and significant for
all carriers. In general, a tenfold increase in market density (i.e. 1000 versus 100 passengers per day)
reduces prices by between 25% and 45%. The estimated coefficients on owprop are positive and
significant for all carriers, as expected, because one-way tickets are generally more expensive (per leg)
than roundtrip tickets.
The estimated coefficients for the various slot dummy variables indicate that there are substantial
differences among the four slot-controlled airports. Flights to and from LaGuardia are more expensive
on all carriers by between 5% and 23%. Likewise, flights to and from DCA tend to be more expensive
for all carriers (except Northwest) by between 6% and 19%. The estimated coefficients on JFK tend to
be mixed, with some carriers (i.e., United) charging higher prices for service to and from JFK and
other carriers (i.e., Northwest and Delta) charging generally lower prices.30 For the four network
carriers that do not operate hubs at O’Hare, prices in markets to and from ORD are higher by between
4% and 9%.
Pooled Regressions
In order to compare our results more directly to those of Borenstein (1989) and Evans
and Kessides (1993), the next step in our analysis is to pool carriers together and estimate an
average hub premium. We estimate 2SLS, OLS, and fixed effects (FE) models for all carriers (not
only the six network carriers) using the largest 1000 markets. Like Evans and Kessides (1993), we
eliminate from our sample observations where a carrier has less than a 1% share of a market’s
total O&D traffic.
We first estimate a similar regression to the individual carrier regressions of Section 4 for the
pooled data, with and without market fixed effects:
lnðPijÞ ¼ lþ hubij bþ Xijdþ eij ð3ÞlnðPijÞ ¼ lj þ hubij bþ Xijdþ eij ð4Þ
where ln(Pij) is the natural log of carrier i’s average price per mile in market j, l is a constant, hubij is
a matrix of two hub dummies (primary and secondary) that take the value of 1 if either endpoint of
market j is a hub (primary or secondary) for airline i, and Xij is a matrix of regressors that varies with
the airline’s identity within a market. In Equation 4, lj are market fixed effects. The random error eij is
assumed to be i.i.d. with zero mean and variance r2e. X includes the same control variables as the
individual airline regressions plus airline dummies that capture firm differences constant across
markets (i.e., differences in costs or service quality, etc.). As was the case with our individual
carrier regressions, we exclude nsprop from the specification because of its collinearity with the hub
dummy variables.
30 The negative and significant coefficient for JFK in the Delta regressions is almost certainly related to the competitive impact of
low-cost carrier jetBlue, which began service from JFK in 2000, primarily in markets that overlapped heavily with Delta
(i.e., to and from destinations in Florida).
388 Darin Lee and Marıa Jose Luengo-Prado
The market fixed-effects model is our preferred specification. Including fixed effects allows us to
control for unobservable effects correlated with the observed explanatory variables, lessening possible
biases from omitted variables. While the market fixed effects control for demand and cost differences
that are common for all airlines serving the same market (i.e., distance, market density etc.), they also
indirectly control for the inherent business orientation of a particular market. If our hypothesis is
correct, and the hub premium is inflated by failure to control for passenger mix, the estimated hub
premium from the market fixed effects model should be lower than the hub premium from the model
with a common intercept for all markets. It is important to emphasize, however, that market fixed
effects alone cannot control for passenger mix entirely because a carrier’s ability to attract business
passengers depends critically on its service offering (i.e., flight frequency, service quality, etc.) in
a particular market. Likewise, it is important to note that the fixed-effects approach does not permit
identifying the effects of variables that do not vary within a market.31
As we did in our individual airline regressions, we also estimate augmented regressions that
separate tickets by fare class, with and without fixed effects:
lnðPifjÞ ¼ lþ a premiumifj þ hubij bþ ðhubij 3 premiumifjÞcþ Xifjdþ eifj ð5ÞlnðPifjÞ ¼ lj þ a premiumifj þ hubij bþ ðhubij 3 premiumifjÞcþ Xifjdþ eifj ð6Þ
Finally, in order to compare our results to previous studies, we estimate a model that attempts to
indirectly capture the effects of hubs on prices using endptmsij, defined as the simple average of airline
i’s market share of O&D passengers at the two endpoints of market j, instead of using hub dummies.
Consistent with Evans and Kessides (1993), we include nsprop in this case.
Summary statistics for the variables used in this section are presented in Table 6 and are similar
to those reported by Evans and Kessides (1993, table 1).32
Discussion of Results
Results for our model using hub dummies are presented in Table 7. The estimated hub premiums
without fixed effects for fare class aggregated data (2SLS) are 28.1% and 25.7% for primary and
secondary hubs respectively. These numbers are higher than the average hub premiums from the
individual airline regressions (18.2% and 16.3%) because the sample now includes low-cost carriers,
which lower average fares for the control group. In other words, we are no longer comparing hub
versus nonhub prices for a given airline; rather, we are now comparing hub prices versus nonhub
prices for all airlines, including low-cost carriers.
Confirming our a priori belief, the estimated average hub premiums with fixed effects are
substantially lower, 15.1% and 16.9% for primary and secondary hubs, respectively, in the fixed
effects 2SLS (FE-2SLS) model. This result strongly suggests that failing to control for passenger mix
tends to inflate the hub premium. However, because including fixed effects does not directly control
for passenger mix, we also make use of our disaggregated fare data. Without fixed effects, the hub
premiums for primary and secondary hubs are now 16.2% and 14.7%, respectively, substantially
lower than the fare class aggregated data. With fixed effects and controlling for fare class, we do not
find a significant hub premium for primary hubs and a hub premium of 6.6% for secondary hubs.
31 Like Evans and Kessides (1993), our data rejected the random effects model, and therefore, we do not report the results for
this specification.32 Note that the fares in our dataset include all fees and taxes, which likely explains why our mean fare is somewhat higher than
the mean fare reported by Evans and Kessides (1993).
Impact of Passenger Mix on Hub Premiums 389

Looking at the other control variables, we also find that for premium passengers, the price
per mile is between 110% and 118% higher than the average price per mile, and that carriers–in
general–extract additional hub premiums from their business passengers (between 14% and 16%).
Estimated coefficients for the other regressors have the expected signs, including nonreported carrier
dummies. For example, all other things being equal, Southwest Airlines’ price per mile is—on
average—47% less than American’s.
Finally, results for OLS, 2SLS, FE, and FE-2SLS regressions replacing hub dummies with
endptms are presented in Table 8. In general, the estimated coefficients are similar to those of Evans
and Kessides (1993), except in our data, both share and endptms remain significant and positive in the
FE-2SLS specification. As expected, using the fare class–disaggregated data decreases the estimated
coefficient for endptms. Likewise, with our hub dummy specification (Table 7), share remains
significant in all specifications. Recall that one of the primary findings of Evans and Kessides (1993)
is that share at the market level was not important after controlling for endpoint market share. We
suspect that this somewhat surprising result may result from multicollinearity between share and
endptms. For example, in our data set, the correlation between these two variables is 0.83.
Table 6. Variable Definitions and Descriptive Statistics for Largest 1000 Markets
Variable
Name Definition Mean
Standard
Deviation
fareij Average one-way fare for airline i in market j 190.14 (78.39)ppmij Average price per O&D mile for airline i in market j 0.197 (0.127)mktpaxj Average number of O&D passengers in market j in 1999 234,411 (215,177)nspropij Proportion of passengers for airline i in market j
traveling nonstop0.388 (0.436)
owpropij Proportion of passengers for airline i in market j usingone-way tickets
0.109 (0.086)
milesj One-way non-stop distance between airports in market j 1234.9 (703.4)shareij Market share of airline i in market j 0.228 (0.271)endptmsij Simple average of airline i’s market share of O&D
passengers at endpoint airports in market j0.162 (0.132)
DCAj Dummy variable taking value 1 if either endpoint ofmarket j is DCA and 0 otherwise
0.039 (0.194)
JFKj Dummy variable taking value 1 if either endpoint ofmarket j is JFK and 0 otherwise
0.015 (0.123)
LGAj Dummy variable taking value 1 if either endpoint ofmarket j is LGA and 0 otherwise
0.051 (0.220)
ORDj Dummy variable taking value 1 if either endpoint ofmarket j is ORD and 0 otherwise
0.066 (0.249)
lowcostj Dummy variable taking value 1 if low cost carrierscollectively account for more than a 1% share ofO&D passengers in market j, 0 otherwise
0.670 (0.470)
primaryhubij
Dummy variable taking value 1 if either end-point ofmarket j is a primary hub for airline i, 0 otherwise
0.121 (0.326)
secondaryhubij
Dummy variable taking value 1 if either end-point ofmarket j is a secondary hub for airline i, 0 otherwise
0.048 (0.214)
Firms Number of firms in sample 20Markets Number of markets in sample 1000N Number of observations 4101
Largest 1000 markets in 2000 in terms of domestic O&D passengers.
390 Darin Lee and Marıa Jose Luengo-Prado

Ta
ble
7.
Po
ole
dR
egre
ssio
ns
wit
hH
ub
Du
mm
ies.
Lar
ges
t1
00
0M
ark
ets
Far
eC
lass
Aggre
gat
edF
are
Cla
ssD
isag
gre
gat
ed
2-S
LS
OL
SF
E-2
SL
SF
E2
-SL
SO
LS
FE
-2S
LS
FE
prim
ary
hub
0.2
48
*(0
.01
5)
0.2
59
*(0
.01
5)
0.1
41
*(0
.01
3)
0.1
56
*(0
.01
2)
0.1
50
*(0
.01
5)
0.1
59
*(0
.01
5)
0.0
17
(0.0
15
)0
.02
8(0
.01
5)
seco
ndar
yhu
b0
.22
9*
(0.0
19
)0
.23
9*
(0.0
19
)0
.14
3*
(0.0
15
)0
.15
4*
(0.0
15
)0
.13
7*
(0.0
20
)0
.14
4*
(0.0
20
)0
.06
4*
(0.0
19
)0
.07
2*
(0.0
19
)pr
emiu
m0
.77
9*
(0.0
10
)0
.78
1*
(0.0
10
)0
.73
9*
(0.0
09
)0
.74
0*
(0.0
09
)pr
imar
yhu
b3
prem
ium
0.1
35
*(0
.01
8)
0.1
35
*(0
.01
8)
0.1
50
*(0
.01
5)
0.1
50
*(0
.01
5)
seco
ndar
yhu
b3
prem
ium
0.0
93
*(0
.02
7)
0.0
92
*(0
.02
7)
0.1
05
*(0
.02
2)
0.1
05
*(0
.02
2)
shar
e0
.12
4*
(0.0
20
)0
.09
9*
(0.0
19
)0
.26
4*
(0.0
16
)0
.23
5*
(0.0
15
)0
.08
2*
(0.0
17
)0
.06
3*
(0.0
16
)0
.22
1*
(0.0
16
)0
.20
0*
(0.0
16
)lo
wco
st�
0.1
78
*(0
.00
9)�
0.1
78
*(0
.00
9)
�0
.12
9*
(0.0
07
)�
0.1
30
*(0
.00
7)
lnm
iles
�0
.55
9*
(0.0
07
)�
0.5
61
*(0
.00
7)
�0
.47
2*
(0.0
05
)�
0.4
74
*(0
.00
5)
lnm
ktpa
x�
0.0
79
*(0
.00
6)�
0.0
79
*(0
.00
6)
�0
.05
5*
(0.0
05
)�
0.0
55
*(0
.00
5)
owpr
op1
.17
2*
(0.0
69
)1
.16
0*
(0.0
69
)1
.54
2*
(0.0
66
)1
.51
6*
(0.0
66
)0
.88
5*
(0.0
27
)0
.87
9*
(0.0
27
)1
.03
0*
(0.0
24
)1
.02
4*
(0.0
24
)JF
K0
.07
0*
(0.0
30
)0
.07
4*
(0.0
30
)0
.03
9(0
.02
4)
0.0
42
(0.0
24
)L
GA
0.1
60
*(0
.01
6)
0.1
61
*(0
.01
6)
0.1
48
*(0
.01
3)
0.1
49
*(0
.01
3)
DC
A0
.06
8*
(0.0
18
)0
.06
9*
(0.0
18
)0
.08
2*
(0.0
15
)0
.08
3*
(0.0
15
)O
RD
�0
.05
3*
(0.0
16
)�
0.0
56
*(0
.01
6)
�0
.02
7*
(0.0
13
)�
0.0
29
*(0
.01
3)
Ad
just
edR
20
.79
80
.79
80
.91
30
.91
20
.86
40
.86
40
.90
40
.90
4N
41
01
41
01
41
01
41
01
82
02
82
02
82
02
82
02
Indep
enden
tvar
iable
:th
enat
ura
llo
gof
aver
age
pri
ceper
mil
e.P
rim
ary
hubs
defi
ned
asth
ose
wher
eat
leas
t50%
of
the
hub
carr
iers
pas
senger
sar
em
akin
gco
nnec
tions.
Pri
mar
yhubs
incl
ude:
US
Air
way
s(C
LT
,P
IT),
Nort
hw
est
(ME
M,
MS
P,
DT
W),
Del
ta(C
VG
,A
TL
,S
LC
),A
mer
ican
(OR
D,
DF
W),
Conti
nen
tal
(IA
H)
and
Unit
ed(D
EN
,O
RD
).S
econdar
yhubs
incl
ude:
US
Air
way
s
(PH
L),
Conti
nen
tal
(CL
E,
EW
R),
Am
eric
an(M
IA),
Unit
ed(I
AD
,S
FO
).T
he
spec
ifica
tion
incl
udes
(nonre
port
ed)
carr
ier
dum
mie
s.
*S
ignifi
cant
atth
e5%
level
.
Impact of Passenger Mix on Hub Premiums 391

Ta
ble
8.
Poole
dR
egre
ssio
ns
wit
hE
nd-p
oin
tM
arket
Shar
e.L
arges
t1000
Mar
ket
s
Far
eC
lass
Aggre
gat
edF
are
Cla
ssD
isag
gre
gat
ed
2-S
LS
OL
SF
E-2
SL
SF
E2
-SL
SO
LS
FE
-2S
LS
FE
endp
tms
0.7
68
*(0
.05
9)
0.8
35
*(0
.05
7)
0.9
55
*(0
.04
4)
1.0
01
*(0
.04
3)
0.6
43
*(0
.04
8)
0.6
91
*(0
.04
6)
0.7
70
*(0
.04
7)
0.7
99
*(0
.04
6)
prem
ium
0.8
14
*(0
.00
9)
0.8
16
*(0
.00
9)
0.7
74
*(0
.00
8)
0.7
75
*(0
.00
8)
shar
e0
.05
1(0
.03
3)�
0.0
06
(0.0
30
)0
.08
1*
(0.0
24
)0
.03
9(0
.02
2)
0.0
42
(0.0
26
)0
.00
1(0
.02
4)
0.0
70
*(0
.02
5)
0.0
45
(0.0
23
)lo
wco
st�
0.1
93
*(0
.00
9)�
0.1
94
*(0
.00
9)
�0
.14
2*
(0.0
07
)�
0.1
42
*(0
.00
7)
lnm
iles
�0
.54
4*
(0.0
07
)�
0.5
44
*(0
.00
7)
�0
.46
0*
(0.0
05
)�
0.4
60
*(0
.00
5)
lnm
ktpa
x�
0.0
75
*(0
.00
6)�
0.0
78
*(0
.00
6)
�0
.04
9*
(0.0
05
)�
0.0
51
*(0
.00
5)
owpr
op1
.11
8*
(0.0
71
)1
.09
0*
(0.0
71
)1
.47
8*
(0.0
63
)1
.44
8*
(0.0
63
)0
.83
1*
(0.0
27
)0
.82
4*
(0.0
26
)0
.98
4*
(0.0
24
)0
.98
0*
(0.0
24
)JF
K0
.02
7(0
.03
1)
0.0
27
(0.0
31
)0
.00
7(0
.02
5)
0.0
06
(0.0
25
)L
GA
0.1
42
*(0
.01
6)
0.1
42
*(0
.01
6)
0.1
34
*(0
.01
3)
0.1
33
*(0
.01
3)
DC
A0
.05
2*
(0.0
19
)0
.05
3*
(0.0
19
)0
.06
8*
(0.0
15
)0
.06
9*
(0.0
15
)O
RD
0.0
02
(0.0
16
)0
.00
1(0
.01
6)
0.0
25
(0.0
13
)0
.02
4(0
.01
3)
nspr
op0
.00
8(0
.01
6)
0.0
24
(0.0
16
)�
0.0
21
(0.0
12
)�
0.0
08
(0.0
12
)�
0.0
12
(0.0
13
)�
0.0
01
(0.0
12
)�
0.0
31
*(0
.01
3)�
0.0
24
(0.0
13
)A
dju
sted
R2
0.7
93
0.7
93
0.3
72
0.8
60
0.8
60
0.8
65
N4
10
14
10
14
10
14
10
18
20
28
20
28
20
28
20
2
Indep
enden
tvar
iable
:th
enat
ura
llo
gof
aver
age
pri
ceper
mil
e.P
rim
ary
hubs
defi
ned
asth
ose
wher
eat
leas
t50%
of
the
hub
carr
iers
pas
senger
sar
em
akin
gco
nnec
tions.
Pri
mar
yhubs
incl
ude:
US
Air
way
s(C
LT
,P
IT),
Nort
hw
est
(ME
M,
MS
P,
DT
W),
Del
ta(C
VG
,A
TL
,S
LC
),A
mer
ican
(OR
D,
DF
W),
Conti
nen
tal
(IA
H)
and
Unit
ed(D
EN
,O
RD
).S
econdar
yhubs
incl
ude:
US
Air
way
s
(PH
L),
Conti
nen
tal
(CL
E,
EW
R),
Am
eric
an(M
IA),
Unit
ed(I
AD
,S
FO
).T
he
spec
ifica
tion
incl
udes
(non-r
eport
ed)
carr
ier
dum
mie
s.
*S
ignifi
cant
atth
e5%
level
.
392 Darin Lee and Marıa Jose Luengo-Prado

5. Conclusions
What does our analysis add to the decade-long debate over hub premiums? Our analysis
indicates that much of the observed difference in average prices charged by airlines at their hubs
compared to the remainder of their networks can be explained by passenger mix. Controlling for
passenger mix lowers the average hub premium at primary hub airports from 19.5% to 12.2%. Stated
differently, failing to control for passenger mix overstates the hub premium at major hub airports by
an average of 59.2% (see Table 5). For secondary hubs, explicitly controlling for passenger mix
reduces the average premium from 16.2% to 13.0%. Our result are robust to whether or not we
estimate individual or pooled models and to whether or not we control for passenger mix explicitly
(i.e., by using the fare class–disaggregated data) or indirectly (i.e., by using market fixed effects).
Nevertheless, our analysis does find evidence that network airlines do indeed charge more per
mile for service to and from most of their hubs compared to service throughout the remainder of their
networks, even after controlling for factors such as passenger mix, density, distance, and a number of
other factors. Furthermore, these hub premiums, when they exist, tend to be larger for passengers
purchasing premium tickets for most carriers. However, it is these passengers who are most likely to
place a high value on the time saving and convenience offered by the high-frequency, nonstop service
to a wide array of destinations made possible by the hub-and-spoke system.
Data Description Appendix
The source of our ticket and price data is the U.S. Department of Transportation’s (DOT) Domestic Origin and Destination
Survey, Databank 1B (OD1B). The data represent a 10% sample of U.S. Scheduled Passenger Carriers providing service under
the Code of Federal Regulations, Part 241. The particular version of the DB1A data we use was purchased from Data Base
Product, Inc., a DOT-certified data vendor, and is called the ‘‘HUB Sup’’ Low Level O&D Data. Data for our analysis are for the
full year 2000.
Each observation in the raw data is a unique airline/route combination, where a route is defined as a starting and ending
airport, in addition to any intermediate connecting point(s). In the raw data, passenger itineraries have been broken into
directional ‘‘legs’’ (i.e., outbound or return), and the reported fares represent the fare of the directional leg (i.e., roundtrip fares
have been divided by two). Each observation also indicates the total number of flight coupons (a separate coupon is required for
each flight segment) as well as the fare class associated with each coupon. Fares are inclusive of all taxes and fees.
The preparation of the raw data for our econometric analysis consisted of the following steps. First, we exclude the
following types of tickets:
1. Tickets with four or more coupons per directional trip leg (these accounted for fewer than 0.1% of all tickets).
2. Tickets with ‘‘bulk fare’’ and ‘‘zero fare’’ types (both of which report a fare of $0), as well as tickets with fares of less than $26
(these are coded by Data Base Products as ‘‘Z’’ fare types in the raw data, signifying that they represent either frequent flyer
award tickets or employee travel).
3. Open jaw trips (i.e., BOS-LAX-JFK).
4. Tickets with more than one marketing carrier (i.e., ‘‘interline’’ tickets).
5. First, business or unrestricted coach class tickets with an average price per mile of less than five cents.
6. Restricted coach class tickets with an average price per mile of less than two cents.
7. Tickets with ‘‘unknown’’ fare classes (these accounted for roughly 1.25% of the observations).
For the purposes of our analysis, we aggregate first, business, and unrestricted coach class tickets into a single ‘‘premium’’
fare type category. In the raw data, unrestricted coach tickets accounted for roughly 95% of the premium tickets. For multiple-
coupon itineraries in which there are coupons with different fare classes, the fare class of the longest distance coupon was used.
The raw data are then collapsed into nondirectional airport-pair markets. That is, nonstop Boston to Seattle passengers are
considered to be in the same market as Seattle to Boston passengers making a connection. In collapsing the data, average fares for
each carrier and fare class (restricted coach and premium) are weighted by the number of passengers. We then included only
those market/carrier observations where the carrier had more than 100 restricted coach and 100 premium passengers. We also
dropped a very small number of market/carrier combinations where the average premium fare was less than the average
unrestricted coach fare.
Impact of Passenger Mix on Hub Premiums 393

The median ratio (across markets) of premium to restricted fares in our final data set is: American (2.28), Continental
(3.28), Delta (2.83), Northwest (2.77), United (2.58), and US Airways (2.23). Overall, the percentage of passengers purchasing
premium tickets in our data set is: American (22.6%), Continental (11.8%), Delta (11.2%), Northwest (14.1%), United (19.8%),
and US Airways (27.6%).
References
Baumol, William, and Daniel Swanson. 2003. The new economy and ubiquitous competitive price discrimination: Identifying
defensible criteria of market power. Antitrust Law Journal 70:661–85.
Berry, Steven, Michael Carnall, and Pablo Spiller. 2006. Airline hubs: costs, markups, and the implications of customer
heterogeneity. In Advances in airline economics, volume 1, edited by Darin Lee. Amsterdam: Elsevier.
Borenstein, Severin. 1989. Hubs and high fares: Dominance and market power in the U.S. airline industry. RAND Journal of
Economics 20:344–65.
Brueckner, Jan, Nichola Dyer, and Pablo Spiller. 1992. Fare determination in airline hub-and-spoke networks. RAND Journal of
Economics 23:309–33.
Brueckner, Jan, and Pablo Spiller. 1994. Economies of traffic density in the deregulated airline industry. Journal of Law and
Economics 9:379–415.
Evans, William, and Ioannis Kessides. 1993. Localized market power in the U.S. airline industry. Review of Economics and
Statistics 75:66–75.
Gordon, Robert, and Darryl Jenkins. 2000. Hub and spoke network pricing in the Northwest Airlines domestic system.
Unpublished Manuscript, Department of Economics, Northwestern University, Evanston, IL.
Levine, Michael E. 2002. Price discrimination without market power. Yale Journal of Regulation 19, no. 1.
Morrison, Steven. 2001. Actual, adjacent and potential competition: Estimating the full effect of Southwest Airlines. Journal of
Transport Economics and Policy 35:239–56.
Morrison, Steven, and Clifford Winston. 1995. The evolution of the airline industry. Washington, DC: The Brookings Institution.
Morrison, Steven, and Clifford Winston. 2000. The remaining role of government policy in the deregulated airline industry. In
Deregulation of network industries: What’s next? edited by Sam Peltzman and Clifford Winston. Washington, DC: AEI-
Brookings Joint Center for Regulatory Studies, pp. 1–40.
Transportation Research Board. 1999. Entry and competition in the U.S. airline industry: Issues and opportunities. National
Research Council, Special Report 255, Washington, DC.
U.S. Department of Transportation. 1990. Airports, air traffic control, and related concerns. Office of the Secretary of
Transportation, Secretary’s Task Force on Competition in the U.S. Domestic Airline Industry, Washington, DC.
U.S. Department of Transportation. 2000. Air fare premiums at hub airports: a review of the evidence. Office of System and
Economic Assessment, Volpe Center, Office of Planning and Special Projects, Cambridge, MA.
U.S. Department of Transportation. 2001. Dominated hub fares. Domestic Aviation Competition Series, Office of the Assistant
Secretary for Aviation and International Affairs, Washington, DC.
U.S. General Accounting Office. 1990. Airline competition: Higher fares and reduced competition at concentrated airports.
July, 1990, GAO/RCED 90-102, Washington, DC.
U.S. General Accounting Office. 1999. Airline deregulation: Changes in airfares, service quality and barriers to entry. March
1999, GAO/RCED 99-92, Washington, DC.
394 Darin Lee and Marıa Jose Luengo-Prado

Reproduced with permission of the copyright owner. Further reproduction prohibited without permission.
Related Documents


