DISCUSSION PAPER SERIES Forschungsinstitut zur Zukunft der Arbeit Institute for the Study of Labor The Impact of Parents’ Years since Migration on Children’s Academic Achievement IZA DP No. 6242 December 2011 Helena Skyt Nielsen Beatrice Schindler Rangvid

Welcome message from author
This document is posted to help you gain knowledge. Please leave a comment to let me know what you think about it! Share it to your friends and learn new things together.
Transcript

DI
SC
US
SI
ON
P
AP
ER
S
ER
IE
S
Forschungsinstitut zur Zukunft der ArbeitInstitute for the Study of Labor
The Impact of Parents’ Years since Migrationon Children’s Academic Achievement
IZA DP No. 6242
December 2011
Helena Skyt NielsenBeatrice Schindler Rangvid

The Impact of Parents’ Years since Migration on Children’s Academic
Achievement
Helena Skyt Nielsen Aarhus University
and IZA
Beatrice Schindler Rangvid Danish Institute of Governmental Research (AKF)
Discussion Paper No. 6242 December 2011
IZA
P.O. Box 7240 53072 Bonn
Germany
Phone: +49-228-3894-0 Fax: +49-228-3894-180
E-mail: [email protected]
Any opinions expressed here are those of the author(s) and not those of IZA. Research published in this series may include views on policy, but the institute itself takes no institutional policy positions. The Institute for the Study of Labor (IZA) in Bonn is a local and virtual international research center and a place of communication between science, politics and business. IZA is an independent nonprofit organization supported by Deutsche Post Foundation. The center is associated with the University of Bonn and offers a stimulating research environment through its international network, workshops and conferences, data service, project support, research visits and doctoral program. IZA engages in (i) original and internationally competitive research in all fields of labor economics, (ii) development of policy concepts, and (iii) dissemination of research results and concepts to the interested public. IZA Discussion Papers often represent preliminary work and are circulated to encourage discussion. Citation of such a paper should account for its provisional character. A revised version may be available directly from the author.

IZA Discussion Paper No. 6242 December 2011
ABSTRACT
The Impact of Parents’ Years since Migration on Children’s Academic Achievement*
In this paper, we employ register data for eight cohorts of second-generation immigrant pupils to identify the impact of each parent’s years since migration on their children’s school achievements. We exploit local variation in years since migration and within-family variation. We find evidence of a positive impact of parents’ years since migration on children’s academic achievement. Mothers’ years of residence tend to be more important for Danish, while fathers’ years of residence tend to be more important for math. The effects vary by gender, and family-specific effects influence girls’ and boys’ educational attainment differently. JEL Classification: I21, J12, J62 Keywords: intergenerational mobility, years since migration, scholastic achievement,
immigrant children, second generation, fixed effects Corresponding author: Helena Skyt Nielsen Department of Economics and Business Aarhus University Bartholins Allé 10 8000 Aarhus C Denmark E-mail: [email protected]
* We are grateful for comments from Aycan Celikaksoy, Marianne Simonsen, Lars Skipper and participants in the workshop on Immigration, integration and school achievement, Aarhus, and in the conference on Migration: Economic Change, Social Challenge, London. We appreciate funding from the Danish Council for Independent Research (#275-07-0233). The usual disclaimer applies.

2
1. Introduction
In Western Europe, there is increasing concern about the assimilation of the children of the large cohorts of guest worker immigrants. Contrary to what one might expect, results from the international PISA, PIRLS and TIMMS studies show that in most Continental European countries immigrants continue to lag significantly behind their native peers even in the second generation (Schnepf, 2007; OECD, 2010). In the face of a rapidly growing population of second-generation immigrant youth, this is a puzzle of major importance. In this paper, we focus on the effect of parents’ years since migration on second-generation pupils’ achievement and thus on intergenerational, or inherited, integration. It turns out that the second-generation immigrants, whose parents have spent fewer years since migration in the country of destination before having their child, inherit severe disadvantages from their immigrant parents. The literature on immigrant outcomes typically focusses on the time (first-generation) immigrants have lived in the host country. For the first generation, time since migration (or age at arrival) reflects both their own and their families’ time since migration and thereby their potential integration in the host country. By contrast, second-generation immigrants are typically considered a homogenous group with respect to their potential for integration, since they all – by definition - have been born and raised in the host country. However, they still differ by their families’ potential for integration, i.e. their parents’ years since migration, and thus by their own potential for intergenerational, or inherited, integration and its derived effect on educational outcomes. Thus, in this study, we analyse the effect of parents’ time since migration (before the child’s birth) on children’s educational outcomes at the end of lower secondary education. We analyse father’s and mother’s years since migration separately, since parents have not necessarily migrated to Denmark jointly, in which case their time since migration varies. In our sample, 70% of pupils have parents, who arrived in Denmark more than three years apart in time. One particular source of this variation is the widespread practice among immigrants in Denmark and other European countries of marrying a marriage migrant from their country of origin.1 This practice may result in substantial differences between father’s and mother’s years since migration, since one of them may have migrated to Denmark with his/her parents as a child and thus has been raised and educated in Denmark, while the other is a recent immigrant at the time of childbirth. The literature on effects of immigrants’ age at arrival or years since migration is rooted in the theory of transmission of human capital and language capital over generations. Looking first at the parent generation, these studies document that age at migration matters for immigrants’ own assimilation as measured by e.g. language proficiency, educational attainment and wages, because there exist certain critical ages in which migration hampers language proficiency and educational progression.2 As a consequence, the effect of parents’ age at migration may be transmitted to the children, and the transmission may work through several different channels. 1 The expression “marriage migration” denotes the practice of immigrants residing in the country of destination to get married to someone residing in their country of origin before marriage. 2 See Schaafsma & Sweetman (2001) for Canada, Bleakley & Chin (2004, 2010) and Chiswick & DebBurman (2004) for the US, and Van Ours & Veenman (2006) for the Netherlands.

3
While there is a small body of literature on the effects of first-generation immigrants’ age at arrival on educational outcomes (Böhlmark, 2008; Cortes, 2006; Gonzalez, 2003; Van Ours & Veenman, 2006), previous research on the effect of parents’ years since migration on their children’s education is rare. To our knowledge, this is studied only in one recent paper by Åslund, Böhlmark & Skans (2009). They look at a sample of primarily guest-worker migrants from Nordic countries in Sweden and exploit sibling-fixed effects to identify the effect of the mother’s years since migration on e.g. education. They document that a ten-year earlier arrival would increase the length of education by 0.2 years (or 0.1 SD), which should of course be seen in the light of the relatively advantaged sample of mainly Nordic immigrants that they look at.3 The authors focus on the effect of the mother’s years since migration, and thus they neglect potential effects of diverse migration of the two parents. Yet, the effect of parents’ language proficiency, which is one of the channels through which parents’ years since migration may influence their children’s education, on children’s education and employment has been analysed. Both Bleakley & Chin (2008) and Casey & Dustmann (2008) show that the parents’ language skills translate into higher English proficiency of and better educational outcomes for their children.4 Bleakley & Chin (2008) employ an instrumental variables technique in which the instrument for parents’ language skills is the interaction between age at migration and non-English speaking country of origin. Casey & Dustmann (2008) employ a “selection-on-observables” strategy where they exploit rich background information such as parental education and permanent earnings, years since migration, country of origin dummies as well as survey information about parents’ contact with residents in the host country. These papers focus on transmission of capital from each of the two parents.
Our goal is to contribute to a better understanding of the sources of the second-generation gap by investigating an important potential source: the impact of each parent’s years since migration on their children’s academic achievement. Formally, using local marginal effects and sibling-fixed effects specifications, we estimate the effect of each parent’s years since migration, assuming that variation in parental time since migration/spacing between birth of siblings is random, conditional on observed or unobserved permanent characteristics at the family level. The present paper contributes to the literature by being the first study to investigate the effect of parental years since migration on children’s educational outcomes in a sample that is similar to other current immigrant populations in Continental Europe: refugees and children of guest-worker migrants from non-Western countries. Furthermore, our analysis is novel in its focus on both fathers’ and mothers’ years since migration, and possible asymmetries in the effects, and in its focus on educational achievement early in the educational career. In Figure 1, we describe the timing of the set-up in the case in which the father immigrates to Denmark first (e.g. as a guest-worker), and then the (future) spouse follows, and then they have a child.5 This is the example illustrated in the figure. A similar set-up applies to the cases in which the mother arrives first, or both parents migrate together.
3 Also Alba & Nee (2003) find that longer residence in the host country is associated with higher educational achievement among children without, though, interpreting this as a causal effect. 4 In US research, a lack of English proficiency is often cited as the principle barrier for poor school performance among many first- and second-generation children (Cosden et al., 1995; Alba et al., 2002). 5 The spouse may bring children born in the home country with her, but since these children are not born in Denmark (i.e. first generation), they are not included in our study.

4
Figure 1: Timing of set-up
Although the research question is clearly relevant also for other Western countries, the availability of data in Denmark gives us an advantage in this type of investigation, because we can link family members in the Danish registers and follow immigrants from arrival and onwards. Therefore, our empirical analysis is based on Danish register data allowing us to combine information on all pupils in the form 9 cohorts of 2002-2009 with information about their parents’ background characteristics in the year of immigration. To be specific, we study the impact of each parent’s years since migration prior to birth of the child in question on pupils’ achievement as measured by subject-specific exam grades in the school exit exams, drop-out and no exam in form 9. We find that generally the mother’s years since migration are most important for grades in Danish, while the father’s years since migration are most important for grades in math and for drop-out and no exam. This emphasizes the importance of our distinction between each parent’s years since migration, which contrasts the approach in the earlier literature. When we split the sample by gender, we find that the mother’s years since migration matter for grades in both Danish and math for girls when we use the local marginal effects approach, and that these effects disappear when we account for sibling-fixed effects. The opposite is seen for boys. This clearly indicates that family-specific effects influence girls and boys differently. A plausible explanation is that family-specific effects include factors that are closely related to norms and attitudes regarding education and gender role patterns, and this is what shows up in the results. The remainder of the paper is organized as follows: Section 2 describes previous research and how we contribute to this. Section 3 presents the data which are used for the study. Section 4 presents the empirical strategy, while section 5 contains the results of the empirical analyses. Section 6 concludes the paper.
2. Data description
In this study, we focus on second-generation immigrant children and their parents. Second-generation immigrants are defined as being born in Denmark to two parents, who are both born abroad. In the 2002 cohort of form 9 pupils, 3% of pupils are second-generation immigrants from non-Western countries, while that number has increased to 6% in the 2009 cohort.
9th grade exit exam
Childbirth Mother immigrates
Father immigrates
YSM f
YSM m
Treatment measured
Outcome measured

5
The reason why we focus on second-generation immigrant children is that they are more comparable to native Danes than children born abroad are, since they have received their entire education in Danish schools and have lived in Denmark all their lives. While it is understandable that the first generation underachieves compared to native Danes (even after accounting for measurable socioeconomic differences), it is much less obvious why this should still be the case in the second generation. The empirical analysis is based on a data set stemming from administrative registers hosted by Statistics Denmark. The data set contains information on the full population of pupils in the form 9 cohorts graduating in 2002-2009, that is, roughly 480,000 pupils. The basic estimation data set including only second-generation immigrant pupils from non-Western countries comprises about 20,000 observations. The multichild families data set used for the sibling-fixed effects estimations is smaller, but still sizeable, containing about 12,000 pupils. This data set includes immigrant families with at least two children born in Denmark (i.e. second-generation children) who graduated from form 9 within the 8-year period from 2002-2009.6 2.1 Years since migration The variable of main interest in this study is years since migration to Denmark (YSM). It is important to note that unlike other pieces of research in this area we do not consider the time the child has spent in the host country, but the time his or her parents have spent there. The children in our sample are all born in Denmark. We investigate whether the degree of integration of the child’s parents (approximated by the time the parents have lived in Denmark) spills over into children’s educational attainment.
Figure 2: Histograms of fathers’ and mothers’ years since migration before childbirth
The time the father and mother have spent in Denmark, prior to birth of the child in question, is a measure of the time the parents had to get accustomed to life in Denmark, learn the language, obtain host country education and labor market experience before the child was born, and, thus, before they started child rearing.
6 We show descriptive statistics for both data sets in Table 2.
0.00
0.05
0.10
0.15
0.20
0.25
0 2 4 6 8 10 12 14 16 18 20 22 24
Father
Exact year of arrival available
Year of arrival ≤ 1973
0.00
0.05
0.10
0.15
0.20
0.25
0 2 4 6 8 10 12 14 16 18 20 22 24
Mother
Exact year of arrival available
Year of arrival ≤ 1973

6
Figure 2 shows the distribution of time since migration for fathers and mothers at the time the child is born. For parents arriving before 1973, we do not know the exact year of arrival, although we know that they were
not born in Denmark.7 The black parts of the columns summarize years since migration when the exact year
of arrival is known, while the grey parts indicate that exact years since migration are missing.8 Many parents were recent arrivers in Denmark at the time of birth of their children, while only few parents have enjoyed a long residence in Denmark or have grown up in Denmark. There are substantially more mothers than fathers who came to Denmark within five years before childbirth (10,000 compared to 7,000).
Figure 3: How parents spent the time between immigration and childbirth
Figure 3 shows how parents on average have spent the period between their immigration to Denmark and having the child. We distinguish between (accumulated) years spent in employment, in education, and time spent temporarily (e.g. due to unemployment) or permanently (e.g. social transfer income) away from the labour market and education.9 We posit that both time spent in employment and in education improves parents’ (Danish) language skills and their knowledge about life in Denmark, while time spent away from the labour market or education (i.e. time spent at home) does not encourage integration to the same degree. Figure 3 indicates that parents have spent very little time in education. Employment is the dominant activity for males, who have spent more than six years in Denmark at the time of childbirth, while permanent non-labour-market activities are the dominant activities among females. For both males and females, the amount of and the proportion of time spent in the labour market and in education are higher when they have spent a
7 Figure A1 in the appendix gives an overview of the parents’ year of arrival. 8 E.g. 16 years mean “16 years or more” since we only know that these parents have lived in Denmark since 1972 or longer. 9 This is for parents who immigrated in 1980 or later. Another measure of years in employment can be calculated also for parents arriving prior to 1980. The results are essentially unchanged.
0
1
2
3
4
5
6
7
8
1 2 3 4 5 6 7 8 9 10 11 12 13
Ye
ars
Years since migration, mother
0
1
2
3
4
5
6
7
8
1 2 3 4 5 6 7 8 9 10 11 12 13
Ye
ars
Years since migration, father
Years in
employment
Years in
education
Years
temporarily
out of labour
market
Years
permanently
out of labour
market

7
longer period of time in Denmark before childbirth. Supposedly, this promotes their language skills and knowledge of life in Denmark, which we posit should help increase their children’s outcomes. For the purpose of the empirical estimation, we design categories for years since migration so that the uppermost category includes all individuals arriving prior to 1973, where the exact year of arrival is unknown. We classify YSM into four categories: 0-4, 5-9, 10-13, and 14 or more years since migration.10 Figure 3 documents that mothers and fathers in the lowest category have very limited labour market experience and education (around 25% of time spent in Denmark), while parents in the highest category – in particular fathers –have substantial labour market experience and education (around 50% of time spent in Denmark). We consider both the father’s and the mother’s years since migration, because only some of them arrived in Denmark as a couple. Part of the older immigrant population in Denmark has come to Denmark as children together with their parents. Since marriage migration of spouses is frequent, one parent would often have been raised in Denmark, while the other comes to Denmark as an adult to marry the Danish resident.
Table 1: Distribution of the sample by years since migration of each parent
YSM father YSM
mother 0-4 years 5-9 years 10-13 years 14+ years All
0-4 years 0.205 0.158 0.061 0.113 0.538 4,337 3,343 1,295 2,397 11,372
5-9 years 0.043 0.062 0.036 0.068 0.210 918 1,317 763 1,438 4,436
10-13 years 0.032 0.018 0.013 0.042 0.104 681 383 265 877 2,206
14+ years 0.056 0.034 0.014 0.045 0.148 1,193 711 285 951 3,140
All 0.337 0.272 0.123 0.268 1.000 7,129 5,754 2,608 5,663 21,154
In Table 1, we show the joint distribution across the categories of years since migration of the parents. The table shows that 54% of pupils have been born to recently arrived mothers and 34% to recently arrived fathers (YSM: 0-4 years). A total of 951 pupils (5%) are born to parents who both grew up in Denmark (YSM: 14 years or more). In our sample, about one third of pupils grow up in a family where the parents arrived at roughly the same time and are most likely tied movers (the diagonal), while the remaining two thirds grow up in a family where one parent arrived in Denmark considerably earlier than the other.
10 Virtually all fathers and mothers with missing year of arrival, have a value of YSM prior to birth of the child in question of 14 years or more. There are only 60 pupils (less than 0.5%) for whom this is not true due to occurrence of the infrequent combination of a 15-year old pupil taking the 9th grade exam in 2002 (the normal age is 16 years) and a parent arriving before 1973. We delete these individuals from the estimation sample.

8
2.2 Outcome variables The main outcomes considered are exam grades from the national school exit exams at the end of form 9. We use grades for written Danish and math. As an additional outcome variable, we measure whether pupils take the exam or not. Below, we describe these outcome measures in more detail.
Grades As a measure of pupils’ academic achievement, we use grades from the (written) national school exit exams in form 9. The results from the school exit exams are normally considered comparable across schools. The written exams are identical across schools and are graded by the teacher and an external examiner whose opinion dominates the teacher’s opinion. We use only grades from written exams.11 We create an outcome for Danish grades in which the one-dimensional composite measure for Danish is calculated as the simple mean of the pupils’ grades for written Danish and spelling. As outcome for Math achievement, we use grades from the written Math exam(s).12 Before 2008, a 13-point numerical grading scale system was used.13 From 2008 onwards, an internationally comparable seven-point scale was introduced.14 To be able to compare grades across cohorts, we standardize grades to zero mean and unit standard deviation within each cohort.15 Figure 4: Average standardized grades in Danish and math for second-generation pupils and natives
Figure 4 shows average grades for second-generation pupils and natives for Danish and math. The exam results for the average second-generation pupil are lower than for the average native, and it is stable across
11 In preliminary analyses, we also ran regressions for oral exam grades, but results were generally not significant. 12 For 2002-06, a specific grade is given for written math, while for 2007-09, we compute the average of the grade for mathematical skills and mathematical problem solving. 13 The possible grades were 00, 03, 5, 6, 7, 8, 9, 10, 11 and 13; 6 is the lowest passing grade, and 8 represents average performance. 14 The possible grades are 12/A, 10/B, 7/C, 4/D, 02/E, 00/Fx, -02/F, and the average grade of 8 on the previous grading scale is supposed to be equal to 6 on the new scale. 15 See Table A1 for means and standard deviations before the standardization.
-0,7
-0,6
-0,5
-0,4
-0,3
-0,2
-0,1
0,0
0,1
2002 2003 2004 2005 2006 2007 2008 2009
Danes: Danish
Danes: Math
2nd generation:
Danish
2nd generation:
Math

9
cohorts (e.g. no closing or widening of the gap between the second generation and natives) over the period. The disadvantage of the second generation is more prevalent for math than for Danish.
Taking the exam or not
Until 2007, taking the school exit exam has not been compulsory. As shown in Figure 5 (right hand side), the percentage of second-generation pupils not taking the exam has been about 5%, while the corresponding number for natives has been around 2.5%. After making the exam compulsory in 2007, there was a sharp drop in the rate for second-generation pupils not taking the exam to around 3%16, while the already low rate for Danes drops only slightly from 2.5% to 2%.17 When also counting individuals who drop out of school during form 9 (see Figure 5, left hand side), and who for that reason are not observed to take the exam, the 3% non-attendance for second-generation pupils increases to 9%. A comparison of the left hand side and right hand side of the figure indicates that the decline in no exam was followed by an increase in drop-out. This indicates that some second-generation immigrant pupils decided to drop out instead of quitting the exam, when that was banned.
In the regressions, we define an outcome variable which equals one if the pupil has not taken at least one exam for a sub-domain of Danish and a sub-domain of math, and which equals zero otherwise. We analyze this outcome both for the sample of individuals present in form 9 at the time of the exit exam, and for the sample of individuals who entered form 9 after the summer break.
Figure 5: Proportion dropping out or not taking the exam. Natives and immigrants
16 A similarly remarkable drop is seen for first-generation immigrants for whom the rate drops from almost 8% to 4-5%. 17 According to UNI-C (2011), half of these have been exempted by the headmaster, and the other half consists of no-shows.
0%
5%
10%
15%
20%
25%
2002 2003 2004 2005 2006 2007 2008 2009
Danes Second generation First generation
0%
5%
10%
15%
20%
25%
2002 2003 2004 2005 2006 2007 2008 2009
Danes Second generation First generation

10
2.3 Control variables At the pupil level, we control for gender, birth order, country of origin, parents’ ages at arrival, parents’ education and the presence of older siblings born in the country of origin. Table 2 shows descriptive statistics for the control variables used in the regressions, both for the full sample and for the multi-child sample used for the sibling-fixed effects regressions.
Table 2. Descriptive statistics
FULL sample MULTI-CHILD
sample
Mother Father Mother Father
Years since migration 5.7 7.7 5.8 5.7
Parents' education from country of origin
Lower secondary school (max.) 0.13 0.09 0.13 0.10
Vocational education 0.04 0.06 0.03 0.05
High school 0.03 0.02 0.03 0.02
Short cycle higher education 0.01 0.01 0.01 0.01
Medium cycle higher education 0.01 0.01 0.01 0.01
Long cycle higher education 0.01 0.01 0.00 0.01
Missing education 0.78 0.79 0.78 0.80
Parents' age at arrival
Age at arrival (if not missing) 21.1 22.6 20.1 21.6
(SD Age at arrival) 6.3 7.4 5.9 6.9
Missing age at arrival 0.09 0.22 0.09 0.19
Presence of (older) siblings born in country of origin 0.22 0.16
Firstborn child 0.39 0.31
Male 0.50 0.49
Country of origin
Turkey 0.36 0.39
Lebanon 0.13 0.15
Pakistan 0.10 0.13
Ex-Yugoslavia 0.05 0.05
Outcome measures
Grade in Danish exam -0.49 -0.55
Grade in Math exam -0.59 -0.63
Drop-out/no exam 0.09 0.08
No exam 0.04 0.04
Number of observations 21,154 12,393

11
Of the second-generation pupils in our full sample, about 36% have origins in Turkey, about 13% in Lebanon, about 10% in Pakistan and other 5% in former Yugoslavia. The average age at arrival is 21 and 23 years for mothers and fathers, respectively, and although information about education before arrival in Denmark is most often missing, it is striking that only 2.5% of the mothers and 3.5% of the fathers are observed to have acquired education beyond high school before arrival in Denmark. The percentage of pupils who have (older) siblings born before arrival in Denmark is 22%, and the percentage of firstborn pupils in the sample is 39%. Summary statistics in the multi-child sample are similar to those in the full sample except for variables that are directly related to the selection into the sample, e.g. the share of firstborns is smaller in the multi-child sample since this sample does not include only children. In our sample of second-generation pupils, the relationship between YSM18 and children’s exam grades is strong. The graphs in Figure 6 display means for the standardized grades in Danish and Math exams for each value of YSM. The means are regression-adjusted for gender, birth order, country of origin, parents’ ages at arrival, parents’ education and the presence of older siblings born in the country of origin. Consistent with our expectations, children of mothers, who were recent arrivers at the time of the child’s birth, do worse in the exam than children of long-term resident mothers.
Figure 6: Regression-adjusted means
3. Empirical strategy We investigate the impact of each parent’s years since migration (YSM) prior to birth of the child on the child’s Outcome. Our identification strategy comprises three steps. First, we use basic OLS estimations as our baseline results, including predetermined control variables in our regressions of YSM on outcomes and thereby reducing biases that are thought to influence both YSM and outcomes. Thus, conditional on observables, it is assumed to be random how many years the parents have
18 Here, exemplified by mothers’ years since migration.
-0,80
-0,70
-0,60
-0,50
-0,40
-0,30
-0,20
-0,10
0,00
0 1 2 3 4 5 6 7 8 9 10 11 12 13 14+
Sta
nd
. e
xa
m g
rad
es
Years since migration before child's birth, mother
Math
-0,80
-0,70
-0,60
-0,50
-0,40
-0,30
-0,20
-0,10
0,00
0 1 2 3 4 5 6 7 8 9 10 11 12 13 14+
Sta
nd
. e
xa
m g
rad
es
Years since migration before child's birth, mother
Danish

12
spent in the country before they have a child. Since this is a strong assumption, in a second step, we estimate local marginal effects19, i.e. the effect of a change in years since migration from one category to the subsequent category conditional on keeping the partner’s years since migration fixed at 0-4 years.20 Local marginal effects need weaker assumptions for identification than basic OLS. Third, since YSM may still be related to unobserved parental characteristics that also influence pupil outcomes, we estimate sibling-fixed effects models to control for time-invariant observed and unobserved characteristics at the family level, such as taste for education, ability, norms, etc. The key advantage of using differentials in parental years since migration for siblings is that it offers a natural way of eliminating the family-specific heterogeneity biases associated with migration and birth timing choices. In our context, the primary assumption in this model is that a couple’s birth spacing decisions are independent of those characteristics of the individual children in the family that are also related to educational outcomes.21 As a result, the omitted parental characteristics as, for example, concern for or time spent with the children can be captured in a family-specific error term. Estimating sibling-fixed effects models and comparing them to the OLS results, we examine whether unobserved characteristics that are shared by all siblings in a family do indeed drive our OLS findings that years since migration matter for children’s educational outcomes.
However, sibling-based fixed effects models are no panacea because they leave open the possibility of omitted variable bias due to unobserved within-family heterogeneity. Moreover, it is only children with second-generation siblings graduating within the 2002-2009 period who contribute to identification of the coefficients when the siblings approach is used, and this raises some concerns about how general the results are.
3.1 Baseline: Basic OLS For the baseline empirical specifications, we estimate variations of the following model using OLS regressions:
�������� = �� �� + ������� + ������� + � + ��
The outcomes, e.g. exam grade, are a function of pupil-specific variables, Pupilif , family-specific variables, Familyf , and parental years since migration, YSMif. The error term has two components: a family-specific error term εf that includes omitted characteristics that are constant for siblings, and a random error term εif. The crucial assumption for OLS to identify the effect of YSM is that the covariates sufficiently proxy variables influencing both YSM and the outcome, such that, for instance, �=0 over the entire distribution of
YSM. Thus, conditional on observables, it is assumed to be random how many years the parents have spent in the country before they have a child. This is clearly a strong assumption. Therefore, we proceed by estimating local marginal effects, which need much weaker assumptions for identification.
3.2 Local marginal effects The assumption here is that it is random whether a parent has spent a few years less or more in the host country before having a child. Thus, instead of focusing on the average impact of YSM on outcomes, we
19 See Behrman, Cheng & Todd (2004) and Datta Gupta & Simonsen (2010). 20 Here, we only present results in which the partner’s years since migration are fixed at 0-4 years. In the section on robustness, we show results for alternative periods, too. 21 This assumption may be violated if the ability of older siblings affects birth spacing decisions.

13
explore the local effect of increasing years since migration by assuming that the assignment to categories of years since migration is random, conditional on observables.22,23 For this assumption to hold, the conditioning set should include a rich set of pre-treatment variables thought to influence timing of migration and childbirth after migration and child educational outcomes. Below, we discuss which variables are included in the conditioning set in order to best satisfy this requirement.24,25
First of all, timing of childbirth would of course be influenced by parents’ age at migration since that would indicate how close the individual was to childbearing ages at the time of migration. It is not possible to separately identify the effect of years since migration from both age at birth and age at arrival. 26 However, if we believe that maternal age at birth is correlated with child outcomes but is not a cause of child outcomes as indicated by Leigh and Gong (2010) and Turley (2003), we can ignore that variable and investigate years since migration conditional on age at arrival. It is important to control for age at arrival, though, otherwise variation in years since migration as measured at birth of the child in question would to a large extent be driven by variation in age at arrival. Secondly, the presence of foreign-born older siblings would also influence the time from migration to childbirth. Presence of foreign-born siblings would most likely reduce the time from migration to childbirth if fertility was not already completed. Thus, the presence of foreign-born siblings increases the likelihood of being born to a less integrated parent. Moreover, since older siblings, in particular the firstborn, tend to do better than their younger siblings (Black et al. 2005), we also control for birth order effects. Finally, country of origin is likely to be important since that would approximate systematic cultural differences, timing of childbirth and preferences for and traditions of education. Furthermore, education of each parent at the time of migration is included since that would approximate inherent ability, which may affect grades as well as time of marriage and thus time of childbirth.
Our prior would be that low-ability individuals have children earlier after migration than others, and if that pattern is not accounted for by the conditioning set, it would give an upward bias on the effect of long duration of stay in Denmark on child outcomes. Similarly, we would expect that parents with a lack of tradition of education would have children earlier after migration than others.
The identifying assumption is that, conditional on observables, it is random whether the parent spends a few (∆YSM) more or a few less years in the country before deciding to have a child. As long as the change ∆YSM is small, this seems to be a reasonable assumption.27 Comparing parents who spend a similar number of years in the country before childbirth bypasses the problem of large indirect effects stemming from unobserved
22 In the baseline OLS, the parameter of interest would be the average effect of increasing YSM:
[ ]( ) ( ) |f f f
E Grade YSM YSM Grade YSM X+ ∆ − , while in the local marginal effects approach, it would be the average effect
of increasing time since arrival at a given margin : [ ]( ) ( ) | , ,f f f f m
E Grade YSM YSM Grade YSM YSM YSM X+ ∆ − . 23 In practice, when we estimate local marginal effects, we base the computations on separate regressions for each specific cell. For example, in order to estimate the impact of having a mother with 5-9 YSM compared to only 0-4 YSM, we would run the regression for the subsample including mothers with YSM equal to 0-4 and 5-9 years combined with fathers having YSM equal to 0-4 years. 24 It is generally not recommendable to condition on post-treatment variables such as education and labour market outcomes of the parents (see Rosenbaum, 1984). 25 Whether or not X should include the other parent’s YSM (t and s) is debatable. We know from Table 1 that the two variables are correlated, and the other parent’s YSM may in fact be affected by the treatment variable if, for instance, the migration decision is joint as it is for tied movers. No obvious answer can be given to this question, and therefore we experiment with different combinations of each of the parent’s treatment and control variables. 26 Because age at birth ≡ age at arrival + YSM at child birth. 27 In practice, the variable of main interest is of course divided into a number of categories depending on the amount of data available, and whether these categories are narrow enough to satisfy the assumption is not immediately testable.

14
variables influencing the more fundamental decision on whether to import a spouse or not (such as education and labour market attachment).
3.3 Sibling-fixed effects Even though we control for many predetermined parental characteristics that might influence both parental years since migration and children’s outcomes (e.g. country of origin, parental education), the estimate of β might still be biased due to the correlation between YSM and unobserved family characteristics (�). If
parents in adjacent categories differ systematically with respect to unobserved characteristics like parental taste for education, competence, or interest in their children’s well-being, this would bias the results of the local marginal effects specification. Thus, we pursue an alternative approach that exploits the observation that the latent family factors associated with parents’ migration and birth timing choices are sibling-invariant.
The sibling approach can be motivated by the presence of self-selection in the migration and birth timing decisions. Concerning our variable of interest (years since migration of parents), two choices are involved: the choice of when to migrate and when to have a child. For parents who came to Denmark as childhood migrants, the choice of when to migrate was that of their parents (i.e. the grandparents of our second-generation pupils). However, as laid out in Böhlmark (2008), if their parents’ choice of when to migrate (i.e. while the children are still young or later28) is related to their taste for education, etc., and if that again is transmitted through generations, parental age at arrival is not exogenous to the present generation’s educational outcomes. Moreover, and likely more important, if the decision on when to have a child (after migration) is related to unobserved parental characteristics which also influence children’s educational outcomes, basic OLS estimates are likely to be (upward) biased. Parents who have the insight and the possibility of considering accumulating host country-specific skills before having children are likely to be overrepresented among those who accumulate more “years since migration” before childbirth. These parents are also more likely to possess characteristics that are good for their children’s educational outcomes. The fact that the parents consider the length of time between migration and childbearing (=timing of migration and child bearing) will induce selection bias. Yet, applying the siblings strategy will net out any omitted variables capturing time-invariant/persistent, family-specific characteristics.29 This approach is well suited since the explanatory variable of interest shows much within-family variation at the same time as many of the confounding factors, both observed (like e.g. country of origin) and unobserved (like parental ability), are permanent family characteristics.The fixed effects model can formally be written as:
�������� = �� �� + ������� + � + ��
In this specification, ������includes gender and birth order controls30, while controls at the parents’ level
are omitted, since they are common among siblings and are included in the family-fixed effects term, � ,
which captures both observed and unobserved family characteristics.
Since parents of younger siblings have spent more years in Denmark before having the child than they had when their older children were born, this introduces variation in parents’ YSM for siblings. This reflects the fact that the parents have had more time to integrate when raising their later born children. Thus, 28 For example, if parents with strong concern about their children’s education decide to migrate when the children are young, these children are less likely to be set back in their education. 29Also school effects, since it is likely that siblings attend the same school. 30 Since years since migration and birth order are correlated within the family, and older siblings tend to do better than their younger brothers and sisters (Black et al. 2005), we include birth order controls.

15
identification of β relies upon the sibling variation in parental years since migration at the child’s birth (i.e. birth timing after migration). The coefficient vector would then not be subject to any bias due to the influence from unobservables captured in the fixed effects that are also associated with educational outcomes. Hereby we can handle the impact of unobserved family characteristics which may be correlated with parents’ years since migration.
To sum up, the identifying assumption for our baseline OLS specification is that, conditional on observables, it is random how many years the parent spends in the country before having a child. The less restrictive identifying assumption for the derived local marginal effects is that, conditional on observables, it is random whether the parent spends a few more or a few less years in the country before deciding to have a child. This approach clearly implies that we can only address marginal effects stemming from local variations in the years since migration. The identifying assumption for our sibling-fixed effects model is that the most important omitted parental influences are time-invariant family-specific characteristics that are netted out by a sibling-fixed effect. There is no reason to believe that the estimates from the three steps should give identical or directly comparable results, because the sibling-fixed effects model exploits within-family variation, whereas the baseline OLS captures the total within- and between-family variation, and the local marginal effects only exploit local variation.
4. Results
In this section, we present the results from estimations of the impact of parents’ years since migration on educational outcomes in form 9. In the first subsection, we present the main results showing the effect on grades in Danish. In the second subsection, we investigate the effect of years since migration on three further outcomes: math grades, drop-out and whether the pupil takes the exam or not. Then we investigate heterogeneity by focusing on particular subgroups, and, finally, we perform a range of robustness checks.
4.1 The effect of years since migration on grades in Danish
4.1.1 Baseline: Basic OLS Before turning to the main results, we first ascertain that the conditioning set actually explains some of the variation in grades and years since migration. Therefore, in appendix Table A2, we present the full set of regression results including estimated parameters for the set of two times four indicator variables measuring the father’s and mother’s years since migration as well as the conditioning variables.31 In Table 3, we present results for the parameters of main interest. The results of the basic OLS regressions in column (1) show the effect on the exam grade in Danish of a change in years since migration conditional on partner’s years since migration compared to the reference category (0-4 years).32 The general picture is that children whose parents have spent a longer time in the host country do better in the Danish exam. Moreover, the coefficient to medium- and long-term stay of mothers is about twice as large as for fathers. The size of
31 The exact parameter estimates are not commented on because these variables account for selection, and thus the coefficients reflect the combined effect on years since migration and grades. 32 We have to condition on age at migration, because otherwise variation in years since migration would stem from variation in age at migration, which would drive the estimated coefficient to the variable years since migration to zero.

16
the coefficients suggests that pupils with a long-term resident mother (more than 14 years) have grades that are about 0.2 standard deviations higher compared to pupils with a recently arrived mother (0-4 years), while the same difference is only about half that size if we look at father’s years since migration instead.33
Table 3. Basic OLS, local marginal effects34 and sibling-fixed effects of YSM on exam grades in Danish
4.1.2 Local marginal effects Column (2), Table 3, shows local marginal effects, i.e. the effect of a change in years since migration from one category to the subsequent category conditional on keeping the partner’s years since migration fixed at 0-4 years and conditional on other background characteristics. We base the computations on separate regressions for each specific cell. For example, for estimating the first coefficient (0.021) in column (2), we would run the regression for the subsample of pupils who have a mother with YSM equal to 0-4 or 5-9 years and a father with YSM equal to 0-4 years. The coefficient estimate reported in the table then gives the impact on children’s Danish grades of having a mother who has stayed in Denmark 5-9 years rather than only up to 4 years (when the father is a recent arriver with YSM equal to 0-4 years). The upper part of column (2) shows the marginal effect of the mother’s years since migration conditional on the father’s years since migration, and vice versa for the lower part.
33 In section 4.4, we also estimate similar models as in column (1), but without the partner’s years since migration included. The results are basically unchanged. 34 Local marginal effects are estimated in six subsample regressions. LM-effects for mother’s YSM are estimated keeping father’s YSM constant at 0-4 and 14+ years and vice versa for the effect of mother’s YSM. Each coefficient estimates the marginal effect compared to the adjoining (lower) category.
Basic OLSLocal marginal
effects
(1) (2) (3) (4)
5-9 0.035(*) 0.021 0.027 (0.018) (0.045) (0.026)
10-13 0.101*** 0.136* 0.059
(0.025) (0.055) (0.048)
14+ 0.192*** 0.146* 0.110(*)
(0.029) (0.064) (0.067)
5-9 0.041* 0.030 0.024 (0.017) (0.026) (0.028)
10-13 0.043(*) 0.027 0.038
(0.025) (0.034) (0.047)
14+ 0.114*** 0.071(*) 0.031
(0.026) (0.041) (0.062) N (students) 19251 1441-7028 10646 10646N(families) 4803 4803
adj. R 2 0.151 0.093-0.174 0.481 0.481Standard errors in parentheses. (*) p < .10, * p < .05, ** p < .01, *** p < .001
Controls included in columns (1)&(2) include: country of origin, home country education, older siblings born in home country,
age at arrival of father and mother; gender, firstborn. In columns (3) & (4), controls include only gender and firstborn.
Mot
her:
yea
rs
sinc
e m
igra
tion
Fat
her:
yea
rs
sinc
e m
igra
tion
Sibling fixed effects

17
As the results show, the effect of the mother switching from one YSM category to the next YSM category is significant, positive and quite large for the upper two margins: an increase in mother’s YSM from 5-9 years to 10-13 years increases children’s grade in Danish by 0.136 SD, and increasing it further from 10-13 to 14 or more years adds another 0.146 SD to the Danish grade. While there is a substantial additional impact for mother’s years since migration when going from one category of years since migration to the next, there seems to be little impact of having a father who spent more years in Denmark before the child was born. Only at the highest margin, i.e. switching from 10-13 to more than 14 years, there seems to be a (marginally) significant effect (0.071 SD). 4.1.3 Sibling-fixed effects results While the basic OLS results above control for observable predetermined characteristics, and the local marginal effects approach reduces some of the bias caused byunobservables by comparing similar subgroups, as discussed above, we might still be concerned that remaining family-specific unobservables bias the results. Therefore, in this section, we use the multi-child sample to estimate a sibling-fixed effects model to rid the results of bias caused bypermanent family characteristics.
An issue when estimating sibling-fixed effects models is that we can only use a subsample of the original sample, i.e. children in families with at least two second-generation children, who graduated from form 9 in the 8-year period of 2002-09 . This reduces the sample from about 20,000 to 12,000 children. Due to the non-random reduction of the sample where only children are omitted, we want to make sure that reducing the sample does not substantially change the results. Table A3 presents results of the main basic OLS specification (col. (1), Tb. 3) for the multi-child sample. A comparison with the full sample results suggests that, in spite of the coefficients in the siblings sample being less precisely estimated due to the smaller sample size, the point estimates are similar. Thus, we are confident that potential differences between the sibling-fixed effects results and the previous results are not driven by differences between the multi-child sample and the full population.
Columns (3) and (4) of Table 3 show results from the sibling-fixed effects specifications. With sibling-fixed effects, we cannot enter father’s and mother’s years since migration in the same equation, since the difference between father’s and mother’s years since migration does not vary between siblings. Therefore, the results in Table 4 are obtained by estimating two sets of regressions: one including mother’s YSM only, and one for father’s YSM alone. The only controls included in the siblings-fixed effects specification are pupil’s gender and an indicator for firstborns. Obviously, controls at the family level are omitted, since they are captured by the fixed effect.
The results for mother’s YSM in Table 3 show that the point estimates are roughly half the size of the basic OLS estimates: having a long-term resident mother compared to a recent arriver increases Danish exam grades by about 0.1 SD. Yet, since standard errors have approximately doubled in size, most likely due to the smaller sample size, but also due to the within-family estimation method which tends to introduce more noise (measurement error), the sibling-fixed effects estimates are rather imprecisely estimated. Fixed effects point estimates for father’s years since migration are small, also for long-term resident fathers, and not significant.
Thus, we cautiously conclude that there is evidence that the more years a mother has spent in the host country before her child is born the better exam grades in Danish does the child achieve. There is no evidence of a similar impact of YSM for the father.

18
The fact that sibling-fixed effects results are smaller (closer to zero) than OLS results confirms our prior that latent unobserved family-level characteristics (like lower ability) are related to having a child fewer years after migration as well as to lower exam grades. Thus, the fixed effects estimation changes the OLS results in the expected direction.
4.2 Additional outcomes: the effect of years since migration on math grades, drop-out and no exam In this section, we present results on the effect of years since migration on three additional outcomes: math grades, drop-out and whether the pupil takes the exam or not.
Table 4: Results on effects of YSM on math exam grades
Math
Table 4 presents results from basic OLS, local marginal effects and sibling-fixed effects for grades in the math exam. The basic OLS results suggest that in particular father’s years since migration are strongly associated with results in math. Pupils with a long-term resident father have 0.15 standard deviations higher math grades compared to pupils with a recently arrived father, while the same number for mother’s years since migration is only 0.10 SD. Moreover, for mothers, only long-term residency is significantly associated with children’s math grades, while already a short-term residency of fathers (5-9 years) is related to higher math grades. Local marginal effects are positive and (marginally) significant at four out of six margins. Somewhat surprisingly, switching YSM of the mother from 0-4 to 5-9 years is negative and marginally significant.
Basic OLS Local marginal effects
(1) (2) (3) (4)
5-9 -0.023 -0.098(*) 0.025 (0.020) (0.051) (0.030)
10-13 0.023 0.148* 0.057 (0.028) (0.066) (0.056)
14+ 0.098** 0.143(*) 0.061 (0.033) (0.074) (0.077)
5-9 0.064** 0.078** -0.003 (0.020) (0.029) (0.032)
10-13 0.077** 0.000 0.095(*) (0.028) (0.038) (0.054)
14+ 0.148*** 0.094* 0.142* (0.029) (0.047) (0.072)
Controls
N (students) 18935 1420-6902 10410 10410N(families) 4705 4705
adj. R 2 0.133 0.074-0.160 0.457 0.457
Standard errors in parentheses. (*) p < .10, * p < .05, ** p < .01, *** p < .001
Mot
her:
yea
rs
sinc
e m
igra
tion
Fat
her:
year
s si
nce
mig
ratio
n
Country of origin, home country education, older siblings born in home country; Gender, firstborn; age at arrival of father and mother
Sibling fixed effects
Firstborn & gender

19
When controlling for permanent family characteristics in the sibling-fixed effects specification, only father’s YSM seems to matter for Math achievement. Having a medium- or long-term resident father increases math scores by 0.10 and 0.14 SD, respectively. Drop-out and no exam
With the previous outcomes (exam grades), we focused on individuals who actually took part in the exit exam after form 9. However, as mentioned earlier, around 9% are not present at this exam – either because they choose not to sit the exam or because they drop out before the end of school (see Figure 5). In the following, we investigate whether YSM influences whether an individual drops out or does not take the exam.
Tables 5 and 6 show results on effects of YSM on drop-out and no exam. Drop-out and No exam are binary variables that are coded 1 if the pupil drops out. Thus, negative coefficients on YSM signify that longer residency of a parent in Denmark is decreasing drop-out / no exam probabilities.
Table 5: Results on effects of YSM on drop out
Table 5 shows results for drop-out from our three different models. The basic OLS results (col. 1) suggest that only father’s years since migration are important for the drop-out decision. Having a father who has spent 10 years or more in Denmark before the birth of the child decreases the drop-out probability by 2 percentage points (out of an average of 9%) compared to having a newly immigrated father.
Basic OLS Local marginal effects
(1) (2) (3) (4)
5-9 0.001 -0.006 -0.014 (0.006) (0.015) (0.012)
10-13 0.001 -0.033 (*) -0.017 (0.008) (0.020) (0.022)
14+ -0.015 -0.022 -0.066* (0.010) (0.023) (0.032)
5-9 -0.007 -0.007 -0.026* (0.006) (0.009) (0.013)
10-13 -0.019* -0.004 -0.045* (0.008) (0.012) (0.021)
14+ -0.021* -0.014 -0.018 (0.009) (0.014) (0.029)
ControlsFirstborn &
genderFirstborn &
gender
N (students) 17413 1397-6184 9316 9316N(families) 4251 4251
adj. R 2 0.015 0.002-0.030 0.168 0.168Standard errors in parentheses. (*) p < .10, * p < .05, ** p < .01, *** p < .001
Sibling fixed effects
Mot
her:
yea
rs
sinc
e m
igra
tion
Fat
her:
yea
rs
sinc
e m
igra
tion
Country of origin, home country education, older siblings born in home country; Gender, firstborn; age at arrival of father and mother

20
Results based on local marginal effects (col. 2) suggest that when the father is a recent arriver (YSM: 0-4 years), having a mother who has spent 10-13 years in the country as compared to only 5-9 years decreases dropping out by 3 percentage points. Effects at the other margins are not significant. The sibling-fixed effects, which control for time-invariant observed and unobserved differences at the family level, show that long-term residency of the mother strongly decreases drop-out probabilities (6.6 percentage points). This effect size seems enormous, but must be seen within the special limited sample of families and pupils that contributes to estimating the coefficients. Average drop-out rates within this sample are much higher, since each family must have experienced drop-out by at least one of their children to be included in the sample. All in all, out of 4,251 families, only 592 families have variation in the drop-out variable. And thus, only these 592 families (1,438 students) contribute to estimating the coefficients. The drop-out rate in this subsample is 46%. Thus, the effect of 6.6 percentage points found by using sibling-fixed effects should be compared to an average drop-out rate in this specific sample of 46% rather than to the average drop-out rate in the sibling sample (for 2002-2009) of 8%. Interestingly, while only long-term residency (14+ years) of the mother seems to matter for drop-out compared to short term (0-4 years), medium-term stay (5-9 and in particular 10-13 years) of the father is related to lower drop-out , while long-term residency is not. The effect sizes of 2.6 and 4.5 percentage points should again be compared to the drop-out rate of 46% in the particular sample which contributes to the estimation of the coefficients.
Table 6: Results on effects of YSM on no exam
Basic OLS Local marginal effects
(1) (2) (3) (4)
5-9 -0.001 -0.021* -0.004 (0.004) (0.010) (0.008)
10-13 -0.004 0.004 0.002 (0.005) (0.012) (0.014)
14+ -0.013* 0.018 -0.011 (0.006) (0.015) (0.020)
5-9 -0.003 -0.002 -0.013 (0.004) (0.006) (0.008)
10-13 -0.003 -0.003 -0.031* (0.005) (0.007) (0.014)
14+ -0.010(*) -0.014 -0.051** (0.006) (0.009) (0.018)
ControlsFirstborn &
genderFirstborn &
gender
N (students) 21154 1599-7680 12393 12393N(families) 5577 5577
adj. R 2 0.008 0.001-0.029 0.065 0.066
Standard errors in parentheses. (*) p < .10, * p < .05, ** p < .01, *** p < .001
Sibling fixed effects
Mot
her:
yea
rs
sinc
e m
igra
tion
Fat
her:
yea
rs
sinc
e m
igra
tion
Country of origin, home country education, older siblings born in home country; Gender, firstborn; age at arrival of father and mother

21
Table 6 presents results for the No exam outcome. The basic OLS results (col. 1) suggest that long-term residency of both fathers and mothers is associated with the no exam decision. Results based on local marginal effects (col. 2) suggest that having a mother who has spent 5-9 years in the country as compared to only 0-4 years decreases the probability of not taking the exam by 2.1 percentage points.35 Effects at other margins are not significant. Results from estimation with sibling-fixed effects (col. 3 and 4) show that only father’s YSM is important for No exam: having a father who has 10 or more YSM compared to recent arrivers decreases the no exam probability by 3.1-5.1 percentage points. These estimate sizes should be compared to a mean No exam rate of 43% in this particular set of students and families who contribute to the estimation.36 4.3 Heterogeneity Now we investigate whether the estimated effects of parents’ years since migration are heterogeneous across subgroups. In Tables 7-8, we present results from separate regressions for boys and girls.
35 Remember that this is conditional on the father being a recent arriver (YSM: 0-4 years). 36 1,054 students in 434 families actually contribute to estimating the coefficients on No exam.
22
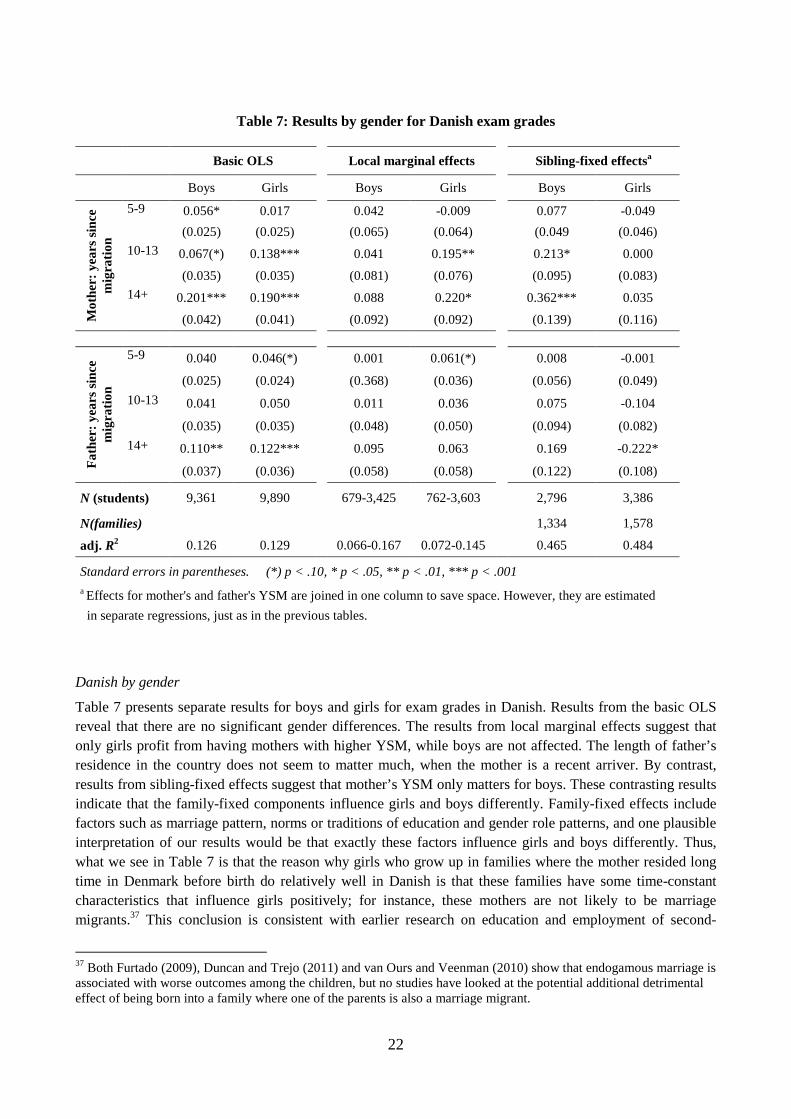
Table 7: Results by gender for Danish exam grades
Basic OLS
Local marginal effects Sibling-fixed effectsa
Boys Girls
Boys Girls
Boys Girls
Mot
her:
yea
rs s
ince
m
igra
tion
5-9 0.056* 0.017
0.042 -0.009
0.077 -0.049 (0.025) (0.025)
(0.065) (0.064)
(0.049 (0.046)
10-13 0.067(*) 0.138***
0.041 0.195**
0.213* 0.000
(0.035) (0.035)
(0.081) (0.076)
(0.095) (0.083)
14+ 0.201*** 0.190***
0.088 0.220*
0.362*** 0.035
(0.042) (0.041)
(0.092) (0.092)
(0.139) (0.116)
Fat
her:
yea
rs s
ince
m
igra
tion
5-9 0.040 0.046(*)
0.001 0.061(*)
0.008 -0.001
(0.025) (0.024)
(0.368) (0.036)
(0.056) (0.049)
10-13 0.041 0.050
0.011 0.036
0.075 -0.104
(0.035) (0.035)
(0.048) (0.050)
(0.094) (0.082)
14+ 0.110** 0.122***
0.095 0.063
0.169 -0.222*
(0.037) (0.036)
(0.058) (0.058)
(0.122) (0.108)
N (students) 9,361 9,890
679-3,425 762-3,603
2,796 3,386
N(families) 1,334 1,578
adj. R2 0.126 0.129
0.066-0.167 0.072-0.145
0.465 0.484
Standard errors in parentheses. (*) p < .10, * p < .05, ** p < .01, *** p < .001 a Effects for mother's and father's YSM are joined in one column to save space. However, they are estimated
in separate regressions, just as in the previous tables.
Danish by gender
Table 7 presents separate results for boys and girls for exam grades in Danish. Results from the basic OLS reveal that there are no significant gender differences. The results from local marginal effects suggest that only girls profit from having mothers with higher YSM, while boys are not affected. The length of father’s residence in the country does not seem to matter much, when the mother is a recent arriver. By contrast, results from sibling-fixed effects suggest that mother’s YSM only matters for boys. These contrasting results indicate that the family-fixed components influence girls and boys differently. Family-fixed effects include factors such as marriage pattern, norms or traditions of education and gender role patterns, and one plausible interpretation of our results would be that exactly these factors influence girls and boys differently. Thus, what we see in Table 7 is that the reason why girls who grow up in families where the mother resided long time in Denmark before birth do relatively well in Danish is that these families have some time-constant characteristics that influence girls positively; for instance, these mothers are not likely to be marriage migrants.37 This conclusion is consistent with earlier research on education and employment of second-
37 Both Furtado (2009), Duncan and Trejo (2011) and van Ours and Veenman (2010) show that endogamous marriage is associated with worse outcomes among the children, but no studies have looked at the potential additional detrimental effect of being born into a family where one of the parents is also a marriage migrant.

23
generation immigrants in Denmark.38 When it comes to boys, within-family variation suggests that boy siblings gain from their mother having stayed longer in Denmark before birth. The effect sizes are rather large: having a long-term resident mother as compared to a recent arriver increases boys’ Danish exam grades by 0.36 SD. There is not much evidence that father’s years since migration aid performance of boys or girls. In fact, having a long-term resident father seems to be detrimental to girls’ results in Danish relative to having a recent arriver, which could also be interpreted in line with the previous arguments regarding norms and attitudes.
Math by gender
Table 8 presents separate results for boys and girls for exam grades in math. Basic OLS results suggest that in particular long-term residence in Denmark of both parents matters for boys. For girls, fathers’ YSM matters at all margins, while mothers’ YSM does not – mothers’ YSM of 5-9 years is even marginally detrimental to girls’ math scores compared to YSM of 0-4 years.
Results for local marginal effects suggest that only one of six estimates is significant for boys: having a long-term resident father as compared to a father who has spent only 10-13 years in Denmark before childbirth increases boys’ math grades by 0.15 SD. For girls, the negative and significant estimate echoes the result from basic OLS: (when the father is a recent arriver) mothers’ YSM of 5-9 years is detrimental to girls’ math scores compared to YSM of 0-4 years. The estimate is four times the size of the basic OLS estimate and is highly significant. Thus, the detrimental effect seems to be accentuated for girls with recently arrived fathers (as compared to basic OLS, which is estimated on the entire sample). Moreover, having a long-term resident mother or having a father, who is (also) not a recent arriver in the country, but has been a resident for 5-9 years, improves girls’ math grades by 0.28 SD and 0.10 SD, respectively.
Sibling-fixed effects by gender are generally not significant. Like for Danish grades, this indicates that family-fixed effects are important for educational outcomes. In particular, we see that the positive impact of mothers on girls is driven by between-family variation, meaning that some families for example have norms in favor of supporting education while others have not. However, since the sibling-fixed effects are not precisely estimated, the differences across approaches are generally not statistically significant.
38 See e.g. Nielsen, Smith and Celikaksoy (2009) and Nielsen, Rosholm, Smith and Husted (2003).

24
Table 8: Results by gender for Math exam grades
Basic OLS
Local marginal effects Sibling fixed effectsa
Boys Girls
Boys Girls Boys Girls
Mot
her:
yea
rs s
ince
m
igra
tion
5-9 0.012 -0.050(*)
0.016 -0.204** 0.016 -0.008 (0.029) (0.028)
(0.076) (0.071) (0.058) (0.053)
10-13 0.048 0.006
0.112 0.146 0.195(*) 0.099
(0.041) (0.039)
(0.101) (0.091) (0.113) (0.095)
14+ 0.139** 0.066
0.019 0.276* -0.006 0.046
(0.048) (0.045)
(0.105) (0.108) (0.164) (0.133)
Fat
her:
yea
rs s
ince
m
igra
tion
5-9 0.053(*) 0.075**
0.059 0.098* -0.054 0.055
(0.029) (0.027)
(0.042) (0.040) (0.066) (0.056)
10-13 0.053 0.099*
-0.030 0.016 0.043 0.084
(0.041) (0.039)
(0.054) (0.055) (0.110) (0.094)
14+ 0.144*** 0.149***
0.146* 0.065 0.142 0.049
(0.042) (0.041)
(0.068) (0.066) (0.145) (0.123)
N (students) 9237 9698
672-3383 748-3519
2744 3281
N(families) 1310 1531
adj. R2 0.131 0.124
0.069-0.167 0.044-0.142
0.46/0.46 0.46/0.46
Standard errors in parentheses. (*) p < .10, * p < .05, ** p < .01, *** p < .001 a Effects for mother's and father's YSM are joined in one column to save space. However, they are estimated
in separate regressions, just as in the previous tables.
4.4 Robustness A number of robustness checks are performed in order to understand how sensitive the main results are to minor changes in the specifications. In the results section above, we showed results for local marginal effects, when the other partner’s YSM is kept constant at 0-4 years since migration, i.e. for recent arrivers we vary their partner’s YSM. In Table 9, we repeat the results for local marginal effects from Table 3, when we vary the partner’s YSM for parents who have spent 5-9, 10-13 or 14 or more years in Denmark. The general picture is that local marginal changes at the upper margin matter only when the partner is a recent arriver or short-term resident (YSM: 5-9). When the partner is a medium-term resident (10-13 years), marginal changes in the other parent’s length of stay do not matter. Remaining results are more mixed. Thus, it is important to stress that our local marginal effects results are valid (only) for the specific subsample of couples, where at least one partner was a recent arriver at the time of childbirth. This particular subsample is

25
relevant because it is the largest (see Table 1), and because it resembles a situation in which one partner is potentially a marriage migrant.
Table 9: Local marginal effects with partner’s YSM kept constant at 0-4, 5-9, 10-13 and 14+ years
(0-4) (5-9) (10-13) (14+)
Mot
her:
yea
rs s
ince
m
igra
tion
5-9 0.021 0.109** 0.010 -0.016 (0.045) (0.035) (0.049) (0.035) 10-13 0.136* -0.038 0.057 0.098* (0.055) (0.074) (0.078) (0.042) 14+ 0.146* 0.173* -0.013 0.027 (0.064) 0.088 0.111 (0.054)
Fat
her:
yea
rs s
ince
m
igra
tion
5-9 0.030 0.165** -0.107 0.105* (0.026) (0.054) (0.074) (0.050) 10-13 0.027 -0.063 0.031 0.050 (0.034) (0.056) (0.105) (0.072) 14+ 0.071(*) 0.105* 0.061 0.052 (0.041) (0.053) (0.089) (0.086)
Table 10: Main results for Danish grades without conditioning on the other partner’s YSM
Local marginal effects
(1) (2) (3)
5-9 0.043* 0.042*(0.018) (0.018)
10-13 0.109*** 0.094***
(0.025) (0.027)
14+ 0.204*** 0.083*
(0.029) (0.033)
5-9 0.042* 0.059**
(0.017) (0.018)
10-13 0.046(*) 0.015
(0.025) (0.025)
14+ 0.130*** 0.090**
(0.026) (0.028)Note: Bold letters indicate significance at a 5%-level while italics indicate significance at a 10%-level.
Controls included: country of origin, home country education, older siblings born in home country,
age at arrival of father and mother; gender, firstborn
Basic OLS
Mot
her:
yea
rs
sinc
e m
igra
tion
Fat
her:
yea
rs
sinc
e m
igra
tion

26
In sections 4.1 and 4.2, we showed results for local marginal effects, when the other partner’s YSM was kept constant at different levels. However, one may argue that parents’ YSM are highly correlated, and therefore, the other parent’s YSM may in fact be affected by the treatment variable if, for instance, the migration decision is taken jointly. Therefore, in Table 10 we present the results without conditioning on the other partner’s years since migration at all. For the Basic OLS specification this means estimating two separate regressions: one including only the set of indicators for mother’s YSM, the second including only father’s YSM. For the Local marginal effects specification this translates into including all fathers in the estimation of marginal effects of mother’s YSM, compared to including only fathers who are recent arrivers (YSM: 0-4 years) as in our main specification.39 Generally, the effects presented in Table 10 show the same patterns as the main results in Table 3. However, local marginal effects are now also significant at the 5-9 years margin.
5. Conclusion
In this paper, we employed register data for eight cohorts of second-generation immigrant pupils to estimate the impact of each parent’s years since migration on second-generation pupils’ achievement. Achievement was measured by exam grades in the school exit exams, drop-out and no exam in form 9.
Second-generation immigrants are all born in the country of destination, but they typically differ by their families’ potential for integration, i.e. their parents’ years since migration, which in turn might affect their own potential for integration and its derived effect on educational outcomes. Therefore, we analysed the effect of parents’ time since migration (before the child’s birth) on children’s educational outcomes at the end of lower secondary education.
We analysed father’s and mother’s years since migration separately, since parents in many cases do not migrate to Denmark jointly (in which case their time since migration varies), and we studied asymmetries in the effects on educational achievement early in the educational career.
To identify the model, we both exploited local variation in years since migration and within-family variation, assuming that variation in parental time since migration/spacing between birth of siblings is random, conditional on observed or unobserved permanent characteristics at the family level.
We find evidence of a positive impact of parents’ years since migration on children’s academic achievement. Our results suggest that the mother’s years since migration are generally most important for grades in Danish, while the father’s years since migration are most important for grades in math and for drop-out and no exam. This emphasizes the importance of our distinction between each parent’s years since migration, which contrasts the approach taken in the earlier literature. When we split the sample by gender, we find that for girls, the mother’s years since migration matters for grades in both Danish and math when we use the local marginal effects approach, and that these effects disappear when we account for sibling-fixed effects. The opposite is seen for boys. This clearly indicates that family-specific effects influence girls and boys differently. A plausible explanation is that family-specific effects include factors that are closely related to norms and attitudes regarding education and gender role patterns, and this is what shows up in the results.
39 Sibling-fixed effects cannot be estimated without implicitly conditioning on the partner’s YSM.

27
References Alba, R. and V. Nee (2003): Remaking the American Mainstream. Assimilation and Contemporary Immigration. Cambridge, MA: Harvard University Press. Alba, R., J. Logan, A. Lutz and B. Stults (2002): Only English by the Third Generation? Loss and Preservation of the Mother Tongue Among the Grandchildren of Contemporary Immigrants. Demography 39(3): 467-484. Åslund, O., A Böhlmark and O. N. Skans (2009), “Age at migration and social integration.” IFAU Working Paper 2009-21, IFAU, Sweden. Behrman, J. R., Y. Cheng and P. E. Todd (2004): Evaluating Preschool Programs when Length of Exposure to the Program Varies: A Nonparametric Approach. Review of Economics and Statistics 86(1): 108-132. Black, S., P. Devereux and K. Salvanes (2005): The More the Merrier? The Effect of Family Size and Birth Order on Children's Education. Quarterly Journal of Economics 120 (2): 669-700. Bleakley, H. and A. Chin (2004): Language Skills and Earnings: Evidence from Childhood Immigrants. Review of Economics and Statistics 86(2): 481-496. Bleakley, H. and A. Chin (2008): What Holds Back the Second Generation? The Intergenerational Transmission of Language Human Capital Among Immigrants. Journal of Human Resources 43(2): 267-298 Bleakley, H. and A. Chin (2010): Age at Arrival, English Proficiency, and Social Assimilation Among U.S. Immigrants. American Economic Journal: Applied Economics 2(1): 165-192. Böhlmark, A. 2008: Age at immigration and school performance: A siblings analysis using Swedish register data. Labour Economics 15(6): 1366-1387. Casey, T. and C. Dustmann (2008): Intergenerational Transmission of Language Capital and Economic Outcomes. Journal of Human Resources 43(3): 660-687. Chiswick, B. and N. DebBurman (2004): Educational Attainment: Analysis by Immigrant Generation. Economics of Education Review 23(4): 361-379. Cortes, K.E., 2006. The Effects of Age at Arrival and Enclave Schools on the Academic Performance of Immigrant Children. Economics of Education Review 25 (2), 121–132. Cosden, M., J. Zimmer, C. Reyes and M. del Rosario Gutierrez (1995): Kindergarten Practices and First Grade Achievement for Latino Spanish-speaking, Latino English-speaking and Anglo Students. Journal of School Psychology 33: 123–141. Datta Gupta, N. and M. Simonsen, (2010), Non-cognitive child outcomes and universal high quality child care. Journal of Public Economics 94:30.43. Duncan, B. and S. J. Trejo (2011): Intermarriage and the Intergenerational Transmission of Ethnic Identity and Human Capital for Mexican Americans. Forthcoming Journal of Labor Economics. Furtado, D., (2009): Cross-nativity marriages and human capital levels of children. Research in Labor Economics 29: 273-296.

28
Gonzalez, A. (2003). The education and wages of immigrant children: the impact of age at arrival. Economics of Education Review 22, 203–212. Leigh, A. and X. Gong (2010): Does Maternal Age Affect Children’s Test Scores? Australian Economic Review 43(1):12–27. Nielsen, H. S., M Rosholm, N. Smith and L. Husted (2003): The School-to-Work Transition of 2nd Generation Immigrants in Denmark. Journal of Population Economics 16: 755-786. Nielsen, H. S., N. Smith and A. Celikaksoy (2009): The Effect of Marriage on Education of Immigrants: Evidence from a Policy Reform Restricting Marriage Migration. Scandinavian Journal of Economics 111(3): 457-486. OECD (2010): PISA 2009 results. What Students Know and Can Do: Student Performance in Reading, Mathematics and Science. OECD, Paris. Rosenbaum, P. R. (1984): The Consequences of Adjustment for a Concomitant Variable That Has Been Affected by the Treatment. Journal of the Royal Statistical Society: Series A. 147 (5) 656-666. Schaafsma, J. and A. Sweetman (2001): Immigrant Earnings: Age at Immigration Matters. Canadian Journal of Economics 34(4): 1066-99. Schnepf, S. V. (2007): Immigrants’ Educational Disadvantage: An Examination across Ten Countries and Three Surveys. Journal of Population Economics 20: 527-545. Turley, R.N. T. (2003): Are Children of Young Mothers Disadvantaged Because of Their Mother’s Age or Family Background? Child Development 74/2: 465-474. UNI-C (2011), Grundskolekarakterer: Prøvetermin 2009/10. UNI-C Statistik og Analyse. Van Ours, J.C. and J. Veenman (2006): Age at Immigration and Educational Attainment of Young Immigrants. Economics Letters 90: 310–316. Van Ours, J.C. and J. Veenman (2010): How Interethnic Marriages Affect the Educational Attainment of Children: Evidence from a Natural Experiment. Labour Economics 17:111-117.

29
APPENDIX
Table A1: Subject-specific grades by cohort for second-generation pupils
2002 2003 2004 2005 2006 2007 2008 2009
Danish Written Mean 7.28 7.28 7.25 7.24 7.28 7.39 4.97 4.01SD 1.41 1.31 1.28 1.34 1.34 1.30 2.72 2.71#obs 1339 1693 1882 2278 2301 2772 3089 3379
Spelling Mean 7.38 7.20 7.28 7.14 7.02 7.41 4.47 4.09SD 1.54 1.53 1.37 1.48 1.47 1.59 2.80 2.83#obs 1343 1699 1882 2291 2315 2779 3103 3392
Mean: Written&spelling Mean 7.32 7.23 7.26 7.18 7.15 7.40 4.70 4.03SD 1.35 1.30 1.22 1.29 1.29 1.32 2.51 2.51#obs 1349 1704 1893 2298 2318 2793 3131 3419
Oral Mean 7.81 7.77 7.75 7.79 7.76 7.70 5.70 5.76SD 1.69 1.67 1.70 1.71 1.71 1.78 3.55 3.56#obs 1324 1681 1869 2275 2290 2747 3049 3332
Math Written Mean 6.76 6.93 6.84 6.70 6.87SD 1.76 1.59 1.68 1.67 1.69#obs 1319 1684 1863 2254 2261
Problem solving (written) Mean 6.86 4.12 4.76SD 1.82 3.38 3.30#obs 2742 3088 3375
Mathematical skills (written) Mean 7.60 5.25 6.14SD 1.66 3.50 3.38#obs 2754 3085 3384
Mean: Written exams Mean 6.76 6.93 6.84 6.70 6.87 7.23 4.685.45SD 1.76 1.59 1.68 1.67 1.69 1.66 3.28 3.17#obs 1319 1684 1863 2254 2261 2754 3094 3385
Oral Mean 7.73 7.59 7.51 7.47 7.40SD 1.67 1.69 1.66 1.66 1.81#obs 1282 1662 1851 2225 2223

30
Figure A1: Distribution of parents’ year of arrival
Note: The leftmost columns in the figures are accumulated number of fathers and mothers who immigrated before 1973,
because immigration date has not been registered in Danish statistics before 1973.
Table A2: Full results table
0
1000
2000
3000
4000
5000
19
73
19
74
19
75
19
76
19
77
19
78
19
79
19
80
19
81
19
82
19
83
19
84
19
85
19
86
19
87
19
88
19
89
19
90
19
91
19
92
19
93
19
94
19
95
19
96
Father
0
1000
2000
3000
4000
5000
19
73
19
74
19
75
19
76
19
77
19
78
19
79
19
80
19
81
19
82
19
83
19
84
19
85
19
86
19
87
19
88
19
89
19
90
19
91
19
92
19
93
19
94
19
95
19
96
Mother
0-4
5-9 -0.012 (0.017) -0.011 (0.017) -0.009 (0.017) -0.002 (0.017) 0.035(*) (0.018)
10-13 0.032 (0.022) 0.042(*) (0.024) 0.046(*) (0.024) 0.056* (0.024) 0.101*** (0.025)
14+ 0.089*** (0.019) 0.133*** (0.029) 0.129*** (0.029) 0.148*** (0.029) 0.192*** (0.029)
0-4
5-9 0.024 (0.017) 0.037* (0.017) 0.038* (0.017) 0.020 (0.017) 0.041* (0.017)
10-13 -0.019 (0.022) 0.011 (0.025) 0.014 (0.024) 0.007 (0.024) 0.043(*) (0.025)
14+ 0.010 (0.018) 0.092*** (0.026) 0.085*** (0.025) 0.080** (0.025) 0.114*** (0.026)
Mother 0.002 (0.001) 0.001 (0.001) 0.006*** (0.002) 0.007*** (0.002)
Father 0.005** (0.001) 0.003* (0.001) 0.005*** (0.001) 0.006*** (0.001)
Lower secondary education
Vocational training 0.183*** (0.037) 0.166*** (0.037) 0.164*** (0.037)
High school 0.195*** (0.039) 0.174*** (0.039) 0.170*** (0.039)
Short cycle higher education 0.118 (0.077) 0.095 (0.077) 0.089 (0.077)
Medium cycle higher education 0.310*** (0.065) 0.282*** (0.065) 0.272*** (0.065)
Long cycle higher education 0.286** (0.093) 0.248** (0.093) 0.243** (0.093)
Lower secondary education
Vocational training 0.031 (0.034) 0.026 (0.034) 0.023 (0.034)
High school 0.199*** (0.045) 0.192*** (0.045) 0.185*** (0.045)
Short cycle higher education 0.092 (0.060) 0.094 (0.059) 0.087 (0.059)
Medium cycle higher education 0.156* (0.061) 0.149* (0.061) 0.144* (0.061)
Long cycle higher education 0.291*** (0.070) 0.284*** (0.070) 0.279*** (0.069)
Older siblings born in home country (0/1) -0.172*** (0.018) -0.111*** (0.020)
Firstborn child 0.122*** (0.016)
N
adj. R2
Standard errors in parentheses. (*) p<.10, * p<.05, ** p<.01, *** p<.001
(1) (2) (3) (4) (5)
0.13519251 19251 19251 192510.137 0.144 0.148 0.151
19251
Father's (highest) education
(Reference)
(Reference)
Father: years since migration
Mother: years since migration
(Reference)
(Reference)
Age-at-arrival
Mother's (highest) education

31
Table A3: Basic OLS results in the multi-child and the full sample
Multi-child sample Full sample
Mother: years since migration
5-9 0.014
0.035(*)
(0.022)
(0.018)
10-13 0.127***
0.101***
(0.033)
(0.025)
14+ 0.211***
0.192***
(0.039)
(0.029)
Father: years since migration
5-9 0.036
0.041*
(0.023)
(0.017)
10-13 0.045
0.043(*)
(0.032)
(0.025)
14+ 0.141***
0.114***
(0.035)
(0.026)
N(students) 10646
19251
N(families) 4803
adj. R2 0.137 0.151
Standard errors in parentheses. (*) p < .10, * p < .05, ** p < .01, *** p < .001
Related Documents