Working Paper No. 2018-02 Rahul Ahluwalia Brookings Institution India Center The Impact of Labor Regulations on Jobs and Wages in India: Evidence from a Natural Experiment Abstract: In this paper we examine the impact of India's labor regulations on employment and wages through the lens of the apparel and textiles industry, India’s largest manufacturing employer. In addi- tion to exploiting cross-state variation in labor regulations, we take advantage of the 2005 abolition of quota restrictions on developing countries’ exports of apparel and textiles products to the developed world and use this as a natural experiment to identify the effects of labor regulations. Employing a difference-in-difference strategy, we find economically and statistically significant gains in post-2005 employment and wage in the apparel and textiles industry in states that maintained more flexible labor regulations as compared to states with inflexible regulations. These gains are either absent or muted in the case of labor intensive industries other than apparel and textiles. Rana Hasan Asian Development Bank Mudit Kapoor Indian Statistical Institute (ISI) Arvind Panagariya Columbia University

Welcome message from author
This document is posted to help you gain knowledge. Please leave a comment to let me know what you think about it! Share it to your friends and learn new things together.
Transcript
Working Paper No. 2018-02
Rahul AhluwaliaBrookings Institution India Center
The Impact of Labor Regulations on Jobs and Wages in India:
Evidence from a Natural Experiment
Abstract: In this paper we examine the impact of India's labor regulations on employment and wages through the lens of the apparel and textiles industry, India’s largest manufacturing employer. In addi-tion to exploiting cross-state variation in labor regulations, we take advantage of the 2005 abolition of quota restrictions on developing countries’ exports of apparel and textiles products to the developed world and use this as a natural experiment to identify the effects of labor regulations. Employing a difference-in-difference strategy, we find economically and statistically significant gains in post-2005 employment and wage in the apparel and textiles industry in states that maintained more flexible labor regulations as compared to states with inflexible regulations. These gains are either absent or muted in the case of labor intensive industries other than apparel and textiles.
Rana HasanAsian Development Bank
Mudit KapoorIndian Statistical Institute (ISI)
Arvind PanagariyaColumbia University
1
The Impact of Labor Regulations on Jobs and Wages in India: Evidence from a Natural Experiment1
Rahul Ahluwalia Brookings Institution India Center
E-mail: [email protected]
Rana Hasan Asian Development Bank E-mail: [email protected]
Mudit Kapoor
Indian Statistical Institute (ISI) E-mail: [email protected]
Arvind Panagariya Columbia University
E-mail: [email protected]
January 14, 2018
Key words: Labor laws, labor market outcomes, economic reforms
Abstract: In this paper we examine the impact of India's labor regulations on employment and wages through the lens of the apparel and textiles industry, India’s largest manufacturing employer. In addition to exploiting cross-state variation in labor regulations, we take advantage of the 2005 abolition of quota restrictions on developing countries’ exports of apparel and textiles products to the developed world and use this as a natural experiment to identify the effects of labor regulations. Employing a difference-in-difference strategy, we find economically and statistically significant gains in post-2005 employment and wage in the apparel and textiles industry in states that maintained more flexible labor regulations as compared to states with inflexible regulations. These gains are either absent or muted in the case of labor intensive industries other than apparel and textiles.
1 We thank Asha Sundaram for helpful discussions and Raginee Baruah for her diligent work on the coding of state-
level labor regulations used in this paper. All errors are ours. The opinions expressed here are those of the authors and do not necessarily reflect the views of the institutions to which they belong.
2
1. Introduction
After three decades of generally low growth, the Indian economy experienced a growth acceleration that
started in the 1980s.2 While the acceleration coincided with market oriented economic reforms
undertaken by India, there are two features of India’s growth experience that are puzzling.3 First, unlike
the growth accelerations experienced by its East Asian neighbors, services has been a bigger driver of
India’s growth than manufacturing. This is puzzling since a major component of India’s economic
reforms included industrial deregulation and the liberalization of the trade policy regime as it applied to
the manufacturing sector.4 While a part of services growth has been driven by these manufacturing-
centered reforms through both input-output linkages as well as demand side linkages working through
income effects as demonstrated by the recent work of Dehejia and Panagariya (forthcoming), a larger
response from Indian manufacturing should have been forthcoming. Second, within the manufacturing
subsector, growth has been driven mainly by relatively capital- or skill-intensive industries, and not labor-
intensive industries as one would expect given India’s labor abundance (see Kochhar et al 2006).
Accordingly, the manufacturing sector's contribution to employment in India has thus also been limited,
especially when attention is restricted to the formal sector, where labor productivity and wages tend to be
considerably higher than the informal sector and which has played an important role in generating “good”
jobs in East and Southeast Asian economies.5
Various factors have been put forward for explaining one or both features of India’s growth experience.
These include deficiencies in India’s infrastructure, especially in energy and transport; labor regulations,
2 Growth in GDP per capita, only 1.3% annually from the 1950s through 1970s, increased steadily—from average
annual growth rates of 2.4% in the 1980s, to 3.6% in the 1990s, and 5.7% in the decade that just ended. 3 The exact timing of India's growth acceleration and its causes are the subject of debate. For example, while
Rodrik and Subramiam (2005) have emphasized "pro-business" reforms of the early 1980s, and thus downplayed the importance of the dramatic trade liberalization and industrial policy delicensing that took place in 1991, Panagariya (2008) shows that unsustainable increases in public expenditures and foreign borrowings were important drivers of growth in the 1980s, and thus that without the reforms of 1991, India's growth acceleration of the 1980s would have proved to be short-lived.
4 The key element of industrial deregulation involved the dismantling of the industrial licensing regime, or “industrial delicensing”. Under the Industries Development and Regulatory Act of 1951 every investor over a very small size needed to obtain a license before establishing an industrial plant, adding a new product line to an existing plant, substantially expanding output, or changing a plant’s location. Over time, many economists and policymakers began to view the licensing regime as generating inefficiencies and rigidities that were holding back Indian industry. The process of delicensing started in 1985 with the dismantling of industrial licensing requirements for a group of manufacturing industries. Delicensing reforms accelerated in 1991, and by the late 1990s virtually all industries had been delicensed.
5 See Baruah et al (2015) and ADB (2009) on the comparison of employment and wages across the manufacturing sector of various Asian economies including India, and breakdowns by size/formality.
3
especially those which make it difficult for Indian manufacturing firms operating in the formal sector to
adjust employment levels and service conditions in response to changing economic conditions (e.g.,
Panagariya 2004, Krueger 2007 and Panagariya 2008); the “reservation” of entire product lines,
especially labor-intensive ones, for firms with plant and equipment values below a given threshold; a host
of complex and time-consuming regulations that govern entry and, especially, exit, notwithstanding the
industrial deregulation of the 1980s and 1990s (e.g., OECD, 2007); credit market imperfections that
constrain small and medium-sized firms from expanding (e.g., Banerjee and Duflo 2014); land related
regulations that restrict the availability or increase the cost of land for industrial purposes; limited
availability of skills required for modern manufacturing; and even path dependence or hysteresis—the
argument being that while the reforms of the mid-1980s and early 1990s had removed the most important
policy-based impediments on Indian manufacturing, the relative profitability of capital-and skill-intensive
activities has remained higher than that of labor-intensive activities (Kochhar et al. 2006).
Which of these alternative constraints on the growth of Indian manufacturing firms, and especially
employment growth in the formal sector, really matter? The argument that infrastructure deficits have
adversely affected manufacturing performance is fairly uncontroversial. In contrast, the role of labor
regulations has been much more controversial. While several empirical studies, starting with Besley and
Burgess (2004) and followed by Aghion et al. (2008) and Ahsan and Pages (2007) among others, utilize
cross state and time series variation in India’s labor regulations and find that industrial performance (in
terms of various parameters such as output, employment, and labor productivity) has been weaker in
states with pro-worker labor laws, skeptics have been unconvinced. Concerns have been raised on mainly
three grounds. First, the coding of state-level amendments to labor regulations as pro-worker, neutral, or
pro-employer by these studies has been critiqued (Bhattacharjea 2006). Second, it has been claimed that
the growing use of contract labor in Indian manufacturing has enabled firms to adjust employment levels
quite easily thereby resulting in de-facto flexibility of labor regulations. Third, the results of the studies
noted above have been criticized for inadequately controlling for other factors that may be driving
industrial performance, such as infrastructure or skills, for example, or the role of the policy of reserving
particular product lines for small enterprises.
While some recent work has tried to address these concerns by considering alternative approaches for
capturing state-level variation in labor regulations, exploiting industry-specific characteristics for more
credible identification of the effects of labor regulation, and introducing additional state-level controls to
tackle concerns about omitted variables bias—see, in particular, Dougherty, Robles, and Krishna (2011;
4
DRK) and Gupta, Hasan, and Kumar (2009; GHK)—our paper brings additional evidence to bear on the
role of labor regulations in influencing industrial performance, and employment and wages, in particular,
in India.6 We focus on employment and wages given that India’s success in creating productive and well-
paying jobs may well be central for meeting policymakers’ objective of inclusive growth; and in this
endeavor, India’s formal manufacturing sector may well hold the key.
Specifically, we use plant-level panel data from the Annual Survey of Industry (ASI) for various years
from 1998-99 to 2010-11 to examine the impact of labor regulations on employment and wages in India’s
apparel and textiles sector across states, before-and-after 2005, and relative to other labor-intensive
industries. 7 Like GHK and DRK before us, we address some of the concerns raised about the coding of
state-level labor regulations developed by Besley and Burgess (2004). However, our focus on the apparel
and textiles sector presents some important advantages in uncovering the effects of labor regulations.
First, and most significantly, it allows us to exploit the 2005 abolition of quota restrictions on exports of
apparel and textiles from developing countries to the developed world as a “natural experiment” for
identifying the effects of labor regulation. The quotas had been imposed by the international Multi Fiber
Agreement (MFA) of 1974 and sought to protect developed country producers from growing imports of
apparel products. Under the Agreement on Textile and Clothing (ATC) negotiated in 1994, the quotas
were to be abolished through bilateral negotiations by January 2005 through “phase-outs” in 1995, 1998,
2002 and 2005. The last phase-out was significant. As noted by Harrigan and Barrows (2006 and 2009),
“Like most big importers, the U.S. delayed the bulk of MFA liberalization until literally the last moment,
6 Industrial performance is measured in terms of firm level TFP in the case of DRK and state-wide measures of
output, value-added, and employment at the three digit industry level in the case of GHK. 7 Though, in principle, we could have also looked at the impact of labor regulation on productivity, we do not do so
for several reasons. First, our central interest in this paper is to look at the relationship between regulation and employment in the manufacturing sector, a fundamental policy concern in India. Second, recent literature has highlighted a number of problems with the measurement of productivity when relying on the type of data available to us. As Syverson (2011) notes, and is confirmed in the ASI data, many firms produce more than one output and it is not very clear how to aggregate them into a single measure. Furthermore, output is not measured in terms of quantities but is reported in the data as revenue. As Syverson has argued, if the quality of output differs across firms, the price of firms’ products will vary and the usual strategy of using a price deflator to deflate revenue and arrive at a measure of output will not be desirable. This is because price variations typically reflect differences in market power so that measured productivity levels may not capture how efficient firms are, but market conditions instead. To make matters more complicated there are also measurement issues associated with estimating value added production functions. Similar to the issue associated with using revenue as output measure, intermediate inputs are reported in terms of total expenditures on inputs and not quantities. Hence, it is not very clear how the intermediate inputs should be handled. For all these reasons, we have not analyzed the relationship between regulation and productivity and focus instead on employment, which is perhaps the cleanest measure of a key input available in the data.
5
with hundreds of binding quotas still in place until midnight on December 31 2004.” Accordingly, we
treat our period of analysis which runs from 1998-99 to 2010-11 as consisting of two sub-periods, one in
which the Indian apparel and textile industry was constrained in export markets (prior to January 2005)
and one in which it was not (after January 2005). Since the phase-out of quotas were negotiated
bilaterally (and on a product-by-product basis), splitting our overall sample using 2005 as a cut-off has
the added benefit of mitigating possible endogeneity of quota phase-outs.
Given the apparel sector’s high labor intensity and the relative volatility of demand for its products, the
sector (and thus the textiles sector as well) should be particularly susceptible to regulations that constrain
flexible adjustment of employment levels. By comparing employment and wages across three
dimensions—namely, prior and subsequent to 20058, across states with differing labor regulations, and
with the decisions of manufacturers of other labor-intensive products—the paper provides more robust
evidence on the impact of labor regulations on Indian manufacturing.
Second, the focus on labor-intensive industries allows us to narrow down the set of possible constraints
on manufacturing sector performance, especially employment. For example, potential inadequacies in
skills among production workers are much less likely to be a constraint on the apparel sector than other
manufacturing industries given the speed with which workers with just a primary education can be trained
in carrying out core production related tasks such as sewing (Baruah et al. 2015). Similarly, while many
of the alleged constraints on manufacturing sector performance emphasize the effects of the “heavy-hand”
of government regulation, some researchers have stressed the lack of an effective “industrial policy”
(whereby the government intervenes to correct market failures on account of learning related externalities
and the need to coordinate the investments of disparate private agents to promote the growth of any given
industry) as a factor responsible for the relatively lackluster performance of Indian manufacturing. Given
India’s long history of producing apparel, and the presence in India of every segment of the overall
apparel-textiles supply chain including production of textiles, processing of fabric, and design capabilities
in apparel, arguments for its underperformance based on learning related externalities and coordination
issues carry less weight than sectors such as, say, electronics. Finally, we also control for the local
availability of power supply in our empirical analysis. In this way, we are able to arrive at a more robust
assessment of the effects of labor regulation.
6
Our “difference in difference” estimates indicate that apparel and textiles manufacturers in states with
flexible labor regulations see a statistically significant increase of 12 workers per firms on average
relative to apparel and textiles manufacturers in inflexible states in the post-2005 period. Within flexible
states, employment in the apparel and textiles industry increases relative to other labor-intensive
industries in the post-2005 period. As for wages, these increase in both the apparel and textiles industry
as well as other labor intensive industries in flexible states relative to their counterparts in inflexible states
in the post-2005 period. These results are found to hold up to a variety of robustness checks. Our results
thus lend considerable support to the argument that inflexible labor regulations have acted as a constraint
to the growth of good jobs by limiting the growth of India’s labor-intensive manufacturing industries in
the formal sector.
It may be noted that our use of ASI data to uncover the effects of labor regulation on employment and
wages using the approach just described is appropriate for two reasons. First, the ASI covers
establishments operating in the registered or formal manufacturing sector, where the full force of India’s
labor regulations apply. Second, while there are many apparel and textiles producers that operate in the
informal sector, they operate at very small scales of production. Excluding own-account enterprises —
i.e., microenterprises who do not hire even a single wage employee on a regular basis — 95% of informal
sector apparel enterprises have less than 10 workers (84.5% had 5 or less workers in 2010-11 as noted in
Baruah et al). With the size of orders placed by global purchases of apparel increasing and delivery
times shrinking, it is larger establishments who are best placed to respond to international orders. Thus
the effects of the abolition of the MFA should be seen primarily on firms captured in the ASI data.
Nevertheless, since subcontracting relationships may link informal and formal sector firms, we include
data on the former from the National Sample Survey Organisation’s approximately quinquennial surveys
of unregistered manufacturing enterprises (NSS-SUME for short) for the years 2000-01, 2005-06 and
2010-11 in some of our analysis.
In this way, we are able to arrive at a more robust assessment of the effects of labor regulation. The
remainder of our paper is organized as follows. Section 2 describes some important features of India’s
apparel sector, including the policy regime under which firms in the sector have operated, domestic and
international. Section 3 describes the data we use to identify the impact of labor regulations on job
creation in India’s apparel sector. Section 4 covers the empirical framework we employ and describes our
results. Section 5 concludes.
7
2. India’s apparel and textiles sector9
In order to understand the role of labor regulations in explaining why India’s formal manufacturing sector
has failed to generate jobs in a big way, a focus on the apparel and textiles sector has several attractive
features. Employing around 14 million workers in 2010-11 (split roughly equally between apparel and
textiles production), or around 31 percent of total manufacturing employment, the apparel and textiles
sector is India’s largest employer in manufacturing. Apparel, in particular, is also one of the most labor-
intensive segments of manufacturing and one in which the skills required by new entrants in the sector,
such as sewing operations, are relatively basic, can be acquired over a relatively short period of time, and
where a primary level education seems sufficient for trainability purposes (Baruah et al). At the same
time, India is among the few countries in the developing world in which the entire supply chain for
manufacturing apparel products—encompassing the production of fibers (natural and synthetic), spinning,
weaving, processing, and finally, design and production of ready-made garments—exists. Not
surprisingly then, it is also one of India’s leading exporters of manufactured products.
By most accounts, however, the apparel sector has not lived up to its potential in terms of exports and the
quality of employment. India’s performance in the global apparel market has been disappointing in the
last decade, vis-à-vis leading Asian comparators, showing no significant improvement in its market share.
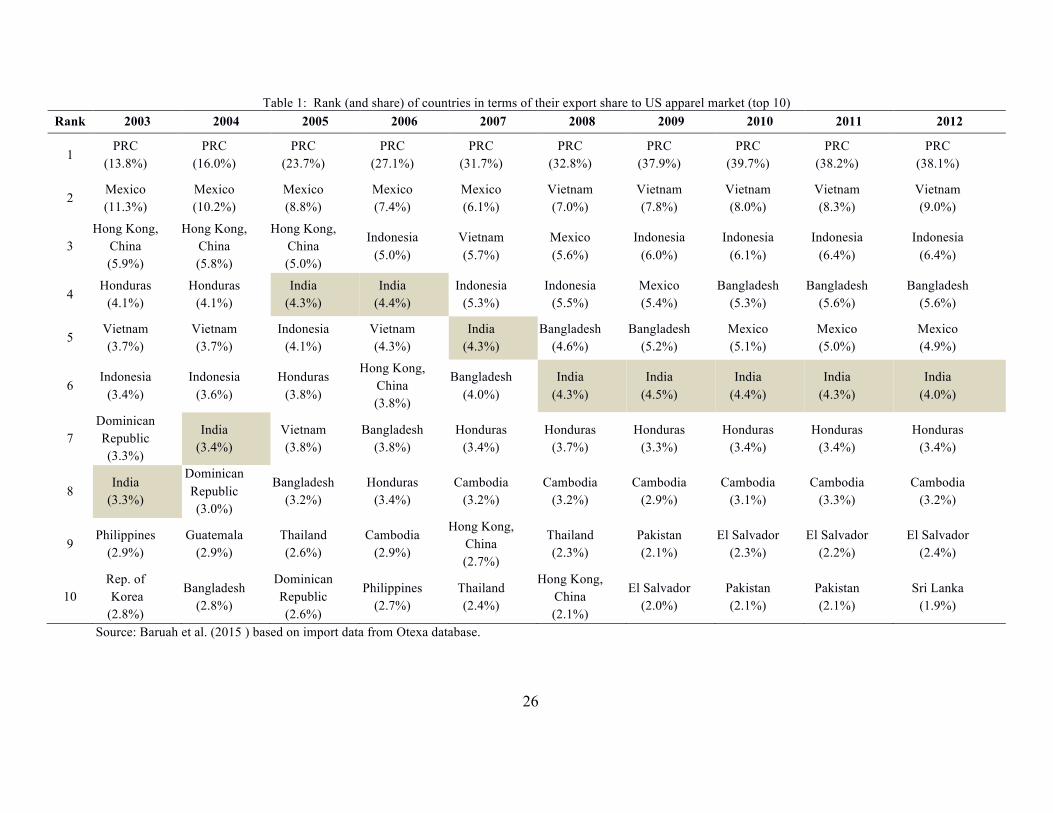
Table 1 shows the ranking of various countries in US apparel imports in terms of market share.10 It shows
that India’s rank initially improved with the abolition of the MFA quota system in 2005, but then kept
falling steadily post-2006. This performance is well aligned to the perceptions of global apparel buyers
who feel that India is uniquely suited to export fashion garments11; however, when it comes to issues such
as productivity, lead time, price, quality, and reliability, India is perceived to have one of the region’s
lowest levels of performance (Birnbaum 2013), making it a poor contender in the basic garments segment
where design does not change from year to year and large scales of production confer advantages.
Finally, the sector is also characterized by the concentration of large numbers of very small sized firms,
most of which operate in the informal sector (Hasan and Jandoc 2013). Informal sector firms accounted
for 88 percent of total employment in apparel in 2010-11 and paid roughly half the wages paid by formal
sector firms (Baruah et al).
9 This section draws on Baruah et al. 10 US imports are considered because no preferential treatment is given to any of these countries by US, as opposed
to the European market where Vietnam and Bangladesh receive preferential treatment in the form of subsidized duties.
11 India is perceived to have considerable capabilities in product design and development. It has a variety of materials available, is skilled at ornamentation and can produce garments in different styles. These features make India a desired supplier for fashion garments.
8
The relative underperformance of the Indian apparel and textiles sector is all the more puzzling when one
considers the policy liberalization, domestic and international, that the sector has experienced. In terms of
the domestic policy environment, the policy of “reserving” various product lines for small sized firms
(i.e., with fixed assets below Rs.10 million in 2004-05) was much diminished by 2000-2001. Readymade
garments were taken out of the reserved list in 2001; moreover, while remaining textile products were
finally taken out by 2005, large firms were allowed to produce reserved items under an obligation to
export at least 50% of their output starting in March 2000 (Panagariya 2008). On the external front, the
abolishment in 2005 of the international quota system set in place by the MFA of 1974 represented an
increase in demand for previously quota constrained developing country producers of apparel and textiles,
especially those from India and other Asian economies (Harrigan and Barrows 2006 and 2009).
A brief description of the 2005 liberalization is in order. Under the MFA, export quotas were allocated to
developing countries for apparel and textile products made of cotton or synthetic fiber or wool. The
quotas were negotiated bilaterally and limited imports of textile and apparel products into developed
country markets. Negotiations at the Uruguay Round of trade talks under the WTO led to an agreement
in 1994 to phase out the MFA. As per the Agreement on Textiles and Clothing (ATC), the MFA quotas
would be gradually eliminated through “phase-outs” in (the first month of) 1995, 1998, 2002, and 2005.
The last phase-out seems to have been particularly important. In their detailed analysis of the evolution of
quota restrictions under the MFA and ATC, Evans and Harrigan (2005) note that many of the required
changes in quota restrictions were delayed until the January 2005 phase-out.12 Consistent with this
observation, the final removal of quotas on apparel and textile products on January 1 2005 led to a surge
in imports of these products into previously protected markets of advanced economies such as the United
States, European Union and Canada (Edwards and Sundaram 2015). India-specific information on quota
“fill rates” from the US also suggest that the January 2005 phase-out was quite important for Indian firms.
Edwards and Sundaram report that as of 2004, 58% of apparel and textile products produced by firms in
the CMIE Prowess database of mainly publicly listed companies were subject to binding quotas in the
US.13 Moreover, for the all-important category of cotton apparel products, the average fill rates were as
12 Based on an assessment of data available between 2002 and 2005, Evans and Harrigan point out that nearly 50
percent of the planned phase-outs in the US would have to occur on January 1, 2005. 13 Edwards and Sundaram use data from the Office of Textile and Apparel (OTEXA; a division of the US
Department of Commerce that administered the US’s MFA quotas) to compute “fill rates” for quotas specific to India and pertaining to various product categories. A fill rate is an indicator of a quota’s restrictiveness and is
9
high as 94% in 2004.14 In other words, 2005 marked a year in the Indian apparel and textiles industry
experienced a major and positive demand shock.
Taken together, the above features strongly suggest that India’s apparel and textiles sector should have
experienced a boom in production and exports since 2005. However, as already noted from Table 1,
India’s rank in terms of apparel exports to the US initially improved with the removal of the quota system
in 2005, but then kept falling steadily post-2006. This was because even though India’s exports did
manage to show positive growth, its growth rate was lower than that of its Asian competitors like
Bangladesh and Vietnam.
In light of all that India’s apparel and textiles sector has going for it, and the domestic and international
policy changes noted above, why has India’s apparel sector not performed better? Some recent case
studies of the apparel and textiles sector, drawing upon a mix of surveys of entrepreneurs and key
informant interviews (including those of global buyers), point to two sets of issues. The first originate
upstream in the textiles-apparel supply chain and affect the variety, quantity, quality, and price of
processed fabric available to Indian producers of apparel—typically 40% to 60% of the cost of an apparel
product. Insofar as apparel products based on synthetic fabrics are concerned— around 45% of the global
and domestic market, respectively—a structure of excise duties that favor cotton over synthetic fabrics
coupled with nontariff barriers on the import of the latter leave Indian apparel producers at a disadvantage
in the growing global market for synthetic apparel products (Jordan , Kamphuis, and Setia, 2014).
India’s position as one of the world’s largest producers of raw cotton coupled with the presence of
spinning and weaving industries do give it an advantage in the production of cotton fabric. However,
some of this natural and historical advantage is lost due to the fragmented nature of the weaving industry
where historical and policy factors have served to sustain large numbers of small, informal enterprises
which rely on traditional production and organizational technologies to produce fabric of uneven quality
and in relatively small quantities. This constrains apparel firms from meeting global buyers’ demands on
quality, quantity, and timelines for finished apparel products.15
defined as the percentage of a quota that is actually used. A fill rate that is much less than 100 percent suggests that the quota is not binding. Edwards and Sundaram classify products whose fill rates are 70 percent or more in 2004 as ‘bound’ or quota-restricted.
14 We thank Asha Sundaram for this observation. The average is based on weighting quota fill rates of OTEXA product groups by product-specific Indian exports to the US in 2007-08.
15 Additionally, and more recently, the introduction of zero liquid discharge environmental standards in the processing of fabric (as of February 2011) cause severe disruption in the textile-apparel supply chain in the state
10
As regards the apparel part of the supply chain, entrepreneur complaints about the availability and/or
costs of power, labor regulations, worker turnover, and absenteeism loom large, as do concerns about
corruption, tax rates, and macroeconomic conditions (especially volatility in the exchange rate). On
power, for example, Tewari and Singh (2011) note that erratic supply of power affects the productivity
and quality of sewing by interrupting the operation of electric sewing machines. Firms have the option of
operating diesel generators, but the unit cost of this power is more than twice the cost of power when
supplied by the public grid. A cost benchmarking by them shows that that India’s power rates are 62%
higher than Bangladesh and 32% higher than China, which erodes India’s competitiveness in the global
market.
It should be noted, however, that one way for apparel firms to deal with the power problem would be to
operate at larger scales where the fixed costs of installing diesel generators could be spread over larger
production volumes. Here, however, India’s labor regulations may be getting in the way of operating
running large plants with several hundreds, if not thousands of workers. As an examination of the World
Bank’s enterprise survey data reveals, labor regulations are listed by entrepreneurs/managers as among
the top five constraints to operations and growth for Indian apparel firms, but not textiles (rank 6) or the
other remaining manufacturing industries (rank 9). Similarly, labor regulations are more of a concern for
firms with 50-99 employees and least so for firms with less than 10 employees. They are also more of a
concern for Indian apparel firms as compared to their Bangladeshi and Chinese counterparts (Baruah et
al).
Qualitative interviews with apparel exporters and global buyers operating in India reinforce the survey
results (Baruah et al). Broadly speaking, labor regulations are pointed to as a major constraint on firms
and difficulty in disciplining or managing labor was cited as problematic, especially the larger the
workforce (and independent of whether a formal union existed or not). As a respondent who works at one
of the leading global buying houses stated, “Firms are wary of putting too much labor under one roof.
There has been an incentive to remain small. Also managing small enterprises is relatively easier than
large ones.” This sentiment echoes that of virtually all other respondents.
of Tamil Nadu, one of India’s most dynamic producers and exporters of apparel products. See Jordan et al for a detailed analysis.
11
What is it about India’s labor regulations that may be incentivizing firms to keep their operations small?
While Indian manufacturing firms operate under a large number of labor regulations passed by both the
central government as well state governments, a few elements of the regulatory regime are likely to be
serious constraints for firms, especially those in labor-intensive industries such as apparel where labor
costs are a major component of total production costs and where volatility in demand (especially in global
markets) puts a premium on the ability of firms to adjust employment levels and/or reassign workers
across tasks or plants.16
Among the most important of these are Chapters V and VB of the Industrial Disputes Act (IDA), which
lays down procedures for the investigation and settlement of industrial disputes. Chapters V and VB
govern the conditions under which layoff, retrenchment, and closure of firms can take place. Chapter VB,
introduced as an amendment by the central government in 1976, made it compulsory for employers with
more than three hundred workers, subsequently lowered to 100 workers in 1982, to seek the prior
approval of the appropriate government before workers could be dismissed.17 Some states, such as West
Bengal, further reduced the 1982 threshold of one hundred workers to fifty workers. In contrast, Uttar
Pradesh retained the previous threshold of 300 workers. Since government approval for retrenchments or
layoffs can be difficult to obtain, Chapter VB of the IDA is believed to have incentivized formal
manufacturing firms in India to conserve on hiring labor and gravitate toward capital-intensive sectors
and capital-intensive production processes and product lines within sectors (see Bhagwati and Panagariya,
2013 for a detailed discussion).18
However, the Chapter VB provisions of the IDA are not the only ones that may have created disincentives
to expand employment and production—and enter export markets in the case of apparel. The IDA also
prescribes the terms under which employers may change “conditions of service” (dealt with in Section 9A
of Chapter IIA). Section 9A of the act requires that employees be given at least twenty-one days’ notice
before employers modify wages and other allowances, hours of work, rest intervals, and leave. According 16 Under the Indian constitution, issues related to labor fall under the “concurrent list” of subjects, giving both the
central government and state governments legislative authority on labor. States also typically have the authority to decide on the specific administrative rules and procedures for enforcing legislations passed by the center.
17 Until 1976, the provisions of the IDA on retrenchments or layoffs were fairly uncontroversial. The IDA allowed firms to lay off or retrench workers according to economic circumstances as long as certain requirements—such as the provision of sufficient notice, severance payments, and the order of retrenchment among workers (last in, first out)—were met. A further amendment in 1982 widened the scope of the 1976 amendment by making it applicable to employers with one hundred or more workers.
18 Consistent with the idea that India’s labor regulations have encouraged capital-intensive production processes and sectors, Hasan, Mitra, and Sundaram (2013) find that capital–labor ratios are higher in India than other countries with similar levels of development and factor endowments for a majority of manufacturing industries.
12
to some observers, including the Government of India’s Task Force on Employment Opportunities, the
“requirement of a 21 day notice can present problems when units have to redeploy labor quickly to meet
the requirement, for example, for time bound export orders” (Planning Commission 2001, p. 156).
Further restrictions on changing the conditions of service (including modifying job descriptions, moving
workers from one plant to another, etc.) in response to changing market conditions come from the
Industrial Employment (Standing Orders) Act and the Factories Act. The latter, which applies to
manufacturing units with 10 workers using power and 20 workers without power, and governs, among
others, the maximum hours of work per day and week (9 hours and 48 hours, respectively), extent of
overtime (a maximum of 50 hours per quarter), payments for overtime (twice the normal wage rate and
higher than the quarter extra as per ILO standards), and timings of work for female employees (not after 7
p.m.) is frequently noted by apparel producers as especially limiting.
An additional complication is that aspects of India’s Trade Union Act makes it difficult to obtain the
worker consent needed to execute changes in service conditions. The Trade Union Act allows any seven
workers in the enterprise to form and register a trade union, but has no provisions for union recognition
(for example, by a secret ballot).19The result has been multiple unions within the same establishment, with
rivalries between unions so common that a requirement of workers’ consent for enacting changes “can
become one of consensus amongst all unions and groups, a virtual impossibility” (Anant 2000, p. 251).
Not all analysts agree, however, that the regulations described above have introduced serious rigidities for
firms. One key argument is that the regulations have been circumvented through the increased usage of
temporary (casual) or contract workers (Ramaswamy 2003).20Since many provisions of Indian labor
regulations, including those of the IDA, cover only “regular” workers, firms have an incentive to hire
temporary and contract workers instead. While the Contract Labour (Regulation and Prohibition) Act,
which regulates the employment of contract labor, provides for the abolition of contract labor in work that
is of a perennial nature and is carried out by regular workers in the same or similar establishments (under
19 An amendment to the Trade Union Act in 2001 raised the minimum number of workers that can form a trade
union in the case of enterprises with one hundred or more workers. In such enterprises, the minimum has been set at 10 percent of the total number of workers up to a maximum of one hundred workers. Additionally, one-third or five officers of the trade union, whichever is less, are permitted to be outsiders in the case of organized sector enterprises as per the 2001 amendment.
20 For a detailed review of Indian labor regulations and the debate surrounding the issue of rigidity, see Anant et al. (2006).
13
Section 10 of the act), the share of contract labor in Indian manufacturing has increased considerably over
time and may have served to reduce the bite of labor regulations (Ahsan and Pages 2007).21,22
However, it needs to be recognized that some major industrial disputes have arisen over contract labor
(regarding “regularization” and union recognition, for example), and some amount of uncertainty
accompanies the use of contract labor for getting around other labor regulations. Moreover, the use of
contract labor may reduce the incentives of both firms and workers to develop long-term relationship with
one another. A lack of investment in training workers and the high degrees of absenteeism and worker
turn over in Indian apparel relative to comparators noted above may well be one of the consequences. Of
course, whether or not India’s labor regulations have constrained the growth of Indian manufacturing,
especially labor-intensive segments like apparel, is an empirical issue.
3. Data
Our analysis requires two sets of information: (i) a measure of labor regulations across India’s states, and
(ii) data on output, employment, and wages for the apparel and textiles sector and comparator labor-
intensive industries.
Labor regulations
Since our empirical strategy is partly based on exploiting cross state variation in labor regulations, we
require a measure of this variation. We consider two alternative measures. The first comes from Gupta,
Hasan and Kumar (2009, henceforth GHK). GHK’s starting point is the state-level indexes of labor
regulations developed by Besley and Burgess (2004) and OECD (2007) and the work of Bhattacharjea
(2009).23 24
21 The act applies to all establishments employing at least twenty workers as contract labor on any day in the
preceding twelve months, and to every contractor employing twenty or more contract workers in the same period. The act provides for the registration of establishments of the principal employer employing contract labor and the licensing of contractors. The principal employer must provide facilities such as rest room, canteens, first aid, etc., if the contractor fails to do so. The principal employer must also ensure that the contractor pays the wages due to the laborers.
22 The share of contract labor in manufacturing has increased from around 12 percent in 1985 to 23 percent in 2002 (Ahsan and Pagés 2007). Certain states have seen a particularly sharp rise in the use of contract labor. Andhra Pradesh, which has seen the largest increase, passed a law in 2003 permitting contract labor employment in so-called core activities of firms and widening the scope of non-core activities (Anant et al. 2006).
14
GHK assign scores of 1, 0, and -1 (denoting flexible, neutral, and inflexible regulations, respectively) to
each state based on information from the three studies and then adopt a simple majority rule to come up
with a composite index of labor regulations. 25, 26 The advantage of this approach is that if a particular
methodology or data source used by one of the underlying studies is subject to measurement error, it will
be ignored due to the majority rule. Indeed, as GHK note, diametrically opposite classifications of labor
regulations for a given state across the studies—such as a state classified as having flexible (inflexible)
regulations by one measure and inflexible (flexible) by another—are unusual. Five states are deemed to
have flexible labor regulations: Andhra Pradesh, Karnataka, Rajasthan, Tamil Nadu, and Uttar Pradesh.
Seven states are deemed to have neutral labor regulations: Assam, Bihar, Gujarat, Haryana, Kerala,
Madhya Pradesh, and Punjab. The remaining three states are deemed to have inflexible labor regulations:
Maharashtra, Orissa, and West Bengal.
We also consider a second measure of state level labor regulations in this paper. Given the primacy of
Chapter VB in the debate on the effects of labor regulation on Indian manufacturing, we start with the
index of state-level regulations GHK developed based on Bhattacharjea’s analysis of Chapter VB.
According to this index, three states are characterized as flexible labor regulation states: Karnataka, Tamil
Nadu, and UP. Maharashtra and Orissa are deemed to be inflexible labor regulation states. The rest are
25 While the Besley and Burgess (2004) measure relies on coding state-level amendments to the IDA from 1958 to
1992 as pro-employer, pro-employee, or neutral, the OECD study is based on a survey of experts and codes progress in recent years in introducing changes not only to regulations dealing with labor issues but also to the relevant administrative processes and enforcement machinery (covering, for example, the role of inspectors, the maintenance of registers, the filing of returns and union representation). The regulations covered by the OECD survey go well beyond the IDA and include the Factories Act, the Trade Union Act, and Contract Labour Act, among others (see Doughtery (2009) for details on the OECD study). Within each major regulatory area, a number of issues are considered and scores are assigned on the basis of whether or not a given state has introduced changes that have reduced the transaction costs associated with labor regulations or their administration. A higher score is given for changes that are deemed to reduce transaction costs (i.e., pro-employer as per Besley and Burgess’ terminology). The responses on each individual item across the various regulatory and administrative areas are aggregated into an index that reflects the extent to which procedural changes have reduced transaction costs vis-à-vis labor issues. The Bhattacharjea study focuses on characterizing state level differences in two elements of Chapter VB of the IDA: regulatory changes pertaining to the employment threshold beyond which permission for retrenchments, layoffs, or closures is required; and those on the requirement of obtaining permission (for example, whether permission is needed for closure or for both closure and retrenchment). In addition to the content of legislative amendments, he also analyzes judicial interpretations to Chapter VB in assessing the stance of states vis-à-vis labor regulation. Bhattacharjea’s detailed account of legislative and judicial interventions affecting Chapter VB enables him to identify points at which one or more states has diverged from the rest of the country. Based on this account, GHK partition states in terms of having flexible, neutral, or inflexible stance on Chapter VB.
26 For the purpose of their study, GHK consider time-invariant measures of state-level labor regulations. They also make two important changes to the original coding of Besley and Burgess (2004). First, based on the arguments of Bhattacharjea (2006), they treat labor regulations in Gujarat as neutral rather than pro-worker. Second, they deem Madhya Pradesh’s labor regulations to be neutral rather than mildly pro-employer.
15
deemed to be ‘neutral’. Next, based on the argument that firms have responded to regulations such as
IDA’s Chapter VB by hiring contract labor, we use information on contract labor regulations from
Dougherty (2009). Dougherty identifies 50 issues across distinct major legal areas including the Industrial
Disputes Act (IDA), Factories Act, State Shops and Commercial Establishments Acts, Contract Labour
Act, the role of inspectors, the maintenance of registers, and the filing of returns and union representation.
Within each major area, scores are assigned a “1” if any reform/amendment was introduced that reduced
transaction costs, “2” for those reforms that further reduced the transaction cost, and “0” if it did not (or
no reforms were introduced in that area). The scores on each individual item across the various regulatory
and administrative areas are then aggregated (and normalized into a proportional index to adjust for the
uneven number of issues in the eight major areas).27 Using Dougherty’s work, we identify those states
that have introduced the most flexible practices (from the perspective of firms) in regulating contract
labor.28 These states, which include Assam, Madhya Pradesh, Andhra Pradesh, Gujarat and Maharashtra
are assigned a “step up” to the Chapter VB index. For example, if one of these states was coded as
‘inflexible’ as per GHK’s Chapter VB index, it gets a step up to ‘neutral’ status. Similarly a ‘neutral’
state becomes ‘flexible’; a ‘flexible’ state remains so.
In the same manner, we incorporate information provided by Dougherty on the Factory Act and consider
states’ scores on the Act. As noted above, the Act regulates provisions on working hours, shifts, and the
employment of women, among others. These are all areas of considerable importance to labor-intensive
industries and especially apparel firms. States which are deemed flexible on the Act, namely Tamil Nadu,
UP and Punjab are assigned a “step up”.29
We then make a final adjustment to our labor regulation index by incorporating information on
administrative processes across states provided in Dougherty. In particular, many Indian states have
27 The number of cases where reform had occurred was taken as a proportion of the number of possible subjects for
reform in a given reform area. 28 Specifically, Dougherty considers and scores 9 elements of contract labor regulations on a scale of 0 to 9.
However, for our analysis, we drop the scores on ‘contract employment allowed in IT/BPO’ as our focus is on the manufacturing sector alone and so, we aggregate across the remaining 8 elements. Next, we create a best practices index by taking the individual aggregate score (out of 8) as a proportion of the maximum aggregate score obtained by any state and normalize it on a scale of 0 (minimum) to 100 (maximum). We deem states that score 80 or more out of 100 as having the most flexible provisions for hiring contract labor.
29 We deviate from Dougherty’s coding in assigning an extra score (“2” instead of “1”) to the state of Tamil Nadu on account of a reform, in 1996, which extended the time frame for license renewal from 5 years to 10years. We have assigned a score of “0” to those states with a time frame of 1 year, “1” to those with a time-frame of more than 1 year and up to 5 years (including), and “2” to those with a time-frame of more than 5 years (10 years in case of Tamil Nadu). We deem states with scores of 80 and above (out of 100) as flexible states..
16
made dealing with regulatory inspectors easier and streamlined business processes (such as those
associated with filing of various forms and returns and maintaining inspection books). However, some
have not done so and we assign a ‘step-down’ to all those states which fare poorly on this account,
namely West Bengal, Assam, Kerala, Maharashtra and Punjab.30 This leaves us with six states classified
as flexible: Andhra Pradesh, Karnataka, Gujarat, Madhya Pradesh, Tamil Nadu, and Uttar Pradesh. 31Four
states are deemed to have inflexible labor regulations: Kerala, Maharashtra, Orissa, and West Bengal.32
The remaining five states are deemed to have neutral labor regulations: Assam, Bihar, Punjab and
Rajasthan.
For expositional convenience, Table 2 describes how states are coded for the GHK index as well as ours.
In much of our analysis, we consider only two distinct groups of states: flexible and inflexible labor
regulation states. That is, as India’s central level labor regulations are widely accepted as among the
more inflexible to begin with in an international perspective, we subsume the states coded as neutral in
the inflexible category. We make use of the finer neutral/inflexible distinction to perform robustness tests
for the main results that we report.
Plant level data
As noted earlier, our focus is on the response of formal sector firms to the phase out of the MFA. For data
on employment and wages across industries, we use plant level data for the years 1998-99 through 2007-
08, and 2010-11 from the Annual Survey of Industries (ASI). The survey, which is conducted by India’s
Ministry of Statistics and Program Implementation, is nationally representative and covers all factories
employing 10 or more workers and using electricity, and those employing 20 or more workers without
using electricity. The survey frame used is based on the list of registered manufacturing enterprises
available with the Chief Inspector of Factories in each state. As such, the ASI covers only registered
manufacturing firms, specifically those covered by Sections 2m(i) and 2m(ii) of the 1948 Factories Act
and by the 1966 Bidi and Cigar Workers Act. The ASI is a statutory survey, in that firms that receive the
survey are required to submit returns. In spite of this, the sampling frame is also divided into census and
survey sections. The definition of these sections has varied with time, so that firms with between 50-200
30 In particular, we consider scores on 6 issues- if authorization is required for specific complaints, provision for
single inspection book, allowing filing on a consolidated form, allowing single format of various returns, provision for single window procedure, and provision for self-certification. States with a score of 0 on 100 are deemed to be inflexible.
32 If we incorporate Dougherty’s scores on “Union Representation” and give a ‘step-up’ to best practices,
Maharashtra would go from being an inflexible to neutral state.
17
workers have been part of the census section. The details of all these plants are collected by the ASI, and
the remaining plants are randomly sampled. However, each plant level observation is probability
weighted to make it representative at the state-industry level. We use these probability weights in all of
our calculations.
The ASI data allow us to compute mean worker wages by dividing the worker wage bill of a plant by the
average number of workers reported by the plant. We use poverty lines based on the Tendulkar committee
recommendations to construct a price index and deflate nominal wages to 2004-05 prices. The poverty
lines are constructed separately for each state, and thus our price index based on it accounts for spatial
variation in prices in addition to temporal variation. Since the Tendulkar poverty lines are available only
for three time periods (1993-94, 2004-05, and 2009-10), we take the implicit price indexes based on these
three years and assume linear changes to arrive at deflators for the remaining years. ‘Total workers’ are
those employees of the firm classified as ‘workers’, i.e. excluding employees holding supervisory or
managerial positions, and working proprietors. Total workers include both workers directly employed by
the firm and those hired through contractors.
We control for the provision of electricity in our analysis to proxy for infrastructure quality. As noted
above, power shortages in India are widely regarded as a major constraint on the growth of Indian
manufacturing, including the apparel sector. We exploit the fact that the ASI survey asks firms to report
the amount of electricity they had to generate themselves along with the total electricity they used. Shukla
et al. (2004) show that captive plants in India can be broadly attributed to the need for backup power
arrangement, requirement for a better quality supply and the need to generate electricity at costs lower
than the high industrial tariffs set to cross subsidize other categories of consumers.33 In effect, a unit
would need to generate power on its own if the public provision of power is not good enough, or is priced
too highly, both of which would indicate an infrastructure environment that is not industry friendly. This
enables us to use the average ratio of power that units generate on their own to the total power they
consume in each state-year combination as a control for the public provision of infrastructure to industry.
The total number of observations available in the data over the period 1999-2011 are 523,548. For our
analysis, we restrict the data to labor intensive sectors which are comparable to apparel and textiles. These
sectors include manufacture of food, tobacco, leather, wood products and paper products. Over the period
we consider, there are 208,567 plant level observations available in the data in these sectors. Table 3
18
provides summary statistics for our main variables of interest for the pre- and post-2005 period and by
state type.
4. Empirical framework and results
A. Empirical framework
Our strategy for capturing the effects of labor regulation relies on comparing outcomes pertaining to
Indian apparel and textile manufacturers across three dimensions—namely, prior and subsequent to 2005,
across states with differing labor regulations, and with the decisions of manufacturers of other labor-
intensive products (other manufacturers, for short). 34 The basic specification we use is of the form:
𝑦!"# = 𝛼 + 𝑎𝑝𝑝𝑎𝑟𝑒𝑙_𝑡𝑒𝑥𝑡𝑖𝑙𝑒! + 𝑓𝑙𝑒𝑥𝑖𝑏𝑙𝑒! + 𝑎𝑝𝑝𝑎𝑟𝑒𝑙_𝑡𝑒𝑥𝑡𝑖𝑙𝑒!×𝑓𝑙𝑒𝑥𝑖𝑏𝑙𝑒! + 𝛽!𝑝𝑜𝑠𝑡𝑀𝐹𝐴!+ 𝛽!(𝑎𝑝𝑝𝑎𝑟𝑒𝑙_𝑡𝑒𝑥𝑡𝑖𝑙𝑒!×𝑝𝑜𝑠𝑡𝑀𝐹𝐴!) + 𝛽! 𝑓𝑙𝑒𝑥𝑖𝑏𝑙𝑒!×𝑝𝑜𝑠𝑡𝑀𝐹𝐴!+ 𝛽! 𝑎𝑝𝑝𝑎𝑟𝑒𝑙_𝑡𝑒𝑥𝑡𝑖𝑙𝑒!×𝑓𝑙𝑒𝑥𝑖𝑏𝑙𝑒!×𝑝𝑜𝑠𝑡𝑀𝐹𝐴! + 𝑦𝑒𝑎𝑟! + 𝑠𝑡𝑎𝑡𝑒! + 𝜀!"#
where 𝑦!"# is the number of workers, or mean wages for firm i in year t and state s. 𝑎𝑝𝑝𝑎𝑟𝑒𝑙! is an
indicator for whether the firm was classified as an apparel or textile producer, 𝑓𝑙𝑒𝑥𝑖𝑏𝑙𝑒 for whether the
firm was in a state with flexible labor regulations, and postMFA for whether it was affected by the 2005
trade liberalization.35 year and state represent state and time fixed effects. The error term, εist is assumed
to have the standard properties, but we account for any correlations at the industry and state levels by
clustering standard errors along those two dimensions. In some of our estimations we also introduce a
control for the local availability of power supply. In one specification we also calculate the effect on the
total number of workers at the state-industry level, instead of at the firm level.
The measure of flexibility that we use is interacted with the indicators for apparel and textiles and the
trade liberalization effect to help us take advantage of the change that affected the apparel industry while
the industry sectors that were not affected can act as control groups.
35 We define our 'post-MFA' years to be 2004-05 onwards (i.e., April 2004-March 2005 onwards). The main reason
for this that as the phase-outs were common knowledge, we would expect some degree of change to take place before the actual phase-out itself. Moreover, some part of the 2004-05 fiscal year itself was after the final January 2005 phase-out of quotas. Thus, it makes sense for us to include 2004-05 as a post-MFA year.
19
We report the various coefficients (𝛽 s) of the flexibility measure, and its interactions with the other
indicators allow us to create estimates of the differential response of the apparel and textiles industry in
the flexible and inflexible states when faced with trade liberalization. For instance, to estimate the
difference in effects between apparel producers in flexible states and inflexible states (referred to as
“Apparel & Textile, Flexible-Inflexible” in our tables), we would sum 𝛽! and 𝛽!. 𝛽! is the triple
difference — the effect of the trade liberalization on the difference between apparel and textile producers
and other producers in flexible states relative to the difference between them in inflexible states.
The advantage of using the difference-in-differences strategy is that it allows us to isolate the effect of the
treatment, because common factors across flexible and inflexible states that may be correlated with the
treatment — for instance, the faster economic growth experienced pan-India post-2005 — are removed.
Similarly, common factors that affected both apparel and textiles manufacturers as well as other
manufacturers are also differenced out. For this advantage to hold, we must satisfy the parallel trends
assumption, i.e., that before the treatment was introduced, producers of both sets of products in both
flexible and inflexible states were not already responding differentially to the economic environment they
faced. To test this assumption we also provide additional results using our treatment variables limited to
the period before the treatment occurred.
In looking at differences in the response of apparel and textiles producers between flexible and inflexible
states, our identification assumption is that there are no factors that are correlated with the 2005
liberalization that only affect the flexible states. If we examine only the difference in response in the gap
between apparel and textiles producers and other producers in flexible states relative to inflexible states,
the assumption is further reduced to there not being any factors that are correlated with the liberalization
and that affect only apparel and textiles producers only in flexible states.
We further control for state and year fixed effects, to control for any unobserved state specific
characteristics and any time trends.
B. Results
To provide some basic intuition with which to view our results, consider Table 3, which as noted earlier
reports summary statistics on our variables of interest — employment and wages — for the periods before
and after the liberalization. In the period before the MFA, the flexible states employed 59 percent of the
apparel and textile workforce, and in the period after, this percentage increased to 64 percent. Mean
20
wages were lower in the flexible states in both periods.
Table 4 describes the estimates of equation (1) based on data from the ASI (or, formal sector) — the
𝛽 coefficients from equation (1). Columns (1) and (2) report the results for mean wages and workers,
respectively, and when the unit of analysis for estimating equation (1) is the firm. Column (3) reports the
results for the number of workers by industry. Given the many interaction effects, Table 5 describes the
various marginal effects of interest based on these coefficients, along with their standard errors. Two sets
of marginal effects are reported. The first set, reported in the upper panel of Table 5, comprises
differences between the post- and pre-liberalization periods for each of the four groups of manufacturers
under consideration: apparel and textiles manufacturers in flexible and inflexible states, and our
comparator other labor-intensive manufacturers (i.e., food, tobacco, leather, wood products and paper
products) in flexible and inflexible states. The second set consists of the difference-in-difference
estimates, i.e., involving differences between flexible state apparel and textiles manufacturers and
inflexible state apparel and textiles manufacturers; flexible state other manufacturers and inflexible state
other manufacturers; flexible state apparel and textiles manufacturers and flexible state other
manufacturers; and inflexible state apparel and textiles manufacturers and inflexible state other
manufacturers.
As reported in the upper panel of column (1) of Table 5, we find a large, statistically significant rise in
real wages across all sectors in flexible states between the pre- and post-2005 periods, with the wages in
the apparel and textiles sector experiencing a larger increase. The inflexible states do not show a
significant rise in real wages. However, in column (2), which pertains to employment, we note that of the
four groups under consideration, only apparel and textiles manufacturers in flexible states have seen a
significant increase (at the 10 percent level), of 20.2 workers in the average number of workers employed
in each plant, an increase of 23 percent.
Our difference in difference estimates are reported in the lower panel of Table 5. As noted earlier, these
estimates enable us to look at the differential impact of the 2005 abolition of the MFA quotas across
flexible versus inflexible states by removing the effect of trends that are common across both sets of
states. We see in column (1) that wages in flexible states increase when compared to inflexible states for
both apparel and textiles as well as other sectors, though the rise is larger in apparel and textiles. The
number of workers per plant however, increases only for apparel and textiles manufacturers in flexible
states by a statistically significant 12 workers, an increase of approximately 15 percent. If the labor
21
supply is viewed as relatively inelastic over the short term, an increase in demand for labor by apparel and
textiles manufacturers and a subsequent shift in the labor market equilibrium can explain the increase in
wages in the flexible states for both apparel and textiles and other manufacturers, compared to inflexible
states. Column (3) reports the effect on the total workers employed in each state, in each two digit
industry division. Here, too, the MFA phase out increases the total number of workers employed in the
apparel and textiles sector in flexible states compared to inflexible states by approximately 35 percent.
C. Robustness checks
We now turn to several robustness checks of different aspects of our analysis. First, as a test of the
parallel trends assumption, we run the same analysis on a data sample restricted to observations before
2004. These results are included in Table 6. We find no statistically significant results, and conclude that
the parallel trends assumption is a reasonable one.
Second, we check whether our results in Table 5 hold up to alternative measures of state-level flexibility.
Table 7 reports the various analogues of the marginal effects reported in Table 5 when we exclude the
neutral states from our analysis, comparing only the states classified as flexible with those classified as
inflexible. We would expect this sub-sample to exhibit stronger effects compared to our main results
insofar as the estimates involving differences between flexible and inflexible state manufacturers are
concerned, and especially for the apparel and textiles industry. This is indeed what we find for
employment as a comparison of the estimated marginal effects across Tables 5 and 7 reveals (i.e., an
estimate of 33.96 in Table 7 compared to 12.34 in Table 5). Table 8 describes the results when we use the
GHK-based partition of states in terms of flexible or inflexible regulations instead of ours. The results are
smaller in economic magnitude, but retain statistical significance.
Finally, we examine whether our results change in any significant way if we incorporate data from the
informal sector. Doing so makes all estimates of marginal effects statistically insignificant. Given that
there are many more informal sector firms than formal sector firms, this may be driven by the fact that the
phase-out of the MFA would mainly be expected to affect formal sector firms. We thus check what
happens if we use only data from the NSS SUME to estimate equation (1) and the various marginal
effects of interest. As may be seen from Tables 9 and 10 (which are analogues of the ASI-based Table 4
and 5), we find no differential impact of the 2005 liberalization on the unorganized sector. Considering
that the division of states into flexible and inflexible matters only to the formal manufacturers, this result
is along expected lines.
22
5. Conclusions
India’s growth acceleration since the 1980s was unlike the more ‘conventional’ experience of its East and
Southeast Asian neighbors, which was primarily driven by growth in the manufacturing sector and
resulted in many jobs being created. Instead, India’s growth acceleration was driven more by its services
sector. And, while formal manufacturing did contribute to growth, it did not add much to employment.
It is widely accepted that one factor behind this pattern of growth was India’s infrastructure deficit, which
arguably was more of a constraining factor on manufacturing than services. The role of Indian labor
regulations has also been much discussed. However, analysts have been divided on how important they
have been in constraining the growth of India’s manufacturing sector, and especially the growth of
employment in the formal segment of manufacturing. While some previous research finds labor
regulations to have been a significant constraint, there remains some skepticism based on measurement
and methodological grounds. In this paper, we introduce some refinements to state-level measures of
labor regulations and exploit an industry-specific policy change that applied only to the apparel and
textiles industry. This allows us to use a difference-in-difference approach to identify the effects of labor
regulations on employment and wages.
Our analysis strongly suggests that an increase in demand resulting from the abolition of the international
quota system under the Multi Fiber Agreement led to economically and statistically significant
employment and wage gains in states that maintained more flexible labor regulations relative to those
states that had comparatively inflexible regulations. Our results add to the evidence that inflexible labor
regulations have acted as a constraint to the growth of good jobs by limiting the growth of India’s labor-
intensive manufacturing industries in the formal sector.
23
References
Asian Development Bank. 2009. Key Indicators 2009: Enterprises in Asia: Fostering
Dynamism in SMEs. Manila.
Aghion, P., R. Burgess, S. Redding, and F. Zilibotti. 2008. The Unequal Effects of Liberalization: Evidence from Dismantling the License Raj in India. American Economic Review. 98 (4). pp. 1397-1412.
Ahsan, A. and C. Pagés. 2007. Are All Labor Regulations Equal? Assessing the Effects of Job Security, Labor Dispute and Contract Labor Laws in India. Policy Research Working Paper No. 4259. Washington, D.C.: The World Bank.
Anant, T. C. A. 2000. Reforming the Labour Market. In S. Gangopadhyay and W. Wadhwa, eds. Economic Reforms for the Poor. New Delhi: Konark.
Anant, T. C. A., R. Hasan, P. Mohapatra, R. Nagraj, and S. K. Sasikumar. 2006. Labor Markets in India: Issues and Perspectives. In J. Felipe and R. Hasan, eds. Labor Markets in Asia: Issues and Perspectives. London: Palgrave Macmillan; Manila: Asian Development Bank.
Banerjee, A. V. and E. Duflo. 2014. Do Firms Want to Borrow More? Testing Credit Constraints Using a Directed Lending Program. Review of Economic Studies. 81 (1). pp. 572-6007.
Baruah, R., R. Hasan, N. Kapoor, and A. Mehta (2015). What Constrains the Growth of Good Jobs? The Case of Apparel Manufacturing Manuscript. Manila: Asian Development Bank.
Besley, T. and R. Burgess. 2004. Can Labor Regulation Hinder Economic Performance? Evidence from India. The Quarterly Journal of Economics. 119 (1). pp. 91-134.
Bhagwati, J. and A. Panagariya. 2013. India's Tryst with Destiny: Debunking Myths That Undermine Progress and Addressing New Challenges. Noida: HarperCollins Publishers.
Bhattacharjea, A. 2006. Labour Market Regulation and Industrial Performance in India: A Critical Review of the Empirical Evidence. The Indian Journal of Labour Economics. 49 (2). pp. 211-232.
Bhattacharjea, A. 2009. The Effects of Employment Protection Legislation on Indian Manufacturing CDDRL Working Papers No. 96. Stanford, CA: Center on Democracy, Development, and The Rule of Law.
Birnbaum, D. 2013. Benchmark Study India. Background study. New Delhi: Apparel Export Promotion Council.
Dehejia, R. and A. Panagariya. Forthcoming. "The Link Between Manufacturing Growth and Accelerated Services Growth in India," Economic Development and Cultural Change.
24
Dougherty, S., V. F. Robles and K. Krishna. 2011. Employment Protection Legislation and Plant-Level Productivity in India. Economics Department Working Papers No. 917. Paris: Organisation for Economic Co-operation and Development.
Dougherty, S. M. 2009. Labour Regulation and Employment Dynamics at the State Level in India. Review of Market Integration. 1 (3). pp. 295-337.
Edwards, L. and A.Sundaram. 2015. Trade Liberalization, Rival Exporters and Reallocation of Production: An Analysis of Indian Manufacturing. Working paper at the University of Cape Town.
Evans, C. L. and J. Harrigan. 2005. Tight Clothing: How the MFA Affects Asian Apparel Exports. In T. Ito and A.K. Rose, eds. International Trade in East Asia, NBER-East Asia Seminar on Economics, Volume 14. University of Chicago Press
Gupta, P., R. Hasan and U. Kumar. 2009. Big Reforms but Small Payoffs: Explaining the Weak Record of Growth in Indian Manufacturing. India Policy Forum. 5 (1). pp. 59-123.
Harrigan, J. and G. Barrows. 2006. Testing the Theory of Trade Policy: Evidence from the Abrupt End of the Multifibre Arrangement, NBER Working Paper 12579. Also appeared in 2009 in the Review of Economics and Statistics, 91(2), pp. 282-294.
Hasan, R. and K. Jandoc. 2013. Labour Regulations and Firm-Size Distribution in Indian Manufacturing. In J. Bhagwati and A. Panagariya, eds. Reforms and Economic Transformation in India. New York, NY: Oxford University Press.
Hasan, R., D. Mitra and A. Sundaram. 2013. The Determinants of Capital Intensity in Manufacturing: The Role of Factor Market Imperfections. World Development. 51 (1). pp. 91-103.
Kochhar, K., U. Kumar, R. G. Rajan, and A.Subramanian. 2006. India's Patterns of Development: What Happened, What Follows. Journal of Monetary Economics. 53 (1). pp. 981-1019.
Krueger, A. O. 2007. The Missing Middle. SCID Working Paper No. 343. Stanford, CA: Stanford Center for International Development.
OECD. 2007. Improving the Performance of the Labour Market. In Economic Survey of India. Paris: Organisation for Economic Co-operation and Development.
Panagariya, A. 2008. India: The Emerging Giant. New York, NY: Oxford University Press.
Panagariya, A. 2004. “Growth and reforms during 1980s and 1990s,” Economic and Political Weekly, June 19, 2581-94
Planning Commission. 2001. Report of Task Force on Employment Opportunities. New Delhi.
25
Ramaswamy, K. V. 2013. Size-Dependent Labour Regulations and Threshold Effects: The Case of Contract-Worker Intensity in Indian Manufacturing. Mumbai Working Papers 2013-012. Mumbai: Indira Gandhi Institute of Development Research.
Rodrik, D. and A. Subramanian. 2005. From "Hindu Growth" to Productivity Surge: The Mystery of the Indian Growth Transition. IMF Staff Papers. 52 (2). pp. 193-228.
Jordan, L., Kamphuis, B., Setia, S.P., 2014. Improving the Competitiveness of the Textile Value Chain in India. (In Republic of India: Manufacturing Plan Implementation Report No: ACS14223. Washington, D.C . The World Bank.)
Shukla, P. R., et al. 2004. Impact of Power Sector Reforms on Technology, Efficiency and Emissions: Case Study of Andhra Pradesh, India. PESD Working Paper No. 20. Stanford, CA: Program on Energy and Sustainable Development.
Syverson, C. 2011. What Determines Productivity? Journal of Economic Literature. 49 (2). pp. 326-365.
Tewari, M. and M. Singh. 2011. Benchmarking the International Competitiveness of the Indian Textile and Apparel Industry. New Delhi: Ministry of Textiles, Government of India.
26
Table 1: Rank (and share) of countries in terms of their export share to US apparel market (top 10) Rank 2003 2004 2005 2006 2007 2008 2009 2010 2011 2012
1 PRC
(13.8%) PRC
(16.0%) PRC
(23.7%) PRC
(27.1%) PRC
(31.7%) PRC
(32.8%) PRC
(37.9%) PRC
(39.7%) PRC
(38.2%) PRC
(38.1%)
2 Mexico (11.3%)
Mexico (10.2%)
Mexico (8.8%)
Mexico (7.4%)
Mexico (6.1%)
Vietnam (7.0%)
Vietnam (7.8%)
Vietnam (8.0%)
Vietnam (8.3%)
Vietnam (9.0%)
3 Hong Kong,
China (5.9%)
Hong Kong, China (5.8%)
Hong Kong, China (5.0%)
Indonesia (5.0%)
Vietnam (5.7%)
Mexico (5.6%)
Indonesia (6.0%)
Indonesia (6.1%)
Indonesia (6.4%)
Indonesia (6.4%)
4 Honduras
(4.1%) Honduras
(4.1%) India
(4.3%) India
(4.4%) Indonesia
(5.3%) Indonesia
(5.5%) Mexico (5.4%)
Bangladesh (5.3%)
Bangladesh (5.6%)
Bangladesh (5.6%)
5 Vietnam (3.7%)
Vietnam (3.7%)
Indonesia (4.1%)
Vietnam (4.3%)
India (4.3%)
Bangladesh (4.6%)
Bangladesh (5.2%)
Mexico (5.1%)
Mexico (5.0%)
Mexico (4.9%)
6 Indonesia
(3.4%) Indonesia
(3.6%) Honduras
(3.8%)
Hong Kong, China (3.8%)
Bangladesh (4.0%)
India (4.3%)
India (4.5%)
India (4.4%)
India (4.3%)
India (4.0%)
7 Dominican Republic (3.3%)
India (3.4%)
Vietnam (3.8%)
Bangladesh (3.8%)
Honduras (3.4%)
Honduras (3.7%)
Honduras (3.3%)
Honduras (3.4%)
Honduras (3.4%)
Honduras (3.4%)
8 India
(3.3%)
Dominican Republic (3.0%)
Bangladesh (3.2%)
Honduras (3.4%)
Cambodia (3.2%)
Cambodia (3.2%)
Cambodia (2.9%)
Cambodia (3.1%)
Cambodia (3.3%)
Cambodia (3.2%)
9 Philippines
(2.9%) Guatemala
(2.9%) Thailand (2.6%)
Cambodia (2.9%)
Hong Kong, China (2.7%)
Thailand (2.3%)
Pakistan (2.1%)
El Salvador (2.3%)
El Salvador (2.2%)
El Salvador (2.4%)
10 Rep. of Korea (2.8%)
Bangladesh (2.8%)
Dominican Republic (2.6%)
Philippines (2.7%)
Thailand (2.4%)
Hong Kong, China (2.1%)
El Salvador (2.0%)
Pakistan (2.1%)
Pakistan (2.1%)
Sri Lanka (1.9%)
Source: Baruah et al. (2015 ) based on import data from Otexa database.
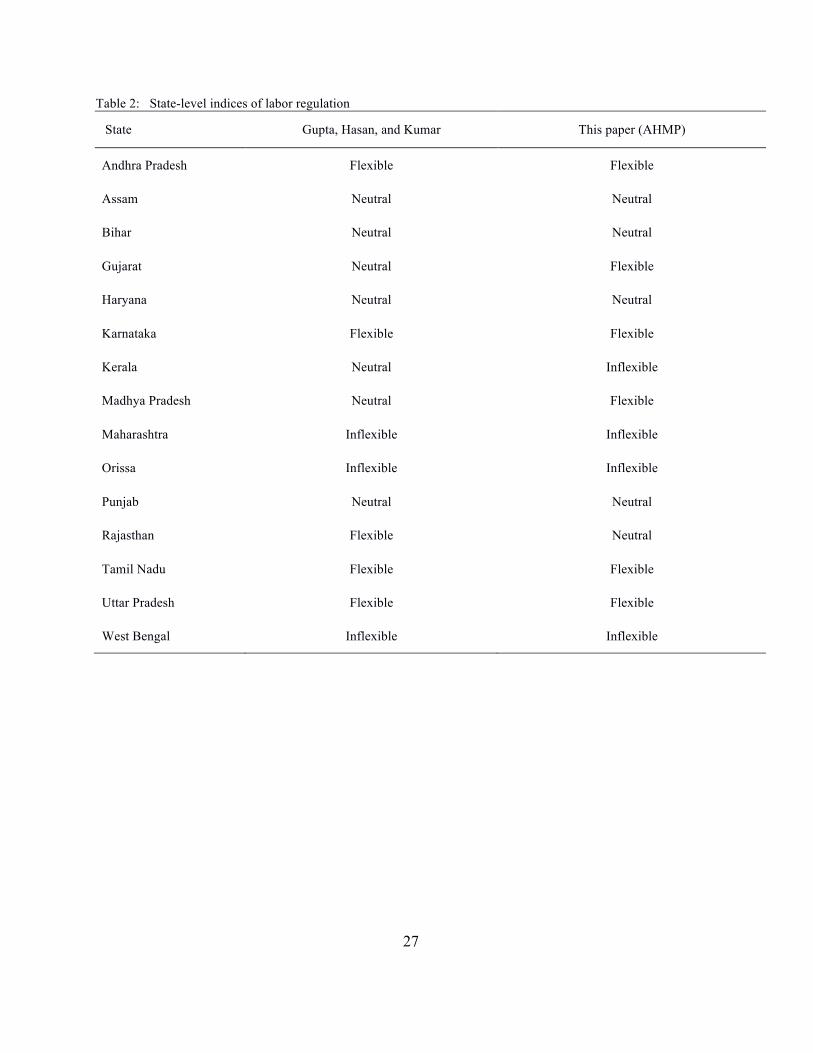
27
Table 2: State-level indices of labor regulation
State Gupta, Hasan, and Kumar This paper (AHMP)
Andhra Pradesh Flexible Flexible
Assam Neutral Neutral
Bihar Neutral Neutral
Gujarat Neutral Flexible
Haryana Neutral Neutral
Karnataka Flexible Flexible
Kerala Neutral Inflexible
Madhya Pradesh Neutral Flexible
Maharashtra Inflexible Inflexible
Orissa Inflexible Inflexible
Punjab Neutral Neutral
Rajasthan Flexible Neutral
Tamil Nadu Flexible Flexible
Uttar Pradesh Flexible Flexible
West Bengal Inflexible Inflexible
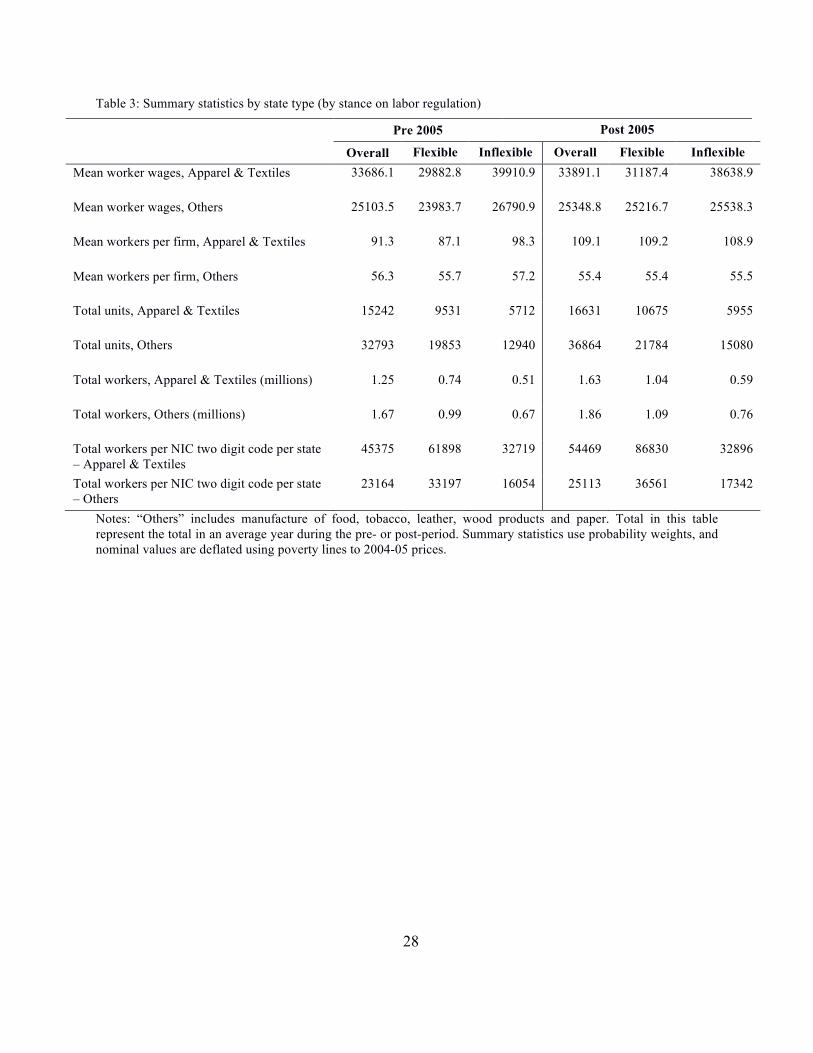
28
Table 3: Summary statistics by state type (by stance on labor regulation)
Pre 2005 Post 2005
Overall Flexible Inflexible Overall Flexible Inflexible Mean worker wages, Apparel & Textiles 33686.1 29882.8 39910.9 33891.1 31187.4 38638.9
Mean worker wages, Others 25103.5 23983.7 26790.9 25348.8 25216.7 25538.3
Mean workers per firm, Apparel & Textiles 91.3 87.1 98.3 109.1 109.2 108.9
Mean workers per firm, Others 56.3 55.7 57.2 55.4 55.4 55.5
Total units, Apparel & Textiles 15242 9531 5712 16631 10675 5955
Total units, Others 32793 19853 12940 36864 21784 15080
Total workers, Apparel & Textiles (millions) 1.25 0.74 0.51 1.63 1.04 0.59
Total workers, Others (millions) 1.67 0.99 0.67 1.86 1.09 0.76
Total workers per NIC two digit code per state – Apparel & Textiles
45375 61898 32719 54469 86830 32896
Total workers per NIC two digit code per state – Others
23164 33197 16054 25113 36561 17342
Notes: “Others” includes manufacture of food, tobacco, leather, wood products and paper. Total in this table represent the total in an average year during the pre- or post-period. Summary statistics use probability weights, and nominal values are deflated using poverty lines to 2004-05 prices.
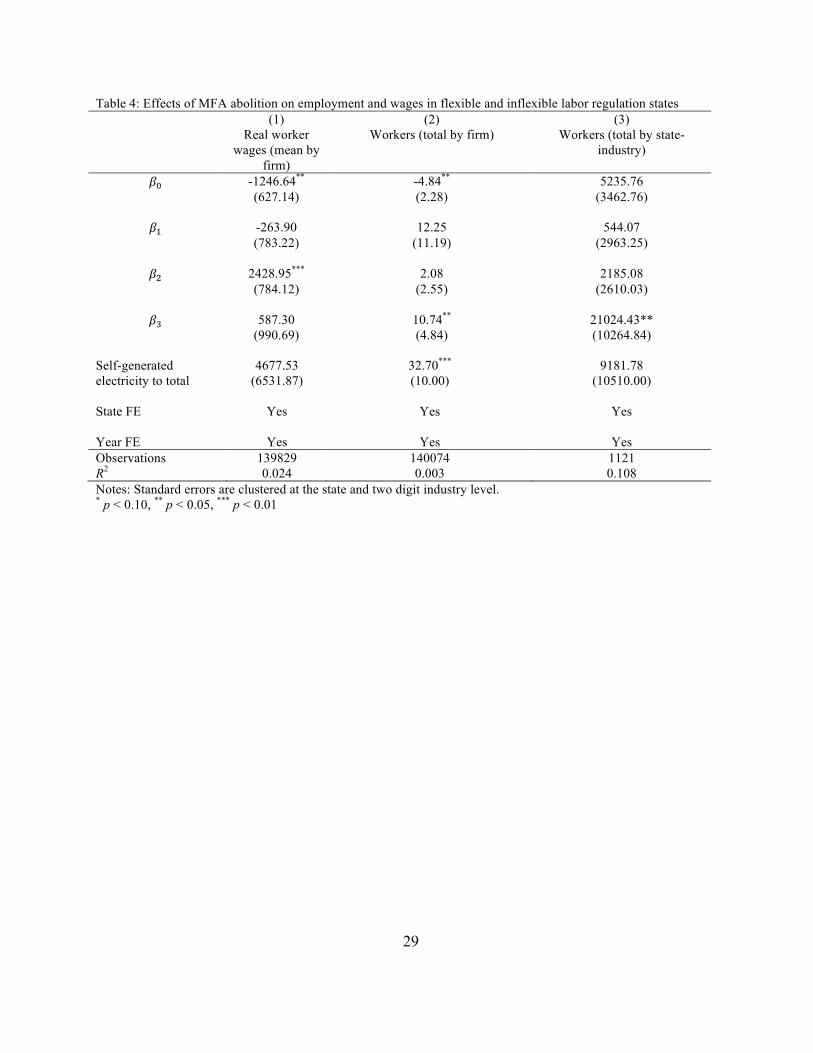
29
Table 4: Effects of MFA abolition on employment and wages in flexible and inflexible labor regulation states (1) (2) (3)
Real worker wages (mean by
firm)
Workers (total by firm) Workers (total by state-industry)
𝛽! -1246.64** -4.84** 5235.76 (627.14) (2.28) (3462.76)
𝛽! -263.90 12.25 544.07 (783.22) (11.19) (2963.25)
𝛽! 2428.95*** 2.08 2185.08 (784.12) (2.55) (2610.03)
𝛽! 587.30 10.74** 21024.43** (990.69) (4.84) (10264.84)
Self-generated electricity to total
4677.53 32.70*** 9181.78 (6531.87) (10.00) (10510.00)
State FE Yes Yes Yes
Year FE Yes Yes Yes Observations 139829 140074 1121 R2 0.024 0.003 0.108 Notes: Standard errors are clustered at the state and two digit industry level. * p < 0.10, ** p < 0.05, *** p < 0.01
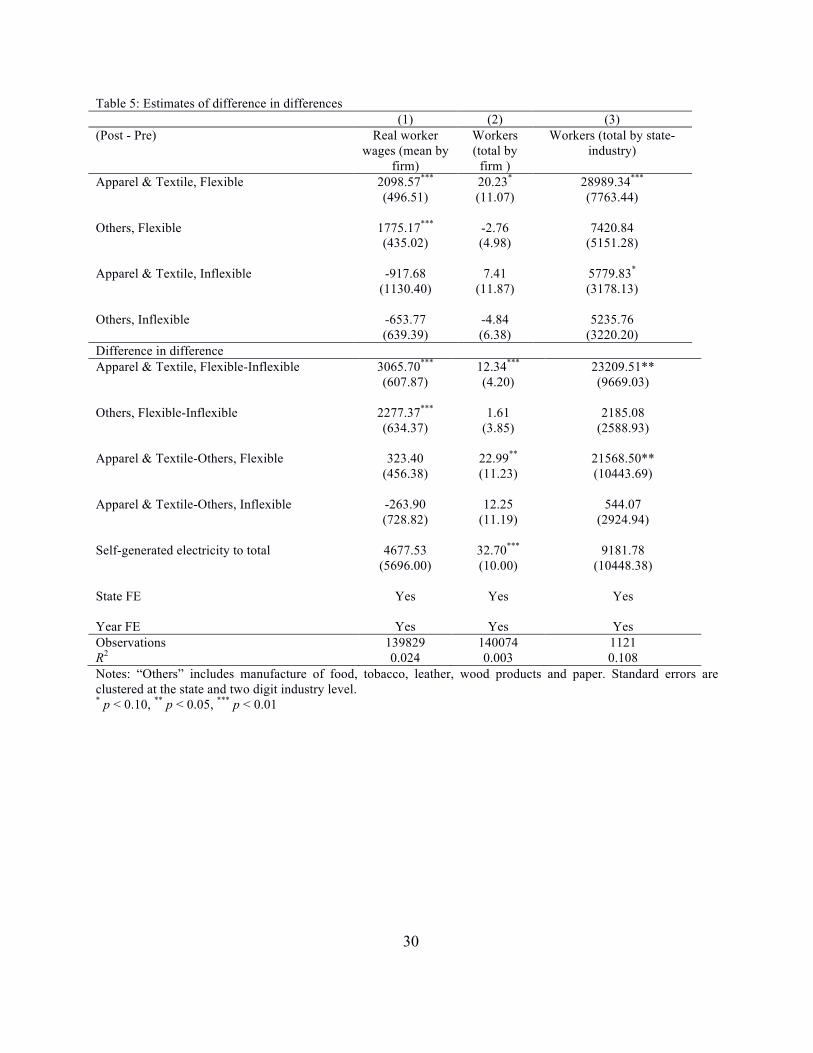
30
Table 5: Estimates of difference in differences (1) (2) (3)
(Post - Pre) Real worker wages (mean by
firm)
Workers (total by
firm )
Workers (total by state-industry)
Apparel & Textile, Flexible 2098.57*** 20.23* 28989.34*** (496.51) (11.07) (7763.44)
Others, Flexible 1775.17*** -2.76 7420.84 (435.02) (4.98) (5151.28)
Apparel & Textile, Inflexible -917.68 7.41 5779.83* (1130.40) (11.87) (3178.13)
Others, Inflexible -653.77 -4.84 5235.76 (639.39) (6.38) (3220.20)
Difference in difference Apparel & Textile, Flexible-Inflexible 3065.70*** 12.34*** 23209.51**
(607.87) (4.20) (9669.03)
Others, Flexible-Inflexible 2277.37*** 1.61 2185.08 (634.37) (3.85) (2588.93)
Apparel & Textile-Others, Flexible 323.40 22.99** 21568.50** (456.38) (11.23) (10443.69)
Apparel & Textile-Others, Inflexible -263.90 12.25 544.07 (728.82) (11.19) (2924.94)
Self-generated electricity to total 4677.53 32.70*** 9181.78 (5696.00) (10.00) (10448.38)
State FE Yes Yes Yes
Year FE Yes Yes Yes Observations 139829 140074 1121 R2 0.024 0.003 0.108 Notes: “Others” includes manufacture of food, tobacco, leather, wood products and paper. Standard errors are clustered at the state and two digit industry level. * p < 0.10, ** p < 0.05, *** p < 0.01
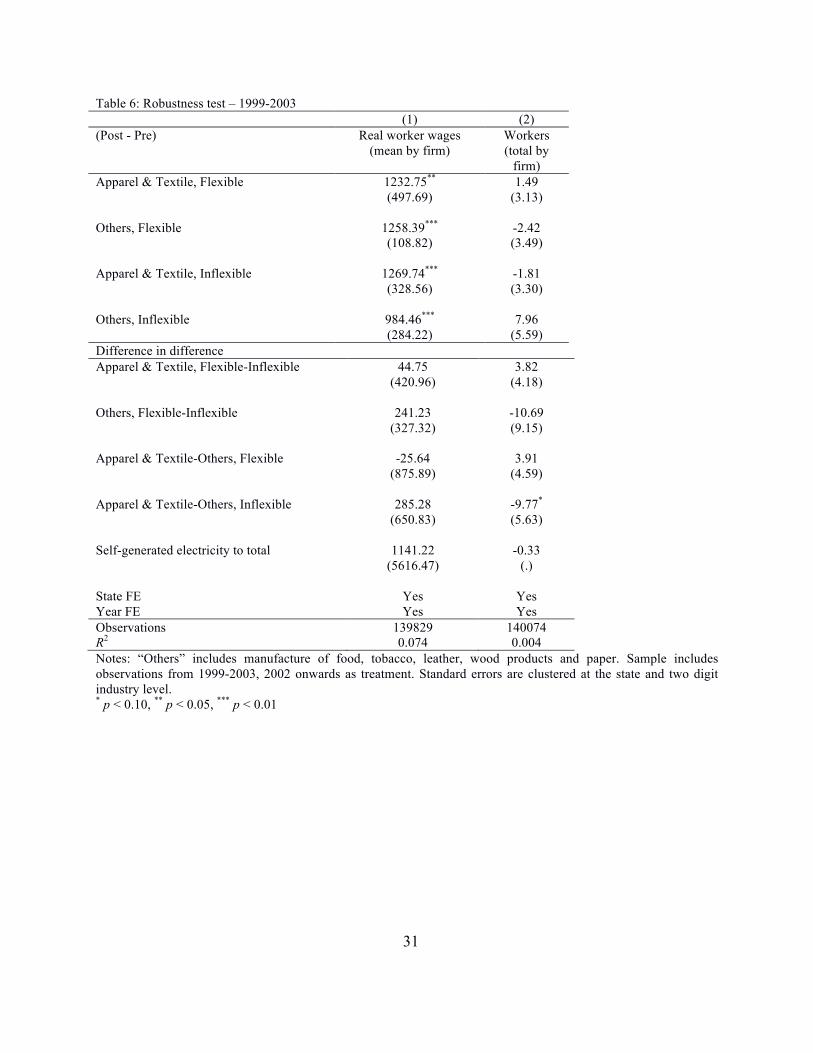
31
Table 6: Robustness test – 1999-2003 (1) (2)
(Post - Pre) Real worker wages (mean by firm)
Workers (total by
firm) Apparel & Textile, Flexible 1232.75** 1.49
(497.69) (3.13)
Others, Flexible 1258.39*** -2.42 (108.82) (3.49)
Apparel & Textile, Inflexible 1269.74*** -1.81 (328.56) (3.30)
Others, Inflexible 984.46*** 7.96 (284.22) (5.59)
Difference in difference Apparel & Textile, Flexible-Inflexible 44.75 3.82
(420.96) (4.18)
Others, Flexible-Inflexible 241.23 -10.69 (327.32) (9.15)
Apparel & Textile-Others, Flexible -25.64 3.91 (875.89) (4.59)
Apparel & Textile-Others, Inflexible 285.28 -9.77*
(650.83) (5.63)
Self-generated electricity to total 1141.22 -0.33 (5616.47) (.)
State FE Yes Yes Year FE Yes Yes Observations 139829 140074 R2 0.074 0.004 Notes: “Others” includes manufacture of food, tobacco, leather, wood products and paper. Sample includes observations from 1999-2003, 2002 onwards as treatment. Standard errors are clustered at the state and two digit industry level. * p < 0.10, ** p < 0.05, *** p < 0.01
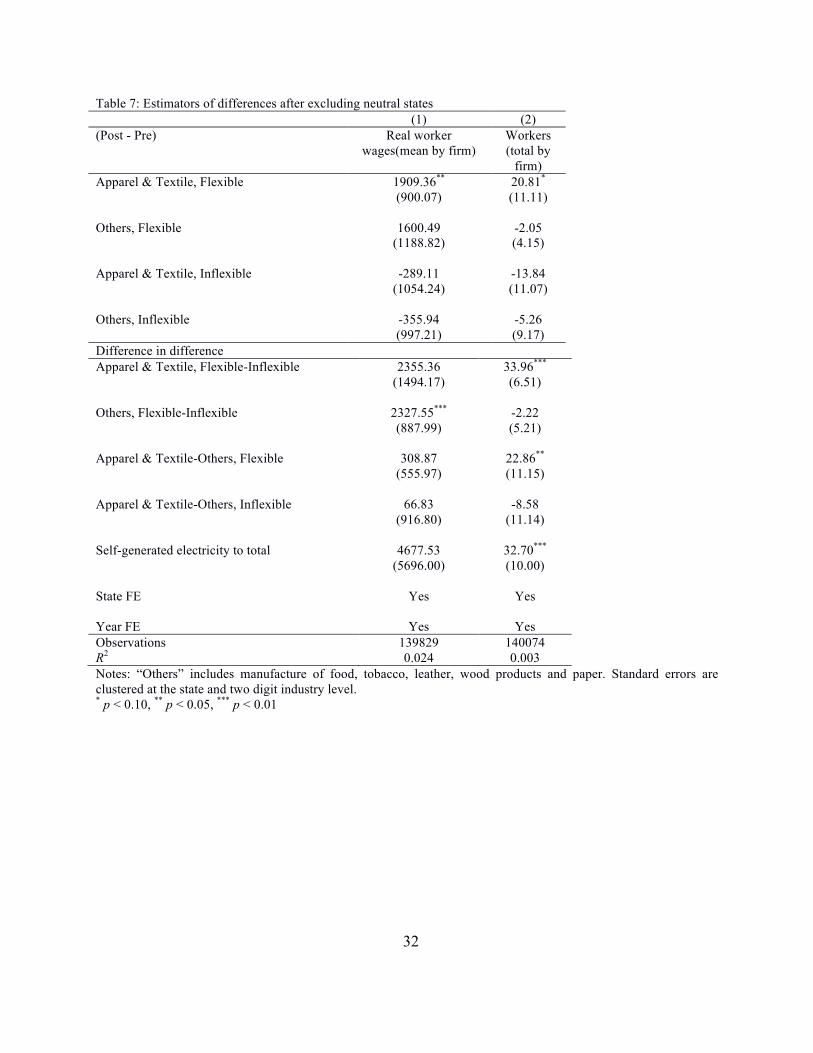
32
Table 7: Estimators of differences after excluding neutral states (1) (2)
(Post - Pre) Real worker wages(mean by firm)
Workers (total by
firm) Apparel & Textile, Flexible 1909.36** 20.81*
(900.07) (11.11)
Others, Flexible 1600.49 -2.05 (1188.82) (4.15)
Apparel & Textile, Inflexible -289.11 -13.84 (1054.24) (11.07)
Others, Inflexible -355.94 -5.26 (997.21) (9.17)
Difference in difference Apparel & Textile, Flexible-Inflexible 2355.36 33.96***
(1494.17) (6.51)
Others, Flexible-Inflexible 2327.55*** -2.22 (887.99) (5.21)
Apparel & Textile-Others, Flexible 308.87 22.86** (555.97) (11.15)
Apparel & Textile-Others, Inflexible 66.83 -8.58 (916.80) (11.14)
Self-generated electricity to total 4677.53 32.70***
(5696.00) (10.00)
State FE Yes Yes
Year FE Yes Yes Observations 139829 140074 R2 0.024 0.003 Notes: “Others” includes manufacture of food, tobacco, leather, wood products and paper. Standard errors are clustered at the state and two digit industry level. * p < 0.10, ** p < 0.05, *** p < 0.01
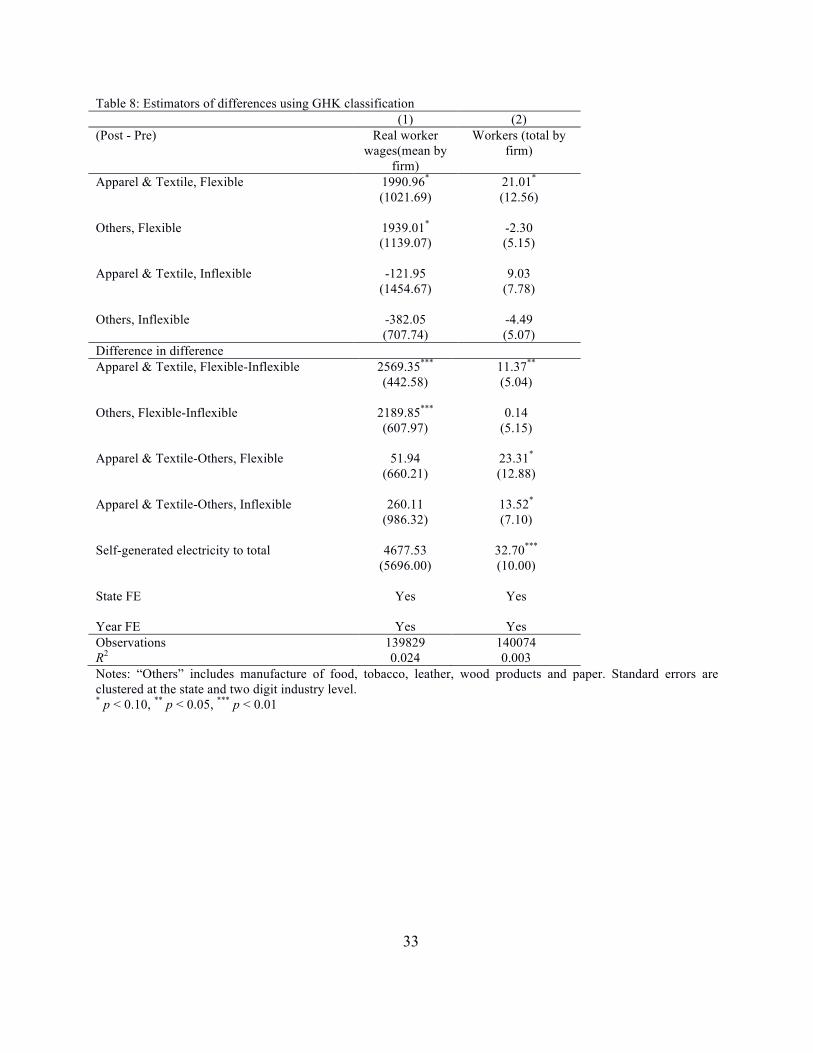
33
Table 8: Estimators of differences using GHK classification (1) (2)
(Post - Pre) Real worker wages(mean by
firm)
Workers (total by firm)
Apparel & Textile, Flexible 1990.96* 21.01* (1021.69) (12.56)
Others, Flexible 1939.01* -2.30 (1139.07) (5.15)
Apparel & Textile, Inflexible -121.95 9.03 (1454.67) (7.78)
Others, Inflexible -382.05 -4.49 (707.74) (5.07)
Difference in difference Apparel & Textile, Flexible-Inflexible 2569.35*** 11.37**
(442.58) (5.04)
Others, Flexible-Inflexible 2189.85*** 0.14 (607.97) (5.15)
Apparel & Textile-Others, Flexible 51.94 23.31* (660.21) (12.88)
Apparel & Textile-Others, Inflexible 260.11 13.52* (986.32) (7.10)
Self-generated electricity to total 4677.53 32.70***
(5696.00) (10.00)
State FE Yes Yes
Year FE Yes Yes Observations 139829 140074 R2 0.024 0.003 Notes: “Others” includes manufacture of food, tobacco, leather, wood products and paper. Standard errors are clustered at the state and two digit industry level. * p < 0.10, ** p < 0.05, *** p < 0.01
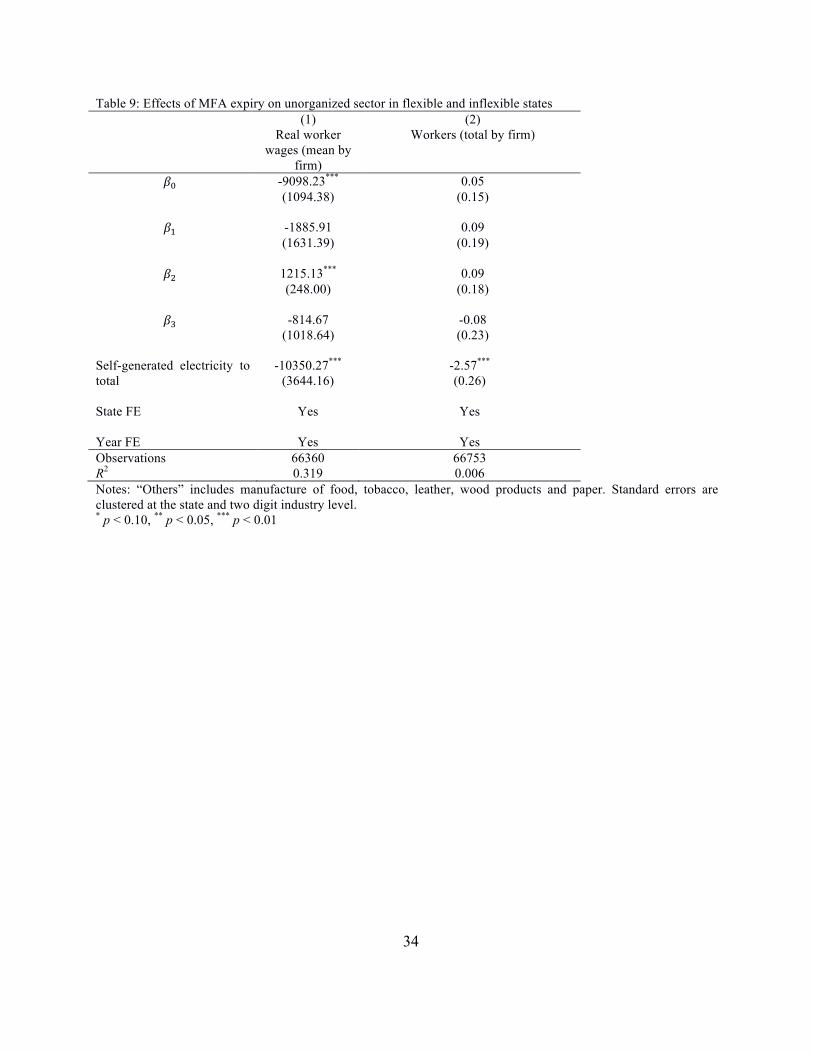
34
Table 9: Effects of MFA expiry on unorganized sector in flexible and inflexible states (1) (2)
Real worker wages (mean by
firm)
Workers (total by firm)
𝛽! -9098.23*** 0.05 (1094.38) (0.15)
𝛽! -1885.91 0.09 (1631.39) (0.19)
𝛽! 1215.13*** 0.09 (248.00) (0.18)
𝛽! -814.67 -0.08 (1018.64) (0.23)
Self-generated electricity to total
-10350.27*** -2.57*** (3644.16) (0.26)
State FE Yes Yes
Year FE Yes Yes Observations 66360 66753 R2 0.319 0.006 Notes: “Others” includes manufacture of food, tobacco, leather, wood products and paper. Standard errors are clustered at the state and two digit industry level. * p < 0.10, ** p < 0.05, *** p < 0.01
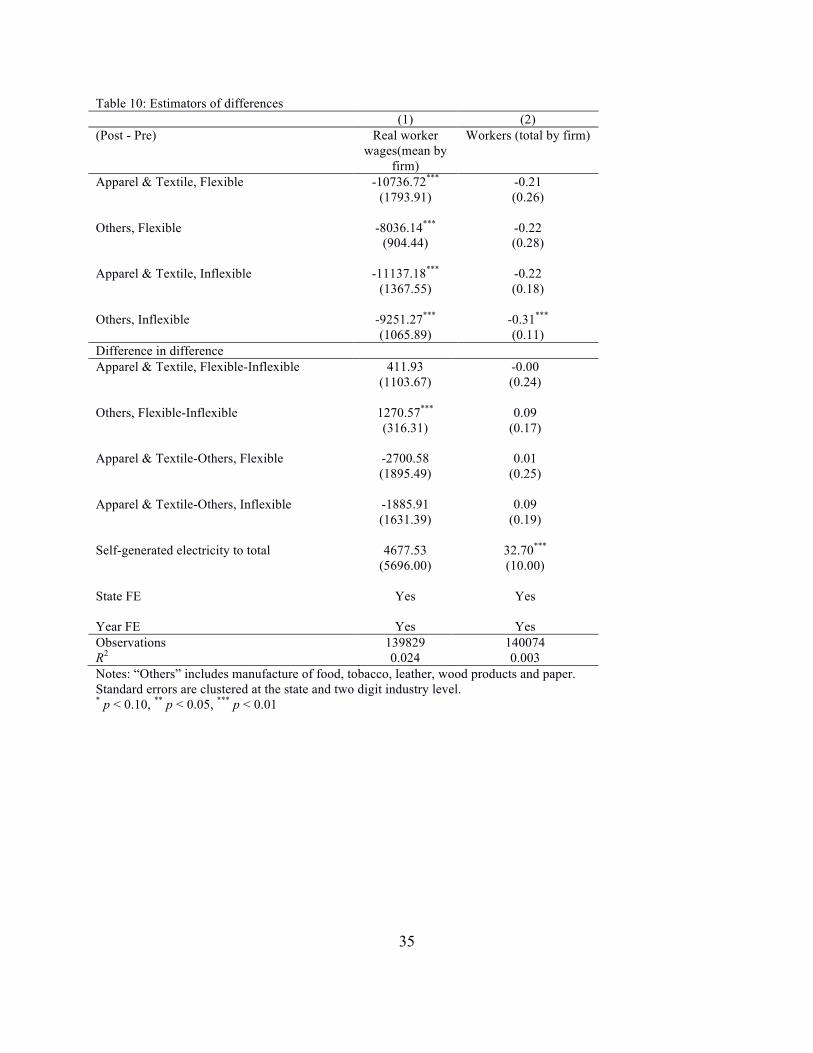
35
Table 10: Estimators of differences (1) (2)
(Post - Pre) Real worker wages(mean by
firm)
Workers (total by firm)
Apparel & Textile, Flexible -10736.72*** -0.21 (1793.91) (0.26)
Others, Flexible -8036.14*** -0.22 (904.44) (0.28)
Apparel & Textile, Inflexible -11137.18*** -0.22 (1367.55) (0.18)
Others, Inflexible -9251.27*** -0.31*** (1065.89) (0.11)
Difference in difference Apparel & Textile, Flexible-Inflexible 411.93 -0.00
(1103.67) (0.24)
Others, Flexible-Inflexible 1270.57*** 0.09 (316.31) (0.17)
Apparel & Textile-Others, Flexible -2700.58 0.01 (1895.49) (0.25)
Apparel & Textile-Others, Inflexible -1885.91 0.09 (1631.39) (0.19)
Self-generated electricity to total 4677.53 32.70***
(5696.00) (10.00)
State FE Yes Yes
Year FE Yes Yes Observations 139829 140074 R2 0.024 0.003 Notes: “Others” includes manufacture of food, tobacco, leather, wood products and paper. Standard errors are clustered at the state and two digit industry level. * p < 0.10, ** p < 0.05, *** p < 0.01
Related Documents