The impact of Information and Communications Technology (ICT) on effective teaching of Environmental Education in rural high schools By Mrs Akosua Agyakoma Mireku (née Osei) (201404887) A dissertation submitted in fulfilment of the requirements for the degree MASTER OF EDUCATION In the FACULTY OF EDUCATION UNIVERSITY OF FORT HARE SOUTH AFRICA Supervisor Prof EO Adu May 2016

Welcome message from author
This document is posted to help you gain knowledge. Please leave a comment to let me know what you think about it! Share it to your friends and learn new things together.
Transcript

The impact of Information and Communications Technology (ICT)
on effective teaching of Environmental Education in rural high
schools
By
Mrs Akosua Agyakoma Mireku (née Osei)
(201404887)
A dissertation submitted in fulfilment of the requirements for the degree
MASTER OF EDUCATION
In the
FACULTY OF EDUCATION
UNIVERSITY OF FORT HARE
SOUTH AFRICA
Supervisor
Prof EO Adu
May 2016

ii
DECLARATIONS
(a) Originality
I declare that this dissertation is my original work. To the best of my knowledge,
this study is not a reproduction of previously published or unpublished research
or materials accepted for the award of any qualifications, except where due
acknowledgement has been made in the test.
Signature ----------------- Date: ____________
(b) Supervisors’ statement
This dissertation has been submitted with/without my approval
------------------------------------- -------------------------
Professor E.O Adu (Supervisor) Date

iii
ABSTRACT
Information and Communication Technology (ICT) has become commonplace
entities in all aspects of life. Over the past twenty years, the use of ICTs has
drastically changed the procedures of almost all forms of endeavour within business
and governance. Additionally, throughout the world there is an awareness of the
fundamental role of new ICTs in the field of education. Education is a socially
oriented activity, and quality education has traditionally been associated with strong
teachers having high degrees of personal contact with learners. The use of ICT in
education lends itself to learner-centred learning settings.
With the world moving rapidly into digital media and information, the role of ICT in
education and the influence of ICT in schools cannot be overemphasised as its utility
is changing the way learners learn, teachers teach, and how it supports staff work.
Whilst ICT is fully integrated into many schools in the urban areas of South Africa,
regrettably the same cannot be said about rural high schools. This has created a
digital division between rural and urban high schools. Most of these rural high
schools still do not have access to these technological tools and educators have not
been given the professional training for them to integrate ICT in their lessons. This
study explores the effectiveness of integrating ICT into teaching of Environmental
Education in selected rural high schools. The quantitative study adopted survey
research design with sample randomly selected for the study. From the findings, it
can be concluded that integrating ICT in education cannot be comprehended by
exploring the pedagogical orientations at play in the teaching and learning situation.
It becomes the basis that teachers use ICTs to achieve the determined goals.
Keywords: Information and Communication Technologies; Integration; pedagogy;
Environmental Education
iv
ACKNOWLEDGEMENTS
This study would not have seen the light of the day had it not been for the
assistance, advice and support of numerous persons. In particular, I would like to
express my deepest gratitude to my supervisor Prof. E.O Adu under whose expert
guidance the study was conducted, analysed, written and submitted.
A sincere word of gratitude also goes to the Department of Basic Education,
Mdastani, for giving me the permission to conduct the survey in the selected rural
high schools. In addition, I am thankful to all the educators who participated
voluntarily.
Words cannot articulate my heartfelt appreciation to my parents, Mr and Mrs Osei,
who have gone to great lengths to bring me this far. Last, but not the least, I would
like to thank Professor Obeng Mireku, my husband, for his immense support and
also for his role as a wonderful academic mentor and a source of inspiration.

v
DEDICATION
My sincere thanks go to the Lord Almighty for the strength and for sustaining me
through this study.
I dedicate this academic monument to my late father, Mr Ernest Osei, and to my
children Melissa Akore Mireku and Kwaku Obeng Mireku.

vi
LIST OF APPENDICES
Appendix A : Research Questionnaire (Teachers)
Appendix B : Letter of Consent (Teachers)
Appendix D: Letter of permision from the Department of Basic Education
Appendix E: Informed Consent Form
Appendix F: Language Editing Certificate

vii
LIST OF TABLES
Table 2.1: History of Information Technology ........................................................... 30
Table 2.2: An adapted model of patterns of uses of ICT .......................................... 31
Table 2.3: Schools with computers according to provinces (2000) .......................... 48
Table 2.4: Teacher Centred and Learner Centred Learning Environment ................ 50
Table 3.1: Tenets of Positivism (Yin, 2003) .............................................................. 80
Table 4.1: Response rate of educators/ teachers ..................................................... 92
Table 4.2: Gender of the teacher/ educator .............................................................. 93
Table 4.3: Qualification of the teacher ...................................................................... 95
Table 4.4: Work experience of the teacher ............................................................... 96
Table 4.5: Descriptive statistics ................................................................................ 98
Table 4.6: Group Statistics on how ICT improves teaching EE .............................. 100
Table 4.7: T-test Independent Samples Test on how ICT improves teaching EE .. 101
Table 4.8: T-test: Group Statistics availability of ICT resources ............................. 103
Table 4.9: T-test: Independent Samples Test availability of ICT resources ............ 104
Table 4.10: T-test: Group Statistics attitudes towards use of ICT tools .................. 106
Table 4.11: T-test: Independent Samples Test attitudes towards use of ICT tools 107
Table 4.12: T-test: Group Statistics for efficient usage of ICT tools........................ 109
Table 4.13: T-test: Independent Samples Test for efficient usage of ICT tools ...... 110
Table 4.14: Descriptive ANOVA: Education Level and Effective use of ICT ........... 113
Table 4.15: Descriptive ANOVA: Education Level and Availability of resources .... 115
Table 4.16: Descriptive ANOVA: Education Level and Attitude of Teachers .......... 116
Table 4.17: Descriptive ANOVA: Education level and efficient usage of ICT ......... 118
Table 4.18: Analysis of variance (ANOVA) Educational level ................................. 120
Table 4.19: Descriptive ANOVA: Teaching experience and Effective use of ICT ... 124
Table 4.20: Descriptive ANOVA: Teaching experience and availability of resources
............................................................................................................................... 126
Table 4.21: Descriptive ANOVA: Teaching experience and attitude of teachers .... 128
Table 4.22: Descriptive ANOVA: Teaching experience and availability of ICT support
............................................................................................................................... 130
Table 4.23: Analysis of Variance (ANOVA) educational level ................................ 132
Table 4.24: Chi-Square .......................................................................................... 136
Table 4.25: Chi-Square Tests ................................................................................ 137

viii
Table 4.26: Chi-Square Tests ................................................................................ 138
Table 4.27: Chi-Square Tests ................................................................................ 139

ix
LIST OF FIGURES
1. Figure 4.1 Gender and the teacher 94
2. Figure 4.2 Qualification of the teacher 95
3. Figure 4.3 Work experience of the teacher 97

x
LIST OF ACRONYMS AND ABBREVIATIONS
Becta British Education Communication and Technology Agency
CAL Computer Assisted Learning
CAI Computer Assisted Instruction
CAPS Curriculum and Assessment Policy Statement
CD–ROM Compact Disc Read Only Memory
DST Department of Science and Technology
DoE Department of Education
ECDL European Computer Driving License
EE Environmental Education
EECI Environmental Education Curriculum Initiative
EEPI Environmental Education Policy Initiative
ELFE European e–learning Forum for Education
ESD Education for Sustainable Development
ETUCE European Trade Union Committee on Education
GET General and Educational Training
ICT Information and Communication Technology
ICTs Information and Communication Technologies
IEEP International Environmental Education Program
IT Information Technology
MIS Management Information Systems
NCS National Curriculum Statement

xi
NEEAC National Environmental Education Advisory Council
NEIMS National Education Infrastructure Management System
NEEP National Environmental Education Project
NEPAD New Economic Program for African Development
NGO Non-Governmental Organization
TELI Technology Enhanced Learning Initiative
UNDP United Nations Development Program
UNESCO United Nations Educational Scientific and Cultural Organization
WWW World Wide Web
xii
Table of Contents
DECLARATIONS ........................................................................................................................... ii
ABSTRACT.................................................................................................................................... iii
ACKNOWLEDGEMENTS ............................................................................................................ iv
DEDICATION .................................................................................................................................. v
LIST OF APPENDICES ................................................................................................................ vi
LIST OF TABLES..........................................................................................................................vii
LIST OF ACRONYMS AND ABBREVIATIONS.......................................................................... x
CHAPTER ONE .............................................................................................................................. 1
INTRODUCTION AND BACKGROUND ....................................................................................... 1
1.0 Introduction .......................................................................................................................... 1
1.1 Distinctions between Rural and Urban Areas in South Africa .......................................... 4
1.1.1 Teachers in rural schools and ICT ............................................................................... 5
1.1.2 South Africa’s general ICT profile in schools .............................................................. 7
1.1.3 ICT in Environmental Education ................................................................................... 8
1.1.4 Adoption and use of ICT in Environmental Education ........................................ 11
1.2 Statement of the Problem .................................................................................................. 14
1.3 Rationale of the Study ........................................................................................................ 17
1.4 Significance of the Study .............................................................................................. 17
1.5 Scope and Limitations of the Study .................................................................................. 18
1.6 Research Questions ........................................................................................................... 18
1.6.1 Main research question ............................................................................................... 18
1.6.2 Sub-research questions .............................................................................................. 18
1.7 Research Objectives ..................................................................................................... 19
1.8 Operational Definition of Terms ........................................................................................ 19
1.8.1 Environmental Education ............................................................................................ 19
1.8.2 Teaching ....................................................................................................................... 19
1.8.3 ICT ................................................................................................................................ 20
1.8.4 GET band ..................................................................................................................... 20
1.8.5 Teacher or educator .................................................................................................... 21
1.8.6 Learners ....................................................................................................................... 21
1.8.7 Schools ......................................................................................................................... 21
1.8.8 Sustainable development ........................................................................................... 21

xiii
1.8.9 Curriculum .................................................................................................................... 22
1.9 Research Methodology ...................................................................................................... 22
1.9.1 Research paradigm ..................................................................................................... 22
1.9.2 Research design .......................................................................................................... 22
1.9.3 Population sample ....................................................................................................... 22
1.9.4 Data collection ............................................................................................................. 22
1.9.5 Procedure ..................................................................................................................... 23
1.9.6 Data analysis ............................................................................................................... 23
1.10 Ethical Considerations ..................................................................................................... 24
1.11 Structure of the Research Report ................................................................................... 24
CHAPTER TWO ........................................................................................................................... 25
LITERATURE REVIEW ................................................................................................................ 25
2.0 Introduction ......................................................................................................................... 25
2.1 Overview of the concept: ICT ............................................................................................ 26
2.2 Education and ICT .............................................................................................................. 27
2.2.1The brief history of ICT in education ........................................................................... 29
2.2.2 General use of ICT in education ................................................................................ 30
2.2.3 The South African e–Education policy ....................................................................... 31
2.2.4 The concept of educational technology ..................................................................... 35
2.3 ICT Integration in Education .............................................................................................. 36
2.3.1 ICT integration in South Africa ................................................................................... 39
2.3.2 Barriers to integrating ICT into education .................................................................. 39
2.3.2.1 The teacher’s perceptions towards the use of ICT ................................................ 39
2.3.2.2 Teachers’ attitudes towards the use of ICT ........................................................... 41
2.3.2.3 Teacher ICT skill ...................................................................................................... 43
2.4 ICT in Rural High Schools and Communities in South Africa ......................................... 45
2.4.1 ICT in township and rural communities in South Africa ........................................... 45
2.4.2 ICT in rural high schools in South Africa ................................................................... 45
2.4.3 Problems encountered in using ICTs in rural high schools ......................................... 46
2.4.4 Initiatives to bridge the urban and rural digital divide ............................................... 47
2.5 The Importance of School Culture on ICT in Rural Schools ........................................... 48
2.5.1 The role of teachers in technology mediated environment ...................................... 49
2.6 ICT on Curriculum Development ....................................................................................... 52
2.6.1 The concept of curriculum development ................................................................... 52

xiv
2.6.2 ICT on the curriculum development ........................................................................... 53
2.6.3 Cross–curricular teaching of Environmental Education in South Africa ................. 54
2.6.4 ICT curriculum models in relation to Environmental Education ............................... 55
2.7 Cost and Implementation of ICT Resources .................................................................... 55
2.7.1 Availability, cost and implementation of ICT resources ........................................... 55
2.7.1.1 School based strategies .......................................................................................... 58
2.7.1.2 External environmental strategies .......................................................................... 60
2.8 History of Environmental Education in South Africa ........................................................ 60
2.8.1The development of Environmental Education in South Africa ................................ 61
2.8.2 South Africa Environmental Education policies ........................................................ 63
2.8.3 The teaching models, concepts of environmental education and ICT .................... 65
2.9 Environmental Education Learning Strategies ................................................................. 67
2.9.1 Active learning ............................................................................................................. 68
2.9.2 Critical thinking ............................................................................................................ 68
2.9.4 Problem solving ........................................................................................................... 69
2.9.5 Authentic learning ........................................................................................................ 69
2.10 ICT Implementation on the Curriculum ........................................................................... 69
2.10.1 ICT Implementation in the developed world ............................................................ 71
2.10.2 ICT implementation in the developing world ........................................................... 72
2.10.3 ICT implementation at national level ....................................................................... 72
2.10.4 ICT Implementation at school level .......................................................................... 73
2.11 THEORETICAL FRAMEWORK ...................................................................................... 74
2.11.1 Cognitive theory ......................................................................................................... 74
2.12 Cognitive Theory and ICT Integration ............................................................................. 75
2.12.1 Learning from ICTs.................................................................................................... 75
2.12.2 Learning with ICTs .................................................................................................... 75
2.12.3 Learning about ICTs .................................................................................................. 76
2.13 Summary ........................................................................................................................ 76
CHAPTER THREE ....................................................................................................................... 77
RESEARCH METHODOLOGY ................................................................................................... 77
3.0 Introduction ............................................................................................................................. 77
3.1 Research approach ............................................................................................................ 77
3.1.1 Research paradigm ..................................................................................................... 79
3.2 Research Design ................................................................................................................ 81

xv
3.2.1Survey and correlation study ....................................................................................... 81
3.3 The Setting .......................................................................................................................... 83
3.3.1 Population .................................................................................................................... 83
3.3.2 Sample and sampling techniques .............................................................................. 84
3.3.2.Simple random sampling ............................................................................................ 84
3.4 Data Collection Methods .................................................................................................... 85
3.4.1 Research instruments ................................................................................................. 85
3.4.1.1 Questionnaire ........................................................................................................... 85
3.5 Data Analysis ...................................................................................................................... 86
3.5.1 Reliability ...................................................................................................................... 87
3.5.2 Validity .......................................................................................................................... 88
3.6 Ethical Considerations ....................................................................................................... 88
3.7 Summary ............................................................................................................................. 89
CHAPTER FOUR ......................................................................................................................... 90
DATA PRESENTATION AND ANALYSIS .................................................................................. 90
4.0 Introduction .................................................................................................................... 90
4.1 Background Information of Educators/ Teachers ....................................................... 90
4.1.1 Response rate educators/ teachers ..................................................................... 91
4.1.2 The normality of the data ...................................................................................... 92
4.1.3 Demographic profiles of respondents .................................................................. 92
4.1.4 The gender of respondents ................................................................................... 92
4.1.5 Qualification of the teacher ................................................................................... 94
4.1.6 Work experience of the teacher............................................................................ 96
4.2 Descriptive Statistics on the Adoption and Integration of ICT in Teaching
Environmental Education in Rural High Schools ................................................................... 97
4.2.1 T-Test ........................................................................................................................... 99
4.3 Analysis of Variance (ANOVA) ........................................................................................ 111
4.3.1 Analysis of variance (ANOVA) educational level .................................................... 111
4.3.2 Descriptive ANOVA: Education Level and Effective use of ICT ...................... 111
4.3.3 Descriptive ANOVA: Education Level and Availability of resources ............... 114
4.3.4 Descriptive ANOVA: Education Level and Attitude of Teachers ..................... 116
4.3.5 Descriptive ANOVA: Education level and efficient usage of ICT ..................... 117
4.4 Analysis Of Variance (ANOVA) Teaching Experience .................................................. 122
4.4.1 Descriptive ANOVA: Teaching experience and the effective use of ICT in teaching
EE ......................................................................................................................................... 122

xvi
4.4.2 Descriptive ANOVA: Teaching experience and availability of resources........ 125
4.4.3 Descriptive ANOVA: teaching experience and attitude of teachers ...................... 127
4.4.4 Descriptive ANOVA: Teaching experience and availability of ICT support and
efficient use of ICT .............................................................................................................. 129
4.5 Chi-Square Test................................................................................................................ 135
4.6 Summary ........................................................................................................................... 139
CHAPTER FIVE .......................................................................................................................... 140
DISCUSSIONS OF FINDINGS, SUMMARY, CONCLUSION AND RECOMMENDATIONS
...................................................................................................................................................... 140
5.0 Introduction ....................................................................................................................... 140
5.1 Discussions ....................................................................................................................... 140
5.1.1 ICT integration in education ...................................................................................... 140
5.1.2 Mastery of ICT integration in teaching ..................................................................... 141
5.1.3 Establish the availability of technological tools ....................................................... 141
5.1.4 The teacher or educator............................................................................................ 143
5.1.5 General trends in rural high schools ........................................................................ 144
5.2 Summary ........................................................................................................................... 146
5.3 Conclusions and Recommendations .............................................................................. 148
REFERENCES ........................................................................................................................... 151
APPENDIX A: RESEARCH QUESTIONNAIRE- TEACHERS ............................................... 170
APPENDIX B: LETTER OF CONSENT .................................................................................... 176
APPENDIX C: ETHIC CLEARANCE CERTIFICATE .............................................................. 177
APPENDIX E: INFORMED CONSENT FORM ........................................................................ 180
APPENDIX F: LANGUAGE EDITING CERTIFICATE ............................................................. 183

1
CHAPTER ONE
INTRODUCTION AND BACKGROUND
1.0 Introduction
The 21st century global explosion in Information and Communication Technology
(ICT) has obvious implications for the increasing use of ICT in schools. Traditionally,
teaching and learning in schools could be enhanced with the provision of learning
resources to increase active learner participation. But now with the advancement in
ICT, learners can have access to a wide range of learning resources, especially
where teaching and learning take place on the web. Digital technology is often
presented as a driving force of the transformation of education, which carries positive
overtones that ICT will make a contribution to this transformation “for the better”
(Fisher, 2006; Nivala, 2009). With the rapid explosion of ICT, this leads to computers
becoming part of daily life and has pushed ICT and computers into classrooms at all
educational levels during the last three decades.
The act of improving the quality of education through diversification of contents and
methodology and promoting experimentation, innovation, the dispersion and sharing
of information and best practices as well as policy dialogued are UNESCO’s
strategic objectives in education. Education systems around the world are under
increasing pressure to make use of new information and communication
technologies (ICTs) to teach learners the knowledge and skills they need in the 21st
century. The 1998 UNESCO World Education Report, Teachers and Teaching in a
Changing World, describes the radical implications ICT has for conventional teaching
and learning, and predicts the transformation of the teaching and learning process. It
states:
“New possibilities are emerging which already show a powerful impact on
meeting basic learning needs, and it is clear that educational potential of
these possibilities has barely been tapped. These new possibilities exist
largely as a result of two converging forces, both recent by–products of the
general development process. First quantity of information available in world

2
much of it relevant to survival and basic well–being is exponentially greater
than that available, only a few years ago, and the rate of its growth is
accelerating. A synergistic effect occurs when important information is
coupled with the second modern advance – the new capacity to communicate
among the people of the world” (UNESCO World Education Report, 1998, p.
19).
According to Daniels (2002), ICT has become, within a short time frame, one of the
integrants of modern society. Many countries now understand ICT as a basic skill
and entity which forms part of the core of education. Presently, many teachers are
embracing new technologies and have been concerned about how to improve
learning through the more effective way and appropriate use of technology. The rate
of Information and Communications Technology innovation diffusion in high school
classrooms has not kept pace with other professions nor even with the general
environment (Cuban, 1994, 1997; Geoghegan, 1994). While a minority of educators
have aggressively adopted ICT in the classroom, majority of educators in the rural
high schools have not adopted or have rejected most ICT innovations and have
maintained the traditional lecture based instruction format (Duderstadt et al., 2002).
Presently, ICT is considered as an important way of promoting new methods of
teaching and learning. The availability of the Internet provides a channel for the use
of an electronic approach to learning, known as ‘electronic learning’ or ‘e-learning’.
E-learning is the method of teaching and learning using the Internet via the
computer. It comprises of delivering structured instructional content to the learner.
Erah (2006) defined e-learning as using computers and the Internet to enhance
learning. Rosenberg (2001) also explained that e-learning is using the appropriate
application of the Internet to support the delivery of skills and knowledge.
The gap between integrating ICT in educational settings and the current level of ICT
integration has inspired researchers to focus on teachers and the difficulties they
encounter integrating tools into their classroom practices (Drent & Melissen, 2008;
Hsu et al., 2008). Identifying the facet and explaining ICT use is seen as a way of
answering the question why some teachers welcome the use of technologies in
teaching whilst others do not. These determinants are usually technology related
teacher characteristics where, for example, teachers’ attitudes and self-efficacy are

3
in focus (Herman, Tondeur, van Braak, & Valcke, 2008). ICT has become an
indispensable tool in today’s information age, making a great footprint in the lives of
people. Its influence is the most important in education. The computer has become a
contraption or an aid for teaching and learning in many schools almost throughout
the world (Mossom, 1999; World Bank, 1999).
There have been a quite numerous of attempts to equip South African schools with
ICT. Organisations, especially School Net SA (Caroll, 1998), address on a national
level the issue of providing ICT to South African schools. The World Links for
Development (WorLD), which is a networking programme, has been providing ICT to
South African schools where it is needed most (the Eastern Cape and Kwa Zulu
Natal). The WorLD programme intends to network and provide professional training
for teachers in developing countries including South Africa to improve their ICT skills
and to ensure that technologies are used effectively. The South African government
has committed itself to improving the information and communication technology
skills of its people and to bridge the gap by targeting the disadvantaged groups. This
is in line with the New Partnership for Africa Development (NEPAD) programme to
achieve a sustainable development in the 21st century (DoE, 2003).
In 1997, the National Centre for Educational Technology and Distance Education in
the National Department of Education, following on from the Technology Enhanced
Learning Initiative (TELI), discovered the need for the expansion of clear, umbrella
policies for addressing the development of sustainable ICT capacity in South African
schools. The main objective was to inquest the nature and extent of ICT provision in
the schooling sector, soliciting how ICT is being used and to consider factors that
could hinder the effective use of ICTs in schools. The South African government has
participated in the global market place of ICT and the importance of education in
contributing to effective participation. It uses “Technology Enhanced Learning” as a
phrase to describe the implementation of technologies in teaching and learning for
education purposes (SAIDE Report, 2001).
Many initiatives have been run aimed at addressing the concerns in this area. These
initiatives were made up of conferences on the issue of developing countries and the
introduction of policies on ICT development in education. For these to be
sustainable, ICT should be effectively infused into school programmes, and it needs
4
to be seen as important by teachers and administrators. By so doing, it will be part of
a more comprehensive programme towards improving the quality of an education
system.
1.1 Distinctions between Rural and Urban Areas in South Africa
There is a continuous technological advancement that has benefited both developed
and developing countries’ progress. This section reflects on problems faced by
teachers from rural disadvantaged communities of South Africa in relation to the use
of ICT in education.
According to Rural Development Framework of 1997 cited in Van Donk, Swilling,
Pieterse, and Parnell (2012, p. 1), rural areas are defined as:
“Sparsely populated areas in which people farm or depend on natural
resources, including the villages and small towns that are dispersed through
these areas, which also include the large settlements in the former
homelands, created by apartheid removals which depend for their survival on
migratory labour remittances.”
Rural areas can also be classified as communal areas, whereas commercial areas
are characterised by large farms. The workforce is composed mainly of poor Black
people, and the lands they have occupied have no economic base. The people
practise subsistence farming from the fields and home gardens (Van Donk et al.,
2012). A study by Index Mundi (2012) indicated that the rural population in South
Africa was 19 146 670, which constituted 38,3% of the total population in South
Africa. However, there has been a rise in urbanisation, but the depth of poverty still
remains in the rural areas.
On the other hand, urban settings, which include cities and towns, are densely
populated and are more affluent. For example, in 2010, Guateng had a population
density of 616 people per km square (Brand South African Media Services, 2012).
The population in urban South Africa was 30 844 630 which made 61,7%, according
to a World Bank report published in 2012 (Anon, 2012).
ICT for rural schools has gradually become a political issue in developing countries.
The situation is seen as a matter of equity with regard to access and opportunities.

5
Communication infrastructure is usually a more complex issue. Many rural areas in
the Eastern Cape Province of South Africa lack telephone or mobile coverage, which
makes it extremely difficult to use the Internet access solutions as compared to those
learners in the urban areas. In addition, regular communication and Internet facilities
may be more expensive in rural areas. Even though it is possible to have access to
Internet facilities in rural schools, regardless of their geographical location, it is still
implemented on a small scale which is for one specific school or for a few schools.
1.1.1 Teachers in rural schools and ICT
Rural high school teachers, however, are used to working within a stressful working
environment with limited resources, which makes them become creative in solving
problems in different ways. They progressively integrate technology in their teaching
for pedagogical objectives. The integration of ICT in pedagogical practice is very
important in developing the teacher in the rural high schools. If it is overlooked, it
cannot be implemented. Therefore it is necessary for teachers in rural high schools
to be developed for these technological basic skills (Mfum–Mensah, 2003).
South Africa faces significant challenges as a nation, more especially with regard to
implementing ICT in Environmental Education classrooms in rural areas. Many
people in the rural areas exist below subsistence levels and remain impoverished, so
for this simple reason alone that they have no access to infrastructure for
development. Class sizes in the rural areas in South Africa are large, and providing
adequate resources for these classrooms has always been a challenge.
The ICT Research Priorities for the South African National Research Foundation
(Information and Communication Technology, 2002,p.1) has stressed the need for
ICT to form a new impact which will bring about the information age and the
information society, both popular concepts in use today.
South African policy on ICT in education is determined by the Department of Science
and Technology (DST), the Department of Communications, and the Department of
Education. The collaboration between the Departments of Education and
Communication came up with the e–Education white paper [18] which made a
contribution to the reduction of Internet tariffs by 50% in schools. The targets set
were to:

6
• Build an education and training system to support ICT integration in
teaching and learning;
• Build a framework for competencies for teacher development in the
integration of ICTs into the curriculum;
• Establish ICT in schools; and
• Ensure that schools are connected and have access to the Internet.
The South African government has made a commitment to improve the Information
and Communication Technology (ICT) skills of its people, and to bridge the digital
divide by targeting previously disadvantaged groups. The idea is in line with the New
Partnership for Africa’s Development (NEPAD) programme to achieve a sustainable
development in the 21st century (Department of Education, 2003).
The integration of technology into a curriculum is complex. Akbaba–Altun (2004) and
Reid (2002) warned that the successful integration of ICT depends on incorporating
variables such as teachers’ knowledge, skills and attitudes towards ICT, adequacy of
infrastructure, curriculum strategy, and school managements’ attitude.
Semenov (2005) reported that ICT provides opportunities:
“To facilitate learning for learners who have different learning styles and
abilities, make learning environments more useful with more senses in a
multimedia context; and more connections in a hypermedia context; provide a
broader international context for approaching problems as well as being more
sensitive to local needs” (p.23).
In these times of immense change, much of which is directly associated with
technological advances, educators are beginning to think about the implications of
the utilisation of the new information technologies for communication and
representation. In this context of rapid and far reaching change, educators are
asking substantive questions about pedagogical practices. In particular, they are
beginning to take account of the new implications of the use of ICT.
ICT competency has become necessary because learners have to work in the
modern knowledge economy since the labour market has been penetrated and

7
driven by modern ICT. ICT developments require and enable a greater integration of
education, both merging in ways not seen before. There is opportunity for innovative
practices to be developed for schools to open space for new connections and to
realise the potential for life-long learning, which can be seen, for example, with the
development of the University for Industry and the validation of practice related
degrees.
1.1.2 South Africa’s general ICT profile in schools
South African schools have incorporated traditional teaching modes that have stayed
the same for the last few decades or so. Most South African institutions – in
particular previously disadvantaged schools – face numerous challenges such as
declining financial support from the government. The challenges faced by schools in
South Africa that do not use ICT as a means of enhancing teaching and learning has
led South Africa to failing to close the digital divide (DoE, 2003). The digital divide is
defined as the gap between those individuals who benefit from digital technology and
those who do not (DoE, 2003).
The Electronic and Communication Transaction Act, No 25 of 2002 was established
by the Department of Communication (DoC) in a bid to promote all ICT initiatives in
South Africa and to develop a five year national e-strategy which would empower all
citizens, especially the education sector. The South African government, in
collaboration with the DoC, hosted a National ICT Policy Colloquium on 19- 20 April
2012 at Gallagher Estate. The main objective was to start a process of scrutinizing
all government ICT policies that have existed since 1994. The DoC also hosted an
ICT Indaba in Cape Town in 2012, which met together with other stakeholders in
business labour and civil society across Africa and the world.
Computer usage was established in South African Schools around the early 1980s,
chiefly in private schools and a few well-resourced government schools. The
computers were mainly used for administrative purposes, for example recording
marks and creating timetables, until ICT exploded globally and came to be
considered as a basic requirement for the knowledge society for which universities
now prepare students (Castells, Flecha, & Freire et al., 1999). Thus an investigation
into its integration into education to meet the changing dynamics is of great
importance.

8
Although there is an urgent need for ICT implementation in schools to be spread
across the entire of South Africa, there are numerous challenges that make it
impossible to attain this goal. According to Crawford (2006), one of the major
challenges in implementing ICT in schools is that Information Technology (IT) based
Management Information Systems (MIS) are expensive to set up. Crawford (2006)
further argued that it is costly to buy some hardware and the software required.
1.1.3 ICT in Environmental Education
Education is a community oriented activity and quality education has traditionally
been affiliated with educators having personal contact with learners. Educators have
within their power the opportunity to shift their own beliefs and understanding about
new technologies and about their place in teaching Environmental Education. The
use of ICT in teaching Environmental Education lends itself to more learner-centred
settings (SchoolNet, 2006, p. 2). Educators have been working to break this lecture–
centred instructional model by shifting the focus from the curriculum to learner
learning needs as the driver of the instruction. There is usually available time for
learners to collaborate with their peers on projects, engage more deeply with
content, and practical skill (SchoolNet, 2006, p. 2).
Orr (1992) cited in Culter Mackenzie and Smith (2003) explained that education is
the single most important element needed to address world environmental
challenges (). Thus, a good number of EE teachers strongly argue that, ideally, every
school curriculum must mainstream EE instead of offering it as a stand-alone
subject. Similarly, cross–sectional coordination in the development of EE teaching
and learning materials stands out as a major recommended strategy in the
innovative NSW Environmental Education Plan (2007-2010, learning for
sustainability).
Environmental Education has been embedded in most subjects like natural sciences
in the GET Band. The main goal of Environmental Education in the National
Curriculum Statement (NCS) is that learners develop methods in solving
environmental problems (UNESCO, Tbilisi Declaration, 1978). Environmental
Education is part of the curriculum since it helps the learners to be knowledgeable of
their environment and how to solve problems. Through Environmental Education,
learners will be expected to have opportunities to develop skills such as questioning,

9
observing and interpreting observation. ICT can be utilized for teaching EE by
facilitating information.
With the revision of Curriculum 2005 and the adoption of the National Curriculum
Statement for General Education and Training (GET) came the need to refocus
Environmental Education work in the curriculum policy document. This means that
Environmental Education processes are now integral to all learning areas in the
formal curriculum. These are held together by the principle of the National
Curriculum Statement (NCS) that recognizes the relationship between human rights,
inclusivity, and a healthy environment and social justice (Lotz–Sisitka & Raven,
2001). ICT is becoming more integral to the lives of South African citizens. Learners
of the new curriculum based on the latest revised Curriculum and Assessment Policy
Statement (CAPS) implemented in 2004 (DoE, 2002) are expected to have access to
relevant information through the World Wide Web, which is an important facility in
the implementation of NSC.
ICT can be utilised for teaching Environmental Education by facilitating information
gathering and dissemination. According to Adu and Tella (2010), applying ICT as a
tool for teaching in the curriculum areas enables students to become “competent,
discriminating, creative and productive users of ICT’’ (p.___). Learners are better
able to achieve skills and develop capacity to select and use ICT to inquire, develop
new understanding, and also create and communicate with others in order to
participate effectively in society.
There is currently considerable interest within the field of Environmental Education in
developing learners’ abilities to apply their knowledge and to solve environmental
problems. Signs of improvement in using ICT still reveal significant shortcomings.
These shortcomings together with the importance of developing ICT knowledge and
skills have led to calls for light to be thrown on pedagogy for ICT to be used in
teaching and learning (Johnson & Mclean, 2001).
The focus of this research is on the application of new technologies in teaching
Environmental Education, aims to present a framework for ICT use in subject
teaching based on understanding of theoretical issues, possible approaches and
examples from practice. Teaching and learning through ICT is used to describe
situations where ICT facilities become the whole teaching and learning environment

10
by providing learning material and acting as assessor or a tutor. The traditional role
for teachers has been as presenters of ready–made information and as organisers of
learning experiences. One way in which ICT can be used in the classroom is to take
over these presentational and organisational roles. This has implications for both the
teachers and learners; by providing an additional source of knowledge, the computer
may reduce the dependency of learners upon the teacher.
There is learner autonomy in learning, which means the teacher no longer needs to
adopt a didactic approach but gain freedom to function increasingly as “enablers of
quality learning experience” (Somekh & Davies, 1991, p. 221). The teacher acts as a
facilitator of learning, drawing on a range of information sources, trusting in
technology’s ability to offer greater sufficiency and effectiveness of student learning,
and ICTs’ growing prevalence in society at large.
Computer–aided tasks in Environmental Education of any kind can be more
authentic than the traditional teacher–centred tasks. For example, through the wide
range of information sources that modern technology makes available, learners can
be exposed to many opportunities which open up spontaneity in learning in
Environmental Education. In these ways, IT tools appear to be able to support what
Vygotsky (1978) called “the zone of proximal development” which, together with
interactive support, enables learners to use skills and concepts they have only
partially mastered (Pea, 1987; Salomon, 1988).
According to Daniels (2002), ICT has quickly emerged as a vital building block in the
fabric of contemporary society. Virtually every country currently regards
understanding ICT concepts and mastering basic ICT skills as part of the core of
education. However, there is a prevailing narrow view that ICT only refers to
computers and applications associated with computers. Tracing the evolution of ICT,
Pelgrum and Law (2003) stated that, in the late 1980s, IT (Information Technology)
came to replace the previous narrow conception of ‘computer’ because of its
revolutionary capability to store and retrieve information, thereby shifting from mere
computing technology which hitherto had been the domain of the ‘computer’. This
was followed by the introduction of the term ICT (Information and Communications
Technology) around 1992, when e–mail started to become available to the general
public (Pelgrum & Law, 2003).

11
In order to be precise, effective teaching and learning of EE has been positively
affected and enhanced by ICT (Yusuf, 2005). A number of researchers have
identified many benefits of ICT in promoting the quality of education (Al– Ansari,
2006). ICT has the ability to enrich, deepen skills, accelerate, motivate and engage
learners to help relate school experience to work practices and create economic
viability as well as strengthen teaching and helping schools to change (Davis &
Tearle, 1998).
The use of ICT in teaching Environmental Education can help teachers improve the
quality of education by providing support. According to Zhao and Cziko (2001), three
conditions are necessary for educators to introduce ICT as pedagogy: educators
should believe in its effectiveness, the use of technology should not cause any
disturbances, and educators should have control over it.
1.1.4 Adoption and use of ICT in Environmental Education
The availability and use of ICT in EE have undoubtedly been beneficial to teaching
and learning in almost every community — whether urban or rural. Learners in rural
high schools can have access to education despite their geographical barriers. It
also provides intrinsic motivation for the teaching process, which will then have a
positive impact on learners’ performance and achievement. ICT usage significantly
prepares learners for their future careers in the modern workplace where computers,
the Internet and related technologies have become increasingly indispensable and
commonplace.
In addition to technological literacy, which is the ability to use ICT effectively, En
Gauge in Tinio (2002) has identified other job skills referred to as 21st century skills,
such as digital age literacy, information literacy and global awareness, which
learners can acquire through the use of ICT in Environmental Education. Emerging
ICT tools offer new opportunities to develop some of the critical early literacy skills,
the fundamental developments, which will affect many numbers of low–literate
learners in the rural areas to take advantage of educational opportunities presented
to them through formal education.
As a tool, technology entails the use of a wide range of word processors, hardware,
software graphic packages, databases, and spread sheets among others. This group
of hardware and software does not have limited educational purpose; rather it is

12
designed to help extend teachers and learners’ abilities to do work. The ICT theatre
makes it possible for certain forms of large group presentation; the overhead
projector makes possible presentation of texts and images to all those in the room.
Sharma (2003) further identified teleconferencing, e-mail, audio conferencing,
television lessons and radio broadcast as tools that have been and can be used for
different purposes in education (Sangul, 2001). These are also thinking tools that
educators use to integrate into teaching and learning strategies and encourage
independent learning (Hyeon–Suk, 2001).
Several experts in educational technology suggested that the reason for the low level
of ICT integration in teaching Environmental Education in rural high schools is a
conflict between the educator-centred educational values and learner-centred
educational values expressed in most forms of information technology. ICT plays an
important role in a school which provides new frameworks that can help improve the
teaching and learning culture. There has been a remarkable breakthrough in the use
of ICT on a large scale, and teachers are benefiting from the easy access to
educational resources such as software packages, the Internet and other electronic
resources (Kozma, 1999).
In a developmental state such as South Africa, learners do not acquire enough skill
in dealing with experiments in Environmental Education, a basic understanding of
scientific concepts during school years. ICT provides tools and content to help them
build up such skills. It is therefore not ideal to have ICT as a separate subject, but
should become integrated into their daily teaching. Furthermore, ICT should be
included as teaching and learning resources for all teachers teaching Environmental
Education.
The study seeks to say that, as teachers in rural high schools are now embracing
technology and use them to impact on teaching within some schools in the Eastern
Cape Province of South Africa. The use of ICT tools offer opportunities to ‘liberate’
learners in the classroom while providing teachers with the opportunity to pay more
attention to individual needs. It is also emphasises the complexity of environmental
problems like poaching, waste and littering.
It is therefore appropriate to say that using ICT in Environmental Education is more
than learning about the environment. It deals with changing behaviours in such a

13
way that people will not act against the environment. Our natural resources are being
depleted and environmental degradation is increasing because of our unsustainable
life and uncontrolled population (UNESCO–UNEP, 1994). The myriad environmental
problems facing our world today generates the need for motivating and elucidating
Environmental Education. Because of the urgency of many environmental problems,
Environmental Education will engage all members of the society — children, parents
and community members — in identifying environmental problems and solutions
which will be necessary to foster the culture of sustainability we all need.
Environmental Education is simultaneously blessed and cursed in that it is not
considered to be a subject on its own, a subject equal to the other subjects which are
traditionally studied. The transformative nature of Environmental Education signifies
that teachers’ perspectives and actions within the environment will radically change
in order to deal with its problems. A whole school approach similar to that conducted
by exemplary schools in New Zealand, Sweden, China, United Kingdom, Canada
(Henderson & Tilbury, 2004) and integral education in Brazil (Haddad, 2009) could
be seen to offer the transformative potential of EE in schools.
Why is Environmental Education important?
• Environmental Education has been found to increase learners’
achievement.
Environmental Education connects knowledge that learners gain in the classroom
with real-world situations, allowing them to make new discoveries and understand
their world on a whole new level.
• Environmental Education has been found to assist learners in other
subject areas.
It has been shown that Environmental Education reduces discipline and class
management issues, increases student engagement in the learning process,
facilitates student pride, and promotes ownership in achievement.
• Environmental Education creates an environmentally literate learner
population.

14
Across the board, learners are becoming detached from the natural world and this
will only make the environmental crisis worse. An education with a strong foundation
on the environment will enable learners to be creative and deal with environmental
problems effectively.
The whole school approach is used by all teachers in their school work to integrate
EE across the school curriculum and to seek quality in the teaching and learning
process. Environmental Education was introduced as a theme to be learned by all
learners in South African schools through the implementation of the National
Environmental Education Project for General Education and Training (herein referred
to as NEEP-GET) (DoE, 2004). The NEEP-GET focused on the development of
teachers and curriculum implementers to implement Environmental Education fully in
South African schools (DoE, 2004).
The Department of Basic Education in South Africa recognized Environmental
Education as a critical component of every school curriculum to respond to the
national and global crisis (DoE, 2001, p. 3). For this reason, post 1994 education
sought to infuse EE into the new curriculum (Curriculum 2005). The White Paper on
Education and Training (RSA, 1995) perceived EE as a means to a better quality of
life for all people and concluded that it should be integrated at all levels of the South
African education system. Additionally, Section 24 of the Constitution of the Republic
of South Africa (1996) protects the right of everyone to an environment that is not
harmful to his or her health (South African Constitution, 1996).
1.2 Statement of the Problem
Generally, the rural areas of South Africa lag behind in technological development.
The people in urban areas usually enjoy the benefits of ICT as compared to the level
of some global trends. In view of this, learners who receive formative education in
rural schools face serious challenges in their career development. Because of no
emphasis on ICT in the schools’ curricula (South Africa Info, 2011; Koranteng, 2012,
p. 26- 27), learners can hardly compete with their counterparts from urban schools
that are better resourced with computers and equipped with ICT skills.
Several education research topics and journal articles are directly related to ICT in
teaching and learning, its benefits and challenges. Teachers are expected to
integrate technology in the teaching process, so that it supports instructions and

15
enables learners to use ICT tools to meet their information needs and to construct
knowledge (Addam, 2013).
There is a wide range of tools that can be used by teachers to present or model
ideas in front of the whole class. Knowledge of and experience with computers is not
enough to enable teachers to make the best use of ICT in the classroom. Effective
adoption of computers within the classroom takes time (Somekh & Davis, 1996). In
addition, the way in which teachers’ skills, beliefs and practices are related is
complex (Wild, 1996) and how effective they are at using ICT tools in the classroom
differs (Higgins & Moseley, 2001). The knowledge of ICT has become the must–
have knowledge for many learners who pass through high schools. This is easy for
the learner in an urban setting owing to his/her closeness to a number of institutions.
However, a learner in the rural set–up lags behind in getting access to ICT
knowledge because technological tools are not readily available. This has greatly
disadvantaged the learner, hence the issue of integrating ICT in teaching
Environmental Education in rural high schools in the Eastern Cape in South Africa.
The issue with the fact that ICT changes rapidly and innovations offer new
possibilities for teaching and learning not only open up to new technologies and
techniques, to influence the existing curriculum effectively, but change the nature of
it. This poses a real dilemma for teachers, where spending time on learning how to
use ICT has not appeared to be justified in terms of knowledge gained in subsequent
learning. A number of international studies have shown that rural high schools
teachers lack competencies in the use of ICT as a pedagogical tool in the teaching
and learning process (Nihuka & Voogt, 2011). Most educators are still embracing the
old style of teaching because of ineffective use of ICT as a pedagogical tool
(Tapscott, 1998; Knight et al., 2006).
The use of modern technological tools such as computers and the Internet is still in
its infancy stage in most developing countries including South Africa. These
developing countries are currently developing ICT policies (Hare, 2007; Moonen,
2008; Tilya, 2008), which in most educational practices their impacts are found to be
insignificant (Hervanger, Vanden Akker, & Reiter, 2007). ICT as a pedagogical tool
is referred to as the use of ICT facilities in the teaching process for students to be

16
able to solve problems, to provoke students’ capabilities, and share their
perspectives with each other (Jonassen, Howland, Marra, & Crismond, 2008).
The need for Environmental Education is to address the numerous environmental
crises as well as the importance of the role of teachers in Environmental Education.
The need to protect the environment is of human responsibility. The main goal of
Environmental Education is for the world to develop a population that is aware and
can care for the environment and the associated problems, of which they will be
committed to work individually and collectively towards the solutions to correct the
problems and to avoid new ones (Bennet, 1985, p.11).
Bennet (1985) stated that Environmental Education can be taught using different
approaches and methods of teaching. He made mention of the interdisciplinary
approach as one of the most characteristic of Environmental Education, stating that
Knowing how to select and apply these approaches efficiently is of importance. It is
to this end that evaluation of instructional program is to be directed (p. 4).
Now, as the educational sector is faced with many changes, it is vital to reflect on
matters concerned with Environmental Education and the dissemination of
Environmental Education knowledge and lessons. Numerous teaching styles have
been adapted which tend to accommodate learners’ need and diverse learning
methods. One such teaching style involves the use of ICT. The concept of
Environmental Education emerged only in the 1970s, which was known as the
decade of Environmental Education. During that period, the world realised that
environmental concerns and awareness could be spread only through a mass
environmental education programme.
An inter–governmental conference to consider Environmental Education was
organised at Tbilisi, USSR in 1977 by UNESCO and UNEP which resulted in the
famous Tbilisi Declaration. It was all about the understanding among individuals and
social groups about environmental problems. The basis of such a training
programme would be the preparation of teaching learning materials and adoption of
the interdisciplinary approach. Use of mass media to disseminate information was
also emphasized (UNESCO–UNEP, 1985).

17
To have a positive impact on the quality teaching and learning of Environmental
Education in e rural high schools in the Eastern Cape, the aims for ICT in teaching
this subject must go beyond acquisition of skills, for example to access a database,
and engage at a higher cognitive level.
1.3 Rationale of the Study
The theme of the study centres on education and the use of ICT. The present study
aims to find out how effective using ICT in teaching Environmental Education is in
rural high schools. The use of ICT tools in teaching Environmental Education has
long been studied. However, most of the studies were confined to developed
countries such as USA, Britain and Australia. It was found that in both Britain and
Australia use a drill and practice such as software and have shown an increase in
learners’ achievement in performance (Yelland, 2001). In high schools it was found
that the use of ICT tools supports higher order thinking skills. However, very little
studies have been done in developing countries (Yelland, 2001). Therefore, the
focus on the importance of ICT tools in rural high schools should be on how the tools
can enhance EE teaching given the enormous challenges that rural schools are
faced with.
1.4 Significance of the Study
Environmental Education involving an interdisciplinary and active approach to
learning must be a vital element in all levels of programmes of the education system
(South Africa White Paper on Education and Training, 1995). This approach to
Environmental Education teaching needs to be facilitated by teachers, and they are
expected to ensure that Environmental Education allows learners the chance to
comprehend the many varied environmental issues that surround them, how
decisions are made about the environment, and how people can have the
opportunity of participating in the decision- making process (Palmer & Neil, 1995).
The findings of this study may expose the challenges facing the integration of ICT in
the teaching of Environmental Education in rural high schools and can therefore set
the tone for the effective planning for integration and implementation. For example,
e-learning technologies and other alternatives as well as interactive digital content
may improve the quality contribution of ICT skills in the curriculum and the use of ICT
to support 21st century learning.

18
The findings are also expected to explore new models of learning that are radically
changing the current perception of education. The Department of Basic Education
believes that the development in ICT can create access to learning opportunities,
redress inequalities, and improve the quality of teaching and learning. ICT integration
in the Environmental Education curriculum can accommodate differences in the
learning environment by providing expanded opportunities and individualised
learning experience.
In this study, the role of ICT becomes more important as it is already transforming
many aspects and is also considered a means for educational reform (Collins &
Halverson, 2009; Davis, 2008; Gilbert, 2005).
1.5 Scope and Limitations of the Study
The current study will be focused on the GET Band ,that is Grades 8 and 9, with
teachers offering Environmental Education in some selected rural high schools in the
East London district of the Eastern Cape Province of South Africa. Previous research
has been done on the integration of ICT into teaching. Hence, the research will
predominantly source primary research materials based on international studies.
Furthermore, this study is limited to the implementation process of the technology
initiatives and does delve into long-term use.
1.6 Research Questions
The research aims to address the main question in 1.6.1. However, the subsidiary
questions in 1.6.2 are posed to provide further insight into the main question.
1.6.1 Main research question
How can the integration of ICT improve the teaching of Environmental Education
(EE) in rural high schools?
1.6.2 Sub-research questions
i) How can ICT be used effectively in the selected rural high schools to improve the
teaching of EE?
ii) What ICT facilities are available for teaching EE?
iii) What are the attitudes of teachers towards the use of ICT tools in teaching EE?
iv) Do teachers use ICT efficiently in teaching EE?

19
1.7 Research Objectives
i) To find out teachers’ perceptions on the adoption and use of ICT tools to teach
EE effectively.
ii) To determine whether the adoption of ICT tools is influenced by the availability of
resources.
iii) To investigate if the adoption of ICT tools is influenced by teachers’ attitudes.
iv) To determine the support system available for teachers to use ICT tools
efficiently in teaching EE.
1.8 Operational Definition of Terms
1.8.1 Environmental Education
This is a learning process that increases peoples’ knowledge and awareness about
the environment and associated challenges, develops the necessary skills and
expertise to address the challenges, and fosters attitudes, motivations and
commitments to make informed decisions and take responsible action (UNESCO,
Tbilisi Declaration, 1978). It is a process of recognizing values and clarifying
concepts in order to understand and appreciate the interrelatedness among people,
their culture, and their biophysical surroundings. Environmental Education also
entails practices in decision-making and self–formulation of a code of behaviour
about issues concerning environmental quality (IUCN, 1971).
1.8.2 Teaching
This is the social and interactive process where inter–personal influence is aimed at
changing the behaviour of another person (Gage & Amidon, 1996). This social
process employs the most effective teaching and learning strategies to enable
learners and young people to make progress. In the same process, teachers are
able to access what their learners know, understand and can do, and then use this
assessment to plan for future teaching and learning.
Teaching is carried on primarily by uncodified rules of thumb and through
accumulated individual experience. At the same time, there probably exists enough
knowledge and experience stored in an individual’s head to provide the basis for
sophisticated technologies (Joyce & Weil, 2003).

20
1.8.3 ICT
Information and Communications Technology (ICT) refers to all the technology used
to handle telecommunications, broadcast and the media. Although ICT is often
considered an extended synonym for Information Technology (IT), its scope is
broader. Information and Communications Technology (ICT) education is basically
our society’s effort to teach current learners valuable knowledge and skills around
computing and communication devices, the software that operates them, the
applications that run on them, and the systems that are built with them.
The United Nations Educational, Scientific and Cultural Organization (UNESCO)
uses the term ICT to describe the tools and processes to access, retrieve, store,
organise, manipulate, produce and present information by electronic and other
automated means. These include hardware software and telecommunications in the
forms of personal computers and scanners. According to Tella and Adu (2010), the
use of ICT in education only begins when access to ICT services and higher band
widths become more available to learners. The danger is that we ascribe to new
technologies and the characteristics of the previous media and its educational
practices without considering the development and reflection of the concept.
While definitions of ICTs are varied, it might be useful to accept the definition
provided by the United Nations Development Program (UNDP, 2003). ICTs are
information handling tools – a varied set of goods, applications and services that are
used to produce, store and process, distribute and exchange information. They
include the “old” ICTs of radio, television and telephone, and the “new” ICTs of
computers, satellite and wireless technology as well as the Internet and the web.
ICTs also include simple audio visual aids such as power point slides, video,
cassette etc. The older technologies are termed as analogue and the newest, which
are Internet based technologies, are the digital media.These different tools are now
able to work together in our “networked world”.
1.8.4 GET band
This refers to the General Education and Training Band that is Grades R to 9 in the
high school learning areas. They are composed of learners who are of compulsory
school going age (about five to fifteen years of age). All South Africans have the right
21
to a basic education. The National Qualification Framework (NQF) recognises three
bands of education of which the General Education and Training Band is included.
The GET Band includes Grade R–9 and follows an integrated curriculum. It is further
subdivided into phases, called the Foundation Phase (Grade 0 plus Grade 1 to 3),
the Intermediate Phase (Grades 4 to 6) and the Senior Phase (Grades 7 to 9). The
study focuses on the teaching of Environmental Education in Grades 8 and 9 which
is also part of the high school system. As their school curriculum suggests, whilst at
school their skills and values should be developed about the environment where they
live.
1.8.5 Teacher or educator
The term teacher is often interchanged with the term educator. The teacher (or
educator) who imparts knowledge to learners is the sample of the study.
1.8.6 Learners
In the current study, ‘students’, ‘learners’ and ‘pupils’ are terms that are synonymous.
However, the term ‘learner’ has been used consistently. A learner, as implied in this
study, is a person who is learning in the formal schooling period.
1.8.7 Schools
Schools are classified as public, government or state schools, former model C
schools, or independent schools. Former model C schools are public schools that
were previously (prior to 1994) designated for white learners only. Township schools
are public schools previously for Black learners only, which are typically situated in
the suburbs away from the city centre. Independent schools are defined as schools
that receive minimal financial support from the state. Rural schools are situated in
most disadvantaged communities which lack basic infrastructure for learning.
1.8.8 Sustainable development
Sustainable development is defined as the best strategy to deal with environmental
issues and crises in an on-going way without jeopardising the chances of future
generations. According to O’Donoghue (2008), sustainable development is a
concept that seeks for modernisation of living patterns. Additionally, it aims at
promoting individuals’ opportunities to achieving social prosperity and environmental
compatibility (http://en.wikipedia.org/wiki/sustainable.dev, 2008).

22
1.8.9 Curriculum
There has been a total lack of an agreement on how to define the concept of
curriculum. Marks, Stoops, and Kind–Stoops (1978, p. 457) define curriculum as:
“The total sum of the means by which a learner is guided in attaining the
intellectual and moral disciplines to the role of an intelligent citizen in a
society. It is not only a course of study, but rather consisted of all the learning
experiences that learners have under the direction of a school.”
1.9 Research Methodology
1.9.1 Research paradigm
The research was conducted within a positivist paradigm which included a
quantitative methodology. Measurement of data was used to confirm casual effect;
that is, independent and dependent variables were used.
1.9.2 Research design
Survey
Surveys are thought of as methods used for descriptive research. They are used to
collect data from a larger number of people than generally is possible. The
substantial amount of data which is collected is used to draw conclusions about the
phenomenon under investigation. Johnson (1994, p. 13) described it as “eliciting
equivalent information from an identified population”. Research was conducted in the
selected rural high schools which the researcher conveniently chose in the East
London district of the Eastern Cape Province of South Africa. The researcher
considered the timeframe and accessibility when choosing these schools.
1.9.3 Population sample
The target population is the teachers of Environmental Education in the rural high
schools of the Eastern Cape, South Africa. The sample was selected at random,
which consisted of 60 teachers.
1.9.4 Data collection
Data was collected by using various instruments such as a structured questionnaire
to obtain factual information, attitudinal information, or both. A structured
questionnaire with Modified Likert responses was used. These range from Strongly

23
Agreed (SA), with the highest numerical value of 4, to Strongly Disagree (SD), with
the lowest numerical value of 1 as below:
SA = 4
A = 3
D = 2
SD = 1
1.9.5 Procedure
The research instrument was administered personally by the researcher. A letter of
introduction was first sought from the Department of Basic Education and sent to the
various selected rural high schools in the East London district. The researcher first
explained the purpose of the research to respondents and also addressed their
concerns before distributing the questionnaire to them. Each of the items was also
elaborated on.
1.9.6 Data analysis
Descriptive and inferential statistics was used in the data analysis. Descriptive
statistics summarises raw data in order for it to be visualised, and enables the study
to present the data in a more meaningful way which allowed simpler interpretation of
data. The researcher found the central tendency of a variable, meaning the average
score of a participant on a given study measure. These are ways of describing the
central position of a frequency distribution for a group of data by using the mode,
median and mean.
Inferential statistics is concerned with making predictions about a population based
on a random sample. The results of the study could then be analysed using a
sample and the researcher could generalise them to the larger population that the
sample represented. The sample was representative of the group to which it is being
generalised. To address this issue of generalisation, tests of significance. A Chi-
square or T-test, for example, can tell the probability that the results of the analysis
could have occurred by chance when there is no relationship at all between the
variables studied in the population.

24
1.10 Ethical Considerations
The research followed a strict code of ethics in conducting the study. The research
was conducted in public schools and as such, it was necessary to obtain the
approval of the Department of Basic Education as well as the management of the
schools as a whole.
The participants were fully informed about the procedures and risks involved in the
study, and they had to give their consent to participate. The study guaranteed the
participants’ confidentiality. They were assured that identifying information would not
be made available to anyone who was not directly involved in the study.
Information about the participants remains strictly confidential and anonymous, and
they had the right not to participate, to withdraw from the study at any time once the
research had begun. The study adhered to the prescripts of the University of Fort
Hare ethical clearance policy.
1.11 Structure of the Research Report
The study consists of five chapters. The arrangements of the chapters take the
following format:
Chapter One provides a general overview of the study. It introduces the research
problem and explaines how the research was done.
Chapter Two is a review of literature of the research problems based on the
questions asked in Chapter One. It delves into the literature review dealing
specifically with technology integration in education. The chapter further provides
consideration of why technology integration in teaching in rural high schools could be
viewed as innovation.
Chapter Three provides a description of the research methodology employed in the
study. It also includes the methods of collecting data.
Chapter Four provides a detailed description of how the data was presented and
analysed.
Chapter Five concludes with a summary of the results and findings, conclusions and
recommendations of the study.

25
CHAPTER TWO
LITERATURE REVIEW
2.0 Introduction
Confucins (2006) cited in Hofstee (2006, p. 91) highlights the immeasurable import
of literature review in any academic investigation by pointing out that a man who
reviews the old so as to find the new is qualified to teach others. There is an
explosion of information and technological advancement in the world which is
coupled with the flow of information. This is transforming the world from isolated
islands to interconnected super highways of ICT (Herselman, 2002). In this chapter,
the review of existing literature on the subject begins with a brief description of the
role of ICT in education, the implications of ICT on the curriculum development, as
well as the availability, cost and implementation of ICT resources. The chapter
concludes with a discussion.
The literature review considered a number of books published in Europe, especially
in the Netherlands where many studies on ICT policy implementation have been
conducted. However, a considerable number of articles with a focus on ICT in
African countries were also considered. The articles considered in this study were
published between the period from 1998 to 2009 because the pace at which ICT
changes is faster than the rate at which publications are produced. A number of
authors appeared to have been quoted by others many times, and this has led the
researcher to rely heavily on such frequently cited studies because of the recognition
of the usefulness of the findings in these early studies. Prominent among these
authors are Anderson (2008); Law, Pelgrum, and Plomp (2008); Komza (2008);
Voogt (2003, 2005, 2008), and many others. Most of these authors provide
references to international studies in an attempt to study ICT policy implementation,
availability, and cost of ICT.
The mainstreaming of ICT in EE teaching and learning in South African rural schools
remains a major developmental challenge with potential risks to the quality of
education provided to our youth. School teachers are faced with a problem of having
two parallel curricular at the same time as the interim Outcome–Based Education
(OBE) syllabus is being phased out while Curriculum Assessment Policy Statements

26
(CAPS) is being phased in. Educators are still struggling to get their hands on the
new curriculum, which is a major challenge on its own. Thus, there might be a lot of
reluctance as far as ICT integration is concerned, more so because most of rural
high schools get their ICT resources through donors. ICT has the potential to enlarge
access to education. Through ICT, learning can occur anytime and anywhere.
The literature review focused on issues related to availability, cost and
implementation of ICT policies in rural high schools in the Eastern Cape Province in
South Africa and specifically in the EE classroom. EE teachers’ use of ICT is
therefore investigated for effective Environmental Education curriculum
implementation. The goal of most authors is to improve on teaching using ICT in
rural areas, particularly in the Environmental Education classrooms. Environmental
Education offers a wide variety of ICT modules within its curricular. However, the
curricular are not harmonised neither across the region nor within the individual rural
high schools. Thus in South Africa, it is not unusual to find great diversity of offerings
among rural high schools. However, also underlying this diversity is the national
institutions with ICT capacities (Ngulube, 2006).
The South African government recognised that ICT capacity building for its human
capital is the key to national development as well as knowledge economy in this
information age. To ensure that the country is well positioned for realising its
developmental goals, the Department of Basic Education is expected to increase
enrolments in the ICT field of study (Ministry of Education, 2001).
In the following section the discussion focuses on ICT and education.
2.1 Overview of the concept: ICT
ICT refers to computer technology, multimedia and networking including the Internet.
In some countries, such as United States of America (USA), the term ‘technology’ or
‘information technology’ is used, but slowly this appears to be changing to ‘ICT’
(Anderson, 2008). ICT has become more accessible to people in both developed
and developing worlds.
So many terminologies have been used to describe various sets of ICT related
curricula, which include cognitive tools (Salomon, 1996) and mind tools (Jonassen,
2000). Tagg cited in Kaffash, Kargiban, Kargiban, and Remezani (2010) explained it

27
as a tool to extend curriculum method, content, product and process to new
information which was not discovered in the past. Previous researchers believe ICT
is a combination of computer video and telecommunication technologies as well as
the use of multimedia networks (Van Damme, 2003).
For the purpose of this study, ICT is information based technology which can be
coordinated with other technologies including communications. Researchers use
different terminologies to drive ICT concepts which are probably the purpose for
which they are used. In education, these terminologies are mostly a structural unit of
society (National Council for Accreditation of Teacher Education, 2002; UNESCO,
2002). Elston (2007) identified ICT as technology to manage information and
communication, Educational Technologies (UCT, 2003).
2.2 Education and ICT
This part introduces an apprehension approach of ICT within education. Much
attention has increasingly been directed into research in merging fields of education
and ICT, and this attention is encouraged by education authorities (Bauer & Kenton,
2005). This will improve teachersand learners’ competence in the use of ICT in
teaching and learning, and teachers are expected to explore more by means of
incorporating ICT into their professional practice (Fitzallen, 2004). The trend of ICT
integration continues to increase and as such, researchers identify issues such as
inadequate technology, insufficient curriculum, technical and administrative support,
limited time for planning, and a general resistance for teachers to adapt to changes
(Roblyer, 2004).
As the information we have is increasing all the time, it becomes important to record,
process, store and share it with others often at great distances from us.
Technological tools help us to do these with much efficiency. The main focus is on
computers and the Internet which enhance teaching and learning, particularly with
regard to the recording, processing, storing and sharing of information. Various
investigations on the impact of technology on education mostly come to a conclusion
that technology plays a role in education. One such study was conducted by the
North Central Regional Education Laboratory (NCREL), in the USA, which
suggested in its report entitled ‘Computer Based Technology and Learning’ that
technology can:

28
• “make learning more interactive,
• enhance the enjoyment of learning,
• capture and store data for data-driven decision making” (p.__).
Computers are increasingly becoming part of our daily lives. For example, e-mail is
used daily to exchange messages, or information is searched for on popular search
engines on the World Wide Web. The use of computers in education has been
reported to have a link to the levels of economic and social development. They do
this by supporting the administration, financial and governance systems, making
them efficient.
Education, in the form of teaching and learning, has ever been changing (Theroux,
2004; Day & Sachs, 2004) and this has made technology penetrate into the system
of education. This permeation of ICT in education has become a useful resource in
teaching and learning. However, the digital explosion has become so great in the
previous years that the integration and application of technology in education have
become more complex as new tools continue to emerge in the market (Jimoyiannis
& Komis, 2007). It has become very important to keep abreast with the changes,
which will assist learners and teachers to have much information and develop the
expertise in teaching and learning to overcome the educational challenges (British
Education Communications and Technology Agency [Becta], 2008).
Rastogi and Malhotra (2013) postulated that different forms of ICTs are sources of
powerful tools that are able to help meet some of these challenges. Particularly they
can help changing the old methods of teaching where the teacher becomes the
centre of the teaching process. Education brings home to the EE teacher that the
digital revolution of the last few decades brings with it many positive dividends for
teaching and learning. As Quinot and Van Tonder (2014) have explained, the use of
ICT in education through the rubric of e-learning can be described as the use of
computer network technology, primarily over intranet or through the Internet, to
deliver information and instructions to individual learners.
The use of ICT in teaching Environmental Education will support learning, blending
the teaching process. Blended learning refers most commonly to the combination of
traditional forms of teaching and learning, such as face-to-face classroom sessions

29
(Oliver & Trigwell, 2005). Oliver and Trigwell (2005) pointed out that blended
teaching and learning can bring about the motivation to help learners experience a
variety in the critical aspects of the topic being learnt. There is an evidence of
literature of blended teaching and learning which can optimise the use of ICT in
education.
The DoE (2004, p. 18) identified an e-school which has teachers who use ICT in
teaching and are qualified and competent in the use of ICT. South Africa faces a
considerable challenge in which both developing and developed conditions prevail
(Howie & Bilgnaut, 2009). In addition, Phumzile Mlambo-Ngcuka, former Chancellor
of Tswane University of Technology and former Deputy President of South Africa,
indicated that there is a shortage of ICT literate teachers in South Africa and this
reduces the possibility for rural school learners to acquire the critical 21st century
skills (Tshwane University of Technology News, 2011).
Almost all developing countries such as South Africa have realised that ICT has the
potential for increasing access to education and could also promote the quality and
relevance of education. This provides the chance to promote educational systems in
every country. However, some challenges such as poverty and the high population
of rural dwellers without access to ICT as well as a majority of the population who
lack basic knowledge of ICT may impede the easy access to ICT. ICT has always
been used to improve education so as to ensure that teachers in rural high schools
acquire skills of ICT which in turn can be used to help learners improve their
academic performance. According to Kearns and Grant, any ICTsupported
educational system substantially empowers learners for life-long learning (Kearns &
Grant, 2002).
In the section below, this study examines the brief history of ICT in education, the
South African e-education policy, as well as the concept of educational technology.
2.2.1The brief history of ICT in education
Besterfield et al. (2003, p. 223) have pointed out that the foremost computer was the
ENIAC (Electronic Numeric Integrator and Computer), which was developed in 1946.
It is this information age that sped up the growth in information and knowledge and
the evolution of technologies that has made it possible to grow faster (Pernia, 2008,

30
p. 13). Since then, several types of hardware and software have developed – the
dates given in the table below.
Table 2.1: History of Information Technology (Besterfield et al., 2003, p. 224)
Timeline Machine Application
1946–1963 Vacuum tube with input by
punch cards
Scientific and engineering
1964–1976 Distributed access to main
frame. Compatible models
Accounting and inventory
1977–1984 Mid–range computers with
user-friendly interfaces
Users involved in system
development
1985–1996 Personal computers, local
and area networks
Desktop system with word
processors
1997–future Wireless technology and
Internet
E-mail electronic
commerce system
2.2.2 General use of ICT in education
This section presents a summary of the general use of ICT in education through a
model. The information becomes useful and important for teachers in an effort to
elaborate how ICT is being implemented. Kozma (2003) and McGhee (2006) offer a
model of the classified uses of ICT.

31
Table 2.2: An adapted model of patterns of uses of ICT (Adapted from Kozma,
2003 & McGhee, 2006)
Patterns Characteristics
Tool use Teachers use e-mail, produce
documents, information search, word
processing and multi–media.
Information management Teachers use ICT to organise, manage
and use information for teaching and
learning.
Teacher collaboration Teachers design instructional material.
Product creation Teachers design and create digital
products using soft–wares.
Tutorial projects Teachers use tutorial soft–wares to allow
learners wind up taught lessons.
2.2.3 The South African e–Education policy
After independence in 1994, the first South African educational White Paper (DoE,
1995) came up with a clear policy which commits to education. Generally, it relates
to philosophy, goals, values and principles for the new education system which
forms the basis of a national plan to explore the use of technology in education. The
e–Education White Paper (DoE, 2004) was the first and is currently the only policy
document dealing with how the use of ICT in education should be implemented. The
paper sets out the government’s response to new information and communication in
education internationally, which will focus on developing learners’ 21st century skills.
It provides a framework for the collaboration of government and the private sector in
the provision of ICT in education.
The importance that the Department of Basic Education places on e-Education is
reflected in an Action Plan 2014: Towards the Realization of Schooling 2025, the
Department’s long-term strategy to achieve quality education. The role of ICT in

32
education cannot be over-emphasised in South Africa’s quest for quality teaching
and learning for all teachers and learners. The Action Plan highlights the need for
teachers to be computer literate and to ensure that learners have increasing access
to a wide range of media, including computers, that will enrich their education (DoE,
2003).
In South Africa, the whole idea of e-Education is all about the use of ICT for the
realisation of national educational goals. e-Education is mainly perceived as a
connecting tool: it is able to connect learners to learners; teachers to professional
support services, and provide other avenues for learning. Moreover, it is also
capable of connecting learners and teachers to better information, ideas and one
another via combinations of pedagogy and technology. e-Education has the
capability to develop computer literacy skills necessary to deal with the various types
of ICT, where the application of ICT skills can be used to access, analyse, evaluate,
integrate, present and communicate information.
Kozma (2008) has explained that e-Education views ICT as:
• a tool for management;
• a resource for curriculum integration; and
• a learning environment that advances creativity and communication.
Emerging models of learning in the modern age are constantly and radically
changing the traditional conception of education which has existed for ages.
Education for human development in the learning society needs to involve focusing
on building knowledge. The two major factors contributing to change arise from shifts
in educational goals and from new concepts of learning. The Department of Basic
Education believes that developments in ICT create access to learning opportunities,
redress inequalities, and improve the quality of teaching and learning. The e-
Education policy goal states:
“Every South African learner is the General and Further Education and
Training Band (GET) will be ICT capable, (that is use ICT confidently and
creatively to help develop the skills and knowledge they need to achieve
personal goals and to be full participants in global economy) by 2013.”
33
Current changes in societies are transforming the nature of knowledge, which will
lead to the need for major reforms in education as well as a new conception for the
role of the teacher and learners (Gilbert, 2005; Hargreaves, 2003; Adreotti et al.,
2008). The use of modern technology tools such as computers and the Internet is
still in its infancy stage in most developing countries, including South Africa.
Although most developing countries are currently developing ICT policies (Hare,
2007; Moonen, 2008; Tilya, 2008), the policy impact on educational practice has
been found to be insignificant (Hervanger et al., 2007). ICT as a pedagogical tool is
referred to as the use of ICT facilities in the process of teaching and for learners to
be able to solve problems, provoke their capabilities, and share their perspectives
with each other (Howland et al., 2008).
A number of international studies have shown that rural high school educators lack
competencies with the use of ICT as a pedagogical tool in the teaching and learning
process (Nihuka & Voogt, 2011). However, Tapscott and Knight et al.(1998) opined
that most educators are still embracing the old style of teaching because of
ineffective use of ICT as a pedagogical tool (Tapscott, 1998). Although there have
been numerous changes in the impact of ICT on society, many classrooms and
schools still lack their application. Condie and Livingstone (2007) found that while
some teachers continue to display an urge to engage with new technology, the rest
are fearful of trying new approaches.
The research study by Mlambo (2007) on ICT in A–level physics teaching at
secondary schools in Manical and Zimbabwe found the absence of good examples
of the best practice in the use of ICT in teaching physics. He found teachers using
traditional methods of teaching; mainly, the lecture method. This implies that ICT is
not effectively used as a tool in teaching. A similar study in Singapore by Teo (2006)
on the use of ICT-mediated lessons identified several barriers to the teacher in ICT
integration in the classroom. According to Teo (2006), such barriers include
inadequate technical support staff, lack of sufficient time for teachers to prepare for
ICT–mediated lesson, lack of support provided by school leaders in addressing ICT
concerns, and insufficient training for teachers on how to incorporate ICT into
classroom instruction.

34
However, the study in Cyprus by Dirckinck, Hodgson et al. (2010) shows that most
curricula do not include ICT integration. In view of this shortcoming, teachers spend
much more time finding, revising and making adjustments for learning and teaching
materials for them to fit in the curriculum.
Five merits of ICT in education have been identified by researchers and these have
been summarised as the following:
• Assist learners to have access to digital information effectively
As Bush, Glazewski, and Hew (2008) have stated, ICT is used as a tool for students
to discover learning topics and provide solutions to problems. ICT makes knowledge
acquisition more accessible and concepts in learning easily understood.
• Produce creative learning
ICT develops students’ new understanding in their areas of learning (Chai, Koh, &
Tsai, 2010). ICT provides more creative solutions to different types of learning
inquiries. For example, learners can access all types of texts from beginning to
advanced levels with ease through computers, laptops, or personal digital assistants.
It therefore provides purpose-designed applications that provide innovative ways to
meet a variety of learning needs.
• Offer more opportunities to develop critical thinking skills
ICT helps students focus on higher level concepts rather than less meaningful tasks
(Levin & Wadmany, 2006). McMahon’s (2009) study showed that there were
significant correlations between studying with ICT and the acquisition of critical
thinking skills. A longer exposure in the ICT environment can foster learners’ higher
critical skills. Thus, schools are strongly advised to integrate technology in teaching
Environmental Education.
With the major explosion of ICT in education, it is regarded as an aid for teaching
and learning. ICTs are said to expand the access to education and strengthen the
importance of it. This has a direct link between the use of ICT and learners’
academic performance. This further increases the ability of learners to improve their
learning by improving the point of communicating between them and the teacher
(Valasidou & Bousiou, 2005).

35
• Improve the quality of teaching and learning
As Lowther, Inan, Strahl, and Ross (2008) have stated, there are three important
characteristics that are needed to develop good quality teaching with ICT: autonomy,
capability, and creativity. Autonomy means the learners take control of their learning
through the use of ICT. In this way they become more capable of working
independently. With regard to capability, learners are more confident in the learning
process, and they can develop the capability to apply and transfer knowledge while
using new technology effectively. The whole teaching and learning process enriches
and motivates learners, and broadens their knowledge beyond what they know.
Their creativity is also enhanced, that is when they are able to discover new
multimedia tools and create materials in the styles readily available to them (Gee,
2007, 2011).
It also facilitates the flexibility of delivery of education, which allows learners to have
access to knowledge at any time. Learners are able to now browse through e-books,
search for previous examination questions, as well as having contact with resource
persons all over the world. This has increased the availability of just-in-time learning
for many more learners (Young, 2002).
• It enhances the learning environment
ICT creates on entirely new learning environment for learners in which they require
different skills to be successful. ICT is changing the processes of teaching and
learning by adding elements of vitality to learning environments including virtual
environment for the purpose of ICT. Teachers should encourage learners to engage
in active learning (Collins, 1996; Hannafin, Land, & Hill, 1994). The learning
environment needs to reflect the potential uses of knowledge that learners are
expected to master in order to prevent the acquired knowledge from becoming inert
(Bransford, Sherwood, Hasselbring, Kinzer, & Williams, 1990).
2.2.4 The concept of educational technology
Richey (2008) has stated that there is a difference between technology in education
and educational technology. The former describes the application of particular tools,
such as computers in the classroom. The latter is the name of a unique discipline of
study. Educational technology is the effective use of technological tools in teaching

36
and learning. As a concept, it consists of different kinds of tools such as media,
machines and networking hardware. Richey (2008) defined educational technology
as “the study and ethical practice of facilitating learning and improving performance
by creating, using and managing appropriate technological processes and
resources” (p.13). That is to say, educational technology is not restricted to high
technology but has become an important part of society today.
In practice, as technology has advanced, the particular “narrowly defined” aspect
that was initially emphasised has blended into the general field of educational
technology. Bernard Luskin, who is an educational technology pioneer, advocated
that the “e” of e-learning should be interpreted to mean “exciting, energetic,
enthusiastic, emotional, extended, excellent and educational”, in addition to
“”electronic”. Educational technology is thus the application of scientific knowledge
about learning conditions to enhance the effectiveness of teaching and learning. It
also has practical applications, and the existence of such resources for teaching and
learning constitute the most basic evidence of this practical application.
The Association for Educational Communications and Technology, the professional
society for ET, defines educational technology as:
“The study of ethical practice of facilitating teaching and learning and
improving performance by creating, using and managing appropriate
resources. As a field of education, it will emphasize the communication skills
and approaches to teaching environmental education through the integration
of varied and different media” (p.34)
2.3 ICT Integration in Education
The purpose of integrating ICT in education and the curriculum as a whole is to
enhance the quality of teaching and learning and to improve learners’
comprehension skills of what is being taught. However, the potential of ICT to
motivate pedagogy is yet to be fully realised due to the lack of expertise to help
effect the adoption of ICT for curriculum delivery.
Some authors have explained ICT integration as ways and approaches for the use of
ICTs in teaching and learning (Hodgkinson–Williams, 2006); technology integration
is more cross–curricula than an individual subject. From the definitions given, one

37
can say that ICT integration in the 21st century involves all essential elements of a
system combined to make a whole (Earle, 2002). This simply means in education
that integration takes place if ICT and other elements of education such as content
are combined into one body.
ICT came from the concept of IT (Sansanwal, 2009), which simply means computer
technology for information delivery. Recently, there has been an emergence web,
communication and digital networks and the IT concept has had limitations and has
to be extended into new technologies. Various authors have tried to explain their
understanding of ICT integration into the curriculum by explaining the different ways
for harnessing ICTs in teaching and learning (Hodgkison–Williams, 2009; Senapaty,
2012).
Watts–Taffe et al. (2003) realised that educators can play the role of facilitators in
the classroom where there has been a successful integration of ICT in the
curriculum. As Reid (2002) indicated, ICT offers learners the opportunity to be
reflective and ultimately the motivation to continue to learn throughout their lives.
Similarly, Anderson (2008) in a study has summarised the implications of the needs
of the knowledge required in teaching and learning. Anderson (2008) further
discussed the importance of helping learners to develop ICT-related skills which may
include finding, organising, retrieving information and ICT usage.
Current changes in the economy and knowledge point out that the need is not only to
enable learners to become self–driven, but also to develop as proficient learners as
many information sources will be accessed digitally (Wright, 2010; Davis & Fletcher,
2010). In this context, teachers share the moral good of supporting learners achieve
their potential while working in societies that are changing rapidly with technology. In
the knowledge society, knowledge is a process rather than a product. It develops
when needed. Learners are not “tabulae rasae”, but their minds are resources and
therefore can create new knowledge (Gilbert, 2005).
Salomon and Perkins (1996) pointed out some years ago that the thinking on ICT in
education should not be determined by what is technically possible but by which ICT
applications can improve teaching processes. According Saloman and Perkins
(1996), the way in which ICT may influence education should be a question of
pedagogical and educational choices. Thinking along these lines, Nieder–hauser and

38
Stoddart (2001) indicated that with regard to the integration of ICT into education,
teachers tend to adopt technology in ways that are consistent with their personal
perspectives on curriculum and instructional practice. ICT has a clear impact on the
development of educational curricula. It is concerned with what is taught and how
teaching and learning occurr. What is taught includes objectives, content and
learning outcomes, and attitudes that learners tend to demonstrate. Anderson (2008)
has argued that integrating ICT in the curriculum largely requires learner–driven
activities; the learner must use the computer room to perform almost all educational
tasks. Learners need to seek information, evaluate it and process it. In this process
they make use of a wide range of resources. Other features of the integrated
approach are the collaborative group skills, learning by doing, and providing
opportunities for creative expression.
Lowther et al. (2008) have noted that the integrated approach places ICT in a pivotal
role in the already transforming learning process. The authors argued that its
success as an approach lies in the ability of teachers to set tasks that require
learners to use these skills and information. According to them, this is appropriate
and necessary at a time when teachers are being encouraged to adopt new teaching
strategies to disseminate knowledge to learners. Moreover, the authors emphasised
that the kind of learning activities described here are all characteristics of situations
where ICT plays the supportive role for the learner and the teacher either as a
source of information and communication, or as a productivity tool assisting the
processing of information and presentation of findings (Lowther et al., 2008). ICT
integration does not demand a 1:1 computer to learner ratio, but low density
computer centres with space for learner interaction are best suited to this kind of
teaching (DoE, 2001).
The introduction of ICT in the education system would call for redefinition of
Environmental Education where ICT will no longer be the transmitters of knowledge
but rather facilitators of the learning process. Tinio (2009) noted that “as learning
shifts from teacher–centred approach to a learner–centred approach, the teacher
becomes the sole voice of authority” (p.__).

39
2.3.1 ICT integration in South Africa
Enlarging the use of ICTs in teaching and learning has become an important issue in
the context of the South Africa education system (DoE, 2001). The Department of
Arts, Culture, Science and Technology (2002) declared how ICT plays a major role in
education. This emphasises the value ICTs add to education, thereby improving
teaching and learning, encouraging innovation, and contributing to transformation
(Czerniewicz, Ravjee, & Mlitwa, 2005).
Czerniewicz and Brown (2005) researched through a quantitative study and
identified how ICT is being used as part of teaching and learning events and the
extent to which it is being used in teaching. It is worth comprehending that
Czerniewicz and Brown’s (2005) interpretation of ICT integration has to do with
combined use of digital resources and how teachers perceive teaching to be
organised.
2.3.2 Barriers to integrating ICT into education
The process of integrating ICT into teaching and learning is regarded as complex
and teachers may encounter a number of challenges. These challenges are referred
to as “barriers” (Schoepp, 2005). A barrier is defined as any obstacle that makes it
difficult to make progress to achieve a goal (WordNet, 1997, as cited in Schoepp,
2005, p. 2). Several studies have classified barriers into two: extrinsic and intrinsic
barriers. Ertmer (1999) defined extrinsic barriers as first order, examples as in time,
support, resources and training, and intrinsic barriers as second order, examples as
in attitudes, beliefs and practices.
Some studies also examined the question as to whether the barriers, the teachers,
or the school system. However, for the purpose of this study, it is to determine the
barriers that face Environmental Education teachers in their rural high schools, which
will focus on teacher–level barriers.
2.3.2.1 The teacher’s perceptions towards the use of ICT
Integrating ICT into classroom teaching is being promoted globally. Integration of ICT
in the classroom teaching involves a diverse set of technological tools used for
creating, storing and communicating information, which ultimately enhance teaching
and learning. Therefore Cope and Ward (2002) have observed that effective usage
of ICT in teaching will promote enhanced learning outcomes. According to Mumtaz

40
(2002), the educator’s perception on the role of ICT is very important as this impacts
on how they will integrate it in the classroom. There are also various perceptions on
how educators make use of ICT in teaching (Bebell, Russel, & O’Dweyer, 2004).
These divergent perceptions on the educators use of ICT will definitely have impact
on the planning and implementation of educational technology.
According to Beyerbach, Walsh, and Vannata (2001), if a person has a narrow view
of what educational technology is and at technology that may be used for in the
classroom, he/she may be ignorant about the importance of ICTs, and which may
lead to the perception of computers, for example, as alien and a luxury acquisition.
They will always regard it as a constraint in teaching situations, but if one is
knowledgeable about technology and how useful it can be in the classroom setting,
one will see it as empowerment. Educators’ perceptions should be drawn to a wider
view so that they see technology as an empowerment.
Teachers believe that the language used on the media is solely English, which may
inhibit them from using ICT in their teaching. On the subject of language, Lambert
(1996) observed that “access” to the Internet depends not only on ready access to
telephone lines and telecoms infrastructure, but also on a working knowledge or
proficiency in the English language which is the language of the cyberspace. Without
this, finding a way through all the various interfaces on the Internet and to be able to
access information becomes extremely difficult. Lambert (1996) noted how lack of
familiarity with English has affected the extent to which the Japanese use the
Internet compared to the massive use of the Internet in Singapore. Furthermore,
many educators perceive the integration of ICT into education as consisting of basic
computers whose role is to contribute towards effective and efficient teaching to
advance the quality of curriculum delivery (Enochsson & Rizza, 2009).
However, how to get learners get connected to the digital generation comes as a
vital component in teaching, and teachers have employed integration as a medium
for curriculum delivery. Many published articles report that integrating ICT in
education supports learning either directly, as in content delivery, or indirectly
through communication (Chai Koh & Tsai, 2010; Enochsson & Rizza, 2009), which
makes technology to be essential.

41
It is important to acknowledge that technology on its own is not likely to lead to
effective teaching in Environmental Education (Tee & Lee, 2011), rather it is a way in
which teachers integrate technology that can bring about change in the education
process. Therefore, educators in rural high schools must develop a positive attitude
and believe that ICT is an important educational tool to enhance the teaching and
learning process. However, teachers’ attitudes towards ICT usage and their
competence level have not been well received by most educators (Rastogi &
Malhotra, 2013).
In addition to this, it is perceived that there is an absence of dedicated technology
champions to initiate electronic education and to implement new technologies.
Owning a computer is also seen as a status symbol of one’s hierarchy in the society
(Dzidonu & Reddy, 1997). Educators that are using ICT in the process of teaching
and learning are interested because they see the importance of ICT resources in
teaching to be better educators and improve their teaching as well (Higgins &
Moseley, 2001).
2.3.2.2 Teachers’ attitudes towards the use of ICT
According to Rogers (1995, p.161), people’s attitudes towards a new technology are
basically elements in its diffusion. Rogers’s (1995) Innovation Decision Process
study postulate that the process occurs through stages: Knowledge, Persuasion
Decision, Implementation and Confirmation. This process makes the individual pass
through the following:
1. From first knowledge of an innovation;
2. to forming an attitude towards it;
3. a decision to adopt or reject;
4. implementation of the new idea; and finally,
5. to confirm the decision.
Rogers’s (1995) idea that individuals shift from knowledge about technology to
forming attitudes towards it and then adopting or rejecting it creates a general and
widely accepted belief that attitudes affect behaviour (Ajzen & Fishbein, 1980;
Zimbardo et al., 1977). The issue of identifying educators’ attitudes has not been
easy. Watson (1998) considered educators’ attitudes as the most misread one.

42
A major part of a study from Spain (Instituto de Evaluacion y Asesoramient
Educativo, 2007) reported that teaching staff have a positive attitude towards the use
of ICT, with a significant proportion judging it to be helpful for their teaching. In
Slovenia, educators think that learners are motivated by using ICT in the classroom
and their interest in the content of the subject increases (Gerlic, 2006). A similar
study in France (Societe-Pragma, 2006) revealed that teachers have a positive
attitude towards ICT and have identified it as a value in creating motivational
frameworks and increasing learners’ dependency.
Given that there is evidence of correlation between attitudes and behaviour, (Ajzen,
1998; Shrigley, 1990), it follows that teachers’ attitudes towards the use of
technologies in teaching may influence their behaviours and activities where they
have to use ICT tools to perform. Collins (1991) reported that beliefs were a better
indicator of career interests. Researchers (Koohang, 1987, 1989; Loyd & Gressard,
1986; Hunt & Bohlin, 1993) found the importance of teachers needing to believe in
ICT literacy which is vital for living in today’s society. However, teachers do or may
not perceive that they need a good command of ICT for their future profession and
generally had negative attitudes towards its usage. Similarly, Brunner and Tally
(1999) claimed that ICT is an expensive and creative medium of learning. Since
teachers will be expected to play an essential role in identifying technologies in their
classrooms (Albion, 2001), It becomes necessary that they are not only comfortable
using ICT but also able to engage with issues around ICT in the classroom.
The use of ICT in education has been an important concern for many countries.
Many developing countries are embracing the idea. However, ICT tools are provided
to teachers without taking into consideration their attitudes towards ICT. It is
assumed that potentially the new technological tools are to revolutionise
technological tools that are outmoded in the education system (Albrini, 2006). In the
definition of ICT in education, there are mainly four key elements which consider ICT
as an object, an assisting tool, a medium for teaching and learning, and a tool for
organisation in schools (Monnen & Kommers, 1995).
The use of ICT in education seems to have blended the issue between those who
have a positive attitude as distinguished from those with a negative attitude toward
ICT use as a tool of teaching. The depiction of negative attitudes towards the use of

43
ICT has been found to arise due to teachers’ lack of confidence in using technology
and the shortage of pedagogically driven and motivated training provided. The
teacher is an effective factor in contributing to improve education. The teachers’
effectiveness depends solely on the attitudes of the teachers. Albrini (2004) carried
out a study titled where he discovered that many teachers did not think that
computers were part of their curriculum programmes. They also felt their time slots
for lessons were very limited for computer use. In another study, Yusuf (2011) stated
that there are a number of factors which determine the attitudes of teachers towards
ICT such as an inequity of access to education between males and females.
Teachers’ long experience of using ICT was a major factor in influencing their
attitudes towards the use of computers and other tools such as projectors, scanners,
etc. Savenge (1993) found that teachers’ participation in courses in ICT literacy
reduced their anxieties and gave them more confidence, and therefore they valued
ICT more. Similarly, Watson’s (1997) study showed that many teachers had low self-
efficacy with learning ICT and had negative attitudes towards the usage of ICT.
Teachers with different levels of ICT and with much knowledge about the usage in
teaching had different self-efficacy. The novice teachers appeared to have been the
most negative, while the more experienced were the most positive towards
technology usage. As Mumtaz (2000) pointed out:
“The implications of the studies are that teachers’ theories about teaching are
central in influencing teachers to use ICT in their teaching. Even if teachers
are provided with up–to–date ICT in and supportive networks, they may not
be enthusiastic enough to use it in the classroom. Teachers need to be given
the evidence that ICT can make their lessons more fun, more interesting, and
fun for their learners, more enjoyable and much more of a motivation” (p.
338).
2.3.2.3 Teacher ICT skill
Teachers’ ICT skills are becoming widely known and as a determinant of the quality
of education provided to learners. The integration of ICT into the Environmental
Education curriculum depends on the teachers’ skills that have been acquired from
ICT (Mean, 1997; Poole, 2000). The US National Council for Accreditation of
Teacher Education (2000) defined teachers’ skills as “the ability to use content and

44
pedagogical knowledge effectively and be ready to change the teaching methods in
such a way that all learners will benefit from the learning process” (p. 56). Finger et
al. (1999) stated that teachers’ skills enable a teacher to have access to a class and
use this form of motivation to employ different techniques, for example projectors to
illustrate a process, and may improve and assist in the teaching and learning.
ICT skills refer to familiarity with technologies such as computers and equipment
including printers, scanners and familiarity with installing and using Microsoft Office.
However, Higgins and Packard (2000) contended that teachers and their ICT skills
acquired with knowledge and motivation do not improve their productivity. ICT skills
consist of the basic and advanced. Hefzallah (2004, p. 30) explained that the basic
level user should have a comprehensive knowledge of a broad range of applications
and should be able to manage computer operations.
The lack of ICT related knowledge of teachers is still one of the generally recognised
obstacles that prevent the realisation of their ICT-related goals (Pelgrum, 2001). The
persistent influx of ICT in education will make teachers life-long learners. This may
mean that the traditional model of teaching needs to be replaced by new models
which are supported by ICT. Teachers in most South African public and rural schools
have been engaged in ICT workshops to equip themselves with basic computer skills
they need to integrate into their subject teaching (PanAf, 2008-2011).
Recently, UNESCO (2009) came up with a comprehensive method for teachers to
apply ICT knowledge. The aim of ICT Competency Framework for Teachers (ICT-
CFT) is to help improve teachers’ practice by considering recent practices in the
curriculum and pedagogies. The framework is designed for professional
development for teachers to use ICT skills to improve their teaching.
The objectives of the project are:
• To develop a common core syllabus training that providers can use to
develop learning materials.
• To provide a basic set of qualifications that allows teachers to integrate ICT
into their teaching and to extend their professional development.

45
• To provide a harmonisation for different views and vocabularies, regarding
the use of ICT in education.
2.4 ICT in Rural High Schools and Communities in South Africa
2.4.1 ICT in township and rural communities in South Africa
The apartheid legacy of racial divide in the South African society has had an impact
on creating two economies in one country; the first economy being advanced, skilled
and globally competitive (Talton, 2012, p. 3). The second one, which is mostly
informal, marginalised and unskilled, is unable to have access to the benefits of the
first economy. The second economy is known to lag behind, of which the
government is trying to intervene to avoid the risk of further receding (Fourie, 2008).
This explains why there are inequalities in the development of education as well as
the usage of ICT in most rural schools in the country.
In order to determine how people from disadvantaged communities in South Africa
are trained in word processing, Blignaat et al. (2007) found that these people
showed limitations of low background and were mainly not familiar with the language
of computers. They could hardly open a document because of their inability to
comprehend the basic concepts of computer usage.
2.4.2 ICT in rural high schools in South Africa
Mfum-Mensah (2003) strongly argued that there is persuasive evidence about the
benefits of ICT in schools, especially for developing countries, as ICT is seen as a
tool that will prepare learners for the information society they will inherit. The
Department of Basic Education (2004) indicated that ICTs are seen as resources
that can reduce poverty in developing countries by overcoming the obstacle of social
and geographical isolation and accelerate access of to education for many people.
The ICT in rural high schools is seen as a political issue, as in most instances the
aim is to redress inequality with regard to access to opportunities (Pedro et al.,
2004). Rural schools have enormous challenges in integrating ICT into their
teaching. In the South African context they are seen to be addressing access, equity
and imbalances of the past system. In South Africa, rural high schools constitute a
larger proportion of the schools in the country. However, as Mfum–Mensah (2003)

46
pointed out, the lack of resources is a major characteristic of rural schools as
compared with their urban counterparts.
2.4.3 Problems encountered in using ICTs in rural high schools
Rural schools at the moment, face numerous challenges that do not occur in urban
schools. According to Naidoo (2002), research showed that rural scholars are seven
years behind their urban counterparts in basic computer skills and its usage. These
problems have been discussed below.
• Lack of school building and resources
There are so many rural high schools that do not have adequate school buildings
and resources for teachers and learners to use. Jenkin (1995) stated that most rural
high schools are located in areas with extreme poverty, and therefore there is
unlikely to be extra funds for buildings and provision of resources (Jenkin, 1995).
• Lack of computer hardware and software
According to Furlonger (2002, p. 2), most rural high schools lack computer
laboratories, let alone someone who is skilled with the knowledge of ICT and the
Internet. This result in most rural schools not being able to offer computer courses,
and this becomes difficult for learners in disadvantaged schools to find gainful
employment since most jobs now require some knowledge of computers and the
Internet.
• Remotely situated rural schools
Jenkin (2005) stated that most rural high schools are in isolation, located in
inaccessible remote areas, which makes it difficult for resources and facilities to
reach them. There is also limited transport to these areas, which makes scholars
walk long distances to schools. The roads are usually dangerous to travel on,
especially during rainy months (Jenkin, 1995). In response to these problems, there
have been some initiatives by the government and some NGOs to develop ICT in
rural parts of South Africa.

47
2.4.4 Initiatives to bridge the urban and rural digital divide
Private organisations and non- governmental organisations (NGOs) are all making
immense contributions in supplementing the government’s effort to integrate ICT into
education. In South Africa, ICT integration in schools has become a key objective for
government – both national and provincial – as well as everybody associated with
education. The Department of Basic Education (2004) sees integration of ICT into
the school system as a way of providing quality education for all.
Some projects are provided to support the integration of ICT into education, e.g. the
South African School Nets which started in some provinces and is now connected to
communities. The Mind– set Learn ,a satellite channel that broadcasts educational
content to schools in South Africa which is made up of a decoder and a television, is
trying to set up orientation to help teachers use the broadcast optimally. There is
also the Sentech Project, Khanya Technology in the Western Cape Province, and
Gauteng On–line. Microsoft Partners in Learning (PiL) is a global initiative that was
launched in September 2003 to target countries and educational institutions. It
established partnerships with local institutions on the implementation of ICT in
education. In South Africa, the (PiL) program partnered with SchoolNet South Africa
in the localisation of face–to–face teacher training materials and delivering in
schools. These include basic ICT skills for teachers, ICT integration, and ICT
leadership for education managers. To date, the programme has reached more than
8600 teachers and Department of Education officials (DoE, 2005), to mention a few.
However, almost all of these projects are situated in the urban areas. This can be
attributed to the fact that urban schools have good infrastructure. This is a contrast to
what actually happens in rural schools. According to Mdolongwa (2012), there is still
a struggle among rural schools.
The table below shows the disparities that exist in terms of acquisition of ICT tools.
The Eastern Cape, being a predominantly rural province, is the least ICT providing
province.

48
Table 2.3: Schools with computers according to provinces (2000) (DoE, 2004)
Provinces Schools with computers Schools with computers
for teaching and learning
Eastern Cape 8.8% 4.5%
Free State 25.6% 12.6%
Gauteng 88.5% 45.4%
Kwazulu Natal 16.6% 10.4%
Mpumalanga 22.9% 12.4%
Northern Cape 76.3% 43.3%
Limpopo 13.3% 4.9%
North West 30.5% 22.9%
Western Cape 82.4% 56.8%
2.5 The Importance of School Culture on ICT in Rural Schools
School culture is made up of the vision, mission, plans, norms and values that are
shared by school members (Maslowski, 2001). Focusing on the importance of school
culture for ICT integration, Pelgrum and Law (2009) indicated that effective
integration depends on the perceptions and vision of the school leaders rather than
teachers with ICT skills. The school has a mediating role that motivates teachers’
actions, beliefs and attitudes (Chai, Hong, & Teo, 2009).
In order to explore teacher perceptions related to the ICT usage, Tezci (2011b)
examined Turkish teacher perceptions from both technical and motivational
perceptive. The results on both sides were not positive because majority did not
believe they would receive adequate technical and motivational support from their
school. Ward and Parr (2010) stated that teachers need to feel confident in their
ability to facilitate teaching with technology in order to integrate it in their classrooms.

49
Kadel (2005) added that, despite the numerous quantity of technology that are
available in the classrooms, it is very important for teachers to have competency .
Competence is the ability to apply the necessary attributes to a particular concept or
content. These may include capabilities, skills, values and to put them into practise.
According to Ertmer (2010), more professional development is suggested with a
focus on increasing teachers’ skills. Above all, implementation of effective teaching
with technology integration needs teachers to change their beliefs (Ertmer, 2010).
2.5.1 The role of teachers in technology mediated environment
The integration of ICT, as predicted by Borg in 1980, may have a remarkable effect
on the work of teachers, if it is considered as tool in education (Borg, 1980). Not only
do teachers need to change their roles, but they have to put in much effort and
energy to introduce and adapt these new learning methods for the benefit of their
learners. It has been anticipated that major methods of teaching would involve the
use of modern technologies like computers by the year 2000 (Borg, 1980). However,
Crook (1994) opined that this prediction could not to be true. Vygotsky (1978)
developed the concept of zone of proximal development (ZPD) that has had a great
effect on how we regard teachers’ instruction in motivating learners to achieve
optimally. This is reinforced by appropriate use of instructional materials. This
concept of ZPD is defined as:
“The distance between the actual development levels as determined by
independent problem solving and the level of the potential development as
determined through problem solving under adult guidance” (Vygotsky, 1978,
p. 86).
Teachers can play an important role in disseminating knowledge and creating
awareness about the environment and also assist in tackling local and international
environmental problems. The teacher should be motivated so that he/she becomes
committed to the cause of realising the objectives of Environmental Education and
gets initiated in compiling programmess for such environmental issues. However, for
teachers to become successful in spreading environmental awareness, it is very
important that schools as well as the Department of Basic Education provide
incentives and conditions which will be conducive. Teachers should be well equipped
with the concepts and skills to be imparted to learners. They should acquaint

50
themselves with the methodology of the teaching that will inculcate these positive
attitudes about the environment into learners (DoE, 2004).
As technology has created change in virtually every sphere of life, including the role
of an educator, it is also changing expectations of what learners must learn in order
to function effectively in the new knowledge economy. Learners have to learn how to
navigate through large amounts of information to analyse and make decisions, and
to master new knowledge domains in an increasingly technological society. A
radical shift from teacher–centred instruction to learner–centred activity is necessary
to enable learners to acquire the new 21st century knowledge and skills. The
following table (adopted from Sandholfz, Ringstaff, & Dwyer, 1997) identified the shift
that will take place in changing from a focus on teaching to a focus of learning.
Table 2.4: Teacher Centred and Learner Centred Learning Environment
(Santholfz, Ringstaff, & Dwyer, 1997)
Teacher–centred learning
environment
Learner–centred learning
environment
Classroom activity Teacher centred, Diadatic Learner- centred,
Interactive
Teachers role Fact teller, always expert Collaborator, sometimes a
learner
Instructional emphasis Facts memorisation Relationship, Inquiry and
Invention
Concepts of
knowledge
Accumulation of facts Transformation of facts
Technology use Drill and practice Communication, access
and expression
The new environment also involves engaging learners to be more interactive and
have a greater responsibility of their learning.

51
Teachers have recently found themselves in uncertainty where there are rapid
changes in their professional practice. These have arisen due to a number of factors
including technological innovations and political initiatives. One of the most
predominant changes in the professional practice is the global influx of the
implementation of ICT. Teachers have always wondered if the introduction of ICT
into education will make a great impact and whether teachers need to acquire the
necessary skills to support their teaching. The debate is about how and the extent to
which teachers should adapt their traditional and longstanding pedagogical
methodologies to accommodate the modern ICT-driven teaching and learning. Most
teachers have accepted the new educational technologies, some have welcomed
these technologies, while a few have ignored them. Teachers that have not
welcomed the ideas of new technology in the classroom have adequately damaged
the reputation of ICT by poor classroom practice, for instance using technology for
the sake of its novelty value (Littlejohn et al., 1999).
Teachers have been polarised in their acceptance of new technologies. Some have
begun to integrate it in their teaching, whilst others have been cautious in their
welcome. A shift in the role of a teacher utilising ICTs to that of a facilitator does not
obviate the need for teachers to serve as leaders in the classroom. The existence of
ICTs does not transform teacher practices in itself. However, ICTs can help teachers
to transform their practices, given a set of enabling conditions.
With the inevitable introduction of ICT in the classroom, the role of the teacher must
change from being the centre of the teaching process to becoming organisers and
enablers (Sinko & Lentinem, 1994, p. 143). This will motivate teachers to encourage
critical thinking skills, promote information literacy and collaborative working
practices to prepare learners for entry into the world of work. Teachers must also
reappraise the methods of teaching which will meet learners’ learning needs. The
teacher will become a supervisor of the learning process and also a transmitter of
knowledge, but will also fulfil a broader range of roles. The tasks are varied which
include coaching, training, advising and testing. Subject matter and the didactic
knowledge of Environmental Education will not be enough, they must have
supervisory and guidance skills as well.

52
The question as to how the integration of ICT into education will affect the teaching
profession and the labour market has been reviewed in various literatures on
computer technology, the teaching profession and the market. In the Netherlands,
however, the discussion on integration of ICT is currently linked to another type of
question concerning the teaching profession. Partly as a result of the rapid shortage
of teachers, it is increasingly putting forward possible solutions to the problems in the
educational labour market as a contributory factor to the professionalisation and
attractiveness of the teaching profession (Boer, 2001).
As much has been mentioned on ICT and teachers in the rural schools, ICT can also
help develop the curriculum that has to be carried throughout the school years. The
next section deals with ICT and curriculum development in relation to Environmental
Education.
2.6 ICT on Curriculum Development
2.6.1 The concept of curriculum development
Philosophy has played an important role in the curriculum and teaching in the past
and will continue to be vital for making important decisions in future (Ornesein &
Hunkins, 1998). What is curriculum? Below are some definitions of what curriculum
is:
1. A specified course of study in a school to lead a person to a career; the whole
body of courses offered in an educational institution (Webster’s New
International Dictionary 2nd ed.).
2. A plan programme for all experiences with which the learner has the guidance of
the school (Jackson, 1992a).
Social reconstructionists believe that learning is a social practice and that learners
should make it a habit to build a sense of responsibility for the society. Educational
ICT is understood as the development of a set of systematic techniques with
accompanied practical knowledge for designing and testing schools as educational
systems. Petrinia (2004) argued that it is necessary to identify what knowledge is
important and what technologies are selected. According to Petrinia (2004, p. 2):
“Curriculum designs are negotiations in the politics of knowledge, identify and
identification and representation which may differ accordingly. They lend from
to, and chart provisions for the process of teaching and learning and become

53
concrete at various stages of educational practice. The very true nature for
learners experiences are shaped by the way we choose to design, or not to
design curriculum. In other words, different curriculum designs provide varied
powers of experiences and knowledge.”
2.6.2 ICT on the curriculum development
Anderson (2002) identified 28 countries that have integrated ICT into the curriculum.
His findings indicate that computer integrated activities allow learners to work
independently and constructively. The teacher is responsible for organising his or her
activities and acting as a facilitator. The integration has been proposed in various
countries depending on the long-term goals of the country. Earlier studies indicated
that the integration of ICT into the curriculum remains a big challenge in the context
of the schooling system (John, 2005). Chief among the problems that have been
identified in the integration is teachers’ perceptions of ICT usage. As Loveless (2003,
p. 315) explained, teachers’ perceptions of ICT usage in education are not only
influenced by official guidelines but also by their own experiences.
A study that was carried out in Italy (Nesler, 2004) also looked at developing an
innovative curricula proposed on the use of ICT in schools. It analyses the
advantages as well as the technical methodological problems related to the
introduction of ICT at a level of instruction. In Estonia, ICT is part of the framework
curriculum (as an integrated theme) for general education. Reiska (2008) also
sought to find out how ICT is integrated in the curricula of different schools and how
it provided guidance to meet learners needs.
However, Gibson (2001) stated that most teachers, in order to improve their
pedagogy, have to make amendments in their teaching by making full use of ICT in
the teaching and learning process (Fabry & Higgs, 1997). In the Environmental
Education curriculum, ICT acts as a supplement to classroom activities. Currently
many programmes are designed at education levels with the effective use of ICT for
the purpose of contributing to the attainment of sustainable education. There is the
need for educators to be trained of the new curriculum alongside the development of
ICT programmes to create and develop different activities for different individual
learners.

54
Paas and Creep (2008) indicated that the current uses of ICT in the curriculum
include the information resource tools which provide important links to information on
ICTs in education. The platform enables teachers to exchange knowledge, read and
prepare lesson notes. Early proponents of the use of ICT in educational curricula
were from the civics field promoting media awareness (Adu & Tella, 2010). For
example, regarding the content of geography in Environmental Education, educators
are increasingly using ICT tools as central to the curriculum, including mapping and
graphics software such as Geographic Information Systems (GIS).
2.6.3 Cross–curricular teaching of Environmental Education in South Africa
The Constitution of South Africa states that every South African has a right to an
environment that is not detrimental to his or her health or well-being (Republic of
South Africa, 1986). Every educational institution has been mandated by this
statement. This therefore implies that if environmental education can be integrated
across the curricula effectively, learners in the local and global community will be
saved from a number of environmentally related problems. This can be addressed by
educators who are empowered through programmes of Environmental Education to
educate learners who are environmentally literate.
Defining the term ‘environment’, the South Africa Environmental Education Policy
Initiative (EEPI) in 1995 stated that the environment is a matter of social and
economic policies. This definition explains why Environmental Education can be
integrated into any subject, be it natural science, social science, geography or arts
and culture. Powers (2004) described an Environmental Education integrating a
model which includes a process of infusing EE concepts and skills throughout the
existing curriculum. In South Africa, it means integrating EE across all the eight
learning areas at the GET level.
In view of reshaping learners with regard to EE, educators should be given enough
training and support. This is motivated by the Environmental Education Curriculum
Initiative (EECI, 2000) which stated that higher education institutions will have to use
the method and knowledge in resolving the environmental issues. South African
schools have chosen this integration approach and, as stated by Loubser (1997), is
one of the most important focal points, especially in the GET phase.

55
2.6.4 ICT curriculum models in relation to Environmental Education
Nicholson (1995) identified two kinds of curriculum models in relation to ICT: techno-
centric and humanistic computing. In the techno-centric model, curriculum emphasis
is placed on equipping learners with necessary skills that will be important for their
lifelong learning and future. This model that dominated in the 1980s emphasised
learning the technology to better meet the requirements of an industry. The
humanistic computing model is when the computer and the Internet serve as a
pencil, not as an isolated class, but a tool which motivates learners with knowledge
as well thinking skills.
Voogt and Pelgrum (2005) found three curriculum models:
a) Single subjects curricula focus on the ICT-supported innovative pedagogical
practices were integrated within discipline-based subject. ICT was mainly
used to improve understanding the subject contents and concepts.
b) Thematic curricula focus curriculum content was offered through themes and
ICT was used to facilitate the implementation of life- long goals.
School-wide curricula focus on the ICT–supported innovative pedagogical practices
were integrated throughout the school curriculum
Implementing ICT in the curriculum will imply funds that need to provide these
technological tools and make them available for teachers to use them in the teaching
and learning process. The next session highlights on the cost and implementation of
ICT resources.
2.7 Cost and Implementation of ICT Resources
2.7.1 Availability, cost and implementation of ICT resources
Literature suggests that as computer systems become integrated in the field of
education, teachers will become more reliant on the resources and communication
will be more available through the use of ICTs (Bloom et al., 2002). The media
traditionally used for instructional purposes will be outdated, as computers become
increasingly available and schools become more dependent on technology.
However, the degree of implementation and use of computers are affected by the
level of wealth of individual schools between rural and urban schools (Ishaq, 2001).
It therefore becomes apparent, as technology continues to progress more rapidly,

56
that learners that are not exposed to technology stand at a disadvantage (Ishaq,
2001). Seemingly, some teachers see ICT as a tool that reduces workload (Granger
et al., 2002). Edward and Roblyer (2000) stated that in the 1960s the inventors of
computers predicted that computers will replace many teacher positions.
The integration of ICT into education and teaching can only be successful if carefully
planned, managed and supported. Bates (1997) emphasised that new technologies
are likely to remain marginal despite high levels of capital investment, and will merely
add cost to the system, if structural changes in schools are not dealt with at the
same time. Twigg and Oblinger (1996) supported this by stating that management,
technical support, curriculum development and training expenditure are essential to
ensure sustainable ICT access and use in education. The introduction and
sustainability of ICT in education are also expensive. The capital cost of the
equipment needed to begin the process is obvious. Less obvious is the high level of
recurrent costs associated with the effective use of ICT, which results in a more
accurate analysis of the total costs. All attempts must be made to optimise the
benefits of such large investments and to develop cost effective implementation and
maintenance procedures.
Given the global enthusiasm for applying ICT in teaching in rural high schools and
national education systems, it is essential to put in place appropriate costing,
financing and planning processes to aid budgets, and financial allocations to ICT
must properly take into account the full cost of sustainable ICT systems as well as
address the challenge of providing ICT on an equitable basis. The cost of ICT
hardware has fallen since personal computers were introduced. A few hundred Rand
will but entry level device that will run a wide range of software. It may be that these
prices continue to fall, however, past reduction in the cost of basic devices which
provide access may not be a good guide to the future.
In many though not all developed countries, these technological and cost
advantages have accounted for mass access to and the use of computers in
education. The same is not evident in developing countries largely because the cost
barriers to supplying ICT hardware, software and connectivity in these education
environments. In developed countries, there is growing realisation of what Oberlin

57
(1996) called the financial mythology of information technology which he described
as follows:
“While the per unit price of information technology is declining rapidly, the total
cost of owing and maintaining systems is steadily rising. This was largely
because of consistent underestimation of the support” (p.43)
ICT as a global reference for information and communication technology is an
umbrella that encompasses many aspects of computing communications and
technologies. It deals with the use of electronic computers and computer software to
convert, store, protect, process, transmit and retrieve information securely.
Resources that fall within this wide scope are classified under ICT resources. Human
expertise that provides intellect layers to supplement the right usage of these
resources can be qualified under this classification and considered as an important
ICT resource development. Availability of these ICT resources does not entirely
count when considering their tangible significance, but comes when resources are
prioritised effectively and efficiently (Komza, 2005).
According to Anderson (2008), digital ICTs are quickly becoming accessible; it is
important to note earlier ICTs continue to play a critical role in education worldwide.
Accesses to films, video tapes, telephones are still far more common place than
access to a computer or the Internet and the World Wide Web. The new digital ICTs
are not single technologies but combinations of hardware media and delivery
systems. Today ICT in education encompasses a great range of rapidly evolving
technologies such as desktop, notebook and handheld computers, local area
networking, the Internet, CD–ROMs and the applications of word processors, spread
sheets, tutorials, electronic mail, digital libraries, etc. It should be noted that the use
of new ICTs is being integrated with the use of older technologies, for example it is
uncommon to find textbooks sold with CD–ROMs, containing multimedia materials,
or links to related websites.
The application of ICT tools in education is profound to changes occurring worldwide
in communication and information industries. The ability to digitise analogue signals
and transmit them over telecommunication networks is resulting in the reconstruction
of the radio, telephone, television and computer industries that create digital

58
products combining voice, video, text and graphics and deliver these signals
electronically (Bane, Bradley, & Collins, 1995).
Although the number of people with Internet access is difficult to estimate in rural
areas, one estimate places the total number at around 150 million in late 1998 and
increase of over 60% since early 1997 (Nua Internet Surveys, 1998). Internet access
at present is strongly concentrated in a small number of countries, providing services
to a fraction of the world’s population. Over 90% of Internet hosts are located in the
world’s richest 29 countries (Cukier, 1998). However, this may be expected to
change over time as telecommunications costs continue to drop precipitously. In
Africa, it is estimated that there are between 800 000 and 1 million Internet users.
The current ratio of Internet users to people in Africa is estimated to be one for every
5000 compared to a world average of about one Internet user to every 40 people.
However, Naisbitt (2008) dismissed this by pointing out that ‘whenever a new
technology is introduced, there must be a balance in human capital’ (p.__). To
buttress this argument, Goodison (2003) opined that it is in the classroom that the
fundamentals of education and what it means to know and understand are explained
by the teacher (Goodison, 2003). Teachers are sometimes unable to make use of
technology because they lack the time needed to fully prepare materials for lessons,
particularly where this involves multimedia content (Fabry & Higgs, 1997;
Manternach- Wigans et al., 1999).
In addition to this group of teachers who do not fully utilise technology because of
the time to deal with multimedia content, there is also another group of teachers
which Russel and Bradley (1997) described as having “cyberphobia” because of
their fear of getting stuck with technology. Russel and Bradley (1997) suggested that
any strategy to reduce computer anxiety among teachers deserves serious attention
and complete redress. It was expected that this study would come up with
recommended strategies to support teacher development in the use of ICT such as
school based strategies and external environmental strategies.
2.7.1.1 School based strategies
An important step towards the successful integration of ICT in schools is to facilitate
their capacity to develop a school-based ICT policy which will result in an ICT policy
plan. Such a plan can be defined as a school document containing elements

59
concerning the integration of ICT in education. Several strategies have been
mentioned in previous research literatures. Recently attention has shifted to school-
based programmes that emerge into successful ICT integration (Tonduer et al.,
2008). Examining school characteristics such as leadership or school conditions,
infrastructure is very important in identifying which factors best explains the
successful integration of ICT in education. Hew and Brush (2007) identified one
important school level condition as having a shared vision and ICT policy plan.
Schools need to facilitate their capacity to develop a local ICT policy (Hew & Brush,
2007). This policy has to be grounded in a vision of teaching and learning and ICT
integration (Vanderlinde et al., 2009). A school-based ICT policy can be defined as a
comprehensive school document containing a variety of operational elements
concerning the integration of ICT in teaching and learning (van Braak, 2003; Frazier
& Bailey, 2004). It describes the overall philosophy of ICT use and explores how ICT
will improve teaching and learning (Baylor & Ritchie, 2002).
In an ICT policy plan, a school describes its expectations, goals and content
concerning the integration of ICT in education. This may include elements such as
professional development, ICT curricula and ICT planning and evaluation (van
Braak, 2003). Bryderup and Kowalski (2002) argued that creating an ICT plan is a
crucial step towards the implementation of the integrated use of ICT. Research
showed that schools that are successful at integrating ICT in teaching and learning
are mostly guided by an ICT plan (Baylor & Ritchie, 2002).
Much more recently, Tondeur et al. (2007) found that educators in schools with a ICT
policy plan emphasise shared goals and tend to use ICT more in their classrooms.
ICT policy planning is a way of solving problems that will emerge during the process
and implementation of ICT integration in teaching and learning (Gulba–har, 2007).
According to Gulba–har (2007), such planning is not about hardware and Internet
connections, but about how an ICT is integrated within the curricula content.
It is important for school leadership to show appreciation for increasing significance
of ICT in the school curriculum in general and Environmental Education in particular.
Therefore, school management should create an enabling environment for the
integration and promotion of ICT in teaching and learning of Environmental
Education in rural high schools. Where the ICT infrastructure has been adequately

60
provided, it becomes the duty of the leadership to ensure that both teachers and
learners get along with this innovative tool.
2.7.1.2 External environmental strategies
Schools working together with other schools in the same community can benefit
each other by sharing ICT resources, expertise and support. External support may
also be provided in the form of locally based training. Ross et al. (1999) highlighted
the advantages of involving teachers in the design of such training courses,
providing training expertise in the form of continuous professional development.
according to the World Health Organization (WHO, 2002), environmental pollution,
especially regarding air and atmospheric pollution, is limited to situations in which
the ambient atmosphere contains material in concentration which are harmful to man
and his environment. Learners can therefore undertake other Environmental
Education lessons outside the classroom in the course of learning. These include
planting of trees to check loss of vegetation, construction of contours to check
erosion, provision of waste baskets to the market people. Umozurike (1993)
observed that the categorisation and weighing of prescribed activities for teaching
Environmental Education topics revealed that 77.3% are indoor activities and 22.7%
are outdoor activities. The analysis reveals that EE teaching is limited to the
classroom most of the time.
How then is Environmental Education offered in the classroom? Below is a
discussion of the history and concepts of Environmental Education.
2.8 History of Environmental Education in South Africa
Environmental Education has in existence since the years of Second World War
(1939-1949).This was as a result of human suffering. Out of these concerns there
flowed recognition of the need for public awareness about the environment and
environmental issues that have emerged (Carson, 1962). From an international
environmental education perspective, the most fruitful partnership was that with
UNESCO. UNESCO was initially concerned only with education in a developmental
context, but gradually through its contact with bodies such as IUCN, it became part
of the process of developing Environmental Education.

61
The 1992 Earth Summit also focused on the role of Environmental Education as an
educational response to the environmental crisis. Chapter B6 of Agenda 21 is one of
the documents which emphasised the need for wide-scale Environmental Education
and capacity building, and aimed at responding to a wide range of environmental
issues. Agenda 21 described the process as those that involve teachers and
learners in promoting sustainable development and improving the capacity of
individuals to address environmental issues (UNCED, 1992, Chapter 36, p. 2),
illustrating the link between changes in the field of Environmental Education.
2.8.1The development of Environmental Education in South Africa
Having discussed the history of Environmental Education, its development can now
be traced in South Africa up to and after 1994. Contemporary forms of
Environmental Education first reached South Africa in the mid-1970s, stimulated by
the Belgrade Charter of 1975 and the 1977 Tbilisi Principles. Back then,
Environmental Education was termed ‘conservation education, with great
concentration of soil erosion, until the late 1970s. Conservation education later
became subsumed within Environmental Education, of which it continues to be an
integral part.
In the 1990s, Environmental Education shifted its focus on sustainability. For
example, it was a cross-curricular theme adopted into the national curriculum in
Britain. Many schools practised the model of interdisciplinary teacher cooperation
where the teacher uses different disciplines and works together through planning
courses, organising teams and teaching, etc. Environmental Education is best done
by the interdisciplinary teacher who is able to embody the plan of integrating. The
teacher guides learners to resolve environmental issues by aesthetic, social,
economic, political and cultural activities. Therefore, the interdisciplinary teacher
embodies the idea of Environmental Education for sustainability. As a result,
Environmental Education for sustainability contributes to the education of the whole
person (Tilbury, 1995). This acknowledges that the investigation of any
environmental issue must involve the study of the intersection and interaction of
these elements.

62
A holistic Environmental Education would not be considered as a subject in itself but
rather be treated as a whole concept that needs input from all parts of the curriculum
(Worldwide Fun for Nature, 1990). For example, when solving some environmental
problems, it may bring out questions like how poverty sometimes causes
environmental exploitation, and which forms of social organisation may best
contribute to sustainable development (Beddis & Johnson, 1998).
For many years, most Environmental Education in Southern Africa took place in the
non-formal education sector. It was understood and interpreted clearly as
programmes of Environmental Education in institutions. During those days it was
focused on outdoor activities and experiential learning. Although some merits could
be identified in the methodology of these approaches, it was difficult to determine the
real purpose of many of these programmes. The understanding of Environmental
Education gradually changed and it grew to include a more holistic understanding of
how to educate (Fien, 1993, p. 12). This new understanding of Environmental
Education had significance on curriculum development in formal education.
Despite efforts being made to include Environmental Education in formal education,
there is still no clarity on how Environmental Education should be implemented.
Theories have been criticised by those advocating critical curriculum theorising
(Schreuder, 1995, p. 21). However, the best way to address environmental learning
through the formal curriculum is still fiercely debated today. The NEEP (National
Environmental Education Programme) process in South Africa includes research
processes that are supposed to provide answers to this burning issue. Whilst these
programmes focus on a certain cluster- based approach, (Sguazzin & Du Toit,
2000), the EEPI (Environmental Education Policy Initiative) (1995, p. 2–3) suggested
that there are four main policy options for introducing Environmental Education in the
formal education system:
1. Environmental Education as local problem–solving curriculum actions.
2. Environmental Education as an integrated approach to Environmental Education.
3. Environmental Education as a separate subject.
4. Environmental Education as a component within a subject.

63
Once a good curriculum process is in place, teachers and facilitators will have to
choose the strategies and methods to use in their teaching. These have been widely
discussed in many publications. The question is: Which of these methods are
appropriate to Environmental Education? Generally, strategies and methods should
include:
• •Questioning including tests and examinations
• •Discussion including debates and teaching by peers
• •Investigation and problem–solving
• •Demonstrations
• •Cooperative group work
• •The experimental method, including exploratory learning excursions
(Fraser, Loubser, & Van Rooy, 1993; Trowbridge & Bybee, 1996).
The development of Environmental Education in South Africa has not, however,
been a smooth process. A concept which emerged in the early 1980s and was
confused with Environmental Education was that of “outdoor education” which
focused on out-of-door activities (UNCED, 1992, Chapter 36, p. 2). After 1982, this
point gradually declined in South Africa and is now in complete eclipse. Stimulated
by the increasing interest by the international community in Environmental
Education, there was a large conference on outdoor education held in Pretoria at
Treverton College, Mooi River in Natal. This conference gave birth to the formation
of the Environmental Education Association of Southern Africa (EEASA) which has
subsequently played a role in the growth of Environmental Education in South Africa
(Environmental Education Bulletin).
2.8.2 South Africa Environmental Education policies
South Africa’s Environmental Education visions are found in the various policies
which begin with the 1996 Constitution of the Republic, the 1997 Urban
Development Strategy, the 2000 Rural Development Strategy, The National
Environmental Management Act of 1998, Curriculum 2005, and the National
Curriculum Statement of 2002. South Africa has been considered as one of the
countries with a profusion of environmental pressures, which includes air and water

64
pollution from industrial areas that are close to residential areas, unplanned
urbanisation which has increased to 58 %, and increasing poverty levels, to name a
few (Southern African Institute for Environmental Assessment, 2003).
Environmental Education policies have been in the process of becoming inculcated
into the curriculum (DoE, 2004). However, the processes of funding have not been
established by the South African government, but initiatives are largely funded
externally by overseas donor agencies (UNESCO, 2004). For instance, the World
Bank has been one such international body that has supported the funding of the
integration of curriculum through the Environmental Support Program (Lupele, 2002).
The teaching of Environmental Education takes place within the curriculum, the
teacher and the learner. It consists of two fields: education and the environment.
The education field has been well established and it is being studied and practiced.
This process has led to a strong focus on formal education. The education field has
strengthened its policies which include teaching methods to identify the effectiveness
of different styles and teaching tools (Giddens, 2001)
Outdoor education has been positioned within the Environmental Education
curriculum. Outdoor Education Activities (OEA) consists of two definition elements
which are: teaching and learning that take place outdoors, and a method of teaching.
The role of outdoor education and Environmental Education has been established
over the years with numerous studies to support the impact on personal and social
development of learners (Smith, 2002). The role also suggested that learners
participate in activities outside the classroom and not only increase their physical
well-being, but also there are measurable improvements in their self-esteem, self-
worth and confidence, as well as reducing their stress levels (Davidson, 2001). Other
studies have revealed how exposure to nature improves mental ability which can
translate into academic success (Berman, Jonides, & Kaplan, 2008).
Teachers are therefore encouraged to use outdoor educational activities in teaching
environmental issues and concepts, instead of staying in the classroom to deliver the
contents of the curricula. Learners should be taken on field trips, avoiding risks and
obtaining approval from the Department of Basic Education (Adu, 2006). In support
of the Environmental Policy Initiative, Molapo (1999) suggests that schools should

65
have a clear environmental policy that caters for all outdoor activities within the
school.
2.8.3 The teaching models, concepts of environmental education and ICT
Weiser states that “You don’t know the power of a motivated, excited teacher until
you see one in action”. Many teachers are now incorporating Environmental
Education activities into all sorts of recycling programmes at their schools. They
change the way they do things in their personal lives and pass the enthusiasm along.
Models of teaching like patterns represent the steps in teaching which will bring the
desired outcomes in both teachers and learners. According to Joyce and Weil
(1985), a teaching model is a pattern that can be used to shape the curriculum and
to design instructional materials so as to guide teachers. Thus the model of teaching
comprises guidelines for designing educational activities. It also specifies the
methods of teaching and learning, and the intended goals to be achieved.
The integration of ICTs as an approach to teaching and learning need the
accommodation of new tools into the teachers’ practice for it to be described as
quality. The teachers’ ability to choose and manage the teaching and learning
processand using different media has a great impact in the development of new
ideas that are relevant to the learners’ performance. The principles of teaching and
learning should be prioritised when ICTs are being used in the classroom if quality
education is the aim.
The selection of ICTs should reflect in the teaching and learning process and not
necessarily what makes the learners excited. That is to say, the technology chosen
should be based on the content of the curriculum. This will have enormous influence
in determining whether the goals of the lesson have been achieved or not. Lim and
Tay (2003) suggest the following tools that can be used to support an achievement
of specific learning objectives.
a) Situating tools are settings where learners get first-hand experience of the
content and context of the learning process. These can be simulation games
and virtual reality. Hogle in Lim and Tay (2003) proposed that simulation and
games can improve cognitive learning styles like, memory, organisation and
especially critical thinking. The main purpose of the game should depict the
lesson content.

66
b) Constructive tools are devices used to manipulate information and also to
construct new forms of knowledge in Environmental Education. Examples are
databases, spreadsheets, etc. They do not take the responsibility away from
the teacher but promote higher order thinking skills (Jonassen & Carr in Lim &
Tay, 2003, p. 430). Learners are given the chance to access, analyse,
connect and solve problems with ICT tools.
c) Communicative tools are tools used for teacher-learner or learner-learner
interaction outside the classroom. Examples are e-mails and social networks.
Such tools can be used to argue meaning in a given context. These provide a
wide range of aids to the personal or professional work of teachers. For
example, lesson plans and learner handouts are stored as word processor
files. They are easily modified and brought up to date. Teachers can also
have access to professional development and training through distance
learning, as well as communicating with learners.
Appreciation of one’s environment is nothing new. Since the early writings of John
Muin and Aldo Leopold, amongst others, concern over humankind’s impact on the
environment has been well discussed. Carson (1962) released a seminal work
documenting the effects of pesticides in the environment, which brought a new
sense of urgency in how humans interacted with the environment. This was noted by
Daniel Einstein as Silent Spring (1995). Silent Spring quickly became a catalyst for
an environmental movement. From this movement emerged an awareness of human
complicity in environmental decline, as well as the involvement of public values that
emphasise the quality of the human experience and the human environment
(NEEAC, 1996).
Environmental Education must not merely be to create another professional cadre. It
must be able to instil the moral values from early childhood that would engender
deep respect for nature and the environment. In other words, the focus of
Environmental Education must be to instil in the young strong moral values regarding
the environment. Environmental Education tends to develop a world that is mostly
concerned about the environment and its problems which embodies knowledge,
skills attitudes and motivation, as well as commitment to work. It has set objectives
which were stated in the behaviourist approach at a conference in 1977 at Tbilisi in
the USSR. They focus on the following:

67
• The inculcation of awareness of the total environment and its problems.
• The gaining of sound knowledge and understanding of how the
environment functions.
• The establishment of positive attitudes toward the environment.
• The participation of skills needed to identify, investigate he environmental
issues and problems.
The term ‘Environmental Education’ has been in common use in educational circles
for several decades. In 1979, the International Union for Conservation of Nature and
Natural Resources (IUCN) and UNESCO held an international working meeting on
Environmental Education in the school curriculum at Foresta Institute, Carson City,
Nervads, USA. Below is a definition of Environmental Education:
“Environmental education is the process of recognizing values and clarifying
concepts in order to develop skills and attitudes necessary to understand and
appreciate in the inter–relatedness among man, his culture and his
biophysical surroundings” (IUNC, 1970).
2.9 Environmental Education Learning Strategies
There are multitudes of learning strategies, but some are more appropriate for
environmental learning. A hands-on, experiential approach is preferred where
learners are actively involved and focused on environmental problems and
challenges (EETAP, 1998; 2001). This is simply because learning about the
environment does not automatically lead to action. Learners need to experience the
fact that they can make real contributions to their environment through meaningful
activities which are respected, and that they can influence the reality in which they
live (Centre for Education Research and Innovation, 1991, p. 7). Some of the more
appropriate learning strategies in environmental learning, therefore, are active
learning, critical thinking and involvement of real issues (authentic learning) (Lotz–
Sisitka & Raven, 2001, p. 94), and learning through problem- solving (Evans, 2002,
p. 1–6; EPA, 1999, p. 2).

68
2.9.1 Active learning
Learners should not only learn about the environment but should be active
participants in the learning situation in Environmental Education. They must be given
the opportunity to be critical and creative, as well as be able to discover things on
their own. The purpose of the learning must be to enable learners to develop as
individuals and to acquire knowledge, understanding skills, attitudes and values that
will help them to understand and face the many challenges in the environment
(Morris & Stoney, 1998).
Active learning requires learners to act on information by transforming it into new
meaning. (Campell, 1990). In this instance they should be able to use the
technological tools to ascribe meaning to what they have learnt.
2.9.2 Critical thinking
Many outcomes for Environmental Education are “Learners should be critically
engaged with…” This implies a higher dimension of thought and requires learners to
acquire a lot of information on different perspectives associated with an
environmental problem, issue or risk if their critical engagement is to be meaningful
(Lotz–Sisitka, 2002, p. 118).
According to Wals and Van der Leij (1997, p. 20), environmental learning, as seen
from a social-critical paradigm, consists of four dimensions -- its purpose is to enable
learners to construct, critique and transform their environment. Wals and Van der
Leij (1997) explain this as follows:
“Construct in the sense of building upon the prior knowledge, experiences,
ideas of learners; critique in the sense of investigating underlying values,
assumptions, world views, morals, etc., as they are part of the world around
the learner and as a part of the learner him/ herself; emancipate in the sense
of detecting, exposing and, where possible, alerting power distortions that
impede communication and change; and transform in the sense of changing,
shaping, influencing the world around them, regardless of scope or scale”
(p.23).

69
2.9.4 Problem solving
Problem- solving and decision- making are critical to ensure meaningful experiences
(Evans, 2002, p. 5–6) in Environmental Education. Evans (2002) stated that
investigating environmental issues with a focus on specific problems in the local
community can be used with great success, as long as learners are provided with a
variety of tools they can use to effect change. With correct guidance and support,
learners will make a genuine effort to solve problems if they are real and especially if
adults are unable to find a solution (Conti, 1999, p. 112).
2.9.5 Authentic learning
Because of nature, learning in Environmental Education should have an applied
focus and should be authentic. This implies learning about real environmental threats
and problems, and looking for real solutions to these challenges. Where possible,
learning should consist of authentic (real-life) activities and should take place in real-
world contexts. The environment actually presents educators with a wide range of
subject matter and a variety of learning contexts which can make learning interesting
and enjoyable (Morris & Stoney, 1997). Authentic learning tasks help learners to
understand the interaction of environmental, social and economic processes, and to
cope better with the complexity of sustainable development (Gurevitz, 1998).
How then is ICT implement in the curriculum, for teaching, to be effective? Below is a
discussion on the implementation of ICT in the curriculum, with regard to some
developed and developing countries.
2.10 ICT Implementation on the Curriculum
Some researchers suggest that there is no direct link between the use of ICT and a
positive impact on learners’ outcomes (Cuban et al., 2001; Newhouse, 2002;
Waxman et al., 2003) unless ICT are used effectively (Becta, 2002). ICT has to be
used in an effective way otherwise it will be a waste of time (Romeo, 2006). For
example, according to Leach and Moon (2000), using computers only for word
processing does not indicate good implementation.
According to them:
“Implementation is not substituting 30 minutes of reading for 30 minutes of
computer skills development. It is, however, using computers to teach 30

70
minutes of a lesson. Implementation is not providing application soft–wares
like spread sheets, without a purpose. It is not pre–packaged programs that
are often unrelated activities clustered around a particular topic that
addresses a concept. Defining technology implementation is not the first step
in deciding how to integrate [it] into the classroom” (p. 73).
Secondly, for effective ICT implementation, educators should start with the
identification of educational problems. The use of ICT will support the educational
process and a way to strive for better implementation (Newhouse, 2002). Educators
should not focus on technology itself, but instead be able to do an analysis of
educational problems that need to be rectified (Van Melle et al., 2003). For example,
educators should begin asking questions like “What are the educational problems
that our learners face?” and “Do our learners need to improve their educational
skills?” Then educators carefully choose ICT, paying attention to the advantages as
well as the limitations (Collin & Berge, 2000).
ICT implementation is not a product but a process (Yalin, Karadeniz, & Sahin, 2007).
The success of ICT implementation in education means implementing ICT effectively
and efficiently in all dimensions (Yalin et al., 2007). This includes ensuring that the
process requirements are met. Educators, in choosing ICT, should pay attention to
well supported and well-defined educational objectives (Collins & Berge, 2000).
Collins (2001) suggests that teachers cannot use ICT until they know which ICT is
relevant. Furthermore, ICT is less effective when educational set objectives are
unclear (Honey, Culp, & Spielvogel, 2005). Honeyet al. (2005) agreed that instead of
concentrating on ICT use itself, those who successfully implement ICT show a clear,
meaningful connection between technology and educational goals.
Another area of interest worth considering is the teachers as resources in the
implementation of ICT in the curriculum and the teachers’ empowerment in terms of
the knowledge they have acquired and their skills in teaching with ICT.
Empowerment is a process whereby school participants develop the competence to
take charge of their own growth and resolve their own problems (Greer & Melvin,
1994). The study emphasised teachers’ knowledge development in ICT to enhance
education. Teachers who feel incompetent in their content areas fail to teach.

71
2.10.1 ICT Implementation in the developed world
Many authors have researched greatly on the implementation and spread of ICT in
education within the developed world (Cecchini & Scott, 2003; Fullan, 1993, 2001;
Kozma, 2005, 2008; Pelgrum, 2001). The majority of the research indicated that IT
tools can be successful to extend available education opportunities (Kozma, 2008).
However, the dream of promoting their effectiveness remains elusive in many cases
(Reeves, 2008). This problem has developed in research studies over the past
years.
The European e-Learning Forum for Education (ELFE) project was initiated by the
European Trade Union Committee on Education (ETUCE), with the aim of
understanding strengths and weaknesses of using ICT in primary and secondary
schools, studying good practices of pedagogical use of ICT, and identifying lessons
that could be learnt in a number of European countries (Fredriksson et al., 2008). It
was conducted between January 2004 and December 2005 where investigations
were made in different schools with ICT usage, whether ICT was used intensively for
instructional purposes and how it influenced the lives of the learners as compared to
the traditional way of teaching in the classroom. The study identified two areas
where the use of ICT seems to have made a difference.
Finland
Finnish teachers and principals have developed a negative attitude towards ICT use
at school, despite the rapid increase of ICT access in all schools (Kankaanranta,
2009). There was great evidence that the use of ICT as a tool for instructional
development is not important and the impact of ICT on communication is only
moderate. Thus, Finnish schools do not make use of ICT and more so the
pedagogical use is not important (Kankaanranta, 2009). The findings pose questions
on how to support and motivate schools to become competent members of the
Finnish knowledge society.
Lithuania
In Lithuania, members of the school board and the management made decisions
about ICT management and its usage at the schools. Teacher training includes
technical, social, pedagogical, information related and management competencies.

72
The standard for teacher training is based on the modules of the European
Computer Driving License (ECDL), plus additional modules related to the use of ICT
in schools. The ECDL syllabus consist of seven modules which define the skills and
competencies necessary to be a proficient user of a computer and computer
applications (EDCL Foundation, 2007). By 2007, only 24% educators were ICT
literate (Markauskaite, 2009).
2.10.2 ICT implementation in the developing world
The section presents an overview of ICT developments made in the developing
world. The developments are focused on the national systems which further stretch
toward achieving educational goals in South Africa, Mozambique and Chile. These
countries are examples of a developing world based on the fact that Chile is known
to be a successful case because the Chilean government’s ICT initiative was fully
taken over by the Ministry of Education by 2005. South Africa and Mozambique are
from the same block of countries aiming to achieve the African Union goals which
have been set for ICT. In addition, Trinidad and Tobago in the Caribbean region are
also cited as good examples for ICT implementation in rural schools. The
developments are normally measured against the time ICT was implemented and its’
achievements.
2.10.3 ICT implementation at national level
The core of this research, as stated in the title, is how ICT is being implemented in
rural high schools. Little has been written about ICT use in the developing world.
Most of the articles that exist focus on ICT provision (Ali, 2009; Cossa & Gronje et
al., 2006), and some professional development in the colleges (Lipinge, 2010) have
discussed various benefits of implementing ICT in schools.
The national goals of South Africa were summarised by Blignaut and Howie (2009).
The government of South Africa implemented Phase 1 of its roll-out plan in 2004-
2007. The programme was aimed at providing an education system that would
support ICT integration in teaching and learning to acquire confidence in using ICT in
the curriculum, to ascertain the availability of ICT, use quality education content, and
connect schools to the Internet. The second phase, which was between 2007 and
2010, encourages teachers and managers to integrate ICT into the curriculum. The
third phase (2010-2013) expects that all provincial Departments of Education will use

73
ICT in their planning and communication, and all institutions use the educational part
of teaching, given that teachers are capable of using ICT.
In 2007, a baseline survey was conducted to determine the availability of resources
for the Department of Basic Education to make decisions in terms of resource
allocation. South Africa relies on donor funding for the provision of computer
laboratories, moreso than motivating more teachers qualified to integrate ICT into
teaching. Curriculum and content development is government’s responsibility. In
South Africa, universities have not been given any role in professional development
in ICT training for teachers. Farrel and Isaacs (2008) reported universities in South
Africa are developing their own internal ICT policies. Rather, the researcher agrees
with Howie (2010) that a lot can be learnt from the Chilean strategy where
universities are given a specific role to train teachers in ICT.
2.10.4 ICT Implementation at school level
This section summarises the case of ICT implementation at school level in
developing countries. Examples of ICT use in a number of African countries in order
to present the African rural context are South Africa and Mozambique. Cossa and
Gronje (2004) conducted a study on “lessons learnt from introducing computer into
schools in Mozambique between 1997 and 2001”. The aims of the research were to
extend the concept of the global phenomenon of using ICT in secondary schools to
enhance knowledge and to contribute to the formal use of ICT learning in secondary
schools through aspects and the challenges of teachers in ICT implementation. The
project was conducted through a case study on the Acacia project, designed to work
with rural areas that were extended from ICT networks to which their urban
counterparts had access. The project managed to network 13 schools with access to
e-mail and the Internet and was later changed into a national programme now run by
the Ministry of Education. Both teachers and learners were trained how to use
computers for teaching and learning.
Several authors agree on the introduction of ICT into South African schools (Brandt,
Terzoli, & Hodgkinson-Williams, 2008; Langmia, 2006; Mentz & Mentz, 2003), all
favouring introducing computers into schools to a certain extent, but pointing out the
various problems experienced in different parts of rural South Africa. According to
Brandt et al. (2008), there are many schools which are still disadvantaged after

74
apartheid and are still lacking the basic infrastructure such as electricity, telephone
lines and libraries where information could be readily available. To overcome these
challenges, a number of projects have been initiated: The Ulwazi project was
introduced to five schools ,of which four are situated in the township of Mamelodi
and one in Lynwood Glen, Pretoria. In Grahamstown, Eastern Cape, a similar project
was introduced to one third of the secondary schools beyond the range of DSL, and
the poorest schools in the area.
The aim of the project was to develop programmes that educate and train teachers
to integrate ICT effectively in their teaching. In addition to these challenges, Brandt
et al. (2008) reported on a recent survey undertaken by the Education Policy of the
University of Western Cape and the International Development Research Centre,
which found that South Africa has low numbers of Internet users in some rural areas,
sometimes less than 5%. As a result, it becomes difficult to connect to schools that
do have computers. Effective use of the Internet for instructional purposes needs
learners to have the necessary skills to find the relevant information.
2.11 THEORETICAL FRAMEWORK
2.11.1 Cognitive theory
An aspect of Vygotsky’s theory is the idea that the potential for cognitive
development is limited to a “zone of proximal development” (ZPD). This zone is the
area of exploration for which the learner is cognitively prepared, but needs help and
social interaction to fully develop (Briner, 1999). A teacher or more experienced peer
is able to provide the learner with “scaffolding” to support the learner’s evolving
comprehension knowledge. The implications of Vygotsky theory are that learners
should be provided with socially rich environments in which they have to explore
knowledge domains with their peers. ICT can be used to support the learning
environment by providing tools for discourse, discussions and providing online
support systems to scaffold learners’ evolving understanding and cognitive growth.
The basic principles underlying cognitive learning theories include thought as an
active pursuit, a foundation of experience used to organise new information, a
personal perspective regarding new information, and as a social environment to

75
acquire knowledge. Using cognitive theory, the teacher offers a variety of
experiences to approach information, assess understanding and summarise the
information. The learners are active in the exploration using social interaction and
feedback to stimulate the individual thinking process. Cognitive evaluation theory is a
theoretical perspective that sheds light on the interaction between classroom goal
structures and the integration of ICT (Deci et al., 1999).
The cognitive theory infuses the integration of ICT into Environmental Education
curriculum with meaningful interaction. Teachers will use the multimedia to bring the
real world to the classroom through the use of sound and video. Such connection
should sense a factor in motivating learners and also experience modes of
presentation. Meyers and Wilson (2000) explained that without these tools, the
interactions that teachers produce may not assist or motivate the teaching and
learning process.. Therefore, technology in this teaching theory is a piece of the
learning environment that helps to bring about cognition.
2.12 Cognitive Theory and ICT Integration
ICT in singular does not produce learning, but it can be used to enhance and
motivate the learning process. Studies generally describe three major categories of
instructional use for computer aided technologies. These are learning from ICTs,
learning about ICTs, and learning with ICTs.
2.12.1 Learning from ICTs
Learning from ICTs allows the teacher to use technologies to convey information to
learners without their active participation in the lesson. This reflects on the traditional
mode of teaching, where there is passive interaction between the user and the
technologies. This results in acquiring facts through repeated practice and rote
learning or from technology (Ross et al., 2010).
This traditional approach of the traditional mode of teaching underpinned the
cognitive theory. People learn from forming knowledge through thinking, and
therefore learning is a product of thinking.
2.12.2 Learning with ICTs
Learning with technology improves much of the thinking in the learning process
(Jonassen & Reeves, 1996). In view of this, technology becomes an integral part of

76
the teaching and learning process. Both the teachers and learners make adequate
use of technologies to enhance learning.
Learning with ICT tools promotes learning of higher-order thinking skills (Jonassen et
al., 2010). This makes it far easier to recollect facts or information. The role of the
teacher and technology does not actually lead to thinking, but to tools to support and
enhance learning.
2.12.3 Learning about ICTs
Another use of technology is learning about the technology itself (Jonassen &
Reeves, 1996). In this context, the computer is studied as a subject where learners
learn specific skills such as particular programming, keyboard skills, etc., but these
skills are not connected to any other content. Here the computer is not used as a
learning tool.
2.13 Summary
Much research has been conducted on the use of ICT in education with the help and
benefits of technology, and how it can change education to make contributions
globally and to the current digital economy. Educators have always been recognised
as elements of change and transformation, and if they are well trained in the aspect
of technology and become well-equipped, they will be able to help transform the
educational process. Teachers’ ICT competence, technology skills and their
attitudes to the use of ICT tools depend solely on the type of professional training
they acquire.
Literature suggests that when used properly, ICTs enable new ways of teaching and
learning, depending on the availability of the resources, rather than simply allowing
teachers and learners to mix ICTs with the traditional method of teaching and to
improve on what they do in the classroom. These new ways of teaching and learning
are underpinned by cognitive theories of learning, which shift the process away from
teacher-centred to learner-centred approaches.
The chapter analysed research conducted on the integration of ICTs in education, its
benefits, and the challenges that limits its implementation. The problems are mostly
with educators and infrastructure. It is clear from research that the use of ICT in
education is a concurrent issue and must be attempted within a coexisting context.

77
CHAPTER THREE
RESEARCH METHODOLOGY
3.0 Introduction
Research methodology has been described as a systematic and objective process of
gathering, recording and analysing data for the purpose of resolving problems (Bless
& Higson, 1995; Babbie et al., 2001). Similarly, Bailey (1982, p. 4) defines research
as a systematic and organised effort to investigate a specific problem that requires a
solution. In quite a number of definitions of research, there is an assumption that the
researcher has to find out or make an original contribution to a phenomenon.
This chapter describes the research methodology applied in the study, including the
data collection methods, the instruments, the research population, and the method of
sampling used. The research paradigm adopted in the study is discussed. The
methodology seeks to outline and explains the relationship between the research
problem and the data collecting instrument and the analysis of the research.
According to Cohen, Marion, and Morrison (2000), the aim of the methodology is to
help researchers to understand the processes and the outcome of the study. This is
done through diverse ways of collecting data. The chapter concludes by addressing
the ethical issues that were considered in the study.
3.1 Research approach
As briefly described in Chapter One, the research strategy for this study was a
quantitative survey. Slavin (2007) referred to quantitative research as research
whereby numeric data is collected and statistically analysed.
According to Tashakkori and Teddlie (2003), research methods refer to ways,
techniques or tools for acquiring thoughtful, accurate as well as correct data about a
study and ways, technique or strategies to be used to manipulate the data. Cohen et
al. (2000) also agreed with Tashakkori and Teddlie but opined further that methods
are to be used as a basis for inferring and interpreting. In addition to this, Creswell
(2003) said a researcher using the quantitative method uses a post positivist
approach to develop knowledge. The study therefore follows a quantitative method
as well as a survey and correlation research design using a positivist paradigm. It

78
answers the “how many” questions and provides results that can be projected onto a
broader population.
A quantitative method approach is used in the study, focusing on the relationship
between the use of ICT tools and how effectively they are used in teaching
Environmental Education. According to Aliga and Gunderson (2000), quantitative
research explains phenomena by collecting numerical data that are analysed using
mathematically based methods in particular statistics. The specificity of quantitative
methodology lies in the fact that numerical data is collected and analysed using
mathematical methods.
Quantitative methodology tends to control for bias so that facts are understood in an
objective way, looking to first-hand experience to provide meaningful data (Laws &
McLeod, 2004, p. 2). It is a type of educational research that relies on the collection
of data subjected to quantitative analysis. It is generally a means for testing objective
theories by examining the relationship among variables (Creswell, 2009; Johnson &
Christensen, 2004). The researcher in quantitative research often decides what to
study, asks specific, narrow questions, collects quantifiable data from participants,
and analyses these numbers using statistics – like finding the cumulative frequency,
the mean, median and mode (Creswell, 2008, p. 46).
Babbie (2010) stated that the quantitative research approach provides objectives
and results that are unbiased and have not been influenced by the researcher.
Furthermore. the quantitative research approach is based on its original plans and
the results are analysed and interpreted. Below is a summary of the characteristics
of this approach (Burns, 2000, p. 6–7):
• There is reality that can be defined by careful measurement which is
usually concise;
• •The sample should be representative of a large population;
• •It describes, examines relationships and determines causality among
variables;

79
• Statistical analysis is conducted to reduce and organise data, determine
significant relationships, and identify differences or similarities within
different categories of data; and,
• •It provides an accurate account of characteristics of particular individuals
or groups.
According to Burns (2000, p. 6-7), the strength of quantitative research approach lies
in the following:
• •Precision through reliable measurement;
• •Control through sampling and design; and
• Ability to produce causality statements, through the use of controlled
experiments and statistical techniques.
However, its limitations include the following (Burns, 2000, p. 6–7):
• It is difficult to rule out or control all variables because of the complexity of
human experience;
• •Its mechanism and ethos tend to exclude notions of freedom, choice and
moral responsibility; it fails to acknowledge people’s experiences and the
construction of their own meanings; and,
• It leads to assumptions that facts are true and the same for all people at all
times, and it often produces banal findings of little consequence.
3.1.1 Research paradigm
In a positivist paradigm the assumptions are based on the social world which can be
studied in the same way as the natural world. Reichardt and Rallis (1994) wrote that
this type of positivist position was discredited before World War II and was replaced
by post-positivism. In early positivist thinking, the researcher and the subject of the
study were assumed to be independent (Lincoln & Guba, 2000). The positivist
paradigm, stemming from the enlightenment views of Comte and Spencer (Turner,
2003), developed in the 19th century in the wake of the apparent success of natural
or physical sciences in advancing our understanding of the world (Benton & Craib,
2001).

80
The positivist belief is that the approach of natural sciences could be applied in the
social world. It assumes that the social world exists in the same way as the natural
world (Yates, 2004; Evans & King, 2006). Individual behaviour is influenced by
various pressures such as the norms and values held by the social groups to which
they belong. Positivists believe that the structures that create the apparent order in
social life can be discovered and investigated in the same objective way as the
natural world. Structures can create the apparent order in social life which can be
discovered by research. The approach is empirical in that it shows something exists
through observations, namely data. Some educational research uses this method;
however, for much social research it is not possible to create experimental control
groups and alter variables in a controlled way.
Positivists believe that reality should be stable and observed from an objective point
of view. Yin (2003) stated that the phenomenon should be isolated and there should
be a repetition of it. Reality is often manipulated (knowledge) with variations in the
selected variable (technology) in order to find out relationships between teaching and
learning. Table 3.1 below is a comprehensive display of the tenets of positivism
according to Yin (2003).
Table 3.1: Tenets of Positivism (Yin, 2003)
Tenet Meaning
Naturalism The principle of the natural sciences
should be used for social sciences.
Phenomenalism Only observable phenomena provide
valid information.
Nominalism Words of scientific value have fixed and
single meaning.
Facts and values
Facts are to be sought. Values have no
meaning for science.

81
In order to show relationships between variables, researchers frequently use the
comparative method. This is where groups are compared and differences are noted
(McNeill & Chapman, 2005). The purpose is to identify the significant variables which
can explain the differences between them. The main aim ultimately is to show the
cause and effect of relationships. This strategy is felt to be more reliable than the
greater numbers that are used in the comparison. In a positivist paradigm, size does
not matter. Also important is the sample’s representativeness of the whole
population. The findings take on greater significance when data is larger and can be
categorised and compared in a number of ways. The most effective positivist
research will be able to be replicated by others as experiments or at least compared
closely with other similar subjects. For these reasons the paradigm prefers
structured methods of data collection which can be carried out on a large scale. The
data favoured a quantitative approach, usually presented in statistical tables,
enabling others to see how the data have been interpreted and allowing for more
accurate comparisons. The aim is to be able to generate from findings.
3.2 Research Design
A research design is the conceptual structure within which research could be
conducted. It deals with logical problems through logical plans for getting from the
initial set of questions to be answered to the set of conclusion about questions.
3.2.1Survey and correlation study
A survey is well suited to descriptive studies (Muijs, 2004; Mare, 2010) and it allows
the researcher to look at relationships between variables which occur in real-life
contexts. McMillan and Schumacher (2001, p. 602) defined a survey as an
assessment of the present status, beliefs and attitudes by questionnaires or
interviews to a known population. Similarly, Slavin (2007) explained that the
objective of a survey is to record the opinions of a population of interest. It is a
survey study because it gathers data at a particular point in time with the intention of
describing the nature of the existing conditions, or identifying standards against
which existing conditions can be compared (Johnson, 1994). The study could
undergo theory-based evaluation because the evaluator constructs a model of how

82
the programme works using the stakeholders’ theory. Chen and Rossi (1992) view
theory–based evaluation as a way to mitigate problems encountered.
Creswell (2009) defined correlation research design as a design in which the
researcher is interested in the extent to which two or more variables co-vary, where
changes in one variable are reflected in the changes of the other. The two variables
are measured without manipulation to determine whether there exists a relationship.
A quantitative correlation design was an effective method for this study as it offered
non-obstructive approach, and resulted in identifying the relationships between the
study variables (Finlay, 1999; Creswell, 2009). In this study, the two main variables
that are being compared are ICT and Environmental Education. The use of
correlation design provided information that addressed the research questions and
objectives of the study.
As the study is investigating the impact of ICT in teaching Environmental Education
in rural high schools in the East London district of South Africa, with this kind of
evaluation more informed decisions can be taken, which will make a great
contribution to the use of ICT in teaching in rural high schools.
A survey is flexible because it allows the researcher to study a wide range of
research questions which include aspects such as describing a situation (Muijs,
2004). It also allows the researcher to study real-life situations and therefore
generalisations are made easier. Large quantities of data can also be collected at a
low cost when you compare to other research designs. It is extremely easy to
guarantee the participants anonymity, especially when anonymous questionnaires
are used as research instruments.
During the design phase, the researcher should begin to articulate the purpose(s) of
the survey, state specific objectives, consider the types of information needed, and
evaluate design options. Surveys can be used for a wide variety of purposes such
as:
• Many surveys have been conducted to examine the relationship of
participation in a variety of educational placements for a variety of
populations.

83
• Salisbury and McGregor (2002) used a survey to examine the
administrative climate in elementary schools with a policy of inclusion for
children with disability.
In a survey research design, the researcher has a choice between simple
descriptive, cross–sectional, and longitudinal approaches. The researcher will
therefore employ descriptive survey design which is cross–sectional in nature. A
descriptive survey is deemed more appropriate for the study because it basically
deals with obtaining data to determine specific characteristics of a group (Fraenkel &
Wallen, 2000). This study seeks to obtain information about the status of
implementation of ICT into the curriculum of Environmental Education in terms of
teachers’ attitudes, acquired content knowledge of ICT, as well as the availability of
ICT resources.
3.3 The Setting
The study took place in the Eastern Cape Province of South Africa. The Province
hosts many disadvantaged rural schools which are under resourced and lack ICT
resources. The Department of Basic Education, through the initiative of the Policies
of the White Paper, has introduced ICTs in schools for teachers to facilitate effective
teaching and learning. The onus, therefore, lies on educators to integrate technology
into teaching and learning processes so that it supports learners’ ICT use to meet
their information needs.
3.3.1 Population
Seaberg (1988, p. 240) defined population as the total set from which the individuals
or units of the study are chosen. According to Polit and Hungler (1999, p. 37),
population refers to an aggregate or totality of all the objects, subjects or members
that conform to a set of specifications. A study population is the totality of persons,
events, organisations, units or other sampling units which concern the research
problem (Mohlokoane, 2004, p. 8). In addition to this, Monyatsi (2002, p.176)
defined it as a population in research which is a discrete group of units of analysis
such as organisations or schools. This is why most schools are chosen as samples
for the study instead of educational institutions. From these perspectives, the target
population in this study refers to the 60 male and female educators who offer
Environmental Education in some selected rural high schools in the East London

84
district of the Eastern Cape Province. A research population is the total target group
who would be subjects of the study and about whom the researcher is trying to say
something (Punch, 2009).
Therefore the population for this study consists of all teachers in rural high schools
within the East London district, Eastern Cape,.
3.3.2 Sample and sampling techniques
According to Vockell and Asher (1995, p. 170), sampling refers to strategies that
enable the researcher to pick a subgroup as a basis for making inferences about the
larger group. Reasons for sampling are numerous, some of which are convenient to
work with, and working with a subgroup to generate data is also easy to work with. A
sample is a subset of the larger population selected by random probability methods.
Chikuya (2007, p. 91) also defined a sample as a unit that provides a practical,
efficient means to collect data since it serves as a model of the population of the
study. Sampling can be classified into probability and non-probability sampling
(Panneerselvam, 2008, p. 192). He further stated that in a quantitative study, the
main sampling strategy is the probability which depends on the selection of a
random sample. This research used simple random sampling, which is discussed
briefly. Sampling in quantitative research is the actual group of people in the study
from whom data is collected. The study therefore focuses on simple random
sampling and a total of 60 educators, both male and female, were selected at
random for this study.
3.3.2.Simple random sampling
Saunders et al. (2007, p. 206) stated that probability sampling is normally connected
with surveys. Mugenda and Mugenda (2003, p. 50) discussed that simple random
sampling is where the subjects in the population are given random numbers, then
they are made to sect by random. Generalisations about the population from the
data collected are based on statistical probability (Saunders et al., 2007, p. 210;
Panneerselvam, 2008, p. 192). In the current study, the probability samples are
those that had been selected from the target population. 60 educators, both male
and female, were selected to participate in the survey.

85
3.4 Data Collection Methods
3.4.1 Research instruments
This is a summary of the description of the instruments used for data collection. Gay
and Airasian (2000, p. 9) explained that the choice of research instruments depends
on the nature of the research questions. The instrument used in this study is the
questionnaire. Questionnaires allow each of the respondents to read and answer
identical questions which ensure consistency in the responses (Saunders et al.,
2007, p. 357). Furthermore, questionnaires generate standardised data, which
makes processing of responses easier.
Questionnaires were delivered personally to the teachers of Environmental
Education. This method was chosen to avoid a low response rate. Additionally, the
involvement of teachers in the study was voluntary. Randomisation was employed to
ensure that each school had an equal chance of being selected.
3.4.1.1 Questionnaire
A structured questionnaire with Modified Likert responses was used. These range
from Strongly Agreed (SA), with the highest numerical value of 4, to Strongly
Disagree (SD), with the lowest numerical value of 1 as below:
SA = 4
A = 3
D = 2
SD = 1
Questionnaires are the most convenient and inexpensive way of gathering
information from people and can cover a large geographic area. Quantitative
questionnaires are the best way to gather numerical data and can be confirmed by
hypotheses about occurrences. A questionnaire is a form of data collection in which
all the respondents are asked the same set of questions in a pre-set order (de Vaus,
2002).
The questionnaires for this study were based on Christensen and Knezek’s (2001)
instruments for assessing the impact of technology in education, but were
86
contextualised for some rural high schools in the East London district of the Eastern
Cape Province.
The questionnaire was arranged in the following format:
A – Availability of Resources
The questions focused on the availability of educational technology in some selected
rural high schools. Availability here does not imply abundant usage, but lack of them
will contribute to the effective usage of ICT tools.
B – Effective use of ICT in rural high schools to improve teaching EE
The questions focused on how the use of ICT tools made teaching effective, and
whether it enhanced learners’ participation and if educators were able to get tangible
feedback from them.
C – The usage of educational technology in the classroom
The questions are based on the extent to which educators are making effective use
of technology resources in their classrooms and for what purposes. They also asked
how ICT tools are used so that their importance could be realised.
D – Educators’ attitudes about the use of technological resources
These questions were based on educators’ understanding of preconceived ideas
about educational technology.
E – The efficient usage of ICT tools
The questions are based on the strategies that exist to enable teachers to learn how
to use ICT tools and whether the necessary professional help is offered. The
questions also focus on technological competence displayed by teachers, as
indicated by Zhao and Frank (2003), in using ICT tools in their content subject – in
this case Environmental Education.
3.5 Data Analysis
Data analysis is the process of developing understanding and making sense and
meaning from the data collected in the study (Merriam, 2009). In the analysis
process, data is made manageable by categorising them, interpreting it, determining
87
important information, and identifying recurring patterns that emerge (Marshall &
Rossman, 1999). Before the questionnaire was distributed, the respondents were
briefed on the nature of the study, expectations from them, and the responsibility of
the researcher.
In quantitative study, data can be analysed using computer software packages.
These computer software packages analyse numeric data which are pre-coded by
the researcher. The data was analysed using a statistical computer aided software
programme. Descriptive and inferential statistics were used. Descriptive statistics
summarises raw data in order for it to be visualised and enables the study to present
the data in a more meaningful way, which allows simpler interpretation of data. The
researcher found the central tendency of a variable, meaning the average score of a
participant on a given study measure. These are ways of describing the central
position of a frequency distribution for a group of data by using the mode, median
and mean. Analysis of data wwas also represented in tables because it is easy to
identify outliers. Cross tabulation may also be used to compare the relationships
between nominal variables such as computer skills and teaching.
To address this generalisation, a Chi-square test was used to measure the effect
between variables that are studied in the population. Chi–square refers to a statistics
method used to compare frequencies of two or more groups. Maree (2007, p. 246–
248) explained that Chi-square belongs to the type of non-parametric testing and
therefore is suitable in a study where the relationship between two variables is
investigated. In this study, Chi-square is used to examine the relationship between
the impacts of ICT in teaching environmental education.
3.5.1 Reliability
Any good researcher uses an instrument which is valid. Maree (2007) explained that
reliability may be assured by a researcher by using the same instruments at different
times. The questionnaire for this study was administered as a once- off cross-
sectional study influenced by factors such as cost, distance and time. Given the
limited scope of the survey, cost and time are not practical to apply in this study.
To ensure reliability of the questionnaire, it had to be pilot tested. Pilot testing is a
“trial run of the study done for the purpose of testing the instrument and coming up
with issues that have to be addressed before the actual study is conducted” (Slavin,

88
2007, p.107). Cronbach alpha was used to measure the reliability and internal
constituencies. It is commonly used when multiple Likert questions appear in a
survey.
The alpha option provides an effective tool for measuring Cronbach’s alpha which is
a numerical coefficient of reliability. Computation of alpha is based on the reliability
of a test relative with the same number of items, and measuring the same construct
of interest (Hatcher, 1994).
3.5.2 Validity
De Vos et al. (2002) and Maree (2007) proposed that an instrument can only be valid
if it measures what it is supposed to measure. For this study, validity has been
motivated by availing the instruments to an expert and supervisor opinion: Their
comments and advice helped the researcher to shape the items in the questionnaire
to collect data that increased its relevance, reliability and validity to answer the
research questions for this study.
3.6 Ethical Considerations
This section discussed the handling of ethical issues during and after the research.
There are many reasons why it is important to adhere to some norms in research.
These include promoting the objectives of the study, such as knowledge and truth,
and social values, such as mutual respect and human rights (Shamoo & Resnik,
2009). Ethics are considered to be dealing with beliefs about what is right and what
is wrong (McMillan & Schumacher, 2009).
The involvement of human subjects in research requires that ethical issues are
observed. On observing ethics, Slavin (2007) proposed that it is important for the
researcher to avoid public concern over potential abuses of participants and data by
the researcher. This study and ethical considerations helped the researcher to be
honest throughout the process and trust the educators. The researcher’s
understanding of ethical considerations is that it protects both the researcher and the
participants.
In this study, educators were informed about their voluntary participation and their
right to withdraw from the study at any time without any penalty. Teachers were
asked not to write their names, initials or apply any signature which may lead to

89
personal identity. Teachers were informed that the findings would be presented
anonymously without making their identities known. The participants were fully
informed about the procedures and risks involved in the study.
Information as received from participants was treated with absolute confidentiality
and will be kept as such at all times (Denzin & Lincoln, 2000; Shamoo & Resnik,
2009). Participants were assured that the responses they provided were to be stored
securely for a specific number of years, after which electronic records would be
deleted.
The research was applicable in public schools and as such, it was necessary to
obtain the approval of the Department of Basic Education. The study also adhered to
the prescripts of the University of Fort Hare ethical clearance policy.
3.7 Summary
In this chapter, quantitative research adopting a non-experimental study as a
research design was discussed. The research design was discussed. The research
design was a survey, which is suitable when a researcher explores phenomena in a
more natural environment. Research design is influenced by the research questions
that need to be answered.
In the process of developing an instrument for the data collection, the issues of
reliability and validity are very important. Ethical issues such as informed consent,
voluntary participation, right to withdraw, anonymity, and the right to refrain from
answering any question(s) were accounted for, while permission to carry out the
research was obtained from relevant authorities and institutions.
The next chapter is a representation and comprehensive analysis of data from the
questionnaires.

90
CHAPTER FOUR
DATA PRESENTATION AND ANALYSIS
4.0 Introduction
The previous chapter reported on the methodology of the study, the paradigm that
shaped the research, the population and sampling procedures, as well as the
selection of a sample. The chapter also included a discussion of the approach of the
research as well as a discussion and justification of the quantitative methodology as
a choice for data collection. This chapter discusses and analyses the data by means
of the questionnaire. The questionnaire was structured in sections namely:
knowledge, attitudes and effective use of ICT resources provided by the school, and
the integration of ICT in the teaching for understanding, skill building and quality
teaching and learning of Environmental Education. The data was obtained through
the responses from the questionnaire.
The use of computers in the rural high schools uner study is not different from any
other developing countries. Earlier researches of computer usage in developing
countries have revealed that these countries have more challenges in their ICT
integration than the developed countries (Herselman, 2003; Cox, Webb, Abbot,
Blakely, & Rhode, 2003).
The analysis was conducted through looking at educators’ effective use of ICT in
rural high schools to improve teaching Environmental Education, the availability of
ICT resources, teachers’ attitudes towards the use of ICT resources, and how
efficiently educators make use of ICT tools. Tables, figures and description of data
through t- tests were used to present the findings. Occasionally inferential statistics
was used. The chapter begins with a brief presentation of the characteristics of the
educators who participated in the study.
4.1 Background Information of Educators/ Teachers
Three different rural high schools were visited around the East London district . A
total of 52 educators participated in the study. Thus, 86.76% participation of
educators was obtained. All educators were Black, but not from the same ethnic

91
group. Participants’ approach towards the integration of ICT was determined by their
socio-demographic characteristics. The data revealed that most of the educators
were born before ICT resources were introduced to enhance the education process.
Therefore, they found it problematic to depart from the traditional method of
teaching. Most of the educators that participated in the study do not have computers
at home; they depend on the computers that the schools have. The data also
revealed that educators’ academic status gives a good reflection of how these
factors impact on their attitude to using ICT in teaching.
A total of 52 participants returned the questionnaire distributed to the 60 targeted
participants as stated in Chapter Three. These comprise of educators both male and
female who offer subjects which have a component of Environmental Education in
their curriculum. The respondents acknowledged the role the “blackboard” plays
towards teaching and learning; however, the design of its services does not actively
motivate learners in the acquisition of knowledge that reflects their comprehension
of the content of Environmental Education.
The following research questions were used to collect the data:
i. How can ICT be used effectively in the selected rural high schools to
improve the teaching of EE?
ii. What ICT facilities are available for teaching EE?
iii. What are the attitudes of teachers towards the use of ICT tools in teaching
EE?
iv. Do teachers use ICT tools efficienly in teaching EE?
4.1.1 Response rate educators/ teachers
The response rate for the survey was 86.67%. This figure was arrived at by
comparing the number of respondents who provided feedback during the survey. In
order to continue with the analysis and interpretation of data, the response rate
should be above 50% (Babbie & Mouton, 2010). This is done in order to ensure
validity and reliability of the data. If the response rate is below 50%, the results will
not be trusted to give a true reflection of the outcomes of the subject being
investigated. For the purpose of this study, the response rate was satisfactory to

92
allow data analysis and interpretation to make conclusions. Table 4.1 presents the
response rate.
Table 4.1: Response rate of educators/ teachers
No. of questionnaires sent out No. of questionnaires
returned
Response rate
(%)
60 52 86.67 %
Response Rate 86.67 %
Table 4.1 above presents the response rate as 86.67%. The response rate was
calculated as the total of questionnaires completed and returned as a percentage of
the total number of the questionnaires issued.
4.1.2 The normality of the data
Coakes (2005, p. 35) asserted that every research should ensure that the data is
normally distributed before conducting a statistical analysis. Furthermore, Coakes
(2005, p.35) suggested that the Shapiro-Wilk test be done to define the normality of
the data for a sample size less than 100 respondents. On the other hand, Coakes
(2005, p.35) argued that the Kolmogorov-Smirnov test (KMO) test is applicable for
sample size greater than 100 respondents. For the purpose of this research, the
sample size was 60. As a result, the Shapiro-Wilk test was used to test normality of
data. “The normality of data is assumed when the significance level is greater than
0.05” (Coakes, 2005, p. 35). The significance of the Shapiro-Wilk test for this data
was greater than 0.05, suggesting that the data assumed normality.
4.1.3 Demographic profiles of respondents
Part A of the questionnaire was meant to establish the distribution of demographic
information in terms of gender, level of education, and work experience. The purpose
of this section was to establish variations in respondents’ perceptions of ICT
variables against the three demographic variables.
4.1.4 The gender of respondents
Table 4.2 provide a distribution of respondents by gender. The purpose of the
question was to establish the proportion of each gender group that participated in the
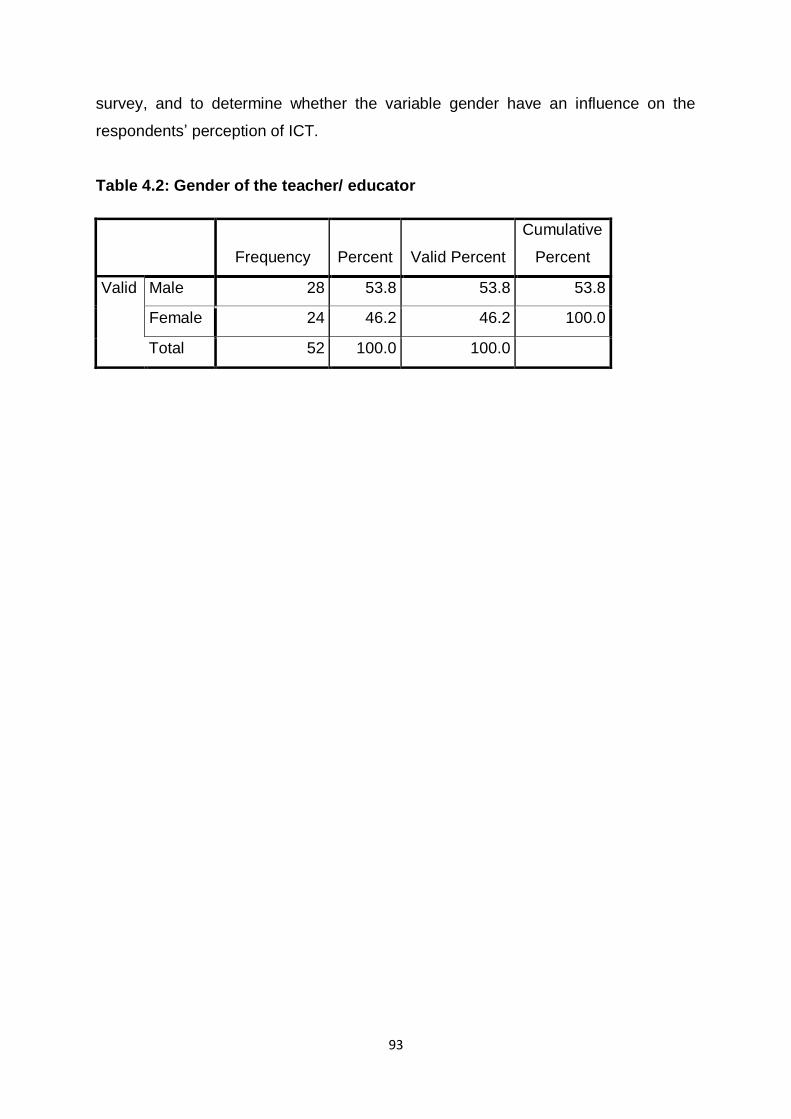
93
survey, and to determine whether the variable gender have an influence on the
respondents’ perception of ICT.
Table 4.2: Gender of the teacher/ educator
Frequency Percent Valid Percent
Cumulative
Percent
Valid Male 28 53.8 53.8 53.8
Female 24 46.2 46.2 100.0
Total 52 100.0 100.0

94
Figure 4.1 below presents a visual display of the distribution of respondents by
gender.
Figure 4.1: Gender of the teacher
The respondents profile suggests that gender was almost evenly distributed with
54% males dominating the respondents’ profile and 46% female respondents of the
group.
4.1.5 Qualification of the teacher
This section sought to establish whether the level of education of the teacher has a
significant impact on their views about ICT. As a result the question will assist the
researcher to make judgement on the variation of respondents in terms of the
patterns of their responses against their levels of education. Table 4.3 presents the
classification of respondents in terms of the level of education.

95
Table 4.3: Qualification of the teacher
Frequency Percent
Valid
Percent
Cumulative
Percent
Valid Honours 13 25.0 25.0 25.0
Bachelor's degree 26 50.0 50.0 75.0
Post Matric diploma 13 25.0 25.0 100.0
Total 52 100.0 100.0
The distribution reveals that majority of respondents have a bachelor’s degree as
their highest qualification (50%). None of the respondents went as far as master’s
degree level. 25% of respondents went as far as honours and the remaining 25%
hold a post-matric diploma. Figure 4.2 below presents a visual distribution of
respondents by their level of education.
Figure 4.2: Qualification of the teacher
The background information regarding the respondents’ level of education was
meant to establish whether the respondents have the potential to understand ICT as
a concept. Furthermore, it sought to establish their propensity to understand the
importance of integrating ICT in Environmental Education.

96
4.1.6 Work experience of the teacher
Work experience determines the level at which an individual understands the field of
teaching. The purpose of this question was to establish the variation of teachers’
responses against the time they spent in the teaching field. The level of experience
also influences the teacher’s propensity to adopt new technologies or resist the
adoption of new technologies. Table 4.4 below shows the distribution of respondents
by work experience.
Table 4.4: Work experience of the teacher
Frequency Percent
Valid
Percent
Cumulative
Percent
Valid 6 months to 2
years 3 5.8 6.0 6.0
2 years to 5 years 9 17.3 18.0 24.0
5 years to 10 years 14 26.9 28.0 52.0
more than 10 years 24 46.2 48.0 100.0
Total 50 96.2 100.0
Missing 99 2 3.8
Total 52 100.0

97
Figure 4.3 below presents a visual distribution of respondents in terms of the level of
teaching experience.
Figure 4.3: Work experience of the teacher
Table 4.4 above reveals that majority of respondents (48%) have more than ten
years’ experience in the teaching field. Only 1% of respondents are new to the
teaching field. About 46% of respondents have two to five years teaching
experience.
4.2 Descriptive Statistics on the Adoption and Integration of ICT in Teaching
Environmental Education in Rural High Schools
Table 4.5 presents the output from the analysis of descriptive statistics for all the
factors that determine the adoption and integration of ICT tools in teaching
Environmental Education in rural schools. The mean and the standard deviation are
the major determinants of the importance of these factors. The “max” indicates the
highest scale and “min” represents the lowest scale selected with regard to that
particular factor. The ranking of the factors that influence the adoption of ICT in
teaching EE are presented in Table 4.5 below in order of importance.

98
Table 4.5: Descriptive statistics
N Min Max Mean Std.
Dev
ICT can improve the teaching of EE 52 3 4 3.94 .235
ICT offers opportunities to educators to obtain
resources for EE improvement
52 3 4 3.92 .269
ICT plays a transformative role in teaching EE 52 3 4 3.92 .269
ICT enhances students’ participation &
feedback to educators
52 3 4 3.88 .323
It is very important to work with ICT tools to
teach EE
51 2 4 3.67 .622
Lack of autonomy to evaluate and use ICT in
teaching EE
51 1 4 3.10 1.005
Teachers enthusiastically engage in ICT
projects in teaching EE
51 1 4 2.78 .879
Readiness and confidence in using ICT tools in
teaching
51 1 4 2.73 .918
Strategist exist to help teachers learn how to
use ICT in teaching EE
52 1 4 2.62 1.013
Teachers are provided with training &
professional development regarding using ICT
52 1 4 2.42 .723
My school has been equipped with computers
& connected to the Internet
52 1 4 2.31 .875
My school has been able to acquire suitable
software and hardware
52 1 4 2.23 .783
ICT tools are properly equipped in practice and
study rooms to teach EE
52 1 4 2.00 .767
Adequate preparation for the effective usage of
ICT tools in teaching EE
52 1 4 1.98 .852
Majority of educators have ICT equipment for
use in their classrooms
52 1 4 1.85 .638
My school has proper procedure for
communicating to students online
52 1 4 1.38 .661
Valid N (listwise) 51
The most important factor, “ICT can improve the teaching of EE”, has the highest
mean score (3.94) and the lowest standard deviation (0.235). The least important
factor, “My school has proper procedures for communicating to students online”, has
the lowest mean score (1.38) and significantly higher standard deviation (0.661).

99
4.2.1 T-Test
An “independent sample t-test” was run to establish if there were differences in
perception of males and females with regard to the influence of ICT in improving
teaching of Environmental Education. The data revealed that there were no outliers
as the engagement of scores for individual levels of gender were normally
distributed. This is shown by the Shapiro-Wilk test (p>.05). The Shapiro-Wilk test
was done to define the “normality of the data” (all variables are equally represented)
for a sample size less than 100 respondents. “The normality of data is assumed
when the significance level is greater than 0.05” (Coakes, 2005, p.35).
Research Question 1: How can ICT be used effectively in the selected rural high
schools to improve the teaching of EE?
4.2.1.1 T-test on effective use of ICT to improve the teaching EE
Table 4.6 below contains the group statistics showing the means and standard
deviations and the difference between male and female respondents’ perception of
the importance of the use of ICT in improving teaching Environmental Education.

100
Table 4.6: Group Statistics on how ICT improves teaching EE
Gender of the
teacher N Mean
Std.
Deviati
on
Std.
Error
Mean
ICT can improve the
teaching of EE
Male 28 3.96 .189 .036
Female 24 3.92 .282 .058
ICT plays a transformative
role in teaching EE
Male 28 3.96 .189 .036
Female 24 3.88 .338 .069
ICT enhances students’
participation & feedback to
educators
Male 28 3.93 .262 .050
Female 24 3.83 .381 .078
ICT offers opportunities to
educators to obtain
resources for EE
improvement
Male 28 3.93 .262 .050
Female 24 3.92 .282 .058
Table 4.6 above indicates that the use of ICT was more common to male
respondents as indicated by the high mean scores and low standard deviations
(m=3.96, SD=0.189) against females (m=3.92, SD=0.282). Although female
respondents recorded lower mean score than male respondents, their mean score is
above average, revealing that the respondents agree about the effective use of ICT
to improve teaching EE. Table 4.7 below shows the independent sample t-test
statistics on whether ICT improves teaching EE. The purpose of the t-test is to
determine whether the differences will affect the effective use of ICT to improve
teaching EE.

101
Table 4.7: T-test Independent Samples Test on how ICT improves teaching EE
Levene's
Test for
Equality of
Variances t-test for Equality of Means
F Sig. T df
Sig.
(2-
taile
d)
Mean
Differ
ence
ICT can improve
the teaching of EE
Equal
variances
assumed
2.161 .148 .724 50 .473 .048
Equal
variances
not assumed
.702 39.141 .487 .048
ICT plays a
transformative role
in teaching EE
Equal
variances
assumed
6.288 .015 1.19
8
50 .237 .089
Equal
variances
not assumed
1.15
0
34.857 .258 .089
ICT enhances
students’
participation &
feedback to
educators
Equal
variances
assumed
4.782 .033 1.06
3
50 .293 .095
Equal
variances
not assumed
1.03
3
39.895 .308 .095
ICT offers
opportunities to
educators to obtain
resources for EE
improvement
Equal
variances
assumed
.099 .754 .158 50 .875 .012
Equal
variances
not assumed
.157 47.480 .876 .012

102
Homogeneity of variances was not assumed as revealed by Leven`s test for equality
of variances (p=.015) for ICT enhances students’ participation and feedback to
educators and (p=.033) for ICT plays a transformative role in teaching EE. Therefore,
a two-tailed significance test was used. Although there were differences in the mean
score of males and females regarding their perceptions of the importance of the use
of ICT in improving teaching EE, the difference is not statistically significant because
the value "Sig. (2-tailed)" is greater than 0.05. Table 4.7 revealed that "Sig. (2-tailed)"
= 0.473 - 0.875 respectively.
The results of this analysis revealed that there is no statistically significant difference
in the perceptions between male and female respondents regarding their view of
whether effective use of ICT improves teaching EE. Therefore, effective use of ICT
improves teaching EE. The results are consistent to conclusions by Chowdhury
(2009) and Owusu-Ansah (2013). Their studies revealed that use of ICT improves
education and male and females have the same view of the importance of ICT on
education.
Research Question 2: What ICT facilities are available for teaching EE?
4.2.1.2 T-test on availability of ICT facilities for teaching EE
This question was meant to establish whether the perceptions of the teachers
regarding the use of ICT are influenced by the availability of ICT facilities at their
respective workplaces. The group statistics in Table 4.8 below shows the means
and standard deviations and the difference between male and female respondents’
confessions about the availability of ICT resources in teaching Environmental
Education.

103
Table 4.8: T-test: Group Statistics availability of ICT resources
Gender of the
teacher N Mean
Std.
Deviation
Std.
Error
Mean
My school has been able to
acquire suitable software
and hardware
Male 28 2.32 .819 .155
Female 24 2.13 .741 .151
My school has been
equipped with computers
&connected to the Internet
Male 28 2.61 .786 .149
Female 24 1.96 .859 .175
ICT tools are properly
equipped in practice and
study rooms to teach EE
Male 28 1.75 .518 .098
Female 24 2.29 .908 .185
My school has proper
procedure for
communicating to students
online
Male 28 1.25 .441 .083
Female 24 1.54 .833 .170
Table 4.8 above indicates that the majority of men acknowledge that their schools
acquire suitable software and hardware and advance the connection to the Internet
to enhance teaching of EE. This is shown by a higher mean score and lower
standard deviations as compared to females. On the other hand, female respondents
acknowledge that ICT tools are properly equipped in practice and study rooms and
there are proper procedures to communicate with students online. This is revealed
by the higher mean scores respectively. Table 4.9 below is the independent sample
t-test statistics on whether there is a difference between male and female
respondents with regard to their position about the availability of ICT resources and
tools for teaching EE.

104
Table 4.9: T-test: Independent Samples Test availability of ICT resources
Levene's Test
for Equality of
Variances
t-test for Equality of
Means
F Sig. t df
Sig.
(2-
tailed)
My school has been
able to acquire
suitable software and
hardware
Equal
variances
assumed
2.021 .161 .901 50 .372
Equal
variances not
assumed
.908 49.8
37
.368
My school has been
equipped with
computers &
connected to the
Internet
Equal
variances
assumed
.341 .562 2.84
4
50 .006
Equal
variances not
assumed
2.82
4
47.1
72
.007
ICT tools are properly
equipped in practice
and study rooms to
teach EE
Equal
variances
assumed
6.519 .014 -
2.69
0
50 .010
Equal
variances not
assumed
-
2.58
4
35.2
94
.014
My school has proper
procedure for
communicating to
students online
Equal
variances
assumed
9.407 .003 -
1.61
0
50 .114
Equal
variances not
assumed
-
1.54
0
33.7
19
.133

105
Homogeneity of variances was not assumed as revealed by Leven`s test for equality
of variances (p=.014) for the variable “ICT tools are properly equipped in practice
and study rooms to teach EE”, and (p=.003) for “My school has proper procedure for
communicating to students online”. In addition, a two-tailed significance test was
used. The analysis of the two-tailed test also revealed that there were differences in
the mean score of males and females regarding their position on the availability of
ICT resources in teaching EE; the difference is statistically significant at "Sig. (2-
tailed)" is less than 0.05. That is "Sig. (2-tailed)" = 0.006 for “ICT tools are properly
equipped in practice and study rooms to teach EE” and "Sig. (2-tailed)" = 0.010 for
the variable “My school has been equipped with computers & connected to the
Internet”.
Although both males and females acknowledge the availability of ICT resources for
teaching EE, the results of this analysis reveal that there is a significant difference in
the perceptions between male and female respondents regarding their position about
the availability of ICT resources for teaching EE. This conclusion is consistent with
studies by Tella ( 2011) which concluded that availability of resources varies from
school to school, departments and areas of education.
Research Question 3: What are the attitudes of teachers towards the use of ICT
tools in teaching EE?
4.2.1.3 T-test on attitudes of teachers towards use of ICT tools for teaching EE
This question was meant to establish the level of preparedness of teachers
regarding the use of ICT tools and to identify if there is a difference in the attitude of
male and female teachers in the use of ICT tools. The group statistics in Table 4.10
below shows the means and standard deviations and the difference between male
and female respondents’ attitudes towards the use of ICT tools to teach EE.

106
Table 4.10: T-test: Group Statistics attitudes towards use of ICT tools
Gender of the
teacher N Mean
Std.
Deviation
Std.
Error
Mean
Readiness and confidence
in using ICT tools in
teaching
Male 28 2.89 .629 .119
Female 23 2.52 1.163 .242
Teachers enthusiastically
engage in ICT projects in
teaching EE
Male 28 3.07 .604 .114
Female 23 2.43 1.037 .216
Lack of autonomy to
evaluate and use ICT in
teaching EE
Male 28 3.43 .790 .149
Female 23 2.70 1.105 .230
It is very important to work
with ICT tools to teach EE
Male 28 3.79 .499 .094
Female 23 3.52 .730 .152
Figure 4.10 above indicates that the use of ICT was more common to male
respondents as indicated by the high mean scores and low standard deviations
(m=2.89, SD=0.629). Although female respondents recorded a lower mean score
than male respondents, their mean score is above average, revealing that the
respondents agree that attitudes of teachers have a bearing on the use of ICT tools
for teaching EE. Table 4.11 below is the independent sample t-test statistics of the
difference in attitude of male teachers and female teachers on the use of the ICT
tools in teaching EE.

107
Table 4.11: T-test: Independent Samples Test attitudes towards use of ICT
tools
Levene's Test
for Equality of
Variances
t-test for Equality of
Means
F Sig. t df
Sig.
(2-
tailed)
Readiness and
confidence in using
ICT tools in teaching
Equal
variances
assumed
18.777 .000 1.452 49 .153
Equal
variances not
assumed
1.375 32.324 .179
Teachers
enthusiastically
engage in ICT
projects in teaching
EE
Equal
variances
assumed
14.908 .000 2.736 49 .069
Equal
variances not
assumed
2.604 33.840 .074
Lack of autonomy to
evaluate and use ICT
in teaching EE
Equal
variances
assumed
4.426 .041 2.757 49 .058
Equal
variances not
assumed
2.669 38.783 .061
It is very important to
work with ICT tools to
teach EE
Equal
variances
assumed
7.576 .008 1.529 49 .133
Equal
variances not
assumed
1.474 37.581 .149
108
Homogeneity of variances was not assumed as revealed by Leven`s test for equality
of variances on all tested variables because of the “sig <0.05”. As a result, a two-
tailed significance test was used to ascertain whether the differences between the
attitudes of male and female teachers were statistically significant. Although there
were differences in the mean score of males and females regarding their attitude
towards the use of ICT in improving teaching EE, the difference is not statistically
significant because the value "Sig. (2-tailed)" is greater than 0.05. Table 4.11 reveals
that "Sig. (2-tailed)" = 0.153 - 0.133 respectively.
The results of this analysis revealed that there is no significant difference between
male and female teachers’ attitudes regarding the use of ICT tools in teaching EE.
Thus respondents agree that attitudes of teachers have a bearing towards the use of
ICT tools for teaching EE. These results are also consistent with that of Daraja–
Mbili’s (2013) findings which posit that a positive attitude towards the use of ICT
helps in the implementation of the biology curriculum. Therefore, the results enable
the researcher to test the attitudes of male and female teachers in the use of ICT
tools in teaching.
Research Question 4: Do teachers use ICT tools efficiently in teaching EE?
4.2.1.4 T-test on support for efficient usage of ICT tools for teaching EE
This question was meant to establish whether schools provide support mechanisms
to enhance efficient use of ICT tools and to identify whether male and female
teachers are exposed to different teaching environments regarding the use of ICT
tools in teaching EE. The group statistics in Table 4.12 below shows the means and
standard deviations and the difference between male and female respondents ’
confessions about the availability of support mechanisms to enhance the usage of
ICT tools in teaching EE.
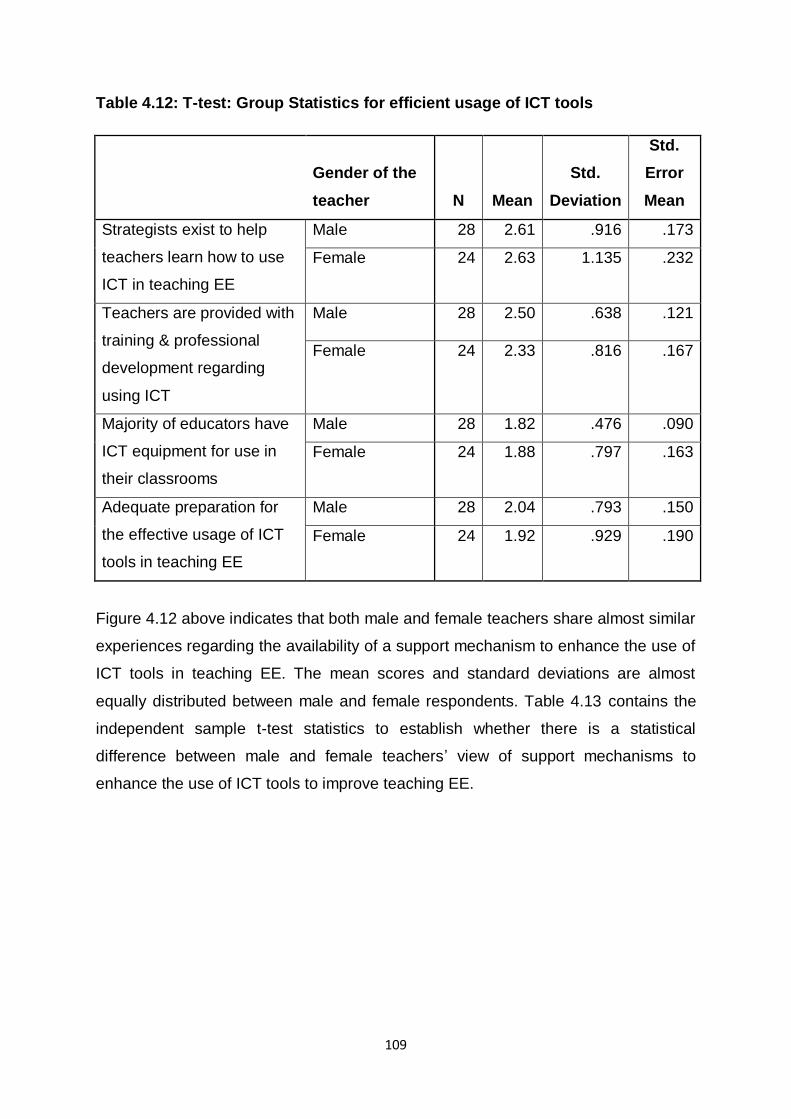
109
Table 4.12: T-test: Group Statistics for efficient usage of ICT tools
Gender of the
teacher N Mean
Std.
Deviation
Std.
Error
Mean
Strategists exist to help
teachers learn how to use
ICT in teaching EE
Male 28 2.61 .916 .173
Female 24 2.63 1.135 .232
Teachers are provided with
training & professional
development regarding
using ICT
Male 28 2.50 .638 .121
Female 24 2.33 .816 .167
Majority of educators have
ICT equipment for use in
their classrooms
Male 28 1.82 .476 .090
Female 24 1.88 .797 .163
Adequate preparation for
the effective usage of ICT
tools in teaching EE
Male 28 2.04 .793 .150
Female 24 1.92 .929 .190
Figure 4.12 above indicates that both male and female teachers share almost similar
experiences regarding the availability of a support mechanism to enhance the use of
ICT tools in teaching EE. The mean scores and standard deviations are almost
equally distributed between male and female respondents. Table 4.13 contains the
independent sample t-test statistics to establish whether there is a statistical
difference between male and female teachers’ view of support mechanisms to
enhance the use of ICT tools to improve teaching EE.

110
Table 4.13: T-test: Independent Samples Test for efficient usage of ICT tools
Levene's Test
for Equality of
Variances
t-test for Equality of
Means
F Sig. t df
Sig.
(2-
tailed)
Strategists exist to
help teachers learn
how to use ICT in
teaching EE
Equal
variances
assumed
2.440 .125 -.063 50 .950
Equal
variances not
assumed
-.062 44.148 .951
Teachers are
provided with training
& professional
development
regarding using ICT
Equal
variances
assumed
.898 .348 .826 50 .413
Equal
variances not
assumed
.810 43.288 .422
Majority of educators
have ICT equipment
for use in their
classrooms
Equal
variances
assumed
1.472 .231 -.299 50 .766
Equal
variances not
assumed
-.288 36.290 .775
Adequate preparation
for the effective
usage of ICT tools in
teaching EE
Equal
variances
assumed
.468 .497 .499 50 .620
Equal
variances not
assumed
.493 45.561 .625

111
Homogeneity of variances was assumed on all variables as revealed by Leven`s test
for equality of variances (p>0.05). In addition, a two-tailed significance test was used
to verify the nonexistence of differences of male and female teachers statistically.
The two-tailed test also revealed that there was no significant difference between the
respondents’ position about the existence of a support mechanism to enhance the
use of ICT tools in teaching EE. Table 4.13 reveal that "Sig. (2-tailed)" was greater
than 0.05 on all occasions ("Sig. (2-tailed)" = 0.950 - 0.620) respectively.
The results of this analysis reveal that there is no significant difference on the
position of male and female respondents regarding their view of the existence of a
support mechanism to enahnce use of ICT tools to improve teaching EE. The results
are consistent with the findings of the study by Tella ( 2011) which found that the
support mechanism and attitude of teachers improve the adoption and use of ICT.
4.3 Analysis of Variance (ANOVA)
Analysis of variance (ANOVA) was done in order to make comparisons of the
differences within groups of demographic variables (academic level and work
experience) with regard to factor variables (effective use of ICT, availability of ICT
tool, attitude of teachers towards ICT, and availability of a support mechanism to use
of ICT tools efficiently). When interpreting the statistical results, there might be
differences between group work experience or academic level, which might affect
the way the researcher concluded the results. The differences may be statistically
significant, with respect to the use of ICT to improve teaching EE variables, if the
factor has a p-value of (p<0.05). The F statistics state the strength of the effect of the
demographic variable has on the factor variables.
4.3.1 Analysis of variance (ANOVA) educational level
The purpose of ANOVA for education level was meant to establish the similarities
and differences within the group level of education regarding the perception of
respondents regarding the use of ICT in teaching EE.
4.3.2 Descriptive ANOVA: Education Level and Effective use of ICT
The tables below provide important descriptions of the meanand standard deviation
of a 95% confidence interval for the variable (efficient use of ICT, availability of ICT
resources, attitude of teachers, and availability of support for efficient use of ICT

112
tools) in teaching EE for each separate group (Honours, Bachelor's degree, and Post
Matric diploma). Table 4.14 below shows the descriptive statistics for effective use of
ICT in teaching EE and educational level.

113
Table 4.14: Descriptive ANOVA: Education Level and Effective use of ICT
N
Mea
n
St
d.
De
v
Std.
Err
or
95% Confidence
Interval for Mean M
i
n
M
a
x
Lower
Bound
Upper
Bound
ICT can
improve the
teaching of EE
Honours 13 4.00 .00
0
.000 4.00 4.00 4 4
Bachelor'
s degree
26 3.96 .19
6
.038 3.88 4.04 3 4
Post
Matric
diploma
13 3.85 .37
6
.104 3.62 4.07 3 4
Total 52 3.94 .23
5
.033 3.88 4.01 3 4
ICT plays a
transformative
role in teaching
EE
Honours 13 3.92 .27
7
.077 3.76 4.09 3 4
Bachelor'
s degree
26 3.96 .19
6
.038 3.88 4.04 3 4
Post
Matric
diploma
13 3.85 .37
6
.104 3.62 4.07 3 4
Total 52 3.92 .26
9
.037 3.85 4.00 3 4
ICT enhances
students’
participation &
feedback to
educators
Honours 13 3.92 .27
7
.077 3.76 4.09 3 4
Bachelor'
s degree
26 3.88 .32
6
.064 3.75 4.02 3 4
Post
Matric
diploma
13 3.85 .37
6
.104 3.62 4.07 3 4
Total 52 3.88 .32
3
.045 3.79 3.97 3 4
ICT offers
opportunities to
educators to
obtain
resources for
EE
improvement
Honours 13 4.00 .00
0
.000 4.00 4.00 4 4
Bachelor'
s degree
26 3.92 .27
2
.053 3.81 4.03 3 4
Post
Matric
diploma
13 3.85 .37
6
.104 3.62 4.07 3 4
Total 52 3.92 .26
9
.037 3.85 4.00 3 4

114
Table 4.14 above shows that as the level of education increases, so do perceptions
of effective use of ICT. Therefore, education does influence teachers’ attitude
towards adoption and effective use of ICT.
4.3.3 Descriptive ANOVA: Education Level and Availability of resources
The table provides an important description of the mean, standard deviation a 95%
confidence interval for the variable (Availability of ICT resources in teaching EE) for
each separate group (Honours, Bachelor's degree, and Post Matric diploma).

115
Table 4.15: Descriptive ANOVA: Education Level and Availability of resources
N Mean
Std.
Dev
Std.
Error
95%
Confidence
Interval for
Mean
Min Max Lower
Bound
Upper
Bound
My school has
been able to
acquire suitable
software and
hardware
Honours 13 2.08 .641 .178 1.69 2.46 1 3
Bachelor's
degree
26 2.42 .758 .149 2.12 2.73 1 4
Post Matric
diploma
13 2.00 .913 .253 1.45 2.55 1 4
Total 52 2.23 .783 .109 2.01 2.45 1 4
My school has
been equipped
with computers
& connected to
the Internet
Honours 13 2.54 .877 .243 2.01 3.07 1 4
Bachelor's
degree
26 2.23 .863 .169 1.88 2.58 1 4
Post Matric
diploma
13 2.23 .927 .257 1.67 2.79 1 3
Total 52 2.31 .875 .121 2.06 2.55 1 4
ICT tools are
properly
equipped in
practice and
study rooms to
teach EE
Honours 13 2.15 .689 .191 1.74 2.57 1 4
Bachelor's
degree
26 1.92 .796 .156 1.60 2.24 1 4
Post Matric
diploma
13 2.00 .816 .226 1.51 2.49 1 3
Total 52 2.00 .767 .106 1.79 2.21 1 4
My school has
proper
procedure for
communicating
to students
online
Honours 13 1.38 .506 .140 1.08 1.69 1 2
Bachelor's
degree
26 1.35 .689 .135 1.07 1.62 1 4
Post Matric
diploma
13 1.46 .776 .215 .99 1.93 1 3
Total 52 1.38 .661 .092 1.20 1.57 1 4

116
4.3.4 Descriptive ANOVA: Education Level and Attitude of Teachers
The table provides an important description of the mean and standard deviation of a
95% confidence interval for the variable “Attitude of Teachers about the use of ICT in
teaching EE” for each separate group (Honours, Bachelor's degree, and Post Matric
diploma).
Table 4.16: Descriptive ANOVA: Education Level and Attitude of Teachers
N Mean
Std.
Dev
Std.
Error
95%
Confidence
Interval for
Mean
Min Max
Lower
Bound
Upper
Bound
Readiness and
confidence in
using ICT tools
in teaching
Honours 13 2.62 .961 .266 2.03 3.20 1 4
Bachelor's
degree
26 2.73 .919 .180 2.36 3.10 1 4
Post Matric
diploma
12 2.83 .937 .271 2.24 3.43 1 4
Total 51 2.73 .918 .129 2.47 2.98 1 4
Teachers
enthusiastically
engage in ICT
projects in
teaching EE
Honours 13 2.69 1.032 .286 2.07 3.32 1 4
Bachelor's
degree
26 2.81 .895 .176 2.45 3.17 1 4
Post Matric
diploma
12 2.83 .718 .207 2.38 3.29 1 4
Total 51 2.78 .879 .123 2.54 3.03 1 4
Lack of
autonomy to
evaluate and
use ICT in
teaching EE
Honours 13 2.69 1.109 .308 2.02 3.36 1 4
Bachelor's
degree
26 3.35 .846 .166 3.00 3.69 2 4
Post Matric
diploma
12 3.00 1.128 .326 2.28 3.72 1 4
Total 51 3.10 1.005 .141 2.82 3.38 1 4
It is very
important to
work with ICT
tools to teach
EE
Honours 13 3.62 .650 .180 3.22 4.01 2 4
Bachelor's
degree
26 3.69 .618 .121 3.44 3.94 2 4
Post Matric
diploma
12 3.67 .651 .188 3.25 4.08 2 4
Total 51 3.67 .622 .087 3.49 3.84 2 4

117
4.3.5 Descriptive ANOVA: Education level and efficient usage of ICT
The table provides an important description of the mean, standard deviation of a
95% confidence interval for the variable “Availability of ICT support mechanisms for
efficient use of ICT in teaching EE” for each separate group (Honours, Bachelor's
degree, and Post Matric diploma).

118
Table 4.17: Descriptive ANOVA: Education level and efficient usage of ICT
N Mean
Std.
Dev
Std.
Error
95%
Confidence
Interval for
Mean
Min Max Lower
Bound
Upper
Bound
Strategists exist
to help teachers
learn how to
use ICT in
teaching EE
Honours 13 2.85 1.068 .296 2.20 3.49 1 4
Bachelor's
degree
26 2.65 1.018 .200 2.24 3.06 1 4
Post
Matric
diploma
13 2.31 .947 .263 1.74 2.88 1 4
Total 52 2.62 1.013 .140 2.33 2.90 1 4
Teachers are
provided with
training &
professional
development
regarding using
ICT
Honours 13 2.62 .961 .266 2.03 3.20 1 4
Bachelor's
degree
26 2.35 .689 .135 2.07 2.62 1 4
Post
Matric
diploma
13 2.38 .506 .140 2.08 2.69 2 3
Total 52 2.42 .723 .100 2.22 2.62 1 4
Majority of
educators have
ICT equipment
for use in their
classrooms
Honours 13 1.77 .832 .231 1.27 2.27 1 4
Bachelor's
degree
26 1.88 .653 .128 1.62 2.15 1 4
Post
Matric
diploma
13 1.85 .376 .104 1.62 2.07 1 2
Total 52 1.85 .638 .088 1.67 2.02 1 4
Adequate
preparation for
the effective
usage of ICT
tools in
teaching EE
Honours 13 2.15 .987 .274 1.56 2.75 1 4
Bachelor's
degree
26 2.00 .938 .184 1.62 2.38 1 4
Post
Matric
diploma
13 1.77 .439 .122 1.50 2.03 1 2
Total 52 1.98 .852 .118 1.74 2.22 1 4

119
The descriptive statistics tables above show that the most importance variable within
each group have a higher mean score. In order to determine if statistically significant
differences in mean scores exist within different groups, an ANOVA table was
generated to reveal the significance level for each group. Table 4.18 below is the
ANOVA table for educational level against factors that determine the use of ICT in
teaching EE (effective use of ICT, attitude of teachers, availability of resource,s and
availability of support mechanisms for efficient use of ICT tools). Therefore level of
education does affect the use of ICT tools.

120
Table 4.18: Analysis of variance (ANOVA) Educational level
Sum of
Squares df
Mean
Square F Sig.
ICT can improve the
teaching of EE
Between
Groups
.173 2 .087 1.598 .213
Within
Groups
2.654 49 .054
Total 2.827 51
ICT plays a transformative
role in teaching EE
Between
Groups
.115 2 .058 .790 .459
Within
Groups
3.577 49 .073
Total 3.692 51
ICT enhances students’
participation & feedback to
educators
Between
Groups
.038 2 .019 .179 .837
Within
Groups
5.269 49 .108
Total 5.308 51
ICT offers opportunities to
educators to obtain
resources for EE
improvement
Between
Groups
.154 2 .077 1.065 .352
Within
Groups
3.538 49 .072
Total 3.692 51
My school has been able to
acquire suitable software
and hardware
Between
Groups
1.962 2 .981 1.642 .204
Within
Groups
29.269 49 .597
Total 31.231 51
My school has been
equipped with computers &
connected to the Internet
Between
Groups
.923 2 .462 .593 .557
Within
Groups
38.154 49 .779

121
Total 39.077 51
ICT tools are properly
equipped in practice and
study rooms to teach EE
Between
Groups
.462 2 .231 .383 .684
Within
Groups
29.538 49 .603
Total 30.000 51
My school has proper
procedure for
communicating to students
online
Between
Groups
.115 2 .058 .127 .881
Within
Groups
22.192 49 .453
Total 22.308 51
Readiness and confidence
in using ICT tools in
teaching
Between
Groups
.298 2 .149 .171 .844
Within
Groups
41.859 48 .872
Total 42.157 50
Teachers enthusiastically
engage in ICT projects in
teaching EE
Between
Groups
.153 2 .077 .095 .909
Within
Groups
38.474 48 .802
Total 38.627 50
Lack of autonomy to
evaluate and use ICT in
teaching EE
Between
Groups
3.856 2 1.928 1.984 .149
Within
Groups
46.654 48 .972
Total 50.510 50
It is very important to work
with ICT tools to teach EE
Between
Groups
.051 2 .026 .064 .938
Within
Groups
19.282 48 .402
Total 19.333 50
Strategists exist to help
teachers learn how to use
ICT in teaching EE
Between
Groups
1.962 2 .981 .955 .392
Within 50.346 49 1.027

122
Groups
Total 52.308 51
Teachers are provided with
training & professional
development regarding
using ICT
Between
Groups
.654 2 .327 .615 .545
Within
Groups
26.038 49 .531
Total 26.692 51
Majority of educators have
ICT equipment for use in
their classrooms
Between
Groups
.115 2 .058 .137 .872
Within
Groups
20.654 49 .422
Total 20.769 51
Adequate preparation for
the effective usage of ICT
tools in teaching EE
Between
Groups
.981 2 .490 .667 .518
Within
Groups
36.000 49 .735
Total 36.981 51
From Table 4.18 above from the significance level in each group, the measure of
significance “sig” is greater than 0.05 at (p=.213, 0.459 - 0.518) respectfully. F
statistics state the strength of the effect of the demographic variable has on the
factor variables. The strength of the effect is indicated by a higher “F value”. In this
case the strength of the effect is indicated by a low “F value” at (F=1.598, 0.790 -
0.667) respectively. This statistical analysis of ANOVA indicates that there is no
statistically significant difference within groups (level of education) with regard to
factors that determine the use of ICT in teaching EE.
4.4 Analysis Of Variance (ANOVA) Teaching Experience
4.4.1 Descriptive ANOVA: Teaching experience and the effective use of ICT in
teaching EE
The purpose of ANOVA for teaching experience was meant to establish the
similarities and differences within the group “Teaching experience” regarding the

123
perception of respondents about the use of ICT in teaching EE. The tables below
provide important descriptions of the mean and standard deviation of a 95%
confidence interval for the variables (effective use of ICT, attitude of teachers,
availability of resources, and availability of support mechanisms for efficient use of
ICT tools) for each separate group (“6 months to 2 years”, “2 years to 5 years”, “5
years to 10 years”, and “more than 10 years”). Table 4.19 below shows the
descriptive statistics for teaching experience and effective use of ICT in teaching EE

124
Table 4.19: Descriptive ANOVA: Teaching experience and Effective use of ICT
N
Me
an
Std
.
De
v
Std.
Erro
r
95%
Confidence
Interval for
Mean
Mi
n
M
ax
Lowe
r
Boun
d
Upper
Bound
ICT can improve
the teaching of
EE
6 months to 2
years
3 4.0
0
.00
0
.000 4.00 4.00 4 4
2 years to 5
years
9 4.0
0
.00
0
.000 4.00 4.00 4 4
5 years to 10
years
14 3.8
6
.36
3
.097 3.65 4.07 3 4
more than 10
years
24 3.9
6
.20
4
.042 3.87 4.04 3 4
Total 50 3.9
4
.24
0
.034 3.87 4.01 3 4
ICT plays a
transformative
role in teaching
EE
6 months to 2
years
3 4.0
0
.00
0
.000 4.00 4.00 4 4
2 years to 5
years
9 4.0
0
.00
0
.000 4.00 4.00 4 4
5 years to 10
years
14 3.8
6
.36
3
.097 3.65 4.07 3 4
more than 10
years
24 3.9
2
.28
2
.058 3.80 4.04 3 4
Total 50 3.9
2
.27
4
.039 3.84 4.00 3 4
ICT enhances
students’
participation &
6 months to 2
years
3 3.6
7
.57
7
.333 2.23 5.10 3 4
2 years to 5 9 4.0 .00 .000 4.00 4.00 4 4

125
feedback to
educators
years 0 0
5 years to 10
years
14 3.7
9
.42
6
.114 3.54 4.03 3 4
more than 10
years
24 3.9
2
.28
2
.058 3.80 4.04 3 4
Total 50 3.8
8
.32
8
.046 3.79 3.97 3 4
ICT offers
opportunities to
educators to
obtain resources
for EE
improvement
6 months to 2
years
3 3.6
7
.57
7
.333 2.23 5.10 3 4
2 years to 5
years
9 4.0
0
.00
0
.000 4.00 4.00 4 4
5 years to 10
years
14 3.8
6
.36
3
.097 3.65 4.07 3 4
more than 10
years
24 3.9
6
.20
4
.042 3.87 4.04 3 4
Total 50 3.9
2
.27
4
.039 3.84 4.00 3 4
4.4.2 Descriptive ANOVA: Teaching experience and availability of resources
The table provides important description of the mean and standard deviation of a
95% confidence interval for the variable “Availability of ICT resources in teaching EE”
for each separate group (“6 months to 2 years”, “2 years to 5 years”, “5 years to 10
years”, and “more than 10 years”).

126
Table 4.20: Descriptive ANOVA: Teaching experience and availability of
resources
N
Me
an
Std
.
De
v
Std.
Erro
r
95%
Confidence
Interval for
Mean
Mi
n
M
ax
Lowe
r
Boun
d
Upper
Bound
My school has
been able to
acquire suitable
software and
hardware
6 months to 2
years
3 2.3
3
1.1
55
.667 -.54 5.20 1 3
2 years to 5
years
9 2.1
1
1.0
54
.351 1.30 2.92 1 4
5 years to 10
years
14 2.2
9
.82
5
.221 1.81 2.76 1 4
more than 10
years
24 2.2
1
.65
8
.134 1.93 2.49 1 3
Total 50 2.2
2
.79
0
.112 2.00 2.44 1 4
My school has
been equipped
with computers &
connected to the
Internet
6 months to 2
years
3 1.6
7
1.1
55
.667 -1.20 4.54 1 3
2 years to 5
years
9 1.5
6
.72
6
.242 1.00 2.11 1 3
5 years to 10
years
14 2.4
3
.85
2
.228 1.94 2.92 1 4
more than 10
years
24 2.6
3
.71
1
.145 2.32 2.93 1 4
Total 50 2.3
2
.86
8
.123 2.07 2.57 1 4
ICT tools are
properly
6 months to 2
years
3 2.6
7
1.5
28
.882 -1.13 6.46 1 4

127
equipped in
practice and
study rooms to
teach EE
2 years to 5
years
9 2.0
0
1.1
18
.373 1.14 2.86 1 4
5 years to 10
years
14 2.0
0
.39
2
.105 1.77 2.23 1 3
more than 10
years
24 2.0
0
.65
9
.135 1.72 2.28 1 4
Total 50 2.0
4
.75
5
.107 1.83 2.25 1 4
My school has
proper procedure
for
communicating
to students
online
6 months to 2
years
3 1.6
7
1.1
55
.667 -1.20 4.54 1 3
2 years to 5
years
9 1.1
1
.33
3
.111 .85 1.37 1 2
5 years to 10
years
14 1.5
0
.65
0
.174 1.12 1.88 1 3
more than 10
years
24 1.4
2
.71
7
.146 1.11 1.72 1 4
Total 50 1.4
0
.67
0
.095 1.21 1.59 1 4
4.4.3 Descriptive ANOVA: teaching experience and attitude of teachers
The table provides important description of the mean and standard deviation of a
95% confidence interval for the variable “Attitude of Teachers about the use of ICT in
teaching EE” for each separate group (“6 months to 2 years”, “2 years to 5 years”, “5
years to 10 years”, and “more than 10 years”).

128
Table 4.21: Descriptive ANOVA: Teaching experience and attitude of teachers
N
Mea
n
Std.
Dev
Std.
Err
or
95%
Confidenc
e Interval
for Mean
Mi
n
M
ax
Low
er
Bou
nd
Upp
er
Bou
nd
Readiness and
confidence in
using ICT tools in
teaching
6 months to 2
years
3 2.33 1.528 .882 -
1.46
6.13 1 4
2 years to 5
years
8 2.25 1.282 .453 1.18 3.32 1 4
5 years to 10
years
14 2.93 .730 .195 2.51 3.35 2 4
more than 10
years
24 2.88 .741 .151 2.56 3.19 1 4
Total 49 2.76 .902 .129 2.50 3.01 1 4
Teachers
enthusiastically
engage in ICT
projects in
teaching EE
6 months to 2
years
3 2.00 1.000 .577 -.48 4.48 1 3
2 years to 5
years
8 2.25 1.165 .412 1.28 3.22 1 4
5 years to 10
years
14 3.07 .616 .165 2.72 3.43 2 4
more than 10
years
24 2.96 .751 .153 2.64 3.28 1 4
Total 49 2.82 .858 .123 2.57 3.06 1 4
Lack of
autonomy to
evaluate and use
ICT in teaching
EE
6 months to 2
years
3 2.33 .577 .333 .90 3.77 2 3
2 years to 5
years
8 3.25 .886 .313 2.51 3.99 2 4
5 years to 10
years
14 3.14 1.027 .275 2.55 3.74 1 4
more than 10 24 3.17 1.007 .206 2.74 3.59 1 4

129
years
Total 49 3.12 .971 .139 2.84 3.40 1 4
It is very
important to work
with ICT tools to
teach EE
6 months to 2
years
3 2.67 1.155 .667 -.20 5.54 2 4
2 years to 5
years
8 3.63 .744 .263 3.00 4.25 2 4
5 years to 10
years
14 3.71 .469 .125 3.44 3.98 3 4
more than 10
years
24 3.75 .532 .109 3.53 3.97 2 4
Total 49 3.65 .631 .090 3.47 3.83 2 4
4.4.4 Descriptive ANOVA: Teaching experience and availability of ICT support
and efficient use of ICT
The table provides an important description of the mean and standard deviation a of
95% confidence interval for the variable “Availability of ICT support mechanisms for
efficient use of ICT in teaching EE” for each separate group (“6 months to 2 years”,
“2 years to 5 years”, “5 years to 10 years”, and “more than 10 years”).

130
Table 4.22: Descriptive ANOVA: Teaching experience and availability of ICT
support
N
Me
an
Std
.
De
v
Std.
Erro
r
95%
Confidence
Interval for
Mean
Mi
n
M
ax
Lowe
r
Boun
d
Upper
Bound
Strategists exist
to help teachers
learn how to use
ICT in teaching
EE
6 months to 2
years
3 3.0
0
1.7
32
1.00
0
-1.30 7.30 1 4
2 years to 5
years
9 2.3
3
1.4
14
.471 1.25 3.42 1 4
5 years to 10
years
14 2.6
4
.74
5
.199 2.21 3.07 2 4
more than 10
years
24 2.7
1
.90
8
.185 2.32 3.09 1 4
Total 50 2.6
4
1.0
05
.142 2.35 2.93 1 4
Teachers are
provided with
training &
professional
development
regarding using
ICT
6 months to 2
years
3 3.0
0
.00
0
.000 3.00 3.00 3 3
2 years to 5
years
9 2.2
2
.83
3
.278 1.58 2.86 1 4
5 years to 10
years
14 2.3
6
.49
7
.133 2.07 2.64 2 3
more than 10
years
24 2.5
4
.77
9
.159 2.21 2.87 1 4
Total 50 2.4
6
.70
6
.100 2.26 2.66 1 4
Majority of
educators have
ICT equipment
for use in their
classrooms
6 months to 2
years
3 2.0
0
1.0
00
.577 -.48 4.48 1 3
2 years to 5
years
9 1.5
6
.52
7
.176 1.15 1.96 1 2
5 years to 10
years
14 1.8
6
.36
3
.097 1.65 2.07 1 2

131
more than 10
years
24 1.9
6
.75
1
.153 1.64 2.28 1 4
Total 50 1.8
6
.63
9
.090 1.68 2.04 1 4
Adequate
preparation for
the effective
usage of ICT
tools in teaching
EE
6 months to 2
years
3 2.3
3
1.5
28
.882 -1.46 6.13 1 4
2 years to 5
years
9 2.1
1
.92
8
.309 1.40 2.82 1 4
5 years to 10
years
14 1.7
9
.42
6
.114 1.54 2.03 1 2
more than 10
years
24 2.0
8
.92
9
.190 1.69 2.48 1 4
Total 50 2.0
2
.84
5
.119 1.78 2.26 1 4
The descriptive statistics tables above demonstrates that the importance of a
variable within each group has a higher mean score. In order to determine if
statistically significant differences in mean scores exist within different groups, an
ANOVA table was generated to reveal the significance level for each group. Table
4.23 below is the ANOVA table for teaching experience against factors that
determine the use of ICT in teaching EE (effective use of ICT, attitude of teachers,
availability of resources, and availability of support mechanisms for efficient use of
ICT tools).

132
Table 4.23: Analysis of Variance (ANOVA) educational level
Sum of
Squares df
Mean
Square F Sig.
ICT can improve the
teaching of EE
Between
Groups
.147 3 .049 .846 .476
Within
Groups
2.673 46 .058
Total 2.820 49
ICT plays a transformative
role in teaching EE
Between
Groups
.132 3 .044 .572 .636
Within
Groups
3.548 46 .077
Total 3.680 49
ICT enhances students’
participation & feedback to
educators
Between
Groups
.423 3 .141 1.335 .275
Within
Groups
4.857 46 .106
Total 5.280 49
ICT offers opportunities to
educators to obtain
resources for EE
improvement
Between
Groups
.341 3 .114 1.564 .211
Within
Groups
3.339 46 .073
Total 3.680 49
My school has been able
to acquire suitable
software and hardware
Between
Groups
.209 3 .070 .106 .956
Within
Groups
30.371 46 .660
Total 30.580 49
My school has been
eequipped with computers
&connected to the Internet
Between
Groups
8.938 3 2.979 4.904 .005*
Within 27.942 46 .607

133
Groups
Total 36.880 49
ICT tools are properly
equipped in practice and
study rooms to teach EE
Between
Groups
1.253 3 .418 .721 .545
Within
Groups
26.667 46 .580
Total 27.920 49
My school has proper
procedure for
communicating to students
online
Between
Groups
1.111 3 .370 .816 .492
Within
Groups
20.889 46 .454
Total 22.000 49
Readiness and confidence
in using ICT tools in
teaching
Between
Groups
3.341 3 1.114 1.403 .254
Within
Groups
35.720 45 .794
Total 39.061 48
Teachers enthusiastically
engage in ICT projects in
teaching EE
Between
Groups
5.960 3 1.987 3.042 .038*
Within
Groups
29.387 45 .653
Total 35.347 48
Lack of autonomy to
evaluate and use ICT in
teaching EE
Between
Groups
2.051 3 .684 .712 .550
Within
Groups
43.214 45 .960
Total 45.265 48
It is very important to work
with ICT tools to teach EE
Between
Groups
3.203 3 1.068 3.022 .039*
Within
Groups
15.899 45 .353
Total 19.102 48

134
Strategists exist to help
teachers learn how to use
ICT in teaching EE
Between
Groups
1.347 3 .449 .429 .733
Within
Groups
48.173 46 1.047
Total 49.520 49
Teachers are provided with
training & professional
development regarding
using ICT
Between
Groups
1.692 3 .564 1.141 .342
Within
Groups
22.728 46 .494
Total 24.420 49
Majority of educators have
ICT equipment for use in
their classrooms
Between
Groups
1.125 3 .375 .913 .442
Within
Groups
18.895 46 .411
Total 20.020 49
Adequate preparation for
the effective usage of ICT
tools in teaching EE
Between
Groups
1.234 3 .411 .561 .644
Within
Groups
33.746 46 .734
Total 34.980 49
Significance level at p<0.05*
From Table 4.23 above, it is evident that there is statistically significant differences
between each group of the variable work experience and the factors: “My school has
been connected to internet and computers” (F= 4.904 and p=0.005*), the factor
“Teachers enthusiastically engage in ICT projects in teaching EE” (F=3.042 and
P=.038*), and the factor “It is very important to work with ICT tools to teach EE”
(F=3.022 and p=.039*). Although the results of these three variables show a
statistically significant difference, the effect of the difference “F-test” (F= 4.904,
=3.042, F=3.022) is weaker, hence it is concluded that there is no significant
difference with regard to teaching experience and these factors.

135
The rest of the factors in the significance level in each group “sig” is greater than
0.05 at (p=0.476 - 0.644) respectfully. The strength of the effect is indicated by a
higher “F value”. In this case the effect of the relationship is indicated by a low “F
value” at (F=0.846 - 0.561) respectively. The overall statistical analysis of ANOVA
indicates that there is no statistically significant difference within groups (teaching
experience) with regard to the use of ICT on teaching EE. F statistics state the
strength of the effect of the demographic variable has on the factor variables.
The inferences from the ANOVA are consistent with studies by Tella ( 2011) which
conclude that availability of resources depends on school to school, departments
and area of education. These results are also consistent with that of Daraja–Mbili’s
(2013) findings which posit that a positive attitude towards use of ICT helps in the
implementation of biology curriculum. Furthermore, the results are supported by
Tella ( 2011) who found out that the support mechanism and attitude of teachers
improve the adoption and the use of ICT; and Chowdhury (2009) and Owusu-Ansah
(2013) reveal that use of ICT improves education and male and females have the
same view of the importance of ICT on education.
4.5 Chi-Square Test
The study employed the Pearson's chi-squared test for independence in order to
determine if there is a relationship between two categorical variables.
Research Question 1: How can ICT be used effectively in the selected rural high
schools to improve teaching EE?
In order to determine the association between perception of teachers on the
adoption of ICT in teaching EE, the cross tabulation of "respondents’ attitude and
effective use of ICT was done and the results are presented in Table 4.25 below.

136
Table 4.24: Chi-Square
Value Df
Asymp.
Sig. (2-
sided)
Pearson Chi-
Square
10.359a 3 .016
Likelihood Ratio 9.323 3 .025
Linear-by-Linear
Association
1.990 1 .158
N of Valid Cases 51
In order to determine the association between variables, the Pearson chi-squared
test was used. According to the reading from Table 4.24 above, there is a statistically
significant association between effective use of ITC and attitude of teachers towards
the use of ICT. "Pearson Chi-Square" is significant at (p<0.05). Therefore "Pearson
Chi-Square" is p = 0.016. at pχ(1) = 10.359.
As a result, the researcher concludes that the attitudes of the teachers play a
significant role in determining their perception of the effective use of ICT tools
in teaching EE.
Research Question 2: What ICT facilities are available for teaching EE?
In order to determine whether adoption of ICT is influenced by the availability of
resources, the cross tabulation of “respondents’ perception of the effective use of
ICT” and availability of “ICT resources in teaching EE” was done and the results are
presented in Table 4.25 below.

137
Table 4.25: Chi-Square Tests
Value Df
Asymp. Sig. (2-
sided)
Pearson Chi-
Square
11.926a 3 .049
Likelihood Ratio 2.892 3 .041
Linear-by-Linear
Association
1.654 1 .020
N of Valid Cases 52
In order to determine the association between variables, the Pearson chi-squared
test was used. According to the reading from Table 4.25 above, there is a statistically
significant association between “effective use of ICT” and “availability of ICT
resources”. The results of "Pearson Chi-Square" is significant at (p<0.05). Therefore
"Pearson Chi-Square" is p = 0.049. at pχ(1) = 11.926.
As a result, the researcher concludes that the adoption of ICT in teaching EE is
influenced by the availability of ICT resources.
Research Question 3: What are the attitudes of teachers towards the use of ICT
tools in teaching EE?
In order to determine whether the adoption of ICT is influenced by teachers’
attitudes, the association between “support mechanisms available to enhance
efficient use of ICT tools” and “the attitude of teachers towards the usage of ICT in
teaching EE” is tested. The cross tabulation of respondents’ attitude and support
mechanism was done and the results are presented in Table 4.26 below.

138
Table 4.26: Chi-Square Tests
Value Df
Asymp. Sig. (2-
sided)
Pearson Chi-
Square
32.681a 9 .000
Likelihood Ratio 38.936 9 .000
Linear-by-Linear
Association
3.474 1 .062
N of Valid Cases 51
In order to determine the association between variables, the Pearson chi-squared
test was used. According to the reading from Table 4.26 above, there is a statistically
significant association between “support mechanisms available” and “the attitude of
teachers towards the usage of ICT”. The results of "Pearson Chi-Square" is
significant at (p<0.05). Therefore "Pearson Chi-Square" is p = 0.000. at pχ(1) =
32.681.
As a result, the researcher concludes that the adoption of ICT is influenced by
teachers’ attitudes.
Research Question 4: Do teachers use ICT tools efficiently in teaching EE?
In order to determine the support systems available to support the efficient use of
ICT tools in teaching EE, the cross tabulation of “availability of resources” and
availability of “support mechanism” was done and the results are presented in Table
4.27 below.

139
Table 4.27: Chi-Square Tests
Value Df
Asymp. Sig. (2-
sided)
Pearson Chi-
Square
14.238a 9 .114
Likelihood Ratio 14.814 9 .096
Linear-by-Linear
Association
4.968 1 .026
N of Valid Cases 52
In order to determine the association between variables, the Pearson chi-squared
test was used. According to the reading from Table 4.27 above, there is no
statistically significant association between “support mechanisms available” and “the
attitude of availability of resources”. The results of "Pearson Chi-Square" is
significant at (p<0.05). Therefore "Pearson Chi-Square" is p = 0.114 at pχ (1) =
14.238. This indicates that the respondents acknowledge the importance ICT
resources, but they cannot make a difference if support mechanisms are not in
place. As a result, the results of the descriptive analysis are used to ascertain the
support mechanisms available in terms of their mean score.
4.6 Summary
The chapter has provided an analysis of the quantitative questionnaire from the
teachers who offer a concept of Environmental Education. The demographic
characteristics of the teachers were explored. These include their social and
academic status.
It was established that computer mediated communication (CMC) was popular
amongst the educators mainly for social use and not for academic purposes.
Teachers’ perceptions play a vital role in their integration of ICT in the curriculum.
Efficient and effective integration needs pedagogical transformation for new
technologies. The availability of ICT resources could also support teaching and
learning and improve conceptual understanding.

140
CHAPTER FIVE
DISCUSSIONS OF FINDINGS, SUMMARY, CONCLUSION AND
RECOMMENDATIONS
5.0 Introduction
This chapter presents and discusses the research findings that emerged from the
questionnaire data. The discussion has been categorised along the major findings of
the study. The aim of this chapter is to discuss the multiple perspectives on the
elements that influence the delivery of the curriculum such as: ICT integration in
education, mastery of ICT integration in teaching, establishment of ICT resources,
the educator or the teacher and the general trends in rural high schools.
5.1 Discussions
5.1.1 ICT integration in education
The essence of this section was to assess the adoption and integration of ICT in
teaching Environmental Education in rural high schools. This is paramount to this
study due to the importance of ICT application in rural schools. There were about 16
sub-variables that characterised ICT integration in rural schools (cf Table 4.5 in
Chapter Four for details). Of the 16 sub-variables, the ranking of the factors that
influence the adoption of ICT in teaching EE suggested that “ICT can improve the
teaching of EE” (M = 3.94; SD = 0.235). However, the least important factor
signifying the adoption of ICT was “proper procedures for communicating to students
online” (M = 1.38; SD = 0.661). The current result is consistent with the work of
Rastogi and Maholtra (2013) in Chapter Two who asserted that different forms of
ICTs are sources of powerful tools that are able to help meet some of these
challenges. The authors argued that ICTs can help in changing the old methods of
teaching, where the teacher becomes the centre of the teaching process. The
assertion of Rastogi and Malhotra is consistent with that of Quinot and Tonder
(2014). Quinot and Van Tonder (2014) (Ibid) explained previously that the use of ICT
in education through the rubric of e-learning can be described as the use of
computer network technology. This can be done primarily over intranet or through
the Internet.

141
This result suggested that educators that offer Environmental Education identify
technological tools and are able to use them appropriately in their classroom
teaching and instruction to bring out the meaning of the curriculum content. There is
also the need to pay particular attention to factors such as “participation and
feedback to educators”, “evaluate and use ICT in teaching” as well as “readiness and
confidence in using ICT tools in teaching”.
This is because introducing technology on its own into teaching may not be sufficient
to effect change. Integration of ICTs therefore becomes necessary as a change
agent. In view of this, educators have by their professional training acquired the
competence and innovative skills to bring about enormous change in the educational
system in terms of ICT integration. ICTs have penetrated the educational system and
are changing teaching experiences (Rapetti & Cantoni, 2012; OECD, 2012 as cited
in Fanni, Rega, & Cantoni, 2013).
5.1.2 Mastery of ICT integration in teaching
Educators’ comprehension of ICT was acclimatised towards teaching from
technological tools, rather than with technological tools. Vygotsky’s theory was
discussed in Chapter Two which allowed learners to be provided with socially rich
environments in which they can explore knowledge domains. Working with
technological tools can support the teaching and learning environment in that it will
allow learners to take full control of the learning process whilst the educator acts as a
facilitator.
The principles underlying cognitive theory, which is a foundation of organising new
knowledge, can be linked to integrating ICT in the classroom teaching because the
technological tools learners will be exposed to will offer them the opportunity to
actively participate through perspectives that shed light on the interaction between
classroom goal structures (Deci et al., 1999).
5.1.3 Establish the availability of technological tools
The Action Plan as noted in Chapter Two advocates the need for teachers to be
computer literate and to ensure that learners have increasing access to a wide range

142
of media (including computers) that will enrich their education (DoE, 2003). With
regard to “attitudes of teachers towards the use of ICT tools for teaching EE”, there
were several variables that explained the usage of ICT tools. These include but not
limited to “Teachers enthusiastically engage in ICT projects in teaching EE”. The
evidence showed that both males and females mean score was above average,
revealing that the respondents agreed that attitudes of teachers have a bearing on
the use of ICT tools in improving the teaching of EE (cf Table 4.10). However, there
was a difference in the mean score of males and females regarding their attitude
towards the use of ICT in effective teaching of EE. That is, the difference is not
statistically significant. It can therefore be argued that the current results resonate
with that of Kozma (2008) who explained that e-Education views ICT as “a tool for
management, a resource for curriculum integration and a learning environment that
advances creativity and communication” (p.). However, Tapscott and Knight et al.
(1998) warned that most educators are still embracing the old style of teaching
because of ineffective use of ICT pedagogical tools.
It was revealed in Chapter Two that ICTs are becoming accessible which importantly
plays a critical role in education worldwide. There is access to films, video tapes,
computers, the Internet and the World Wide Web (WWW). The ICT tools identified
are not single technologies but a combination of hardware media desktop, notebook
and handheld computers and applications such as word processors, spreadsheet,
tutorials and electronic mail and mobile devices such as smart phones, tablets and
the WiFi facility. It has been rightly pointed out that the availability of these ICT
resources does not entirely depend on the tangible tools but the effective and
efficient exploration of such tools (Kozma, 2005). Mobile learning devices empower
learners to embark on finding new knowledge because almost all educators and
learners have access to them (Menkhoff & Bengtsson, cited in Singh, 2012)
although, more often than not, these devices are not permitted in the classroom.
The findings in this section reveal that ICT and technological tools that are readily
available to educators are not copiously used to establish knowledge as well as
contextual comprehension, neither are they used for innovative teaching. Education
is currently changing into an era influenced by electronic media. It is therefore
necessary that teaching methods are changed to accommodate the new method.

143
5.1.4 The teacher or educator
Various trends also suggest that there is the need to have an efficient use of ICT
tools. Amongst them include the available strategies to help teachers learn how to
use ICT in teaching EE; provision of training and professional development, and
adequate preparation for effective usage of ICT tools in teaching EE. These factors
need attention as reflected by various demographics in Table 4.12. The main tenet of
the results as reflected in Table 4.12 is that both male and female teachers
perceived availability of a support mechanism to enhance the use of ICT tools in
teaching EE as essential. It is also important to note that a study in Singapore by
Teo (2006) on the use of ICT-mediated lessons identified several barriers to the
teacher in ICT integration in the classroom. Such barriers, as mentioned in Chapter
Two, included inadequate technical support staff, lack of sufficient time for teachers
to prepare for ICT-mediated lesson, lack of support provided by school leaders in
addressing ICT concerns, and insufficient training for teachers on how to incorporate
ICT into classroom instruction (Teo, 2006).
Teachers’ skills are more heterogeneous. There are teachers with high-level
technology skills. The large majority of educators have sufficient skills for everyday
and routine working practices, but many of them are still experiencing difficulties in
finding meaningful pedagogical use for technology. The educator is directly affected
by the change with integrating ICT in teaching. In addition, the teacher being in the
centre of the education process (Zhao & Frank, 2003; Davis, 2008) has one of the
most important roles in the change to ICT integration, as “education change depends
on what teachers do and think” (Fullan & Stieglbauer, 1991, p.117).
Integrating ICT in education allows teachers to enrich their teaching with a variety of
resources, depending on their ability and confidence to experiment with new tools.
Integrating ICTs in education has changed the role of educators who have been
encouraged to move away from the traditional mode of teaching, i.e. not being
centred in the teaching process, towards facilitating learner-centred learning. The
degree of change depends on the teachers’ attitude. Some are willing to experiment
with new tools and others are not.

144
Some educators explained that there are several limitations to the degree to which
learners can learn independently using ICT tools. Teachers’ needs for adequate
professional development were increased because of their changing roles. Research
has indicated the important role of the teacher in effectively integrating ICT in
education (Davis, 2008; Frailich et al., 2001), taking an appropriate approach, and
making decisions that will make learners benefit from the advantages.
Law (2009) indicated the importance of teachers’ professional development,
recommending a greater focus on the pedagogical rather than the technology
aspects of ICT use in the classroom. The availability of resources at a school in
addition to attitudes of teachers is very important in stimulating change (Zhao &
Frank, 2003).
5.1.5 General trends in rural high schools
Significant information worthy of considering entails the correlation between the
educational level of the teacher and the extent to which he or she can make effective
use of ICT. It was noted that the significant majority of the respondents who hold
honours, bachelor’s degrees or post matric diplomas held the view that ICT can
improve the teaching of EE (M = 3.9; SD = 23). The same group of educational level
holders also thought that ICT plays a transformative role in teaching EE (M = 3.9;
SD; = 0.26). They also asserted that ICT enhances learners’ participation and
feedback to educators, as well as offers opportunities to educators to obtain
resources for EE improvement. From the cognitive learning theory, it is argued that
learning with ICT tools promotes learning of higher–order thinking skills (Jonassen et
al., 2010). Though these particular results do not fully support previous studies, there
are traces of elements that support the study of Lowther et al. (2008) who, in
Chapter Twp, argued that there are three important characteristics that are needed
to develop good quality teaching with ICT:
Autonomy,
Capability, and
Creativity.

145
The authors explained that autonomy means learners take control of their learning
through the use of ICT. However, for capability, learners are more confident in the
learning process. On the other hand, creativity is enhanced when they are able to
discover new multimedia tools and create materials in the styles readily available to
them. This supports the view that the basic principles underlying cognitive learning
theories of foundation of experience are used to organise new information, which
include a personal perspective regarding new information.
In terms of educational level and availability of resources, most educators holding
various qualifications ranging from honours, bachelor’s degrees and post matric
diplomas were mindful of that fact that their schools have been able to acquire
suitable software and hardware (M = 2.23; SD = 783). A good number also agreed
that their schools have been equipped with computers and connected to the Internet.
There were some who supported the notion that ICT tools are properly equipped in
practice and study rooms to teach EE (M = 2.0; SD = 767). Moreover, the
respondents agreed that “schools have proper procedure for communicating to
students online”. The results to a large degree revealed that there is a statistically
significant association between effective use of ICT and attitudes of teachers
towards the use of ICT (<0.05). Additionally, cognitive theory explained that learning
with technology improves much of the thinking in the learning process (Jonassen &
Reeves, 1996). In fact there was alsoa statistically significant association between
support mechanisms available and the attitudes of teachers towards the usage of
ICT (p<0.05); this is consistent with cognitive theory which suggests the integration
of ICT into Environmental Education Curriculum with meaningful interaction.
In contrast, there was no statistically significant association between “support
mechanisms available” and “the availability of resources”. This might not adhere fully
to the policy of ICT integration in schools due to the fact, as noted in Chapter Two ,
the use technology tools such as computers and the Internet is still in its infancy in
South Africa.

146
5.2 Summary
The aim of this study was to investigate the effective usage of ICT in teaching
Environmental Education in rural high schools. Although there educators displayed
the urge and willingness to use ICTs in improving teaching EE in the rural high
schools visited, there are numerous aspects that need to be investigated. In order to
achieve this, the answers to the following questions were needed.
Main question
How can the integration of ICT improve the teaching of Environmental
Education?
Sub–questions
How can ICT be used effectively in the selected rural high schools to improve
teaching of EE?
What ICT facilities are available for teaching EE?
Do teachers use ICT tools efficiently in teaching EE?
What are the attitudes of teachers towards the use of ICT tools in teaching
EE?
The literature review in Chapter Two focused extensively on the usage of ICTs in
teaching Environmental Education in rural high schools. The readily available
literature on the use of ICTs in rural high schools is very limited, which made the
reviewing of the teaching of Environmental Education also very limited. The use of
ICTs in education is not restricted to developed countries, but most rural high
schools are now embracing and still struggling with the efficient usage despite the
numerous challenges they encounter (Castello, 2002 in Herselman, 2003; Pedro et
al., 2004).
It follows from Chapter Two that the use of ICTs in teaching Environmental
Education is believed to support higher- order thinking skills in order for them to
solve some environmental problems and also for environmental sustainability which
contributes to the education of the whole person (Tilbury, 1995, p. 2000). In
Environmental Education, learners are taught to be active and act on information by

147
transforming it into new meaning (Campell, 1990). In this instance, they should be
able to use the technological tools to bring out meaning in relation to what they have
learnt.
Integrating ICTs in teaching Environmental Education will also support learning and
blending the teaching process, that is a combination of traditional forms of teaching,
such as face- to- face classroom sessions (Oliver & Trigwell, 2005). Blended
teaching can bring about the motivation to equip learners with the experience they
need to critically access the topic being learnt.
As described in hapter Three, the study was a quantitative survey of selected rural
high schools in East London district, Eastern Cape, South Africa. The schools were
visited for almost two weeks for data collection. The questionnaire for educators was
written in English and also was structured with Modified Likert responses. These
ranged from Strongly Agreed (SA), with the highest numerical value of 4, to Strongly
Disagree (SD), with the lowest numerical value of 1. The questionnaire was
explained to all educators. Out of the 60 educators that were sampled randomly for
the completion of the questionnaire, only 52 educators returned them.
Data was analysed using descriptive and inferential statistics, and the results were
presented in tables and diagrams. The chi-square test was used to generalise and to
find the effect between variables that were studied in the target population.
Educators were also introduced to the objectives of the study. They were informed
about their voluntary participation and assurance was given for not revealing their
identities.
Chapter Four presented the data and its analysis. This was completed in accordance
with what the study sought to achieve in terms of the research sub-questions and the
main question. The chapter began by presenting data on the demographic
characteristics of the respondents and their ICT profile. Data was gathered on the
way ICT is used in the teaching and learning process and for construction of
knowledge and conceptual understanding.

148
5.3 Conclusions and Recommendations
This section presents a summary of findings and conclusions drawn from the study.
Some recommendations have also been included which will serve as a literature for
future studies to speed up the usage of ICT in education in South African rural high
schools. Based on the results and from the literature, the following conclusions may
be drawn.
First, and most importantly, the educational level of an educator does not necessarily
influence the teacher’s attitudes towards adoption and effective use of ICT tools.
There is sufficient evidence that attitudes of the teachers play a significant role in
determining their perception of the effective use of ICT tools in teaching EE. There is
also ample evidence that adoption of ICT in teaching EE is influenced by the
availability of ICT resources and attitude.
Flowing from the above, it can be inferred that ICTs can contribute to improving the
quality of teaching. Most rural high schools in South Africa do not have enough ICT
resources. ICT was not only an educational pedagogy but also a motivating
mechanism for socio-economic development in a globalising knowledge economy.
The implications of Vygotsky’s theory to the current study is that learners should be
provided with socially rich environments in which they have to explore knowledge
domains with their peers. ICT can be used to support learning environments by
providing tools for discourse and discussions, and providing online systems to
scaffold learners’ evolving understanding and cognitive growth.
Bringing ICT into practice has a role to play in facilitating and improving teaching and
learning. In this study, it was discovered that South African schools have used
traditional teaching methods that have stayed for the last few decades. Meanwhile,
the Electronic and Communication Transaction Act No 25 of 2002 was enacted by
the Department of Communication (DC) in a bid to regulate all ICT initiatives in
South Africa and to develop a five year national e-strategy which would empower all
citizens, especially the education sector.
Educators’ professional development is necessary in the area of ICT to enable them
to be confident and competent and to develop positive attitudes and skills. It may be

149
extremely difficult sometimes to “change” educators’ belief systems. Some are
technophobic to use ICT in the teaching and learning process in their various
classrooms. As a matter of fact, the higher the age of the educator, the greater their
resistance becomes.
ICT provides opportunities to explore new knowledge and creates a conducive
teaching environment. It also furnishes educators with the chance of enjoying
effective ways of communication, processing and solving problems. This in turn may
allow learners to develop their cognitive skills. However, integrating ICT in education
still lags behind in rural schools because of factors such as the inadequate
infrastructure (Internet, software, hardware), lack of policies, teachers’ perceptions,
and teachers’ attitudes towards the use of ICT.
In this study, it was revealed that most educators are still comfortable with the old
teaching methodology. The idea is to push for universal access to ICT through the
deployment of networked computers, educational software and online resources to
all South African schools. Although ICTs grant many beneficial opportunities for
education, they cannot be a substitute for formal schooling. Its main aim and
objective is to support and enhance education. This will also enable the development
and distribution of electronic learning content so that every educator has the
knowledge, skills and support needed to integrate ICT in education.
It is important that the integration process is well managed by educators and that
they are guided by policies. ICTs are tools and they are in no position to fix a bad
educational philosophy. Choices made by educational personnel must be made in
terms of objectives and methodology before any tangible decisions are made about
any ICT intervention. Despite the challenges outlined in this study, ICTs are being
increasingly used in education in the developed world. In order to reach out to
learners from remote areas, there is the need to provide them with adequate and
quality education, and equip teachers with a wider range of educational resources.
As policy implementers of ICT education at the coal face, South African educators in
rural communities need to prioritise subject content knowledge while at the same
time embrace the innovation which comes with the integration of ICT. Capacity-

150
building training programmes designated for educators in rural schools seem to play
a critical role as the skills acquired will alleviate the current poor use of ICT
resources in rural schools.

151
REFERENCES
Adams, N.B. (2002). Concerns of educational computing postsecondary faculty. Research on Technology Education, 285-303.
Adu, E.O., & Tella, A.(2013). A comparison of social networking sites used among undergraduate students in selected African universities: University of Ilorin, Nigeria & BA ISAGO University College, Botswana.
. Agalianos, A., Noss, R., & Whitty, G. (2001). Logo in mainstream schools: The
struggle over the soul of an educational innovation. British Journal of Sociology of Education, 22(4), 479-500.
Agyei, D.D. (2012). Preparation of pre-service teachers in Ghana to integrate
Information and Communication technology in teaching mathematics. Enshede: University of Twente.
Akbaba–Aitun, S. (2004). Information technology classrooms and elementary school
principals’ roles: Turkish experience. Education and Information Technologies, 9(3), 255-270.
Ajzen, I. (1991). The theory of planned behaviour. Organisational behaviour and
human decision processes, 50(2), 179-211. Al–Ansari, H. (2006). Internet use by the faculty members of Kuwait University. The
Electronic Library, 24(6), 791-803. Albirini, A. (2006). Teachers’ attitudes toward information and communication
technology: The case of Syrial EFL teachers. Computers and Education, 47(4), 373-398.
Aliga, M., & Guderson, B. (2002). Interactive Statistics. Thousand Oak: Sage. Anderman, E.M., & Dawson, H. (2011). Learning with motivation. In Mayer, R.E. &
P.A. Alexander (Eds.), Handbook of research on learning and instruction (pp. 219-241). New York: Routledge.
Anderson, G. (1990). Fundamentals of educational research. Bristol: Falmer Press.
Teachers Library Series. Anderson, R. (2008). Implications of the information and knowledge society for
education. In J. Voogt & Knezek (Eds.), International handbook of information and technology in primary and secondary education (pp. 5-22). New York: Springer.

152
Anderson, T. (2007). Reducing the Loneliness of Distant Learner using Social Software. Open and Distance Learning Conference. Retrieved from http://www2.open.ac.uk/r06/conference/TerryAndersonKeynoteCambridge2007.pdf
Andrews, R., & Haythornwaithe, C. (2007). Introduction to e–learning research. In R.
Andrews& C. Haythornwaithe (Eds.), The Sage handbook of e-learning research (p. 539). London: Sage.
Ary, D., Jacobs, L., & Razavieh, A. (2002). Introduction to research in education (6th
ed.). Belmont: Wadsworth. Asmal, K. (2003). Foreword by the Minister of Education. Draft White Paper on e-
Education. Transforming learning and teaching through information and communication technologies. Pretoria: Department of Basic Education.
Austin, K.A. (2009). Multimedia Learning: Cognitive individual differences and
display design techniques predict transfer learning with multimedia learning modules. Computer and Education, 53(4). 1339-1354.
Babbie, E. & Mouton, J. (Eds.). (2006). The Practice of Social Research. New York:
Oxford University Press. Babbie, E.R. (2010). The practice of social research (12th ed.). Belmont, CA: Wadsworth Cengage. Bachiorri, A. (1994). Proceedings of the Colloquium Trends in Environmental
Education in Europe: Environmental Education in Italy. Bradford: England, 25-27th Feb.
Bandura, A. (1977). Social learning theory. New York, NY: General Learning Press. Bane, P.W., Bradley, S.P., & Collin, D.J, (1995). Winners and losers: Industry
structure in the converging world of telecommunication, computing and entertainment. Havard Business School Colloquium: Multimedia and the Boundaryless World.
Banks, K. (2008). Mobile learning in developing countries: Present realities and
future possibilities. In D. Harper (Ed.), Education for a Digital World. Advice, Guidelines and Effective Practice from Around the Globe. Vancouver: BC campus.
Barker, S. (2008). Measuring the quality of e-learning. British Journal of Education
Technology, 39(6) 1037-1056. Barnett, M. (2002). Issues and Trends Concerning New Technologies for Teacher
Professional Development: a review of literature. Paper presented at the annual meeting of the American Educational Research.

153
Bates, T. (2001). The continuing evolution of ICT capacity: The implications for education. In M. Farrel (Ed..), The changing faces of virtual education (pp. 29-46). Vancouver, Canada: The Commonwealth of Learning.
Bauer, J., & Kenton, J. (2005). Toward technology integration in schools: Why isn’t
happening. Journal of Technology and Teacher Education, 13(40), 519-546. Baylor, A., & Ritchie, D. (2002). What factors facilitate teachers’ skill, teacher morale
and perceived student learning in technology classrooms? Journal of Computers and Education, 39(1), 395-414.
Becker, H.J. (1992). Computer-based integrated learning systems in the elementary
and middle grades: A critical review and synthesis of evaluation reports. Journal of Educational Computing Research, 8(1), 1-41.
Beddis, R., & Johnson, C. (1998). Only one earth: A multimedia pack. Godalming ,
England: World Wildlife. Behr, A.L. (1998). Education in South Africa. Origins, issues and trends, 1652-1998.
Pretoria: Academica. Bennet, L. (2001). Technology standards for preparation of teachers. International
Journal of Social Education, 15(2), 1-11. Bialobrzeska, M., & Cohen, S. (2005). Managing ICTs in South African schools:
A guide for school principals, Braamfontein: South African Institute for Distance Education.
Blignaut, S., & Howie, S. (2007). ICT policies, realities and practices in South African
Schools: Tshwane University of Technology, University of Pretoria. Blumstein, D.T., & Saylan, C. (2007). The failure of environmental education and
how we can fix it. PLOS Biology, 5 (UNESCO, Tbilisi Declaration, 1978). Borg, W.R., & Gall, M.D. (1990). Educational research: An introduction (5th ed.). New
York and London: Longman, Inc. Bornman, M. (1997). Environmental education in schools in Bophuthatswana: A South African perspective. Educare, 26 (1 and 2), 56-67. Bradford, P., Porciello, M., Balkon, N., & Backus, D. (2007). The blackboard learning
system. The Journal of Educational Technology Systems, 35, 301-314. Brandford, J.D. (1999). How people learn: Brain, Mind, Experience and School.
Committee on Development in the Science of Learning, National Research Council, National Academic Press.
British Educational Communications and Technology Agency (BECTA). (2004). A
review of the research literature on barriers to the uptake of ICT teachers. Retrievedfrom http://www.becta.org.uk.

154
British Educational Communications and Technology Agency (BECTA). (2007).
Harnessing Technology Review 2007: Progress and Impact of Technology Education. Coventry, Becta.
British Educational Computing and Technology Agency (BECTA) (2009). ICT an
attainment. Retrieved from http:www.becta.org.uk/research/display.cfm. Bruner, Jerome, S., Olver, P.M. et al.(1996). Studies in Cognitive Growth, NY:John
Wiley and Sons. Brush, T., Glazewski, K.D., & Hew, K.F. (2008). Development of an instrument to
measure pre-teachers’ skills, technology beliefs, and technology barriers. Computers in the schools, 25, 112-125.
Buabeng–Andoh, C. (2012). Factors influencing teachers’ adoption and Integration
of ICTs in teaching: a review of literature. International Journal of Education and Development using ICT (IJEDICT),8(1), 136-155.
Burns, R. (2000). Introduction to research methods, London: Sage. Burns, T.C., & Ungerleider, C. (2002). Information and communication technologies
in elementary and secondary education. International Journal of Education Policy Research Practice, 3(4), 27-54.
Burge, K. (1998). School’s Environmental Policies in Fact in Northern Kwazulu–
Natal. Workshop Paper presented at EEASA 1998, Annual Conference 7–10 July. Gaberone.
Brummelhuis, A.C (1995). Models of educational change: The introduction of
computers in Dutch secondary education (Unpublished doctoral dissertation). University of Twente, Enschede.
Bryman, B., & Bell, E. (2001). Business research methods (3rd ed.). Curriculum
Briefing, 5(2), 35-39. Callghan, R. (1999). Solar powered hope for rural schools. Retrieved from
http://www.teacher.co.za/edutech9910/learnovision.html Carl, A. (1995). Teachers’ empowerment through curriculum development: Theory
into Practice. Kenwyn: Juta. Carl, B. (2001). Regional Environmental Education Support (REES) in Southern
Africa, Final draft project document. Copenhagen: Carl Bro Intelligent Solution Carson, R. (1962). Silent Spring. Back Bay, Boston: Houghton Mifflin Hacour. Chai, C.S., Koh, J.H.L., & Tsai, C.C, (2010). Facilitating pre-service teachers’
development of technological, pedagogical and content knowledge (TPACK). Educational Technology and Society, 13, 63-73.

155
Chen, C. H. (2008). Why do teachers not practise what they believe regarding
technology integration? Journal of Education Research, 102, 65-75. Chenje, J. (1999). Proceedings of the EEASA Annual Conference: Enabling
environmental education through environmental education policy and strategy processes in the SADC region. Grahamstown.
Chigona, A., & Chigona, W. (2010). An investigation of factors affecting the use of
ICTs for teaching and learning in the Western Cape schools. 18th European Conference on Information Systems. Research paper, Cape Town.
Chowdhury, M. (2009). ICT Integration Trends and Practices in College Classrooms, Proceedings of EDULEARN09 Conference. 6th–8th July 2009, Barcelona, Spain.
Clacherty, A. (1995). Environmental education policy options for formal education in
South Africa. Johannesburg: Environmental Education Policy Initiative. Coakes, S. J. (2005). SPSS version 12.0 for windows analysis without anguish.
Sydney: John Wiley & Sons, Australia Limited. Cohen , L., & Manion, L. (1994). Research methods in education (4th ed.). London:
Routledge. Cohen L. Manion, L., & Morrison, K. (2007). Research methods in education.
London: Taylor & Francis. Cohen, L., Manion, L., & Morrison, K. (2007). Research Methods in Education. New
York NY: Routledge. Collins, H. et al. (2010). Amalgamation of informal discussions with HE lecturers
from the North West of England. Personal communication 2008-2010. Cox, C. et al., (1999). Collaborative technology development: A Staff Development
Model for Integrating Computers into School Curriculum. Society for Information Technology and Teacher Education.
Cox, M. Preston, C., & Cox K. (1999). “What factors support or prevent teachers from using ICT in their classrooms? Paper presented at the British Educational Research Association Annual Conference, University of Sussex at Brighton. Craig, P. (2002). Advantages and disadvantages of technology. Retrieved from
http://schools.limestone.on.ca/calup/diversity/firsts/techplusandminus.html Craig, D.V. (2001). View from an electronic learning environment: Perceptions and
patterns among students in an online graduate education course. Journal of Educational Technology Systems, (30), 197-219.

156
Creswell, J.W., Plano Clark, V.L., Gutmann, M., & Hanson, W. (Eds. ). (2003). Advanced mixed methods research designs. Thousand Oaks, CA: Sage. Creswell, J.W. (2008). Research design: Qualitative, quantitative, and mixed methods approaches (2nd ed.). Thousand Oaks, CA: Sage. Cronje, J.C. (2000). Paradigms lost. Towards integrating objectivism and constructivism paper for IT Forum. Archived on
http//it.coe.uga.edu/itforum/papae48/paper48.htm. Cuban, L. (1986). Teachers and Machines: The classroom use of technology since
1920. NY: Teachers College Press. Cuban, L. (1993). Computers meet classroom win. Teacher College Record, 95,(2) 185-210. Cuban, L. (2001). Oversold and Underused: Computers in the classroom. Cambridge, MA: Havard University Press. Cukier, K.N. (1998). Proceedings of the 1998 INET Conference: Richman and poor
man: The geopolitics of Internet policy making. Cullen, J. (2005). The ethics of research in educational settings. In P. Adams K. Vossler& C. Scrivens (Eds.), Teachers’ work in Aotearva, New Zealand (pp.
252-261). Southbank, Victoria: Thomson Dunmore Press. Daniels, H.L (2002). Promoting standards, assessment and technology compet encies through digital portfolios. In A.D. Willis, J. Price& N. Davies
(Eds.). Daniels, J.S. (2002). “Foreword” in Information and Communication Technolog y in Education– A Curriculum for Schools and Programme for Teacher Development. Paris: UNESCO. Darling-Hammond, L. (1997). The right to learn: A blueprint for creating schools that
work. San Francisco: Jossey- Bass Davies, N.E., & Tearle, P. (1998). A core curriculum for tele–matics in teacher training. Tele–teaching 98 Conference, Vienna. Retrieved from http://www.ex.ac.uk/telematics/T3/corecurrentteach98.htm Davis, N., & Selinger, M. (1998). Connecting the learning opportunity in educat ion in
using information technology effectively in teaching and learning. London: Routledge. Davis, N., Preston, C., & Sahin, I. (2009). Training teachers to use new technologies
impacts multiple ecologies: Evidence from a national initiative. British Journal of Education Technology, 40(5), 861-878.

157
Department of Arts, Culture, Science & Technology (DACST). (1996). White Paper on Science and Technology. Pretoria: Government Printers. Department of Basic Education. (2001).Strategy for Information and comm unication technology in Education. Report prepared for Departments of Education and Communication, Pretoria: Government Printers. Department of Basic Education. (2003). Draft White Paper on e–Education. Transforming Learning and Teaching through ICT. Pretoria: DoE. Drent, M., & Milissen, M. (2008). Which factors obstruct or stimulate teachers to use ICT innovatively? Computer & Education, 51, 187-199. Duderstadt, J.J. Atkins, D.E., Brown, J.S., Gromory, R.E., Hasselmo., ... et al. (2002) . Preparing for the revolution: Information Technology and the future Research University. Washington, D.C: National Academic Press. Dexter, S., & Riedel, E. (2003). Why improving pre–service teacher educational technology preparation must go beyond college’s walls. Journal of Teacher Education, 54(4),334-346. Earle, R. S. (2002). The integration of instructional technology into public Education: Promises and Challenges. Educational Technology, 42(1), 5-13. EEASA.( 2002). Gaborone Declaration. A working document prepared by the 20th
Annual International Conference of the Environmental Education Association of Southern Africa (EEASA), Gaborone: EEASA. Erah, P. O. (2006). Introduction to e–learning protocols. Paper presented at
ETF capacity building workshop for lecturers of Universities in Nigeria at the University of Uyo.
Ertmer, P. A. (2010). “Teacher Technology Change: How knowledge, confidence,
beliefs and culture intersect?” Journal of Research on Technology, 42(1), 5–13. Ertmer, P.A., & Otternbreit-Leftwich, A.T. (2013). Removing obstacles to the
pedagogical changes required by Jonassen’s vision of authentic technology-enabled learning. Computers and Education, 64, 175–182.
Fabry, D., & Higgs, J. (1997). Barriers to the effective use of technology in
Education. Journal of Educational Computing, 27(4), 385-395. Fanni, F., Rega, I., & Cantoni, L. (2013). Using self–efficacy to measure primary
school teachers’ perception of ICT results from two studies. International Journal of Education and Development Using Information and Communications Technology (IJEDICT), 9(1), 100-111.
Farrell, G., & Issacs, S. (2007). Survey of ICT and Education in Africa. A Summary
Report, Based on 53 Country Surveys. Washington, DC: Info/Dev World Bank.

158
Feenberg, A. (1999). Questioning technology. London; Routledge. Fensham, P. (1978). Stockholm to Tbilisi– the evolution of environmental education.
prospects. UNESCO,. 7(4). Fien, J. (1993). Education for the environment: Critical curriculum theorising
environmental education. Geelong: Deakin University Press. Fien, J., ed.(1995).Teaching for a Sustainable World. The UNESCO–UNEP.
International Environmental Education Programme for Teacher Education. Brisbane: Griffith University.
Fisher, (2006); Nivala, (2009); Educational transformation: Education and
Information Technologies 11(3), 293-303. Education and ICT in Finnish Information Society Strategies. Media, Culture & Society, 31(3), 433–448.
Flecknoe, M. (2002). How can ICT help us improve education? Innovations in Education & Teaching International, 39(4), 271-280. Flecther, J.D., & Tobias, S. (2005). The multimedia principle. In R.E. Mayer (Ed.),
The Cambridge Handbook of Multimedia Learning (pp. 117-134). Cambridge: Cambridge University Press.
Fowler, D.L., Hogle, N. J., & Roh, M.S., (2006). The use of wireless entry of data into
database via internet. 2002, 16(1), 221–223. Fullan, M. G. (1991). The new meaning of educational change. New York: Teachers’ College Press. Fullan, M. (2001). Leading in a culture of change. San Francisco: Jossey–Bass. Fullan, M. (2007). The new meaning of educational change (4th ed.). New York: Teachers’ College Press. Garrison, R., & Anderson, T. (2003). E–Learning in the 21st century: A framework for
research and practice. London: Routledge Falmer. Gee, J.P. (2011). Language and learning in the digital age. New York: Routledge Gibson, I. W. (2002). At the intersection of technology and pedagogy: considering styles of learning and teaching. Journal of ICT for teacher Education, 10(12), pp. 37-61. Giddens, A. (2000). An introduction to a social theorist. Oxford: Blackwell. Gilbert, J. (2005). Catching the knowledge wave? The knowledge society and future of education. Wellington NZ: NZCER Press.

159
Grabe, M., & Grabe, (1998). Integrating technology for meaningful learning. (2nd Ed.). Boston: Houghton Mufflin.
Granger, C. A., Morbey, M. L., Lotherington, H., Owston, R. D.,& Wideman, H.H. (2002). Factors contributing to teachers’ successful Implementation of IT. Journal of Computer Assisted Learning, 18(4), 480-448. Granger, S. (2002). A bird’s eye view of learner corpus research. In S. Granger, J. Hung& S. Petch-Tyson S. (Eds.), Computer learner corpora, second
language acquisition and foreign language teaching(pp.3-33). Amsterdam: John Benjamin
Grewan, R. (2002). Working together to integrate technology into schools. Hargreaves, A. (1994). Changing teachers changing times: Teachers’ work and
culture in the postmodern age. New York: Teachers College Press. Harris, A.L., & Rea, A. (2009). Web 2.0 and virtual world technologies: A growing
impact on IS education. Journal of Information Systems Education, 20(2), 137-144.
Hare, H. (2007). “ICT education in Tanzania”, in Farrell, G. Isaacs S. and Trucano, M. (ed.). Survey of ICT and education in Africa: 53 Country Reports, DC: info Development World bank, Washington. Henderson, K., & Tilbury, D. (2004). Whole school approaches to sustainability: An intervention review of sustainable school programs. Halverson, R. (2009). Rethinking education in the age of technology: The digital
revolution and schooling in America. New York: Teacher College Press. Hawkins, G. (1987). From awareness to participation: New directions in outdoor
experience. Geography, G A, 72(3), 217–222. Hennessy.S., Ruthven, K.,&Brindley, S. (2013).Teacher perspectives on integrating
ICT into subject teaching: Commitments, constraints, caution and change. Journal of Curriculum Studies, 36(7), 1–16.
Hepp, K. P., Hinostroza, S. E., Laval, M. E., & Rehbein, L. F. (2004). Technology in
schools: Education, ICT and the Knowledge Society. OECD. wwwl.worldbank.org/education/pdf/ICTreportoct04a.pdf Hermans, R., Tondeur, J., van Braak, J., & Valcke, M. (2008). The impact of primary
school teachers’ educational beliefs on the classroom use of computers. Computer and Education, 51, 1499–1509.
Herselman, M.E., & Hay, H.R.(2003). Challenges posed by Information and
communication technologies (ICT) for South African Higher Education Institutions. Information Science, 931-943.

160
Hew, K.F., & Brush, T. (2007). Integrating technology into K–12 teaching and
learning: Current knowledge gaps and recommendations for future research. Educational Technology Research & Development, 55, 233–253.
Higgins, M. (2000). “Divergent Messages in a Converging World”. The Information
Society, 16, 49–63. Higgins, S., & Moseley D. (2001).Teachers’ thinking about Information and
communications technology and learning: Beliefs and Outcomes. Teacher development, 191-210.
Higgins, S. (2001). ICT and teaching for understanding. Evaluation and Research in
Education, 15(3), 140, 164–71. Hitchcock, H., & Hughes, D. (1995). Research and the teacher (2nd ed.). London:
Routledge. Howie, S.J. (2010). ICT-supported pedagogical policies and practices in South Africa
and Chile: emerging economies and realities. Journal of Computer Assisted Learning, 26(6), 507-522.
Hsu, P., & Sharma, P. (2008). A case study of enabling factors in technology
integration process. Educational Technology & Society, 11(4), 213-228. Hutchison, A.C., & Reinking, D. (2001). Teachers ’perceptions of integrating
information and communication technologies into literacy instruction: a national survey in the U.S. Reading Research quarterly, 46, 312-333.
ICT and education activities supported by USAID. November 13, 2006: A guide to
ICT and education. Issacs, S. (2007). ICT in education in South Africa. Cape Town: JC Juta. Ishaq, A. (2002). On the global digital divide. [online]. Available from
http://www.inf.org/external/pubs/ft/fandd/2001/09/ishaq.htm . Janse van Resenburg, E. (1995). Environmental education and research in Southern
Africa: A landscape of shifting priorities. Jonassen, D., & Reeves, T. (1996). Learning with technology: Using computers as
cognitive tools. In Jonassen (Ed.), Handbook of Research Educational on Educational Communications and Technology, 693–719. New York: Macmillan.
Jonassen, D. (2000). Computer as mind tools for schools. New Jersey: Prentice Hall,
Inc. Jonassen, D., Howland, J., Marra, R., & Crismond, D. (2008). Meaningful learning
with technology. New Jersey: Pearson.

161
Jonassen, D., Howland, J., Marra, R., & Crismond, D. (2010). How does technology facilitate learning? Learning from technology. Upper Saddle River, NJ: Pearson, Prentice Hall. Retrieved from http://www.education.com/reference/article/how–does
Joubert, T. (1994). The integration of environmental education into formal education.
Pretoria: EEPI. ( Environmental Education Policy Initiative). Education Working Group.
Joyce, B. & Weil, M. (2003). Models of teaching (7th ed.). Englewood Cliffs, NJ:
Prentice Hall. Judson, E. (2006). How teachers integrate technology and their beliefs about
learning: Is there a connection? Journal of Technology and Teacher Education, 14(3), 581-597.
Lawless, K.A., & Pellogrino, J.W. (2007). “Professional development in integrating
technology into teaching and learning: knowns , unknowns and ways to pursue better questions and answers”. Review of Educational Research, 77, 575-614.
Kaffash, H. R., Kargiban, Z. A., Kargiban, S. A., & Ramezani, M. T. (2010). A close
look into the role of ICT in education. International Journal of Instruction, 3(2), 64-82.
Kankaaranta, M., & Phuhakka, E. (2008). Towards the use of ICT in education.
International SITES 2006 survey results. University of Jyvaskyla: Institute for Educational Research.
Khan, B.H. (1997). Web-based instruction. Educational Technology Publications Koehler, M.J., Mishra, P., & Yahya, K. (2007). Tracing the development of teacher
knowledge in a design seminar: Integrating content, pedagogy and technology. Computers and Education, 49(3), 740-762.
Kollberg, M., & Dreyer, H. (2006). Exploring the impact of ICT integration in supply
chain control: a research model. Department of Production and Quality Engineering, Norwegian.
Kozma, R. (2002). ICT and educational reform in developing countries. OECD.
Available from http://web.udg.edu/tiec/orals/c17.pdf Kozma, R. B. (2005). National policies that connect ICT–based education reform to
economic and social development: An interdisciplinary journal of humans in ICT environment, 1(2), 117-156.
Larson, A. (2008). Pedagogical practices and ICT use around the world: Findings
from the IEA international comparative study SITE 2006. Paper presented at the ECER 2008, September 10-12, 2008.

162
Cuban, L., & Geoghehan, W. (Eds.). (1994). Technology, curriculum and professional development: Adapting schools to ….. In D.M. Carey& P. Sale, The Jasper Project: Lessons in curriculum, instruction, assessment and professional development.
Lau, B. T., & Sim, C. H. (2008). Exploring the extent of ICT adoption among secondary school teachers in Malaysia. International Journal of Computer and IT Research, 2(2), 19-36.
Law, N., Pelgrum, W., & Plomp, T. (Eds.). (2008). Pedagogy and ICT use in schools
around the world: Findings from IEA SITES 2006 study. Hong Kong: Comparative Education Research Centre, Springer.
Levin, T., & Wadmany, R. (2006). Teachers beliefs and practices in technology-
based classrooms; A developmental view. Journal of Research on Technology in Education, 39, 417-447.
Lim, C. P. (2007). Effective integration of ICTs in Singapore schools: Pedagogical
and policy implications. Education Technology Research Development, 55, 83-116.
Littlejohn, A., Margaryan, A., & Vojt, G. (2010). Exploring Students’ use of ICT and
Expectations of Learning Methods. Electronic Journal of e-learning, 8(1) 13-20. Littlejohn, A., & Pegler, C. (2007). Preparing for blended e-learning. London:
Routledge. Lotz, H.B. (1999). Developing curriculum frameworks: An enabling orientation.
Howick: SADC Regional Environmental Education Programme. Lotz, H., & Janse van Rensberg, E. (1998). Course curriculum in environmental
education. In Garret, T. Cyr& D. McColaugh (Eds.), EEASA 1998: Environmental Education in the 21st Century. Gaborene: University of Botswana.
Loubser, C. P. (1994). Environmental education in primary schools in South Africa.
Pretoria: University of South Africa. Loveless, A. (2003). The interaction between primary teachers’ perception of ICT
and their pedagogy. Education and Information Technologies, 8, 313–326. Loveless, A. M. (2008). Creative learning and new technology? A provocation paper.
In J. Stefon–Green (Ed.), Creative learning (pp. 61-72). London: Creative Partnerships.
Lowther, D. L., Inan, F. A., Strahl, J. D., & Ross, S. M. (2008). Does technology
integration work when key barriers are removed? Education Media International, 45, 195-213.

163
Lupele, J.K. (2002). Introducing the Monograph. In J. Lupele (Ed.), Monograph: Cases of course development in environmental and sustainability in education in Southern Africa (pp.6-13).
. Lu tz–Sisitka, H., & Raven, G. (2001). Active learning in OBE: Environmental
learning in South African Schools. Report of the National Environmental Education Programme–– GET Pilot Research Project. June, 2001. Pretoria: Department of Basic Education.
Lu, Z. Hou, L., & Huang, X. (2010). A research on a student–centred teaching model
in an ICT–based English audio–video speaking class. International Journal of Education and Development Using Information and Communication Technology, 6, 101-123.
Mackenzie, N., & Knipe, S. (2006). Research dilemmas: Paradigms, methods and
methodology. Issues in Educational Research, 16(2), 193-205. Available from http://www.iier.org.au/iier16/mackenzie.html.
Mackenzie, J. (1999). The Research Cycle, (9)4. Available from
http://questioning.org/rcycle.html. Marcinkiewicz, H. K. R. (1994) Computers and Teachers: Factors Influencing
Computer Use in the Classroom. Journal of Research on Computing in Education, 26(2) , 220-237.
Marks, J. R., & Stoops, J.K. (1989). Handbook of Educational Supervision: A guide
for a practitioner (3rd ed.). Boston, MA: Allyn and Bacon. McCormick, R., & Scrimshaw, P. (2001). Information and communications
technology, knowledge and pedagogy. Education, Communication and Information, 19(1), 37-57.
McLean, G. N., & McLean, l. (2001). If we can’t define HRD in one country, how can
we define it in an international context? Human Resource Development International, 4(3), 313-326.
Mc Neil, L. (2002). Contradictions of School Reform: Educational Costs of
Standardized Testing. New York: Routledge. Mcmahon, M., Forde, C., & Martin, M. (2011). Introduction: Contemporary Issues in
Learning and Teaching. In M. McMahon, C. Forde& M. Martin (Eds), Contemporary Issues in Learning and Teaching (pp. 1–10). London: Sage.
Mdlongwa, T. (2012). Information and Communication Technology (ICT) as a means
of enhancing education in schools in South Africa: challenges, Benefits and recommendations. Africa Institute of South Africa. Policy Briefing no. 80, August, 2012. Avaialable from http://www.ai.org.za/wp–content/uploads Mertens, D. M. (2005). Research methods in education and psychology: Integrating diversity with quantitative and qualitative approaches (2nd ed.). Thousand Oaks: Sage.

164
Mfum–Mensah, O. (2003). Technology for all? Computers in Ghanaian Secondary
Schools: Where does equality come in? Current Issues in Comparative Education, 6(1).
Mitchell, P.D. (1997). The impact of educational technology: A radical reappraisal of
research methods. Research in Learning Technology, 5(1), 48-54. Moonen, J. (2008). Evolution of IT and related educational policies in international
organizations. In J. Voogt & G. Knezek (Eds.), International handbook of Information Technology in Primary and Secondary education (pp. 1071-1082). Berlin: Springer Verlag.
Monk, M. (1999). In-service for teacher development in sub-Saharan Africa: a review
of literature published between 1983-1997. London: DFID. Monroe, M. et al. (1993). Toolbox Series 1–5. Ann Arbor: NCEET. Mumtaz, S. (2002). Factors affecting teachers’ use of Information and
communications technology: A review of the literature. Information Technology for Teacher Education, 9(3), 319–342.
Naisbit, J. (1995). Global Paradox. Naisbit, J., Phillips, D., & Naisbit, N. (1999). High tech high touch: Technology and
our search for meaning. London: Nicholas Brealey. National Environmental Education Project for General Education and Training Band.
Pretoria: DoE. NEEP. (2002). Partnerships in the Environment: Guidelines and issues regarding
resources in support of National Curriculum Statement (NCS) through NEEP-GET project. Pretoria: Department of Basic Education.
Neuman, W.L. (1997). Social research methods: Qualitative and quantitative
approaches (3rd ed.). Needham Heights, M. A: Allyn and Bacon. Nihuka, K. A., & Voogt, J. (2011). Instructors’ and students’ competencies,
perceptions and access to e–learning implementation at the open University of Tanzania. International Journal on E–learning, 10(1), 63–85. Available from http://www.editlib.org/p/32413.
Norris, N., Davies, R., & Beattie, C. (1990). Evaluating new technology: The case of
the interactive video in schools (IVIS) program, British Journal of Educational Technology, 2(21), 84-94.
Norton, R., & Wilbung, K. (1998). Teaching with technology. Orlando, Florida:
Harcourt Brace College Publishers.

165
O ‘Donoghue, R., & O’ Donoghue, (2009). SAARMSTE 2009 Conference: Knowledge access in sciences.. Rhodes University, GrahamsTown, South Africa.
OECD. (2002). ICT: Policy and challenges for education. Planning Meeting, Agenda and Issue Paper. https://www.oecd.org/LongAbstract on December 2009.
Oldfield, A. (2010). A summary of teacher attitudes to ICT use in schools. Futurelab,
iTEC Project. Available from http://itec.eun.org. Omollo, D. O., Indoshi, F. C., & Ayere, M.A. (2013). Attitudes of teachers and
students towards the use of ICT in implementation of Biology curriculum in selected schools. Research Journal in Organizational Psychology & Educational Studies, 2(3), 76-83.
Oppenheim, A. (1992). Questionnaire design, interviewing and attitude
measurement. London: Printers. Owusu–Ansah, S. (2013). Application of ICT: a comparative analysis of male and
female academics in Africa. Library Philosophy and Practice 1087. Palak, D., & Walls, R.T. (2009). Teachers’ beliefs and technology practices: A mixed
method approach. Journal of Research on Technology Education, 41, 157-181. Partnership for 21st Century Skills. (2011). Framework for 21st Century Learning.
Online Published document. Avalable from www.P21.org Pea, R. D. (1993). Practices of distributed intelligence and designs for education. In
G. Salomon (Ed.), Distributed cognitions: Psychological and educational considerations. Cambridge: Cambridge University Press.
Pedro et. Al. (2004). Technology in schools: Education, ICT and the Knowledge
Society. Pelgrum, W. J. (2001). Obstacles to the integration of ICT in education: results from
a worldwide educational assessment. Computers and Education, 37, 163-178. Pelgrum, W., Anderson, R., Law, N., & Quale, A. (Eds.). (2003). Cross national
information and communication technology policies and practices in education. Greenwich, Connecticut : IPA.
Pelgrum, W. J., & Law, N. (2003) “ICT in Education around the world: Trends,
Problems and Prospects. UNESCO- International Institute for Education and Planning. Available from www.worldcatlibraries.org/wcpa/ow/o2d77080fcf32109/9afeb4da09e526.html.
Petrina, S. (2003). The educational technology is technology education manifesto.
Journal of Technology Education, 15(1), 63-73.
166
Plomp, T., Brummelhuis, A.C.A., & Rapmund, R. (1996). Teaching and learning for the future. Report of the Committee on Multi Media in Teacher Training. Den Haag: SDU.
Rapetti, E., & Cantoni, L. (2012). Proceedings of European Distance and E–learning
Networks: Reconsidering “Gen Y” & Co: from minding the mind gap to overcoming it.. Porto, Portugal.
Rastogi, A., & Malhotra, S. (2013). ICT skills and attitudes as determinants of ICT
pedagogy integration. European Academic Research, 1(3), 301-318. Available from http://www.fets.info/journals/10/1/14pdf.
Report prepared by Macquarie University for Australian Government Department of
The Environment and Heritage. Sydney, NSW: Macquarie University. Available from http://wwwaries.mq.edu.au/project.htm .
Richardson, J. (2000). ICT implementation in education: an analysis of
implementation strategies in Australia, Canada, Finland and Israel. Luxembourg: Ministry of Education.
Reid, S. (2002). The integration of ICT into classroom teaching. Alberta Journal of
Educational Research, 48, 30-46. Rogers, L.T. (1995). The computer as an aid for exploring graphs. School Science
Review, 76(276), 31-39. Rosenburg, M. J. (2001). E-Learning strategies for delivery knowledge in the digital
age. New York: McGraw–Hill; 2001. Ross, S. M., Morrison, G. R., & Lowther, D. L. (2010). Educational technology
research past and present: Balancing rigor and relevance to impact school learning. Contemporary Education Technology, 1(1), 17-35.
Russel, G., & Bradley, G. (1997). “Teachers’ computer anxiety; implications for
professional development. Education and Information Technologies, 2(1), 17-30.
Sadik, A. (2005). Factors influencing teachers’ attitude towards personal use of computers: New Evidence from a Developing Nation. Education Review, 2(1), 1-29.
Saide Report.(2001). Focusing and Supporting Policy Development by providing a
broad range of services in the field of educational technology. Salomon, G. (Ed.). (1993). Distributed cognitions: Psychological and educational
considerations. Cambridge: Cambridge University Press. Sandholtz, J., Ringstaff, C., & Dwyer, D. (1997). Teaching with technology: Creating
student centred classrooms. New York: Teachers ’College Press.

167
Sansanwal, D.N. (2009). Use of ICT in Teaching– Learning & Evaluation, Educational Technology – Lecture Series, State Institute of Education, Chandigarh, India, Feb, 27, 2009.
Schatzman, L., & Srauss, A. (1973). Field research: strategies for a natural
sociology. Englewood Cliffs: Prentice Hall. SchoolNet. (2006). Modules that are intended to user friendly and offer a wide range
of technical services and implementation. Schreuder, D. R. (1995). Environmental Education at crossroads: Rhetoric and
reality in educational reconstruction in South Africa. Paper presented at NAAEE. Conference, Portland Maine, USA.
Schumacher, S., & McMillan, J. H. (1993). Research in Education: A conceptual
Introduction. New York: Happer Collins Publications. Schunk, D.H., & Pajares, F. (2009). Self-efficacy theory. In K.R. Wentzel & A.
Wigfield (Eds.), Handbook of motivation at school (pp. 35-54). New York: Routledge.
Scrimshaw, P. (2004). Enabling Teachers to Make Successful Use of ICT. Available
from http://www.becta.org.uk/page.documents/research/enablers.pdf Seabag, J.R. (1988). Utilizing sampling procedures. In R.M. Grinnel (Ed.), Social
work research and evaluation (3rd ed.) (pp. 240-257). Itasca, IL: Peacock. Selwyn, N., & Fitz, J. (2001). The national grid for learning: a core study of new
labour education policy making. Journal of Education Policy, 16(2), 127-147. Semenov, A. (2005). Information and communication technologies in schools: a
handbook for teachers. Paris: UNESCO. Shamoo, A., & Resnik, D. (2009). Responsible conduct of research (2nd ed.). New
York: Oxford University Press. Shulman, M. (2004). Superintendent conceptions of instructional conditions that
impact teachers’ technology integration. Journal of Research on Technology in Education, 36(4), 319-343.
Somekh, B., & Davies, R.(1991). Towards a pedagogy for information and
technology. The Curriculum Journal, 2(2), 153-70. Squazzin, T. (2002). Getting to grips with NEEP. An Introduction to South Africa’s
National Environmental Education. Project for General Education and Training Band. Pretoria: DoE.
Tapscott, D. (1998). Growing up digital: The Rise of the Net Generation. McGrawHill: New York.

168
Tashakkori, A., & Teddlie, C. (2003). Mixed methodology: Combining qualitative and qualitative approaches. In A. Tashakkori& Teddie. C. (Eds), Handbook of mixed methods in social and behavioural research. California: Sage. Teo,T. (2006). Attitudes towards computer: A study of post-secondary students in Singapore. Journal of Teacher Education. Tilbury, D. (1995). Environmental education for sustainability: defining the new focus of environmental education in the 1990s. Educational Research, 1(2), 195-212. Tinio, V.L. (2002). ICT in education: UN Development Programme. Available from
http:www.eprmers.org. Tondeur, J., Valcke, M., & van Braak, J.V. (2008). A multidimensional approach to
determinants of computer use in primary education: Teacher and school characteristics. Journal of Computer Assisted Learning, 24(6), 494-506.
Tondeur, J., Van Keer, H., Van Braak, J., & Valcke, M. (2008). ICT integration in the
classroom: Challenging the potential of a school policy. Computers and Education, 51, 212-223.
Tonduer, J., van Braak, J., & Valcke, M. (2007). Towards a typology of computer
use in primary education. Journal of Computer Assisted Learning, 23(3), 197-206.
Twigg, C.A. (1996). Is technology a silver bullet? Educom Review, 31(2). UNESCO. (2009). Bonn declaration in: World conference on education for
sustainable development. Available from http://www.esd-world-conference-2009.org/.
UNESCO. (2002). Information and Communications Technology in Education. A
Curriculum for Schools and Programme for Teachers Development. Paris: UNESCO.
Usher, L.E., Richardson, W.J., & Fanni, F. (2011). Proceedings of European
Association for Research on Learning and Instruction: Towards a new motivational-base model of motivation adoption. Exerter, United Kingdom.
Vanderlinde, R., & van Braak, J. (2009). Educational technology on a turning point:
Curriculum implementation and challenges for schools. Educational Technology Research and Development, 57(4), 573-584.
Vockell, E.l., & Asher, J.W. (1995). Educational research (2nd ed.). Englewood Cliffs:
Prentice Hall. Voogt, J,. & Knezek, G. (2008). IT in Primary and Secondary education: Emerging
issues. In J. Voogt& G. Knezek (Eds.), International handbook of information technology in Primary and Secondary education. New York: Springer.
169
Vygotsky, L.S. (1978). Mind and society. The development of higher mental
processes. Cambridge, MA: Harvard University Press. Wallen, N.E., & Fraenkel, J.R. (2001). Educational research: A guide to the process
(2nd ed.). Mahwah, NJ : Lawrence Erlbaum Associates Publishers. Watson, D. (2006). Understanding the relationship between ICT and education as a
means of exploring innovation and change. Education and Information Technology, 31(3), 307-320.
Watts-Taffe, S., Gwinn, C.B., & Horn, M.L. (2003). Preparing pre-service teachers to
integrate technology with the elementary literacy programme. The Reading Teacher, 57, 13-138.
Webb, M., & Reynolds, N. (2012). Current and future research issues for ICT in
education. Journal of Computer Assisted Learning VOL, PAGES Weert, T.V., & Tatnal, A. (2005). Information and communication technology and real
life learning: New education for the new knowledge society. New York: Springer.
Wester, K.L. (2011). Publishing ethical research: A step-by-step overview. Journal of
Counselling and Development, 89(3), 301-307. Yates, D. (2001). Project management for information systems. England: Prentice
Hall. Yellend, N. (2001). Teaching and learning with ICT for numeracy in the early
childhood and primary years of schooling. Australia: Department of Education, Training and Youth Affairs.
Young, A.C. (1997). Higher-order learning and thinking: What is it and how is it taught? Educational Technology, 37(4), 38-41. Yusuf, M.O. (2005). Information and communication education: Analysing the Nigerian national policy for information technology. International Education Journal, 6(3), 316-321. Zhang, P., & Aikmans, S. (2007). Attitudes in ICT Acceptance and Use. In J. Jacko (Ed.), Human- Computer Interaction, 1(1), 1021-1030. Syracuse, New York: Springer. Zhao, Y., & Cziko, G.A. (2001). Teacher adoption of technology: a perceptual of
control theory perspective. Journal of Technology and Teacher Education, 9(1), 5-30.

170
APPENDIX A: RESEARCH QUESTIONNAIRE- TEACHERS
Date: ____________________
Email ____________________
Phone No: ________________
INTRODUCTION
This is an M Ed research questionnaire which aims at investigating the impact of
Information and Communications Technology (ICT) on effective teaching of
Environmental Education (EE) in rural high schools. Kindly be open and free as
possible. Be assured that absolute confidentiality will be adhered to, and under no
circumstances will your details be revealed to a third party.
INSTRUCTION
Read each question carefully. The questions are followed by possible answers. For
each question you read, there are indications on the number of possible choices.
Tick in the appropriate box(es) next to the answer of your choice. Kindly respond to
all questions to the best of your ability. Your honesty will be appreciated.
BACKGROUND INFORMATION
Please indicate your gender by ticking an (x) in the spaces provided.
Male
Female
Please indicate your highest qualification by ticking an(x) in the spaces provided.
Masters Degree
Honours
Bachelors Degree
Post-matric Diploma

171
How many years of work experience do you have as offering EE in subject content
teaching? Indicate by ticking an (x) in the spaces provided.
Less than 6 months
6 months to 2 years
2 years to 5 years
5 years to10 years
More than 10 years
RESEARCH QUESTIONS
Please tick in the appropriate boxes. The responses range from Strongly Agree with
the highest numerical value of 4, to Strongly Disagree with the least numerical value
of 1.
SA- Strongly Disagree= 4, A- Agree= (3), D- Disagree= (2) and SD= Strongly
Disagree (1).
How can ICT be effectively be used in rural high schools to improve teaching EE?
S/N ITEMS SA A D SD
1 ICT can
improve the
teaching of
EE
2 ICT plays a
transformative
role in
teaching EE
3 ICT enhances
learners’
participation
and feedback
to teachers
4 ICT offers

172
opportunities
for educators
in obtaining
educational
resources to
improve the
teaching of
EE
What are the availability of ICT resources in teaching EE?
S/N ITEMS SA A D SD
1 My school has
been able to
acquire
suitable
software and
hardware
2 My school is
connected to
the internet
3 ICT tools are
properly
equipped in
practice rooms
to teach EE
4 My school has
proper
procedure for
communicating
to learners
online

173
What are teachers’ attitudes towards the use of ICT tools in teaching EE?
S/N ITEM SA A D SD
1 Readiness and
confidence in
using ICT tools
2 Teachers
enthusiastically
engage in ICT
projects in
teaching EE
3 Lack of
autonomy to
evaluate and
use ICT in
teaching EE
4 It is very
important to
work with ICT
tools to teach
EE

174
How efficiently do teachers use ICT tools in teaching EE?
S/N ITEM SA A D SD
1 Strategists
exist to help
teachers
learn how to
use ICT in
teaching EE
2 Teachers
are provided
with training
and
professional
development
with regard
to the usage
of ICT
3 Majority of
educators
have ICT
equipment
for use in
their
classrooms
4 Adequate
preparation
for the
effective
usage of
ICTs in
teaching EE

175
End of questionnaire. Thank you for your time, which I acknowledge is precious at
this time of the year.

176
APPENDIX B: LETTER OF CONSENT
Dear Colleague,
I am seeking your permission for you to complete these questions on the above topic
in relation to your application of ICTs in your teaching of EE. Please understand that
your participation in this study is voluntary and you have the right to withdraw at any
time. Your responses will be kept strictly confidential and used for academic
purposes only. There is no wrong or right answers to any of the questions as such;
feel free to express yourself to the best of your knowledge.
I shall return on --------------------- to collect the completed questionnaire.
Yours sincerely
Akosua A. Osei

177
APPENDIX C: ETHIC CLEARANCE CERTIFICATE
178

179
APPENDIX D: LETTER OF PERMISSION FROM THE DEPARTMENT

180
APPENDIX E: INFORMED CONSENT FORM
Ethics Research Confidentiality and Informed Consent Form
Our University of Fort Hare Faculty of Education is asking teachers from your school
to answer some questions, which we hope will benefit your community and possibly
other schools in the future.
The University of Fort Hare Faculty of Education is conducting research regarding
THE IMPACT OF INFORMATION AND COMMUNICATIONS TECHNOLOGY (ICT)
IN TEACHING ENVIRONMENTAL EDUCATION. We are carrying out this research
to help the rural high schools in the East London District of South Africa integrate
ICT as a tool in teaching.
Please understand that you are not being forced to take part in this study and the
choice whether to participate or not is yours alone. However, we would really
appreciate it if you do share your thoughts with us. If you choose not take part in
answering these questions, you will not be affected in any way. If you agree to
participate, you may stop me at any time and tell me that you do not want to go on
with the interview. If you do this, there will also be no penalties and you will NOT be
prejudiced in ANY way. Confidentiality will be observed professionally.
Your name will not be recorded anywhere on the questionnaire and no one will be
able to link you to the answers you give. Only the researchers will have access to the
unlinked information. The information will remain confidential and there will be no
“come-backs” from the answers you give.
181
The interview will last around 45 minutes where you will be asked questions. Be as
open and honest as possible in answering these questions. Some questions may be
of a personal and/or sensitive nature, and one questions that you may not have
thought about before, which also involve thinking about the past or the future. We
know that you cannot be absolutely certain about the answers to these questions,
but we ask that you try to think about these questions. When it comes to answering
questions there are no right and wrong answers. When we ask questions about the
future we are not interested in what you think the best thing would be to do, but what
you think would actually happen.
If possible, our organisation would like to come back to this area once we have
completed our study to inform you and your community of the results and discuss
our findings and proposals around the research and what this means for people in
this area.
INFORMED CONSENT
I hereby agree to participate in research regarding THE IMPACT OF ICT IN
TEACHING ENVIRONMENTAL EDUCATION. I understand that I am participating
freely and without being forced in any way to do so. I also understand that I can stop
this interview at any point should I not want to continue and that this decision will not
in any way affect me negatively.
I understand that this is a research project whose purpose is not necessarily to
benefit me personally.
I have received the telephone number of a person to contact should I need to speak
about any issues which may arise in this interview.
I understand that this consent form will not be linked to the questionnaire, and that
my answers will remain confidential.

182
I understand that if at all possible, feedback will be given to my community on the
results of the completed research.
……………………………..
Signature of participant Date:…………………..
I hereby agree to the tape recording of my participation in the study.
……………………………..
Signature of participant Date:…………………..

183
APPENDIX F: LANGUAGE EDITING CERTIFICATE
Related Documents