The impact of honing process parameters on the surface quality of cylinder liners Sofia Edberg Erik Landqvist Master’s Thesis at Department of Production Engineering KTH Royal Institute of Technology, Stockholm, Sweden Supervisors: Andreas Archenti, KTH and Björn Lindbom, Scania CV AB Examiner: Mihai Nicolescu, KTH

Welcome message from author
This document is posted to help you gain knowledge. Please leave a comment to let me know what you think about it! Share it to your friends and learn new things together.
Transcript

The impact of honing process parameters
on the surface quality of cylinder liners
Sofia Edberg
Erik Landqvist
Master’s Thesis at Department of Production Engineering
KTH Royal Institute of Technology, Stockholm, Sweden
Supervisors: Andreas Archenti, KTH and Björn Lindbom, Scania CV AB
Examiner: Mihai Nicolescu, KTH


Abstract
During recent years, legislation regarding emissions and fuel consumption levels for
the automotive industry has become increasingly comprehensive. In order for
automotive manufacturers to reach the demands, engine friction needs to be reduced.
The cylinder liner is considered to be one of the most critical engine components
regarding friction and high demands are put their surface texture.
No process has been found to create efficient cylinder liners as good as honing.
Honing is an abrasive process, using three simultaneous movements of abrasive
stones to remove material and create grooves. Since honing is an abrasive process,
analytical prediction of the process outcome is difficult. In order to describe the
process, empirical modeling has to be applied.
The objective of this thesis is to, by using design of experiments, understand the
honing process in the cylinder liner manufacturing at Scania CV AB and identify
key parameters in the process control connected to surface roughness. Furthermore,
the aim is to find an optimal setting of the machine to produce the demanded surface
texture.
Through screening experiments, five parameters were found to be the most
significant in the process. These parameters were then further investigated in an
optimization test. The results of this test showed that the plateau honing step was of
main importance for the resulting surface texture. The factors with the largest impact
were the honing force and number of strokes used in this operation. The results also
suggested that the reciprocating speed influences the surface parameters and can be
used to decrease the core roughness of the surface without affecting the valley depth
negatively. Due to high correlation between surface parameters, compromises need
to be made in order to find an optimal setting.


Sammanfattning
Under de senaste åren har lagstiftningen gällande utsläpp och bränslekonsumtion för
fordonsindustrin blivit mer omfattande. För att fordonstillverkarna ska kunna möta
dessa krav behöver friktionen i motorerna reduceras. Cylinderfoder har identifierats
som en av de viktigaste motorkomponenterna när det gäller friktion och hårda krav
ställs därför på deras ytstruktur.
Idag är hening den enda bearbetningsmetoden som kan skapa den önskade ytprofilen
hos cylinderfoder. Hening är en slipande bearbetningsmetod som använder tre
simultana rörelser av slipstenar för att bearbeta ytan och skapa repor. Eftersom
hening är en slipprocess så är det svårt att analytiskt förutspå utfallet i processen.
För att beskriva processen måste istället empirisk modellering användas.
Syftet med detta examensarbete är att, med hjälp av metoder för försöksplanering,
skapa en förståelse för heningsprocessen i Scanias cylinderfodertillverkning och
identifiera nyckelparametrar i maskinstyrningen kopplade till ytstrukturen. Vidare så
är målet att hitta optimala inställningar av maskinen för att producera foder med den
rätta ytstrukturen.
Med hjälp av screeningexperiment identifierades fem parametrar som de mest
signifikanta i processen. Dessa parametrar undersöktes sedan ytterligare genom ett
optimeringstest. Resultaten från detta test visade att platåoperationen är viktigast för
den resulterande ytstrukturen. Kraften och antalet slag i detta steg var de parametrar
som visade sig vara mest signifikanta. Resultaten visade också på att slaghastigheten
i platåsteget påverkar ytan och att den kan användas för att minska ytjämnhetens
kärndjup utan att minska ytans daldjup. Eftersom ytparametrarna är
sammankopplade i hög utsträckning måste en optimering innefatta kompromisser
emellan dem.


Acknowledgements
We would like to express our gratitude to our supervisor Andreas Archenti who has
been a great support in guiding us through our thesis work and been available for
valuable discussions.
Thank you Björn Lindbom for giving us the opportunity to work on this interesting
project and for guiding us through our work at Scania.
We would also like to express our gratitude to Mats Bagge who has assisted us in our
experimental design process and has given us a lot of valuable thoughts on the project.
Furthermore, we would like to thank process planner Fredrik Holmberg who has
answered all of our questions regarding the honing process and technician Stefan
Fernqvist who has spent many hours by the machine to help out with our experiments.
Last but not least, we would like to thank our colleagues at Scania who has made the
days at work so enjoyable.


Table of contents
Abstract
Sammanfattning
Acknowledgements
Table of contents
1. Introduction .............................................................................................................. 1
1.1 Cylinder liners ..................................................................................................... 2
1.2 Honing ................................................................................................................. 3
1.3 Surface characteristics ......................................................................................... 7
1.4 Objectives and research questions ..................................................................... 10
1.5 Delimitations ..................................................................................................... 11
2. Problem description ............................................................................................... 13
2.1 The cylinder liner machining ............................................................................. 14
2.2 The finish honing process .................................................................................. 15
3. Methodology ............................................................................................................ 19
3.1 Design of Experiments ...................................................................................... 20
3.2 Factorial experimentation .................................................................................. 23
3.3 Data analysis ...................................................................................................... 28
4. Parameters affecting the process .......................................................................... 31
4.1 Theory ................................................................................................................ 31

4.2 Current process control ...................................................................................... 36
4.3 Parameters to be investigated ............................................................................ 38
5. Experimental procedures....................................................................................... 41
5.1 Screening tests ................................................................................................... 42
5.2 Optimization ...................................................................................................... 49
6. Results and Analysis ............................................................................................... 51
6.1 Effects per surface parameter ............................................................................ 52
6.2 Finding optimal settings .................................................................................... 58
6.3 Analysis ............................................................................................................. 60
7. Conclusions ............................................................................................................. 65
7.1 Future work ........................................................................................................ 66
8. References ............................................................................................................... 69
A1. Test runs Screening 1 ................................................................................................i
A2. Test runs Screening 2 .............................................................................................. ii
A3. Test runs Optimization .......................................................................................... iii

1
1. Introduction
Scania is one of the world’s leading heavy duty truck manufacturers. In 2014,
Scania had a 15.1 percent share of the European market with 33,800 units sold [1].
The company also produces buses and coaches as well as industrial- and marine
engines [2]. Scania is a global company with production sites in Europe, Asia and
Latin America.
Figure 1.1 Scania truck
Trucks, buses and coaches produce five percent of the total emissions of
greenhouse gas within the EU. During recent years, the legislation regarding
emissions has become more comprehensive. The European commission aim to
reduce the greenhouse gas emissions from transport by 60 percent from 1990’s
level by 2050. Nitride oxides and particulate matter are some of the emission
types that are covered by the European legislation. The allowed amount of
emissions has been significantly reduced during recent years as can be seen in
Figure 1.2.

2
Figure 1.2 Emission legislation development for nitride oxides (NOx) and particulate matter
(PM) [3].
In order for modern trucks to keep up with the emission legislation, the
manufacturers have to produce engines with a low level of fuel consumption and
low emissions [4]. A large part of the work is focused on systems for exhaust
treatment but there is also a lot to be gained from optimizing other engine
components. One of these components is the cylinder liner.
1.1 Cylinder liners
In a Scania truck engine, one cylinder liner is mounted inside every cylinder.
Figure 1.3 shows a cross sectional view of a Scania engine with the piston-
cylinder liner ineraction visualized.
Figure 1.3 Scania engine
CHAPTER 1. INTRODUCTION
3
As can be seen in the figure, the piston runs within the cylinder liner. The detailed
view also shows that the space between the liner and the cylinder is filled with
cooling water.
Cylinder liners are among the most critical engine components when it comes to
oil consumption and frictional losses. Researchers have estimated that as much as
40% of the frictional losses in an engine arise from the friction between the
cylinder liner and the piston ring [5]. Therefore, high demands are set on the
surface finish of the liner. In order for the liner to hold a satisfying amount of oil
and to reduce friction between the liner and the piston ring, the surface has to
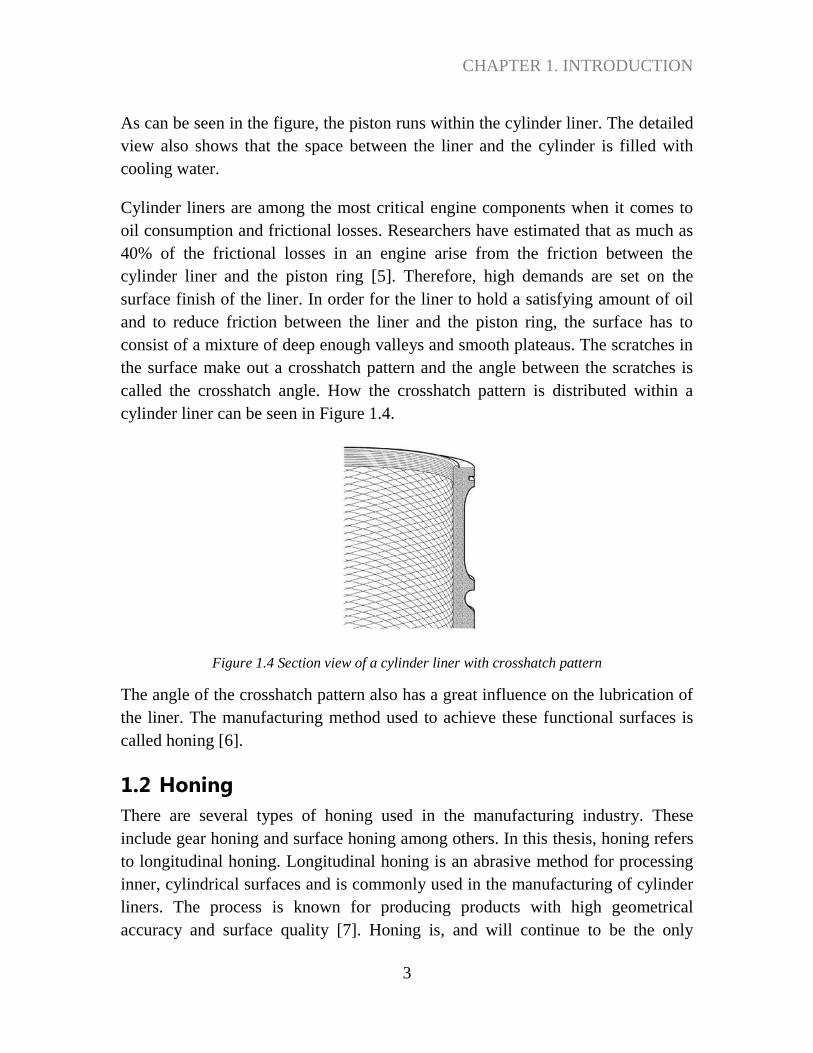
consist of a mixture of deep enough valleys and smooth plateaus. The scratches in
the surface make out a crosshatch pattern and the angle between the scratches is
called the crosshatch angle. How the crosshatch pattern is distributed within a
cylinder liner can be seen in Figure 1.4.
Figure 1.4 Section view of a cylinder liner with crosshatch pattern
The angle of the crosshatch pattern also has a great influence on the lubrication of
the liner. The manufacturing method used to achieve these functional surfaces is
called honing [6].
1.2 Honing
There are several types of honing used in the manufacturing industry. These
include gear honing and surface honing among others. In this thesis, honing refers
to longitudinal honing. Longitudinal honing is an abrasive method for processing
inner, cylindrical surfaces and is commonly used in the manufacturing of cylinder
liners. The process is known for producing products with high geometrical
accuracy and surface quality [7]. Honing is, and will continue to be the only

4
process that can create the demanded surface texture as well as the crosshatch
pattern needed in cylinder liners [6]. During the honing process a tool called
honing head, which is equipped with abrasive stones, is moved through the
cylinder bore. The head is subject to a rotational and reciprocal speed throughout
the operation. While the head is traveling through the cylinder, the honing stones
are simultaneously pressed against the bore wall and are thereby removing
material. This will create the characteristic crosshatch pattern on the surface,
which will serve as channels for lubrication.
In order to create the desired crosshatch pattern with the right honing angle, there
needs to be a correlation between the rotational- and reciprocal speed. This
relationship is described in Equation (1).
1α ah
r
vtan
v
(1)
where αh is half the crosshatch angle, va is the reciprocating speed and vr is the
tangential speed of the honing stones. A graphical representation of the crosshatch
angle can be seen in Figure 1.5.
Figure 1.5 a) Honing head with rotational- and linear movement. b) Crosshatch pattern and
crosshatch angle [7].
The radial feed is achieved by actuators pressing a rod equipped with cones
against the stone attachments. Through this movement, the stones are moved

CHAPTER 1. INTRODUCTION
5
towards the bore surface. The force needed to press the rod downwards can be
generated by hydraulic- or electrical actuators. Figure 1.6 shows the principle of
the two different expansion mechanisms.
Figure 1.6 The different types of feed control in honing [8].
When using an electromechanical actuator, the feed is constant which results in a
constant material removal rate. It is an open loop controlled system, given user-
defined feeding steps. With the hydraulic servo actuator on the other hand, the
stone is fed with a constant pressure resulting in a variation in the material
removal rate. Unlike the electromechanical system, a hydraulic actuator is a
closed loop control system where the feed will be controlled to stay within a user-
defined interval. This makes it possible for the machine to automatically
compensate for operation variations, such as tool wear.
In the beginning of the honing process, the surface roughness is relatively high
from earlier operations. This will result in a low amount of force needed to press
the stone against the surface with a constant feed. As the surface roughness
decreases, the amount of material to be machined will increase. This will in turn,
when using constant feed, lead to an increase in force needed to press the stones
outward. The result will be an increase in force throughout the process. By
controlling the material removal with constant force, the machining system is
more stable and less variation in surface roughness can be detected compared to
processes with constant material removal rate. The process force varying over
time can be seen in Figure 1.7.

6
a) b)
Figure 1.7 Process force over time for constant feed (a) and constant force (b) [9].
As can be seen in the figure, there is a variation in process force in both principles
of control. The controls with constant feed however have an overall increase in
force over time. The joint variation is connected to the longitudinal deformations
that occur during the axial oscillation of the honing head. This oscillation causes a
relative movement between the feeding cone and tool body, resulting in the
variation in force between workpiece and tool [9].
1.2.1 Honing stones
The honing stone contains three material components, abrasives, bonding material
and additives. The abrasives can be divided into two groups, conventional and
super-abrasives. Conventional abrasives are ceramics such as aluminum oxide and
silicon carbide while super-abrasives are made out of diamond or cubic boron
nitride [10]. Diamond grains have been proven to better resist wear and create a
better surface than other abrasives [6]. The size of the abrasive grain varies
depending on the required surface texture and metal removal rate [7]. Larger grain
sizes will increase the material removal rate but lead to a poor surface quality
[11].
The purpose of the bonding material is to fix the abrasive grain during the honing
process. The bonding materials can be of vitreous, organic or metallic types. The
bond should wear at a suitable rate in respect to the abrasive and be able to resist
the large centrifugal forces that can occur during the honing process [10]. It
should also enable worn grains to be removed so that new, sharp, cutting edges
appear [6]. By doing so, the stone is regenerated and its ability to cut is restored.
This means that the stone is able to sharpen itself during production [12].

CHAPTER 1. INTRODUCTION
7
The honing stone is one of the major factors connected to the high variability in
honing processes in general. The grains are inconsistently distributed in the
honing stone, resulting in a variation in number of cutting edges in contact with
the workpiece surface. There is also a size difference between different grains in
the stone, which will create a variance in depth of cut. Other variations that can
occur, in both honing and grinding in general, are material side flow, built up edge
phenomena and vibrations as well as the risk of grains detaching from the stones
and then embedding in the material [13]. During studies made by Malkin and Lee,
a great inconsistency in stone behavior was identified. Differences were found
between different stone sets as well as from stone to stone [14].
Honing stone size and geometry can vary depending on the application. Long
stones in the honing tool have a better ability to create a good cylindricity of the
bore. The material of the honing stone will decide the need for forming the tool
before production. If a ceramic abrasive is used, no forming is needed because the
stone will rapidly adapt to the bore surface. If the stone is of a super-abrasive type,
a forming is required where the stone surface is grinded into the radius wanted on
the bore [11].
1.2.2 Honing oil
A critical part of the honing operation is the honing oil. Additional to the
lubrication, the honing oil contributes by cooling the workpiece and honing tool as
well as by flushing the swarfs away from the cutting process [7]. By keeping the
process at the right temperature, both cylinder liner and stone can be preserved to
ensure quality and lower production cost [6]. The most common fluid used is
mineral oil. This is due to its high viscosity and high flash point. Another benefit
of the oil is that it does not irritate the skin of the machine operators [7].
1.3 Surface characteristics
In order to produce cylinder liners for engines with high demands regarding
emissions and fuel consumption, the surface need to be characterized. There are
multiple surface parameters that can be used to define the surface. Some of the
most frequently used are the mean parameters. The most common one is the
average roughness, Ra. This is, as the name states, an average of the surface
roughness over the sample length [15]. The parameter is described according to
Equation (2) [16].

8
0
1l
Ra Z x dxl
(2)
Where 𝑍(𝑥) is the distance between the profile curve and the mean line and 𝑙 the
sample length. Another parameter that is widely used in the industry is the Rq or
RMS parameter. This is the root mean square of the surface roughness over the
sample length and is calculated according to Equation (3) [15] [16].
2
0
1l
Rq Z x dxl
(3)
The root mean square is an important statistical parameter because it represents
the standard deviation of heights of the surface profile. The mean line is defined
so that the sum of squares of the deviation from the line is equal to zero. These are
the traditional surface parameters used but like all average measurements they
have drawbacks. None of the mentioned parameters can distinguish between
peaks and valleys, profile characteristics critical to the function of the cylinder
liner. Figure 1.8 describes multiple surfaces, with completely different
characteristics but with the same average roughness.
Figure 1.8 Different surfaces with the same average roughness. Modified from source [17].
In order to better define and describe surface characteristics, the parameters
described can be replaced by parameters describing the distribution of peaks and
valleys on the surface. In this way, process control can be more accurate and it is
possible to produce parts with the demanded surface texture. Parameters found to
best correlate with engine performance are the Rk -family parameters. The
parameters are graphically explained in the Abbott-Firestone curve or area bearing
curve [6]. By drawing an equivalent straight line, the peak-, valley- and core areas

CHAPTER 1. INTRODUCTION
9
can be identified. The line is calculated for the central region of the curve which
includes 40 percent of the measured profile. The line is drawn where these 40
percent has a minimum gradient. From the curve, five parameters characterizing
the different parts of the surface can be obtained. The parameters are described in
the standard ISO 13565-2 as follows.
Core roughness depth – Rk: Depth of roughness core profile.
Material portion - Mr1: Material portion, a level in percent(%), determined
from the intersection line that separates the protruding peaks from the
roughness core profile.
Material portion - Mr2: Material portion, a level in percent(%), determined
for the intersection line that separates the deep valleys from the roughness
core profile.
Reduced peak height - Rpk: Average height of the protruding peaks above
the roughness core profile
Reduced valley depths - Rvk: Average depth of the profile valleys projecting
through the roughness core profile.
The mentioned equivalent line intersects with material ratio at 0 and 100 percent.
By plotting horizontal lines from these intersection points to the vertical axis, Rk,
Mr1 and Mr2 can be obtained. The core roughness is the vertical distance between
the lines and the material ratios are the intersection between the plotted lines and
the curve. The peak height and valley depth can then be calculated as the height of
two right-angle triangles that have the same area as the peaks and valley
respectively. The triangle corresponding to the valley depth has Mr2 as its base
while the peak height has Mr1. The illustration of the parameters can be seen in
Figure 1.9.
Figure 1.9 Abbott-Firestone curve explaining roughness parameters [18].

10
In order to use these parameters, the Abbott-Firestone curve needs to be shaped
like the letter S. According to the standard, this is the case for a honed surface
[18]. Close relationships between these parameters and engine performance has
been reported in multiple studies [6].
The Rk -family are profile measuring parameters, showing the surface roughness
in two dimensions. There are however some drawbacks to using two-dimensional
parameters when defining a surface. Surface characterization can be controlled
with profile parameters but in order to be able to predict and understand the
function of the surface three dimensional surface parameters are needed. When
using a profile parameter, it can be hard to understand the true topography of the
surface. If an areal parameter is used instead, the surface can be better understood.
An areal measurement has the ability to detect whether the surface has discrete
pits or valleys, a difference which is significant to the function of the surface. An
areal measurement also has more statistical significance because of the increase of
data-points in the measurement.
There are areal parameters equivalent to the Rk -family. These parameters are Sk,
Spk, Svk, Sr1 and Sr2 and they correspond to the profile parameters with the same
suffix. There are also corresponding areal factors for the mean parameters [19].
Lastly, there are extreme parameters that can indicate different variations in the
surface that the previously mentioned parameters cannot. The maximum
roughness of the surface can sometimes be of importance. Maximum roughness,
Rz, is defined as the height difference between the deepest valley and the highest
peak over a sample length [16].
1.4 Objectives and research questions
In order to achieve a good and stable quality output for any machining operation a
deep understanding of the process is important. Since honing is an abrasive
process, it is hard to analytically predict the resulting quality. To increase the
understanding, empirical modeling is required. In Scania’s manufacturing of
cylinder liners, honing is the final machining operation. The control of this honing
process is based on experiences as to what has been working historically. Previous
tests have however not been based on any experimental design but have consisted
of changing one factor at a time until desired results are reached. This has resulted

CHAPTER 1. INTRODUCTION
11
in some technicians and operators having a sense as to which parameters to
change when a certain measurement is out of tolerance. The process is however
complex and a deeper understanding is needed.
The purpose of this thesis is to reach a deeper understanding of the process control
in Scania’s honing of cylinder liners and how it affects the quality of the produced
parts. The research questions to answer in the project are:
Which honing process parameters have the largest impact on the resulting
quality?
How do these parameters affect the quality and how do they relate to each
other?
What is the most efficient way to control the process?
The aim is to clarify both how the process should be controlled in order to achieve
certain outcomes on the measured quality and to explore how to find the optimal
control settings.
1.5 Delimitations
There are many variables influencing a machining system and thereby the
outcome of a process. In the case of honing, the resulting quality of the cylinder
liner depends on the machine process control, the honing stones used and their
grain sizes, their wear, machine structure, vibrations etc. To investigate all
possible variables influencing the resulting quality would however be very
difficult and time consuming. This thesis will only be focused on the machine
controls. Figure 1.10 shows the scope of this thesis within the green marking.

12
Figure 1.10 Variables affecting the honing results with the scope of this thesis within the green
marking
Furthermore, there are several aspects to consider when it comes to the quality of
the cylinder liners. There are both geometrical tolerances and surface tolerances
that have to be met. The main focus in this thesis will be on the surface quality.
The geometrical tolerances will however be considered to some extent. This is
since it is important that the geometrical tolerances are met even though the focus
of the optimization lies on the surface quality. The actual experiments and the
theoretical study will however not take the geometry into account.

13
2. Problem description
As described in Chapter 1, a cylinder liner has to have a surface texture with deep
grooves complemented with a large bearing area. The peaks of the surface should
be cut off during machining to reduce the need of running in. A desired surface
texture is described in Figure 2.1 with an enlarged picture of the surface profile.
Figure 2.1 Desired surface texture of a cylinder liner
Scania has described the ideal surface texture using Rk-family roughness
parameters. The deep valleys result in a high Rvk-value. The Mr2-parameter should
also be relatively high, due to the desire to have a large amount of material in the
core of the surface. The large bearing area wanted is presented by the slope of the
central part of the Abbot-Firestone curve. The desired surface should have as low

14
slope as possible, i.e. a low Rk-value. Lastly, a low Rpk-value is wanted, since this
represents the peak height of the surface. The surface parameter Mr1 is not used
when defining the surface texture. This is since it is not considered to have any
significant connection to the function of the product.
In practice, the described surface can be difficult to produce. There are
relationships between the different parameters that are hard to define. This can
result in that compensation for deviating values in one surface parameter will
change the outcome of other parameters as well. As stated in the objectives, a
greater understanding of the process is desired in order to know more about these
relationships and which machine parameters should be controlled.
2.1 The cylinder liner machining
The raw pieces used in the cylinder liner manufacturing are created through
centrifugal casting. Before being introduced to the cylinder liner manufacturing,
the liner is rough machined by the supplier. This includes drilling of the bore and
rough turning to obtain the desired geometry. Once introduced to the production
line it is processed in three steps before being washed and packaged. The different
processes and their order are shown in Figure 2.2.
Figure 2.2 Schematic of the processing of cylinder liners
In the rough honing process, the inner cylindrical surface of the cylinder liner is
processed. Honing stones with a large grain size, 151 µm in diameter, are used
and the aim is only to increase the inner diameter and improve the geometrical
accuracy. The surface texture created in this step will be removed from later
process stages. Next, the critical outer surfaces of the cylinder liner are turned in
order to ensure proper sealing when it is mounted in the engine block. The
surfaces turned are identified in Figure.2.3.

CHAPTER 2. PROBLEM DESCRIPTION
15
Figure.2.3 Illustration of outer- (marked with dark) and inner ( yellow) turned surfaces of a
cylinder liner.
The third step is the finish honing step, which is the one investigated in this thesis.
This step will be described in detail in section 2.2. When the liners have been
readily processed, they are washed in order to remove residual oil. All liners are
then visually inspected and packaged.
2.2 The finish honing process
The finish honing operations are performed in a vertical honing machine
manufactured by Nagel. There are three different operations included in the
honing process, all with different objectives. The different steps in the finish
honing process are coarse-, base- and plateau honing. These operations are
performed in three different spindles. In the coarse honing operation, honing
stones with a large grain size are used which enables a high material removal rate.
The feed of the stones is controlled with an electromechanical actuator, which
presses the stones towards the liner surface with a constant speed. The machining
of the bore will continue until a predetermined diameter is reached. The diameter
is measured with a gauge using air pressure. This process is important for the
resulting geometry of the cylinder liner but the surface created has to be removed
by the later operations to avoid too wide valleys.
After the coarse honing operation, the cylinder liner is transported to the next
spindle. During the process the product is transported and machined while in the
same fixture. There are a total of seven fixtures used in the finished honing. Each
fixture contains two rubber sleeves, one upper and one lower. The cylinder liner is

16
clamped in the fixture by an oil pressure that builds up between the fixture and the
rubber sleeves. The sleeves are thereby pressed against the liner and hold it in
place. The oil pressure is kept throughout the whole honing operation.
The second machining operation, conducted in spindle two, is divided into two
steps. The first step is feed controlled, set to remove a certain amount of material.
The second step in the base honing is a force controlled operation, using the same
honing stones as step one. The duration of the operation is controlled by the
number of strokes. These two steps will create the grooves with a crosshatch
angle, characteristic for honing. The honing stones consist of grains with a
medium diameter.
Before the final operation the cylinder liner is cleaned using a brush. The
objective is to remove residue from the earlier operation in order to reduce the risk
of surface deformation. The residue can consist of both swarfs from the cutting
process and grains broken off from the honing stones.
The last machining step of the honing process is plateau honing. The objective of
the operation is to remove the peaks of the surface, reducing the demand for a
running-in period once the engine is in use. The plateau honing operation is quite
different compared to earlier stages. A small grain size and a relatively low
pressure is used. The low pressure is used because of the fact that no grooves are
created in the operation. Since only peaks are removed, no crosshatch pattern
needs to be created. This means that the rotational- and reciprocating speeds are
uncorrelated. As for the second step in the base honing, the duration of the plateau
honing is controlled by the number of strokes. An overview of the machining
steps in the finish honing process is presented in Table 1.
Table 1. Overview of the finish honing process.
Spindle 1
Coarse honing
Spindle 2
Base honing
Spindle 2
Base honing
Spindle 3
Plateau honing
Step 1 Step 2
Grain size Large Medium Medium Small
Actuator type Electromech. Electromech. Hydraulic Hydraulic
Process duration
set by
Diameter Diameter No. of strokes No. of strokes

CHAPTER 2. PROBLEM DESCRIPTION
17
During the operations the honing stones will be worn and deteriorate. The stones
will both become smaller in size and the grain will become dull, reducing the
cutting ability of the stone. The machine is able to compensate for the geometrical
wear of the stone while the sharpening of the grain is generated by the stone itself
as described in section 1.2.1.
The final step in the finish honing is an online measuring station. At the station,
the diameter of the liner is measured and communicated to the operator. The
operator can then compensate the allowance between spindle one and two in order
to get the correct diameter on finished part.

18

19
3. Methodology
Since honing is an abrasive process, it is extremely difficult to analytically predict
the outcome of the process. Therefore, empirical modeling is required to
understand the process and predict its output [6]. Based on this, experimentation
was an important part in understanding and optimizing the honing process of
interest. All experiments were designed using the software MODDE [20].
MODDE was also used to analyze the data collected through the experiments.
In order for these experiments to be relevant, the first part of the work was to
reach a basic understanding of the process to make sure that significant variables
were tested. A literature study was conducted to gain theoretical knowledge of
honing. The literature study was focused on both honing as a process and on
previous studies made on how honing process parameters affect the surface
quality.
Since the actual outcome of the honing process is so hard to predict analytically, it
is not certain whether the outcome of a certain honing process is the same as the
outcome of a previously studied process. Therefore, the current control of the
process was also mapped. This mapping was performed by talking to technicians
and operators working with the cylinder liner manufacturing. The machine
manufacturer, Nagel, was also contacted in order to resolve some uncertainties.
With the combined knowledge from these sources, the parameters of interest that
should be further investigated with experimentation were identified. A visual
representation of the sources of information used to identify relevant parameters is
found in Figure 3.1.

20
Figure 3.1 Sources of information used to identify parameters of interest.
The parameters that were considered interesting for further investigation were
explored with experiments. These experiments were carried out in several steps.
The first tests had the purpose to identify which parameters affect the surface
quality the most. Once the most influential parameters had been identified, these
were subject to further experimentation with the purpose to find optimal working
conditions for the machine to achieve satisfying and stable surface quality. All
experiments were planned using Design of Experiments methods. Some theory on
Design of Experiments is found in the next section. Information on how the actual
tests were developed and performed is found in Chapter 5.
3.1 Design of Experiments
An experiment can be defined as “a test or series of tests in which purposeful
changes are made to the input variables of a process or system so that we may
observe and identify the reasons for changes that may be observed in the output
response” [21]. These input variables, which are changed in order to study the
resulting effects, are called factors [22].
Statistical Design of Experiments involves careful experimental planning in order
to, through experimentation, collect the data needed for drawing valid and
objective conclusions [21]. In other words, it is a working methodology used to
make the most out of experimentation, i.e. to get the best possible results with
respect to the objective of the experiments and available resources [23].

CHAPTER 3. METHODOLOGY
21
In order to continuously improve a process, it is crucial to understand its behavior.
Therefore, industrial experimentation is often focused on exploring and
understanding how the process variables affect the output performance
characteristics. Figure 3.2 shows a representation of a process and components
considered in an experiment.
Figure 3.2 Schematic of a process with inputs, outputs and variables represented [23].
The controllable variables are parameters which can be controlled by the
experimenter. These can include factors such as machine control parameters or
type of tool that is being used. The uncontrollable variables are factors which may
affect the process outcome but are not controllable by the experimenter. These
may include factors such as ambient temperature and humidity. The output is the
measured characteristics which are used to evaluate the performance of the
process [23]. The experiments might have different objectives including [21]:
Identifying which factors have the largest impact on the output
Finding the optimal value for the factors X in order to keep the output Y
near its nominal value
Finding the values for the factors X where the variability in Y is small
Finding the values for the factors X where the impact of the uncontrollable
factors Z is as small as possible

22
3.1.1 Benefits of DOE
Even though DOE today is a widely known concept which provides efficient
methods for performing these kinds of experiments, it is not always used for
industrial experimentation. Two commonly used approaches for industrial
experiments are the Best-Guess approach and the One-Variable-At-a-Time
approach [21].
The best-guess approach involves that the experimenter first reasons which should
be the optimal settings for the process and then performs a test to see if the output
is within the tolerances. If it is not, another guess is made and new tests are
performed. This method can often work quite well if the one performing the
experiments has a lot of knowledge and experience of the process. There are
however, two major disadvantages to the approach. The first is that even an
experimenter with the best knowledge of the process could go on trying different
settings for a long time without finding any optimal settings. The other one is that
an experimenter might settle for settings that are only good enough once they are
found. This is since it is impossible to know what the best possible settings will
yield in advance.
The One-Variable-At-a-Time (OVAT) approach means that the experimenter
changes the levels of one factor at a time while keeping the other factors constant.
A series of tests with different levels of the factors are performed before the
outputs are measured and plotted in graphs. There are some disadvantages to the
OVAT approach as well. This type of experiments does not give reliable result,
they require large quantities of time and resources in order to gain small amounts
of information or false optimum conditions on the process [23]. One reason for
OVAT experiments not giving reliable results is that they do not consider any
factor interactions. Interaction is when the effect from changing one factor to a
certain value is not the same regardless of the settings of the other factors. When
this type of joint factor effects occur, the factors that are interacting with each
other cannot be evaluated individually [24].
In order not to miss interactions and thereby misinterpreting the results, carefully
planned factorial experiments should be conducted. This type of experiments
makes a much more efficient use of the data [21].

CHAPTER 3. METHODOLOGY
23
3.2 Factorial experimentation
Factors can be either quantitative or qualitative. Quantitative factors can be set in
numerical values. In a machining process, quantitative factors can be rotational
speed, depth of cut and such. For quantitative factors it has to be decided which
range of the settings should be used and how these are to be controlled and
measured during experimentation [23]. Qualitative factors are those that cannot be
measured in numerical values. An example of a qualitative factor is supplier of
raw material. All factors which impact the process will be tested at different
levels. For a qualitative factor, such as the raw material supplier, the different
suppliers will be the different levels of the factor. If the test includes two different
suppliers, then this factor has two levels. For a quantitative factor the
experimenter might have a span within which the factor settings are to be tested.
The levels here represent values within this span. Usually experiments are
performed with two or three levels of every factor. In a three level factorial
experiment, every factor is tested at its lower, upper and middle value of the
investigated value span.
In factorial experimentation, the different levels of the factors are tested in several
different combinations. Each test with a specific combination of levels is called a
run [25].
3.2.1 Full factorial designs
Factorial designs can be divided into full factorial and fractional factorial designs.
In a full factorial experiment, all levels of the factors investigated are tested in all
possible combinations. If k factors with two levels are to be investigated in a full
factorial experiment, this experiment will consist of 2k
runs. 2k
is often also used
as a symbol to represent two level full-factorial designs [22]. For a three level
factorial design the number of runs needed is instead 3k. The number of runs
needed for a three level full factorial design increases quite fast with an increase in
the number of factors. For example, a full factorial design for investigating 5
factors with two levels requires 25=32 runs while a full factorial design with three
levels requires 35=243 runs. Since two level factorial designs require relatively
few runs per factor it is the most economical way to investigate a process with
many factors [22].

24
A test which includes two levels of all factors cannot identify any nonlinear
effects on the process. Thus, using a two level factorial design implicates the
assumption that the effects of these factors are approximately linear over the
testing range.
One way to detect tendencies regarding curvature in the model is to add center
points to the two level experimental design. Center points are experimental runs
with all factors set to a medium level. A graphical representation of a 23
factorial
design with three center points is presented in Figure 3.3.
Figure 3.3 Graphical representation of a 23 factorial design.
Every axis in the figure corresponds to a factor and the corner points represent
high and low values of these factors. The center points are represented by the red
points in the middle of the cube. Adding several center points, preferably as the
first, middle and last run in the experimental design can also allow the
experimenter to comprehend how stable the investigated process is [23].
3.2.2 Fractional factorial designs
If there are many factors which might influence the investigated process, even a 2k
experiment might result in a large number of runs. In these cases fractional
factorial designs are often used. In a fractional factorial experiment design, only a
fraction of the runs required for a full factorial experiment is performed. For
example, if five parameters are to be investigated, a two level factorial design
would require 25=32 runs. If the experimenter wishes to explore these parameters
with only eight runs, i.e. a one-fourth fraction of the 32 runs, this is called a

CHAPTER 3. METHODOLOGY
25
quarter fraction of the full factorial design. Fractional factorial designs are
regularly referred to as 2k-p
designs where the p stands for the design being a (1
2)
𝑝
fraction of a 2k design. Thus, the quarter fraction of the 2
5 design is referred to as a
25-2
design since 1
4= (
1
2)
2
[25].
Resolution
The resolution of an experimental design displays the confounding patterns in the
design. Confounding refers to when the influence of a factor cannot be estimated
independently. This means that an effect might be observed from the analysis of
the test responses but that it is not possible to tell which of, for example two
factors have affected this response. These two factors are then confounded with
each other. The design resolution reveals the order of confounding of the main
effects and interactions for a designed experiment. Resolution is an important tool
for deciding what fractional factorial design to use for a problem. For these types
of experiments, designs of resolution III, IV and V are of great importance.
In a resolution III design, no main effect is confounded with other main
effects. There is however, confounding between main effects and two-
factor interactions. Two-factor interactions may also be confounded with
other two-factor interactions.
In designs of resolution IV, no main effects are confounded with each other
or with any two-factor interactions. Two factor effects though, are
confounded with each other.
In resolution V designs, no main effects are confounded with each other or
with any two- or three-factor interaction effects. Two-factor interactions
are however, confounded with three-factor interaction effects [23].
The resolution of a design is denoted by a Roman numerical subscript. For
example a quarter fraction factorial design with five parameters tested at two
levels is of resolution III and is thereby denoted by 2 III5−2.
3.2.3 Randomization
There are always several uncontrollable factors affecting the outcome of a
process. These factors can be for example be humidity, human factors, power
surges and machine wear over time. The impact of such factors cannot be fully

26
controlled or eliminated but there are ways to minimize the risk of them disturbing
the experiment results. One of these methods is randomization. Using a
randomized run order for the experimental runs allows the experimenter to spread
out the effect of the uncontrollable factors and thereby the noise in the process
[23].
For example, in a non-randomized experimental design all runs with the high level
of a certain factor might be performed in a row. If the humidity in the factory
increases after half of the experiments and affects the outcome of the process, the
data analysis might suggest that this variation is due to the change to the lower
level of this factor. This can be prevented by using randomization. If instead, the
runs are mixed with high and low levels of every factor spread out, the effect of
the change in humidity will also be spread out on several settings of the factors.
Thereby the risk of misinterpreting the results is lowered.
3.2.4 Screening tests
Since conducting a full factorial test with many factors requires many runs and
thereby takes a lot of resources, the first step in industrial experimentation is often
to identify which factors affect the process outcome the most. This is regularly
done through a screening test which is commonly performed as a 2-level factorial
experiment [23]. The factors that, through the screening tests, are found to be of
significance to the process output can then be subject to further investigation
through optimization tests.
3.2.5 Optimization tests
By conducting an optimization test, the best settings of the machine can be applied
in aspect of selected responses. In order to generate the optimization point, a wide
set of parameter combinations have to be understood. When conducting
optimization tests, three level full factorial experimentation can be applied. This
kind of test will however, as mentioned in section 3.2.1, generate a large number
of test runs. Due to this fact, this test is not always the most effective way of
identifying model curvature, one of the goals of optimization. A two level
factorial test can, as mentioned in section 3.2.2, identify curvature tendencies with
the use of center points. By combining this sort of test with further, carefully
selected, experimental points a more effective design can be created [21].

CHAPTER 3. METHODOLOGY
27
One design type, generated from a two level full factorial test are central
composite designs. These designs are preferred when the objective of the
experimentation is to optimize a process. They can generate a relatively high
resolution, depending on number of factors used, and at the same time be
reasonable from a practical point of view. There are two different composite
designs that can be applied. A graphical representation of these designs is
presented in Figure 3.4.
Figure 3.4 Graphical presentation of three factorial designs CCF (a) and CCC (b) [26].
Design b in the figure, a central circumscribed (CCC) design, corresponds to a full
two-level factorial design when using two to four factors. The design considers
five levels per factor by placing test points outside of the experiment matrix. The
other design is a central composite face-centered (CCF) design. This design is
similar to the CCC but only considers three levels of each factor. Due to the
higher amount of levels per factor, CCC has a better ability to detect curvature in
the data compared to the CCF design. This makes the CCC model slightly
superior in theory. The CCF design is however more practical which often is a
desired quality in a design [26].

28
3.3 Data analysis
There are several tools that can be applied when validating a model. In the
software used, two parameters are considered to be of greater importance than
others. One parameter is the goodness of fit, denoted R2. This parameter indicates
how well the chosen regression model fits the collected data. The goodness of fit
has a numerical value between zero and one, with zero being no model at all and
one a perfect model. An issue with the parameter is that its value can be increased
by merely acquiring more data points. Due to this fact, the parameter needs to be
complemented with other tools. The most important parameter in regression
analysis is the goodness of prediction, Q2. This parameter gives a value of the
models capacity to predict future outcomes, which is the ultimate goal of any
study.
Other important tools connected to regression analysis are model validity and
reproducibility. As can be derived from the name, model validity indicates how
well the model, fits to the collected data. This is based upon a lack of fit test..
Reproducibility is a value of to what extent the model can be repeated. This is
based on the replicates of the test. Less variation between replicates increases the
value of reproducibility. Range, target values and recommendations for the
different parameters are presented in Table 2.
Table 2 Summary of fit parameters.
Parameter Range Target value Recommendation
Goodness of fit, R2 0 - 1 Maximize No more than 0,2-0,3
units between R2 and Q2.
Goodness of
prediction, Q2
-∞ - 1 > 0,5 – Good model
> 0,9 – Excellent model
No more than 0,2-0,3
units between R2 and Q2.
Model validity > 0,25 – Good model
Reproducibility > 0,5 – Good model

CHAPTER 3. METHODOLOGY
29
When creating a model in MODDE, a summary of fit plot is created, visualizing
how the model fulfills these criteria. An example of such a plot is presented in
Figure 3.5.
Figure 3.5 Example of a summary of fit plot [27].
The tools mentioned above are the ones that every model made for prediction
should pass. There are however complementing tests that can be performed to
further analyze the model. One test that should be conducted is analysis of
distribution. If a non-normal distribution is found, transformation may have to be
conducted due to the fact that the software MODDE applies models based on
normal distribution [26].
When displaying the results in MODDE, effect plots can be used. These plots
visualize the effect of the different factors on the response parameter. An error bar
is included, showing the 95% confidence interval. An example of an effect plot is
shown in Figure 3.6.

30
Figure 3.6 Example of an Effect plot [27].
The factors are sorted by the magnitude of their impact on the response parameter
with a descending order from left to right. When an error bar extends past zero,
the factor impact can be deemed as negligible for the response and removed from
the model. If however the model Q2 value is decreased by such an action, it should
be reversed [27].

31
4. Parameters affecting the process
As mentioned in section 3.1, the first part of DOE is to map and understand the
process which is to be investigated. In order to recognize which parameters might
influence the honing results a pre study was conducted. The data collected was
from a combination of previously performed studies and operator experience.
4.1 Theory
In a honing process there are numerous parameters that can be varied in order to
control the machining procedure. Multiple studies have been carried out on the
subject on honing process control with the aim to understand the effect on
resulting quality. By analyzing literature on previous studies, some parameters
were found to be of larger interest than others. These parameters are presented in
the following sections.
4.1.1 Honing pressure
Several of the previous studies have identified the honing pressure to be a
parameter of importance when it comes to surface roughness. There are however
some differences in the findings regarding in which of the honing operations the
pressure affects the surface the most. In a study by Kanthababu et al., experiments
were conducted in order to analyze the effect of process parameters on surface
roughness. In this study, the surface texture was characterized with Ra and Rk -
family values. It was found that the pressure is of great importance in all steps, i.e.
coarse-, base- and plateau honing. The authors also state that the surface
constructed in the first spindle is of minor importance for the resulting surface
roughness since this profile is removed in later operations [28].

32
The findings of Kanthababu et al. regarding the importance of honing pressure are
supported by a number of other reports on the subject. Vrac et al. performed a
study on the honing of grey cast cylinder liners, comparing the effect of the
process parameters pressure, feed and cutting speed. In this study, the authors
compared the surfaces produced in aspect of average roughness. It was found that
honing pressure is the main parameter affecting the condition of the final surface.
The study also presents the formula found in Equation (4), describing the specific
cutting pressure, Phd.
tan
p p
hd
h
A pP
A
(4)
where Ap is the surface area of the honing machine piston, pp is the hydraulic oil
pressure in the piston, Ah is the honing head metal working surface and β is the
honing tool angle [29]. A greater cutting pressure results in a rougher surface.
This is since the grains of the honing stones are pressed further into the
workpiece. The increase in pressure will also increase the depth of the grooves
[30].
In a report by Buj-Corral et al., it is presented that honing pressure is the most
influential machine control parameter affecting the surface. Of all parameters
investigated in the study, grain size of the honing stones proved to have the largest
impact on surface quality. This is because the larger stones create larger and
deeper grooves, increasing overall roughness [13].
A study by Rosén and Thomas also confirms the theory of pressure being of great
significance. This paper suggests that the pressure in both finish- and plateau
honing affect the results. A low pressure during base honing complemented with a
high pressure during plateau honing is stated to create a favorable surface [31].
The only research found, that contradicts the statement of pressure influencing the
surface roughness throughout all processes is performed by Pawlus et al.. In this
study the authors found that the pressure in the base honing has a great effect on
the surface condition. The surface parameters Rk and Rvk were found to be
proportional to the surface pressure, i.e. an increase in pressure will increase Rk

CHAPTER 4. PARAMETERS AFFECTING THE PROCESS
33
and Rvk. The report does however deem the plateau honing pressure as
insignificant and states that its effect on the resulting surface is negligible [32].
4.1.2 Honing time
Another parameter found relevant is the honing time. Pawlus et al. identified the
plateau honing time to have a major influence on the resulting surface texture. The
findings were that with an increase in honing time, a smoother surface will be
created [32]. This theory is confirmed by Klocke who also states that a longer
honing time will create surfaces with lower roughness. The decrease in surface
roughness is non-linear with a rapid reduction rate in the beginning which is then
leveled out over time, according to Figure 4.1. This is since the stone will first
come in contact with the peaks of the surface, creating a very high pressure on
those peaks. When the peaks are removed, the pressure will stabilize as a result of
the honing stones coming in contact with the core of the surface. The decrease in
pressure will decrease the rate of which the stones can remove material [11].
Figure 4.1 The effect of honing time on surface roughness [11].
The honing time was also examined in the previously mentioned study by
Kanthababu et al.. It was found that the base honing time has an effect on the
surface texture. In this stage it mainly affects the Mr2-parameter and according to
the study, the highest Mr2 is found with medium honing time [28].
By increasing the honing time, the number of rotations of the honing tool
increases. A larger number of rotations has also been proven to reduce the

34
roughness of the surface. The surface structure after a certain number of tool
rotations can be seen in Figure 4.2.
Figure 4.2 Surface roughness after different number of tool rotations. Modified from source [11].
4.1.3 Number of strokes
Instead of setting the honing time, the duration of a honing process can in some
cases be controlled by the number of strokes. Regardless of the controlling factor,
the number of tool rotations is varied with the process duration in combination
with the rotational speed. Because of this, the resulting surface of the cylinder
liner is dependent on the number of strokes in the same way as with the honing
time. In one study it is stated that no fewer than four strokes should be used in the
plateau honing process. It has been found that it is after this point that a change in
surface texture can be identified. There is also an upper limit to the number of
strokes that should be used. When using too many strokes, the surface will have a
low amount of deep valleys and a too large plateau area. This will decrease the
ability of the surface to retain oil and will thereby result in poor lubrication
properties of the cylinder liner. The previous mentioned study showed that no
more than seven strokes should be used in order to prevent this from occurring
[33].
4.1.4 Cutting speed
According to the analyzed literature, honing pressure and honing time are the two
parameters with the largest effect on surface texture. There are however several
other parameters that have been found to be of significance even if their effects
have not been confirmed in as many studies. One of these parameters is the
cutting speed. The cutting speed is the resulting vector from the rotational- and the
reciprocal speed. These speeds are connected to each other according to the

CHAPTER 4. PARAMETERS AFFECTING THE PROCESS
35
formula for the crosshatch angle, described in Equation (1). In the earlier
mentioned study by Buj-Corral et al. tangential speed was identified to have some
effect on the surface roughness. It was found that with high and medium grain
sizes roughness decreased when increasing the tangential speed. This is due to the
fact that the cutting operation is easier performed at higher speeds. When using a
smaller grain size on the other hand, an increase in tangential speed results in
higher roughness. A higher rotational speed increases the vibrations in the tool,
generating a higher roughness of the workpiece surface. It is important to note that
the experimenters varied the rotational speed while keeping the reciprocating
speed constant, thereby neglecting the crosshatch angle [13].
The reciprocating speed of the honing tool has also been subject to some studies.
Kanthababu et al. found the reciprocating speed to be an important parameter in
the plateau honing process, mainly affecting the Mr2 surface parameter. Another
study showed that the cutting speed, as a function of the reciprocating speed, is the
most influential parameter when using a large grain size. In this case the grain size
was 181 µm, a grain size used when conducting rough honing. With smaller grain
sizes however, pressure was considered to be the main influencing parameter.
[34]. It has also been presented that an increase in cutting speed results in a
decrease in surface roughness. The roughness decreases in a non-linear way.
Larger changes in roughness were detected at changes in lower speeds than in
high speeds.
Except for its effect on surface quality, the cutting speed has major influence on
material removal rate of the process. An increase in cutting speed will increase the
removal rate, decreasing the cycle time for the operation. It will however also
result in an increase in wear on the tool [11]. The wear itself will also affect the
condition of the surface. An increase in wear i.e. a blunting of the cutting stone,
will decrease the ability of the stone to cut the material. The result is a
deterioration of the surface, mainly affecting peak- and core surface parameters
[35].
4.1.5 Acceleration
The acceleration of the honing head has a great effect on the geometry of the
cylinder liner. It also has an effect on the surface roughness, mainly at the lower
turning point. At this point, the reciprocating speed will vary while the rotational

36
speed is constant. This results in a deviation from the crosshatch pattern. In a
study conducted by El-Mansori et al., it was found that surface roughness
decreases with an increase in acceleration [36].
4.2 Current process control
The current control of the process parameters is based on a combination of
recommendations from the machine supplier and operator experience. As stated in
section 2.2, the machining in the finish honing is carried out in three different
spindles of which the process in the second spindle is divided into two steps.
4.2.1 Parameters controlled
The parameters controlled in the machine are the feed rate, force, number of
strokes, stroke length and amount of material to be removed in the process. In the
first spindle, both feed rate and force are controlled. The force is a limiting factor
in order to reduce the risk of machine overload. If the force reaches a certain user
defined level, the feed will be set to the corresponding value. With the feed used
in current production, the force limit is always reached. This indicates that a too
high value of the feed rate is used.
The force is used for compensation in the second step in spindle 2 as well as in
spindle 3. This is consistent with analyzed literature which states that force is the
parameter with most influence on surface quality. When controlling the force in
the machine at hand, no numerical value can be set. Instead the operators set a
percentage value that represents a fraction of the maximum machine force. The
machine has a specification regarding the maximum pressure that can be
generated in the system. The friction of the system is however unknown, making
it impossible to calculate machine force in the spindle using Equation (4).
The number of strokes used during the honing process is controlled in the second
step in spindle 2 and in spindle 3.
4.2.2 Machine compensation
In the present production there are two major approaches when dealing with
surface deviations. One is compensating for deviating Rvk- and Mr2-values and one
for deviating Rpk- and Rk-values. When compensating for Rvk-values, the operators

CHAPTER 4. PARAMETERS AFFECTING THE PROCESS
37
have found that the Mr2 will be affected in an inverse manner. This means that a
compensation for a low Rvk will decrease the Mr2-value. The Rk- and Rpk-
parameters on the other hand, are according to the operators connected in such a
way that if one is increased, the other one increases as well.
Since Rpk and Rk only have an upper limit, the compensation for these parameters
are due to high values. These are mainly corrected by increasing either the force
or the number of strokes in spindle 3. One of the machine parameters is chosen at
a time and there is no standard procedure for when a certain one of them is used.
The work sequence for compensation of deviating Rpk- and Rk-values can be seen
in Figure 4.3.
Figure 4.3 Machine control when compensating for deviating Rpk / Rk .
The Rvk and Mr2-parameters have, as earlier stated, an upper and a lower limit.
Therefore, compensation has to be made both for high and low values. When
compensating for a high Rvk, the operator controls that the machine leaves the
correct amount of material from spindle 1 to spindle 2 for machining. If this is not
the case, the operator compensates by increasing the allowance left from spindle 1
to spindle 2. If however the allowance is sufficient, the usual action is to either
increase the force in spindle 2 or the number of strokes in spindle 3. One
parameter is changed at the time until the problem is corrected. This is consistent
with the OVAT approach, mentioned in section 3.1.1, which has been proven to
be flawed. High Rvk-values are rarely occurring in production and therefore these
compensations are seldom performed. Low Rvk-values on the other hand appear
more frequently. There are some disagreements regarding the compensation of
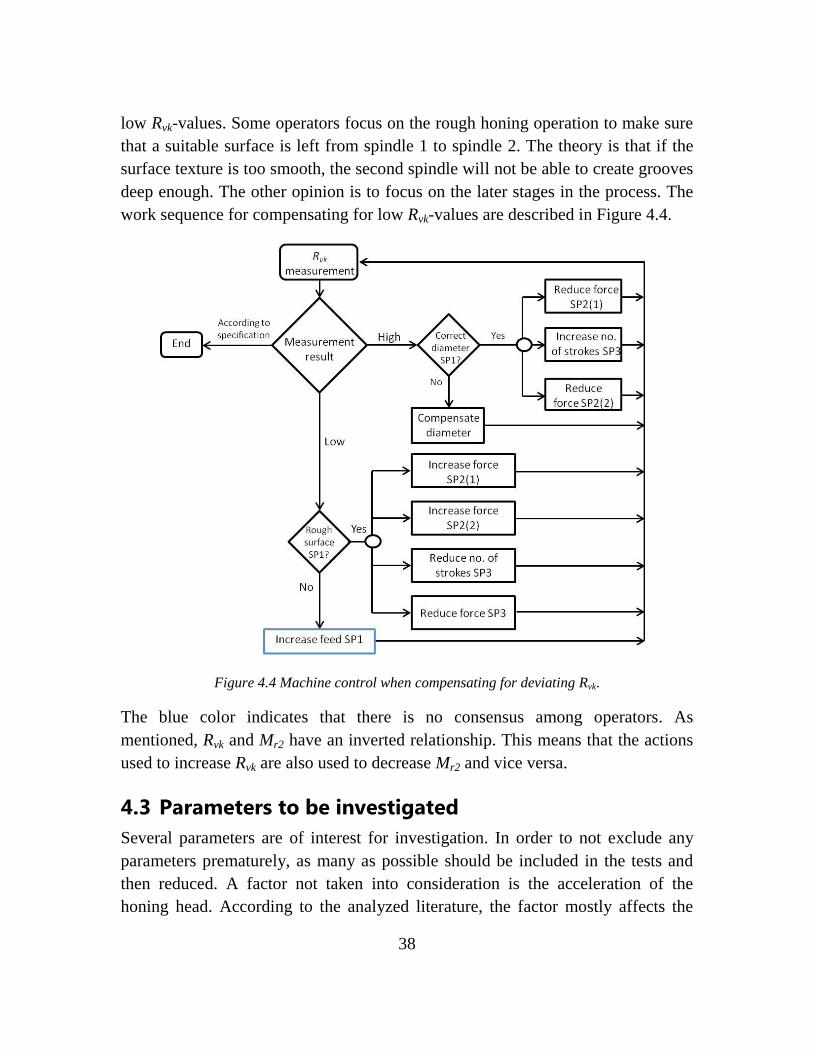
38
low Rvk-values. Some operators focus on the rough honing operation to make sure
that a suitable surface is left from spindle 1 to spindle 2. The theory is that if the
surface texture is too smooth, the second spindle will not be able to create grooves
deep enough. The other opinion is to focus on the later stages in the process. The
work sequence for compensating for low Rvk-values are described in Figure 4.4.
Figure 4.4 Machine control when compensating for deviating Rvk.
The blue color indicates that there is no consensus among operators. As
mentioned, Rvk and Mr2 have an inverted relationship. This means that the actions
used to increase Rvk are also used to decrease Mr2 and vice versa.
4.3 Parameters to be investigated
Several parameters are of interest for investigation. In order to not exclude any
parameters prematurely, as many as possible should be included in the tests and
then reduced. A factor not taken into consideration is the acceleration of the
honing head. According to the analyzed literature, the factor mostly affects the

CHAPTER 4. PARAMETERS AFFECTING THE PROCESS
39
lower part of the cylinder. During the tests, this part of the liner will not be subject
to measuring which makes an investigation of the parameter excessive.
As stated in 2.2, the duration of the process is controlled differently in the
different stages of the process. Because of this, the honing time will not be subject
of investigation as a single parameter but instead be a result of a combination of
factors. In step one in the base honing and in the coarse honing, parameters
influencing the material removal rate will affect the resulting honing time. In the
second stage of the base honing as well as the plateau honing, the number of
strokes will be the defining factor.
An overview of the parameters to be investigated is presented in Figure 4.5.
Figure 4.5 Parameters to be investigated with experimentation.

40

41
5. Experimental procedures
In order to identify which process parameters influence the surface texture as well
as in what way they do, experiments were performed. All experimental designs
were created in the software MODDE [20] which was also used for analyzing the
data. The tests were conducted using grey cast iron cylinder liners. The matrix of
the material was pearlitic with no more than five percent ferrite. The honing oil
used was Castrol Honilo 981. The honing stones were diamond abrasives supplied
by Nagel. Different grain sizes were used for different spindles. The sizes are
presented in section 2.1.
Measurements were performed using a perthometer, MahrSurf XR1. The tool was
equipped with a diamond stylus with a radius of 2 µm according to ISO 3274
standard. The resolution of the tool was 7 nm in height and 0,5 µm in length
according to the same standard. The measurement speed was 0,5 mm/s. During
the measurements ISO 4288 was applied, which among other things results in a
measuring length of 5,6 mm and an evaluation length of 4 mm. The measuring
tool is calibrated according to ISO 12179.
Every liner was measured on six predetermined heights distributed on a vertical
line. The number of lines measured in each liner was determined for the different
experiments and can be found in the experimental details. Figure 5.1 illustrates the
distribution of measuring points along one line in the cylinder liner.

42
Figure 5.1 Overview of the different measurement points on the liner [mm].
5.1 Screening tests
In order to find which parameters have the largest influence on the surface quality,
screening tests were performed in two stages.
5.1.1 Experimental details
For every test run in the screening tests, three cylinder liners were processed of
which the third served as the reference piece that was measured. Three liners were
used for each run to give the machine some time to adapt to the new settings. The
decision to use two pieces for the transition was based on discussions with
technicians with knowledge of the process. According to their experience, it
usually takes a while before changes to the process parameters show any result on
the surface quality of the machined cylinder liners. No explanation for this
phenomenon has been found in literature but it was decided to use transition
pieces based only on experience of the process.
For every reference liner, the surface parameters Rk, Rpk, Rvk and Mr2 were
measured along three lines, i.e. at 18 different points, with the earlier mentioned
perthometer. For every test piece, a mean value for the 18 measurement points
was calculated for each surface parameter. Values that diverged more than three
standard deviations from the mean were excluded from the results and the mean
values for the remaining measurements were then used for the data analysis.

CHAPTER 5. EXPERIMENTAL PROCEDURES
43
During the execution of the test runs, the machine was set with the process
parameter values corresponding to the current run and the liners were then
processed. Each run was ended when the last of the processed pieces was
transported from the machine to the conveyor belt.
In order to reduce the variation in the process, the tests were performed with
stones of average wear. By using stones in the middle of their life span, the wear
is negligible during the test course. To reduce the effect of other variations in the
process, the test runs were completely randomized except for three center points
that were performed as the first, middle and last run for each screening test.
5.1.2 Screening 1
With consideration to both theoretical and empirical knowledge of the process, ten
parameters were found to be of interest for further investigation. In order to gain
knowledge regarding which of these parameters affect the surface the most, a
screening test with a 2 III10−6 design was performed. All investigated parameters as
well as the higher and lower levels for which they were tested can be found in
Table 3.
Table 3 Parameters investigated in the first screening test.
Spindle Parameter Abbreviation Low
level
High
level
Unit
1 Force F1 60 95 %
2 Step 1 Allowance A21 30 50 µm
2 Step 1 Force F21 45 70 %
2 Step 1 Rotational speed RoS21 130 190 rpm
2 Step 2 Force F22 70 100 %
2 Step 2 Rotational speed RoS22 130 190 rpm
2 Step 2 Number of Strokes NoS22 5 15 strokes
3 Force F3 30 70 %
3 Reciprocating Speed ReS3 26 38 m/min
3 Number of Strokes NoS3 4 14 strokes
For all test runs, the relationship between the rotational speed and reciprocating
speed was kept constant according to Equation (1), i.e. whenever the rotational
speed for a spindle was changed, the reciprocating speed was changed

44
accordingly. In spindle 3 the reciprocating speed was the controlled parameter.
Here the rotating speed was kept accordingly to keep a fixed honing angle mainly
for practical reasons. Reciprocating speed was controlled primarily since,
according to analyzed literature, it has been found to be of larger importance than
the rotational speed in the plateau honing operation. The full test plan with all
levels of the parameters can be found in A1.
Results
The data retrieved for each response was fitted to a model using multiple linear
regression (MLR). A summary of fit plot for the models obtained for the different
responses is found in Figure 5.2.
Figure 5.2 Summary of fit plot for the first screening test.
The demands stated in Table 2 are fulfilled in regards of R2 and Q2 which
indicates that the models are good.
The number of strokes in spindle 3 showed to have the largest total impact on the
surface texture. Furthermore, the force in spindle 3 proved to have a large impact
on all output parameters. Figure 5.3 shows an effect plot for all the surface
roughness parameters with the factors that showed to be most significant
represented.

CHAPTER 5. EXPERIMENTAL PROCEDURES
45
Figure 5.3 Effect plot of results from the first screening test.
The indicated significance of the allowance between the first and second spindle
was quite unexpected. These results suggested that a larger allowance would have
a negative impact on the Rvk-parameter. This arose some suspicion that the whole
surface profile from spindle 1 was not removed in the machining in spindle 2 with
the lower allowance. This made the allowance a subject of discussion prior to the
second screening test. Moreover, the number of strokes in spindle 2, step 2
showed to have an impact on the Rpk-parameter. This was also quite unexpected
which made the parameter interesting for further experimentation.
There were two factors that did not show to be of significance for any of the
resulting surface parameters. These were the force in spindle 1 and the force in
spindle 2 step 1. Because of this, it was decided that these factors would not be
subject to any further investigation.
5.1.3 Screening 2
The purpose of the second screening test was to further limit the number of factors
to investigate in an optimization test. For the second screening test, a 2 IV8−4
fractional factorial design was used. By using a higher resolution than in the first
screening test, some factor interactions could also be identified. All parameters
investigated in this test as well as their high- and low levels can be found in Table
4.

46
Table 4 Parameters investigated in the second screening test.
Spindle Parameter Abbreviation Low
level
High
level
Unit
2 Step 1 Allowance A21 35 55 µm
2 Step 1 Rotational speed RoS21 110 190 rpm
2 Step 2 Force F22 50 100 %
2 Step 2 Rotational speed RoS22 110 190 rpm
2 Step 2 Number of Strokes NoS22 5 14 strokes
3 Force F3 50 90 %
3 Reciprocating Speed ReS3 15 35 m/min
3 Number of Strokes NoS3 5 14 strokes
In this test, the relationship between reciprocal speed and rotational speed was
kept fixed for both steps in spindle 2. Spindle 3 does not create any deep grooves
in the surface which makes the relationship between the different speeds in this
spindle redundant. Therefore, the rotational speed in spindle 3 was kept fixed
while reciprocating speed was varied for this test. The lower limit of both the
rotational- and reciprocating speed was significantly lowered in the second
screening test. These parameters did not show any major influence on the surface
texture in the first screening test. A possible explanation for the results could be
poorly chosen levels of the parameters. By lowering the lower limit, further
testing of these factors could be made before making a ruling whether to discard
them or not.
To investigate the suspicions regarding the amount of allowance between spindle
1 and 2, the Rz surface parameter was measured after spindle 1. The Rz parameter
needs to be smaller than half the allowance in order to make sure that grooves
created in spindle 1 does not show on finished surface. This is since the allowance
is quantified as the increase in diameter of the bore. Measurements were
conducted on six points in the liner and an average was calculated. The average Rz
value was found to be 16.85 µm. This would suggest that an allowance of 30 µm
is an insufficient value for the allowance between the spindles. To make sure that
no texture created in spindle 1 remains, the allowance levels were shifted up. The
values set for the factor can be seen along with the other factor levels in Table 4.

CHAPTER 5. EXPERIMENTAL PROCEDURES
47
Another factor with altered levels was the force in the last spindle. The aim of the
change was to observe whether the factor had the same effect on the surface with
higher levels. Therefore the amount of force used was increased, shifting the
levels with 20 units compared to screening 1. The full test plan can be found in
A2.
Results
Data gathering and analysis was performed as described for screening 1. The
summary of fit plot for the second screening test is presented in Figure 5.4.
Figure 5.4 Summary of fit plot for the second screening test.
The summary of fit plot implies that the models for all responses are good. All
requirements stated in Table 2 are fulfilled.
The factors that were found to be of little or no significance for the response
parameters were removed before the models were fitted. The effects of the
remaining and most significant parameters are presented in Figure 5.5.

48
Figure 5.5 Effect plot for the second screening test.
According to the second screening, honing force and number of strokes in the
plateau honing has the largest total effect. These factors show to have a large
effect on all surface parameters, consistent with results from the first screening.
As suspected after screening one, the allowance in spindle two was found to have
a negligible effect on the surface roughness once the levels were increased. The
parameter could therefore be excluded from further tests.
A factor with a large increase in significance, compared to screening 1, was the
reciprocating speed in the plateau honing operation. By controlling the
reciprocating speed while having a fixed rotating speed, the number of passes of
the abrasives against the workpiece can be controlled. As stated in section 4.1.2, a
larger number of tool rotations will result in a smoother surface. In these tests, the
number of tool rotations per stroke increases with a decrease in reciprocal speed.
An increase in reciprocal speed will increase Rk and decrease Mr2. This contradicts
the results from screening 1 which showed that an increase in reciprocating speed
will decrease the core roughness. The difference in the effect of the reciprocating
speed was believed to be related to de decoupling from the rotational speed in the
spindle. An interesting observation is the small significance of the factor presented
for the Rvk-parameter. These results would suggest that by controlling the
reciprocal speed, Rk can be decreased without affecting Rvk. The increase in
significance joint with the change in effect calls for further exploration of the
reciprocating speed. The lowering of the rotational speed in spindle two on the

CHAPTER 5. EXPERIMENTAL PROCEDURES
49
other hand had no effect on the significance of the factor. This indicates that no
further investigation is needed.
Another observation was the increase in significance for the number of strokes in
the second step in the second spindle. An interesting fact is that the number of
strokes seems to affect the Rvk-parameter in a negative way, reducing the valley
depth as the number of strokes increases. This would suggest that a higher number
of strokes will, instead of increasing the amount of grooves, create a smooth
surface. In order to increase the understanding of the parameter, a larger amount
of data is needed.
5.2 Optimization
Based on the results from the second screening test, five factors were found to be
of interest for an optimization test. All factors tested in the optimization test as
well as their high and low values that were investigated can be found in Table 5.
Table 5 Factors investigated in the optimization test and their value spans.
Spindle Parameter Abbreviation Low
level
High
level
Unit
2 Step 2 Force F22 70 100 %
2 Step 2 Number of Strokes NoS22 5 13 strokes
3 Force F3 40 80 %
3 Reciprocating Speed ReS3 12 24 m/min
3 Number of Strokes NoS3 5 13 strokes
A CCF design was applied generating 29 test runs. This was complemented with
the runs of a 2 III5−2 fractional factorial design and an additional center point to
increase the accuracy of the experimental design. The total number of tests was
thereby 38. The full experimental design is presented in A3.
5.2.1 Experimental details
To increase the statistical significance of the results from the optimization test, the
number of liners measured was increased. Because of the increase in test pieces,
the transition pieces became subject to discussion mainly for economic reasons.
The first two liners produced in tests 17, 18 and 19 from both screening tests were

50
measured in order to evaluate if the machine needs a number of liners to adapt to
the new settings. It was found that changes in machine settings could be observed
on responses instantly. Based on this information, no running-in liners were used
in the optimization test.
Three liners were machined for each test run and each liner were then measured at
12 points with 180 degrees between the measuring lines. The specifications for
the measurement equipment can be found in the beginning of the chapter. Outliers
in the measurement data were excluded using the same criteria as in the screening
tests.
The workpieces used during the test series were machined in one sequence in the
production line. As a result, all pieces were rough honed and turned during similar
conditions.
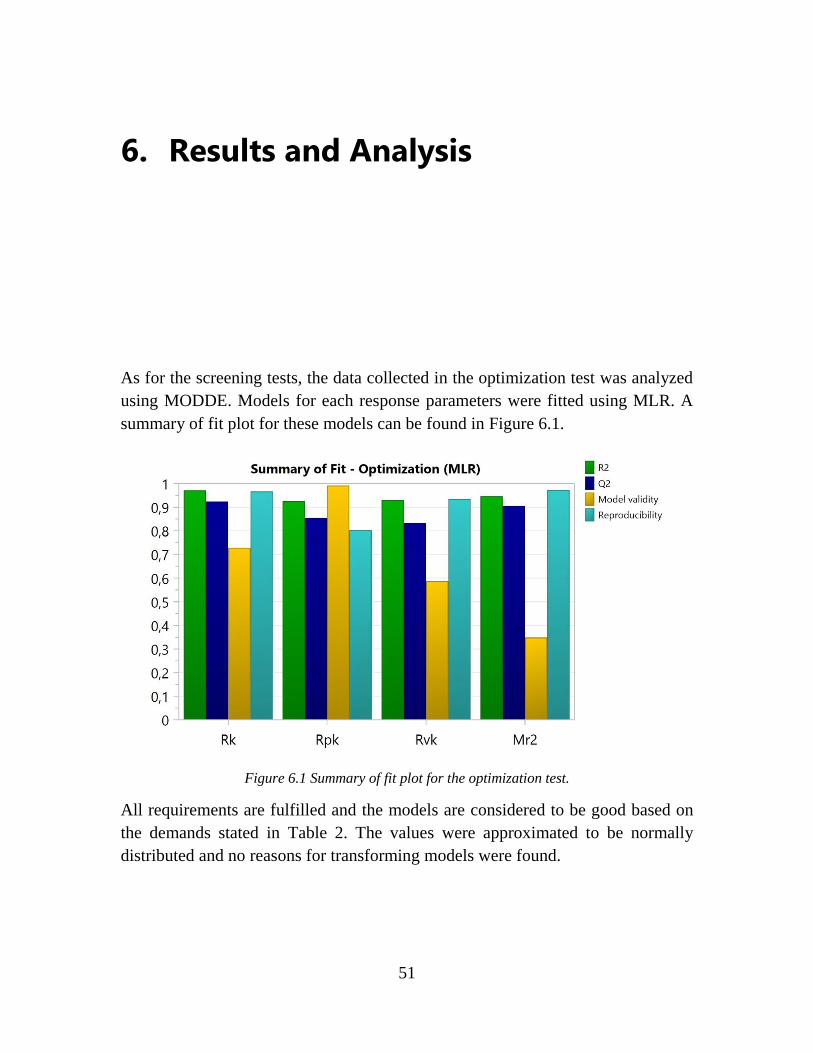
51
6. Results and Analysis
As for the screening tests, the data collected in the optimization test was analyzed
using MODDE. Models for each response parameters were fitted using MLR. A
summary of fit plot for these models can be found in Figure 6.1.
Figure 6.1 Summary of fit plot for the optimization test.
All requirements are fulfilled and the models are considered to be good based on
the demands stated in Table 2. The values were approximated to be normally
distributed and no reasons for transforming models were found.

52
6.1 Effects per surface parameter
Since the surface parameters relate to each other in different ways, an
optimization of the process must be a balance between the factors affecting the
different parameters. In order to do this, the parameters were first analyzed one by
one.
6.1.1 Parameter Rvk
No factors were found that significantly increase the value for Rvk. Since relatively
high values for the Rvk-parameter are preferred an optimization means knowing
how to achieve good values for the other surface parameters without decreasing
the Rvk-value too much. An effect plot with all factors influencing Rvk is found in
Figure 6.2.
Figure 6.2 Effect plot from the optimization test for Rvk.
As indicated by the screening tests, the force and number of strokes in the plateau
honing operation have the most significant effect on the reduced valley depth. The
optimization results did however give some clarity regarding in what way these
factors affect the Rvk-parameter. The squared terms for the force and number of
strokes indicates that these factors have non-linear effects on the valley depth.
Furthermore, the combined term F3*NoS3 indicates that the factors are dependent
on each other. Combined factor effects are important to analyze. This is since the
effect of a changes to a factors might show in different ways depending on the
settings of the other factor in the combination. A contour plot showing the joint

CHAPTER 6. RESULTS AND ANALYSIS
53
effect of force and number of strokes in the plateau honing on Rvk is found in
Figure 6.3. The figure shows the effect when all other parameters are set to
medium values. The Rvk-values are symbolized by a colored scale with yellow
representing low values and blue representing high values.
Figure 6.3 Joint impact of number of strokes and force in spindle three on Rvk.
According to the results, the largest values for valley depth can be generated when
using a low force and a medium number of strokes in the plateau honing
operation. High values for both factors result in a low Rvk-value. When using a
low force, the effect of changes in the number of strokes is much smaller than
when using a large force. The same applies for changes in force when using a low
number of strokes.
In the screening tests, the number of strokes in spindle 2 showed to have a
negative effect on the Rvk-parameter. In the model obtained from the optimization
test however, the factor contributes with a squared term. This indicates that the
number of strokes in the base honing operation in fact has a non-linear effect on
the reduced valley depth. Figure 6.4 shows a graph representing the effect with
different numbers of strokes in spindle 2.

54
Figure 6.4 Factor effect for number of strokes in the base honing on Rvk.
The graph indicates that favorable values for the Rvk-parameter are obtained by
using either a low or a high number of strokes in spindle 2. This factor also
showed to have a combined effect with the force in the same operation. The
combined effect of these factors can be viewed in Figure 6.5. As in the previous
contour plot, lower Rvk-values are represented by yellow and high values by blue
color. Important to note is however that the scale in this plot includes a smaller
range of Rvk-values since the effect of these factors in spindle 2 are less significant
than from the corresponding ones in spindle 3.
Figure 6.5 Combined effect of number of strokes and force in spindle two on Rvk.

CHAPTER 6. RESULTS AND ANALYSIS
55
The largest valley depth can be found when combining either low force and few
strokes or large force and a large number of strokes. When using a medium
number of strokes, the effect of changing the force showed to be insignificant and
these settings always generate lower values for Rvk, which is also consistent with
the non-linear effect of the number of strokes.
6.1.2 Parameter Rk
The main effects on the core roughness depth showed to come from the plateau
honing operation. This is consistent with the results from the screening tests. The
force in spindle 3 did however, in the optimization test, show to have a larger
impact than indicated by the screening tests. The force as well as the number of
strokes in the plateau honing also contribute with quadratic factors to the model.
This indicates that their effects on the Rk-parameter are non-linear. All factors and
their effect can be seen in Figure 6.6.
Figure 6.6 Effect plot from the optimization test for Rk.
As for the valley depth, force and number of strokes in the third spindle also have
a joint impact on the core roughness depth. This combination term is further
discussed in section 6.2. The reciprocating speed in the plateau honing operation
still showed to have a positive impact on the Rk-parameter. This indicates that
lowering the reciprocating speed in the third spindle will reduce the core
roughness depth of the surface. This is an interesting observation since this is the
only factor that can be used for reducing the Rk-parameter which does not have a

56
significant negative impact on the Rvk-parameter for which high values are
desired.
6.1.3 Parameter Rpk
As for the other surface parameters, the factors in the plateau honing operation are
of the most significance for the resulting Rpk-value of the surface. The results are
to a large extent consistent with those in the screening tests. All factors and their
effect can be viewed in Figure 6.7.
Figure 6.7 Effect plot from the optimization test for Rpk.
The squared term for the number of strokes in spindle 3 is a new contribution
indicating a non-linear impact on the Rpk-parameter. In all, the reduced peak
height is to a large extent affected by the same factors as the Rk-parameter. The
main difference is that the impact of the different factors is of smaller significance
for Rpk than for Rk. This suggests that the reduced peak height is a more stable
parameter than the core roughness depth.
The reciprocating speed in spindle 3 showed to be of significance influencing the
reduced peak height in the same way as the core roughness depth. This is, as
mentioned in the previous section, interesting from a optimization point of view
since the reciprocating speed has no major impact on the Rvk-parameter.

CHAPTER 6. RESULTS AND ANALYSIS
57
6.1.4 Parameter Mr2
The results regarding the Mr2-parameter are to a great extent consistent with those
from the screening tests. As in the second screening test, all factors from the base
honing step has been excluded from the model which thereby only consists of
factors in the plateau honing step. All significant factors and their effect can be
seen in Figure 6.8.
Figure 6.8 Effect plot from the optimization test for Mr2.
As for the other surface parameters, the force and the number of strokes in the
plateau honing operation has the largest impact on the resulting Mr2-value. The
model also contains a squared term for the plateau honing force which indicates a
non-linear impact on the parameter. A plot for the effect of the force in spindle 3
on Mr2 with all other factors set to their medium values is found in Figure 6.9.
Figure 6.9 Effect plot for plateau honing force on the Mr2-parameter.

58
As can be seen in the plot, changes in the lower regions of the plateau honing
force showed to have a larger impact on the resulting Mr2-value than changes in
the higher region.
6.2 Finding optimal settings
In order to create the optimal surface, the machine settings need to be appropriate
in aspect of all surface parameters. Since some factors have different effect on
different surface characteristics, compromises have to be made. The correlation
between the different surface parameters must also be taken into consideration.
The constants for all surface parameter correlations found by MODDE when
fitting the models are found in Table 6. The scale of the coefficients goes from -1
to 1 where values close to 0 indicates that no linear correlation exists between the
parameters.
Table 6 Correlation matrix for surface parameters.
Rk Rpk Rvk Mr2
Rk 1 0,891 0,725 -0,848
Rpk 0,891 1 0,768 -0,853
Rvk 0,725 0,768 1 -0,951
Mr2 -0,848 -0,853 -0,951 1
The strongest correlation was found to be between Rvk and Mr2. A coefficient
value so close to -1 indicates an almost linear relationship between the parameters.
The fact that the coefficient is negative means that an increase in one of the
parameters will result in a lower value of the other parameter. This result is
consistent with operator experience. This negative correlation is important to take
into consideration when optimizing the process since high values for both
parameters are desired.
There are also negative correlations between Rk and Mr2 as well as between Rpk
and Mr2. These negative correlations are however favorable from an optimization
point of view since the aim is to minimize Rk and Rpk while maximizing Mr2.
Furthermore, the Rk- and Rpk-parameter s both have positive correlations with Rvk.
This means that an increase of the Rvk-parameter often also leads to an increase in
the values for Rk and Rpk. This is an important observation when it comes to

CHAPTER 6. RESULTS AND ANALYSIS
59
optimization and further promotes the need for compromises between the
parameters.
The force and number of strokes in the plateau honing have shown to be of great
significance for all surface parameters. These parameters have also contributed
with combination factors to the models. The combined effect of these factors on
the different surface parameters can be seen in Figure 6.10. For Rk and Rpk low
values are favorable, indicated by yellow color, while for Rvk and Mr2 high values
are preferred, which is indicated by blue color.
Figure 6.10 Response contour plot for surface parameters as a function of force and number of
strokes in spindle 3.
The plots suggest that the areas in the upper right corners with high settings for
both factors will generate good values for Rk, Rpk and Mr2. The Rvk-value however,
will be low when using such settings. Favorable Rvk-values will be generated when
using low settings for both factors. This indicates that a compromise is needed to
get a surface satisfying the demands for all surface parameters. This finding is also
consistent with the found correlations between the parameters. As mentioned in
section 6.1.1, no parameters that have a linear positive impact on the Rvk-
parameter have been found. The optimization of this parameter instead needs to be
a balance of minimizing the negative impact on the value when optimizing the
other parameters. The only parameter that has been found to improve the values of
all other parameter without having a negative impact on the Rvk-value is the

60
reciprocating speed in the plateau honing. Even though this factor is not the one
with the largest effect on the Rk-, Rpk- and Mr2-parameters, it should be taken into
consideration when optimizing the process. This is since the cylinder liner surface
demands are so thorough that all improvements can make a difference. If the use
of a lower reciprocating speed can enable a lowering of the use of number of
strokes or force in the plateau honing, a more beneficial cylinder liner surface can
be created.
6.3 Analysis
The force was one of the main influencing factors out of those tested for each step.
This is consistent with a major part of the research conducted on the subject.
When analyzing the spindles all together, there was however a great variation in
impact on resulting surface. The plateau honing operation has the main effect on
all response parameters. The base honing affects the surface texture to some
extent while the coarse honing can be considered negligible. This strongly
contradicts the research conducted by Pawlus et.al. in which it was found that the
plateau honing pressure was to be considered insignificant. No valid explanation
has been found regarding the difference in stated impact from the plateau honing
force. A larger amount of information from the study conducted by Pawlus et. al.
would be necessary to draw further conclusions.
According to analyzed literature, a higher base honing pressure should press the
grains further into the workpiece, creating deeper grooves. This suggests that an
increase in force in the base honing should be an effective way to increase the
valley depth of the surface. In the tests performed, no factors have been found to
significantly increase the Rvk-parameter. These results indicate that the grains of
the stones used will not penetrate the surface deeper with an increase in force.
This calls for further analysis of the use of different stones to see if the effects of
changes in parameter settings differ between stone types.
In the performed experiments, the number of strokes in combination with other
parameters was used to control the duration of the honing. The number of strokes
in the plateau honing showed to be of large significance for the surface roughness.
This is consistent with previous studies where the honing time has been found to
be of great importance. It is however difficult to make a solid conclusion whether

CHAPTER 6. RESULTS AND ANALYSIS
61
the effect of honing time is the same as in analyzed literature due to the use of
different surface response parameters.
A parameter that according to literature should be of significance is the cutting
speed. When the factor was varied during experimentation, with a constant honing
angle, no major effect could be identified. When the reciprocating speed instead
was varied independently of the rotational speed, the impact on the surface
roughness increased. This is to some extent consistent with the research conducted
by Kanthababu et al. which stated that reciprocating speed in the plateau honing
should have an effect mainly on Mr2. In the experimentation performed during this
project, the reciprocating speed did however show to have some effect on all
surface parameters.
Results were also found that can be used to make the current machine
compensation procedure more efficient. The results presented shows, in line with
analyzed literature, that the coarse honing process has a negligible effect on the
resulting surface roughness. The effect of varying the allowance in the base
honing operation was also significantly reduced once it was determined that no
grooves created in the coarse honing step were to be found on finished surface.
This suggests that the allowance should not be varied once a good setting for this
factor is found.
With the apprehended results, the procedure regarding compensation for low Rvk-
values can be modified. In current production, the base honing pressure is
increased to get deeper grooves. Since it was found that this will not have any
significant effect on the valley depth, the factor should instead be set to an
appropriate level and then kept fixed. An efficient way of increasing Rvk is to vary
the force and number of strokes in the plateau honing operation. Even though this
compensation was applied before, it did not take the combined effect of the factors
into consideration. When varying the force and number of strokes individually,
there is a substantial risk that no significant change is observed in valley depth
while the values for the other surface parameters are worsened.
The current compensation for Rk- and Rpk-values are focused on the correct
parameters. As for the compensation for low Rvk-values, the joint effect of the
force and number of strokes in the plateau honing should also be taken into
account. By understanding the combination, smaller changes can give a more

62
successful result. A factor that should also be added to this compensation is the
reciprocating speed. It is the only parameter found that can decrease Rpk- and Rk-
values without affecting the Rvk-values negatively.
6.3.1 Result uncertainty
Like all processes, honing has built in variations which involve some uncertainty
of the results. The variation that could not be controlled during the experiments is
described in this section. There are different variation sources such as machines,
human factors and environmental effects.
Some of the variation in the process originates from the machine itself. During the
optimization tests, the honing stones were subjected to wear. This suggests that
the cutting ability of stone will vary over the length of the experimental run. This
variation is however hard to predict since the breakage of the grain and generation
of new cutting edges in the stone are stochastic variations.
Another machine variation that was hard to take into account during the tests,
were the different fixtures used. In order for the tests to be practically feasible, all
fixtures had to be included. The liners position in the fixture was also a parameter
that could not be traced. This means that the measurements performed were
conducted on different places in the liner relative to the position in the machine.
Some variation also originates from the environment in contact with the machine.
Parameters connected to the location of the machine such as humidity,
temperature and other processes generating vibrations can affect the output of the
machine. The temperature in this case should have lower effect than many other
machining processes due to the use of honing oil.
During the measurements of the liners machined in the optimization test, 12 points
were measured in every liner. One major uncertainty during the measurement is
the liner surface itself. Since surface roughness can vary greatly on the same liner
it is difficult to determine whether the data is representative for the whole surface
or not. The amount of time needed to measure the liners once they were machined
were however an issue. Due to the time limitation of the project, a compromise
was made in order to collect a sufficient amount of data without spending too
much resources.

CHAPTER 6. RESULTS AND ANALYSIS
63
The previously mentioned uncertainties all relate to the physical process of
honing. Another kind of uncertainty that has to be accounted for is the sample size
during the experiment. The larger the sample size is, the better it is out of a
statistical point of view. During the optimization tests the sample size was limited
to three pieces per test run. This was considered to be reasonable number in
regards of statistical significance and practical feasibility.
The only measures taken to reduce the effect of time dependent variation was to
randomize the test. By applying this technique, the effect of these variations
should be reduced. Even though this measure is taken, all of these uncertainties
should be taken into consideration when reviewing the results.

64

65
7. Conclusions
By using Design of Experiments (DOE), the honing process parameters with the
largest influence on the surface roughness of a cylinder liner have been identified.
Models were created in order to understand and predict the impact of these
factors, both individually and in combination with other factors. The main
conclusions drawn are presented below.
The plateau honing step is of main importance for the surface roughness.
The force and the number of strokes in the plateau honing step are the main
influencing factors.
Due to correlation between response parameters, compromises have to be
made when searching for the optimal settings.
By identifying the plateau honing step as the one having the largest impact on
surface roughness, machine controls can be reduced. The coarse- and base honing
can be set to appropriate levels and be kept fixed during production. Instead, the
operators can focus on compensating for deviating surface parameter values by
altering the plateau honing step. This enables a more stable process with a reduced
number of factors that can be changed, ultimately reducing the risk of
compensation error in the process.
Besides from their individual effect on the surface, the number of strokes and the
force in the plateau honing showed to have a large combined effect for all surface
parameters. This means that machine compensation using one of these variables
can be insignificant depending on the settings of the other factor. Another
important discovery is the effect from the reciprocating speed. When

66
disconnecting the relationship between the reciprocating speed and the rotational
speed in the plateau honing, it can be used to affect the surface quality. The
reciprocating speed was found to be the only factor able to reduce Rk and Rpk
without also reducing Rvk. There are no results in analyzed literature showing this
effect.
In this thesis, multiple non-linear and combination factor effects were identified.
No such combination effects have been found in the studied literature. The
discoveries of this paper would be hard to detect using the current methodology
based on the OVAT-approach. When the method of DOE was applied
complemented with thorough research, the investigation could be performed in an
efficient way. No evident flaws were detected in the method and it is to be
considered as very useful for the kind of investigations performed in this project.
To complement the method with software is however recommended due to the
high amount of data generated.
Since all experiments in this project were performed in the same honing machine
there is no guarantee that the results apprehended will be applicable in other
machines. Some of the findings do however have support in existing literature
which indicates that the results can to some extent be considered general.
Furthermore, the experiments have been performed with honing stones in varying
conditions and the results have still been consistent between the different test
series. The fact that, to a large extent, the same factors has shown to affect the
surface in the same manner indicates that the results are applicable regardless of
the state of the honing stones. The main difference between the honing machine in
question and general honing machines is that the base honing operation is divided
into two steps. Therefore the applicability of the results regarding this spindle in
other machines might be questionable. Overall, the results should still be of
interest for other honing processes as well. The way the different factors affect the
surface should be similar even though the extent of their effect may vary from
machine to machine.
7.1 Future work
The objective of this thesis was to increase the understanding of honing process
parameters on surface roughness. As stated in the introduction chapter, several
factors with a probable effect on the process was disregarded from due to the

CHAPTER 7 CONCLUSIONS
67
limited amount of time and resources available in the project. To focus on the
process parameters and get a greater understanding of their effect was a first step
in understanding the whole process of honing. Further research should be
conducted to get a better overview of factors with impact on the process.
A major factor excluded from this thesis is the honing stone used in the machine.
There has been research made on the different bonding- and grain materials while
the deterioration of the stones is an area where further investigation is needed. In
order to apply the settings and machine compensation techniques presented in this
thesis, the wear over time and its effect on surface roughness should be mapped. If
the natural variation of the process is unknown, there is a risk that compensation
will be performed at the wrong time, generating a unsatisfactory surface.
An interesting next step to understand honing would also be to use the results in
this thesis and apply these using different honing stones. This would give and
understanding regarding both the relevance of the stated results as well as the
effect of different honing stones.
Lastly, the impact of workpiece material and geometry on surface roughness
should be researched. By getting a better understanding of the deformation of the
liner during honing the setting of machine controls can be appropriately adjusted
and better results generated.

68

69
8. References
[1] Scania AB. Scania Year-end Report January–December 2014.
Södertälje:Scania AB; 2014.
[2] Scania AB. Products & Services. [Internet] Södertälje: Scania AB; 2013.
Cited 150316. Available: http://www.scania.com/products-services/.
[3] Scania AB. Scania Euro 6 - setting the standard. [Internet]. Södertälje:
Scania AB. Cited 150319. Available: http://www3.scania.com/sv/Scania-
Euro6/Scania-Euro6/.
[4] European Comission. Reducing CO2 emissions from Heavy-Duty Vehicles.
[Internet]. European Comission. Cited: 150316. Updated: 150210. Available:
http://ec.europa.eu/clima/policies/transport/vehicles/heavy/index_en.htm.
[5] Sadeghi F, Bolander N. Deterministic Modeling of Honed Cylinder Liner
Friction. Tribology Transactions. 2007;50(2): 248-56
[6] Feng CX, Wang X, Yu Z. Neural Networks Modeling of Honing Surface
Roughness Parameters Defined by ISO 13565. Journal of Manufacturing
Systems. 2002; 21(5):395-408
[7] El-Hofy AH, Youssef H. Machining technology, machine tools and
operations. CRC Press; 2008.
[8] Goeldel B, Voisin J, Dumur D, El Mansori M, Frabolot M. Flexible right
sized honing technology for fast engine finishing. CIRP Annals.
2013;62(1):327-330

70
[9] Bähre D, Schmitt C, Moos U. Analysis of the Differences between Force
Control and Feed Control Strategies during the Honing of Bores. Procedia
CIRP.2012;1:377 –81
[10] Webster J, Tricard M. Innovations in Abrasive Products for Precision
Grinding. CIRP Annals - Manufacturing technology. 2004;53(2):597–617
[11] Klocke F. Manufacturing processes 2. Berlin: Springer-Verlag; 2009.
[12] Kanthababu M, Shunmugam MS, Singaperumal M. Tool condition
monitoring in honing process using acoustic emission signals. Int. J.
Automation and Control. 2008;2(1):99-112
[13] Buj-Corral I, Vivancos-Calvet J. Roughness variability in the honing process
of steel cylinders with CBN metal bonded tools. Precision Engineering.
2011;35(2):289-93
[14] Lee J, Malkin S. Experimental investigation of the Bore Honing Process.
Journal of Engineering for Industry. 1993;115(4):406-9
[15] Griffiths B. Manufacturing Surface Technology [Internet]. Elsvier Ltd,
2001[150223] Available from:
http://www.sciencedirect.com.focus.lib.kth.se/science/book/9781857180299
[16] ISO 4287:1997.Geometral Product Specifications (GSP) - Surface texture:
Profile method - Terms, definitions and surface texture parameters.
[17] Sahoo P. Surface topography. In: Paulo Davim J, editor. Tribology for
Engineers, Cambridge, UK: Woodhead Publishing Limited; 2011.
[18] ISO 13565-2:1996. Geometrical product specifications (GPS) - Surface
texture: Profile method; Surfaces having stratified functional properties -
Part 2: Height characterization using the linear material ratio curve.
[19] Leach R (Editor), Introduction to surface topography. In: Leach R, editor.
Charaterisation of Areal Surface Texture. Berlin: Springer- Verlag; 2013.
[20] MKS Umetrics AB. MODDE, 10.1[Computer software]. MKS Umetrics
AB.

71
[21] Montgomery DC. Design and Analysis of Experiments. 5th edition. New
York: John Wiley & Sons, Inc.; 2001.
[22] Mee R. A Comprehensive Guide to Factorial Two-Level Experimentation.
London/New York: Springer Dordrecht Heidelberg; 2009.
[23] Antony J. Design of Experiments for Engineers and Scientists. 2nd edition.
London: Elsevier Ltd.; 2014.
[24] Mason R, Gunst R, Hess J. Statistical Design and Analysis of Experiments:
With Applications to Engineering and Science. 2nd edition. John Wiley &
Sons, Inc.; 2003.
[25] Box G, Hunter J, Hunter W. Statistics for Experimenters - Design,
Innovation and Discovery. 2nd edition. Hoboken, New Jersey: John Wiley &
Sons, Inc.; 2005.
[26] Eriksson L, Johansson E, Kettaneh-Wold N, Wikström C, Wold S. Design of
Experiments, Principles and Applications, 3rd rev. and enlarged edition,
Umeå: MKS Umetrics AB; 2008.
[27] MKS Umetrics AB, ”www.umetrics.com,” 10 02 2014. [Online]. Available:
http://www.umetrics.com/sites/default/files/downloads/1/user_guide_to_mod
de_10.1.pdf. [Använd 30 03 2015].
[28] Kanthababu M, Shunmugam M, Singaperumal M. Identification of
significant parameters and appropriate levels in honing of cylinder liners. Int.
J. Machinability of Materials. 2009;5(1):80-96
[29] Vrac DS, Sidjanin LP, Balos SS. Mechanical finishing honing: cutting
regimes and surface texture. Industrial Lubrication and Tribology.
2011;63(6):427-32
[30] Gafarov AM, Gafarov V, Aliev GS. Surface roughness in honing with dosed
removal of surface layer. Russian engineering research. 2011;31(10):1030-
33

72
[31] Rosén B, Thomas T. Relationship of the plasticity index to machining
parameters. International Journal of Machine Tools & manufacture.
2001;41(13):2061-69
[32] Pawlus P, Cieslak T, Mathia T. The study of cylinder liner plateau honing
process. Journal of Materials Processing Technology. 2009;209(20):6078-
86vol. 209, pp. 6078-6086, 2009.
[33] Santochi M, Giusti F, Vignale M. A study on the functional properties of a
honed surface. CIRP Annals - Manufacturing Technology. 1982;31(1):431-
34
[34] Vrac DS, Sidjanin LP, Kovac PP, Balos SS. The influence of honing process
parameters on surface quality, productivity, cutting angle and coefficients of
friction. Industrial Lubrication and Tribology. 2012;64(2):77-83
[35] Cabanettes F, Dimkovski Z, Rosén B. Roughness variations in cylinder
liners induced by honing tool's wear. Precision Engineering. 2015;41:40-46
[36] El Mansori M, Goedel M, Sabri L. Performance impact on honing dynamics
on surface finish of precoated cylinder bores. Surface & Coatings
Technology. 2013;215:334-39
[37] Saljé E, von See M. Process-Optimization in Honing. Annals of the CIRP.
1987;36(1):235-39

i
A1. Test runs Screening 1
Spindle 1 Spindle 2 step 1 Spindle 2 step 2 Spindle 3
Run F1 F21 Rot21 ReS21 A21 F22 RoS22 ReS22 NoS22 F3 RoS3 ReS3 NoS3
1 78 58 160 32 40 85 160 32 10 50 160 32 9
2 60 45 130 26 30 70 130 26 5 30 190 38 14
3 95 45 130 26 50 100 190 38 5 30 190 38 4
4 95 45 190 38 30 70 190 38 5 70 190 38 4
5 60 45 130 26 50 70 190 38 15 70 130 26 14
6 60 70 130 26 50 100 130 26 15 30 190 38 4
7 95 70 190 38 30 100 130 26 5 30 130 26 14
8 60 45 190 38 30 100 190 38 15 30 130 26 14
9 60 70 190 38 30 70 130 26 15 70 190 38 4
10 78 58 160 32 40 85 160 32 10 50 160 32 9
11 95 70 190 38 50 100 190 38 15 70 190 38 14
12 95 70 130 26 30 70 190 38 15 30 190 38 14
13 60 70 190 38 50 70 190 38 5 30 130 26 4
14 60 70 130 26 30 100 190 38 5 70 130 26 4
15 95 70 130 26 50 70 130 26 5 70 130 26 14
16 95 45 190 38 50 70 130 26 15 30 130 26 4
17 95 45 130 26 30 100 130 26 15 70 130 26 4
18 60 45 190 38 50 100 130 26 5 70 190 38 14
19 78 58 160 32 40 85 160 32 10 50 160 32 9

ii
A2. Test runs Screening 2
Spindle 2 step 1 Spindle 2 step 2 Spindle 3
Run Rot21 ReS21 A21 F22 RoS22 ReS22 NoS22 F3 RoS3 ReS3 NoS3
1 150 30 45 75 150 30 10 70 140 25 10
2 190 38 35 50 110 22 14 50 140 35 14
3 110 22 55 50 110 22 14 90 140 15 14
4 110 22 35 100 190 38 14 50 140 15 14
5 190 38 35 100 110 22 14 90 140 15 5
6 190 38 55 50 110 22 5 90 140 35 5
7 110 22 55 100 190 38 5 90 140 15 5
8 110 22 55 50 190 38 5 50 140 35 14
9 190 38 35 50 190 38 5 90 140 15 14
10 150 30 45 75 150 30 10 70 140 25 10
11 190 38 55 50 190 38 14 50 140 15 5
12 190 38 55 100 190 38 14 90 140 35 14
13 110 22 35 50 190 38 14 90 140 35 5
14 190 38 55 100 110 22 5 50 140 15 14
15 110 22 55 100 110 22 14 50 140 35 5
16 110 22 35 100 110 22 5 90 140 35 14
17 190 38 35 100 190 38 5 50 140 35 5
18 110 22 35 50 110 22 5 50 140 15 5
19 150 30 45 75 150 30 10 70 140 25 10

iii
A3. Test runs Optimization
Run F22 NoS22 F3 ReS3 NoS3 Run F22 NoS22 F3 ReS3 NoS3
1 85 9 60 18 9 20 100 5 40 12 5
2 85 9 60 12 9 21 70 5 40 12 13
3 100 5 80 24 5 22 70 5 80 12 5
4 100 5 40 24 13 23 85 9 80 18 9
5 70 5 40 24 5 24 85 9 60 24 9
6 85 9 60 18 5 25 70 13 80 12 13
7 100 9 60 18 9 26 70 13 40 24 13
8 85 5 60 18 9 27 85 13 60 18 9
9 70 9 60 18 9 28 85 9 40 18 9
10 100 13 40 24 5 29 85 9 60 18 9
11 70 13 40 12 5 30 100 5 80 12 5
12 70 13 80 24 5 31 100 5 40 12 13
13 85 9 60 18 13 32 70 5 40 24 13
14 100 13 80 24 13 33 70 5 80 24 5
15 85 9 60 18 9 34 70 13 40 12 5
16 70 5 80 24 13 35 100 13 80 24 13
17 100 13 80 12 5 36 100 13 40 24 5
18 100 13 40 12 13 37 70 13 80 12 13
19 100 5 80 12 13
Related Documents