European Journal of Government and Economics Volume 4, Number 1 (June 2015) ISSN: 2254-7088 The impact of good governance in the economic development of Western Balkan countries Engjell Pere, European University of Tirana Abstract After the socio-economic transformation and the establishment of the free market institutions, the development and improvement of living standards in post-transition economies are deemed to depend more and more on the so called secondary ‘generating’ reforms, at the core of which is the good governance. Drawing from this approach, this article seeks to address the role and the effect of the good governance in the economic development of the Western Balkan countries. More specifically, the article investigates the impact of good governance in the rates of economic growth of GDP. The article adopts a quantitative methodology approach, i.e. an econometric model based on the examination of a panel – data of good governance indicators for Western Balkan countries for the period 1996 – 2012. The analysis concentrates on Albania, Bosnia and Herzegovina, Croatia, Kosovo, Macedonia, Montenegro and Serbia. Keywords Western Balkans; good governance; economic growth; governance index. JEL classification H110; O40; R58. 25

Welcome message from author
This document is posted to help you gain knowledge. Please leave a comment to let me know what you think about it! Share it to your friends and learn new things together.
Transcript

European Journal of Government and Economics Volume 4, Number 1 (June 2015)
ISSN: 2254-7088
The impact of good governance in the economic development of Western Balkan countries
Engjell Pere, European University of Tirana
Abstract After the socio-economic transformation and the establishment of the free market institutions, the development and improvement of living standards in post-transition economies are deemed to depend more and more on the so called secondary ‘generating’ reforms, at the core of which is the good governance. Drawing from this approach, this article seeks to address the role and the effect of the good governance in the economic development of the Western Balkan countries. More specifically, the article investigates the impact of good governance in the rates of economic growth of GDP. The article adopts a quantitative methodology approach, i.e. an econometric model based on the examination of a panel – data of good governance indicators for Western Balkan countries for the period 1996 – 2012. The analysis concentrates on Albania, Bosnia and Herzegovina, Croatia, Kosovo, Macedonia, Montenegro and Serbia.
Keywords Western Balkans; good governance; economic growth; governance index.
JEL classification H110; O40; R58.
25

Pere ● Governance and economic development of Western Balkan countries
Introduction This article aims at identifying the correlation between good governance and economic growth in the Western Balkan countries. After the political change in the 1990s, the economic development of these countries, for several years, was characterized by high economic growth rates, benefiting from the new political system based on democracy and transformation of economy towards the free market one. Growth rates of GDP, in most Western Balkan countries, particularly prior to 2008, have been much higher than in West European countries. However, this positive development is accompanied with many lacks and critics regarding good governance; particularly in the area of corruption, law enforcement, property rights, etc.
Many political and economic scholars argue that good governance is one of the main factors, not only for the democratic development of the country, but it is also one of the primary factors in the economic growth. But some others are critical of this approach, arguing that this correlation can be only theoretical and there is not enough evidence to support it.
In this light, the main research question refers to the attempt to confirm the correlation between improvement of governance and economic growth in Western Balkan countries. Based on the positive data of economic growth on one side, and problematic aspects of good governance in these countries on the other, the main hypotheses is that in the Western Balkans, there is no clear evidence to support a positive correlation between good governance and economic growth.
The methodological approach of this article is rather simple and as follows: upon completion of a literature review, the article analyses through descriptive interpretation the data on economic growth in Western Balkan countries and at the same time, for the same period, the indicators of good governance are also examined as estimated by international institutions. Further, the article presents an econometric model, which shows the relation between good governance and economic growth for different countries in the Western Balkans.
From the statistical point of view, the article uses the databases of the World Bank (World Governance Indicators - WGI), which bring together considerable data and statistical indicators from different economic, social and political international institutions. It is necessary to emphasize that this article does not seek to evaluate or discuss neither the content nor the reliability of the data published by the WGI.
The analysis, as stated above, relates only to the region of the Western Balkans, and thus includes seven countries: Albania, Bosnia & Herzegovina, Croatia, Kosovo, Macedonia (FYROM), Montenegro and Serbia. Drawing conclusions on the correlation between good governance and economic growth based on data for only seven cases might certainly have some weaknesses in argumentation. However, the presented work does not aim to draw general and universal theoretical conclusions, but only to illustrate the above correlation in this region.
It is also necessary to remark that the analysis focuses on the period from 1996 to 2012. This relatively short period is related to the radical political and economic change in the Western Balkans, which started in the beginning of the 1990s.For the purposes of this analysis, it is not relevant to take into analysis the period before these changes occurred in the. This implies that the conclusions of the article should be considered only for this specific period and can be different in the long run.
Following the introduction, the paper will continue with three other sections: section 2 will present the variation of good governance indicators in Western Balkan countries; section 3 shows the positive economic growth in the region; and section 4 analyzes the correlation between economic growth and good governance. The results of econometric model are shown in annexes at the end of the paper.
26

European Journal of Government and Economics 4(1)
Literature review Many theoretical as well as empirical studies are dedicated to evidencing the relation between good governance and economic growth. There is a common acceptance that good governance is one of the main factors, not only for the democratic development of the country, but it is also a primary factor in the economic development. In this regard, Hall and Jones (1999) stress that the difference between economic developments in different countries, productivity, accumulation of capital etc., can be explained essentially by the difference in social structure. ‘The central hypothesis … is that the primary, fundamental determinant of a country's long-run economic performance is its social infrastructure. By social infrastructure, we mean the institutions and government policies that provide the incentives for individuals and firms in an economy’ (Hall and Jones, 1999). In this regard the evaluation of Kaufmann (2003) is rather interesting, in which he analyzes the economic development of a certain number of countries for a long period (from 1970 still the beginning of 2000), and concludes that the slowing of growth rate of this last period (2002-2003) is not related only to the macroeconomic situation of certain countries, but also to the stagnation or the lowering of some of wellbeing standards, as are quality of the institutional structure, independence of the judiciary, level of corruption and the ease of doing business. Such results are also drawn by Roll and Talbott (2003), who conclude that about 80 percent of differences in GNI per capita between different countries ,can be explained by such factors as property rights, political rights, governance expenses, freedom of speech, etc., while negative effects come from excessive administrative regulation, informal economy, trade barriers, etc.
From a historical point of view, a particular approach is given by Acemoglu, Robinson and Jonson (2002). Based on empirical data, they argue why among colonized European countries, those who were wealthier in the 16th century, now after 500 years, are relatively poorer. According to them, this difference cannot be explained simply by the impact of geographic factors, but exactly from the role of political institutions in the economic development of these countries
As many authors highlight, good governance is seen as a key element in the economic development particularly in the developing countries. This thesis is related mostly to the fact that these countries inherit a limited market infrastructure which requires reforming governance initiatives to speed up free market initiatives and raise production (Khan, 2007). Based on empirical analysis, Khan (2007) argues for a substantial correlation between good governance and an increase of income per capita, seeing good governance as an important factor in economic growth.
In this framework, the so called ‘secondary generating reforms’, which have in their core good governance, are considered nowadays more and more important for the Eastern European countries, including the Western Balkans. Why ‘secondary’? The primary reforms in these countries are considered those that are related to the transformation of the country from a centralized economy to a free market system, the essence of which is establishing of free market institutions, i.e. privatizing, liberalization of economy, fiscal reform, building up of a new financial system, etc. After these reforms take place, the development of these countries is primarily related to good governance, in all aspects of this concept.
Drawing from this interrelation between good governance and economic growth, the question posed is: how can we evaluate good governance? Is it possible to have unique indicators/indices to determine all dimensions of ‘good governance’? As stated above, this is related to the market and particularly with its efficiency. In this way Knack (1995) determines five main indicators characterizing good governance: (i) corruption; (ii) legal framework; (iii) public administration efficiency; (iv) lack of contract execution by the government; and (v) expropriation. Knack aggregates above indices in one aggregated index, so named ‘property right index’, which is evaluated from 0 (lowest) to 50 (highest).
27

Pere ● Governance and economic development of Western Balkan countries
The World Bank has considered as a good governance index the one from Kaufmann, Kraay and Mastruzzi (2005), which groups it in six main pillars: (i) accountability and responsibility of governance – assessment of political and human rights; (ii) political stability and lack of violence – assessment of violent and terroristic acts; (iii) governance efficiency – the quality of public services; (iv) legal framework – assessment of politics which stumble the free market; (v) law enforcement – implementation of contracts, court verdicts, etc. (vi) corruption control – abuse of office for personal profits.
From a general review of the literature on economic growth and good governance, there should be mentioned that some authors are critical of this approach, showing that this correlation can be only theoretical and there is not enough evidence to support it (Kurtz and and Shrank, 2007). According to them the relation between economic growth and good governance can be obvious only in developed countries or in a very long period of time. In this context, this article seeks to test this hypothesis in the case of the Western Balkan countries. It aims at identifying the correlation between good governance and economic growth in this region.
Governance indicators in the Western Balkan countries When attempting to analyze the impact of good governance in economic growth, the first problem that rises is that of definition, i.e. what do we mean by ‘good governance’. It is a broad concept and in many aspects very difficult to measure, particularly in quantitative figures. For that reason in the political-economic literature there is no clear definition of this concept. However, the object of this article is not to analyze the problematic aspects related with indicators that are used to express the level of good governance of a country. From this point of view, this article adopts the definition of the World Bank regarding ‘good governance’ as provided in 2002 and later in 2007. In 2002 the World Bank defined the governance as ‘The ability of the state to provide those institutions that support growth and poverty reduction-often referred to as good governance-is essential to development’ (World Bank, 2002).The later definition was within the same perception (World Bank), in which governance is defined as ‘...the manner in which public officials and institutions acquire and exercise the authority to shape public policy and provide public goods and services.’ (World Bank, 2007).
To have a clearer definition, today we mostly refer to the Kaufmann and Kraay (2008) classification, which classifies governance indicators in two groups based on two main criteria: (a) what do they measure (b) on what sources and opinions they are based. Further, the first group of indicators includes two categories: (a.1) indicators who value the law enforcement or specific rules; and (a.2) indicators who value the concrete results of governance, specific politics or the outputs of this politics. Regarding the second group of indicators, which means where they are based, (sources, opinions, etc.), governance indicators are classified in two other categories: (b.1) indicators which result from evaluation of different experts, and (b.2) indicators which reflect the results of a sample’s observation from groups of individuals and firms. Although both methods have their weaknesses, this type of classification is important for the analysis and the results presented below.
In this framework, the analysis of good governance for Western Balkan countries is based on the six main indicators defined by the World Bank, (Kaufmann, Kraay and Mastruzzi, 2005), elaborated for the period 1996 – 2012.
1. Accountability of Governance. 2. Political stability and lack of violence. 3. Governance efficiency. 4. Legal framework. 5. Law enforcement.
28

European Journal of Government and Economics 4(1)
6. Corruption control.
The evaluation of these indicators form the World Bank is made by ranking 230 countries on the bases of percentiles, meaning the percentage of other countries that have a lower indicator that the given country. [Information about the elaboration’s sources of indices can be found in ‘Worldwide Governance Indicators’ for respective Countries 1992–2012.] The better the ranking, the more positive is considered the index of that country, because the percentage of the other countries which have a lower performance will be higher. Meantime, the World Bank makes an evaluation of each indicator of governance from –2.5 (bad performance) to +2.5 (good performance). Since this paper focuses on the analysis of the effect of good governance in Western Balkan countries, the analysis is not based on the ranking of the countries (percentile), but on the evaluation from -2.5 to +2.5. It is clear that the higher the evaluation, the higher the ranking of the country will be. The value for these indicators for Western Balkan countries in 2012 are shown in Table 1.
Table 1. Good governance indicators in Western Balkan Countries in 2012 (Index valuation and ranking in 230 countries)
ALB BIH HRV KSV MKD MNE SRB
Voice and Accountability
Index valuation 10 -0.14 0.48 -0.22 0.00 0.23 0.17
Rank 50 45 64 42 50 56 56
Political Stability & no Violence
Index valuation -0.16 -0.54 0.58 -1.15 -0.44 0.56 -0.22
Rank 40 29 64 15 33 64 39
Government Effectiveness
Index valuation -0.28 -0.47 0.70 -0.39 -0.07 0.13 -0.11
Rank 45 39 72 42 52 60 51
Regulatory Quality
Index valuation 0.17 -0.06 0.44 -0.04 0.35 0.01 -0.08
Rank 56 51 67 53 61 53 51
Rule of Law Index
valuation -0.57 -0.23 0.21 -0.56 -0.24 -0.01 -0.39
Rank 35 48 60 36 48 55 44
Control of Corruption
Index valuation -0.72 -0.30 -0.04 -0.62 0.02 -0.10 -0.31
Rank 27 49 57 30 59 55 48
Source: World Bank, Worldwide Development Indicators – Data (WDI), 2013
The first indicator is the ‘accountability of governance’. The variation of the evaluation of this indicator for Western Balkan countries is shown in Graph 1.
29

Pere ● Governance and economic development of Western Balkan countries
Graph 1.Accountability of Governance (1996 – 2012)
Source: World Bank, Worldwide Governance Indicators (WGI), 2013
As shown in the graph, this indicator shows an improvement for all the countries in the period 1996 - 2000 and a relative stabilization after 2001. In general, for this group of countries the index is between -0.5/+0.5 (ranking 45 – 55 from about 230 countries). The highest evaluation is for Croatia while the lowest is for Kosovo (-0.22 in 2012).
Graph 2. Political stability and no violence (1996 – 2012)
Source: World Bank, Worldwide Governance Indicators (WGI), 2013.
The data for Montenegro are from 2006 and for Kosovo from 2008.
30

European Journal of Government and Economics 4(1)
Regarding the ‘political stability and lack of violence’ (the second indicator, Graph 2), the indices vary between -1,0 / +1.0, and ranks vary from15 for Kosovo, to 64 for Croatia and Montenegro in 2012.The overall and significant characteristic is that, with exception of Croatia and Montenegro, all other countries have currently a negative sign rating, lower than the average level (zero). For Kosovo, although the index has been very positive in 2008 (the first year of calculation of this indicator), there has been a significant drop in the next years. A characteristic for three other countries, Albania, Bosnia Herzegovina and Macedonia, is that the index suffered a decrease in the same year, 2011, reflecting the local insurgences that year; later in 2012 the evaluation improved.
Graph 3. Governance efficiency (1996 – 2012)
Source: World Bank, Worldwide Governance Indicators (WGI), 2013.
The data for Montenegro are from 2006 and for Kosovo from 2008.
Graph 3 shows the dynamics of the third index, ‘governance efficiency’. Even here it is shown that except for Croatia and Montenegro, the other countries have a negative index, with slight positive trends. The ranking of the countries (2012) is from 39 (Bosnia and Herzegovina), to 72 (Croatia, distinguished from other countries).
31

Pere ● Governance and economic development of Western Balkan countries
Graph 4. Legal Framework (1996 – 2012)
Source: World Bank, Worldwide Governance Indicators (WGI), 2013.
The data for Montenegro are from 2005 and for Kosovo from 2007.
The fourth index ‘legal framework’ is seen in Graph 4. From the graph a considerable improvement is seen, for almost all countries, especially in the years 2003 to 2004. A characteristic of Croatia is that, although it is still better than the others, the index has slightly decreased after 2009.
Graph 5. Law Enforcement (1996 – 2012)
Source: World Bank, Worldwide Governance Indicators (WGI), 2013.
The data for Montenegro and for Kosovo are from 2003.
Graph 5 presents the evaluation of the ‘law enforcement’ index (rule of law). It is undoubtedly one of the most negative indicators for the Western Balkans. With the exception of Croatia, the assessment is negative, despite the improvements starting from 2003. In 2012, (excluding Croatia), the evaluation is between -0.01 (Montenegro) and -0.57 (Albania). The ranking of the countries for 2012 is in the
32

European Journal of Government and Economics 4(1)
range between 35-55 respectively for Albania and Montenegro (excluding Croatia which occupies the rank 60). This means that these countries have the better index regarding law enforcement, compared with only 35 - 55 percent of 230 countries surveyed in this analysis.
Graph 6. Corruption Control (1996 – 2012)
Source: World Bank, Worldwide GovernanceIndicators (WGI), 2013.
The data for Montenegro and for Kosovo are from 2003.
Graph 6 shows another negative indicator for the Western Balkans, the ‘control of corruption’. For 2012, with the exception of Macedonia (0,02) all other countries are below zero and there is no improvement for the entire period analyzed. The index is quite problematic and varied from Macedonia 0,02; Croatia -0.04; Montenegro -0.10; Bosnia and Herzegovina -0.30; Serbia -0.21; to Kosovo and Albania respectively -0.62 -0.72. Albania and Kosovo have ranked respectively 27 and 30 (that are better compared with only 27 and 30 percent of countries) while other countries are in the range from 48 to 59.
Regarding good governance in Western Balkan countries, we may refer also to Penev (2012), who conducts a profound analysis of some aspects of the reforms undertaken in the region and underlines in detail the weaknesses of their introduction and implementation. In this point of view, we should underline for example: gaps in low enforcement; corruption levels; weaknesses of legal system in the area of rule of law, property rights, and judicial independence; insufficient cooperation between the governments and the respective parliaments; lack of capacities for regulatory impact analysis, etc.
Economic growth in Western Balkan countries In macroeconomic terms, GDP has been one of the most positive and stable indicators in the Western Balkans. In 2007, the GDP growth in the region, compared with average growth of GDP in the 27 countries of the European Union (EU 27), shows that the Balkan Countries have had a rapid economic growth. During the years 2005 - 2007, GDP growth in the region has been higher than the EU on average 6-7 percent. Even in 2008, when the economic crisis began in European industrialized economies, Western Balkan countries had a positive growth on an average of 5.5 percent. The slowdown in economic growth in the region began in
33

Pere ● Governance and economic development of Western Balkan countries
2009 in almost all countries. The decline was particularly significant in Croatia (-6.8%), Macedonia (-5.8%) and Serbia (-3.1%).
Graph 7. Growth of GDP (1996 – 2012)
Source: World Bank, Worldwide Development Indicators – Data (WDI), 2013
Graph 8. Growth GDP per capita (1996 – 2012)
Source: World Bank, Worldwide Development Indicators – Data (WDI), 2013
Graphs 7 and 8 report the growth rates of GDP and GDP per capita for the Western Balkan in the period 1996-2012. As seen from the two graphs, rates of growth were satisfactory, but have been getting lower after 2008. The decline is particularly more evident in the years 2009-2012, where several countries have had also negative rates.
ALB BIH HRV KSV MKD MNE SRB
1996 9,10 88,96 5,92 1,18 7,801998 12,70 15,60 1,98 3,38 4,90 0,702000 7,30 5,50 3,75 4,55 3,10 5,342002 2,90 5,30 4,88 -0,70 0,85 1,90 4,122004 5,90 6,10 4,13 2,61 4,63 4,40 9,302006 5,00 6,20 4,94 6,00 5,03 8,60 3,602008 7,70 5,42 2,08 6,90 4,95 6,90 3,802010 3,50 0,70 -1,41 3,90 2,89 2,50 1,012012 0,80 -0,70 -2,00 3,80 -0,27 0,50 -1,70
-3,002,007,00
12,0017,00
ALB BIH HRV KSV MKD MNE SRB
1996 9,65 90,88 10,04 0,77 8,221998 12,90 12,27 3,59 2,28 5,05 1,792000 7,72 3,23 6,75 3,65 3,13 5,682002 3,61 4,81 4,88 -0,77 0,40 1,77 4,172004 6,66 6,35 4,15 2,54 4,38 4,19 9,562006 5,55 6,33 4,98 5,15 4,84 8,42 4,012008 8,03 5,62 2,13 6,04 4,84 6,75 4,242010 3,53 0,90 -1,16 3,07 2,81 2,39 1,422012 0,54 -0,56 -1,69 2,91 -0,35 0,43 -1,23
-3,002,007,00
12,0017,00
34

European Journal of Government and Economics 4(1)
Good governance and economic growth in Western Balkan countries From the previous presentation of governance indicators set by the World Bank (Graphs 1 to 6) and growth rates (Graphs 7 and 8), is noted that while governance indicators have not been optimistic, the rates of economic growth (GDP) were satisfactory (at least until 2008). This indicates the fact that economic growth in these countries should not significantly have been affected by the improvement of good governance, but normally by other factors. Among these, we may include: the primary reforms related to privatization, opening of these economies to international trade, changes in the structure of the economy, increasing demand in the unsaturated markets, etc.
To analyze in more detail such indications, and in order to measure the impact of good governance in the economic growth in Western Balkan countries, the following econometric model is used:
gdpoecdλgcflogλ extgdlogλ
log
321
1996/
++
++++++++= CrrLawRreEffStbAccGDPaGr capgdp γϕεδβα(1)
In this model the indicators of good governance are those set by the World Bank (Kaufmann, Kraay, and Mastruzzi, 2010). In (1) Grgdp/cap represents economic growth (growth of GDP per capita); logGDP1996 is the logarithm of the GDP per capita for the base year of the study (1996); inclusion of this noted variable in the model becomes important because countries with lower income per capita, should have the largest percentage increase; Acc represents the governance indicator that reflects the ‘governance accountability’ (Voice and Accountability); Stb is an indicator representing ‘political stability and lack of violence’ (Political Stability and no Violence); Eff is the indicator of ‘governance efficiency’ (Governance Effectiveness);Rre is the indicator which expresses the ‘administrative and regulatory framework’ (Regulatory Quality); Law is the index that characterizes the level of ‘law enforcement’ (Rule of Law); Crr represents index of corruption’s level ‘(Control of Corruption).
To ensure the same assessment of impact on the dependent variable (Grgdp/cap), the above indicators are normalized with X = 0 and SD = 1.
In this model three other variables are included, which are considered to affect in a considerable way economic growth, although not directly related to governance): extgdlog, it is the logarithm of trade opening index of the economy, which shows the percentage of exports and imports to total GDP; gcflog, which is the logarithm of the ration of capital formation to GDP and gdpoecd, which represents economic growth of GDP per capita in OECD countries. Inclusion of extgdlog based on the assumption that the more an economy is open to international markets, the more substantial its growth will be, while the variable which is linked to the capital formation, gcflog, presupposes that the growth of capital formation to GDP will affect faster economic growth. Further, gdpoecd variable is included based on assuming that economic development of Western Balkan countries, as relatively small economies, is affected by the economic growth on developed countries (OECD).
Evaluation of coefficients in model (1) is based on the World Bank database for the Western Balkan countries (Albania, Bosnia and Herzegovina, Croatia, Kosovo, Macedonia, Montenegro and Serbia). The period taken in analysis is from 1996 to 2012. For some years during this period, particularly for Montenegro and Kosovo, there are no records, so they are completed using noted statistical methods (moving average).
Drawing conclusions on the correlation between good governance and economic growth based on data for only seven cases might certainly have some weaknesses
35

Pere ● Governance and economic development of Western Balkan countries
in argumentation. However, this work does not aim to draw general, overreaching and universal theoretical conclusions, but only to illustrate the above correlation in this region. It is also necessary to remark, that the analysis focuses on the period from 1996 to 2012. This relatively short period is related to the radical political and economic change in the Western Balkans, which started in the beginning of the 1990s. For the purposes of this analysis, it is not relevant to take into analysis the period before these changes occurred. This implies that the conclusions of the article should be considered only for this specific period and can be different in the long run.
On this basis, panel data are built which are processed in STATA. The results are presented in Annex 1. In this annex it is noted that:
growth of GDP per capita (gdpcap), is statistically significant correlated from: (1) good governance efficiency (eff, p = 000), (2) the administrative regulatory framework (rre, p = 0,076), (3) law enforcement (law, p = 0,089), (4) income per capita in the base year (log96, p = 0.039), (5) share of capital formation to GDP (gcflog, p = 0,003) and (6) growth of GDP per capita in developed OECD countries (gdpoecd, p = 0,029). The link between economic growth and political stability is not statistically significant (stb, p = 0.136). While the results for the other indicators (acc, crr and extgdlog) show that the correlation is not statistically significant.
Taking statistically significant results, the data indicate that there is a positive correlation between the economic growth and (1) rule of law (law), (2) economic growth in OECD countries (gdpoecd), and in particular (3), the rate of capital formation to GDP (gcflog).
In the meantime, the data show anomalies in correlation between economic growth and governance efficiency (eff), administrative regulation (rre), and the level of corruption (crr). For these indicators the coefficients are negative (respectively -8.22, -2.59 and -0.58), which means that the improvement of these indicators has not contributed to economic growth as might be thought. Anomalies can be noted also in positive dependence of economic growth, from the initial level of income (year 1996), as is normally assumed that the greater is the basis of departure (beginner level), the smaller will be the rates of growth.
After eliminating from the model any variables that are not statistically significant, the regression is repeated and the results are presented in Annex 2. Results show that the correlation of economic growth from analyzed variables is statistically significant (although for stb, p = 0.166). From indicators that characterize good governance, positive impact on economic growth have been those related to political stability and absence of violence (stb) and the improvements in law enforcement (law). It is also a positive impact of capital formation to GDP (gcflog), and economic growth in OECD countries (gdpoecd). The anomalies are observed in the impact of governance efficiency (eff) and regulatory reforms in the administrative context (rre).
As mentioned above, in the economic literature there is a common agreement that good governance is an important factor in economic growth. The data analyzed above shows that for the Western Balkan countries, only specific aspects that characterize good governance have a positive and reasonable impact on economic growth, namely law enforcement (law) and political stability (stb), although for the latter p = 0.166. For some other elements the data shows a negative correlation (governance efficiency and regulatory framework), while for some others, statistical data do not provide a meaningful response (governance accountability and anti-corruption measures). In this case we may return to the literature. Kurtz and Shrank (2006) argue that the positive correlation of economic growth and good governance, cannot always be evident. Their arguments are related to two main problems. The first is related to governance indicators assessments, which are based on perceptions and may have a biased content. The second problem is based in the assumption that not only good governance affects economic growth, but overall economic growth and development can bring improvements in governance.
36

European Journal of Government and Economics 4(1)
According to them, there may be other casual and unobserved factors, which make ‘…select countries into high-growth/good governance or low-growth/mal-governance equilibrium’ (Kurtz and Schrank, 2007).
As underlined above, the aim of this paper is not to discuss the content of the indicators set by the World Bank and they are taken for granted. However, if we go to the data of Annexes 1 and 2, it can be said that the economic growth for the Western Balkan countries was not based particularly in good governance, such as improvements in administrative business regulation, anti-corruption measures or efficiency of public services. In fact, this conclusion is clearly shown in the graphs above regarding good governance indicators (Graphs 1 to 6) and economic growth (Graphs 7 to 8). Although the growth has been stable (at least until 2008), the majority of good governance indicators were negative ones with little improvement.
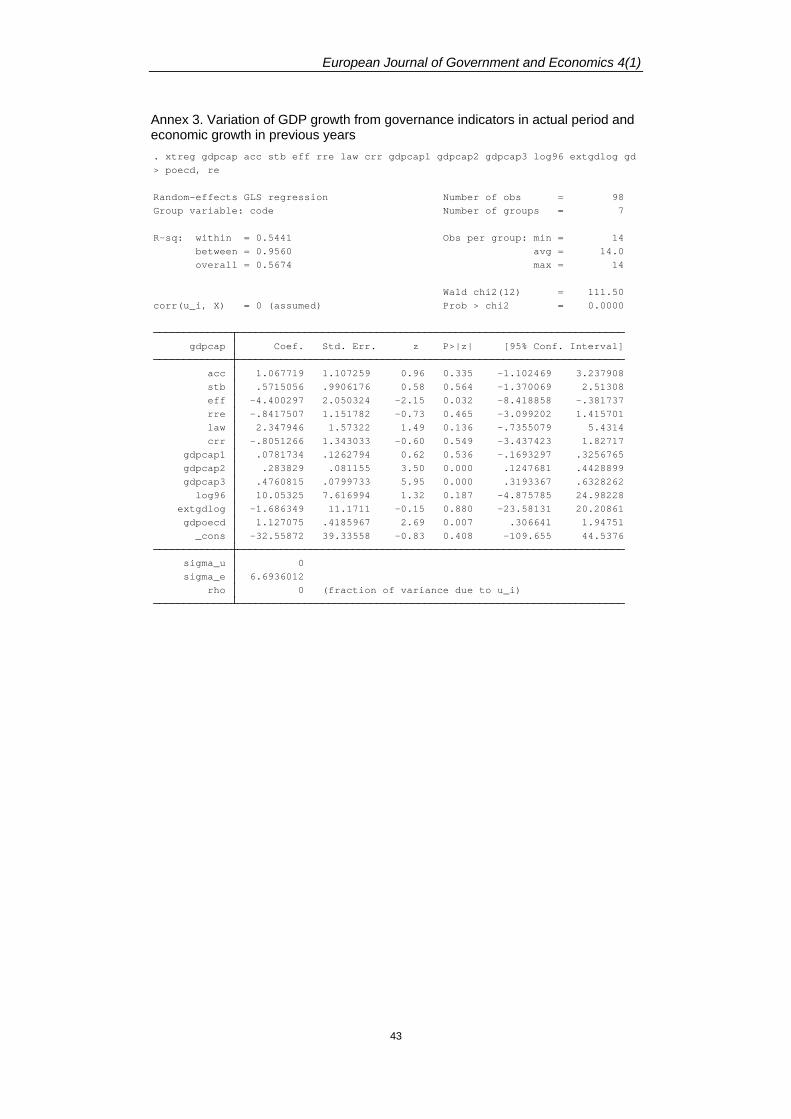
In this regard, the econometric model presented in function (1) is modified, including in it also the performance of economic growth in previous years. In this way, economic growth is seen not only dependent on factors set in function (1), but also from the development in previous years. Analysis is done in two options. In the first way (a), the economic growth in the current period is seen depending on the indicators and other variables in function (1) taken from the same year, but also on the growth of GDP per capita, respectively in the first, second and third preceding years. While the second option (b), economic growth is seen depending on the indicators of governance and other variables in function (1) taken from the previous year, and the growth of GDP per capita respectively in the first, second and third preceding years.
In option (a) processing data in STATA has brought the results shown in Annex 3. Here gdcap1, gdcap2 and gdcap3 represent the increase in GDP per capita respectively in the first, second and third years before the actual period. The data show that the dependence of economic growth from some aspects of good governance cannot be considered statistically significant (acc, stb, rre, crr and extgdlog). Not taking these variables into account, the regression is repeated and results are presented in Annex 4. Here, all variables are statistically significant (p <0.05). The data show an anomaly regarding the correlation of the economic growth from governance efficiency (eff) and the initial level of income (log96). On the other hand, law enforcement (variable law) has a significant impact on economic growth in the same period, also this growth depends on the growth in the previous years (gdpcap1 and gdpcap2) and economic development in OECD countries (gdpoecd).
Compared with the analysis previously done, in this case, the variant (a) shows that the ratio of capital formation to GDP is replaced with the variables that reflect economic growth in previous years. This is acceptable because both these variables in fact present the same thing: the basis of economic development in prior years. Compared to the previous regression, the determination coefficient (R-sq) is 0.54, which is larger compared to the 0.32 in the regression shown, in Annex 2.
In the variant (b), the economic growth (GDP/capita) in a period, depends not only on the growth in previous periods, but also on the governance in these periods. Alternatively, the economic impact of the governance is seen in growth of GDP in the next years. The first results of the regression are presented in Annex 5, while the final results (after eliminating variable that are not statistically significant), appear in Annex 6.
In this case growth is influenced positively by the governance accountability index (acc), economic growth in the previous year and economic growth in developing countries (gdpoecd). Although statistically acceptable, the data show an abnormal dependence of GDP growth per capita, from the regulatory reforms (rre). The determination coefficient here is above 0.54.
In the analysis, it is also taken into consideration the assumption of correlation of economic growth on specific governance indicators, seeing their dependence on the
37

Pere ● Governance and economic development of Western Balkan countries
growth of GDP per capita in the first, second and third preceding years. It means analyzing the dependence in inverse: the impact of economic growth on improving the governance indicators. Also in this case, data do not show logical dependence or the conclusions are not statistically significant.
Conclusions Despite a relatively long duration of social and economic transformation, the improvement of governance indicators in the Western Balkan countries during the period 1996-2012 has been slow and below the average level of assessment. Croatia makes an exception, which is above the average level indicators and positive. From six main indicators defined by the World Bank as indicators of good governance, about four of these are still negative for six countries (from seven in total). The negative value has held in the particular indicators of ‘corruption control’; ‘law enforcement’, ‘governance efficiency’ and ‘political stability and lack of violence’.
Regarding the correlation of economic growth from good governance, the analysis of regression for the period 1996-2012 presents a messy dependence of economic growth on the good governance level. In some cases the dependence of these indicators is negative (governance efficiency, regulatory framework and corruption), while in some other cases it is not statistically significant. Croatia with the most positive indices in governance has the most modest growth compared to the other countries.
Not all aspects of good governance have the same impact on economic growth and for some of them this impact is faster than others. The statistical analysis shows that political stability, absence of violence (stb) and the strengthening of law enforcement (law) affect the growth of the same period, but it is not evident for other indicators. Statistical analysis shows that some aspects of good governance can be better identified for their impact on economic growth, displaced in time. Governance accountability (acc) affects economic growth in future periods, which means it has a slower future impact.
Taking for granted the assessment of governance indicators, analysis conducted in paper shows that the impact of good governance in economic development of the Western Balkan countries can be interpreted only in the long term. It is not clear from the overall evidence of this relation for the short period of 10 to12 years.
For the Western Balkans, statistical analysis shows that there is no significant dependency of the improvement of governance indicators on the economic growth in the previous periods. Thus, the assumption that governance can be improved as a result of economic development in general, at least for the analyzed period, 1996-2012, is not confirmed.
References Acemoglu, Daron, Simon Johnson and James A. Robinson (2002) ‘Reversal of Fortune: Geography and Institutions in the Making of the Modern World Income Distribution‘, The Quarterly Journal of Economics 117(4): 1231-1294.
Gradstein, Mark (2004) ‘Governance and Growth’, Journal of Development Economics 73: 505-518.
Hall, Robert E. and Charles I.Jones (1999) ‘Why Do Some Countries Produce so Much More Output per Worker Than Others?’, Quarterly Journal of Economics 114(1): 83-116.
Hossein, Jalilian, Colin Kirkpatrick and David Parker (2007) ‘The Impact of Regulation on Economic Growth in Developing Countries: A cross-country analysis’, World development 35(1): 87-103.
38

European Journal of Government and Economics 4(1)
Kaufmann, Daniel (2003) ‘Governance Redux: The Empirical Challenge’, Working paper, MPRA Paper 8210.
Kaufmann, Daniel and Aart Kraay (2003) ‘Growth Without Governance’, Economia: The Journal of the Latin American and Caribbean Economic Association 3(1): 169- 215.
Kaufmann, Daniel and Aart Kraay (2007) ‘Governance Indicators: Where Are We, Where Should We Be Going?’ World Bank Policy Research Working Paper Series 4370.
Kaufmann, Daniel, Aart Kraay and Massimo Mastruzzi (2010) ‘Response to: “The Worldwide Governance Indicators: Six, One, or None”’, Brookings Institution, World Bank Development Research Group, and World Bank Institute.
Kaufmann, Daniel, Aart Kraay and Massimo Mastruzzi (2010) ‘The Worldwide Governance Indicators: Methodology and Analytical Issues’, The World Bank, Institute Global Governance, Policy Research Working Paper 5430.
Kaufmann, Daniel, Aart Kraay and Massimo Mastruzzi (2005) ‘Governance Matters IV for 1996-2004’, The World Bank World Bank, Institute Global Governance. Policy Research Working Paper.
Kaufmann, Daniel, Aart Kraay and Massimo Mastruzzi (2006) ‘Growth and Governance: A Reply’, The World Bank (forthcoming, Journal of Politics 69(2)).
Kaufmann, Daniel, Aart Kraay and Pablo Zoibo-Lobatón (1999) ‘Aggregating Governance Indicators’, The World Bank World Bank, Institute Global Governance, Policy Research Working Paper 2195.
Kaufmann, Daniel, Aart Kraay and Pablo Zoibo-Lobatón (1996) ‘Governance Matters’, The World Bank World Bank, Institute Global Governance, Policy Research Working Paper 2196.
Khan, Mushtaq (2007) ‘Governance and Development: The Perspective of Growth-enhancing Governance’, DESA Working Paper 54.
Knack, Stephen and Philip Keefer (1995) ‘Institutions and Economic Performance: Cross-Country Tests Using Alternative Measures’, Economics and Politics 7(3): 207-227.
Kurtz, Marcus J. and Andrew Schrank (2007) ‘Growth and Governance: Models, Measures, and Mechanisms’, Journal of politics 69(2): 538-554.
La Porta, Rafael, Florencio Lopez-de-Silanes, Andrei Shleifer and Robert Vishny (1999) ‘The Quality of Government’, Journal of Law, Economics and Organization 15(1): 222-279.
Thomas, Melissa A. (2009) ‘What Do the Worldwide Governance Indicators Measure?’ European Journal of Development Research 22(1):31-54.
Mauro, Paolo (2002) ‘The Persistence of Corruption and Slow Economic Growth’, IMF Working Paper WP/02/213.
Penev, Slavica (2012) ‘Economic and European Perspectives of Western Balkan Countries’, Westminster Foundation for Democracy.
Roll, Richard and JohnTalbott (2003) ‘Political and Economic Freedoms and Prosperity’, Journal of Democracy 14(3): 75-89.
Manasan, Rosario G., Eduardo T. Gonzalez and Romualdo B. Gaffud (1999) ‘Indicators of Good Governance: Developing an Index of Governance Quality at the LGU Level’, No. JPD 1999 Vol. XXVI No. 2-d. Philippine Institute for Development Studies.
Sharma, Shalendra D. (2007) ‘Democracy, Good Governance, and Economic Development’, Taiwan Journal of Democracy 3(1): 29-62.
39

Pere ● Governance and economic development of Western Balkan countries
Siddiqui, Danish A. and Qazi M. Ahmed (2009) ‘Institutions and Economic Growth: A Cross country Evidence’, MPRA Paper 19747.
40

European Journal of Government and Economics 4(1)
Appendix Annex 1. Growth of GDP per capita and governance indicators
rho 0 (fraction of variance due to u_i) sigma_e 8.0817479 sigma_u 0 _cons -85.86295 46.36586 -1.85 0.064 -176.7384 5.012459 gdpoecd 1.085017 .497624 2.18 0.029 .1096917 2.060342 gcflog 25.54283 8.57272 2.98 0.003 8.740604 42.34505 extgdlog -4.841363 13.70471 -0.35 0.724 -31.70211 22.01938 log96 18.2358 8.855933 2.06 0.039 .8784875 35.59311 crr -.5827184 1.619033 -0.36 0.719 -3.755966 2.590529 law 3.181707 1.871013 1.70 0.089 -.4854125 6.848826 rre -2.587529 1.456549 -1.78 0.076 -5.442312 .2672543 eff -8.219662 2.33311 -3.52 0.000 -12.79247 -3.646851 stb 1.736147 1.164004 1.49 0.136 -.5452597 4.017553 acc .6123372 1.34217 0.46 0.648 -2.018269 3.242943 gdpcap Coef. Std. Err. z P>|z| [95% Conf. Interval]
corr(u_i, X) = 0 (assumed) Prob > chi2 = 0.0000 Wald chi2(10) = 47.24
overall = 0.3519 max = 14 between = 0.8939 avg = 14.0R-sq: within = 0.3099 Obs per group: min = 14
Group variable: code Number of groups = 7Random-effects GLS regression Number of obs = 98
. xtreg gdpcap acc stb eff rre law crr log96 extgdlog gcflog gdpoecd, re
41

Pere ● Governance and economic development of Western Balkan countries
Annex 2 Growth of GDP per capita and good governance indicators (statistically significant)
rho 0 (fraction of variance due to u_i) sigma_e 7.9839582 sigma_u 0 _cons -96.01482 30.81755 -3.12 0.002 -156.4161 -35.61354 gdpoecd 1.022126 .47998 2.13 0.033 .0813824 1.962869 gcflog 24.46416 7.894859 3.10 0.002 8.990521 39.9378 log96 19.2147 7.743185 2.48 0.013 4.038337 34.39106 law 2.791953 1.242372 2.25 0.025 .3569483 5.226958 rre -2.579118 1.348562 -1.91 0.056 -5.222252 .0640152 eff -7.944702 2.236542 -3.55 0.000 -12.32824 -3.561161 stb 1.539992 1.11113 1.39 0.166 -.6377835 3.717767 gdpcap Coef. Std. Err. z P>|z| [95% Conf. Interval]
corr(u_i, X) = 0 (assumed) Prob > chi2 = 0.0000 Wald chi2(7) = 48.03
overall = 0.3480 max = 14 between = 0.7939 avg = 14.0R-sq: within = 0.3160 Obs per group: min = 14
Group variable: code Number of groups = 7Random-effects GLS regression Number of obs = 98
. xtreg gdpcap stb eff rre law log96 gcflog gdpoecd, re
42
European Journal of Government and Economics 4(1)
Annex 3. Variation of GDP growth from governance indicators in actual period and economic growth in previous years
rho 0 (fraction of variance due to u_i) sigma_e 6.6936012 sigma_u 0 _cons -32.55872 39.33558 -0.83 0.408 -109.655 44.5376 gdpoecd 1.127075 .4185967 2.69 0.007 .306641 1.94751 extgdlog -1.686349 11.1711 -0.15 0.880 -23.58131 20.20861 log96 10.05325 7.616994 1.32 0.187 -4.875785 24.98228 gdpcap3 .4760815 .0799733 5.95 0.000 .3193367 .6328262 gdpcap2 .283829 .081155 3.50 0.000 .1247681 .4428899 gdpcap1 .0781734 .1262794 0.62 0.536 -.1693297 .3256765 crr -.8051266 1.343033 -0.60 0.549 -3.437423 1.82717 law 2.347946 1.57322 1.49 0.136 -.7355079 5.4314 rre -.8417507 1.151782 -0.73 0.465 -3.099202 1.415701 eff -4.400297 2.050324 -2.15 0.032 -8.418858 -.381737 stb .5715056 .9906176 0.58 0.564 -1.370069 2.51308 acc 1.067719 1.107259 0.96 0.335 -1.102469 3.237908 gdpcap Coef. Std. Err. z P>|z| [95% Conf. Interval]
corr(u_i, X) = 0 (assumed) Prob > chi2 = 0.0000 Wald chi2(12) = 111.50
overall = 0.5674 max = 14 between = 0.9560 avg = 14.0R-sq: within = 0.5441 Obs per group: min = 14
Group variable: code Number of groups = 7Random-effects GLS regression Number of obs = 98
> poecd, re. xtreg gdpcap acc stb eff rre law crr gdpcap1 gdpcap2 gdpcap3 log96 extgdlog gd
43

Pere ● Governance and economic development of Western Balkan countries
Annex 4. Variation of GDP growth from governance indicators in actual period and economic growth in previous years (statistically significant)
Annex 5. Variation of GDP growth, from governance indicators and economic growth in previous years
rho 0 (fraction of variance due to u_i) sigma_e 6.510881 sigma_u 0 _cons -40.57649 19.58747 -2.07 0.038 -78.96723 -2.185744 gdpoecd 1.071694 .3898761 2.75 0.006 .3075512 1.835837 log96 11.62513 5.831543 1.99 0.046 .1955118 23.05474 gdpcap3 .4842415 .0765319 6.33 0.000 .3342418 .6342413 gdpcap2 .3166192 .0671942 4.71 0.000 .184921 .4483174 law 2.068566 .9828004 2.10 0.035 .1423121 3.994819 eff -4.63443 1.490092 -3.11 0.002 -7.554956 -1.713903 gdpcap Coef. Std. Err. z P>|z| [95% Conf. Interval]
corr(u_i, X) = 0 (assumed) Prob > chi2 = 0.0000 Wald chi2(6) = 113.85
overall = 0.5558 max = 14 between = 0.8747 avg = 14.0R-sq: within = 0.5392 Obs per group: min = 14
Group variable: code Number of groups = 7Random-effects GLS regression Number of obs = 98
. xtreg gdpcap eff law gdpcap2 gdpcap3 log96 gdpoecd, re
rho 0 (fraction of variance due to u_i) sigma_e 2.6655707 sigma_u 0 _cons -4.077269 9.321261 -0.44 0.662 -22.3466 14.19207 gdpoecd .5632867 .1694072 3.33 0.001 .2312547 .8953187 log96 1.703298 2.76614 0.62 0.538 -3.718237 7.124834 gdpcap3 .1017265 .0331055 3.07 0.002 .0368409 .1666121 gdpcap2 .0098275 .0335076 0.29 0.769 -.0558462 .0755012 gdpcap1 .0496679 .0514519 0.97 0.334 -.051176 .1505118 crr -.8081095 .5375017 -1.50 0.133 -1.861593 .2453745 law -.9459614 .6012155 -1.57 0.116 -2.124322 .2323994 rre -.7157147 .4764095 -1.50 0.133 -1.64946 .2180308 eff -.3183857 .8567224 -0.37 0.710 -1.997531 1.360759 stb .3111996 .4266384 0.73 0.466 -.5249963 1.147396 acc 1.713261 .4679364 3.66 0.000 .7961226 2.6304 gdpcapI Coef. Std. Err. z P>|z| [95% Conf. Interval]
corr(u_i, X) = 0 (assumed) Prob > chi2 = 0.0000 Wald chi2(11) = 52.47
overall = 0.3991 max = 13 between = 0.7289 avg = 13.0R-sq: within = 0.3696 Obs per group: min = 13
Group variable: code Number of groups = 7Random-effects GLS regression Number of obs = 91
> e. xtreg gdpcapI acc stb eff rre law crr gdpcap1 gdpcap2 gdpcap3 log96 gdpoecd, r
44

European Journal of Government and Economics 4(1)
Annex 6. Variation of GDP growth from governance indicators and economic growth in previous years (statistically significant)
rho .10568209 (fraction of variance due to u_i) sigma_e 2.6058534 sigma_u .8957869 _cons 2.163959 .5591069 3.87 0.000 1.06813 3.259789 gdpoecd .5023464 .1614302 3.11 0.002 .1859491 .8187438 gdpcap3 .0961148 .0314896 3.05 0.002 .0343964 .1578332 rre -1.683388 .3976871 -4.23 0.000 -2.46284 -.9039352 acc .8629871 .3567695 2.42 0.016 .1637318 1.562242 gdpcapI Coef. Std. Err. z P>|z| [95% Conf. Interval]
corr(u_i, X) = 0 (assumed) Prob > chi2 = 0.0000 Wald chi2(4) = 45.28
overall = 0.3102 max = 13 between = 0.2080 avg = 13.0R-sq: within = 0.3797 Obs per group: min = 13
Group variable: code Number of groups = 7Random-effects GLS regression Number of obs = 91
. xtreg gdpcapI acc rre gdpcap3 gdpoecd, re
45
Related Documents