Academic Journal of Economic Studies Vol. 3, No. 4, December 2017, pp. 35–49 ISSN 2393-4913, ISSN On-line 2457-5836 35 The Impact of Foreign Capital Inflows, Infrastructure and Role of Institutions on Economic Growth: An Error Correction Model Hammed Oluwaseyi Musibau 1 , Suraya Mahmood 2 , Agboola Yusuf Hammed 3 1,2 Faculty of Economics and Management Science, Universiti Sultan Zainal Abidin (UniSZa)/Kuala Terengganu| Malaysia, 1 E-mail: [email protected] 3 School of Economics, Finance and Banking, University Utara Malaysia Abstract This study investigates the impact of foreign capital inflows, corruption, and infrastructure on economic growth among ECOWAS members over the period 1980 to 2016. We adopt the Two-Gap model and using ECM method. The empirical results revealed long run causality between the explanatory variables and growth. And also there are short run causality between FCI, infrastructure and corruption on growth but Political stability does not cause growth in short run. Findings of the study also established a negative relationship between FDI, Infrastructure and real growth while ODA, corruption, political stability have positive impact on real growth among ECOWAS members. We recommend policy across the ECOWAS countries that will attract foreign capital inflow. The policy makers should look inwards, re-strategize and begin to formulate and implement sound and credible economic policies that will be aimed at attracting productive capital inflows into the region. Key words Foreign capital flows, infrastructure, institutions, economic growth, ECM JEL Codes: F43 1. Introduction The issue of foreign capital flows to Africa as a whole has become an important topics today among academic scholars. Since global economies were severely affected from the debt crisis in 1980s till present especially Africa, Latin America and few countries in Eastern Europe and Asia. However, the Africa region had been seriously affected by currency fluctuations, decay infrastructural development, high level of corruption and economic and political instability among others banes which discourage foreign investors in most of African economies especially ECOWAS members. The academicians have extensively debated on the issue of foreign capital as a tool for any economy whose capital requirement surpasses its saving capacity. Foreign capital flows to developing economies especially, foreign direct investment proved resilient in 2015 and offset the precipitous fall in debt flows and drop in portfolio equity. Net financial flows (debt and equity) dropped to $379 billion, one third the 2014 level ($1,159 billion) but FDI flows held steady at $543 billion, marginally higher than the prior year. Even with all these flows of capital in Africa, economic activities still remain poor. Epileptic energy supply, decay infrastructure, Social crises among others contributed to economic cancer in most of the West African economies. Apart from being politically unstable, is the issue of security for investors‟ capital in ECOWAS economies which is a great concern contributing outflows of foreign investors in the region. It is expected that if institutions like corruption is moderated with good infrastructure facilities and inflows of foreign capital thus economy performance of any Nation will improve. Holding those factors constant, foreign capital is the only solution to save the sub-region from economic doldrums that affect development in Africa especially ECOWAS countries. Conversely, economic Growth remains relaxed in West Africa compared with other developing economies. West Africa receives only 5% of total FDI inflows to developing economies which not enough for the targeted development in the region. Diao and Breisinger (2011) hinted that, foreign capital flows are reasonable alternative source of savings to fuel growth. This is expected to bridge saving and exchange gaps which will argument domestic resources of ECOWAS member, fast track their developmental strides and thus, increase the living standard of the resident. 1.1. The overview of ECOWAS and Foreign Capital Inflows The ECOWAS came in existence in Lagos on 28 May 1975 to integrate economies of 15 West African countries: Benin, Cote d‟Ivoire, Burkina Faso, Ghana, Gambia, Guinea- Bissau, Guinea, Liberia, Mali, Niger, Mauritania, Sierra Leone, Nigeria, Senegal, and Togo. They accept Cape Verde joined the economic integration in 1976 while Mauritania withdrew in 2001. The economic community adopted Trade Liberalization Scheme to allow free trade among the member nations (Forere, 2012). They extended their agreement by accelerating economic integration and increase political co-operation in July 1993. Nevertheless, the member nations had been facing numerous challenges in term of capacity to attract foreign Capital (FC) owing to the level of infrastructural development and instructional factor like corruption and political instability. The members comprises of different heterogeneous characteristics in term of resources endowments but homogeneously related in form of poor state of infrastructural development, heavily indebted, high level of corruption, political crises among others. Another issue is very weak domestic savings with regards to international financing (Saving gap). As hinted by

Welcome message from author
This document is posted to help you gain knowledge. Please leave a comment to let me know what you think about it! Share it to your friends and learn new things together.
Transcript

Academic Journal of Economic Studies Vol. 3, No. 4, December 2017, pp. 35–49
ISSN 2393-4913, ISSN On-line 2457-5836
35
The Impact of Foreign Capital Inflows, Infrastructure and Role of Institutions on Economic Growth: An Error Correction Model
Hammed Oluwaseyi Musibau1, Suraya Mahmood2, Agboola Yusuf Hammed3
1,2Faculty of Economics and Management Science, Universiti Sultan Zainal Abidin (UniSZa)/Kuala Terengganu|
Malaysia, 1E-mail: [email protected] 3School of Economics, Finance and Banking, University Utara Malaysia
Abstract This study investigates the impact of foreign capital inflows, corruption, and infrastructure on economic growth among ECOWAS
members over the period 1980 to 2016. We adopt the Two-Gap model and using ECM method. The empirical results revealed long run causality between the explanatory variables and growth. And also there are short run causality between FCI, infrastructure and corruption on growth but Political stability does not cause growth in short run. Findings of the study also established a negative relationship between FDI, Infrastructure and real growth while ODA, corruption, political stability have positive impact on real growth among ECOWAS members. We recommend policy across the ECOWAS countries that will attract foreign capital inflow. The policy makers should look inwards, re-strategize and begin to formulate and implement sound and credible economic policies that will be aimed at attracting productive capital inflows into the region.
Key words Foreign capital flows, infrastructure, institutions, economic growth, ECM
JEL Codes: F43
1. Introduction
The issue of foreign capital flows to Africa as a whole has become an important topics today among academic scholars. Since global economies were severely affected from the debt crisis in 1980s till present especially Africa, Latin America and few countries in Eastern Europe and Asia. However, the Africa region had been seriously affected by currency fluctuations, decay infrastructural development, high level of corruption and economic and political instability among others banes which discourage foreign investors in most of African economies especially ECOWAS members. The academicians have extensively debated on the issue of foreign capital as a tool for any economy whose capital requirement surpasses its saving capacity. Foreign capital flows to developing economies especially, foreign direct investment proved resilient in 2015 and offset the precipitous fall in debt flows and drop in portfolio equity. Net financial flows (debt and equity) dropped to $379 billion, one third the 2014 level ($1,159 billion) but FDI flows held steady at $543 billion, marginally higher than the prior year. Even with all these flows of capital in Africa, economic activities still remain poor. Epileptic energy supply, decay infrastructure, Social crises among others contributed to economic cancer in most of the West African economies. Apart from being politically unstable, is the issue of security for investors‟ capital in ECOWAS economies which is a great concern contributing outflows of foreign investors in the region. It is expected that if institutions like corruption is moderated with good infrastructure facilities and inflows of foreign capital thus economy performance of any Nation will improve. Holding those factors constant, foreign capital is the only solution to save the sub-region from economic doldrums that affect development in Africa especially ECOWAS countries. Conversely, economic Growth remains relaxed in West Africa compared with other developing economies. West Africa receives only 5% of total FDI inflows to developing economies which not enough for the targeted development in the region. Diao and Breisinger (2011) hinted that, foreign capital flows are reasonable alternative source of savings to fuel growth. This is expected to bridge saving and exchange gaps which will argument domestic resources of ECOWAS member, fast track their developmental strides and thus, increase the living standard of the resident.
1.1. The overview of ECOWAS and Foreign Capital Inflows
The ECOWAS came in existence in Lagos on 28 May 1975 to integrate economies of 15 West African countries: Benin, Cote d‟Ivoire, Burkina Faso, Ghana, Gambia, Guinea- Bissau, Guinea, Liberia, Mali, Niger, Mauritania, Sierra Leone, Nigeria, Senegal, and Togo. They accept Cape Verde joined the economic integration in 1976 while Mauritania withdrew in 2001. The economic community adopted Trade Liberalization Scheme to allow free trade among the member nations (Forere, 2012). They extended their agreement by accelerating economic integration and increase political co-operation in July 1993. Nevertheless, the member nations had been facing numerous challenges in term of capacity to attract foreign Capital (FC) owing to the level of infrastructural development and instructional factor like corruption and political instability. The members comprises of different heterogeneous characteristics in term of resources endowments but homogeneously related in form of poor state of infrastructural development, heavily indebted, high level of corruption, political crises among others. Another issue is very weak domestic savings with regards to international financing (Saving gap). As hinted by

Academic Journal of Economic Studies
Vol. 3 (4), pp. 35–49, © 2017 AJES
36
UNCTAD, (2016) FDI flows to West Africa have reduced by 18 per cent about $9.9 billion, as result of decline in multinational companies‟ investment in the region. The country had been facing challenges in term of fall in commodity prices (oil in particular), depreciating in local currency trade gap and postponement in key projects resulted to fall in FDI flows to the country from $4.7b in 2014 to the about $3.1 billion in the year 2015. However despite depressing economic conditions in most of West African countries, the behavior of the residents with regards to spending remained strong, which could serve as internal economies advantage to attract foreign capital flows in term of investment. Aside Nigeria, the largest economy among ECOWAS members, Ghana and Côte d‟Ivoire are doing well in term of cocoa exportation but also faced problem in term fall in the global price of cocoa. The foreign companies are facing their facing problem due to high cost of production resulting from poor state of infrastructure, political instability and high level of corruption which has negative impact on the cost of production. Also, high level of external debt has negative effect on their currencies which make it unattractive to foreign investors. As reported by Panel, 2015 on the need to accelerate development and global warming adaptation especially region of Africa due urgent need of their energy crisis. Sub-Saharan Africa has an energy crisis that demands urgent political attention. Two in every three Africans, around 621 million in total, have no access to electricity at all (Panel, 2015). As for ECOWAS sub region, in every two out of every three Africa countries lack access to electricity. According to the last population censuses, the total population per thousand for all ECOWAS member is 349million while Nigeria alone is 182million and remaining 166.9million i.e. about 53 per cent of ECOWAS population is Nigeria. Nigeria as giant of Africa and biggest economy among ECOWAS member lost one of the major potential foreign investors due power instability. In fact, as a result of lack of reliable electricity, 90 per cent of companies and residents supplement the electricity by having their own generators. Nigeria has the highest cost production in the world. Recently, Bimbola (2017) hinted that the ECOWAS largest economy Nigeria faced with numerous effects of epileptic Power supply and constant outages, like reduction in economic performance (Low Productivity). The cost of alternatives power supply is enormous. Cost of Producing in the country is the highest in the whole world leading to outright closure or relocation to other countries especially foreign investors thus increases number of unemployment and social crises. Few once like Wempco, Nigeria Flour Mills, Coca Cola and of course the multinational companies generate their own power. It revealed by the president of Manufacturing Association of Nigeria that N20.8 billion was spent in one year for self-power generation by multinational firms. The Director General of the Nigeria Employers Consultative Association (NECA), Mr. Segun Oshinowo said the effect of high cost of power generation will make the sub region economies less competitive. Apart from power, poor road network and high cost of internet subscription reduces distribution channel for these companies in their host economies West Africa. It is expected that appropriate authorities in this sub-region have a lot to do with regards fighting corruption and providing solution of decay infrastructural facilities to encourage foreign capital to West Africa thus promote economic performance in the sub region. This study, therefore, investigates FCI, infrastructure and institution role on economic growth among ECOWAS members. The study contributes to the literature in this area and also aids other regions with similar characteristics.
World
EU
G20
G20 OECD
ASIA
AFRICA
Source: Authors‟ data from UNCTAD 2017.
NB: The graph is drawn with UNCTAD data in Table1.
Figure 1. Global FDI Inwards Flows in million USD (2005–2016)
Figure 1 depicts FDI flows in the world, G20 countries, G20 OECD countries, European Union and region of Africa. European Union is the highest recipient of FDI inflows. And also, Asia mercury in term of development induced FDI to the region. The FDI inflows to Asia are very significant.
Academic Journal of Economic Studies
Vol. 3 (4), pp. 35–49, © 2017 AJES
37
Table 1. Global FDI Inwards Flows in million USD (2005–2016)
Years World EU G20 G20 OECD ASIA AFRICA
2005 990808 457701 6192274 446063 58700 66100 2006 1457859 526498 870899 641453 115800 39600 2007 2019505 827563 1141623 826139 190100 26200 2008 1579586 317215 1032286 629917 106300 24800 2009 1180417 378303 691223 416917 211100 21800 2010 1488979 358085 907049 462182 204700 16600 2011 1708975 424658 1059058 559295 211800 24000 2012 1529631 336039 874312 451770 259400 33600 2013 1579186 335563 999382 528045 327000 36900 2014 1437816 241106 838006 392435 187200 54200 2015 1868420 478242 984278 582445 527000 54200 2016 1773866 582126 984278 864389 528500 50406
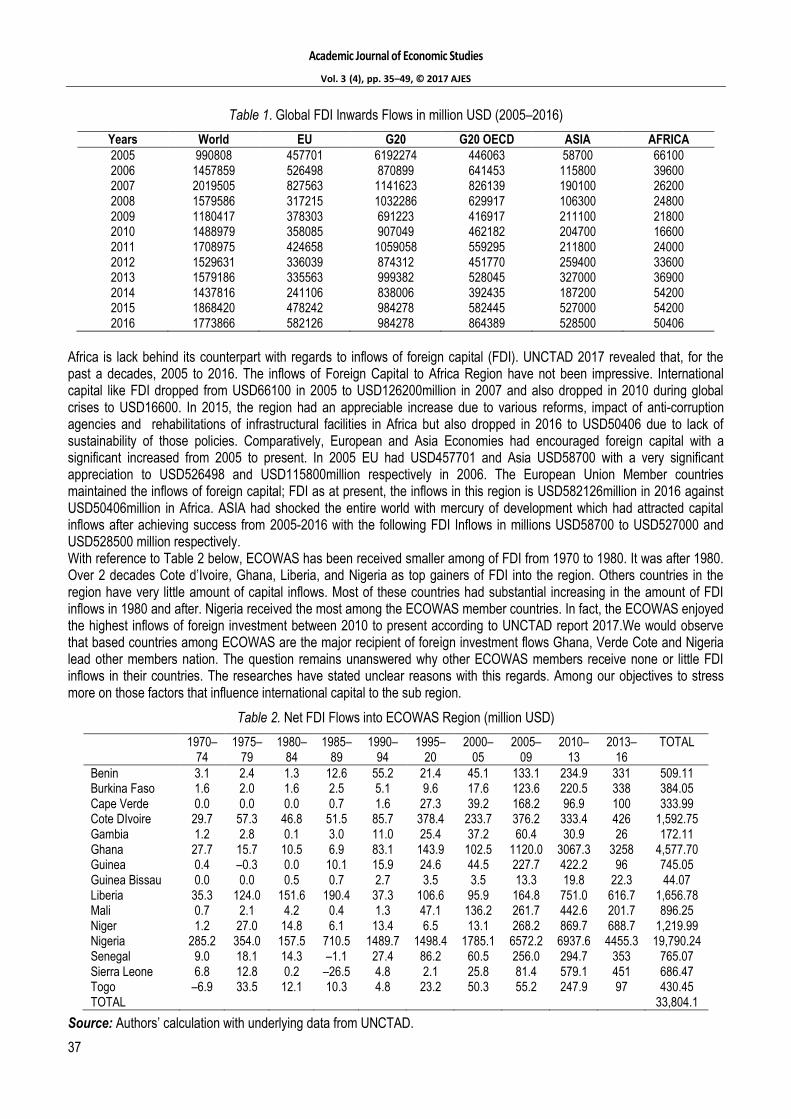
Africa is lack behind its counterpart with regards to inflows of foreign capital (FDI). UNCTAD 2017 revealed that, for the past a decades, 2005 to 2016. The inflows of Foreign Capital to Africa Region have not been impressive. International capital like FDI dropped from USD66100 in 2005 to USD126200million in 2007 and also dropped in 2010 during global crises to USD16600. In 2015, the region had an appreciable increase due to various reforms, impact of anti-corruption agencies and rehabilitations of infrastructural facilities in Africa but also dropped in 2016 to USD50406 due to lack of sustainability of those policies. Comparatively, European and Asia Economies had encouraged foreign capital with a significant increased from 2005 to present. In 2005 EU had USD457701 and Asia USD58700 with a very significant appreciation to USD526498 and USD115800million respectively in 2006. The European Union Member countries maintained the inflows of foreign capital; FDI as at present, the inflows in this region is USD582126million in 2016 against USD50406million in Africa. ASIA had shocked the entire world with mercury of development which had attracted capital inflows after achieving success from 2005-2016 with the following FDI Inflows in millions USD58700 to USD527000 and USD528500 million respectively. With reference to Table 2 below, ECOWAS has been received smaller among of FDI from 1970 to 1980. It was after 1980. Over 2 decades Cote d‟Ivoire, Ghana, Liberia, and Nigeria as top gainers of FDI into the region. Others countries in the region have very little amount of capital inflows. Most of these countries had substantial increasing in the amount of FDI inflows in 1980 and after. Nigeria received the most among the ECOWAS member countries. In fact, the ECOWAS enjoyed the highest inflows of foreign investment between 2010 to present according to UNCTAD report 2017.We would observe that based countries among ECOWAS are the major recipient of foreign investment flows Ghana, Verde Cote and Nigeria lead other members nation. The question remains unanswered why other ECOWAS members receive none or little FDI inflows in their countries. The researches have stated unclear reasons with this regards. Among our objectives to stress more on those factors that influence international capital to the sub region.
Table 2. Net FDI Flows into ECOWAS Region (million USD)
1970– 74
1975– 79
1980– 84
1985– 89
1990– 94
1995– 20
2000– 05
2005– 09
2010– 13
2013– 16
TOTAL
Benin 3.1 2.4 1.3 12.6 55.2 21.4 45.1 133.1 234.9 331 509.11 Burkina Faso 1.6 2.0 1.6 2.5 5.1 9.6 17.6 123.6 220.5 338 384.05 Cape Verde 0.0 0.0 0.0 0.7 1.6 27.3 39.2 168.2 96.9 100 333.99 Cote DIvoire 29.7 57.3 46.8 51.5 85.7 378.4 233.7 376.2 333.4 426 1,592.75 Gambia 1.2 2.8 0.1 3.0 11.0 25.4 37.2 60.4 30.9 26 172.11 Ghana 27.7 15.7 10.5 6.9 83.1 143.9 102.5 1120.0 3067.3 3258 4,577.70 Guinea 0.4 –0.3 0.0 10.1 15.9 24.6 44.5 227.7 422.2 96 745.05 Guinea Bissau 0.0 0.0 0.5 0.7 2.7 3.5 3.5 13.3 19.8 22.3 44.07 Liberia 35.3 124.0 151.6 190.4 37.3 106.6 95.9 164.8 751.0 616.7 1,656.78 Mali 0.7 2.1 4.2 0.4 1.3 47.1 136.2 261.7 442.6 201.7 896.25 Niger 1.2 27.0 14.8 6.1 13.4 6.5 13.1 268.2 869.7 688.7 1,219.99 Nigeria 285.2 354.0 157.5 710.5 1489.7 1498.4 1785.1 6572.2 6937.6 4455.3 19,790.24 Senegal 9.0 18.1 14.3 –1.1 27.4 86.2 60.5 256.0 294.7 353 765.07 Sierra Leone 6.8 12.8 0.2 –26.5 4.8 2.1 25.8 81.4 579.1 451 686.47 Togo –6.9 33.5 12.1 10.3 4.8 23.2 50.3 55.2 247.9 97 430.45 TOTAL 33,804.1
Source: Authors‟ calculation with underlying data from UNCTAD.
Academic Journal of Economic Studies
Vol. 3 (4), pp. 35–49, © 2017 AJES
38
This confirms the argument of Torvik (Wang, 2012) that greater amounts of resources increase the number of entrepreneurs involved in rent seeking and lessens the number of entrepreneurs engage goods production. With our knowledge of the history of economic thought about entrepreneurship (Hébert and Link, 1989) hinted on the characteristic of an capitalist and their behaviours to their host countries: „the entrepreneur is somebody who takes charge for and making judgmental verdicts that affect the location, form, and the use of goods, resources, or institutions'. Since investors are rational they want to minimize cost and maximize profit. So multinational firms concentrated most in the resource based economies. This is in line with the conclusion of (Carree and Thurik, 2010; Wadho, 2014).
1.2. Institution and economic growth ECOWAS experience
Globally, Africa has been considered as the most corrupt region going by the report from CPI 2016. They reported that, African countries alone have 6 countries among the 10 most corrupt nations in the world. Prior to this report, transactional international revealed that only 5 countries Botswana, Rwanda, Mauritius, Namibia and Ghana in Sub Sahara Africa are free from corruption and all the remaining 41 countries are corrupted. Corruption had become normal thing where every civil servant sees it as their right before any meaningful increase in productivity can take place. Nigeria, the largest economy among ECOWAS member ranked first in Africa. In fact, apart from Ghana which is least corrupt ECOWAS nation with Mali and Togo, the rest are very corrupt. According to Nuhu Ribadu 2016 hinted that corruption in Nigeria has reached the level that if they try to fight corruption its fight back. CPI revealed that over USD150billion lost every year in Africa continent as a result of corruption against USD22.5billion foreign capital inflows. Only in 2016 Buhari administration in Nigeria recovered 3.4 Trillion Naira from looters and February 2017, they recovered USD151million again. It is doubtful for any economy in the world will not feel the impact of looting experience in West Africa especially Nigeria the largest economies in Sub Sahara Africa. Some economist argue that is need to be tackled in Africa instead of relying on foreign capital however result from anti-corruption efforts revealed a mixed result which evinced on the fact that, for any poor region like Africa need foreign capital to boost their domestic investments. Even the Africa best economy South Africa was ranked second in Africa with regards to corruption index. The example is president Zuma‟s irregular expenditure of R316 million incurred in 2015 on the re-registration of beneficiaries by cash paymaster service and other looting cases. Transparency international 2015 hinted that more than 75 million African people pay bribe, corruption in the region increase by 58% and many governments failed completely in addressing the issue through anti-corruption agencies. Apart from Nigeria among ECOWAS, situation is worst in Liberia where over 69 per cent paid bribe. West Africa is very rich with natural resource oil, gas, gold diamond and fertile soil for agricultural products but political instability and corruption responsible for miserable poverty and fall in economic performance. In West Africa, corruption is a daily practice across every sector of the economy schools, banks, police, media, commercial driver, civil society and even churches and mosques are free from corruption. In light of these issues on institution, the study would examine the impact of corruption and infrastructure on economic performance in ECOWAS economies. Our intention is owing to the fact that, growth of any economies is dependent on level of infrastructural development. Infrastructural decay is a real problem in West African economies. Energy, telephone and electricity decay affect most the manufacture firm in West Africa. It has often said that infrastructural development like road and energy to bridging the infrastructure gap and ending poverty in the region. Mohamed et al 2013 hinted that for ECOWAS economies performance to improve there is need to reduce poverty which can enhance via more investment in infrastructural facilities like energy for capital productivity boost. They found that infrastructure availability reduces productivity in the largest economics Nigeria and Cote d‟ Ivoire.
1.3. Problem and issues of the study
It is widely contended that the quality of institution, infrastructure and foreign capital flows are significant determinant of economic growth in developed economy. Public and private investments among African countries have been facing a perennial shortage of resources in the respect of financing their investments. The lack of adequate finance has reduced the ability of governments to embark on public expenditure in infrastructure and social services required to boost domestic demand, encourage private sector activity and sustain high level of growth for economic transformation (Onyeiwu, 2015). The chronic resource gaps emanate from imbalances between exports and imports, between debt payments and resource inflows and between domestic savings and domestic investments (Anyanwu, 2012). However, little research has been done on the effect of foreign capital inflows in the context of Economic Community of West African States (ECOWAS). The idea gap has held back growth in emerging markets. If an idea gap has impeded growth, FDI can induce a catch-up process (Romer 1993; Mastromarco and Simar, 2015). The second issue as to do with the poor state of the infrastructure, corruption among ECOWAS countries. The investors have highlighted the major challenges of ECOWAS economies development is the lack of infrastructure which make the cost of production increase due to the lack of key infrastructure like road, power and conductive business environment for foreign investment (Olakojo, 2017). The foreign Capital flows has over the years concentrated in the booming oil region of
Academic Journal of Economic Studies
Vol. 3 (4), pp. 35–49, © 2017 AJES
39
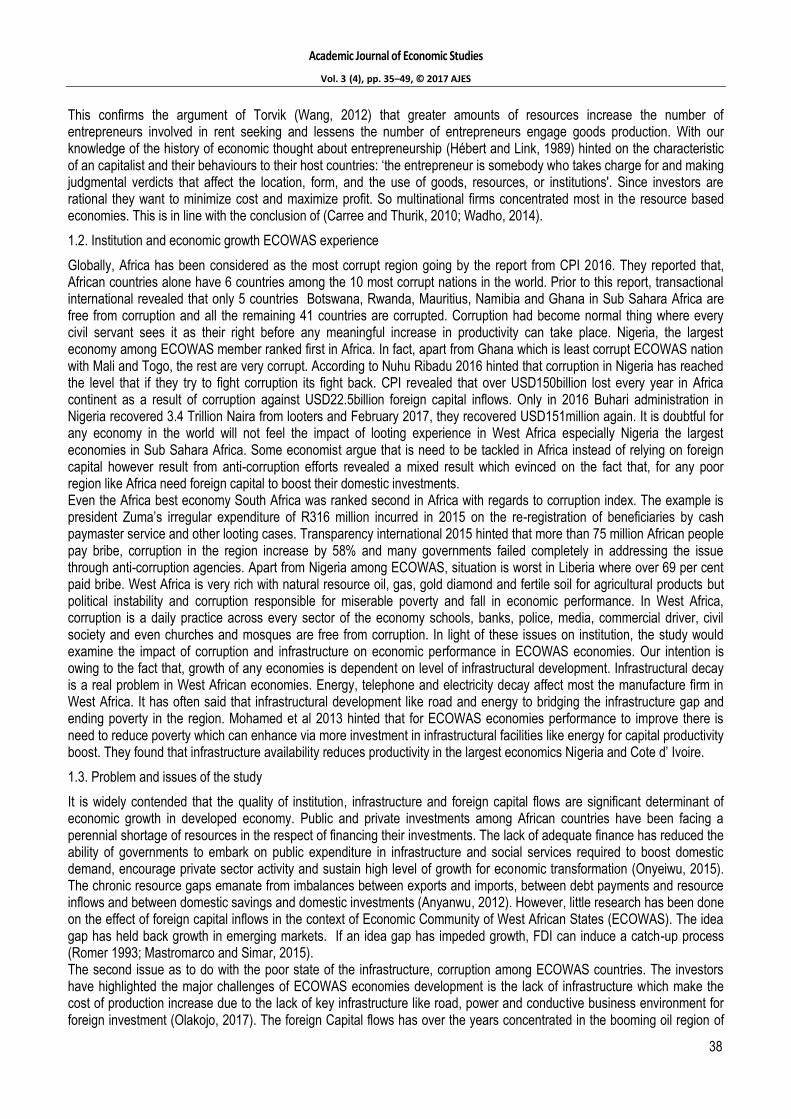
Northern African Countries, hence little has been coming to ECOWAS countries due to poor state of infrastructural facilities, corruption, political instability among other (Ajide, 2014). The infrastructural performance dimensions in relation to economic growth, West African countries had been ranked low compare with other regions. This is because of the intrinsic features of African‟s economies demand for infrastructural development to promote economic growth. The state of infrastructural development is critical which has direct impact on the cost of production in the region. The diseconomies with regards to high cost of transportation hamper inter and intra-regional trade and economic growth because cost of production increase discourage investors in the region and leave the region to other regions that have more developed infrastructures. The numbers of foreign investors leaving Nigeria, the largest economies among ECOWAS is enormous. West Africa ranked bottom among other developing economies which is bad signal for foreign investors (Teixeira and Guimarães, 2015). In order to compare the growth rate and foreign capital flows among different continents. We can observe from the figure 2. Below Foreign capital flow in Africa remained the lowest. The trends show that for more than 3 decades (1981-2016). There are shortage of capital inflows in this region as compared to other region like Europe, Asia and Middle East as result of poor state of infrastructure, corruption and political instability in some of the countries members of ECOWAS.
Source: UNCTAD 2017
Figure 2. The Economic growth and foreign capital inflows among Africa, Europe, Middle East and Asia
The need for FCI had been hinted by scholars, African countries and other emerging economies need substantial inflow of capital to fill their savings and foreign exchange gaps, enhance capital accumulation and growth needed to overcome widespread poverty in these countries. The Africa countries, West African in particular had been experiencing poor growth in the region owing to political crises, insecurity, corruption in investment on adequate infrastructural facilities to attract foreign capital flows (Ifeakachukwu and Ditimi, 2014). As we can observe from Figure 2 above the growth rate of infrastructural development among ECOWAS member had been constant over years. In fact, the growth was negative between 1980 to 1992 and appreciated a little bit from 1993 to 2004. After 2004 rate had been falling to present due to level of corruption, political instability, insecurity and poor state of infrastructural facilities demotivate foreign capital and investors to West Africa countries.
2. Literature review
2.1. Two Gap Model of Aid
The growth theory has hinted on the association between the determinants of economic growth and the role of foreign capital to bridge the two famous gaps in developing economies savings and trade gaps. The argument state by Harrods and Domar of 1939 and 1946 respectively on growth model, they emphasized on saving and investment as a main determinant of economic growth. As result poor level of saving in developing economies led to dual gap model that emphasized that, the major banes affecting economic growth in low income economies is a result of savings and trade gap. The savings in these economies is too small to attain desire growth rate, international capital is needed to argument the gap between savings and desired investment to achieve economic growth. The two gap model was introduced by Hollis B. Chenery and Alan Strout (1966) which is known dual-gap model of foreign aid. The model pointed out that the difference between desire saving and required investment for economic growth is refer to as savings gap. Meanwhile, the variance
Academic Journal of Economic Studies
Vol. 3 (4), pp. 35–49, © 2017 AJES
40
between export and import is known as trade gap. Their idea based on the fact that saving gap and trade gap which is also called foreign exchange gap are two separate and self-determining constraints in achieving of target economic growth rate in developing economies and foreign aid is seen as a solution to bridge the dual gaps. In the study of Bacha and Taylor (1990), hinted that revenue raising capacity is not sufficient to cover the anticipated level of investment efficient usage of foreign aid will helps to fill the gap and also similar to (Kolawole 2013; Amassoma, 2014; Orji et al., 2014).
2.2. Foreign Capital inflows and Growth Nexus
Foreign capital flows provide a great benefit to economies that are operating financial integration, they also stance various macroeconomic challenges. It is expected that, any nation that encourage foreign capital will enjoy some greater benefit like smoothing consumption, bridging saving and foreign exchange rate gap. Among the scholars that support positive impact of foreign capital on economics growth (Chenery and Strout, 1966; Taylor, 1991; Akinboade, Siebrits and Roussot, 2006; Adams, 2009; Guichard and Rusticelli, 2011; Aizenman et al., 2013; Nwaogu et al., 2015; Azam, 2016; Blanchard et al., 2016; Alley, 2017). Aizenman et al. (2013) find a strong, robust relationship between FDI (both inflows and outflows) and growth. Chen and Quang (2014) shows that, the growth effect of international capital flows is contingent on the levels of economic, institutional and financial development and government spending. Findings are in contrary to Adam (2009) examined the influence of FDI and domestic investment on growth in Sub-Saharan Africa for the period 1990–2003 using dynamic approach and established that FDI has negative impact on Domestic Investment in the short run but positive effect in long run in the Sub-Sahara African economies and a net crowding out effect.
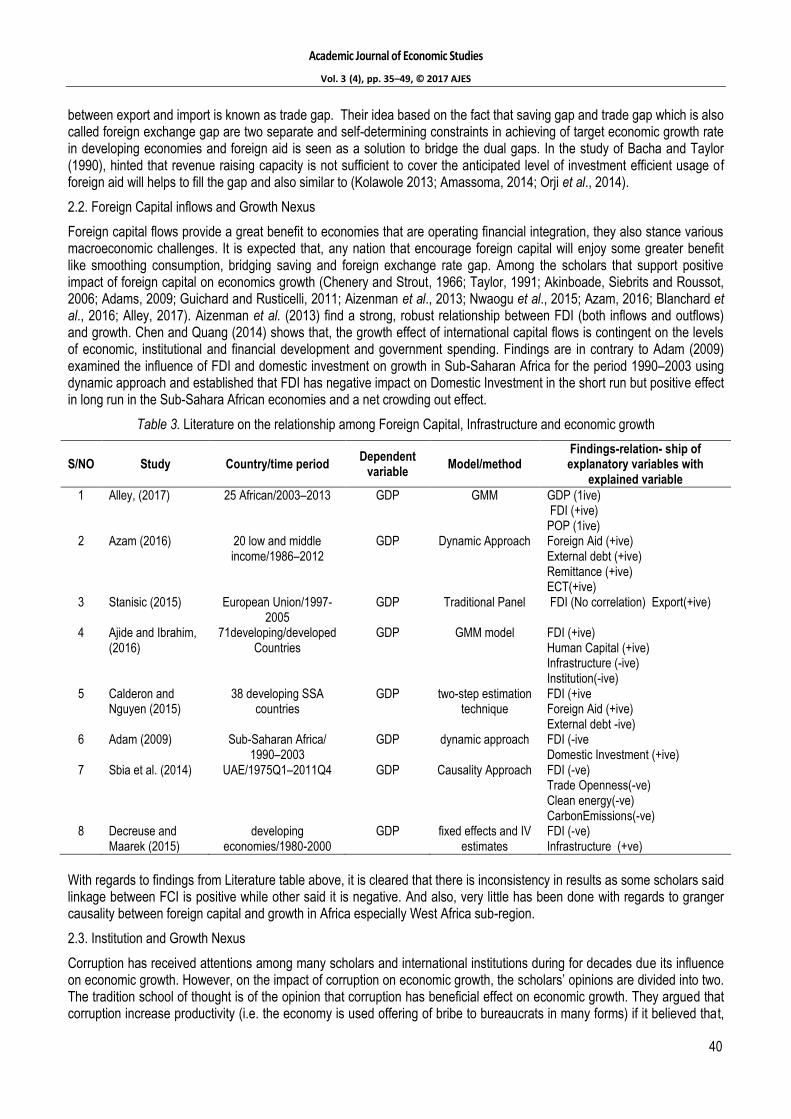
Table 3. Literature on the relationship among Foreign Capital, Infrastructure and economic growth
S/NO Study Country/time period Dependent
variable Model/method
Findings-relation- ship of explanatory variables with
explained variable
1 Alley, (2017) 25 African/2003–2013 GDP GMM GDP (1ive) FDI (+ive) POP (1ive)
2 Azam (2016) 20 low and middle income/1986–2012
GDP Dynamic Approach Foreign Aid (+ive) External debt (+ive) Remittance (+ive) ECT(+ive)
3 Stanisic (2015) European Union/1997-2005
GDP Traditional Panel FDI (No correlation) Export(+ive)
4 Ajide and Ibrahim, (2016)
71developing/developed Countries
GDP GMM model FDI (+ive) Human Capital (+ive) Infrastructure (-ive) Institution(-ive)
5 Calderon and Nguyen (2015)
38 developing SSA countries
GDP two-step estimation technique
FDI (+ive Foreign Aid (+ive) External debt -ive)
6 Adam (2009) Sub-Saharan Africa/ 1990–2003
GDP dynamic approach FDI (-ive Domestic Investment (+ive)
7 Sbia et al. (2014) UAE/1975Q1–2011Q4 GDP Causality Approach FDI (-ve) Trade Openness(-ve) Clean energy(-ve) CarbonEmissions(-ve)
8 Decreuse and Maarek (2015)
developing economies/1980-2000
GDP fixed effects and IV estimates
FDI (-ve) Infrastructure (+ve)
With regards to findings from Literature table above, it is cleared that there is inconsistency in results as some scholars said linkage between FCI is positive while other said it is negative. And also, very little has been done with regards to granger causality between foreign capital and growth in Africa especially West Africa sub-region.
2.3. Institution and Growth Nexus
Corruption has received attentions among many scholars and international institutions during for decades due its influence on economic growth. However, on the impact of corruption on economic growth, the scholars‟ opinions are divided into two. The tradition school of thought is of the opinion that corruption has beneficial effect on economic growth. They argued that corruption increase productivity (i.e. the economy is used offering of bribe to bureaucrats in many forms) if it believed that,

Academic Journal of Economic Studies
Vol. 3 (4), pp. 35–49, © 2017 AJES
41
we can get the best from people unless they are offered bribes. This is in contrary to the first school believed that relationship between corruption and economic growth is negative. They suggested that, corruption is damaging to businesses and innovators, it creates additional cost to working capital thus increase price of the commodities in the market. This is opinion of the majority are of opined that it creates evil to economic system. In light this, it is expected that corrupt free society with good infrastructure, macroeconomic stability, openness to FDI, and political stability will induce foreign capital. Among the literatures shown inefficient institutions as measured by corruption and weak enforcement of contracts discourages foreign investment. Corruption is a global issue which is an endemic to government all over the world. Many studies have found that corruption and political instability have negative effect on economic growth (see Aisen and Veiga, 2013; Ugur and Dasgupta, 2011; Bentzen, 2012; Okafor et al., 2014). In the study of Ugur and Dasgupta (2011) employed fixed effects and random effects weighted means to examine the effect of corruption across countries. Their results revealed that corruption has a negative effect on per capita GDP growth. Similarly, Okafor et al. (2014) Investigated the impact of corruption in a sample of 48 SSA countries from 1996 to 2008 Corruption has a significant negative relationship with economic development. And also, Aisen and Veiga (2013) Assessed the effect of political instability on economic growth in a sample of 169 countries from 1960 to 2004 Higher political instability leads to lower GDP per capita growth rates via its effect on productivity growth as well as physical and human capital accumulation. Contrary to Asiedu (2006) who investigate the role of institution, market size and government policies on foreign capital in Africa and found that corruption is negative in Nigeria but positive in South Africa. However, we observed inconsistence in the findings of scholars; some are saying negative while study like Asiedu, 2006 established positive association between institutional variables and economic growth.
2.4. The theory Economic Growth and Foreign Capital
The Solow-Swan is a long run growth model that looks at capital accumulation, population growth, and productivity increase as technological progress (Solow-Swan, 1956 and Solow, 1999). Given these axioms, with constant technical progress, we defined production function as: Y=F(K,L). Y is output, K = capital, L= Labor. Given the condition of constant return to scale Y/L=F(K,1) = L.f(k) Where Y = Y/L is income per worker, k = K/L is capital-Labor ratio, and the function J(k)= J(k, 1). Thus the production function can be expressed as y= f (k) …(2) N.B that, saving is a constant fraction, s, of income. So saving per worker is sy. Since income equals output, sy = sf(k) …(3). This is required level of investment to maintain capital per worker k, is a function of growth in population, and depreciation rate, d. Meanwhile it is presumed that population grows at a constant rate n, the capital stock grows at the rate n.k to provide capital to the growing population (Mello 1999), Akinlo 2004; Adeniyi et al., 2012). Since Solow Swam model argued on capital and labour as a salient factor to bring growth. In light of this, choice of our variables in the model is from the theory with Foreign capitals represent K. institutions is moderating effect with reference to the literatures above while other variables are control variable according to the growth theory.
3. Methodology of research
The study utilized data of 15 ECOWAS countries from 1980 to 2017, and fully modified ordinary least squares (FMOLS) estimation to investigate the relationship between components of foreign capital inflows (Foreign Direct Investment, Official development assistances, Workers‟ migrants‟ remittances, Real Exchange Rate and Real Interest Rate and economic growth. Also, to estimate foreign capital inflows in this study we employ real gross domestic product for growth and remittance, official development assistance, foreign portfolio investment and foreign direct investment. Following their model with a little modification the model for this study is specified as thus;
(1)
Where: GDP is gross domestic product (US$), FDI signifies the net FDI inflows as % of GDP ODA (official development aid) as a percentage of nominal gross domestic product, Infrastructure is fixed and mobile subscribers (per 1000 people), Exchange Rate is the official exchange rate to the US$ (annual average), PTS: Index of Political Stability, Corro denotes Corruption perception Index, β is a vector of coefficients, and εij represents the myriad other influences on FDI, assumed to be well behaved.
3.1. The Panel Unit Root Tests
In study to examine the panel co-integration, it is highly imperative to check in the series as unit root. There are lots of test introduced to check unit root in past decades among them are Quah (1992, 1994), Levin and Lin (1992, 1993), Maddala
Academic Journal of Economic Studies
Vol. 3 (4), pp. 35–49, © 2017 AJES
42
and Wu (1999), Hadri (2000), Levin et al. (2002) and Im et al. (1997, 2003). The panel unit root is an extension of the univariate unit root test recognized before which has low power such as Augmented Dickey-Fuller test (Said and Dickey, 1984). The panel unit root test has power to detect problem of heteroscedasticity with different relationship. And also has specification for null and alternate hypothesis. Since each test has its own advantages. As for this study we shall choose Levin, Lin and Chu (LLC) 2002. In LLC it is establish that the main hypothesis of panel unit root is as follows:
tiLti
p
L
litiiit yyyi
,,
1
,1,
(2)
Where: yi,t refers to variable ln rgdpit, ln Odait, ln fdiit, ln Corroit, ln Ptsit, ln reerit and Δ and refers to the first difference i.e. Order one. The Null hypothesis test is Ho : Φi = 0. If a series has unit root Ha : Φi < 0 when there is no unit root. pi is unknown.
3.2. Panel Co-integration Analysis and FMOLS Approach
In this stage we shall adopt FMOLS procedure from Christopoulous and Tsionas (2003, 2004). Full modified OLS (FMOLS) introduced by Pedroni (1996) tackles efficient consistent estimates in panel series, non-erogeneity and serial correlation problems. Due to the fact that the variables are found co-integrated with trend through the panel unit root test and panel co-integration test, we proceed to estimate FMOLS for heterogeneous co-integrated panels (Pedroni, 1996, 2000). FMOLS make it possible for consistent and efficient estimation of co-integrated vectors. It handles the problem of non-stationary regressor and problem of simultaneity biases. Since OLS can yield biased results due to the that regressor are exogenously determined in the case of order one I(1). We shall start with the OLS following co-integrated system:
ititiit exy (3)
ittiit xx 1,
Where:
ititit e , is the stationary with covariance matrix Ωi. The estimator β will be consistent when the error process
],[ ititit e satisfies the assumption of co-integration between yit and xit.
Due to the some nuisance parameters, that limits distribution of OLS estimator. Semi correction can be made to the OLS following Philiphs and Hansen (1990) which eliminate the second order bias cause to the fact that the regressor are endogenous. FMOLS estimator is stated as thus;
T
t
iittiti
N
i
i
N
i
T
t
titiFM Texxxx1
1
22
1
1
11
1
1 1
22
22ˆˆˆ)ˆ(ˆˆ
(4)
0
222221
1
22
0
212121
1
22ˆˆˆˆˆˆˆ,ˆˆˆ
iiiiiiiiiitit ee
Where:
The covariance matrix can be decomposed as iiii 0
where 0
i represents the contemporaneous
covariance matrix, and i being a weighted sum of autocovariances and also, 0ˆi
is the appropriate estimator of0
i.
For the purpose of the analyses in this study, both the within-dimension and between dimension panel FMOLS test Pedroni (1996, 2000) will be used. One of the salient advantages of the-dimension estimator is that the pooled data give way for greater flexibility in the existence of heterogeneity of the co-integrating vectors. Note that test statistics from the within –dimension estimator are built to test the null hypothesis H0 : βi = β0 for all I against the alternative hypothesis HA : βi = βA ≠ β0 where the value βA is the same for all i, test statistics constructed from the between-dimension estimators are designed to test the null hypothesis H0 : βi = β0 for all i against the alternative hypothesis HA : βi ≠ β0, so that the values for βi are not constrained to be the same under the alternative hypothesis. The salient thing to note is that, this application has the following benefits such as the advantage of the between dimension estimators is the fact that the point estimate have a more useful interpretation in the event that the co-integrating vectors are heterogeneous. To be precise, point estimate can be interpreted as the mean value for the co-integrating vectors. The estimation will be conducted by performing the

Academic Journal of Economic Studies
Vol. 3 (4), pp. 35–49, © 2017 AJES
43
following tests. First, the order of integration of the RGDP and foreign capital inflows components, Corruption, Infrastructures and Political Stability Index viz INFRA,ODA, FDI, CORRO, PTS and REER. Series will be tested. Then, we shall use Johansen‟s approach and when the series are found stationary at the order of one I(1) we shall perform co-integration test between the economic growth and foreign capital inflows components. Note, the Pedroni test allows for cross-sectional independency among different individual effects. Second, in order to detect the direction of causality between the two variables we use the technique of Error Correction Mechanism (ECMt.).
3.3. Panel Granger Causality Test
The granger causality shows direction of the causality between the independent variables to dependent is it one way or two ways since co-integration fail to identify the direction of causality among variable. In panel causality is used to determine short run and long run relationships among variables. The ECT coefficient are used for long run causality if is negative and significant (Engle and Granger, 1987). So, the study will examine causality between INFRA, FCI, INST and economic growth. The panel causality is a dynamic error correction model specified as thus:
tt
p
l
itit
k
itj
n
j
it
m
i
ZINSTINFRFCIGDPiGDP
1
1
0
111
tt
p
l
itit
k
itj
n
j
it
m
i
ZGDPINSTINFRGDPiFCI
1
1
0
111
tt
p
l
itit
k
itj
n
j
it
m
i
GDPZINSTFCIGDPiINFR
1
1
0
111
tt
p
l
it
k
itj
n
j
it
m
i
GDPZINFRFCIGDPiINST
1
1
0
111 (5)
Where: ∆ represents first-difference operator, n denotes the optimal lag length(s). Where 𝛼 is the constants for the four equations. We can test for co-integration among INFRA, FCI, INST and economic growth and long and short run causality using panel granger causality approach (Wald test and VECM). In this Study, the maximum number of lags is four based on the Schwarz information criteria (SIC).
4. Analysis and discussion
The results of the panel unit root tests conducted for the seven variables (GDP per capita, FDI, ODA, Corruption, REER and Infrastructure Quality) according to Table 4 below shows.
Table 4. The stationary time series
Variables Levin Lin C Statistics Probability Order of Integration
GDP 5.55106 0.0000 I(1) INFRA 4.37638 0.0000 I(1) ODA 26.2349 0.0000 I(1) FDI 11.0999 0.0000 I(1) PTS 14.7565 0.0000 I(1)
CORRO REER
5.31027 13.1939
0.0005 0.0000
I(1) I(1)
Note: All the reported values for the LLC t-stat are distributed N(0,1) under null of unit root or no co-integration.
N.B: * Indicates significant at the 5% level. We can carry the variable forward for co-integration test because they found stationary at first difference.
The number in ( ) denotes probability value. The lag length is chosen based on the Akaike”s Information Criteria (AIC) where maximum lag order was specified (k) in auto regression and then the appropriate lag order was selected according to the AIC. The decision is made on the major selection by the statistical tests.
Academic Journal of Economic Studies
Vol. 3 (4), pp. 35–49, © 2017 AJES
44
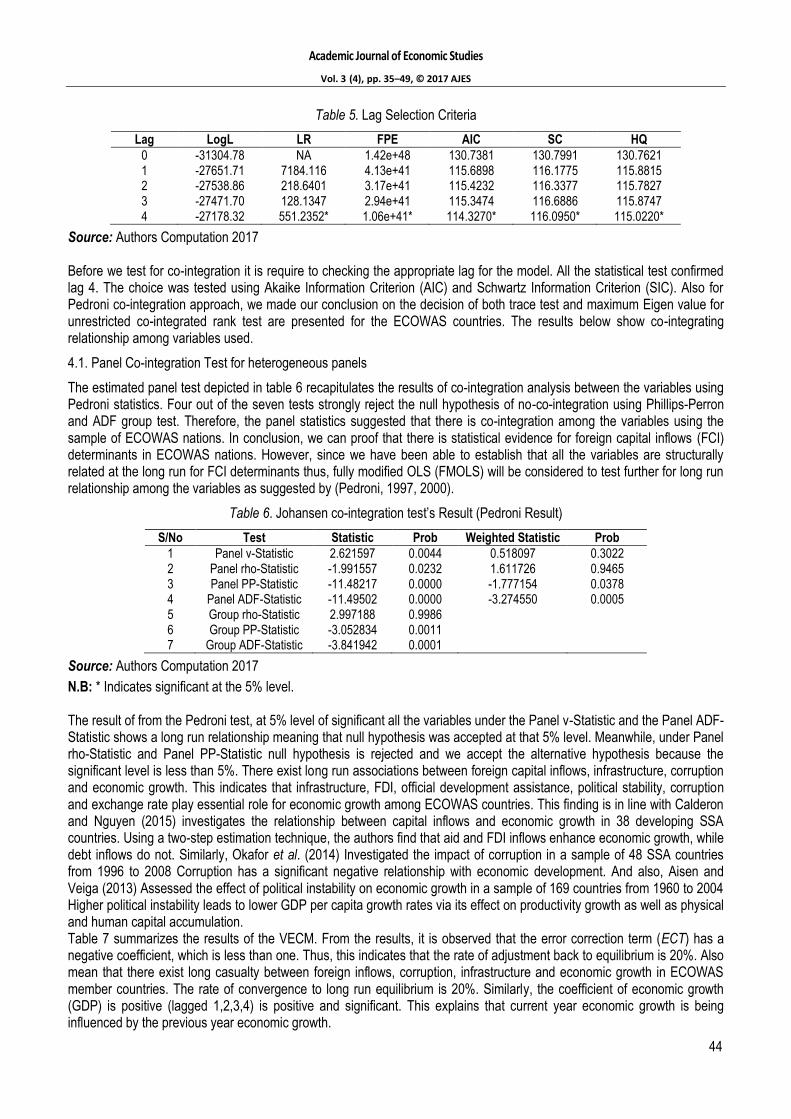
Table 5. Lag Selection Criteria
Lag LogL LR FPE AIC SC HQ
0 -31304.78 NA 1.42e+48 130.7381 130.7991 130.7621 1 -27651.71 7184.116 4.13e+41 115.6898 116.1775 115.8815 2 -27538.86 218.6401 3.17e+41 115.4232 116.3377 115.7827 3 -27471.70 128.1347 2.94e+41 115.3474 116.6886 115.8747 4 -27178.32 551.2352* 1.06e+41* 114.3270* 116.0950* 115.0220*
Source: Authors Computation 2017 Before we test for co-integration it is require to checking the appropriate lag for the model. All the statistical test confirmed lag 4. The choice was tested using Akaike Information Criterion (AIC) and Schwartz Information Criterion (SIC). Also for Pedroni co-integration approach, we made our conclusion on the decision of both trace test and maximum Eigen value for unrestricted co-integrated rank test are presented for the ECOWAS countries. The results below show co-integrating relationship among variables used.
4.1. Panel Co-integration Test for heterogeneous panels
The estimated panel test depicted in table 6 recapitulates the results of co-integration analysis between the variables using Pedroni statistics. Four out of the seven tests strongly reject the null hypothesis of no-co-integration using Phillips-Perron and ADF group test. Therefore, the panel statistics suggested that there is co-integration among the variables using the sample of ECOWAS nations. In conclusion, we can proof that there is statistical evidence for foreign capital inflows (FCI) determinants in ECOWAS nations. However, since we have been able to establish that all the variables are structurally related at the long run for FCI determinants thus, fully modified OLS (FMOLS) will be considered to test further for long run relationship among the variables as suggested by (Pedroni, 1997, 2000).
Table 6. Johansen co-integration test‟s Result (Pedroni Result)
S/No Test Statistic Prob Weighted Statistic Prob
1 Panel v-Statistic 2.621597 0.0044 0.518097 0.3022 2 Panel rho-Statistic -1.991557 0.0232 1.611726 0.9465 3 Panel PP-Statistic -11.48217 0.0000 -1.777154 0.0378 4 Panel ADF-Statistic -11.49502 0.0000 -3.274550 0.0005 5 Group rho-Statistic 2.997188 0.9986 6 Group PP-Statistic -3.052834 0.0011 7 Group ADF-Statistic -3.841942 0.0001
Source: Authors Computation 2017
N.B: * Indicates significant at the 5% level. The result of from the Pedroni test, at 5% level of significant all the variables under the Panel v-Statistic and the Panel ADF-Statistic shows a long run relationship meaning that null hypothesis was accepted at that 5% level. Meanwhile, under Panel rho-Statistic and Panel PP-Statistic null hypothesis is rejected and we accept the alternative hypothesis because the significant level is less than 5%. There exist long run associations between foreign capital inflows, infrastructure, corruption and economic growth. This indicates that infrastructure, FDI, official development assistance, political stability, corruption and exchange rate play essential role for economic growth among ECOWAS countries. This finding is in line with Calderon and Nguyen (2015) investigates the relationship between capital inflows and economic growth in 38 developing SSA countries. Using a two-step estimation technique, the authors find that aid and FDI inflows enhance economic growth, while debt inflows do not. Similarly, Okafor et al. (2014) Investigated the impact of corruption in a sample of 48 SSA countries from 1996 to 2008 Corruption has a significant negative relationship with economic development. And also, Aisen and Veiga (2013) Assessed the effect of political instability on economic growth in a sample of 169 countries from 1960 to 2004 Higher political instability leads to lower GDP per capita growth rates via its effect on productivity growth as well as physical and human capital accumulation. Table 7 summarizes the results of the VECM. From the results, it is observed that the error correction term (ECT) has a negative coefficient, which is less than one. Thus, this indicates that the rate of adjustment back to equilibrium is 20%. Also mean that there exist long casualty between foreign inflows, corruption, infrastructure and economic growth in ECOWAS member countries. The rate of convergence to long run equilibrium is 20%. Similarly, the coefficient of economic growth (GDP) is positive (lagged 1,2,3,4) is positive and significant. This explains that current year economic growth is being influenced by the previous year economic growth.

Academic Journal of Economic Studies
Vol. 3 (4), pp. 35–49, © 2017 AJES
45
Table 7. Vector Error Correction Mechanism
Coefficient Standard Error T-Statistic
C 33921392 3.18E+08 -0.106604 ECT -0.204235 0.014790 -13.80935 D(GDP)(-1) 0.330113 0.050448 6.543670 D(GDP)(-2) 0.594121 0.041326 14.37655 D(GDP)(-3) 0.514548 0.044126 11.66086 D(GDP)(-4) 0.271456 0.038492 7.052186 D(INFRA)(-1) 4.49E+08 1.24E+09 0.362537 D(INFRA)(-2) -7.97E+08 1.39E+09 -0.573257 D(INFRA)(-3) -1.32E+09 1.39E+09 -0.946541 D(INFRA)(-4) -8.90E+08 1.24E+09 -0.715758 D(ODA)(-1) -11.85323 0.734966 -16.12760 D(ODA)(-2) -4.855958 0.818451 -5.933109 D(ODA)(-3) -17.51569 0.600729 -29.15740 D(ODA)(-4) -1.966601 1.022219 -1.923855 D(FDI)(-1) 16105057 26166273 0.615489 D(FDI)(-2) 23255206 28769869 0.808318 D(FDI)(-3) 13377278 28722225 0.465747 D(FDI)(-4) -3031043. 26344716 -0.115053 D(CORRO)(-1) 1.68E+09 5.15E+08 3.251856 D(CORRO)(-2) 9.38E+08 5.25E+08 1.786329 D(CORRO)(-3) 5.00E+08 5.36E+08 0.932807 D(CORRO)(-4) 2.09E+08 5.30E+08 0.394085 D(PTS)(-1) -6.10E+08 4.42E+08 -1.380062 D(PTS)(-2) -4.19E+08 4.74E+08 -0.883458 D(PTS)(-3) -2.14E+08 4.75E+08 -0.451015 D(PTS)(-4) -4.43E+08 4.40E+08 -1.007163 D(REER)(-1) -659235.9 1990800. -0.331141 D(REER)(-2) -1036425. 2084660. -0.497167 D(REER)(-3) 285068.4 2090386. 0.136371 D(REER)(-4) -622142.5 2002160. -0.310736 Coefficient of Determination (R2) 0.727372 F-Statistic 43.68808 Prob(F-statistic) 0.000000 Akaike Information Criterion 47.86421 Schwarz Information Criterion 48.13144
Diagnostic tests J-B normality test 0.946369 (0.6667) LM test 1.248256 (0.5832) ARCH test 0.267232 (0.6474) N.B: * Indicates significant at the 5% level. Source: Authors Computation 2017
This is line with the results found by Aizenman et al. (2013) examine the connection between economic growth and lagged capital flows, They study about 100 countries during 1990–2010 when emerging markets became more integrated into the international financial system. They found a large and robust relationship between FDI – both inflows and outflows – and growth. However, coefficient of infrastructure is positive (lagged 1) is positive and significant. This explains that current year infrastructure is being influenced by the previous year infrastructure. Similarly to the study of Ajide and Ibrahim, (2016) in their study on the impact of institution variables and FDI on growth rate of 71 countries using GMM model the established that political stability, accountability, government effectiveness, rule of law regulatory quality, and control of corruption. Additionally, the coefficient of FDI, corruption is positive (lagged 1,2,3,4) is positive and insignificant. As supported by Chen and Quang (2014) show that the growth effect of international capital flows is contingent on the levels of economic, institutional and financial development and government spending. The diagnostic tests for both the short- and the long run models show that the error terms are normally distributed and they are serially uncorrelated. There is also no evidence of autoregressive heteroscedasticity and misspecification in both models. The F-Statistic measures the overall (whole) significance of a model. With a coefficient of 43.68 which is above the 1.96 critical value and probability of 0.0000. The model may be said to be good-fitted.
Academic Journal of Economic Studies
Vol. 3 (4), pp. 35–49, © 2017 AJES
46
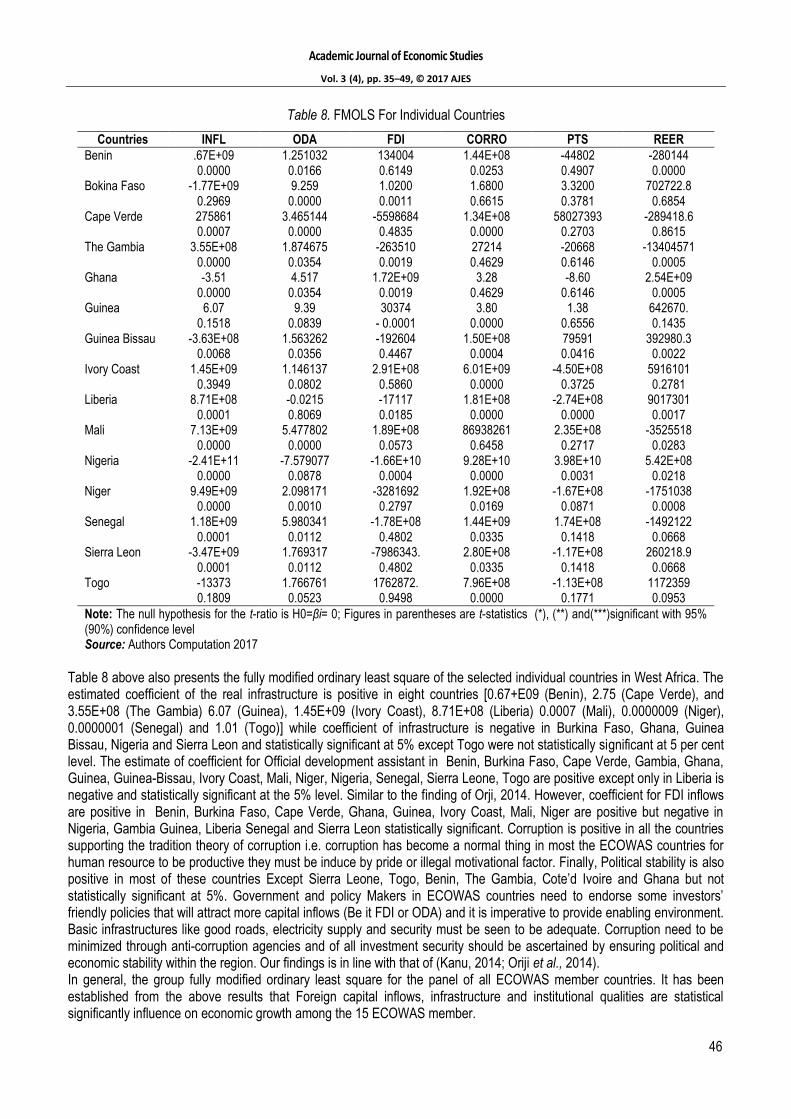
Table 8. FMOLS For Individual Countries
Countries INFL ODA FDI CORRO PTS REER
Benin .67E+09 0.0000
1.251032 0.0166
134004 0.6149
1.44E+08 0.0253
-44802 0.4907
-280144 0.0000
Bokina Faso -1.77E+09 0.2969
9.259 0.0000
1.0200 0.0011
1.6800 0.6615
3.3200 0.3781
702722.8 0.6854
Cape Verde 275861 0.0007
3.465144 0.0000
-5598684 0.4835
1.34E+08 0.0000
58027393 0.2703
-289418.6 0.8615
The Gambia 3.55E+08 0.0000
1.874675 0.0354
-263510 0.0019
27214 0.4629
-20668 0.6146
-13404571 0.0005
Ghana -3.51 0.0000
4.517 0.0354
1.72E+09 0.0019
3.28 0.4629
-8.60 0.6146
2.54E+09 0.0005
Guinea 6.07 0.1518
9.39 0.0839
30374 - 0.0001
3.80 0.0000
1.38 0.6556
642670. 0.1435
Guinea Bissau -3.63E+08 0.0068
1.563262 0.0356
-192604 0.4467
1.50E+08 0.0004
79591 0.0416
392980.3 0.0022
Ivory Coast 1.45E+09 0.3949
1.146137 0.0802
2.91E+08 0.5860
6.01E+09 0.0000
-4.50E+08 0.3725
5916101 0.2781
Liberia 8.71E+08 0.0001
-0.0215 0.8069
-17117 0.0185
1.81E+08 0.0000
-2.74E+08 0.0000
9017301 0.0017
Mali 7.13E+09 0.0000
5.477802 0.0000
1.89E+08 0.0573
86938261 0.6458
2.35E+08 0.2717
-3525518 0.0283
Nigeria -2.41E+11 0.0000
-7.579077 0.0878
-1.66E+10 0.0004
9.28E+10 0.0000
3.98E+10 0.0031
5.42E+08 0.0218
Niger 9.49E+09 0.0000
2.098171 0.0010
-3281692 0.2797
1.92E+08 0.0169
-1.67E+08 0.0871
-1751038 0.0008
Senegal 1.18E+09 0.0001
5.980341 0.0112
-1.78E+08 0.4802
1.44E+09 0.0335
1.74E+08 0.1418
-1492122 0.0668
Sierra Leon -3.47E+09 0.0001
1.769317 0.0112
-7986343. 0.4802
2.80E+08 0.0335
-1.17E+08 0.1418
260218.9 0.0668
Togo -13373 0.1809
1.766761 0.0523
1762872. 0.9498
7.96E+08 0.0000
-1.13E+08 0.1771
1172359 0.0953
Note: The null hypothesis for the t-ratio is H0=βi= 0; Figures in parentheses are t-statistics (*), (**) and(***)significant with 95% (90%) confidence level Source: Authors Computation 2017
Table 8 above also presents the fully modified ordinary least square of the selected individual countries in West Africa. The estimated coefficient of the real infrastructure is positive in eight countries [0.67+E09 (Benin), 2.75 (Cape Verde), and 3.55E+08 (The Gambia) 6.07 (Guinea), 1.45E+09 (Ivory Coast), 8.71E+08 (Liberia) 0.0007 (Mali), 0.0000009 (Niger), 0.0000001 (Senegal) and 1.01 (Togo)] while coefficient of infrastructure is negative in Burkina Faso, Ghana, Guinea Bissau, Nigeria and Sierra Leon and statistically significant at 5% except Togo were not statistically significant at 5 per cent level. The estimate of coefficient for Official development assistant in Benin, Burkina Faso, Cape Verde, Gambia, Ghana, Guinea, Guinea-Bissau, Ivory Coast, Mali, Niger, Nigeria, Senegal, Sierra Leone, Togo are positive except only in Liberia is negative and statistically significant at the 5% level. Similar to the finding of Orji, 2014. However, coefficient for FDI inflows are positive in Benin, Burkina Faso, Cape Verde, Ghana, Guinea, Ivory Coast, Mali, Niger are positive but negative in Nigeria, Gambia Guinea, Liberia Senegal and Sierra Leon statistically significant. Corruption is positive in all the countries supporting the tradition theory of corruption i.e. corruption has become a normal thing in most the ECOWAS countries for human resource to be productive they must be induce by pride or illegal motivational factor. Finally, Political stability is also positive in most of these countries Except Sierra Leone, Togo, Benin, The Gambia, Cote‟d Ivoire and Ghana but not statistically significant at 5%. Government and policy Makers in ECOWAS countries need to endorse some investors‟ friendly policies that will attract more capital inflows (Be it FDI or ODA) and it is imperative to provide enabling environment. Basic infrastructures like good roads, electricity supply and security must be seen to be adequate. Corruption need to be minimized through anti-corruption agencies and of all investment security should be ascertained by ensuring political and economic stability within the region. Our findings is in line with that of (Kanu, 2014; Oriji et al., 2014). In general, the group fully modified ordinary least square for the panel of all ECOWAS member countries. It has been established from the above results that Foreign capital inflows, infrastructure and institutional qualities are statistical significantly influence on economic growth among the 15 ECOWAS member.
Academic Journal of Economic Studies
Vol. 3 (4), pp. 35–49, © 2017 AJES
47
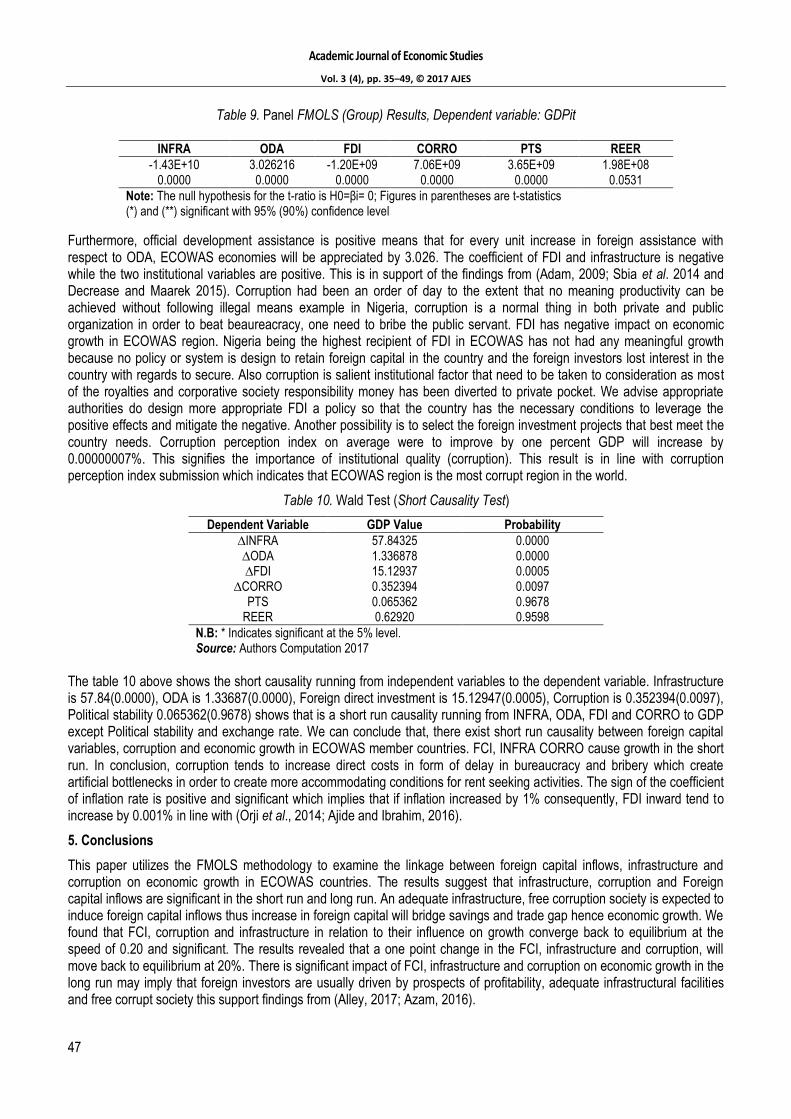
Table 9. Panel FMOLS (Group) Results, Dependent variable: GDPit
Furthermore, official development assistance is positive means that for every unit increase in foreign assistance with respect to ODA, ECOWAS economies will be appreciated by 3.026. The coefficient of FDI and infrastructure is negative while the two institutional variables are positive. This is in support of the findings from (Adam, 2009; Sbia et al. 2014 and Decrease and Maarek 2015). Corruption had been an order of day to the extent that no meaning productivity can be achieved without following illegal means example in Nigeria, corruption is a normal thing in both private and public organization in order to beat beaureacracy, one need to bribe the public servant. FDI has negative impact on economic growth in ECOWAS region. Nigeria being the highest recipient of FDI in ECOWAS has not had any meaningful growth because no policy or system is design to retain foreign capital in the country and the foreign investors lost interest in the country with regards to secure. Also corruption is salient institutional factor that need to be taken to consideration as most of the royalties and corporative society responsibility money has been diverted to private pocket. We advise appropriate authorities do design more appropriate FDI a policy so that the country has the necessary conditions to leverage the positive effects and mitigate the negative. Another possibility is to select the foreign investment projects that best meet the country needs. Corruption perception index on average were to improve by one percent GDP will increase by 0.00000007%. This signifies the importance of institutional quality (corruption). This result is in line with corruption perception index submission which indicates that ECOWAS region is the most corrupt region in the world.
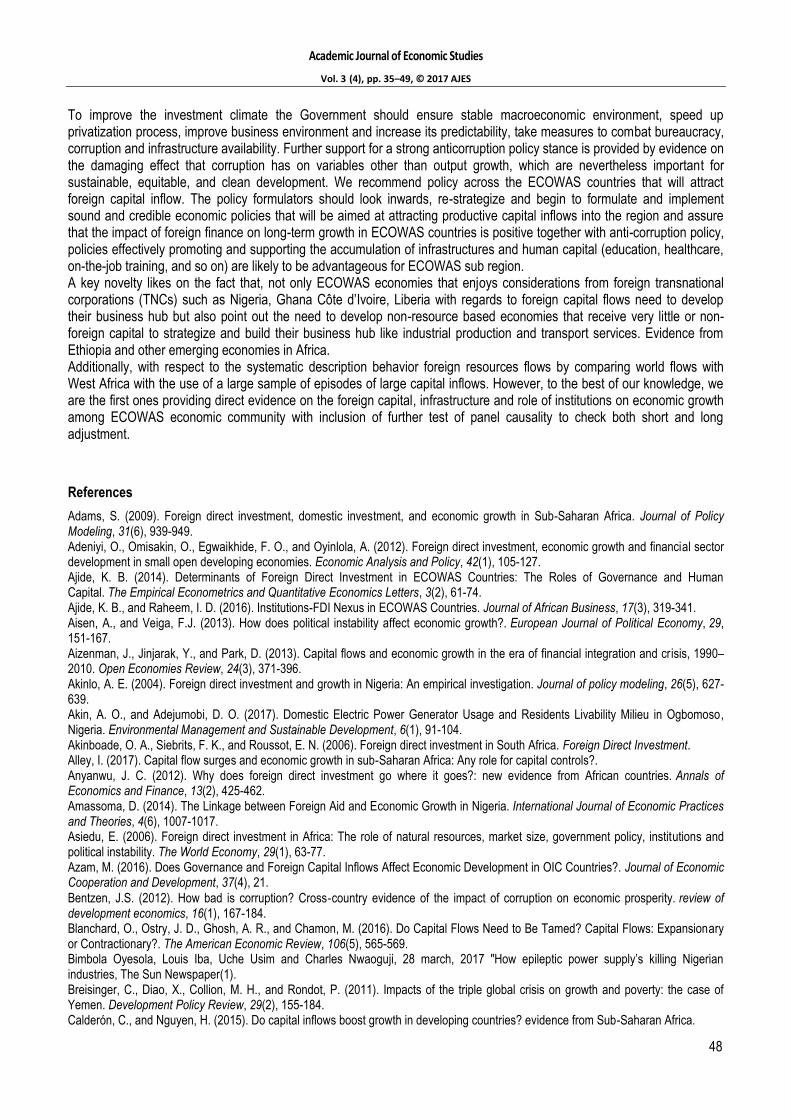
Table 10. Wald Test (Short Causality Test)
Dependent Variable GDP Value Probability
∆INFRA 57.84325 0.0000 ∆ODA 1.336878 0.0000 ∆FDI 15.12937 0.0005
∆CORRO 0.352394 0.0097 PTS 0.065362 0.9678
REER 0.62920 0.9598
N.B: * Indicates significant at the 5% level. Source: Authors Computation 2017
The table 10 above shows the short causality running from independent variables to the dependent variable. Infrastructure is 57.84(0.0000), ODA is 1.33687(0.0000), Foreign direct investment is 15.12947(0.0005), Corruption is 0.352394(0.0097), Political stability 0.065362(0.9678) shows that is a short run causality running from INFRA, ODA, FDI and CORRO to GDP except Political stability and exchange rate. We can conclude that, there exist short run causality between foreign capital variables, corruption and economic growth in ECOWAS member countries. FCI, INFRA CORRO cause growth in the short run. In conclusion, corruption tends to increase direct costs in form of delay in bureaucracy and bribery which create artificial bottlenecks in order to create more accommodating conditions for rent seeking activities. The sign of the coefficient of inflation rate is positive and significant which implies that if inflation increased by 1% consequently, FDI inward tend to increase by 0.001% in line with (Orji et al., 2014; Ajide and Ibrahim, 2016).
5. Conclusions
This paper utilizes the FMOLS methodology to examine the linkage between foreign capital inflows, infrastructure and corruption on economic growth in ECOWAS countries. The results suggest that infrastructure, corruption and Foreign capital inflows are significant in the short run and long run. An adequate infrastructure, free corruption society is expected to induce foreign capital inflows thus increase in foreign capital will bridge savings and trade gap hence economic growth. We found that FCI, corruption and infrastructure in relation to their influence on growth converge back to equilibrium at the speed of 0.20 and significant. The results revealed that a one point change in the FCI, infrastructure and corruption, will move back to equilibrium at 20%. There is significant impact of FCI, infrastructure and corruption on economic growth in the long run may imply that foreign investors are usually driven by prospects of profitability, adequate infrastructural facilities and free corrupt society this support findings from (Alley, 2017; Azam, 2016).
INFRA ODA FDI CORRO PTS REER
-1.43E+10 3.026216 -1.20E+09 7.06E+09 3.65E+09 1.98E+08 0.0000 0.0000 0.0000 0.0000 0.0000 0.0531
Note: The null hypothesis for the t-ratio is H0=βi= 0; Figures in parentheses are t-statistics (*) and (**) significant with 95% (90%) confidence level
Academic Journal of Economic Studies
Vol. 3 (4), pp. 35–49, © 2017 AJES
48
To improve the investment climate the Government should ensure stable macroeconomic environment, speed up privatization process, improve business environment and increase its predictability, take measures to combat bureaucracy, corruption and infrastructure availability. Further support for a strong anticorruption policy stance is provided by evidence on the damaging effect that corruption has on variables other than output growth, which are nevertheless important for sustainable, equitable, and clean development. We recommend policy across the ECOWAS countries that will attract foreign capital inflow. The policy formulators should look inwards, re-strategize and begin to formulate and implement sound and credible economic policies that will be aimed at attracting productive capital inflows into the region and assure that the impact of foreign finance on long-term growth in ECOWAS countries is positive together with anti-corruption policy, policies effectively promoting and supporting the accumulation of infrastructures and human capital (education, healthcare, on-the-job training, and so on) are likely to be advantageous for ECOWAS sub region. A key novelty likes on the fact that, not only ECOWAS economies that enjoys considerations from foreign transnational corporations (TNCs) such as Nigeria, Ghana Côte d‟Ivoire, Liberia with regards to foreign capital flows need to develop their business hub but also point out the need to develop non-resource based economies that receive very little or non-foreign capital to strategize and build their business hub like industrial production and transport services. Evidence from Ethiopia and other emerging economies in Africa. Additionally, with respect to the systematic description behavior foreign resources flows by comparing world flows with West Africa with the use of a large sample of episodes of large capital inflows. However, to the best of our knowledge, we are the first ones providing direct evidence on the foreign capital, infrastructure and role of institutions on economic growth among ECOWAS economic community with inclusion of further test of panel causality to check both short and long adjustment.
References
Adams, S. (2009). Foreign direct investment, domestic investment, and economic growth in Sub-Saharan Africa. Journal of Policy Modeling, 31(6), 939-949. Adeniyi, O., Omisakin, O., Egwaikhide, F. O., and Oyinlola, A. (2012). Foreign direct investment, economic growth and financial sector development in small open developing economies. Economic Analysis and Policy, 42(1), 105-127. Ajide, K. B. (2014). Determinants of Foreign Direct Investment in ECOWAS Countries: The Roles of Governance and Human Capital. The Empirical Econometrics and Quantitative Economics Letters, 3(2), 61-74. Ajide, K. B., and Raheem, I. D. (2016). Institutions-FDI Nexus in ECOWAS Countries. Journal of African Business, 17(3), 319-341. Aisen, A., and Veiga, F.J. (2013). How does political instability affect economic growth?. European Journal of Political Economy, 29, 151-167. Aizenman, J., Jinjarak, Y., and Park, D. (2013). Capital flows and economic growth in the era of financial integration and crisis, 1990–2010. Open Economies Review, 24(3), 371-396. Akinlo, A. E. (2004). Foreign direct investment and growth in Nigeria: An empirical investigation. Journal of policy modeling, 26(5), 627-639. Akin, A. O., and Adejumobi, D. O. (2017). Domestic Electric Power Generator Usage and Residents Livability Milieu in Ogbomoso, Nigeria. Environmental Management and Sustainable Development, 6(1), 91-104. Akinboade, O. A., Siebrits, F. K., and Roussot, E. N. (2006). Foreign direct investment in South Africa. Foreign Direct Investment. Alley, I. (2017). Capital flow surges and economic growth in sub-Saharan Africa: Any role for capital controls?. Anyanwu, J. C. (2012). Why does foreign direct investment go where it goes?: new evidence from African countries. Annals of Economics and Finance, 13(2), 425-462. Amassoma, D. (2014). The Linkage between Foreign Aid and Economic Growth in Nigeria. International Journal of Economic Practices and Theories, 4(6), 1007-1017. Asiedu, E. (2006). Foreign direct investment in Africa: The role of natural resources, market size, government policy, institutions and political instability. The World Economy, 29(1), 63-77. Azam, M. (2016). Does Governance and Foreign Capital Inflows Affect Economic Development in OIC Countries?. Journal of Economic Cooperation and Development, 37(4), 21.
Bentzen, J.S. (2012). How bad is corruption? Cross‐country evidence of the impact of corruption on economic prosperity. review of development economics, 16(1), 167-184. Blanchard, O., Ostry, J. D., Ghosh, A. R., and Chamon, M. (2016). Do Capital Flows Need to Be Tamed? Capital Flows: Expansionary or Contractionary?. The American Economic Review, 106(5), 565-569. Bimbola Oyesola, Louis Iba, Uche Usim and Charles Nwaoguji, 28 march, 2017 "How epileptic power supply‟s killing Nigerian industries, The Sun Newspaper(1). Breisinger, C., Diao, X., Collion, M. H., and Rondot, P. (2011). Impacts of the triple global crisis on growth and poverty: the case of Yemen. Development Policy Review, 29(2), 155-184. Calderón, C., and Nguyen, H. (2015). Do capital inflows boost growth in developing countries? evidence from Sub-Saharan Africa.
Academic Journal of Economic Studies
Vol. 3 (4), pp. 35–49, © 2017 AJES
49
Carree, M. A., and Thurik, A. R. (2010). The impact of entrepreneurship on economic growth. In Handbook of entrepreneurship research (pp. 557-594). Springer New York. Chenery, H. B., and Strout, A. M. (1966). Foreign assistance and economic development. The American Economic Review, 679-733. Chinn, M. D., and Prasad, E. S. (2003). Medium-term determinants of current accounts in industrial and developing countries: an empirical exploration. Journal of International Economics, 59(1), 47-76. Decreuse, B., and Maarek, P. (2015). FDI and the labor share in developing countries: A theory and some evidence. Annals of Economics and Statistics/Annales d'Économie et de Statistique, (119/120), 289-319. De Mello, L. R. (1999). Foreign direct investment-led growth: evidence from time series and panel data. Oxford economic papers, 51(1), 133-151. Forere, M. (2012). Is Discussion of the “United States of Africa” Premature? Analysis of ECOWAS and SADC Integration Efforts. Journal of African Law, 56(01), 29-54. Furceri, D., Guichard, S., and Rusticelli, E. (2011). The effect of episodes of large capital inflows on domestic credit. Hébert, R. F., and Link, A. N. (1989). In search of the meaning of entrepreneurship. Small Business Economics, 1(1), 39-49. Ifeakachukwu, N. P., and Ditimi, A. (2014). Capital Inflows and Exchange Rate in Nigeria. Mediterranean Journal of Social Sciences, 5(7), 263. Kolawole, B. O. (2013). Foreign assistance and Economic growth in Nigeria: The two-Gap model Framework. American International Journal of Contemporary Research, 3(10), 153-160. Panel, A. P. (2015). Power people planet: seizing Africa's energy and climate opportunities: Africa progress report 2015. Policy, E., and Politics, C. (2016). Fuel for Thought. Energy and Environment, 27(3-4), 434-515. Mastromarco, C., and Simar, L. (2015). Effect of FDI and time on catching up: New insights from a conditional nonparametric frontier analysis. Journal of Applied Econometrics, 30(5), 826-847. Nwaogu, Uwaoma G., and Michael J. Ryan. "FDI, foreign aid, remittance and economic growth in developing countries." Review of Development Economics 19.1 (2015): 100-115. Okafor, C., Smith, L. M., and Ujah, N. U. (2014). Kleptocracy, nepotism, kakistocracy: impact of corruption in Sub-Saharan African countries. International Journal of Economics and Accounting, 5(2), 97-115. Olakojo, S. A. (2017). Foreign trade and international financial flows: Implications for economic stability in ECOWAS countries. Onyeiwu, S. (2015). Regionalism and Industrial Development. In Emerging Issues in Contemporary African Economies (pp. 105-124). Palgrave Macmillan US. Orji, A., Uche, A. S., and Ilori, E. A. (2014). Foreign capital inflows and growth: An empirical analysis of WAMZ experience. International Journal of Economics and Financial Issues, 4(4), 971-983. Romer, P. (1993). Idea gaps and object gaps in economic development. Journal of monetary economics, 32(3), 543-573. Stanisic, N. (2015). Do foreign direct investments increase the economic growth of Southeastern European transition economies?. South-Eastern Europe Journal of Economics, 6(1). Solow, R. M. (1999). Neoclassical growth theory. Handbook of macroeconomics, 1, 637-667. Swan, T. W. (1956). Economic growth and capital accumulation. Economic record, 32(2), 334-361. Taylor, M. P., and Sarno, L. (1997). Capital flows to developing countries: long-and short-term determinants. The World Bank Economic Review, 11(3), 451-470. Teixeira, A. A., and Guimarães, L. (2015). Corruption and FDI: Does the Use of Distinct Proxies for Corruption Matter?. Journal of African Business, 16(1-2), 159-179. UNCTAD, U. (2016). World Investment Report 2016. Ugur, M., and Dasgupta, N. (2011). Evidence on the economic growth impacts of corruption in low-income countries and beyond. London: EPPI-Centre, Social Science Research Unit, Institute of Education, University of London, 2. Wadho, W. A. (2014). Education, rent seeking and the curse of natural resources. Economics and Politics, 26(1), 128-156. Wang, C., Hong, J., Kafouros, M., and Wright, M. (2012). Exploring the role of government involvement in outward FDI from emerging economies. Journal of International Business Studies, 43(7), 655-676.
Related Documents