P OLICY R ESEARCH WORKING P APER 4666 The Impact of Food Inflation on Urban Poverty and Its Monetary Cost: Some Back-of-the-Envelope Calculations Sébastien Dessus Santiago Herrera Rafael de Hoyos The World Bank Development Economics Vice Presidency July 2008 WPS4666 Public Disclosure Authorized Public Disclosure Authorized Public Disclosure Authorized Public Disclosure Authorized

Welcome message from author
This document is posted to help you gain knowledge. Please leave a comment to let me know what you think about it! Share it to your friends and learn new things together.
Transcript

Policy ReseaRch WoRking PaPeR 4666
The Impact of Food Inflation on Urban Poverty and Its Monetary Cost:
Some Back-of-the-Envelope Calculations
Sébastien DessusSantiago HerreraRafael de Hoyos
The World BankDevelopment Economics Vice PresidencyJuly 2008
WPS4666P
ublic
Dis
clos
ure
Aut
horiz
edP
ublic
Dis
clos
ure
Aut
horiz
edP
ublic
Dis
clos
ure
Aut
horiz
edP
ublic
Dis
clos
ure
Aut
horiz
ed

Produced by the Research Support Team
Abstract
The Policy Research Working Paper Series disseminates the findings of work in progress to encourage the exchange of ideas about development issues. An objective of the series is to get the findings out quickly, even if the presentations are less than fully polished. The papers carry the names of the authors and should be cited accordingly. The findings, interpretations, and conclusions expressed in this paper are entirely those of the authors. They do not necessarily represent the views of the International Bank for Reconstruction and Development/World Bank and its affiliated organizations, or those of the Executive Directors of the World Bank or the governments they represent.
Policy ReseaRch WoRking PaPeR 4666
This paper uses a sample of 73 developing countries to estimate the change in the cost of alleviating urban poverty brought about by the recent increase in food prices. This cost is approximated by the change in the poverty deficit, that is, the variation in financial resources required to eliminate poverty under perfect targeting. The results show that, for most countries, the cost represents less than 0.1 percent of gross domestic product. However, in the most severely affected, it may exceed 3 percent. In
This paper—a product of the Development Economics Vice Presidency (DEC)—is part of a larger effort in the department to analyze policy-relevant topics rigorously with the best available information to support decision making. Policy Research Working Papers are also posted on the Web at http://econ.worldbank.org. The authors may be contacted at [email protected], [email protected], [email protected].
all countries, the change in the poverty deficit is mostly due to the negative real income effect of those households that were poor before the price shock, while the cost attributable to new households falling into poverty is negligible. Thus, in countries where transfer mechanisms with effective targeting already exist, the most cost-effective strategy would be to scale up such programs rather than designing tools to identify the new poor.

The Impact of Food Inflation on Urban Poverty
and Its Monetary Cost: Some Back-of-the-Envelope Calculations
Sébastien Dessus, Santiago Herrera, Rafael de Hoyos∗
JEL: D12, I32 Keywords: Urban Poverty, Food Prices
I. Introduction
The objective of this paper is to estimate the monetary cost of alleviating urban poverty changes induced by the increase in food prices since 2005 in a large sample of developing countries. The cost is approximated by the change in the “poverty deficit” (Atkinson, 1987), that is, the variation in financial resources required to lift all urban poor out of poverty under perfect targeting. In this context, the change in the urban poverty deficit can be decomposed into two additive elements: (a) the extra monetary cost (with respect to the initial situation) required to bring current poor households above the poverty line given the new set of ∗ The findings, interpretations, and conclusions are those of the authors, and do not necessarily represent the views of The World Bank or its Executive Directors. For their comments we are grateful to Shanta Devarajan, Alan Gelb, Delfin Go, Eduardo Ley, Cristina Savescu, Augusto de la Torre, and Quentin Wodon. Rebecca Lessem provided excellent research assistance. Address for correspondence: [email protected], [email protected] and [email protected].

prices, and (b) the monetary cost required to pull out of poverty those households falling below the poverty threshold due to price increases. Thus, we take into account both the change in the depth of poverty, i.e. the increase in the poverty gap given the increase in food prices, and the additional number of urban poor. Our estimates depend on three country-specific parameters for which we have data of limited comparability: (i) the change in the domestic relative price of food, which varies across countries due to different global prices pass-through to domestic prices; (ii) the share of the total household budget allocated to food consumption by those households below the poverty line or sufficiently close to it to be considered vulnerable to price changes; and (iii), the elasticity of substitution between food and non food items for poor and vulnerable households. Given the uncertainty regarding these three parameters we consider a range of plausible values in our computations, based on information for a subset of countries. On the other hand, there exists reliable and comparable country-specific information on urban poverty and income distribution that we use to estimate the change in the poverty deficit. The results show a range of estimates of changes in the poverty deficit for each country in our sample; these back-of-the-envelope computations can be refined with additional country-specific information as it becomes available. We focus exclusively on urban poverty for various reasons. First, from the methodological viewpoint, it is critical to control for the positive income effect that food inflation has on the households which derive their income from agriculture-related activities. Unlike rural households, urban ones only derive a small --if any-- share of their income from agricultural activities. Hence, the assumption that food inflation will only affect the price of their consumption basket, leaving their income unchanged, is not unrealistic. In contrast, rural households derive a substantial part of their income from agricultural activities, and estimation of the net impact of food inflation on rural poverty would require detailed and country specific data which we do not have on a large and comparable basis.1 Hence, the focus on the urban poor does not mean that rural poverty is not of concern, but rather, it is an unfortunate consequence of the lack of valuable information. Second, from the policy perspective, it is justifiable to distinguish urban from rural areas, in particular when it is advised to resort on targeted transfer programs to mitigate poverty (World Bank, 2008). Indeed, these programs are, by nature, located in specific places (food-for-work programs, schools to send children) or destined to localizable agents. As such, it is possible to assess the adequacy of current and envisaged transfers in cities in response to the increase in poverty. Third, the inflation information captured by CPIs reflects price changes taking place in the cities rather than in rural areas. Finally, focusing on urban areas—where a welfare loss will unambiguously occur as a consequence of higher food prices—allows us to identify countries at risk of potential social unrest.
1 Not only the net buyer/seller position of rural households vis-à-vis each commodity needs to be known (such data are not always available in households surveys; and many developing countries simply do not have sufficiently recent surveys), but also the cost and factors’ market structures to estimate who would benefit the most from food price spikes: farmers, land owners, intermediaries, etc.

There are alternative approaches to estimate the impact of the price shock on the poor. Compared with recent papers on the same subject (Ivanic and Martin, 2008, Wodon et al. 2008), the present paper differs on several grounds. First, we use household survey data for 73 countries2 covering 88 percent of the population living in developing countries in 2005; second, in addition to measuring the impact of food price changes on the headcount poverty rate, we differentiate between the cost attributable to the “new poor” versus that one of the existing poor before the price increases; and third, our approach focuses only on urban households, ignoring income effects for food-producing households. Similarly to Ivanic and Martin, 2008 and Wodon et al. 2008, the present study focuses on the short-term micro-economic impacts, ignoring second-round or multiplier effects which could occur in the longer run.3 Despite the methodological caveats and data limitations, this paper is a useful first step to identify countries facing the highest risk level of severe disruption in their fight against urban poverty as a result of the food price shock. The note also gauges the order of magnitude of a ceiling for the cost of these interventions, understood as aiming to offset the impact of food price spikes on urban poverty at US$1 or US$2 a day.4 II. Methodology and Stylized Facts
A. Methodology Define as the per capita household income of household “h” and z as the minimum income required to purchase a basket of goods that satisfies a required level of consumption (the poverty line), most of which of food. If q individuals fall below z, the total monetary cost of providing those individuals with the required consumption level is defined as:
hy
(1) ( )∑=
−=q
iiyzPD
1
( )zyyy q ≤<< K21
The increase in food prices will raise the monetary cost of affording the same basket of goods. Assuming that incomes remain constant (consistently with our focus on consumption effects), the change in the poverty deficit (PD) due to an increase in the poverty line can be defined as follows:
2 Since the household survey data for China is not available, the computations for this country relied on the PovCal parameterization of the Lorenz curve. 3 Ivanic and Martin (2008) also account for changes in unskilled wages rates so as to capture higher factor remuneration in agriculture. According to the authors, citing Ravallion (1990), such a wage response could take several years. Passa Orio and Wodon (2008) estimate the longer term impact of specific commodity price spikes on the price of other commodities through a social accounting matrix multiplier effect approach, and suggest that indirect effects are much more pronounced for oil than food. Dessus (2008), using a computable general equilibrium model, assesses the impact of imported inflation on domestic prices accounting for behavioral effects and substitution effects in the short, medium and long run in Tanzania. 4 This paper consistently uses poverty lines and GDP expressed in purchasing power parities derived from the ICP 1993, as new poverty lines derived from the ICP 2005 have not yet been disclosed.

(2) ( ) ( ) ( )∑∑∑===
−+−−−=Δι
ιιq
qii
q
ii
q
ii yzyzyzPD
11
New poorOld Poor where and ι represent the post-price increase extreme poverty line and headcount, respectively; hence
ιz q( )ιι zyyzyy
qqq <<<≤< + KK 11 . The first two elements on the
right hand side of equation (2) account for the increase in the poverty gap keeping the number of poor constant at q, i.e. the old poor; the last element captures the increase in poverty deficit explained by an increase in the number of poor from q to ι or the new poor. To measure the importance of PD in terms of the total resource of the economy, we define the cost of an increase in food prices as the change in the PD divided by the sum of total household income,
q
∑ ==
N
i iyY1
, quasi equivalent from a macro-economic perspective to GDP. Notice that the change in PD accounted by the old poor is equivalent to the concept of compensating variation (CV) introduced by Hicks and developed later by Deaton and Muellbauer (1980): it has been applied in numerous empirical studies including Friedman and Levinsohn (2002), Niimi (2005), and Ackah and Appleton (2007). The CV measures the change in money income or expenditure, )(⋅c , needed to maintain a constant utility level after a change in prices: (3) ),(),( 1010 pucpuccCV −=Δ= where p and u represent the vector of prices in the economy and the utility level, respectively. Using a second order Taylor expansion of the expenditure function, Friedman and Levinsohn (2002) show that the compensating variation can be approximated by the following expression:
(4) psppxc ΔΔ+Δ≈Δ '*21
where x are the quantities consumed and s is the compensated derivative of demand. The second element in the right hand side of expression (4) allows for substitution effects, i.e. a change in quantity demanded given a change in relative prices. Equation (4) can be reformulated in terms of proportional changes and household budget shares (Friedman and Levinsohn, 2002):
(5) ∑∑∑ ΔΔ+Δ≈Δi j
jiijii
ii ppwpwc lnln21lnln ε

where wi is the budget share allocated to good “i”, in our case being food, ijε is the price elasticity of good “i” with respect to price change “j”. Therefore, the critical elements to estimate the compensating variation for the poor given a change in relative prices are: (a) the share of food consumption in total household budget of the poor, (b) the change in relative prices, and (c) the elasticity of substitution between food and non-food items for households below the poverty line. The CV for the old poor plus the extra cost accounted by the new poor will give the change in poverty deficit (PD) brought about by the increase in the price of food. The three parameters required for our computation vary across countries and between households within the same country. Calculating the PD for a large number of countries implies collecting --and in some cases estimating-- this household-level information, which is a gigantic undertaking. In this paper we simplified the task by computing the PD for each country under three different scenarios capturing plausible values of the three parameters yielding three scenarios: a central one, and a lower and upper bounds scenarios, respectively. The values of the parameters are discussed in the next section. B. Stylized facts and data issues
Figure 1 shows how the food budget shares and the price elasticity of demand change with the income level in a sample of about 100 countries. 5. As income increases, the food budget share declines from around 70 percent to 10 percent. The price elasticity of food demand is non-linear, decreasing at low income levels, and then increasing, with a range from -.4 to -.1.
Figure 1 Food budget share and price elasticity of demand across countries
0
10
20
30
40
50
60
70
80
6 7 8 9 10 11 12
(log) GDP per capita
food
bud
get s
hare
-.40
-.35
-.30
-.25
-.20
-.15
-.10
-.05
6 7 8 9 10 11 12
(log) GDP per capita
pric
e el
astic
ity
Our estimations consider a range for the food budget shares from 50 percent to 70 percent, with a mid point of 60 percent. Recall that Figure 1 shows country averages, and hence the poor in each country will have food budget shares higher than the national
5 Data source for food budget shares and price elasticities Seale et.al. (2003).

average. The food price-elasticity can take extreme values of -.3 or -.1, with a mid value of -.2. The relationship between international and domestic food prices is country-specific. The transmission of high world prices to domestic prices depends on the depth of international markets for different commodities, countries’ exchange rates variations against the US dollar during the period, the degree of openness of the different economies and domestic policies in response to the shock. Domestic relative food prices are affected by inflation of non-food prices, which also varies by country. Evidence on price transmission mechanisms is limited to few countries and commodities.6 But incomplete pass-through combined with differentiated price inflation across commodities is consistent with the observation of relatively moderate food inflation in many developing countries relative to the overall consumer price index. Table 1 shows the changes in food relative prices in a few countries of different income levels. In all cases, food price inflation is significantly lower than international levels. The FAO obtains the same result with a different sample of countries over the period 2007-8.7 Based on this range of observed relative price changes over the period 2005-8, the estimations reported in the next section considered three alternative scenarios for food relative price changes: 10%, 20% and 30%.
Table 1 Heterogeneity in the changes in relative prices, 2005-2008
CPI inflation
(%)
Food inflation
(%)
Change in food relative prices* (%)
India 16 22 12 Tanzania 32 39 14 Colombia 13 22 18 Nigeria 18 17 -2 Bolivia 23 38 30 Bangladesh 17 21 8 Mexico 9 15 12 Chile 12 20 16 Egypt 24 38 28 Pakistan 33 42 18
*The non-food price inflation is estimated assuming a weight of 50% for food in the overall consumer price index. The change in relative prices is the difference between food and non-food inflation. Source: calculations based on data from national statistical offices.
6 FAO research suggests that the pass-through of the world price of rice in US$ to domestic markets in six Asian countries currencies over the period Q4-2003 to Q4-2007 ranged between 6 and 64 percent, or one-third on average (FAO, 2008). Baffes and Gardner (2003) shows that pass-through effects are weak and they vary across countries and commodities. 7 See FAO (2008).

Based on the possible values of the three varying parameters we derived three estimates- central, upper and lower bounds- of the increase in the poverty line, or conversely the reduction in real income, resulting from higher food prices.8 Table 2 summarizes results of three scenarios. The higher the relative price change, the higher the food share in total consumption, and the lower the price elasticity, the higher the decline in real income, in our case, 20 percent. Table 2 Estimates of change in real household income as a result of the change in relative food prices
Relative price change (%)
Share of food consumption (%)
Price elasticity
Change in real income (%)
Upper bound scenario 30 70 0.1 -20 Central scenario 20 60 0.2 -11 Lower bound scenario 10 50 0.3 -4
Notes: The figures in the first three columns capture possible parameter values determining the real income effects of price changes among poor and near poor households (i.e households near the poverty line). The upper and lower bound estimate can be interpret as the worse and best case scenario, respectively. The figures are based on the stylized facts shown in Figure 1 and Table 1. The change in real income is estimated using equation 5. In turn, for a given change in real households’ income the country-specific information on income distribution allows us to estimate the change in the poverty deficit. The computations are based on the micro dataset part of the Global Income Distribution Dynamics (GIDD) model.9 The GIDD data includes 73 household surveys for low and middle income countries, adding up to 1.2 million households and over 5.1 million individuals. This large dataset together with aggregate information for China accounts for 88 percent of the population of the developing world in 2005. The advantage of having such a rich dataset is that we can compute the initial and final PD taking full account of household heterogeneity, without relying on simple average characteristics of the poor or on parameterizations of the Lorenz curve. III. Results This section reports our estimates of the impact of food inflation on urban poverty at US$1 and US$2 a day. Given the large number of country- and scenario-specific estimates, this section shows detailed results for those countries with the higher change in the poverty deficit under the central scenario. The results for all countries under each of the three scenarios are presented in Annex II. A. US$1 a day urban poverty
8 The use of three different values for the three parameters yields 27 possible combinations. For the sake of clarity, we only report here the lower bound, the central, and the upper bound estimates. 9 For an explanation of the GIDD and an application on the ex-ante changes in global income distribution see Bussolo et al. (2007).

Table 3 reports urban poverty rates and poverty deficits before the price shock and changes in poverty headcount and the poverty deficits after the price shock in the twenty most severely affected countries. The increase in urban poverty rate (or headcount, i.e., the proportion of the population below the poverty line), averages 4 percentage points, and ranges from 1 to 6 percentage points. The cost (estimated as the change in the poverty deficit) reaches an average 0.5 percentage points of GDP, ranging from 0.1 to 2.8 percent. It is noteworthy that over 90 percent of the additional monetary cost stems from the loss in real income of those who were already poor before the price shock. Conversely, the additional monetary cost accounted for by the increase in the number of poor is relatively modest. This is due to the fact that the poverty gap among the new poor is much smaller than that of the old poor after the crisis.
Table 3. Urban poverty at US$1 a day: Countries at risk
Initial situation
(2005) 2008 Central Scenario
Country Poverty
Headcount Poverty Deficit
Δ in Poverty
HeadcountEstimated
Cost
Due to old
poor
Due to new poor
Nigeria 54.6 10.0 6.1 2.8 2.6 0.2 Nicaragua 36.5 5.1 3.7 1.5 1.4 0.1 Haiti 43.5 6.4 3.5 1.2 1.2 0.0 Madagascar 35.8 2.6 4.0 0.8 0.8 0.0 Uganda 42.0 2.6 5.4 0.8 0.7 0.0 Cambodia 25.1 1.1 5.8 0.5 0.4 0.1 Benin 17.1 0.8 5.8 0.4 0.4 0.1 Tanzania 21.9 0.9 4.2 0.4 0.3 0.1 Ghana 10.0 0.4 3.1 0.2 0.2 0.0 El Salvador 9.6 0.6 1.4 0.2 0.2 0.0 Mauritania 7.0 0.2 1.8 0.2 0.1 0.1 Côte d'Ivoire 8.6 0.3 2.4 0.2 0.1 0.1 Bangladesh 8.7 0.2 5.0 0.1 0.1 0.0 Ethiopia 15.2 0.2 5.4 0.1 0.1 0.0 India 5.7 0.1 3.3 0.1 0.1 0.0 Burkina Faso 8.6 0.2 4.3 0.1 0.1 0.0 Bolivia 4.8 0.2 1.2 0.1 0.1 0.0 Pakistan 3.0 0.0 3.2 0.1 0.1 0.0 Mali 3.4 0.1 2.3 0.1 0.1 0.0 Burundi 12.5 0.2 2.1 0.1 0.1 0.0
*Notes: (1) Authors’ own calculations using data from the GIDD; (2) the poverty deficit is expressed as a proportion of the sum of total household incomes; (3) the estimated cost is defined as the difference between the initial PD and the PD after the price shock; (4) households surveys have been standardized to year 2005 using information from national accounts; see Annex I for methodological details and Annex II for a complete listing of countries with results.
The results show that initial conditions matter tremendously in the determination of poverty impact, reflecting different initial urban / rural population distributions, poverty levels, gaps and income distributions. Nigeria’s 2005 GDP per capita might for instance

exceed that of Ghana, yet the additional cost of alleviating urban poverty induced by food price increases is much higher in Nigeria (2.8 percent of GDP) than in Ghana (0.2. percent of GDP). Figure 2 shows how countries facing similar increases in poverty rates might also face very different costs (i.e. changes in poverty deficit) implied by the shock. For instance, India and Haiti’s urban poverty rates increase by a similar magnitude (3.3 and 3.5 percentage points respectively) in the central scenario. But the change in poverty deficit would exceed 1 percent of GDP in Haiti, while it would be 0.1 percent in India. This is explained by the different initial urban poverty rates in these two countries, with that of Haiti being significantly higher.
Figure 2. Estimated changes in urban poverty deficits and poverty rates (US$1 a day)
GIN CMRECU BDIMLI PAKBOL BFAIND ETHBGDCIVMRTSLV GHA
TZABENKHM
UGAMDG
HTI
NIC
NGA
0.0
0.5
1.0
1.5
2.0
2.5
3.0
0.0 1.0 2.0 3.0 4.0 5.0 6.0 7.0
Change in poverty rate (central estimate, percentage points)
Cha
nge
in p
over
ty d
efic
it (c
entr
al e
stim
ates
, per
cent
age
poin
ts)

Figure 3. Central, upper and lower estimates of changes in urban poverty deficits (US$1 a day)*
0.0
1.0
2.0
3.0
4.0
5.0
6.0
NGA NIC HTI MDG UGA KHM BEN TZA GHA SLV MRT CIV BGD ETH IND BFA BOL *Central, upper and lower scenarios defined in Table 2
These figures vary with the upper and lower bound assumptions of real income changes. In Nigeria, for instance, assuming a 20 percent decline in real income induces a change in urban poverty deficit in excess of 5 percent of GDP. Yet, only in 5 countries out of 73, the upper bound cost estimate (at US$1 a day) exceeds 1 percent of GDP. In contrast, there are 57 countries (out of 73 included in the sample) for which the estimated change in poverty deficit represents less than 0.1 percent of GDP when using central estimates, or 49 when using upper bound estimates. Within this 49 countries, the average change in urban poverty headcount approaches 1 percent of the urban population, which is not negligible. However the cost as a share of GDP is relatively small suggesting that most of these countries have the domestic financial capacity to address the problem.
B. US$2 a day urban poverty
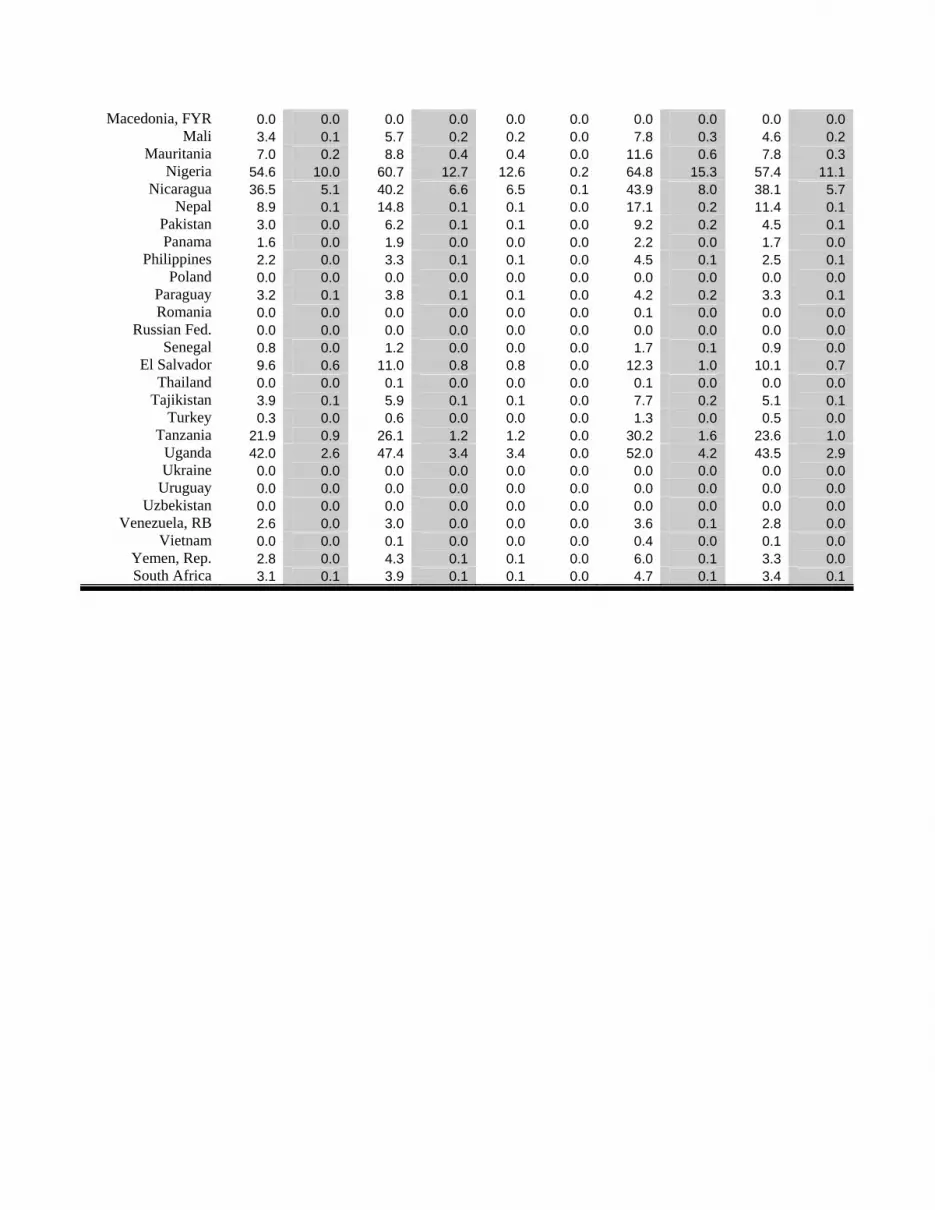
This section uses a different definition of poverty, probably more applicable to an urban setting. Table 4 reports the urban poverty rates and poverty deficits before the price shock, and the change in poverty headcount and poverty deficit after the price increase in the twenty most severely affected countries. In these countries the rise in urban poverty rates reaches an average of 5 percentage points, ranging from 3 to 8 percentage points. This would correspond to an average change in the poverty deficit (as a share of GDP) of 2.2 percentage points, ranging from 0.7 to 8.4 percent.

Table 4. Urban poverty at US$2 a day: Countries at risk
Initial situation
(2005) 2008 Central Scenario
Country Poverty
Headcount PovertyDeficit
Δ in Poverty
HeadcountEstimated
Cost
Due to old
poor
Due to new poor
Nigeria 86.0 42.9 2.9 8.4 8.2 0.1 Nicaragua 66.0 24.4 3.9 5.4 5.2 0.2 Haiti 61.6 19.7 2.9 3.3 3.3 0.1 Madagascar 68.2 13.0 5.0 3.0 2.9 0.1 Uganda 76.3 12.8 3.0 2.8 2.7 0.1 Benin 56.1 8.3 5.5 2.5 2.4 0.1 Cambodia 62.5 8.6 4.8 2.3 2.2 0.1 Tanzania 62.2 7.0 5.1 2.0 1.9 0.1 Mauritania 39.3 4.3 6.9 1.7 1.5 0.1 Pakistan 46.7 3.2 8.4 1.5 1.4 0.1 Ghana 37.7 4.3 5.1 1.4 1.3 0.1 India 44.2 3.4 6.8 1.4 1.3 0.1 Bangladesh 47.4 3.5 5.8 1.3 1.2 0.1 Côte d'Ivoire 35.1 3.4 5.4 1.2 1.1 0.1 Mali 32.0 2.4 5.7 1.1 1.0 0.1 Indonesia 25.8 1.8 7.5 1.0 0.9 0.1 Ethiopia 61.0 2.8 4.9 0.9 0.9 0.0 El Salvador 25.0 3.2 3.6 0.9 0.8 0.1 Guinea 26.2 1.8 7.7 0.9 0.8 0.1 Cameroon 25.5 1.7 5.3 0.7 0.7 0.1
*Notes: (1) Authors’ own calculations using data from the GIDD; (2) the poverty deficit is expressed as a proportion of the sum of total household incomes; (3) the estimated cost is defined as the difference between the initial PD and the PD after the price shock; (4) households surveys have been standardize to year 2005 using information from national accounts, see Annex I for methodological details and Annex II for a complete list of countries
Interestingly, 17 of the 20 most affected countries at US$2 a day are also among those most affected at US$1 a day (Table 3). The higher number of poor and near poor at US$2 a day than at US$1 a day explains the larger costs. In turn, the relationship between the change in poverty rates and the change in poverty deficits becomes less pronounced. Nigeria and Haiti register similar increases in poverty rates, 3 percentage points, but the monetary cost is much higher in Nigeria (8.4 against 3.3 percent of GDP).
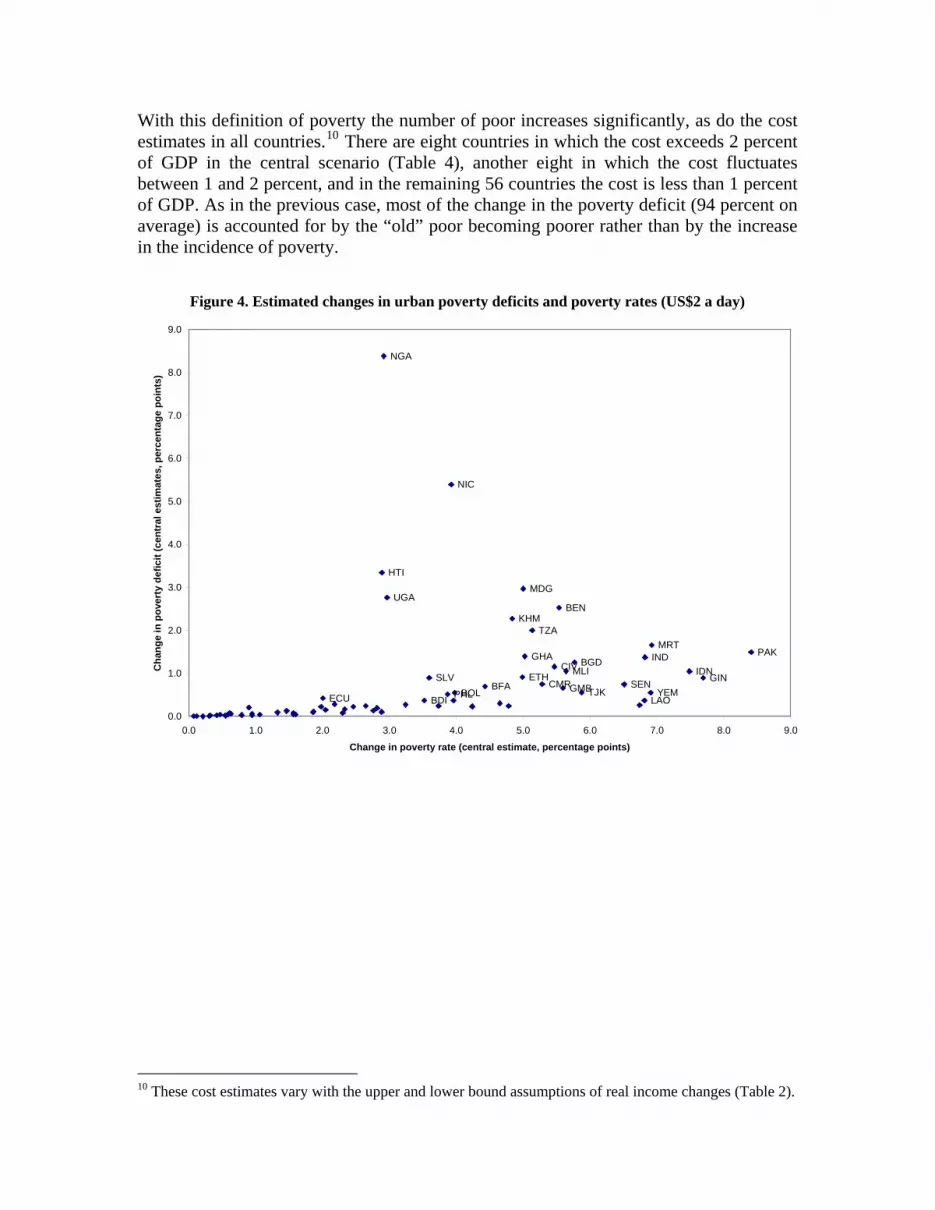
With this definition of poverty the number of poor increases significantly, as do the cost estimates in all countries.10 There are eight countries in which the cost exceeds 2 percent of GDP in the central scenario (Table 4), another eight in which the cost fluctuates between 1 and 2 percent, and in the remaining 56 countries the cost is less than 1 percent of GDP. As in the previous case, most of the change in the poverty deficit (94 percent on average) is accounted for by the “old” poor becoming poorer rather than by the increase in the incidence of poverty.
Figure 4. Estimated changes in urban poverty deficits and poverty rates (US$2 a day)
BDI LAOECU PHLBOL YEMTJKGMBBFA SENCMR GINSLV ETH IDNMLICIV BGD INDGHA PAKMRT
TZAKHM
BENUGA
MDGHTI
NIC
NGA
0.0
1.0
2.0
3.0
4.0
5.0
6.0
7.0
8.0
9.0
0.0 1.0 2.0 3.0 4.0 5.0 6.0 7.0 8.0 9.0
Change in poverty rate (central estimate, percentage points)
Cha
nge
in p
over
ty d
efic
it (c
entr
al e
stim
ates
, per
cent
age
poin
ts)
10 These cost estimates vary with the upper and lower bound assumptions of real income changes (Table 2).

Figure 5. Central, upper and lower estimates of changes in urban poverty deficits (US$2 a day)*
0.0
2.0
4.0
6.0
8.0
10.0
12.0
14.0
16.0
NGA NIC HTI MDG UGA BEN KHM TZA MRT PAK GHA IND BGD CIV MLI IDN ETH *Central, upper and lower scenarios defined in Table 2
IV. Conclusions This paper estimates the urban poverty impact of recent food price inflation and its monetary cost in a sample of countries covering 88 percent of the population in the developing world. To achieve this large coverage, we relied on simplifying assumptions which, necessarily, entails a trade-off in terms of country-specific accuracy. One of the more critical aspects and limitations of this exercise is its exclusive focus on urban poverty. At the same time, focusing on urban poverty allows interpreting more safely the estimates as a minimum impact on poverty in the absence of readily functioning compensating mechanisms between rural and urban areas. The results are useful for focusing attention on the identified set of countries where the urban poverty deficit increases the most and hence are more likely to experience demands for redistribution and, perhaps, social unrest. In most countries, the induced monetary cost of additional urban poverty is estimated to be small relative to GDP, even if poverty rates increase significantly. Nevertheless in some countries the cost is significant. Unsurprisingly, the results suggest that countries with high initial poverty rates and poverty gaps are particularly vulnerable to food price increases. For the same reasons, estimated changes in urban poverty deficits at US2$ a day exceed that estimated at US1$

a day. At US$1 a day, the average change in poverty deficit in the 20 most severely affected countries amounts to 0.5 percent against 2.2 percent at US$2 a day. In all countries included in the study the change in the poverty deficit is mostly induced by the negative real income effect of those households who were poor before the price shock, while the change in poverty deficit attributable to new households falling in poverty is negligible. Thus, in countries already equipped with effective targeting mechanisms, such as conditional cash transfers, the strategy that would produce faster results at lower costs would be to scale up such programs rather than designing tools to identify new poor. The challenge in this case lies in the ability to adjust responses to the permanent vs. transitory nature of the shock, yet to a large extent unknown.11 In other countries resources should be devoted to rapidly implement effective targeting mechanisms in cities. Workfare programs or direct hand-outs could constitute short-term responses to the crisis in this context (World Bank 2008b). While it is unrealistic to envisage perfect targeting, the rough estimates provided in this paper nevertheless provide an order of magnitude of the cost (excluding operational and implementation costs) of an efficient transfer program from coverage and targeting perspectives. These estimates can also be used to benchmark the cost of alternative policy options.
References Atkinson, A.B. (1987) “On the measurement of poverty”, Econometrica, Vol. 55, No. 4, pp. 749-764. Ackah, C. and S. Appleton (2007) “Food price changes and consumer welfare in Ghana in the 1990’s”. Centre for research in Economic Development and International Trade. University of Nottingham. CREDIT Research Paper 07/03. Baffes, J. and Gardner, B. (2003) “The transmission of world commodity prices to domestic markets under policy reforms in developing countries”, Journal of Economic Policy Reform, Volume 6, Issue 3 September 2003 , pages 159 - 180
11 Current outlooks from most international institutions (OECD-FAO, 2008) now foresee a slow decline in food prices in 2008/9, stabilizing thereafter to a higher plateau than in 2005/6, yet remaining volatile. But such outlook still remains quite uncertain. Indeed, the transitory vs. permanent component of food inflation is yet to be quantified with more certainty. This is not an easy task as many important factors exerting influence on agricultural supply and demand can move in the near future in different directions, implying the existence of multiple equilibriums in the medium term. The policy response to the current crisis is itself one of these factors, as well as its interpretation by markets. Others comprise global macro-economic imbalances, the impact of climate change on agricultural yields and volatility, potential technological gains, energy prices, and possible remaining bubbles on financial and assets markets.

Bhalla, S. (2003) “Crying Wolf on Poverty: Or How the Millennium Development Goal for Poverty Has Already Been Reached”, Oxus Research and Investments, New Delhi, India Bussolo, M., R. De Hoyos, D. Medvedev, D. van der Mensbrugghe (2007) “Global growth and distribution: are China and India reshaping the world?” World Bank Policy Research Working Papers No. 4392, Washington D.C. Deaton, A. (1997) “The Analysis of Household Surveys: A Microeconomic Approach to Development Policy”, World Bank: The John Hopkins University Press. Deaton, A. and Muellbauer, J. (1980a) “Economics and Consumer Behaviour”, Cambridge University Press, New York. Dessus, S. (2008), “Harnessing global commodity inflation for poverty alleviation in Tanzania”, mimeo, June, the World Bank, Washington. Food and Agriculture Organization (2008), “Soaring food prices: facts, perspectives, impacts and actions required”, April, Rome. Friedman,J. and J. Levinsohn (2002) “The distributional impacts of Indonesia’s financial crisis on household welfare: a “rapid response” methodology” The World Bank Economic Review, vol. 16 No. 3 Ivanic, M. and W. Martin (2008) “Implications of higher global food prices for poverty in low income countries”, World Bank Policy Research Working Papers No. 4594, Washington D.C. Niimi, Y. (2005), “An Analysis of Household Reponses to Price Shocks in Vietnam: Can Unit Values Substitute for Market Prices?”, Poverty Research Unit Working Paper no. 30, University of Sussex. Organization for Economic Cooperation and Development - Food and Agriculture Organization (2008), “Agricultural Outlook 2008-2017”, May, Paris and Rome. Passa Orio, J.C. and Q. Wodon (2008), “Impact of higher food prices on cost of living: assessing multiplier effects using social accounting matrices”, mimeo, May, World Bank, Washington D.C. Ravaillon, M. (1990), “Rural welfare changes of food prices under induced wage responses: theory and evidence from Bangladesh”, Oxford Economic Papers, 42, 574-85. Ravallion, M. (2003) “Have We Already Met the Millennium Development Goal for Poverty?”, mimeo, The World Bank, Washington D.C.

Seale, J., A. Regimi and J. Bernstein (2003) “International Evidence on Food Consumption Patterns“, Technical Bulletin 1904. USDA. October. Wodon, Q., C. Tsimpo, P. Backiny-Yetna, G. Joseph, F. Adoho and H. Coulombe (2008), “Measuring the potential impact of higher food prices on poverty: summary evidence from West and Central Africa”, mimeo, May, World Bank, Washington D.C. World Bank (2008a), “Rising food prices: policy options and World Bank response”, background note for the development committee, April, Washington D.C. World Bank (2008b), “Guidance for responses from the human development sectors to soaring food price”, mimeo, May, Washington D.C.

Annex I. Standardizing Household Surveys to 2005 The periodicity at which developing countries undertake nationally representative household surveys is very irregular, with some countries having one every 2, 5 or even 10 years and others not having any at all. This irregularity of survey years results in a very low number of countries for which a survey is available for a particular year. To be able to work with the income/expenditure distributions of a relatively large sample of countries (73) and anchor them to a given year (2005) we had to use some assumptions. We collected surveys for years circa (usually before) 2005 and assume that the distribution between the survey year and 2005 remained constant; additionally --and perhaps more importantly-- we assumed income/expenditures for all households grew at a rate equal to the growth in private consumption reported in national accounts (NA). Numerous studies discuss the appropriateness of NA information as an indicator of changes in household incomes (see the debalte between Bhalla, 2003 and Ravallion, 2003). Although we acknowledge the limited relationship between consumption from NA (basically a residual) and the disposable incomes/expenditures of households, we believe that in the absence of household survey information it is better to “gross-up” the survey’s income using NA information rather that assuming that zero growth occurred between the survey year and 2005. This “grossing-up” process often overestimates actual growth in household incomes (Ravallion, 2003). This bias in household incomes (keeping distribution constant) will result in an underestimation of the changes in the poverty deficit reported in this paper. Finally, we believe that the magnitude of this bias is small since the discrepancies between growth in survey mean and private consumption from NA will have an effect over a limited number of year, i.e. the difference between survey year and 2005 (usually 2 or 3 years).

Annex II. Detailed country results
A1: Urban Poverty at US$1 a Day: Estimated Poverty Headcounts and Deficits
Final Situation (After Price Shock)
Initial Situation
(2005) Central Scenario Upper Scenario Lower Scenario Poverty
Rate Poverty Deficit
Poverty Rate
Poverty Deficit
Old poor
New poor
Poverty Rate
Poverty Deficit
Poverty Rate
Poverty Deficit
Albania 0.0 0.0 0.0 0.0 0.0 0.0 0.5 0.0 0.0 0.0 Argentina 3.3 0.1 3.7 0.1 0.1 0.0 4.6 0.2 3.6 0.1
Armenia 0.0 0.0 0.4 0.0 0.0 0.0 0.8 0.0 0.1 0.0 Azerbaijan 0.2 0.0 0.4 0.0 0.0 0.0 0.7 0.0 0.3 0.0
Burundi 12.5 0.2 14.6 0.3 0.3 0.0 16.4 0.3 13.4 0.2 Benin 17.1 0.8 22.9 1.2 1.2 0.1 26.6 1.7 19.4 1.0
Burkina Faso 8.6 0.2 12.9 0.3 0.3 0.0 15.2 0.4 11.0 0.2 Bangladesh 8.7 0.2 13.7 0.3 0.3 0.0 17.1 0.5 10.5 0.2
Bulgaria 0.0 0.0 0.2 0.0 0.0 0.0 0.3 0.0 0.0 0.0 Belarus 0.1 0.0 0.1 0.0 0.0 0.0 0.1 0.0 0.1 0.0 Bolivia 4.8 0.2 6.0 0.3 0.3 0.0 7.2 0.4 5.6 0.3
Brazil 3.9 0.1 4.5 0.1 0.1 0.0 5.5 0.2 4.0 0.1 Chile 1.0 0.0 1.2 0.0 0.0 0.0 1.3 0.0 1.1 0.0 China 0.2 0.0 0.3 0.0 0.0 0.0 0.3 0.0 0.2 0.0
Cote d'Ivoire 8.6 0.3 11.0 0.5 0.4 0.0 13.4 0.6 9.8 0.4 Cameroon 3.5 0.1 5.2 0.1 0.1 0.0 6.8 0.2 4.3 0.1 Colombia 2.8 0.1 3.2 0.1 0.1 0.0 3.7 0.1 2.8 0.1
Costa Rica 1.3 0.0 1.5 0.0 0.0 0.0 1.7 0.0 1.3 0.0 Dominican Rep. 0.5 0.0 0.6 0.0 0.0 0.0 0.7 0.0 0.6 0.0
Ecuador 4.6 0.2 6.0 0.3 0.3 0.0 6.3 0.4 4.7 0.3 Estonia 0.0 0.0 0.0 0.0 0.0 0.0 0.0 0.0 0.0 0.0
Ethiopia 15.2 0.2 20.6 0.3 0.3 0.0 25.5 0.5 17.5 0.3 Georgia 1.1 0.0 1.3 0.0 0.0 0.0 1.7 0.0 1.1 0.0
Ghana 10.0 0.4 13.1 0.6 0.5 0.0 15.3 0.8 11.0 0.4 Guinea 2.9 0.1 4.2 0.1 0.1 0.0 5.5 0.2 3.4 0.1
Gambia, The 2.2 0.1 3.3 0.2 0.2 0.0 4.1 0.2 2.4 0.1 Guatemala 4.2 0.1 5.0 0.2 0.2 0.0 5.2 0.2 4.8 0.1
Guyana 0.2 0.0 0.2 0.0 0.0 0.0 0.2 0.0 0.2 0.0 Honduras 3.5 0.1 4.1 0.1 0.1 0.0 4.6 0.1 3.7 0.1
Haiti 43.5 6.4 47.0 7.5 7.5 0.0 48.9 8.6 44.9 6.8 Hungary 0.0 0.0 0.0 0.0 0.0 0.0 0.0 0.0 0.0 0.0
Indonesia 1.3 0.0 2.4 0.1 0.0 0.0 3.5 0.1 1.7 0.0 India 5.7 0.1 9.0 0.2 0.2 0.0 12.3 0.3 6.8 0.2
Jamaica 0.1 0.0 0.1 0.0 0.0 0.0 0.1 0.0 0.1 0.0 Jordan 0.1 0.0 0.3 0.0 0.0 0.0 0.3 0.0 0.2 0.0
Kazakhstan 0.0 0.0 0.0 0.0 0.0 0.0 0.0 0.0 0.0 0.0 Kenya 0.7 0.0 1.4 0.0 0.0 0.0 1.5 0.0 0.7 0.0
Kyrgyz Rep. 0.5 0.0 0.9 0.0 0.0 0.0 1.7 0.0 0.5 0.0 Cambodia 25.1 1.1 30.9 1.6 1.5 0.1 34.6 2.1 28.0 1.3 Lao PDR 2.7 0.0 3.7 0.0 0.0 0.0 4.7 0.1 3.1 0.0 Sri Lanka 0.6 0.0 1.8 0.0 0.0 0.0 2.9 0.0 1.1 0.0 Lithuania 0.0 0.0 0.0 0.0 0.0 0.0 0.0 0.0 0.0 0.0 Morocco 0.0 0.0 0.0 0.0 0.0 0.0 0.0 0.0 0.0 0.0 Moldova 1.0 0.0 1.5 0.0 0.0 0.0 1.9 0.0 1.2 0.0
Madagascar 35.8 2.6 39.8 3.4 3.4 0.0 43.2 4.2 37.3 2.9 Mexico 0.6 0.0 0.7 0.0 0.0 0.0 1.0 0.0 0.6 0.0
Macedonia, FYR 0.0 0.0 0.0 0.0 0.0 0.0 0.0 0.0 0.0 0.0 Mali 3.4 0.1 5.7 0.2 0.2 0.0 7.8 0.3 4.6 0.2
Mauritania 7.0 0.2 8.8 0.4 0.4 0.0 11.6 0.6 7.8 0.3 Nigeria 54.6 10.0 60.7 12.7 12.6 0.2 64.8 15.3 57.4 11.1
Nicaragua 36.5 5.1 40.2 6.6 6.5 0.1 43.9 8.0 38.1 5.7 Nepal 8.9 0.1 14.8 0.1 0.1 0.0 17.1 0.2 11.4 0.1
Pakistan 3.0 0.0 6.2 0.1 0.1 0.0 9.2 0.2 4.5 0.1 Panama 1.6 0.0 1.9 0.0 0.0 0.0 2.2 0.0 1.7 0.0
Philippines 2.2 0.0 3.3 0.1 0.1 0.0 4.5 0.1 2.5 0.1 Poland 0.0 0.0 0.0 0.0 0.0 0.0 0.0 0.0 0.0 0.0
Paraguay 3.2 0.1 3.8 0.1 0.1 0.0 4.2 0.2 3.3 0.1 Romania 0.0 0.0 0.0 0.0 0.0 0.0 0.1 0.0 0.0 0.0
Russian Fed. 0.0 0.0 0.0 0.0 0.0 0.0 0.0 0.0 0.0 0.0 Senegal 0.8 0.0 1.2 0.0 0.0 0.0 1.7 0.1 0.9 0.0
El Salvador 9.6 0.6 11.0 0.8 0.8 0.0 12.3 1.0 10.1 0.7 Thailand 0.0 0.0 0.1 0.0 0.0 0.0 0.1 0.0 0.0 0.0
Tajikistan 3.9 0.1 5.9 0.1 0.1 0.0 7.7 0.2 5.1 0.1 Turkey 0.3 0.0 0.6 0.0 0.0 0.0 1.3 0.0 0.5 0.0
Tanzania 21.9 0.9 26.1 1.2 1.2 0.0 30.2 1.6 23.6 1.0 Uganda 42.0 2.6 47.4 3.4 3.4 0.0 52.0 4.2 43.5 2.9 Ukraine 0.0 0.0 0.0 0.0 0.0 0.0 0.0 0.0 0.0 0.0
Uruguay 0.0 0.0 0.0 0.0 0.0 0.0 0.0 0.0 0.0 0.0 Uzbekistan 0.0 0.0 0.0 0.0 0.0 0.0 0.0 0.0 0.0 0.0
Venezuela, RB 2.6 0.0 3.0 0.0 0.0 0.0 3.6 0.1 2.8 0.0 Vietnam 0.0 0.0 0.1 0.0 0.0 0.0 0.4 0.0 0.1 0.0
Yemen, Rep. 2.8 0.0 4.3 0.1 0.1 0.0 6.0 0.1 3.3 0.0 South Africa 3.1 0.1 3.9 0.1 0.1 0.0 4.7 0.1 3.4 0.1
A2: Urban Poverty at US$2 a Day: Estimated Poverty Headcounts and Deficits
Final Situation (After Price Shock)
Initial Situation
(2005) Central Scenario Upper Scenario Lower Scenario Poverty
Rate Poverty Deficit
Poverty Rate
Poverty Deficit
Old poor
New poor
Poverty Rate
Poverty Deficit
Poverty Rate
Poverty Deficit
Albania 5.7 0.2 8.5 0.3 0.3 0.0 11.2 0.5 7.0 0.2 Argentina 10.4 0.7 11.3 0.9 0.9 0.0 13.9 1.1 11.0 0.8
Armenia 8.7 0.4 13.3 0.7 0.7 0.1 16.9 1.1 10.2 0.5 Azerbaijan 9.0 0.3 13.2 0.5 0.5 0.0 17.0 0.8 10.8 0.4
Burundi 35.9 1.3 39.4 1.7 1.7 0.0 42.1 2.0 37.5 1.4 Benin 56.1 8.3 61.6 10.8 10.7 0.1 65.2 13.2 58.6 9.3
Burkina Faso 37.4 2.2 41.8 2.9 2.8 0.0 46.2 3.5 38.9 2.4 Bangladesh 47.4 3.5 53.2 4.8 4.7 0.1 57.4 6.0 49.9 4.0
Bulgaria 3.4 0.1 4.0 0.2 0.2 0.0 4.8 0.3 3.5 0.2 Belarus 0.2 0.0 0.3 0.0 0.0 0.0 0.5 0.0 0.3 0.0 Bolivia 17.6 1.7 21.6 2.2 2.2 0.0 24.8 2.8 19.3 1.9
Brazil 14.2 0.8 16.4 1.1 1.1 0.0 18.1 1.4 15.0 0.9 Chile 3.0 0.1 3.6 0.2 0.2 0.0 4.0 0.2 3.2 0.1 China 1.8 0.1 2.7 0.3 0.3 0.0 3.6 0.6 2.1 0.2
Cote d'Ivoire 35.1 3.4 40.5 4.6 4.5 0.1 45.0 5.7 37.3 3.9 Cameroon 25.5 1.7 30.8 2.5 2.4 0.1 36.0 3.2 27.7 2.0 Colombia 7.9 0.4 9.4 0.5 0.5 0.0 10.6 0.7 8.2 0.5
Costa Rica 4.1 0.1 4.5 0.2 0.2 0.0 5.5 0.2 4.4 0.1 Dominican Rep. 2.7 0.1 3.1 0.1 0.1 0.0 3.3 0.1 2.9 0.1
Ecuador 16.7 1.3 18.7 1.7 1.7 0.0 22.4 2.2 17.4 1.5 Estonia 0.3 0.0 0.6 0.0 0.0 0.0 1.1 0.0 0.3 0.0
Ethiopia 61.0 2.8 65.9 3.8 3.7 0.0 69.9 4.6 63.1 3.2 Georgia 6.9 0.3 8.9 0.4 0.4 0.0 10.8 0.6 7.7 0.4
Ghana 37.7 4.3 42.8 5.6 5.6 0.1 47.5 7.0 39.9 4.8 Guinea 26.2 1.8 33.9 2.7 2.6 0.1 39.9 3.6 29.1 2.2
Gambia, The 19.5 1.5 25.1 2.1 2.0 0.1 29.0 2.8 22.0 1.7 Guatemala 11.6 0.6 14.5 0.8 0.8 0.0 16.7 1.0 12.8 0.7
Guyana 2.1 0.0 2.4 0.0 0.0 0.0 3.4 0.1 2.1 0.0 Honduras 12.7 0.7 15.2 0.9 0.9 0.0 17.7 1.1 13.4 0.7
Haiti 61.6 19.7 64.5 23.0 23.0 0.1 66.0 26.0 63.1 21.0 Hungary 0.0 0.0 0.0 0.0 0.0 0.0 0.0 0.0 0.0 0.0
Indonesia 25.8 1.8 33.3 2.9 2.8 0.1 39.5 4.0 29.0 2.2 India 44.2 3.4 51.0 4.7 4.6 0.1 56.5 6.1 47.1 3.9
Jamaica 3.3 0.1 4.3 0.2 0.1 0.0 6.4 0.2 3.9 0.1 Jordan 3.8 0.1 5.6 0.3 0.2 0.0 7.3 0.4 4.5 0.2
Kazakhstan 3.0 0.1 4.8 0.2 0.2 0.0 6.6 0.3 3.6 0.1 Kenya 8.6 0.2 11.5 0.3 0.3 0.0 15.6 0.4 9.3 0.2
Kyrgyz Rep. 13.8 0.6 17.7 0.9 0.9 0.1 22.1 1.3 16.0 0.7 Cambodia 62.5 8.6 67.3 10.8 10.8 0.1 71.0 12.9 64.6 9.5 Lao PDR 23.2 0.7 30.0 1.1 1.1 0.0 35.6 1.5 26.0 0.9 Sri Lanka 20.1 0.4 26.8 0.7 0.7 0.0 32.1 1.0 22.7 0.5 Lithuania 0.9 0.0 1.5 0.0 0.0 0.0 2.4 0.1 1.2 0.0 Morocco 1.4 0.0 2.5 0.1 0.1 0.0 4.0 0.1 1.8 0.0 Moldova 10.5 0.5 14.2 0.7 0.7 0.0 17.9 1.0 11.9 0.6
Madagascar 68.2 13.0 73.2 16.0 15.9 0.1 75.7 18.6 70.2 14.2 Mexico 8.8 0.5 11.5 0.8 0.8 0.0 14.0 1.0 9.9 0.6
Macedonia, FYR 1.3 0.0 2.3 0.0 0.0 0.0 3.1 0.1 1.7 0.0
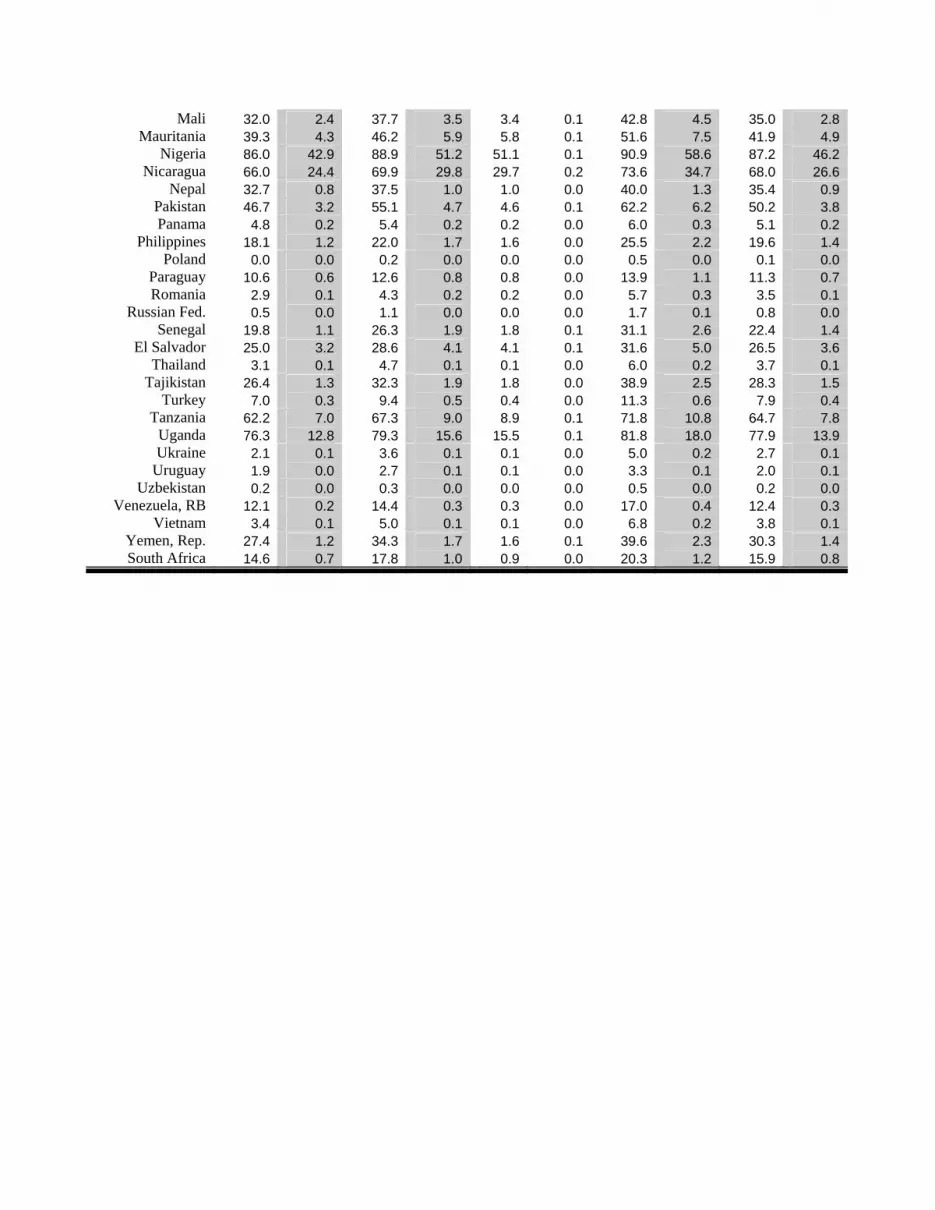
Mali 32.0 2.4 37.7 3.5 3.4 0.1 42.8 4.5 35.0 2.8 Mauritania 39.3 4.3 46.2 5.9 5.8 0.1 51.6 7.5 41.9 4.9
Nigeria 86.0 42.9 88.9 51.2 51.1 0.1 90.9 58.6 87.2 46.2 Nicaragua 66.0 24.4 69.9 29.8 29.7 0.2 73.6 34.7 68.0 26.6
Nepal 32.7 0.8 37.5 1.0 1.0 0.0 40.0 1.3 35.4 0.9 Pakistan 46.7 3.2 55.1 4.7 4.6 0.1 62.2 6.2 50.2 3.8 Panama 4.8 0.2 5.4 0.2 0.2 0.0 6.0 0.3 5.1 0.2
Philippines 18.1 1.2 22.0 1.7 1.6 0.0 25.5 2.2 19.6 1.4 Poland 0.0 0.0 0.2 0.0 0.0 0.0 0.5 0.0 0.1 0.0
Paraguay 10.6 0.6 12.6 0.8 0.8 0.0 13.9 1.1 11.3 0.7 Romania 2.9 0.1 4.3 0.2 0.2 0.0 5.7 0.3 3.5 0.1
Russian Fed. 0.5 0.0 1.1 0.0 0.0 0.0 1.7 0.1 0.8 0.0 Senegal 19.8 1.1 26.3 1.9 1.8 0.1 31.1 2.6 22.4 1.4
El Salvador 25.0 3.2 28.6 4.1 4.1 0.1 31.6 5.0 26.5 3.6 Thailand 3.1 0.1 4.7 0.1 0.1 0.0 6.0 0.2 3.7 0.1
Tajikistan 26.4 1.3 32.3 1.9 1.8 0.0 38.9 2.5 28.3 1.5 Turkey 7.0 0.3 9.4 0.5 0.4 0.0 11.3 0.6 7.9 0.4
Tanzania 62.2 7.0 67.3 9.0 8.9 0.1 71.8 10.8 64.7 7.8 Uganda 76.3 12.8 79.3 15.6 15.5 0.1 81.8 18.0 77.9 13.9 Ukraine 2.1 0.1 3.6 0.1 0.1 0.0 5.0 0.2 2.7 0.1
Uruguay 1.9 0.0 2.7 0.1 0.1 0.0 3.3 0.1 2.0 0.1 Uzbekistan 0.2 0.0 0.3 0.0 0.0 0.0 0.5 0.0 0.2 0.0
Venezuela, RB 12.1 0.2 14.4 0.3 0.3 0.0 17.0 0.4 12.4 0.3 Vietnam 3.4 0.1 5.0 0.1 0.1 0.0 6.8 0.2 3.8 0.1
Yemen, Rep. 27.4 1.2 34.3 1.7 1.6 0.1 39.6 2.3 30.3 1.4 South Africa 14.6 0.7 17.8 1.0 0.9 0.0 20.3 1.2 15.9 0.8
Related Documents