Eastern Illinois University e Keep Masters eses Student eses & Publications 1999 e Impact of Fast ForWord on Phonological Awareness and Literacy Skills Melissa Nulty Eastern Illinois University is research is a product of the graduate program in Communication Disorders and Sciences at Eastern Illinois University. Find out more about the program. is is brought to you for free and open access by the Student eses & Publications at e Keep. It has been accepted for inclusion in Masters eses by an authorized administrator of e Keep. For more information, please contact [email protected]. Recommended Citation Nulty, Melissa, "e Impact of Fast ForWord on Phonological Awareness and Literacy Skills" (1999). Masters eses. 1635. hps://thekeep.eiu.edu/theses/1635

Welcome message from author
This document is posted to help you gain knowledge. Please leave a comment to let me know what you think about it! Share it to your friends and learn new things together.
Transcript

Eastern Illinois UniversityThe Keep
Masters Theses Student Theses & Publications
1999
The Impact of Fast ForWord on PhonologicalAwareness and Literacy SkillsMelissa NultyEastern Illinois UniversityThis research is a product of the graduate program in Communication Disorders and Sciences at EasternIllinois University. Find out more about the program.
This is brought to you for free and open access by the Student Theses & Publications at The Keep. It has been accepted for inclusion in Masters Thesesby an authorized administrator of The Keep. For more information, please contact [email protected].
Recommended CitationNulty, Melissa, "The Impact of Fast ForWord on Phonological Awareness and Literacy Skills" (1999). Masters Theses. 1635.https://thekeep.eiu.edu/theses/1635

THESIS REPRODUCTION CERTIFICATE
TO: Graduate Degree Candidates (who have written formal theses)
SUBJECT: Permission to Reproduce Theses
The University Library is receiving a number of request from other institutions asking permission to reproduce dissertations for inclusion in their library holdings. Although no copyright laws are involved, we feel that professional courtesy demands that permission be obtained from the author before we allow these to be copied.
PLEASE SIGN ONE OF THE FOLLOWING STATEMENTS:
Booth Library of Eastern Illinois Univ,ersity has my permission to lend my thesis to a reputable college or university or the purpose of copying it for inclusion in that institution's library or research holdings.
5-s-99 • • . I - I Date
I respectfully request Booth Library of Eastern Illinois University NOT allow my thesis to be reproduced because:
Author's Signature Date
thesis4.fonn

THE IMPACT OF FAST FORWORD ON PHONOLOGICAL
AWARENESS AND LITERACY SKILLS (TITLE)
BY
MELISSA NULTY
THESIS
SUBMITTED IN PARTIAL FULFILLMENT OF THE REQUIREMENTS FOR THE DEGREE OF
MASTER OF SCIENCE
IN THE DEPARTMENT OF COMMUNICATION DISORDERS AND SCIENCES, EASTERN ILLINOIS UNIVERSITY
CHARLESTON, ILLINOIS
1998-1999 YEAR
I HEREBY RECOMMEND THAT THIS THESIS BE ACCEPTED AS FULFILLING THIS PART OF THE GRADUATE DEGREE CITED ABOVE
DATE
DATE
i-?.3 - ~9' DATE
DATE

ACKNOWLEDGMENTS
Without the assistance of several professionals, this project would not have
concurred. First, I would like to thank Tammy Corzine Johnson who assisted with the
identification of subjects and served as the Fast For Word professional at the Shiloh
School District site. I also extend my thanks to the Shiloh school administration for
allowing this research to be conducted in cooperation with the summer school program.
I extend heartfelt thanks to my committee members, Dr. Mary Anne Hanner and
Dr. Gail Richard. I appreciate Dr. Mary Anne Hanner for donating her time and expertise
to the organization and writing of this thesis. I would also like to express my deepest
gratitude to Dr. Gail Richard, who without her insight and vast knowledge of Fast
ForWord, this project would not have commenced. I owe more than a thank you to Dr.
Rebecca Throneburg and Mrs. Jean Smitley for serving as co-chairs of this project. Both
individuals were extremely supportive and instrumental in the development and writing
of this thesis. Not only did these professionals teach me valuable lessons about the
writing process but also about the meaning of collaboration. I also extend my thanks to
Lisa Odorizzi for her assistance in determining reliability.
I would like to my family for their constant support in all my life's endeavors.
Without their encouragement, I would not have accomplished this goal. Finally, to my
fiance Chris whose patience, understanding, and continual support during this project
only strengthened my love for him. Thank you again to everyone.

TABLE OF CONTENTS CHAPTER PAGE
I Introduction . . . . . . . . . . . . . . . . . . . . . . . . . . . . . . . . . . . . . . . . . . . 3
II Review of the Literature . . . . . . . . . . . . . . . . . . . . . . . . . . . . . . . . . 7
Speech Language Deficits and Academic Difficubes. . . . . . . . . . 7
Reading .............................................. 11
Phonological Awareness and Literacy Skills . . . . . . . . . . . . . . . . . . 11
Auditory and Speech Perception Difficulties . . . . . . . . . . . . . . . . . 14
Reading Difficulties . . . . . . . . . . . . . . . . . . . . . . . . . . . . . . . 15
Language Impairment . . . . . . . . . . . . . . . . . . . . . . . . . . . . . 16
Computerized Training Utilizing Altered Speech . . . . . . . . . . . . . . 1 7
Summary and Statement of Objectives . . . . . . . . . . . . . . . . . . . . . . 28
III Methods . . . . . . . . . . . . . . . . . . . . . . . . . . . . . . . . . . . . . . . . . . . . . . 3 2
Overview . . . . . . . . . . . . . . . . . . . . . . . . . . . . . . . . . . . . . . . . . . . . . 3 2
Subject Selection ....................................... 32
Assessment ............................................ 3 5
Reliability ............................................. 39
Training Procedures ..................................... 40
IV Results . . . . . . . . . . . . . . . . . . . . . . . . . . . . . . . . . . . . . . . . . . . . . . . 46
Subject 1 . . . . . . . . . . . . . . . . . . . . . . . . . . . . . . . . . . . . . . . . . . . . . 4 7
Subject 2 . . . . . . . . . . . . . . . . . . . . . . . . . . . . . . . . . . . . . . . . . . . . . 49
Subject 3 . . . . . . . . . . . . . . . . . . . . . . . . . . . . . . . . . . . . . . . . . . . . . 51
11

Subject 4 . . . . . . . . . . . . . . . . . . . . . . . . . . . . . . . . . . . . . . . . . . . . . 53
Subject 5 . . . . . . . . . . . . . . . . . . . . . . . . . . . . . . . . . . . . . . . . . . . . . 54
Summaries . . . . . . . . . . . . . . . . . . . . . . . . . . . . . . . . . . . . . . . . . . . . 56
V Discussion . . . . . . . . . . . . . . . . . . . . . . . . . . . . . . . . . . . . . . . . . . . . 62
REFERENCES ......................................... 74
APPENDICES
A Research Participation Authorization . . . . . . . . . . . . . . . . . 83
Ill

lV
LIST OF TABLES TABLE PAGE
1 Skills Required to Decode Unknown Printed Words 12
2 Experimental Subjects' Pre-Test Standard Scores for Five Assessment Measures 34
3 Control Subjects' Pre-Test Standard Scores for Five Assessment Measure 35
4 Fast ForWord Training Progression 45
5 Game Completion Data for Fast ForWord Games for Subject 1 47
6 Raw Scores, Standard Scores, and Test Gains for Five Standardized Measures for Subject 1 48
7 Game Completion Data for Fast ForWord Games for Subject 2 50
8 Raw Scores, Standard Scores, and Test Gains for Five Standardized Measures for Subject 2 50
9 Game Completion Data for Fast ForWord Games for Subject 3 52
10 Raw Scores, Standard Scores, and Test Gains for Five Standardized Measures for Subject 3 52
11 Game Completion Data for Fast ForWord Games for Subject 4 53
12 Raw Scores, Standard Scores, and Test Gains for Five Standardized Measures for Subject 4 54
13 Game Completion Data for Fast ForWord Games for Subject 5 55
14 Raw Scores, Standard Scores, and Test Gains for Five Standardized Measures for Subject 5 56
15 Five Subjects' Fast ForWord Percentage Gains for Each Game 58
16 Summary of Five Subjects' Test Gain Performance and Average Gain on Five Assessment Measures 58

17 Summary of Three Control Subjects' Pre and Post Test Standard Scores, 60 Test Gain, and Average Gain on Five Assessment Measures.
18 Group Means and Standard Deviations for Testing Gains of Five Subjects 61
v

Impact of Fast For Word 1
Running Head: IMPACT OF FAST FORWORD
THE IMPACT OFF AST FOR WORD ON
PHONOLOGICAL AWARENESS AND READING SKILLS
Melissa C. Nulty
Eastern Illinois University

Impact of Fast For Word 2
Abstract
This study investigated the impact of Fast For Word on individual children's
phonological awareness and reading skills as well as general language and auditory
processing skills. Five children, ages six through eight years, served as experimental
subjects. The duration of participation in the Fast For Word (FFW) training program was
approximately 2 hours per day, 5 days a week, for 6 to 8 weeks. Fast ForWord training
was completed when the subject reached at least 90 percent completion on five of the
seven training exercises or when it was determined by the Fast ForWord professional that
the child had received maximum benefit from the program. Thrte children, within the
same age range, served as control subjects and did not receive any type of speech or
language training. Results indicated that significant group mean gains (a minimal
increase of one standard deviation) were not evidenced by the experimental subjects on
any of the five assessment measures. The largest mean standard score increases were
noted on the Language Processing Test-Revised (8 points) and the Test of Language
Development-Primary:2 (4 points). Individually, two subjects increased standard scores
by a minimum of one standard deviation. None of the five children reached the FFW
completion rate of 90% completion on five of the seven games. Post test data for the
control subjects revealed a similar, slightly larger increase in standard scores as for the
experimental subjects.

Chapter I
Introduction
Impact of Fast ForWord 3
In the course of development, most children acquire a spoken language. This
achievement normally occurs without explicit instruction by parents or other adults.
During the preschool period, most children pass easily and uneventfully through the
stages of uttering and understanding sounds, single words, simple two- or three- word
phrases and complex sentences. A small minority (approximately 8%) of children with
normal hearing, motor abilities, and nonverbal intelligence fail to develop speech and
language at or near the expected age (Tomblin, 1996).
Most cultures have a fully developed spoken language, but only a minority of
these languages exist in written form. When a written form does exist, many speakers do
not and cannot use it effectively (Blachman, 1991). An estimated 40-75% or more of
children who evidence speech and language disorders during the preschool years,
continue to demonstrate language and/or learning limitations in later academic settings
(Aram & Hall, 1989). Strikingly, an estimated 35 million American adults (20% of the
adult population) have difficulty reading (Stedman & Kaestle, 1987).
Reading shares many of the same processes and sources of knowledge as talking
and understanding. Although spoken language and reading have much in common in
terms of the knowledge and processes tapped, fundamental, nontrivial differences exist
between the two. Knowledge of the similarities and differences between spoken language
and reading is critical for understanding how children learn to read and why some
children have difficulty learning to read (Kamhi & Catts, 1991 ). Perhaps the most basic
Impact of Fast ForWord 4
difference between reading and spoken language processing lies in the input. For spoken
language, the input is an auditory signal, whereas for reading, the input is a visual stimuli.
Reading and oral language begin to share similar knowledge domains and processes at the
word recognition stage. One similarity between reading a!ld oral language is that the
reader and listener use the same storage of word knowledge. The strategies used to
access the lexicon in reading depends to a large extent on the sophistication of the reader
(Barron, 1981; Frith, 1985). Reading by the early phonetic strategy encourages children
to attend to the position and sequence of sounds/letters in words (Barron, 1981 ). In a
later direct access strategy, the child predominantly uses segmental composition and order
as cues for word recognition. Higher order processing is necessary for the child to
comprehend more fully what is written or said. Reading and oral language share
linguistic and conceptual knowledge (Kintsch & Kozminsky, 1977). For example, at the
sentence processing level, both rely on the same syntactic and semantic rules, as well as
similar memory codes. In oral language processing, information is generally stored in a
phonetic code. Although written words begin as visual stimuli, once recognized they are
held in a phonetic form for further processing (Banks, Oka, & Shugarman, 1981; Conrad,
1964; Perfetti & McCutchen, 1982). Therefore, regardless of whether one is reading or
listening, verbal information may be stored temporarily in a phonetic code.
Perception of phonological sequences is one aspect of phonological awareness.
Phonological awareness has been defined as the explicit awareness of the sound structure
of language which includes the knowledge that words are composed of syllables and
phonemes and that words can rhyme or begin/end with the same sound segment (Catts,
I_ - - - - - - - - - - - - - - - - - - -

Impact of Past ForWord 5
1993). Phonological awareness has been found by numerous authors to be an important
precursor to reading ability (Kamhi, Lee, & Nelson, 1985; Magnusson & Naucler, 1990;
Bird, Bishop, & Freeman, 1995). Catts & Kamhi (1986) have suggested that
phonological processing deficits may underlie many reading disabilities as well as
language disorders. These researchers proposed that some "low-level perceptual deficits
identifying and discriminating phonemes and difficulty forming accurate representations
oflinguistic (or linguistic-like) information" (p. 344) may be a causal factor for both
language and reading difficulties.
Researchers have attempted to develop perceptual training techniques to
ameliorate these basic processing problems (Merzenich, et al., 1996; Tallal, Miller, et al.,
1996). Recently, several investigators have developed a computer-assisted training
program, Fast ForWord, acclaimed to correct auditory perception difficulties with
exceptional results in approximately 6 to 8 weeks. Previous research of Fast ForWord
indicated children participating in this training program demonstrated significant gains in
their receptive and expressive language abilities and discrimination abilities (Tallal &
Merzenich, 1997; Miller, Merzenich, Saunders, Jenkins, & Tallal, 1996; Tallal, Saunders,
et al., 1996). Children's test scores on a variety of assessment procedures revealed
significant gains when comparing pre- and posttest scores following Fast ForWord
training.
Despite these positive findings, a number of concerns have been cited regarding
the reports of phenomenal success by the authors of the Fast For Word program. As
reported by Brady, Scarborough, and Shankweiler (1996), one concern is that not enough

Impact of Fast For Word 6
information was provided about the exact nature of the linguistic strengths and
weaknesses of the language-impaired children that served as subjects. Additionally,
recent accounts of the research in the popular press have made unsubstantiated statements
that such training may aid individuals with reading impairments. The authors of Fast
ForWord have not documented its effect on phonological awareness skills or reading
ability. Therefore, the purpose of the present study is to determine the effectiveness of
Fast ForWord on 5 children's phonological awareness and literacy skills as well as other
language and auditory processing skills.

Chapter II
Review of Literature
Impact of Fast For Word 7
In reviewing the literature for the present study, several areas of related research
were considered. The chapter begins with a review of the relationship between children's
speech-language deficits and academic difficulties. A summary of tasks involved in
reading is then presented. The review also focuses upon the relationship between
phonological awareness and literacy skills. Recent studies have demonstrated that
auditory and speech perception difficulties may be a common underlying factor in both
language and reading impairments (Bird, Bishop & Freeman, 1995; Catts & Kamhi,
1986). Researchers have attempted to develop perceptual training techniques to
ameliorate these basic processing problems (Merzenich, et al., 1996; Tallal, Miller, et al.,
1996). Because a specific goal of this study was to evaluate the Fast ForWord program,
the remainder of the chapter reviews studies that report the effects of training with this
program (Tallal, Saunders, et al., 1996; Miller, et al., 1996; Tallal & Merzenich, 1997).
Speech Language Deficits and Academic Difficulties
Approximately 8% of children with normal development in hearing, motor
abilities, and nonverbal intelligence fail to develop speech and language at or near the
expected age (Tomblin, 1996). Numerous researchers have emphasized that language
development represents the major learning task during the early education years which
develops the foundation for later academic achievement (Aram & Hall, 1989). Deficits in
language comprehension or expression may interfere with successful academic learning.
An estimated 40-75% or more of children who present with speech and language

Impact of Fast For Word 8
disorders during the preschool years continue to demonstrate language and/or learning
limitations in later academic settings (Aram & Hall, 1989).
Hall and Tomblin (1978) investigated 36 subjects with either articulation or
language impairments. Language-impaired children exhibited more academic difficulties
when compared to articulation-impaired children in the area of reading, but also in
mathematics, language, and vocational skills. In a follow-up parent survey 13 to 20 years
later of their adult children's abilities, 50% oflanguage-impaired children's parents
reported that their child continued to demonstrate some type of communication difficulty;
however, only one parent of a child with past articulation problems reported continued
difficulty. All subjects completed high school; however, significantly fewer language
impaired subjects than articulation-impaired subjects pursued higher education.
Catts (1993) reported on the relationship between speech-language impairments
and reading disabilities of 56 children with articulation or language difficulties and 30
normally developing children. Several standardized speech-language measures were used
to evaluate the children in kindergarten. Initial results indicated that, as a group, children
with speech-language deficits performed lower than their peers. Subjects' reading
abilities were also analyzed in first and second grade. Results revealed language
impaired children's reading skills were significantly more deficient than the normally
developing children's and articulation-impaired children's reading skills. The
articulation-impaired subjects scored within normal limits on the Gray Oral Reading Test
Revised and on the Word Identification and Word Attack subtests from the Woodcock
Reading Mastery Tests-Revised, and did not differ significantly from the normally

Impact of Fast ForWord 9
developing children's reading scores.
Additional research studies have suggested that articulation ability was not related
to reading achievement. A study by Stackhouse (1982) found that children with organic
speech disorders, such as dysarthria or cleft palate, did not evidence significant
difficulties in reading acquisition. Similarly, research by Levi, Capozzi, Fabrizi, and
Sechi (1982) demonstrated no significant difficulties in reading achievement for children
with functional articulation delays.
Silva, Williams, and McGee (1987) studied language delayed children initially
tested in preschool with retesting at ages 7, 9, and 11. The children with either expressive
or receptive language delays exhibited reading scores which were 2 years delayed at age
11. Subjects with both receptive and expressive deficits demonstrated a 2 ~ year delay
in reading scores. Therefore, children with both receptive and expressive language
impairments were impacted the most in academic areas such as reading and vocabulary.
Levi, et al. (1982) supported the idea that language difficulties play a critical role
in children's reading disabilities. In a study involving 32 children, 16 with phonological
impairments and 16 with both phonological and language difficulties, the researchers
found the presence of reading difficulties to be related to the perseverance, quality, and
intensity of the language disorder. Children with phonological and language deficits
performed below their counterparts on literacy measures.
Stark, et al. (1984) examined a group oflanguage-impaired children initially
identified at 4 to 8 years of age. This study was conducted to assess language and reading
skills when the children were 8 to 12 years of age. Twenty-nine language-impaired

Impact of Fast ForWord 10
children and 14 normally developing children participated in the study. All subjects
scored within a normal range for nonverbal intelligence. All language-impaired children
had been receiving therapy prior to the study. The language-impaired children's overall
language age was at least 12 months below chronological or mental age. A
comprehensive assessment including intelligence, receptlve language, expressive
language, speech articulation, and reading tests was administered. The Gates McGinitie
Reading Test results indicated that 23 of29 language-impaired subjects demonstrated a
reading deficit of at least two grade levels, while normally developing children exhibited
reading scores at or above chronological age level. Of the langua.ge-impaired subjects,
90% demonstrated some degree of reading impairment at follow-up 3 to 4 years later,
with most requiring remedial instruction.
Menyuk, et al. (1991) conducted a 3 year study with the goal of predicting reading
problems in at-risk children. Subjects included 130 children between the ages of 53 to 77
months and consisted of 23 children with specific language impairments (SLI), 32
children who were prematurely born, and 87 children in an at-risk group. The criteria for
the SLI group was defined by at least 6 months delay in receptive language age, coupled
with an expressive language deficit of at least 12 months below chronological age.
Reading test results from the Wide Range Achievement Test noted more SLI children
(50%) exhibited reading problems than the other two groups (at-risk 33% & premature
31 % ). The authors hypothesized that the differences among these groups of children
might lie in the development of their processing skills which affect both oral language
processing and reading ability. Findings from analyzing all test results indicated that
Impact of Fast ForWord 11
semantic processing, tht: ability to retrieve lexical items rapidly, and perception of
phonological sequences in words, were significant precursors to successfully learning to
read.
Reading
Learning to read is a complex task. Reading requires the decoding of unknown
words, as well as the comprehension of those words. Specific problem areas for children
who have difficulty acquiring decoding skills may include deficits in phonological
awareness, auditory perception, attention, knowledge of morphological rules, sequential
memory, and visual perceptual ability. Descriptions and components of these decoding
skills are described in Table 1.
Phonological Awareness and Literacy Skills
Phonological awareness is one of the fundamental skills cited by Ratner and
Harris (1994) for decoding novel printed words when reading. Phonological awareness
has been defined as the ability to reflect on and manipulate the sound structure of an
utterance as distinct from its meaning (Stackhouse, 1997). Catts (1993) stated that
phonological awareness is the explicit awareness of the sound structure of language
which includes the knowledge that words are composed of syllables and phonemes and
that words can rhyme or begin/end with the same sound segment. Several researchers
have investigated the relationship between phonological awareness and reading
achievement.

Impact of Fast ForWord 12
Table 1
Skills Reguired to Decode Unknown Printed Words
Skill
Phonological Awareness Skills
Auditory Perceptual Skills
Attentional Skills
Knowledge of Morphological Rules
Sequential Memory
Visual Perceptual Ability
Description
Awareness of differences and similarities hetween phonemes Knowledge of phonological rules of the language Ability to blend individual phonemes into a meaningful word Knowledge of sound-letter association Ability to combine sounds into larger units
Ability to isolate a sound within a word in initial, medial, and final position Ability to perceive relationships between words that rhyme (i.e., to perceive the sounds of parts of two or more words that sound the same Ability to perceive the double sound of consonant blends in words, such as play and table (e.g., bl, br, cl, er, dr, dw,fl, tr, gr, pl, gl, pr, sc, sk, sl, sm, sp, st, ng) Ability to perceive the consonant combinations that represent one sound (sh, th, wh, ch, ph, ng, gh) Ability to perceive differences between the sounds of short vowels in words, such as fan, fin, fun, tan, tin, and ten. Ability to perceive the sounds of vowel combinations (e.g., ie, ea, oo, oi, oa,ai)
Ability to focus attention on a specific sound or task Ability to sustain attention for the length of time it requires to complete a specific task
Ability to divide perceived words into their smallest grammatical units, or morphemes (e.g., unanswerable contains un, answer, and able)
Rapid recognition and retrieval of the letters and words Ability to remember the order of phonemes that when combined comprise a word Ability to recall the sounds within a word and words within a phrase or sentence Ability to recall from memory the syntactical, phonological, and morphological rules that govern the arrangement of words in a phrase or sentence
Ability to distinguish different letter shapes and sizes Ability to perceive the differences between the amount of space separating letters within words and that which separates words in a phrase or sentence Ability to distinguish the direction and orientation of different letters
Note. From Understanding language disorders: The impact on learning (pp. 197-198), by V. L. Ratner and L. R. Harris, 1994, Eau Claire, WI: Thinking Publications.

Impact of Fast ForWord 13
The metalinguistic knowledge of words, syllables, and sounds was measured in 15
language-impaired children between the ages 3 to 6 to identify discrepancies in their
phonological awareness skills as compared to normally developing children (Kamhi, Lee,
& Nelson, 1985). Assessment procedures consisted of children dividing sentences and
words into smaller units. The authors found that more than half of the language-impaired
children could not divide monosyllabic words into smaller sound units when compared to
their peers. Language-impaired children were also significantly delayed in their word
awareness skills, such as the knowledge of what words were and their ability to answer
questions about different words. Since the language-disordered children exhibited delays
when compared with normal children, they were identified as at-risk for future academic
problems, especially learning to read.
Research by Magnusson and Naucler (1990) analyzed several linguistic and
metalinguistic tasks to determine which skills were most related to reading achievement.
Thirty-seven matched pairs of language-learning impaired children and normally
developing children participated in this study. Data was collected one year prior to and
following first grade from numerous standardized tests. The investigators reported
language-learning impaired children were deficient in language comprehension,
syntactic/morphological production, and phonological awareness as compared to
normally developing children. Language-learning impaired children experienced more
difficulty than normally developing children on reading and spelling tasks. Syntactic
production and language comprehension were found to be highly correlated with reading
and spelling abilities. Measures of phonological awareness, however, were the best

Impact of Fast ForWord 14
predictor of reading achievement.
Similarly, a longitudinal study conducted by Bird, Bishop, and Freeman (1995)
evaluated the phonological awareness skills of a group of 31 males ages 5.0-7.4 at initial
assessment. These children were reassessed at ages 79 and 91 months using measures of
phonological awareness and literacy skills. Nineteen children exhibited only expressive
phonological impairments and 12 exhibited phonological disorders and additional
language difficulties. Normally developing boys served as a control group and were
individually matched with children exhibiting phonological deficits. Phonological
awareness tasks included rhyme matching, onset matching (same initial consonant), and
onset segmentation and matching. Literacy measures included identification of letter
names and sounds, nonword reading, and nonword spelling. Children who exhibited
phonological impairments, regardless of whether additional language problems existed,
performed lower on phonological awareness and literacy tasks than normally developing
children. Tasks requiring segmentation and matching of onset and rhymes were
consistently difficult for speech-language impaired children. The data suggest that
children with expressive phonological impairments have difficulty identifying sounds
within syllables. This deficit analyzing speech input may contribute to difficulties in both
speech production and the acquisition of reading skills.
Auditory and Speech Perception Difficulties
Catts & Kamhi ( 1986) have suggested that phonological processing deficits may
underlie many language and reading disabilities. These researchers proposed that some
"low-level perceptual deficits identifying and discriminating phonemes and difficulty

Impact of Fast ForWord 15
forming accurate representations of linguistic (or linguistic-like) information" (p. 344)
were a causal factor for both language and reading difficulties. Auditory perceptual
dysfunction has been suggested by numerous researchers as the primary underlying factor
in reading disabilities and language impairment for many children (Haggerty & Stamm,
1978; Katz & Wilde, 1985; McCroskey & Kidder, 1980; Pinheiro, 1977; Rees, 1973,
1981; Willeford, 1977).
Reading Difficulties
Some researchers have suggested that dyslexia has an underlying auditory basis
(Galaburda & Kemper, 1979; Haggerty & Stamm, 1978; Katz & Wilde, 1985;
McCroskey & Kidder, 1980; Pinheiro, 1977; Rees, 1973, 1981; Willeford, 1977).
Defining what constitutes dyslexia has proven to be no easy task (Hynd & Cohen, 1983).
Wheeler and Watkins (1979) define dyslexia as children who have adequate intelligence,
but experience a general language deficit which is a specific manifestation of a wider
limitation in processing all forms of information in short-term memory, whether visually
or auditorally presented.
A large body of evidence suggests that poor reading ability is due to deficits in
underlying phonological processing skills (Blachman, 1994; Brady & Shankweiler,
1991 ), and that dyslexia is linguistically based (Vellutino & Scanlon, 1987). It has been
proposed that difficulties experienced by poor readers on auditory processing tasks are
specific to speech encoding, not a general auditory processing problem (Vellutino &
Scanlon, 1989). Studdert-Kennedy and Mody (1995) argue that the phonological
awareness deficit encountered by poor readers is a problem with rapid perception specific
Impact of Fast ForWord 16
to linguistic stimuli. Similarly, Mody, Studdert-Kennedy, and Brady (1997) documented
that poor readers who exhibited problems discriminating rapidly presented synthetic Iba/
and /da/ syllables, did not have coinciding difficulty with equally rapid non-speech
stimuli presentations. Tobey and Cullen (1984) measured temporal integration for tone
and tone-sweep stimuli and discovered no difference in the temporal processing ability
between children with auditory memory and reading problems versus age-matched
normally developing children.
An alternate theory proposed by investigators is that children with poor reading
skills have difficulty with rapid-temporal processing tasks (Eden, Stein, Wood, & Wood,
1995; Tallal, Miller, & Fitch, 1993). Reed (1989) stated that children with reading
problems may also struggle in discriminating brief auditory cues. Tallal and colleagues
(1993) have suggested that dyslexic children have a general language problem
characterized as phonemic dysfunction, which is based on temporal-processing deficits
in multiple sensory modalities. In a review of literature, Farmer and Klein (1995)
examined the evidence for a temporal-processing deficit related to reading problems. The
authors noted consistent evidence for a multi-sensory temporal-processing deficit of both
auditory and visual tasks requiring sequential processing of two or more stimuli.
Language Impairment
Lubert (1981) reviewed previous research which suggested that children with
specific language impairment have difficulty processing rapid sequences of brief sounds.
Specific language impairment (SLI) is used to describe disorders of children who
demonstrate deficits in language performance, without additional deficiencies in other

Impact of Fast For Word 17
domains. In a study by Wright et al. (1997) children with language impairment evidenced
significant problems perceiving short-duration tones. Numerous researchers have found
children with SLI evidenced difficulties in a range of domains such as auditory, visual,
tactile and phonetic perception, as well as motor tasks (Bishop, 1990; Haynes & Naidoo
1991; Hughes & Sussman, 1983; Johnson, Stark, Melli tis, & Tallal, 1981; Powell &
Bishop, 1992). Due to these deficits, Locke (1994, 1997) theorized that language
impaired children have a generalized neuromaturational delay. Other research has
suggested that the primary deficit is neurally processing rapid events, concluding that
these children can be distinguished by an inability to process quickly changing multi
sensory stimuli (Anderson, Brown, & Tallal, 1993).
Stark and Heinz (1996) examined phoneme perception skills of children with
receptive language impairments only, and children with both receptive and expressive
language deficits. A serial-ordering task incorporated by the authors required the children
to replicate a sequence of /ba-da/ phonemes with a panel-press procedure. This task
involved the ability to create motor sequences in response to auditory stimuli. Only the
children in the receptive and expressive language disorder group had difficulty
discriminating /ba-da/ syllables. Both groups of children performed poorly on the serial
ordering task. The authors hypothesized that a perceptual deficit accounted for the poor
performance by the children with both receptive and expressive problems, although a
motor-sequencing deficit could explain the results as well.
Computer Training Utilizing Altered Speech
Longitudinal studies have demonstrated persistent delays in the development of
Impact of Fast ForWord 18
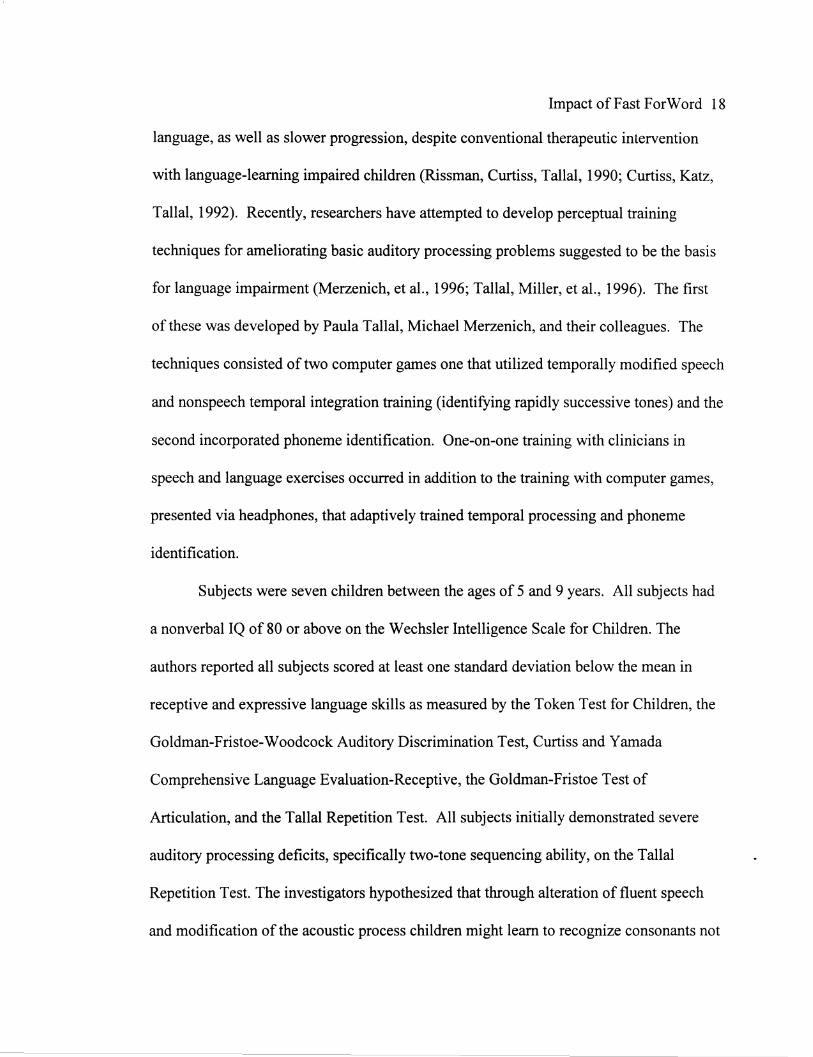
language, as well as slower progression, despite conventional therapeutic intervention
with language-learning impaired children (Rissman, Curtiss, Tallal, 1990; Curtiss, Katz,
Tallal, 1992). Recently, researchers have attempted to develop perceptual training
techniques for ameliorating basic auditory processing problems suggested to be the basis
for language impairment (Merzenich, et al., 1996; Tallal, Miller, et al., 1996). The first
of these was developed by Paula Tallal, Michael Merzenich, and their colleagues. The
techniques consisted of two computer games one that utilized temporally modified speech
and nonspeech temporal integration training (identifying rapidly successive tones) and the
second incorporated phoneme identification. One-on-one training with clinicians in
speech and language exercises occurred in addition to the training with computer games,
presented via headphones, that adaptively trained temporal processing and phoneme
identification.
Subjects were seven children between the ages of 5 and 9 years. All subjects had
a nonverbal IQ of 80 or above on the Wechsler Intelligence Scale for Children. The
authors reported all subjects scored at least one standard deviation below the mean in
receptive and expressive language skills as measured by the Token Test for Children, the
Goldman-Fristoe-Woodcock Auditory Discrimination Test, Curtiss and Yamada
Comprehensive Language Evaluation-Receptive, the Goldman-Fristoe Test of
Articulation, and the Tallal Repetition Test. All subjects initially demonstrated severe
auditory processing deficits, specifically two-tone sequencing ability, on the Tallal
Repetition Test. The investigators hypothesized that through alteration of fluent speech
and modification of the acoustic process children might learn to recognize consonants not

Impact of Fast ForWord 19
previously perceived.
The two computer games used in this study included the Circus Sequence game
and the Phoneme Identification game. Both games began with stimuli easy to perceive.
The games included long nonverbal stimuli (60 ms) or consonant transition (65-70 ms)
durations, presented with long interstimulus intervals (ISis) (500 ms) and with increased
amplification of consonants. These training variables were altered progressively to
approximate normal speech characteristics in both games. Children received feedback in
both games by audio and visual reinforcements for correct responses. The children
earned points on a point accumulator for correct but not incorrect responses.
One of the computer games, Circus Sequence, was a perceptual identification task
which consisted of four stimulus sets of 60 ms-duration tone sweeps with starting or
erding frequencies of 500, 1000, 2000, and 4000 Hertz (Hz). The second computer
game, entitled the Phoneme Identification game, required children to identify stop
consonants presented with brief formant transitions. The stimuli used were /be/, /de/, and
Igel targets and foils.
Speech and language exercises with a speech-language pathologist (SLP) were
included to maintain the children's attention and provide motivation. In general, the
speech and language exercises consisted of acting out commands in a Simon Says format
with props, pointing to pictures or blocks in response to commands, repeating syllables,
nonsense words, actual words or sentences verbatim, and pointing to pictures
corresponding to spoken words. Commands of increasing complexity and length were
used throughout training with the SLP. Immediate feedback models were given by the

Impact of Fast ForWord 20
SLP in listening games if the child answered incorrectly, giving the child a second
opportunity to process the information accurately.
Intensive training occurred with subject participation 3 hours a day, 5 days a week
at the laboratory and as homework for 2 hours per day, 7 d<1ys a week during a 20-day
period. Circus Sequence temporal training exercises were conducted for 19 to 28 of the
sessions for 20 minutes each over the 4-week training period. Phoneme identification
task specific training time was not clearly specified.
The Tallal Repetition Test was used to determine improvements in temporal
event recognition and sequencing abilities for tones. Posttrainingresults indicated a
significant difference in the children's ability to sequence two-tones, discriminate
between tones with shorter ISis and tone duration. The Goldman-Fristoe-Woodcock
Diagnostic Auditory Discrimination Test revealed 6 of 7 subjects made significant
improvements in phoneme discrimination. The gain was approximately 2 years in age
equivalency for discriminating speech sounds. The Token Test also revealed an average
gain of 2 years in age equivalency for following auditory commands of increasing length
and grammatical complexity. The investigators measured change in grammatical
comprehension using the Curtiss and Yamada Comprehensive Language Evaluation
Revised (CYCLE-R). The average age equivalency gain was 1 Yi years. A strong
correlation was found between the children's ability to sequence and segment successive
rapidly presented auditory sweep tones correctly and their posttrainingreceptive language
scores.
The two games were modified following the first study in an attempt to increase

Impact of Fast ForWord 21
performance consistency and better maintain attention. The second version of the Circus
Sequence game was altered so that tone variations in each set were extended to 135 Hz.
Tones with durations of 60, 40, and 20 ms were included, as opposed to only 60 ms as in
the first trial. An animated performance barometer was included to further indicate
progress. To encourage better attention, five misses in a row resulted in a decrease of
difficulty level, and subjects were not allowed to increase the difficulty until a certain
number of correct responses were obtained. The Phoneme Identification game was
revised to include progressively adaptive tasks. The stimuli used were five consonant
vowel (CV) pairs which included Iba/ vs. /da/, /be/ vs. /de/, /fa/ vs. /val, /aba/ vs. /ada/,
and Iba I vs. /da /. As criteria were met, task difficulty increased by reducing the length of
the consonant elements, differential intensification of fast consonant elements was
progressively faded, and the ISis for consecutive CV's were progressively reduced. A
performance barometer was also added to the Phoneme Identification game.
Additional games were also included for the second study. The two new games
were designed to facilitate generalization from the first two games to encompass a wider
range of temporal sequence events and phonemic contexts that occur in natural speech.
Old McDonald's Flying Farm was designed to further increase the subject's identification
of phonemes. The main variables included the duration of a wider range of simulated
consonants and the ISis between the repeated consonants. Phonic Match targeted sound
matching in which subjects were required to identify identical sounds in a matching
format. The main variables consisted of the temporal structure of the phonemes and the
phoneme sequences in individual consonant-vowel-consonant (CVC) words.

Impact of Fast ForWord 22
Subjects were 22 children between the ages of 5.2 to 10.0, with a mean nonverbal
IQ of 96.4 as measured by the Wechsler Intelligence Scale for Children. Assessment
procedures of the first study were replicated for the second. Initially, all subjects
exhibited a severe delay in expressive and receptive language development, marked
temporal processing deficits, and reading problems. Subjects were divided into two
groups, modified speech training and natural speech training. The two matched groups
were determined according to pretraining test measures of nonverbal IQ, receptive
language abilities, gender, and age.
Training exercises were similar to the format of the first study. The modified
speech training group received computer games that adaptively trained temporal
processing and language exercises that utilized acoustically modified speech. The natural
speech training group received essentially the same treatment; however, computer games
were not temporally adaptive and natural speech was used for the language exercises.
Subjects participated in these games for 3 Y2 half hours per day, 5 days a week at the
laboratory with supplemental homework for 2 hours per day, 7 days a week during a 20-
day period. The additional homework was presented entirely in the form of recorded
children's stories on tape with children receiving acoustically modified versions or
natural speech versions, depending on the training they received.
Posttraining assessment procedures were similar to those used in the first study.
Improvement made by the children receiving modified speech was significantly greater
[F(l,20) = 5.44, p= .0015] than that of the children receiving natural speech as measured
by the Goldman-Fristoe-Woodcock Auditory Discrimination Test, the Tallal Repetition

Impact of Fast For Word 23
Test, and the Token Test for Children. The Tallal Repetition Test was used to determine
improvements in the temporal event recognition and sequencing abilities for tones. The
children who received modified speech training scores on the Tallal Repetition Test
increased; however, the children who received natural speech training showed no
significant improvement following the 4-week training period. The group that received
modified speech training increased by 1.25 standard deviations. The Goldman-Fristoe
Woodcock Diagnostic Auditory Discrimination Test noted a larger increase in phoneme
discrimination in the group that received modified speech training than the group that
received natural speech training. A gain of almost one standard deviation was noted in
the group that received modified speech training, whereas the group that received natural
speech training demonstrated only a .5 standard deviation increase in scores.
The Token Test measured the children's ability to follow auditory commands of
increasing length and grammatical complexity. Children in the modified speech training
group demonstrated a .5 standard deviation increase on the Token Test, while a .2
standard deviation gain was noted by children in the natural speech training group.
The investigators measured change in grammatical comprehension using the
CYCLE-R. Children in the modified speech training group increased pretest scores by .8
standard deviation, whereas the natural speech training group improved scores by .5
standard deviation.
Longitudinal follow-up data was taken 6 weeks and 6 months after completed
training in the second study (Tallal, Miller, et al., 1996; & Tallal & Merzemich, 1997).
Children that received modified speech training and children that received natural speech

Impact of Fast ForWord 24
training participated in the study. At 6 weeks posttraining, the modified speech training
group demonstrated a .4 standard deviation increase in scores when compared to scores
gathered immediately following training completion. The children in the natural speech
training group increased their scores .3 standard deviations at 6 weeks posttraining. Six
months after training was completed, the children in both groups demonstrated a .1
standard deviation increase in scores taken at 6 weeks posttraining. Data indicated
continued improvement in both groups; however, the children that received the modified
speech training achieved significantly higher scores than the children that received the
natural speech training. These results indicate the benefits gained through modified
speech training were maintained and increased over time.
The results of the first and second study (Tallal, Miller, et al., 1996; & Merzenich,
et al., 1996) indicate that providing language-learning impaired children with an
acoustically modified signal that can be adequately processed, while reducing the existing
temporal processing deficit achieved through adaptive training, greatly enhanced
language-learning impaired children's ability to process naturally occurring speech.
In an attempt to combat early language impairment and subsequent academic
disorders such as reading, a collaboration between Dr. Paula Tallal, Dr. Steven Miller, Dr.
Michael Merzenich, and Dr. William Jenkins produced Fast ForWord (FFW). Fast
For Word consists of seven adaptive training exercises in computer game formats created
to enhance auditory processing, phonological awareness, and language processing skills
in language learning impaired children. Fast ForWord uses artificial speech, digitized
human speech, tones, and sounds. Speech characteristics and sounds, primarily

Impact of Fast ForWord 25
consonants, are modified as the child advances through the program. Initially, the speech
sounds are separated by a longer duration (250 ms), but as the child's auditory processing
skills improve, the length of separation is shortened to 20 ms.
Seven adaptive training exercises comprise Fast ForWord, which include three
sound and four word tasks. The three sound training exercises used are entitled Circus
Sequence (process and sequence tonal skills), Old MacDonald's Flying Farm (distinguish
phonemic sound changes), and Phoneme Identification (identify specific phonemes). In
the sound exercises, complex auditory stimuli are presented in a tone format using
different frequencies, time durations, and phonemes. An ongoing performance evaluation
is used for monitoring task difficulty level to insure that each child is correctly responding
80% of the time. The four word exercises are Phonic Match (memory and reasoning
skills using simple word structures), Phonic Word (phoneme and word recognition skills
for complex words), Block Commander (listening comprehension and syntactic rules),
and Language Comprehension Builder (increasingly complex sentence to develop higher
level language). The word exercises consist of words presented either in isolation or
within sentences with distinct linguistic complexity levels. Acoustically modified speech
is used to enhance the phonetic components of natural speech. Speech processing
difficulty levels for these exercises are arranged in a hierarchy, from an easier Level One
to a more complex Level Five. Level 5 presents the child with natural, unmodified
speech. All seven training exercises incorporate animations to maintain the child's
interest and to reward correct responses.
Research supports the notion that intense perceptual training with Fast ForWord

Impact of Fast ForWord 26
improves language skills. Miller, et al. (1996) conducted a study using 106 children with
attentional deficit disorder (ADD) and language learning impairment (LLI). The primary
focus of the research was to determine if differences exist between ADD and LLI children
in their ability to improve auditory speech reception skills. The Token Test for Children
and the Clinical Evaluation of Language Fundamentals (CELF) were administered before
and after training. Dramatic improvement in language comprehension was evidenced,
with 82.5% of the children increasing their scores on the Token Test for Children.
Similarly, children's scores rose from the moderate-mild deficit range to within normal
limits on the CELF. The researchers reported that both groups of children benefitted
tremendously in language comprehension from the computer-guided training and no
significant differences existed between the groups.
In a large national field test study (Tallal & Merzenich, 1997), 533 children (377
male, 153 female) participated in Fast ForWord training exercises. Subjects participated
in computerized training sessions an average of 1 hour and 40 minutes per day, 5 days per
week. Children participated in the program until the criterion of 90% accuracy was
achieved on five of seven games at the most difficult level incorporating natural speech.
Duration of participation was generally between 6 to 8 weeks, with no subject's program
extending longer than 50 days. Training exercises were administered either in a home
setting (approximately 200 children) or in clinics, special education settings, or
elementary schools (approximately 300 children) throughout the United States. Subjects
exhibited a wide range of diagnostic labels, some of which included central auditory
processing disorder, pervasive developmental disorder, attention deficit disorder, and

Impact of Fast ForWord 27
language-impaired.
Results gathered from a variety of assessment measures indicated significant gains
in the subjects' receptive and expressive language abilities and discrimination abilities.
The GFW demonstrated subjects' abilities to be approximately 1.5 standard deviations
below the mean on pretest measures. Following Fast ForWord training, the children's
scores on the GFW were near the mean in quiet conditions and slightly above the mean in
the noise conditions.
The Token Test for Children was administered to 329 subjects. Pretest scores
were approximately 2 standard deviations below the mean, while posttest scores
improved by more than one standard deviation. Forty-five percent of the children scored
at or above the mean following FFW training.
Two standardized test batteries were used to assess a portion of the subjects'
receptive and expressive language abilities. The Clinical Evaluation of Language
Fundamentals (CELF) was administered to 148 children. Pretest results on the CELF
demonstrated mean receptive and expressive language scores more thanone standard
deviation below the mean. Following training, receptive and expressive test scores
entered the range which the test described as within normal limits. The Test of Language
Development Primary (TOLD-P) was administered to 77 subjects and the TOLD
Intermediate was administered to 50 subjects. Pretest results on both tests showed scores
approximately one standard deviation below the mean on the composite language
quotient. Posttrainingresults showed significant gains across all subtest quotients, with
scores approaching or exceeding the mean.

Impact of Fast ForWord 28
Training focused specifically on adaptive temporal discrimination tasks has been
found to increase the language abilities of children with language impairment
(Merzenich, et al., 1996; Tallal, Miller, et al., 1996; Tallal & Merzenich, 1997). As
reported by Brady, Scarborough, and Shankweiler (1996), however, the posttraining gains
documented by Merzenich et al. (1996) and Tallal, Miller, et al. (1996) are difficult to
interpret for many reasons. These include the following: a) not enough information was
provided about the exact nature of the linguistic strengths and weaknesses of the language
impaired children; b) little is known about one of the testing instruments used (CYCLE
R, an unpublished test); and c) clarification is needed about which aspects of the versatile
intervention program were essential.
The authors of Fast ForWord have not documented improvement ofreading skills
following the training program in any research study. Nevertheless, accounts of the
research in the popular press have made unsubstantiated statements that such training
might help dyslexics. Although it appears logical that Fast ForWord training may
improve several of the skills necessary to decode words when reading, research is needed
to substantiate this hypothesis. Therefore, more research is needed to establish the effect
of Fast ForWord on reading problems.
Summary and Statement of Objectives
Researchers estimate that more than half of preschool children with speech and
language disorders will continue to demonstrate language and/or learning difficulties in
later academics (Aram & Hall 1989). The academic area most commonly effected was
reading (Silva, Williams, & McGee, 1987; Stark et al., 1984). Investigators have
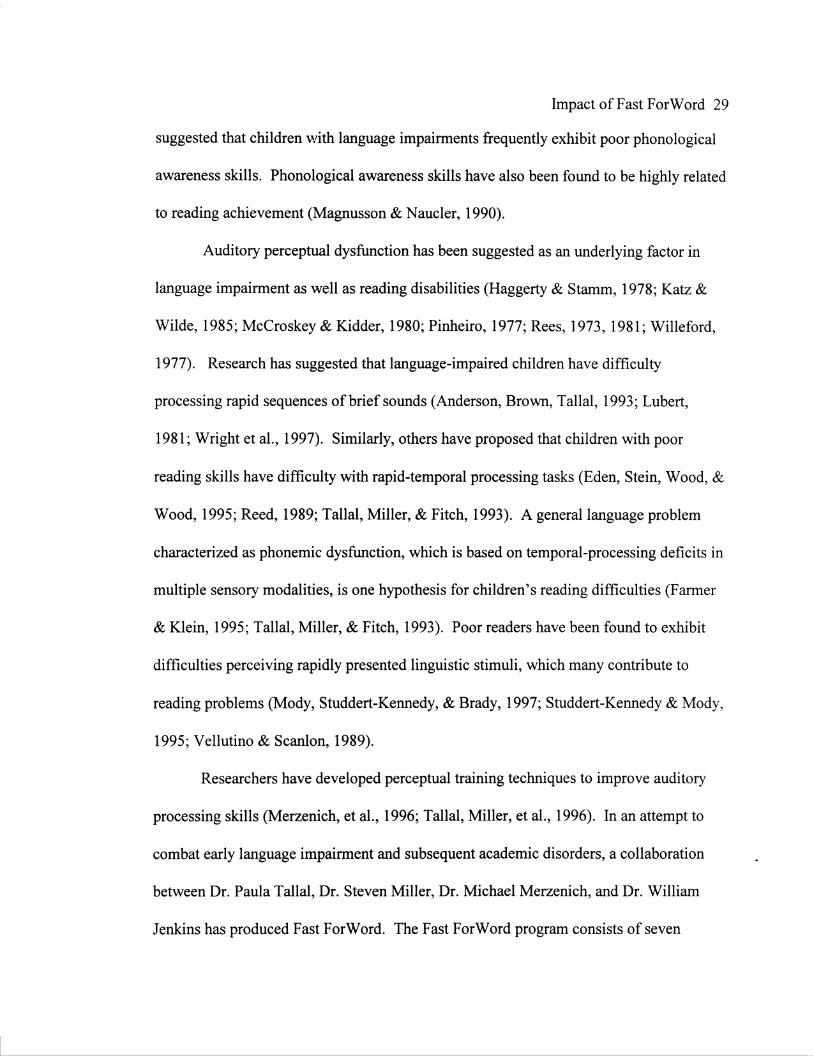
Impact of Fast ForWord 29
suggested that children with language impairments frequently exhibit poor phonological
awareness skills. Phonological awareness skills have also been found to be highly related
to reading achievement (Magnusson & Naucler, 1990).
Auditory perceptual dysfunction has been suggested as an underlying factor in
language impairment as well as reading disabilities (Haggerty & Stamm, 1978; Katz &
Wilde, 1985; Mccroskey & Kidder, 1980; Pinheiro, 1977; Rees, 1973, 1981; Willeford,
1977). Research has suggested that language-impaired children have difficulty
processing rapid sequences of brief sounds (Anderson, Brown, Tallal, 1993; Lubert,
1981; Wright et al., 1997). Similarly, others have proposed that children with poor
reading skills have difficulty with rapid-temporal processing tasks (Eden, Stein, Wood, &
Wood, 1995; Reed, 1989; Tallal, Miller, & Fitch, 1993). A general language problem
characterized as phonemic dysfunction, which is based on temporal-processing deficits in
multiple sensory modalities, is one hypothesis for children's reading difficulties (Farmer
& Klein, 1995; Tallal, Miller, & Fitch, 1993). Poor readers have been found to exhibit
difficulties perceiving rapidly presented linguistic stimuli, which many contribute to
reading problems (Mody, Studdert-Kennedy, & Brady, 1997; Studdert-Kennedy & Mody,
1995; Vellutino & Scanlon, 1989).
Researchers have developed perceptual training techniques to improve auditory
processing skills (Merzenich, et al., 1996; Tallal, Miller, et al., 1996). In an attempt to
combat early language impairment and subsequent academic disorders, a collaboration
between Dr. Paula Tallal, Dr. Steven Miller, Dr. Michael Merzenich, and Dr. William
Jenkins has produced Fast For Word. The Fast For Word program consists of seven

Impact of Fast ForWord 30
adaptive training exercises in computer game formats created to enhance auditory
processing, phonological awareness, and language processing skills in language-learning
impaired children.
Previous research of Fast ForWord indicated that children who participated in this
training program demonstrated significant gains in receptive and expressive language
abilities and discrimination abilities (Tallal & Merzenich, 1997; Tallal, Saunders, et al.,
1996). Children's test scores on a variety of assessment procedures, including the
Goldman-Fristoe-Woodcock Auditory Discrimination Test, the Token Test, The Clinical
Evaluation of Language Fundamentals, and the Test of Language Development-Primary,
all revealed significant gains when comparing pre- and posttest scores following FFW
training.
The recent advances made by Tallal, Merzenich, and colleagues in perceptual
training for remediation of language learning impairments have led to dramatic
improvements in speech reception skills. Recent accounts of the research in the popular
press have made unsubstantiated statements that such training might help individuals with
reading impairments. However, the producers have only reported group mean gains in
the program for large numbers of children. They have not presented detailed descriptions
of individual children's language skills before and after training. The authors of Fast
ForWord also have not documented its effect on phonological awareness skills or reading
ability. Therefore, the purpose of this study is to examine the effect that Fast ForWord
has on children's phonological awareness and reading skills.

Impact of Fast ForWord 31
The specific primary research questions asked in the study are:
1. Do individual children who receive Fast ForWord training evidence a
significant gain of greater than one standard deviation on The
Phonological Awareness Test?
2. Do individual children who receive Fast ForWord training evidence a
significant gain of greater than one standard deviation on the Test of Early
Reading Ability-2?
Additional secondary research questions are as follows:
1. Do individual children who receive Fast ForWord training evidence a
significant gain of greater than one standard deviation in their general
language skills?
a. Do individual children who receive Fast ForWord training
evidence a significant gain of greater than one standard deviation
in their expressive language skills, as measured by the Language
Processing Test-Revised and the Test of Language Development
Primary?
b. Do individual children who receive Fast ForWord training
evidence a significant gain of greater than one standard deviation
in their auditory perceptual skills, as measured by the Screening
Test for Auditory Processing?

Overview
Chapter III
Method
Impact of Fast ForWord 32
The purpose of this study was to determine the effects of Fast ForWord training
on children's phonological awareness and reading skills. Five language-impaired
children received Fast ForWord (FFW) training for approximately 2 hours per day, 5 days
a week, for 6 to 8 weeks. Three language-impaired children served as a comparison
control group. The Phonological Awareness Test (PAT) and The Test of Early Reading
Ability-2 (TERA-2) were administered pre- and posttest to evaluate the effects of the
FFW program on phonological awareness and reading skills. In addition, the Language
Processing Test-Revised (LPT-R), the Test of Language Development-Primary (TOLD
P:2), and the Screening Test for Auditory Processing Disorders (SCAN) were used to
identify other skills impacted by Fast For Word. These measures also facilitated a more
thorough description of the subjects' strengths, weaknesses, and progress.
Subject Selection
Experimental subjects were 5 children between the ages of 6:0 and 8:6 at the
initial time of assessment who were enrolled in the Fast For Word program. The
experimental subjects scored one standard deviation below the mean on The Phonological
Awareness Test and the Test of Early Reading Ability-2. Subjects' initial performance
might also have been below the mean on other testing measures which included the
Language Processing Test-Revised, the Test of Language Development-Primary:2, and
the Screening Test for Auditory Processing Disorders. However, the scores on the LPT-

Impact of Fast ForWord 33
R, TOLD-P:2, and SCAN, did not have to be below the mean to qualify for the study.
Two subjects, Subjects 3 and 4, did not score a minimum of one standard deviation below
the mean on the TERA-2. However, these subjects were included in the study as the PAT
standard scores were at least one standard deviation below the mean and the subjects
were within the target age range.
Several of the experimental subjects had received speech and language services
previously. Subject 1 received speech and language services during the educational year
through the Eastern Illinois University Speech-Language-Hearing Clinic twice per week
for 50 minutes to improve expressive and receptive language skills. Subject 2 did not
receive speech and language services during the school year, however, this subject had
been identified as having reading difficulties by the parents and classroom teacher.
Subject 2 was born with neurofibromatosis and had been diagnosed with attention deficit
hyperactivity disorder (ADHD) and learning disabled (LD). Subjects 3 did not receive
speech and language services during the school year, however, this subject had been
identified as having reading difficulties by the classroom teacher. Subject 4 received
speech and language services throughout the school year four times per week for 60
minute sessions targeting language processing deficits. Subject 5 received speech and
language services throughout the educational year twice per week for 60 minutes to
improve phonological processing skills.
The 5 experimental subjects' pretest standard score results for five assessment
measures are presented in Table 2.

Impact of Fast ForWord 34
Table 2
Five Experimental Subjects' Pretest Standard Scores for Five Assessment Measures.
Measure Subjects
Subject 1 Subject 2 Subject 3 Subject 4 Subject 5
PAT < 71 65 74 86 78
TERA-2 58 69 88 104 82
TOLD-P:2 72 78 77 77 88
LPT-R 67 68 93 88 89
SCAN 74 69 117 101 105
Note. All five assessment measures standard scores are based on a mean of 100 with a standard deviation of 15.
Control subjects were 3 language-impaired children between the ages of 6:0 and
8:6 at the initial time of assessment. These subjects also scored one standard deviation
below the mean on the PAT and the TERA-2. Subjects might also have scored below the
mean on other testing measures (the LPT-R, TOLD-P:2, and the SCAN). Like the
experimental group, these scores did not have to be below the mean on these measures to
qualify for the study. Two subjects in the control group, Subjects 2 and 3, did not score a
minimum of one standard deviation below the mean on the TERA-2. However, these
subjects were included in the study as the PAT standard scores were at least one standard
deviation below the mean and the subjects were within the target age range. The 3
control subjects were not identified at the time pretest measures were administered to the
5 experimental subjects. However, the length of time between pre- and posttest of control
subjects corresponded to the length of time between assessments of experimental

Impact of Fast ForWord 35
subjects. The 3 control subjects' pretest standard score results are presented in Table 3.
The 3 subjects in the control group did not participate in the Fast ForWord
program. They also did not receive speech-language therapy or other special services to
improve reading skills during the time which the experimental subjects were participating
in Fast ForWord. All 3 control subjects were identified by their parents as having reading
difficulties.
Table 3
Three Control Subjects' Pretest Standard Scores for Five Assessment Measures.
Measure
PAT
TERA-2
TOLD-P:2
LPT-R
SCAN
Control Subject 1
64
69
67
54
80
Subjects
Control Subject 2 Control Subject 3
69 85
98 92
83 96
79 60
164 146
Note. All five assessment measures standard scores are based on a mean of 100 with a standard deviation of 15.
Experimental and control subjects did not exhibit any documented deficits in
other developmental areas including physical, visual, auditory, and cognitive
development.
Assessment
Pre- and posttest assessments were conducted using the following battery of
standardized tests: The Phonological Awareness Test, the Test of Early Reading Ability-

Impact of Fast For Word 36
2, the Language Processing Test-Revised, the Test of Language Development-Primary:2,
and the Screening Test for Auditory Processing Disorders.
The Phonological Awareness Test (Robertson & Salter, 1997) is designed to
highlight difficulties in phonological processing and phoneme-grapheme correspondence
for children ages 5:0 to 9:0 years. Children's rhyming, segmentation, isolation, deletion,
substitution, blending, grapheme, and decoding skills are assessed in a developmental
sequence. Rhyming skills are evaluated through discrimination and production.
Segmentation tasks include segmenting sentences, syllables, and phonemes.
Identification of the initial, medial, and final sounds in a word is assessed in the isolation
subtest. Deletion skills are evaluated in compound words and syllables. Substitution of
one phoneme for another phoneme is assessed in words with and without manipulatives.
Blending skills are evaluated in words at the syllable (e.g. /win-dow/) and phoneme (/m-i-
1-k/) level. The grapheme section assesses sound-letter knowledge. Decoding skills are
evaluated through reading of nonsense syllables.
The Test of Early Reading Achievement (TERA-2) (Reid, Hresko, & Hammil,
1991) analyzes the reading ability of young children ages 3 :0 through 9: 11 years. The test
is designed to measure children's ability to attribute meaning to printed symbols, their
knowledge of the alphabet and its functions, and their understanding of the conventions
of print. The contextual meaning subtest measures a child's abilities from three types of
print which include awareness of print in environmental contexts, knowledge of relations
among vocabulary items, and awareness of print in connected discourse. The subtest of
knowledge of the alphabet and its functions measures letter and numeral naming, alphabet
Impact of Fast For Word 37
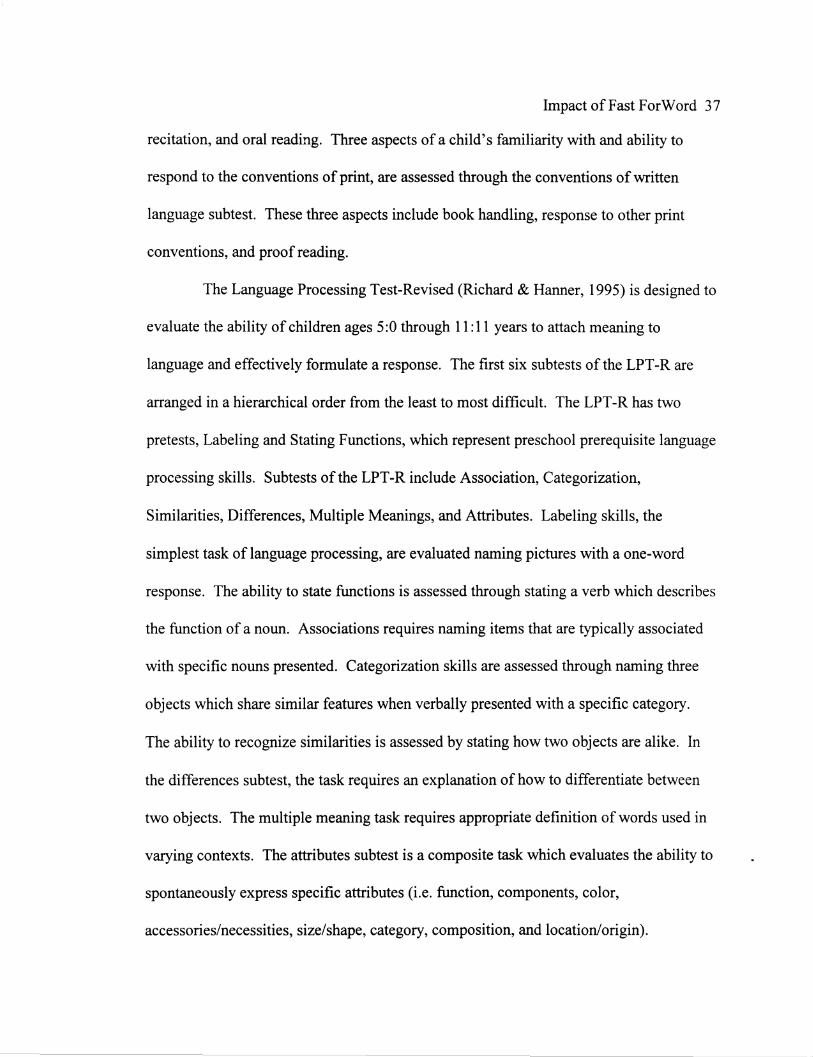
recitation, and oral reading. Three aspects of a child's familiarity with and ability to
respond to the conventions of print, are assessed through the conventions of written
language subtest. These three aspects include book handling, response to other print
conventions, and proof reading.
The Language Processing Test-Revised (Richard & Hanner, 1995) is designed to
evaluate the ability of children ages 5 :0 through 11: 11 years to attach meaning to
language and effectively formulate a response. The first six subtests of the LPT-R are
arranged in a hierarchical order from the least to most difficult. The LPT-R has two
pretests, Labeling and Stating Functions, which represent preschool prerequisite language
processing skills. Subtests of the LPT-R include Association, Categorization,
Similarities, Differences, Multiple Meanings, and Attributes. Labeling skills, the
simplest task of language processing, are evaluated naming pictures with a one-word
response. The ability to state functions is assessed through stating a verb which describes
the function of a noun. Associations requires naming items that are typically associated
with specific nouns presented. Categorization skills are assessed through naming three
objects which share similar features when verbally presented with a specific category.
The ability to recognize similarities is assessed by stating how two objects are alike. In
the differences subtest, the task requires an explanation of how to differentiate between
two objects. The multiple meaning task requires appropriate definition of words used in
varying contexts. The attributes subtest is a composite task which evaluates the ability to
spontaneously express specific attributes (i.e. function, components, color,
accessories/necessities, size/shape, category, composition, and location/origin).

Impact of Fast ForWord 38
The Test of Language Development-Primary:2 (Newcomer & Hammill, 1988)
includes seven subtests which evaluate specific strengths and weaknesses in receptive and
expressive language skills of children ages 4:0 through 8: 11 years. Subtests include
Picture Vocabulary, Oral Vocabulary, Grammatic Understanding, Sentence Imitation,
Grammatic Completion, Word Discrimination, and Word Articulation. Picture
vocabulary is assessed through pointing to one of four pictures which best represents the
meaning of a stimulus word. Oral vocabulary is evaluated by verbal definition of
common words. Identification of appropriate syntax is assessed in the grammatic
understanding subtest . Sentence imitation skills are evaluated through an imitation task
with sentences verbally presented by the examiner. Grammatic completion includes the
ability to recognize, understand, and use common morphological forms. Word
discrimination requires recognition of phonemic differences using minimal pairs. Word
articulation ability is assessed through spontaneous utterances of speech sounds in
response to picture stimuli.
The SCAN (Keith, 1986) analyzes the auditory processing skills of children
between the ages of 3 :0 to 11 :0 years. The three SCAN subtests include Filtered Words,
Auditory Figure Ground, and Competing Words. These subtests are recorded on an
audiocassette and presented through headphones. For the filtered words subtest, 20
words are presented to the right ear, followed by 20 words presented to the left ear with
the child immediately repeating each word. A response is correct only if the word is
repeated accurately. In the auditory figure ground subtest, speech noise is presented
simultaneously to the same ear in which words are presented. As in the first subtest, 20

Impact of Fast ForWord 39
words are presented to each ear, first the right and then the left. The child must repeat
each word accurately for a response to be correct. The final subtest, competing words,
presents semantically unrelated monosyllabic word pairs simultaneously to both ears. For
the first 25 word pairs, the child repeats both words, starting with the word heard in the
right ear first. The next 25 word pairs requires the child to repeat both words starting
with the word heard in the left ear first. Credit is given for each word accurately repeated,
even if only one word of the pair is repeated correctly or if the words are repeated in
reverse order.
Pretest measures were conducted primarily by the graduate student involved in
the research study, but also by two certified SLPs employed by the Shiloh School District,
an additional training site. The graduate student administered The Phonological
Awareness Test and the Test of Early Reading Ability-2 subjects to ensure consistent
testing measures for the primary research questions.
Posttraining measures were conducted similarly to the pretesting procedures.
The graduate student once again administered all primary test measures (PAT and TERA-
2). Two other certified professionals on site also assisted with posttesting on other
assessments. Experimental subjects were posttested within one week after completing the
FFW program.
Reliability
A graduate student attending Eastern Illinois University, along with the two
previously mentioned SLPs, administered the test battery. The PAT and TERA-2 testing
measures were audiotaped. Twenty percent of the primary pre- and posttesting

Impact of Fast For Word 40
procedures were re-scored by another graduate student to determine the reliability of the
primary graduate student administrator. Intrajudge reliability, a comparison of results by
the same individual, was .95 for The Phonological Awareness Test and .97 for the Test of
Early Reading Ability-2. Similarly, interjudge reliability, a comparison of results by
different individuals, was .90 for The Phonological Awareness Test and .99 for the Test
of Early Reading Ability-2.
Training Procedures
The 5 experimental subjects participated in the Fast ForWord training program.
Two subjects participated in the program at the Eastern Illinois University Speech
Language-Hearing Clinic and 3 subjects at the Shiloh School District.
The Fast ForWord training program is a CD-ROM and Internet-based program
that consists of seven computerized training games (Scientific Leaming Corporation,
1997). These games are designed to target temporal processing and phoneme
identification. The training program includes the following training features: rate of
processing, individualized adaptive training, modified speech, and performance review.
The seven computerized training games are as follows: Circus Sequence, Old
MacDonald's Flying Farm, Phoneme Identification, Phonic Match, Phonic Word, Block
Commander, and Language Comprehension Builder. The FFW program is recommended
for children ages 4 to 13 years.
Circus Sequence is designed to train processing of non-verbal sounds more
promptly and accurately. The featured skills include rate of processing speed, short term
memory, and serial order processing. Circus Sequence requires replication of a two-

Impact of Fast ForWord 41
sound sequence by clicking on two buttons, each of which corresponds to a specific
sound. The time interval separating the two-sound sequence decreases as the child's
performance increases. This allows the child to better distinguish rapidly presented
sounds. Three stimulus categories of frequency sweep tones are used: 1) 500 Hz, 2) 1
kHz, 3) 2 kHz. A total of 1260 adaptive training levels are required for 100 percent
completion of Circus Sequence.
Old MacDonald's Flying Farm addresses the ability to detect temporal acoustic
differences between phonemes. The five stimulus categories include contrasts of /gi-ki/,
/chu-shu/, /si-sti/, /ge-ke/, and /do-to/. The task increases in difficulty as the interval
between the contrasts is shortened. The featured skills in Old MacDonald's Flying Farm
include rate of processing speed, short term memory, phoneme discrimination, and
sustained and focused attention. To reach 100 percent completion of Old MacDonald's
Flying Farm, Level 18 must be completed. This level challenges the child to distinguish
between phonemes that differ by only one temporal acoustic cue or rates of acoustic
change found in normal speech.
Phoneme Identification enhances the ability to identify a single phoneme. A
target phoneme is presented. Then the child must correctly identify the same phoneme
out of a stimulus set of two. The five syllable pairs used in this task are: /aba-ada/, /ba
da/, /be-de/, /bi-di/, and Iba-fa/. The featured skills are rate of processing speed, short
term memory, and phoneme identification. The total number of levels in this game is 26
for 100 percent completion.
Phonic Words targets the ability to distinguish minimal pairs, words that differ

Impact of Fast ForWord 42
only by an initial phoneme (tack vs. pack) or by the final phoneme (pat vs. pack). The
featured skills are rate of processing speech and word recognition. The carrier phrase
"Point to ... " is used to elicit the child's selection between two pictures. During the
progression of this game, the degree of acoustically modified speech used decreases. The
highest level, Level 5, uses natural unmodified speech.
Phonic Match consists of a grid of 4 to 16 animated tiles containing animal
characters. The featured skills are rate of processing, short term memory, and word
recognition. Once a tile is selected by the child, a single word is given which represents
the tile. The child must match tiles containing the same target words. The tiles disappear
once the child identifies the match. The words within the grid may vary either in initial or
final phonemes. During the progression of this game, the degree of acoustically modified
speech used decreases. As in the Phonic Words game, Level 5 progresses to natural
unmodified speech.
Block Commander is a three-dimensional board exercise that targets increasing
listening comprehension and attention skills. Focus is achieved by asking the child to
follow a series of simple or complex commands. As the game becomes more
challenging, longer sentences and/or increased syntactic difficulty are incorporated. The
amount of modified speech used decreases as criterion are reached. Level 5, the highest
level, uses natural unmodified speech. The featured skills are rate of processing speed,
short term memory, listening comprehension, and syntax.
Language Comprehension Builder focuses on building phonological,
morphological, and grammatical comprehension skills through pictures illustrating
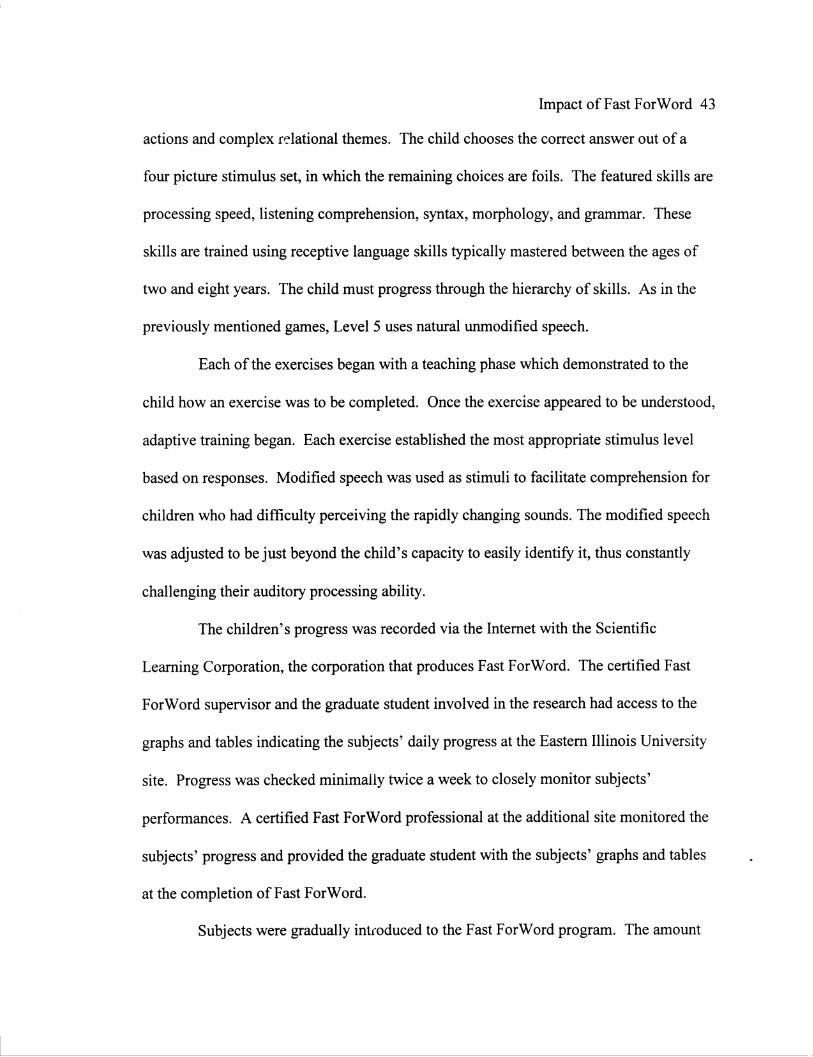
Impact of Fast For Word 43
actions and complex relational themes. The child chooses the correct answer out of a
four picture stimulus set, in which the remaining choices are foils. The featured skills are
processing speed, listening comprehension, syntax, morphology, and grammar. These
skills are trained using receptive language skills typically mastered between the ages of
two and eight years. The child must progress through the hierarchy of skills. As in the
previously mentioned games, Level 5 uses natural unmodified speech.
Each of the exercises began with a teaching phase which demonstrated to the
child how an exercise was to be completed. Once the exercise appeared to be understood,
adaptive training began. Each exercise established the most appropriate stimulus level
based on responses. Modified speech was used as stimuli to facilitate comprehension for
children who had difficulty perceiving the rapidly changing sounds. The modified speech
was adjusted to be just beyond the child's capacity to easily identify it, thus constantly
challenging their auditory processing ability.
The children's progress was recorded via the Internet with the Scientific
Leaming Corporation, the corporation that produces Fast ForWord. The certified Fast
ForWord supervisor and the graduate student involved in the research had access to the
graphs and tables indicating the subjects' daily progress at the Eastern Illinois University
site. Progress was checked minimally twice a week to closely monitor subjects'
performances. A certified Fast ForWord professional at the additional site monitored the
subjects' progress and provided the graduate student with the subjects' graphs and tables
at the completion of Fast ForWord.
Subjects were gradually intfoduced to the Fast ForWord program. The amount
keepscan
Sticky Note

Impact of Fast ForWord 44
of training time increased progressively during the first week of the program. Exercises
listed for the first week of training must be played each day, but not in any particular
order (See Table 4). After day 5, the schedule remained constant at 20 minutes per
exercise, 5 exercises per day, and 5 days per week. The order of the training exercises
was determined by the computer and could not be altered. Training for the day was
complete when signaled by the "End of Schedule" bus that appeared across the computer
screen or when the exercises for the day began to repeat. After the training for the day
was completed, the child automatically went though the "End of Schedule" routine to
acquire extra bonus points. The optimum training period for each child varied depending
on their rate of progress. Fast For Word training was completed when the subject reached
at least 90 percent completion on at least five of the seven training exercises or when 9
weeks of FFW training had occurred.
Throughout the Fast ForWord program reinforcement was provided for the
children. Daily point totals were recorded with stickers awarded for every 100 points
accumulated. When each child completed one row on the sticker chart, a trip to the small
prize basket was allowed. Upon completion of the FFW program, a Beanie Baby was
given to the child. These reinforcement procedures were followed at both FFW training
sites.

Table 4
Fast ForWord Training Progression.
Training Days
Days 1-3 1 hour
Days4& 5 1 hour 20 min.
From Day6 1 hour 40 min.
Impact of Fast ForWord 45
Exercises Available for Play
Circus Sequence Phonic Match Block Commander
Circus Sequence Phoneme Identification Phonic Match Block Commander
Circus Sequence Old MacDonald's Flying Farm Phoneme Identification Phonic Match Phonic Word Block Commander Language Comprehension

Chapter IV
Results
Impact of Fast For Word 46
The study investigated the effects of the Fast For Word computer training
program on children's phonological awareness and reading skills. The primary research
questions asked of study were: 1) Do individual children who receive Fast For Word
training evidence a significant gain of greater than one standard deviation on The
Phonological Awareness Test? 2) Do individual children who receive Fast ForWord
training evidence a significant gain of greater than one standard deviation on the Test of
Early Reading Ability-2? Additional secondary research questions were: 1) Do
individual children who receive Fast ForWord training evidence a significant gain of
greater than one standard deviation in their general language skills as measured by the
Language Processing Test-Revised and the Test of Language Development-Primary? 2)
Do individual children who receive Fast ForWord training evidence a significant gain of
greater than one standard deviation in their auditory perceptual skills as measured by the
Screening Test for Auditory Processing?
Results were obtained by comparing the difference between pre- and posttest
standard scores. The initial and final Fast ForWord game completion percentages for
each individual subject were also analyzed. Each assessment measure was assessed to
determine any increases in reading and/or language skills. Group means for all
assessment measures were also calculated. The results collected for the experimental
subjects are presented in the following tables.

Impact of Fast ForWord 47
Subject 1
Subject l, 6 years 10 months, did not achieve the completion criteria (90%) for
any of the seven games. Table 5 details the progress made on the Fast ForWord games.
The highest completion level obtained was 50% on Block Commander (which targeted
listening comprehension and attention skills). A 4 7% increase was evidenced on this
game. The next highest completion level was 25% on Phonic Match (which featured rate
of processing, short term memory, and word recognition skills). A 15% increase was
observed on this game. The subject remained at 0% accuracy with no gain on Circus
Sequence. Subject 1 participated in FFW training for 8 weeks with 98% attendance
(39/40 sessions).
Table 5
Game Completion Data of Fast ForWord Games for Subject 1.
FFWGame Initial% Final% %Gain
Circus Sequence 0% 0% 0%
MacDonald's Flying Farm 6% 9% 3%
Phoneme Identification 12% 7% -5%
Phonic Match 10% 25% 15%
Phonic Word 14% 16% 2%
Language Comprehension 5% 15% 10%
Block Commander 3% 50% 47%
Initial language test scores for Subject 1 suggested overall low language skills.
Results from testing measures revealed standard scores ranging between 2 to 3 standard
deviations below the mean. Table 6 displays Subject 1 's raw scores and standard scores

Impact of Fast ForWord 48
for the assessment measures. The largest strength was oral vocabulary as measured by
the TOLD-P:2 (this skill was at the 50th percentile). Weaknesses included phonological
awareness skills, knowledge of the alphabet and writing conventions, receptive and
expressive language skills such as picture vocabulary, grammatical understanding and
grammatical completion, and language processing skills.
Table 6
Raw Scores. Standard Scores. and Test Gains for Five Standardized Test Measures for
Subject 1
Measure Pretest Posttest Test Gain
Raw SS Raw SS SS 1 s.d.
PAT 58 < 71 55 <71
TERA-2 12 58 18 78 +20 * TOLD-P:2 51 72 60 72 0
LPT-R 20 67 40 84 +17 * SCAN 87 74 100 79 +5
Note. All assessment measures had a mean of 100 with a standard deviation of 15; *indicates a standard score increase of one standard deviation or greater.
Posttest data was obtained 9 weeks later following participation in the Fast
ForWord (FFW) language program. Subject 1 evidenced greater than one standard
deviation increase on two assessment measures, the TERA-2 and LPT-R. On the TERA-
2, the standard score improved by 20 points, a gain of slightly over one standard
deviation. Another large increase in standard score was observed on the LPT-R. The
standard score on this measure improved 1 7 points, which was also slightly more than

Impact of Fast ForWord 49
one standard deviation. The increase was attributed to minimal gains on the subtests of
categories and associations. Standard scores for the PAT and TOLD-P:2 remained
unchanged at approximately 2 standard deviations below the mean. Results of the SCAN
indicated standard scores increased five points. Posttest scores may not accurately reflect
language skills due to non-compliant testing behavior by this subject.
Subject 2
Subject 2, 8 years 2 months, did not achieve the completion criteria (90%) for
any of the seven games. Table 7 represents the FFW game data for Subject 2. The
highest completion rate was 88% on Phonic Word (which focused on distinguishing
words by a single phoneme either in the initial or final position). The increase on this
game was 77%. The second highest completion occurred on Old MacDonald's Flying
Farm with 68% completion, a 64% increase. Old MacDonald's Flying Farm concentrated
on detecting temporal acoustic differences between phonemes. Subject 2 participated in
FFW training for 8 weeks with 98% attendance (39/40 sessions).
Pretest data revealed Subject 2 performed two standard deviations below the
mean on the PAT, TERA-2, LPT-R, and SCAN, as well as one standard deviation below
the mean on the TOLD-P:2. Table 8 outlines the testing scores for Subject 2. Strengths
on the testing measures included word articulation (the 37th percentile). Specific
weaknesses consisted of phonological awareness skills, knowledge of the alphabet and
writing conventions, receptive and expressive language, and language processing skills.

Impact of Fast ForWord 50
Table 7
Game Completion Data of Fast ForWord Games for Subject 2.
FFWGame Initial% Final% %Gain
Circus Sequence 0% 9% 9%
MacDonald's Flying Farm 4% 68% 64%
Phoneme Identification 17% 36% 19%
Phonic Match 10% 31% 21%
Phonic Word 11% 88% 77%
Language Comprehension 6% 55% 49%
Block Commander 6% 52% 46%
Table 8
Raw Scores. Standard Scores. and Test Gains for Five Standardized Test Measures for
Subject 2
Measure Pretest Posttest Test Gain
Raw SS Raw SS SS 1 s.d.
PAT 128 65 137 69 +4
TERA-2 26 69 28 75 +6
TOLD-P:2 85 78 98 77 -1
LPT-R 32 68 50 81 +13
SCAN 100 69 122 79 +10
Note. All assessment measures had a mean of 100 with a standard deviation of 15; *indicates a standard score increase of one standard deviation or greater.
Following 8 weeks ofFFW training, posttest measures indicated gains on four
assessment measures. No tests evidenced gains of greater than one standard deviation.

Impact of Past ForWord 51
The LPT-R evidenced the largest standard score increase of 13 points, a gain of nearly
one standard deviation. The subtests of similarities, differences, and multiple meanings
demonstrated the most improvement with scores improving to within normal limits. The
SCAN documented a standard score increase of 10 points. The TOLD-P:2 results
indicated a decrease of one standard score point from pre- to posttest. Despite a raw
score increase, standard score decreased which was attributed to the change in the
subject's chronological age (7:11 pretest; 8:2 posttest). Results from the PAT evidenced
a standard score increase of four points.
Subject 3
Subject 3, 7 years 9 months, achieved the completion criteria (90%) on four of
the seven computer games. Table 9 details game completion levels. The completed
games included Circus Sequence (90%) which focused on processing of tone sweeps,
Phonic Match (94%), Phonic Word (97%), and Language Comprehension Builder (96%)
which targeted phonological, morphological, and grammatical comprehension skills.
Subject 3 participated in FFW for 7 weeks with 89% attendance (31/35 sessions).
Pretest data for Subject 3 indicated performance nearly 2 standard deviations
below the mean on the PAT and 1.5 standard deviations below the mean on the TOLD
P:2. Other testing measures were within one standard deviation of the mean. Table 10
provides the testing results for Subject 3. Strengths observed included language
processing skills. Specific weaknesses involved phonological awareness skills and
receptive and expressive language skills.

Impact of Fast ForWord 52
Table 9
Game Completion Data of Fast ForWord Games for Subject 3.
FFWGame Initial% Final% %Gain
Circus Sequence 1% 90% 89%
MacDonald's Flying Farm 8% 31% 23%
Phoneme Identification 19% 71% 52%
Phonic Match 12% 94% 82%
Phonic Word 17% 97% 80%
Language Comprehension 8% 96% 88%
Block Commander 13% 71% 58%
Table 10
Raw Scores. Standard Scores. and Test Gains for Five Standardized Test Measures for
Subject 3
Measure Pretest Posttest Test Gain
Raw SS Raw SS SS 1 s.d.
PAT 145 74 187 90 +lo * TERA-2 35 88 33 85 -3
TOLD-P 92 77 101 84 +7
LPT-R 65 93 70 97 +4
SCAN 153 117 160 123 +6
Note. All assessment measures had a mean of 100 with a standard deviation of 15; *indicates a standard score increase of one standard deviation or greater.
Subject 3 demonstrated posttest gains of greater than one standard deviation on
the PAT with increased standard scores on all subtest except graphemes. Standard score
L

Impact of Fast ForWord 53
increases were observed on three assessment measures, the TOLD-P:2, LPT-R, and
SCAN, but were not significant at the one standard deviation level. The TERA-2 results
did not indicate a positive increase in standard score.
Subject 4
Subject 4, 7 years 6 months, achieved completion criteria (90%) on four of the
seven games. Table 11 details the FFW game completion data. The four games
completed included Old MacDonald's Flying Farm (98%), Phonic Match (93%), Phonic
Word (98%), and Language Comprehension Builder (97%). Circus Sequence was
completed at the 85% level. Subject 4 participated in the FFW training program for 7
weeks with 74% attendance (26/35 sessions).
Table 11
Game Completion Data of Fast ForWord Games for Subject 4.
FFWGame Initial% Final% %Gain
Circus Sequence 1% 85% 84%
MacDonald's Flying Farm 6% 98% 92%
Phoneme Identification 16% 61% 45%
Phonic Match 12% 93% 81%
Phonic Word 14% 98% 84%
Language Comprehension 6% 97% 91%
Block Commander 10% 74% 64%
Table 12 presents testing scores for Subject 4. Weaknesses included receptive
and expressive language skills on the TOLD-P:2 and the decoding subtest of the PAT.
Testing strengths included the isolation, deletion, and graphemes subtests of the PAT and

Impact of Fast For Word 54
the association and categorizations subtest of the LPT-R.
Table 12
Raw Scores, Standard Scores. and Test Gains for Five Standardized Test Measures for
Subject 4
Measure Pretest Posttest Test Gain
Raw SS Raw SS SS 1 s.d.
PAT 147 86 150 76 -10
TERA-2 34 104 33 85 -19
TOLD-P 90 77 104 86 +9
LPT-R 54 88 61 90 +2
SCAN 141 101 134 88 -13
Note. All assessment measures had a mean of 100 with a standard deviation of 15; *indicates a standard score increase of one standard deviation or greater.
Subject 4 did not evidence significant gains on posttest measures. A standard
score increase of four points was noted on the TOLD-P:2. The LPT-R was the other
measure which evidenced a minimal increase in standard score of two points. Subject 4
was not attentive during the posttest procedures and expressed displeasure in
participating.
Subject 5
Subject 5, 8 years 0 months, achieved completion criteria (90%) for one game,
Language Comprehension Builder at the 96% level. Table 13 represents FFW game
completion percentages. Block Commander achieved a 71 % completion followed by
Phonic Word at 55% and Phonic Match at 50% completion. Subject 5 participated in the

Impact of Fast ForWord 55
FFW training program for 7 weeks with 80% attendance (28/35 sessions).
Table 13
Game Completion Data of Fast ForWord Games for Subject 5.
FFWGame Initial% Final% %Gain
Circus Sequence 0% 0% 0%
MacDonald's Flying Farm 2% 34% 32%
Phoneme Identification 16% 37% 21%
Phonic Match 12% 50% 38%
Phonic Word 17% 55% 38%
Language Comprehension 8% 96% 88%
Block Commander 12% 71% 59%
Subject 5 initially performed within one standard deviation of the mean on the
TOLD-P:2, LPT-R, and SCAN. The standard scores for the PAT and TERA-2 were
below 1.5 standard deviations of the mean. Table 14 provides testing scores for Subject
5. Weaknesses for Subject 5 included the oral vocabulary, sentence imitation,
grammatical completion, word discrimination and articulation subtests of the TOLD-P:2.
Strengths included language and auditory processing skills.

Impact of Fast ForWord 56
Table 14
Raw Scores. Standard Scores. and Test Gains for Five Standardized Test Measures for
Subject 5
Measure Pretest Posttest Test Gain
Raw SS Raw SS SS 1 s.d.
PAT 155 78 174 83 +5
TERA-2 31 82 35 87 +5
TOLD-P 113 88 133 93 +5
LPT-R 60 89 67 93 +4
SCAN 145 105 138 91 -14
Note. All assessment measures had a mean of 100 with a standard deviation of 15; *indicates a standard score increase of one standard deviation or greater.
Subject 5 achieved increased standard scores on four of the five testing
measures, although none of the gains met the significance level of one standard
deviation. The SCAN was the only assessment measure in which gains were not
observed. A five point increase in standard score was evidenced on the PAT, TERA-2,
and TOLD-P:2 while the LPT-R indicated a four point gain. The oral vocabulary, word
discrimination, and word articulation subtests of the TOLD-P:2 accounted for the
increase in standard score evidenced on this measure.
Summaries
A summary table of all subjects' individual game completion is presented in
Table 15. The FFW dismissal criteria of 90% on five of the seven games was not
attained by any of the 5 subjects.

Impact of Fast ForWord 57
Subjects 3 and 4 completed the most FFW games of the experimental subjects
with four games reaching the 90% criterion level. These two subjects finished three of
the same games which included Phonic Match, Phonic Word, and Language
Comprehension Builder. Subject 3 also completed Circus Sequence while Subject 4
completed Old MacDonald's Flying Farm. Subject 5 completed one FFW game,
Language Comprehension Builder whereas Subjects 1 and 2 did not meet completion
criteria for any of the seven games.
Of the FFW games, Language Comprehension Builder had the highest
completion rate with three of the five subjects finishing the game. Interestingly, none of
the five subjects achieved the 90% level for Phoneme Identification or Block
Commander.
Table 16 provides a summary of the subjects' standard score gain performance
on the five assessment measures as well as an average gain for each measure. Subjects 1
and 3 increased standard scores by a minimum of one standard deviation on three
assessment measures. The testing measures differed for each subject as Subject 1
improved standard scores by a minimum of one standard deviation on the TERA-2 and
LPT-R while Subject 3 improved standard scores on the PAT. The remaining three
subjects did not improve their standard scores by a minimum of one standard deviation
on any of the assessment measures. As a group, the average standard score gains were
highest for the LPT-R and TOLD-P:2, with increases reported at 8.00 and 4.00,
respectively.

Impact of Fast For Word 58
Table 15
Five Subjects' Fast ForWord Percentage(%) Gains for Each Game
FFWGame Subjects
Subject 1 Subject 2 Subject 3 Subject 4 Subject 5
Circus Sequence 0% 9% 90%* 85% 0%
Flying Farm 9% 68% 31% 98%* 34%
Phoneme 7% 36% 71% 61% 37% Identification
Phonic Match 25% 31% 94%* 93%* 50%
Phonic Word 16% 88% 97%* 98%* 55%
Language 15% 55% 96%* 97%* 96%* Comprehension
Block 50% 52% 71% 74% 71% Commander
Note. * indicates 90% completion criteria was achieved.
Table 16
Summary of Five Subjects' Test Gain Performance and Average Gain on Five Assessment
Measures.
Measure Subjects
Subject 1 ** Subject 2 Subject 3 Subject 4** Subject 5 Avg Gain
PAT 0 +4 +16 * -10 +5 +3
TERA-2 +20 * +6 -3 -19 +5 +1.8
TOLD-P:2 0 -1 +7 +9 +5 + 11
LPT-R +17 * +13 +4 +2 +4 +8
SCAN +5 +10 +6 -13 -14 -1.2
Note. All assessment measures had a mean of 100 with a standard deviation of 15; * one standard deviation increase; * * indicates subject was not cooperative during posttesting procedures.

Impact of Fast ForWord 59
Table 17 provides a summary of the control subjects' pre- and posttest standard
scores and average gain on the five assessment measures. Control Subject 1 increased
standard scores by a minimum of one standard deviation on two different assessment
measures, the TERA-2 and SCAN. The other two control subjects did not improve
standard scores by a minimum of one standard deviation on any of the five assessment
measures. A large variability in standard score gains was noted on the SCAN with two
control subjects, Subjects 2 and 3, significantly decreasing scores upon posttest.
Group means and standard deviations for both the experimental and control
subjects on each assessment measure were calculated. Table 18 presents the group means
and standard deviations for each group. As a group, the FFW subjects' largest standard
score average increases were 8 points on the LPT-R and 4 points on the TOLD-P:2.
These subjects' evidenced a minimal average gain of 3 standard score points on the PAT
and approximately 2 points on the TERA. No positive average increase in standard score
was observed on the SCAN.
The PAT results noted a larger mean increase in group means for the control
group (8.00) than the experimental group (3.00). The standard deviation for the
experimental subjects was large (9.38) with the standard deviation for the control subjects
smaller (5.29). The TERA-2 results mirrored those found for the PAT. The control
subjects demonstrated a larger mean standard score improvement (6.67) than the
experimental subjects (1.80). The standard deviation was large for both groups. The
TOLD-P:2 results were similar to the TERA-2 with the most gain evidenced for the
control group. The control group mean was 10.33 and the experimental group mean was
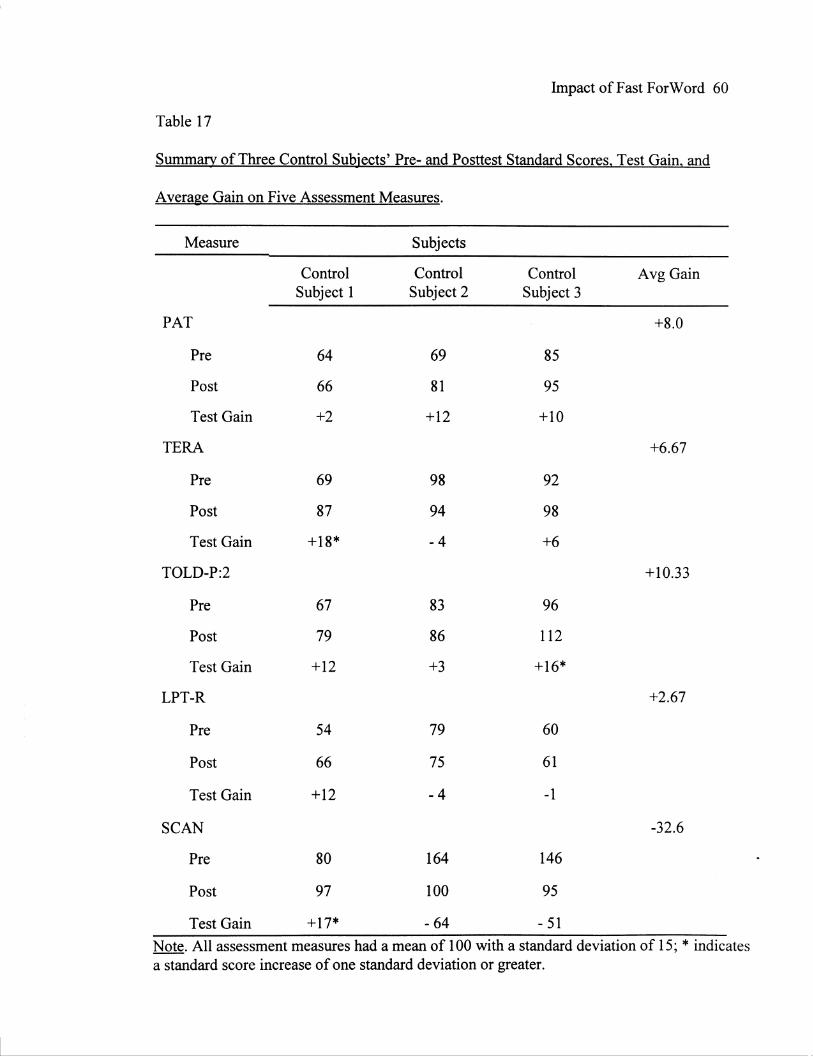
Impact of Fast ForWord 60
Table 17
Summary of Three Control Subjects' Pre- and Posttest Standard Scores. Test Gain. and
Average Gain on Five Assessment Measures.
Measure Subjects
Control Control Control Avg Gain Subject 1 Subject 2 Subject 3
PAT +8.0
Pre 64 69 85
Post 66 81 95
Test Gain +2 +12 +10
TERA +6.67
Pre 69 98 92
Post 87 94 98
Test Gain +18* -4 +6
TOLD-P:2 +10.33
Pre 67 83 96
Post 79 86 112
Test Gain +12 +3 +16*
LPT-R +2.67
Pre 54 79 60
Post 66 75 61
Test Gain +12 -4 -1
SCAN -32.6
Pre 80 164 146
Post 97 100 95
Test Gain +17* -64 - 51
Note. All assessment measures had a mean of 100 with a standard deviation of 15; * indicates a standard score increase of one standard deviation or greater.

Impact of Fast ForWord 61
4.00. Unlike the PAT and TERA-2, the standard deviation for the TOLD-P:2 was
smallest for the experimental subjects (4.36). The LPT-R demonstrated the greatest
increase for the experimental group (8.00) with a slightly larger standard deviation (6.60)
than the TOLD-P:2. For the control group, the average improvement in standard score
was less (2.67) although the standard deviation about the mean was very comparable to
that of the experimental group (6.66). The SCAN was the only assessment measure for
both groups where group mean gains were negative numbers. The experimental subjects
evidenced a mean decrease in standard score (-1.20) with a large standard deviation
(11.39). For the control subjects a much larger average decrease was observed (-32.67)
with the standard deviation about the mean being extremely variable (43.50).
Table 18
Group Means and Standard Deviations for Testing Gains of Five Subjects.
Group PAT TERA-2 TOLD-P:2 LPT-R SCAN
Experimental 3.00 (9.38) 1.80 (14.27) 4.00 (4.36) 8.00 (6.60) -1.20(11.39)
n=5
Control 8.00 (5.29) 6.67 (11.02) 10.33 (6.66) 2.67 (6.66) -32.67 (43.50)
n=3
Note. Standard deviations reported in parentheses; all assessment measures had a mean of 100 with a standard deviation of 15.

Impact of Fast ForWord 62
Chapter V
Discussion
The primary purpose of the present study was to determine the impact of Fast
ForWord on individual children's phonological awareness and reading skills. Another
purpose was to determine the effect of Fast For Word on children's overall language skills
and auditory perceptual skills.
Examination of the Fast ForWord game completion data revealed several
interesting findings. Of the seven FFW games, Language Comprehension Builder had the
highest achievement rate as 3 subjects met completion criteria. Phoneme Identification
and Block Commander were not completed by any of the 5 subjects. According to the
FFW data obtained, none of the 5 subjects achieved the minimum of 90% completion on
five of the seven exercises. However, two subjects, Subjects 3 and 4, completed four of
the training exercises, whereas another two subjects, Subjects 1 and 2, did not meet
completion criteria for any of the seven exercises.
When comparing subjects who completed four of the seven FFW exercises
(Subjects 3 and 4) with those subjects who did not complete any of the seven games
(Subjects 1 and 2), similarities were noted. Subjects 3 and 4, who had chronological ages
of 7 :9 and 7 :6, which were similar to the chronological ages of Subjects 1 and 2, 6: 10 and
8:2. Subjects 3 and 4's (who completed four FFW games) initial language ages, as
measured by the TOLD-P:2, were similar at 5:9 and 5:6, while Subjects 1 and 2's initial
language (who completed no games) ages differed at 4:6 and 6:1, respectively.
Additionally, FFW average initial game percentages for Subjects 3 and 4's were 11.1 %
and 9.3%, which were slightly higher than Subjects 1 and 2's average initial game

Impact of Fast ForWord 63
percentages at 7 .1 % and 7. 7%, respectively .
Examination of the standardized test results also revealed several interesting
findings. As a group, the experimental subjects evidenced the most gain on the Test of
Language Development-Primary and the Language Processing Test-Revised; however,
the increases were not significant at the one standard deviation level. Noticeable
differences between the experimental and control subjects on posttest measures were not
found. Posttest data indicated that two subjects, Subjects 1 and 3, increased standard
scores on at least one assessment measure by one standard deviation or greater. Subject 1
increased standard scores on the TERA-2 and LPT-R while Subject 3 improved standard
scores on the PAT. Interestingly, none of the other subjects increased standard scores by
at least one standard deviation on any of the five measures.
No clear pattern was observed between subjects who increased standard scores
on at least one assessment measure (Subjects 1and3) versus subjects who did not
evidence a significant gain (Subjects 2, 4, and 5). Subjects 1 and 3's, chronological ages
were 6: 10 and 7:9 with language ages of 4:6 and 5:9, respectively. Subjects 2, 4, and S's
chronological ages were 8:2, 7:6, and 8:0 with language ages of 6:1, 5:6, and 6:9. Of the
two subjects who demonstrated standard score gains (Subject 1) did not complete any of
the seven FFW exercises, while Subject 3 met criteria on four of seven games. Of the
three subjects who did not demonstrate significant standard scores gains, one subject,
Subject 4, completed four of the seven exercises, Subject 5 completed one exercise, and
Subject 2 did not complete any of the exercises.
Results from this study do not support the early Fast ForWord research that

Impact of Fast For Word 64
documented significant gains of 1 Yz to 2 years in language skills in 4 to 8 weeks
following 100 minutes per day of training for 5 days per week (Tallal & Merzenich, 1997;
Scientific Learning Corporation, 1997, 1998). Experimental subjects' largest mean
increases in posttest standard scores were on the LPT-R, and TOLD-P:2. However, these
standard score mean gains were eight and four points, respectively, much lower than the
previously reported increases by the FFW developers. On the phonological awareness
and reading assessment measures, the mean improvements for the experimental group
were minimal at three and approximately two standard score points.
Upon completion of the FFW program and close analysis of the assessment
results, specific clinical implications were evident. One implication demonstrated was
that some children toward the lower to middle end of the recommended chronological
ages (FFW is recommended for children ages 4 to 13) may not be appropriate for FFW
training. Similarly, children may need to have certain prerequisite language skills to
benefit from the training.
A specific strength of the study was the detailed information provided on
individual subjects' performance rather than group measures which mask individual
variation. The published FFW field test study (Tallal & Merzenich, 1997) presented large
group results which did not detail individual subjects' FFW performance and assessment
measure gains. The data presented by Tallal and Merzenich (1997) grouped children with
a wide range of diagnostic labels preventing professionals from distinguishing the profile
for children who achieved the most benefit from the training program. Interestingly, all 5
experimental subjects initially appeared to be good candidates for the FFW program.

Impact of Fast ForWord 65
However, none of the experimental subjects met FFW's completion criteria (90% on at
least 5of7 training games) and only 2 subjects made significant gains on any of the five
assessment measures. These findings demonstrate the need for the profiles of successful
children to be delineated by Scientific Learning Corporation and shared with parents and
professionals.
Another strength of this study was the new information provided about FFW' s
impact on phonological awareness and reading skills. The developers of FFW have
stated that the program can aid children with specific phonological awareness skills
which then facilitate successful reading skills (Scientific Learning Corporation, 1997,
1998). Authors also contend that all of the FFW exercises facilitate recognition of
phonemes in different positions of a word; however, the exercises do not directly teach
reading (Scientific Learning Corporation, 1997, 1998). At the time the present study was
conducted, a major discrepancy in regard to this information was noticed. In the FFW
developers' published studies on the program, measures of phonological awareness were
not included in their test protocol although statements were made, and still are today,
regarding the program's effectiveness in training phonological awareness skills.
The current study included phonological awareness and reading assessment
measures and results, therefore, may provide insight into the effectiveness of Fast
ForWord on those specific skills. Results demonstrated that, as a group, the children who
participated in FFW did not increase their standard scores on either of the primary testing
measures by a minimum of one standard deviation. Individually, Subject 3's PAT
standard score increased by 16 points, while Subject l's TERA-2 standard score improved

Impact of Fast For Word 66
by 20 points. It seems logical that FFW could impact these skills since three exercises
(Phoneme Identification, Phonic Word, and Phonic Match) focus on specific
phonological skills (phoneme identification in isolation, syllables, and words).
Nevertheless, the data obtained in the current study did not demonstrate significant gains
in these skills for the subjects as a group. Interestingly, the control subject group
increased the PAT standard scores by an average of eight points and the TERA-2 standard
score by nearly seven points. The control group's mean gain was higher than the
experimental subjects which minimally improved the PAT standard score by three points
and TERA-2 by approximately two points.
Several weaknesses existed with the subject pool for the present study. Only
five children participated in the FFW program. It is difficult to draw definitive
conclusions regarding the effectiveness of FFW due to th~ small number of experimental
subjects. Two of the experimental subjects, Subjects 1 and 4, were non-compliant during
posttest procedures. Subject 1 often declared, "I don't want to do this." Re-direction
techniques were used with Subject I repeatedly throughout posttest assessment. Methods
such as playing games and taking breaks were employed on several occasions during each
test. Similar techniques were also used with Subject 4 but with less frequency than with
Subject 1. Subject 4 demonstrated decreased posttest scores on three measures with
minimal gain noted on the other two.
Second, the number of control subjects was not equal to the number of
experimental subjects. Two of the three control subjects incorporated into the study were
not posttested before the school year began due to late identification. Posttesting
Impact of Fast For Word 67
occurred within the :first 5 weeks of the school year. Although the control subjects'
increased posttest scores were not likely to be due to the short period of time enrolled in
the educational curriculum, the fact exists as a weakness in the study.
Another weakness of the study was the use of the SCAN in the test protocol.
The average gain on the SCAN for both the experimental and control subjects was
negative with a large variation about the mean. In the development of the SCAN, Keith
(1986) determined test-retest reliability data following a six month retest interval and
determined that SCAN scores may be unreliable. Amos and Humes (1998) further
researched the stability of SCAN outcomes using 4 7 children, ages 6 to 9 years, with a 6
to 7 week retest interval (Retest interval in the current study was 8 to 9 weeks). Results
from the Amos and Humes (1998) study indicated that raw, standard, and composite
scores significantly improved upon retest for two of the three subtests. Percentile ranks
and age-equivalent outcomes were also noted to increase significantly. The investigators
stated that it appeared a second administration of the SCAN could provide a better
estimate of an individual child's best performance. The article's findings were not
published at the time the present study was initiated and, therefore, did not impact test
protocol selection.
Prior to the development of FFW, the authors hypothesized that the deficits
underlying receptive difficulties in language-learning impaired children arose from a
temporal processing deficit. The researchers defined this deficit as expressed by limited
abilities at identifying some brief phonetic elements represented in specific speech
contexts and by poor performanct!s at identifying or sequencing short-duration acoustic

Impact of Fast ForWord 68
stimuli (Merzenich, et al., 1996). The current FFW program was developed following
two trial studies (Merzenich, et al., 1996; Tallal, Miller, et al., 1996) which indicated that
implementation of an intense schedule of practice trials undertaken for a significant daily
exercise period over a series of successive days could, in effect, "remodel" the brain so a
child could effectively perceive speech stimuli. The premise was that, if language
impaired children developed competent speech reception, other language skills would
quickly improve as well (Scientific Learning Corporation, 1997). The results obtained in
the present study suggest that perhaps changes in temporal processing ability, the
proposed underlying difficulty for language impaired children, do not occur with all
children who participate in the training program. Individual and group results from the
on the SCAN from the current study did not support this concept. If temporal auditory
processing ability was altered by Fast ForWord, SCAN results should have indicated
gains in those skills. However, both the experimental and control subject group means
for the SCAN did not indicate positive increased scores (-1.20 and -32.67, respectively).
The results from this study demonstrated that, as a group, the experimental subjects'
language processing skills improved more than their auditory processing skills, as
measured by the LPT-R (8.00) and the SCAN (-1.20). Interestingly, as a group, the
control subjects evidenced minimal increases in language processing skills, as measured
by the LPT-R (2.67). These results may indicated that FFW modifies language
processing ability rather than temporal auditory processing ability.
Susan Brady (1998), a professor of psychology at the University of Rhode Island,
has studied speech perception and the phonological difficulties associated with reading

Impact of Fast ForWord 69
disabilities. She questions the accuracy of the premise proposed by Tallal and her
colleagues' in regard to an underlying temporal processing deficit in language impaired
children. Brady emphasized that if the FFW producers' premise is the existence of a
temporal processing deficit, then potential subjects should be identified as having those
deficits before enrolling in the FFW program.
From the time this study began, Fast ForWord developers have been involved in
further research and new program developments. Fast ForWord Two was introduced in
the fall of 1998. This additional program has been reported to build upon and strengthen
the language and reading skills that children acquire through Fast ForWord. The sequel
program is composed of five exercises that are designed to accelerate the development of
reading skills such as recognizing sound/letter correspondence, learning to decode words
faster and easier, listening and reading comprehension, word finding, working memory
and much more (Scientific Learning Corporation, 1998). Fast ForWord Two incorporates
words, whereas Fast ForWord focuses on speech sounds.
The results obtained in this study highlight several areas for future research.
Additional studies should be conducted to provide further insight into the impact Fast
ForWord has on phonological awareness and reading skills, as well as in other areas.
Brady (1998) emphasized the need for more research regarding the Fast ForWord training
program. For example, are all FFW games appropriate for all age children? Results from
the current study noted two games on which none of the five children met the completion
criteria of 90%, Phoneme Identification and Block Commander. It could be that some
children may not be neurologically ready or possess the necessary language age needed to

Impact of Fast ForWord 70
succeed on these games. Another area within the FFW program that needs to be
examined is the lack of control by the en-site professional. Currently, speech-language
pathologists have no control over the training exercises determined for each day the
exercises are pre-determined by SLC. If a child continually struggles with a specific
game, despite one-on-one training, and motivation to play other FFW games is effected,
the SLP can not alter the program to omit the difficult game. In a sense, this lack of
control violates good treatment principle. If children were seen in one-on-one therapy
and were continually struggling with a task, would we not alter the treatment method or
use stimuli at a lower level in order for the child to succeed?
The demand for comparative research with other programs that directly target
language, phonological awareness, and reading skills improvement, is another area for
future studies. It is also essential that studies be conducted with larger numbers of
subjects to better determine the speech and language profile of children who can receive
the most benefit from the program. Previous research studies conducted by the Fast
ForWord developers have incorporated subjects who exhibited a wide range of diagnostic
labels (e.g., attention deficit disorder, autism, language impairment, and central auditory
processing disorder); however, specific results for each disability category have not been
provided by the company (Tallal & Merzenich, 1997). The national field test study
(Tallal & Merzenich, 1997) results did not provide specific speech and language
characteristics for different disorder areas; rather, all children were grouped into a single
category. Data indicated that significant mean gains were found in subjects' receptive
and expressive language abilities and discrimination abilities, but identification of which

Impact of Fast ForWord 71
children evidenced the most gains in those skill areas was not provided. Information
about characteristics of individual children who did not benefit was also not included.
Conversation with a part-time employee of the Scientific Learning Corporation
described studies presently being conducted to provide additional insight into the
effectiveness of the program for children with specific impairments; however, this data
has not been made available to consumers and professionals to date (A. Osterling,
personal communication, February 19, 1999). Currently, an individual speech-language
pathologist must justify the use of this training program based on limited available data.
Considering the high cost of the program and the lack of research available to substantiate
effectiveness in specific disorder areas, concerns have been raised among many
practitioners. As of September 16, 1998, nearly 10,000 children have used Fast ForWord
(Scientific Leaming, 1998). Therefore, Scientific Leaming Corporation could draw from
a large database of individual children's results, which could then be analyzed to provide
more specific details about successful and unsuccessful client's profiles. This would
provide speech language pathologists with a more accurate idea of which language
impaired children would be potential candidates for the FFW program.
In addition to investigation into the appropriate speech and language profile,
future research should also address the language age of children who receive maximum
benefit from FFW. The Scientific Leaming Company has targeted a broad chronological
age range of children (ages 4 to 13) for which the FFW program may be beneficial. The
present study included children in the middle of the recommended chronological age
range but toward the lower end of the language age range (ages 4:6 to 6:9). Throughout

Impact of Fast ForWord 72
the progression of FFW, it was observed that Subject 1 (language age of 4:6) struggled
with certain basic skills that may be necessary for program success (e.g., attention span,
motivation, game skill understanding, basic language skills). Since Subject l's language
age was toward the lower limit of FFW's chronological age span, it is recommended that
future research evaluate a successful child's language age.
A final implication for future research is related to functional gains made by a
child after completion of the FFW program. Longitudinal studies would provide data to
determine whether gains evidenced from FFW are generalized into the classroom and
home environments. The inclusion of parent and teacher reports of a child's speech and
language abilities both pre- and post participation would contribute valuable insight into
FFW' s impact on other skills. The published longitudinal data from the developers
(Tallal, Miller, et al., 1996; Tallal & Merzenich, 1997) was obtained at six weeks and six
months following FFW completion and reported only standardized test data. Data
obtained six months or more following FFW training is critical to determine the long
term impact of the program.
As this study demonstrated, the need for future research evaluating the
effectiveness of the training program is imperative. It will also be important to carefully
evaluate Fast ForWord Two and its impact on phonological awareness and reading skills
in future studies. Perhaps Brady (1998) provided the most appropriate statement, "We
(speech-language pathologists) have the responsibility to offer the best resources to
children who need help and to keep up with new developments. At the same time, we
need to seek out the best scientific evidence to not falsely raise the hopes of worried

Impact of Fast ForWord 73
parents and to not obligate vulnerable families to expensive interventions of questionable
value."

Impact of Fast ForWord 74
References
Anderson, K. C., Brown, C. P., & Tallal, P. (1993). Developmental language
disorders: Evidence for a basic processing deficit. Current Opinions in Neurology and
Neurosurgery. 6, 98-106.
Aram, D. & Hall, N. (1989). Longitudinal follow-up of children with preschool
communication disorders: Treatment implications. School Psychology Review. 18, 487-
501.
Banks, W., Oka, E., & Shugarman, S. (1981). Recoding of printed words to
internal speech: Does recoding come before lexical access? In 0. Tzeng & H. Singer
(Eds.), Perception of print: Reading research in experimental psychology (pp. 13 7-170).
Hillsdale, NJ: Erlbaum Associates.
Barron, R. W. (1981). Development of visual word recognition: A review. In G.
Mackinnon & T. Waller (Eds.), Reading research: Advances in theory and practice (Vol.
1). New York: Academic Press.
Bird, J., Bishop, D., & Freeman, N. (1995). Phonological awareness and literacy
development in children with expressive phonological impairments. American Speech
Language-Hearing Association, 446-462.
Bishop, D. V. M. (1990). Handedness, clumsiness and developmental language
disorders. Neuropsychologia. 28, 681-690.
Blachman, B. (1991). Early intervention for children's reading problems:
Clinical applications of the research in phonological awareness. Topics in Language
Disorders. 12 (1 ), 51-65.

Impact of Fast ForWord 75
Blachman, B. A. (1994). Early literacy acquisition: The role of phonological
awareness. In G. P. Wallach & K. G. Butler (Eds.), Language learning disabilities in
school-aged children and adolescents: Some principles and applications (pp. 253-274).
New York: Macmillan College Publishing Company.
Brady, S. (Speaker). (1998). A close look at the science behind Fast ForWord
(Cassette Recording No. HL8.852). San Antonio, TX: American Speech-Language
Hearing Association National Convention.
Brady, S. A., Scarborough, H., & Shankweiler, D. P. (1996, June 17). A
perspective on research reports of treating language-learning impairment. Advance for
Speech-Language Pathologists & Audiologists. 6, 16-17.
Brady, S. A., & Shankweiler, D. P. (1991). Phonological processes in literacy.
Hillsdale, NJ: Lawrence Erlbaum Associates.
Catts, H. W. (1993). The relationship between speech-language impairments and
reading disabilities. Journal of Speech and Hearing Research. 36, 948-958.
Catts, H. W., & Kamhi, A.G. (1986). The linguistic basis ofreading disorders:
Implications for the speech-language pathologist. Language. Speech. and Hearing
Services in Schools. 17 (4), 329-341.
Conrad, R. (1964). Acou.,tic confusions in immediate memory. British Journal of
Psychology. 5, 75-84.
Curtiss, S., Katz, W., & Tallal, P. (1992). American Speech-Language-Hearing
Association 35, 373.
Curtiss, S., & Yamada, J. Curtiss and Yamada Comprehensive Language

Impact of Fast ForWord 76
Evaluation-Receptive. (unpublished test).
Eden, G. F., Stein, J. F., Wood, H. M., & Wood, F. B. (1995). Temporal and
spatial processing in reading disabled and normal children. Cortex. 31, 4 51-468.
Farmer, M. E., & Klein, R. (1995). The evidence for a temporal processing
deficit linked to dyslexia: A review. Psychonomic Bulletin & Review. 2, 460-493.
Frith, U. (1985). Beneath the surface of developmental dyslexia. In K. Patterson,
J. Marshall, & M. Coltheart (Eds.), Surface dyslexia: Neuropsychological and cognitive
studies of phonological reading (pp. 123-159). Rotterdam: Rotterdam University Press.
Galaburda, A.M., & Kemper, T.L. (1979). Cytoarchitectonic abnormalities in
developmental dyslexia. Annals of Neurology. 6, 94-100.
Haggerty, R., & Stamm, J.S. (1978). Dichotic auditory fusion levels in children
with learning disabilities. Neuropsychologia 16, 349-360.
Hall, P.K., & Tomblin, J.B. (1978). A follow-up study of children with
articulation and language disorders. Journal of Speech and Hearing Disorders. 43, 227-
241.
Haynes, C., & Naidoo, S. (1991). Children with specific speech and language
impairment. Clinics in developmental medicine no. 119. New York: Cambridge
University Press.
Hynd, G. & Cohen, M. (1983). Dyslexia: Neuropsychological theory. research.
and clinical differentiation. New York: Grune and Stratton.
Hughes, M., & Sussman, H.M. (1983). An assessment of cerebral dominance in
language-disordered children via a time-sharing paradigm. Brain and Language. 19, 48-
64.

Impact of Fast ForWord 77
Johnson, R.B., Stark, R.E., Mellitis, E.D., & Tallal, P. (1981). Neurological
status of language-impaired and normal children. Annals of Neurology. 10, 159-163.
Kamhi, A.G., & Catts, H. W. (Eds.) (1991). Reading disabilities: A
developmental language persepective. Needham Heights, MA: Little, Brown and
Company (Inc.).
Kamhi, A.G., Lee, R. F., & Nelson, L. K. (1985). Word, syllable, and sound
awareness in language-disordered children. Journal of Speech and Hearing Disorders. 50,
207-212.
Katz, J., & Wilde, L. (1985). Auditory perceptual disorders in children. In J.
Katz (Ed.), Handbook of clinical audiology (3rd ed., pp. 664-688). Baltimore: Williams &
Wilkins.
Keith, R. W. (1986). A screening test for auditozy processing disorders. The
Psychological Corporation: Harcourt Brace Jovanovich, Inc.
Kintsch, W., & Kozminsky, E. (1977). Summarizing stories after reading and
listening. Journal of Educational Psychology. 69, 491-499.
Levi, G., Capozzi, F., Fabrizi, A., & Sechi, E. (1982). Language disorders and
prognosis for reading disabilities in developmental age. Perceptual and Motor Skills. 54,
1119-1122.
Locke, J. L. ( 1994 ). Gradual emergence of developmental language disorders.
Journal of Speech and Hearing Research. 37, 608-616.
Locke, J. L. (1997) A theory of neurolinguistic development. Brain and
Language.58,265-326.

Impact of Fast ForWord 78
Lubert, N. (1981). Auditory perceptual impairments inchildren with specific
language disorders: A review of the literature. Journal of Speech and Hearing Disorders,
46, 3-9.
Magnusson, E., and Naucler, K. (1990). Reading and spelling in language
disordered children-linguistic and metalinguistic prerequisites: report on a longitudinal
study. Clinical Linguistics & Phonetics, 4(1), 49-61.
Mccroskey, R.L., & Kidder, H.C. (1980). Auditory fusion among learning
disabled, reading disabled, and normal children. Journal of Learning Disabilities, 13, 18-
25.
Menyuk, P., Chesnick, M., Liebergott, J.W., Korngold, B., D' Agostino, R., &
Belanger, A. (1991). Predicting reading problems in at-risk children. Journal of Speech
and Hearing Research, 34, 893-903.
Merzenich, M., Jenkins, W., Johnston, P. S., Schreiner, C., Miller, S. L., &
Tallal, P. (1996). Temporal processing deficits of language-learning impaired children
ameliorated by training. Science, 271, 77-80.
Miller, S., Merzenich, M. M., Saunders, G., Jenkins, W. M., & Tallal, P. (1996).
Improvements in language abilities with training of ch\ldren with both attentional and
language impairments. Society for Neuroscience, 23, 490.
Mody, M., Studdert-Kennedy, M., & Brady, S.A. (1997). Speech perception
deficits in poor readers: Auditory processing or phonological coding? The Journal of
Experimental Child Psychology, 64, 199-231.
Newcomer, P. L., & Hammill, D. D. (1988). The Test of Language

Impact of Fast ForWord 79
Development-Primary (2nd ed.). Austin, TX: Pro-Ed.
Perfetti, C., & McCutchen, D. (1982). Speech processes in reading. In N. Lass
(Ed.), Speech and language: Advances in basic research and practice (Vol. 7, pp. 23 7-
269). New York: Academic Press.
Pinheiro, M. L. ( 1977). Tests of central auditory function in children with
learning disabilities. In R. W. Keith (Ed.), Central auditory dysfunction (pp. 43-68). New
York: Grune and Stratton.
Powell, R. P., & Bishop, D. V. M. (1992). Clumsiness and perceptual problems
in children with specific language impairment. Developmental Medicine and Child
Neurology, 34, 755-765.
Ratner, V. L. & Harris, L. R. (1994). Understanding language disorders: The
impact on learning (pp. 197-198). Eau Claire, WI: Thinking Publications.
Reed, M.A. (1989). Speech perception and the discrimination of brief auditory
cues in reading disabled children. Journal of Experimental Child Psychology, 48, 270-
292.
Reid, D. K., Hresko, W. P., & Hammill, D. D. (1991). Test of Early Reading
Ability (2nd ed.). Austin, TX: Pro-Ed.
Rees, N. S. (1973). Auditory processing factors in language disorders: The view
from Procrustes' bed. Journal of Speech and Hearing Disorders. 38, 304-315.
Rees, N. S. (1981). Saying more than we know: Is auditory processing disorder a
useful concept? In R. W. Keith (Ed.), Central auditory and language disorders in children
(pp. 94-120). San Diego: College-Hill Press.
Impact of Fast For Word 80
Richard, G. J., & Hanner, M. A. (1995). Language Processing Test (Rev. ed.).
East Moline: LinguiSystems.
Rissman, M., Curtiss, S., & Tallal, P. (1990). School placement outcomes of
young language impaired children. Journal of Speech-Language Pathology & Audiology,
H._(2), 49-58.
Robertson, C. & Salter, W. (1997). The phonological awareness test. East
Moline, IL: LinguiSystems.
Scientific Learning Corporation. (1997). Fast ForWord certification seminar
manual [manual]. Berkley, CA.
Scientific Learning Corporation. (1998). Fast ForWord publications [hand-outs].
Berkeley, CA.
Silva, P.A., Williams, S., & McGee, R. (1987). A longitudinal study of children
with developmental language delay at age three: Later intelligence, reading, and behavior
problems. Developmental Medical Child Neurology, 29, 630-640.
Stackhouse, J. ( 1982). An investigation of reading and spelling performance on
speech disordered children. British Journal of Disorders of Communication, 17, 53-60.
Stackhouse, J. (1997). Phonological awareness: Connecting speech and literacy
problems. In Hodson, B. and Edwards, M. (Eds.), Perspectives in Applied Phonology,
154-190.
Stark, R. E., Bernstein, L. E., Condino, R., Bender, M., and Tallal, P., Catts, H.
(1984). Four-year follow-up study oflanguage impaired children. Annals of Dyslexia,
34, 49-68.

Impact of Fast For Word 81
Stark, R. E., & Heinz, J. M. (1996). Perception of stop consonants in children
with expressive and receptive-expressive language impairments. Journal of Speech and
Hearing Research, 39, 676-686.
Stedman, L., & Kaestle, C. (1987). Literacy and reading performance in the U.S.
from 1880 to present. Reading Research Quarterly, 22, 8-46.
Studdert-Kennedy, M., & Mody, M. (1995). Auditory temporal perception in the
reading impaired: A critical review of the evidence. Psychonomic Bulletin & Review, 2,
508-514.
Tallal, P., Miller, S., & Fitch, R. H. (1993). Neurobiological basis of speech: A
case for the preeminence of temporal processing. In P. Tallal, A. M. Galaburda, R.R.
Llinas, & C. Von Euler (Eds.), Temporal information processing in the nervous system:
Special reference to dyslexia and dysphasia (pp. 27-47). Annals of the New York
Academy of Sciences, Volume 682, New York: New York Academy of Sciences.
Tallal, P., & Merzenich, M. (1997, November). Fast ForWord Training for
Children with Language Problems: National field trial results. Paper presented at the
National Convention of the American-Speech-Language-Hearing Association.
Tallal, P., Miller, S.L., Bedi, G., Byma, G., Wang, X .. S. S. Nagarajan,
Schreiner, C., Jenkins, W.M., & Merzenich, M. (1996). Language comprehension in
language-learning impaired children improved with acoustically modified speech.
Science, 271, 81-84.
Tallal, P., Saunders, G., Miller, S., Jenkins, W. M., Protopapas, A., &
Merzenich, M. (1996). Rapid training-driven improvement in language ability in autistic

Impact of Fast ForWord 82
and other PDD children. Society for Neuroscience. 23, 490.
Tobey, E. A., & Cullen, J. K., Jr. (1984). Temporal integration of tone glides by
children with auditory-memory and reading problems. Journal of Speech and Hearing
Research. 27, 527-533.
Tomblin, J.B. (1996). The big picture of SLI: Results of an epidemiological
study of SLI among kindergarten children. Paper presented at the 17th Annual
Symposium on Research in Child Language Disorders, Madison, WI.
Vellutino, F. R., & Scanlon, D. M. (1987). Linguistic coding and reading ability.
In S. Rosenberg (Ed.), Advances in applied psycholinguistics. vol. 1. disorders of first
language development (pp. 1-68). New York: Cambridge University Press.
Vellutino, F. R., & Scanlon, D. M. (1989). Auditory information processing in
poor and normal readers. In J. J. Dumont & H. Nakken (Eds.), Learning disabilities.
volume 2. cognitive. social and remedial aspects (pp. 19-46). Amsterdam: Swets &
Zeitlinger.
Wheeler, T., & Watkins, E. (1979). A review of symptomology. Dyslexia
Review. 2 (1), 12-16.
Willeford, J. A. (1977). Assessing central auditory behavior in children: A test
battery approach. In R. W. Keith (Ed.), Central auditory dysfunction (pp. 43-72). New
York: Grune & Stratton.
Wright, B. A., Lombardino, L. J., King, W. M., Puranik, C. S., Leonard, C. M.,
& Merzenich, M. M. (1997). Deficits in auditory temporal and spectral resolution in
language-impaired children. Nature. 387, 176-178.

Impact of Fast ForWord 83
APPENDIX A
Research Participation Authorization

£ASTERN
ILLINOIS UNIVERSITY
Impact of Fast For Word 84 .
Communication Disorders and Sciences Speech-Language-Hearing Clinic Charleston, IL 61920-3099 Phone: 217-581-2712 CITY & Voice) Fax: 217-581-7105 Email: [email protected] Web: www.eiu.edu\ac\sci\cds
RESEARCH PARTICIPATION AUTHORIZATION
Melissa Nulty, graduate student, and two assistant professors from Eastern Illinois
University, Jean Smitley and Rebecca Throneburg, are conducting a research project
assessing children's reading and phonological awareness skills. I authorize permission
for _______________ ,who is my to participate in (child's name) (birthdate) (relationship)
this project. I give my permission for the researchers to use all data collected during the
research, including audio recordings for teaching and publications. I understand that my
child's name will not be used in any descriptions or reports of data.
(parent signature)
(address) (parent names)
(city) (state) (zip) (phone)
(date)
• A<..:Jr.l11rt0 • ..::---··' ·--·· .. -· -· - -
Related Documents