The Impact of Eliminating the State and Local Tax Deduction Report prepared by the Government Finance Officers Association Updated with 2015 IRS Data

Welcome message from author
This document is posted to help you gain knowledge. Please leave a comment to let me know what you think about it! Share it to your friends and learn new things together.
Transcript
The Impact of Eliminating the State and Local
Tax Deduction
Report prepared by the Government Finance Officers Association
Updated with 2015 IRS Data

About the Government Finance Officers AssociationSince 1906, Government Finance Officers Association (GFOA) has been dedicated to promoting excellence in government financial management to state and local government finance officers. GFOA represents more than 19,000 members in the United States and Canada.
About the National Governors AssociationThe National Governors Association (NGA), founded in 1908, is the collective voice of the Nation’s governors. NGA’s members are the governors of the 50 States, three Territories, and two Commonwealths.
About the United States Conference of MayorsThe U.S. Conference of Mayors is the official nonpartisan organization of cities with populations of 30,000 or more. There are over 1,400 such cities in the country today, and each city is represented in the Conference by its chief elected official, the mayor. Like us on Facebook at facebook.com/usmayors or follow us on Twitter at twitter.com/usmayors.
About the Council of State GovernmentsFounded in 1933, The Council of State Governments champions excellence in state governments to advance the common good. CSG is a region-based forum that fosters the exchange of insights and ideas to help state officials shape public policy. A nonprofit, nonpartisan organization, CSG is the nation’s only organization that serves all three branches of state government. CSG membership includes 56 U.S. states and territories, and six Canadian provinces also partner with the council.
About the National Conference of State Legislatures (NCSL)NCSL is the bipartisan organization that serves the legislators and staffs of the states, commonwealths and territories. NCSL provides, research, technical assistance and opportunities for policymakers to exchange ideas on the most pressing state issues and is an effective and respected advocate for the interests of the states in the American federal system.
About the National League of CitiesThe National League of Cities (NLC) is dedicated to helping city leaders build better communities. NLC is a resource and advocate for 19,000 cities, towns and villages, representing more than 218 million Americans. www.nlc.org
About the National Association of CountiesThe National Association of Counties (NACo) unites America’s 3,069 county governments. Founded in 1935, NACo brings county officials together to advocate with a collective voice on national policy, exchange ideas and build new leadership skills, pursue transformational county solutions, enrich the public’s understanding of county government, and exercise exemplary leadership in public service.
About the International City/County Management AssociationFounded in 1914, ICMA, the International City/County Management Association, advances professional local government through leadership, management, innovation, and ethics. ICMA’s 11,000 members are the professional city, town, and county managers who are appointed by elected officials to oversee the day-to-day operation of our communities. ICMA provides member support, publications, data, and information; peer and results-oriented assistance; and training and professional development worldwide.
About the National Association of State Budget OfficersFounded in 1945, NASBO serves as the professional organization for all state budget officers of the fifty states and U.S. territories. NASBO collects data and publishes numerous reports on state fiscal conditions and organizes meetings and training for budget and finance officials. The organization also provides public officials, the media and citizens detailed information on state financial management and budgeting.

As part of its tax reform efforts, Congress is debating
whether to eliminate the ability for taxpayers to deduct
state and local taxes (SALT). Similar efforts have been
attempted in the past, and they failed each time — for a simple
reason. If SALT were repealed, almost 30% of taxpayers, including
individuals in every state and in all income brackets, would be
adversely impacted. In 2015, the most recent year for which data
are available, that included over 44 million tax units representing
well over 100 million Americans. Additionally, more than 50% of
the total amount of the SALT deduction went to taxpayers with
adjusted gross incomes (AGI) under $200,000.
Since the federal income tax was adopted in the early 20th
century, it has been recognized that independent state and local
government tax structures should be respected. The deduction of
state and local taxes has contributed to the stability of state and
local tax revenues that are essential for providing public services.
State and local governments must balance their budgets every
year, so any change that disrupts the stability of their tax
structure will harm their ability to fund those essential services.
The Impact of Eliminating the State and Local Tax Deduction 3
4 The Impact of Eliminating the State and Local Tax Deduction
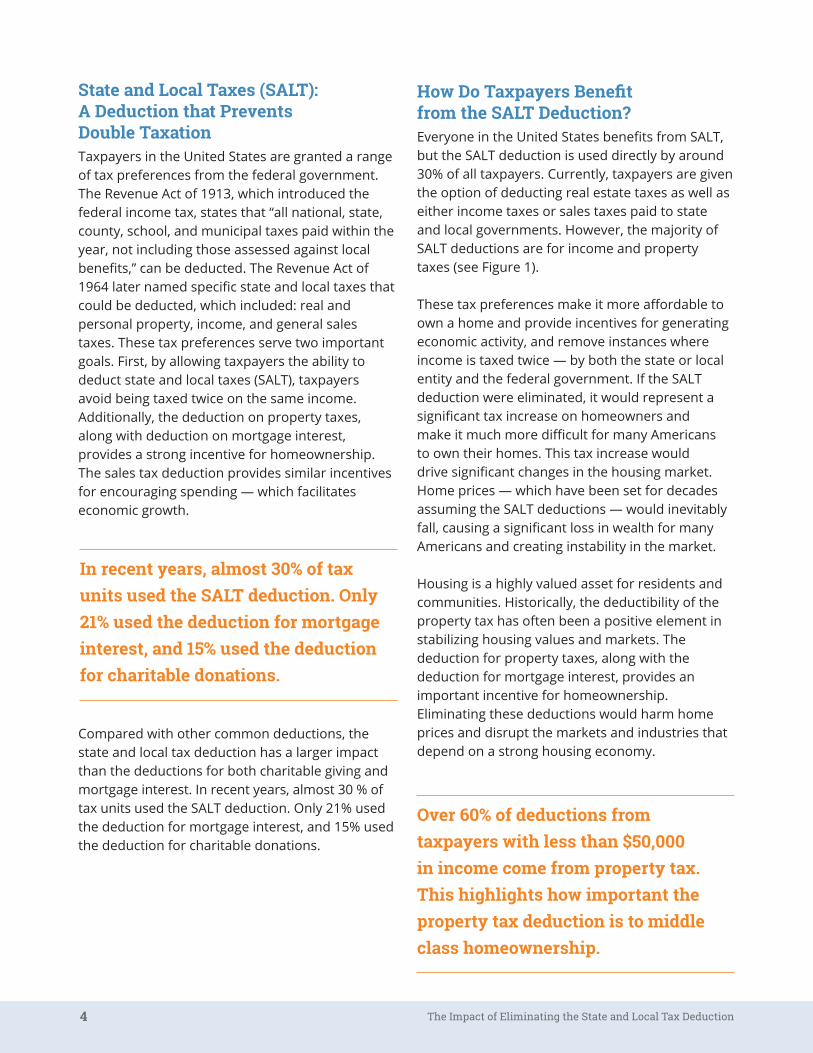
State and Local Taxes (SALT): A Deduction that Prevents Double TaxationTaxpayers in the United States are granted a range of tax preferences from the federal government. The Revenue Act of 1913, which introduced the federal income tax, states that “all national, state, county, school, and municipal taxes paid within the year, not including those assessed against local benefits,” can be deducted. The Revenue Act of 1964 later named specific state and local taxes that could be deducted, which included: real and personal property, income, and general sales taxes. These tax preferences serve two important goals. First, by allowing taxpayers the ability to deduct state and local taxes (SALT), taxpayers avoid being taxed twice on the same income. Additionally, the deduction on property taxes, along with deduction on mortgage interest, provides a strong incentive for homeownership. The sales tax deduction provides similar incentives for encouraging spending — which facilitates economic growth.
Compared with other common deductions, the state and local tax deduction has a larger impact than the deductions for both charitable giving and mortgage interest. In recent years, almost 30 % of tax units used the SALT deduction. Only 21% used the deduction for mortgage interest, and 15% used the deduction for charitable donations.
How Do Taxpayers Benefit from the SALT Deduction?Everyone in the United States benefits from SALT, but the SALT deduction is used directly by around 30% of all taxpayers. Currently, taxpayers are given the option of deducting real estate taxes as well as either income taxes or sales taxes paid to state and local governments. However, the majority of SALT deductions are for income and property taxes (see Figure 1).
These tax preferences make it more affordable to own a home and provide incentives for generating economic activity, and remove instances where income is taxed twice — by both the state or local entity and the federal government. If the SALT deduction were eliminated, it would represent a significant tax increase on homeowners and make it much more difficult for many Americans to own their homes. This tax increase would drive significant changes in the housing market. Home prices — which have been set for decades assuming the SALT deductions — would inevitably fall, causing a significant loss in wealth for many Americans and creating instability in the market.
Housing is a highly valued asset for residents and communities. Historically, the deductibility of the property tax has often been a positive element in stabilizing housing values and markets. The deduction for property taxes, along with the deduction for mortgage interest, provides an important incentive for homeownership. Eliminating these deductions would harm home prices and disrupt the markets and industries that depend on a strong housing economy.
In recent years, almost 30% of tax units used the SALT deduction. Only 21% used the deduction for mortgage interest, and 15% used the deduction for charitable donations.
Over 60% of deductions from taxpayers with less than $50,000 in income come from property tax. This highlights how important the property tax deduction is to middle class homeownership.
The Impact of Eliminating the State and Local Tax Deduction 5
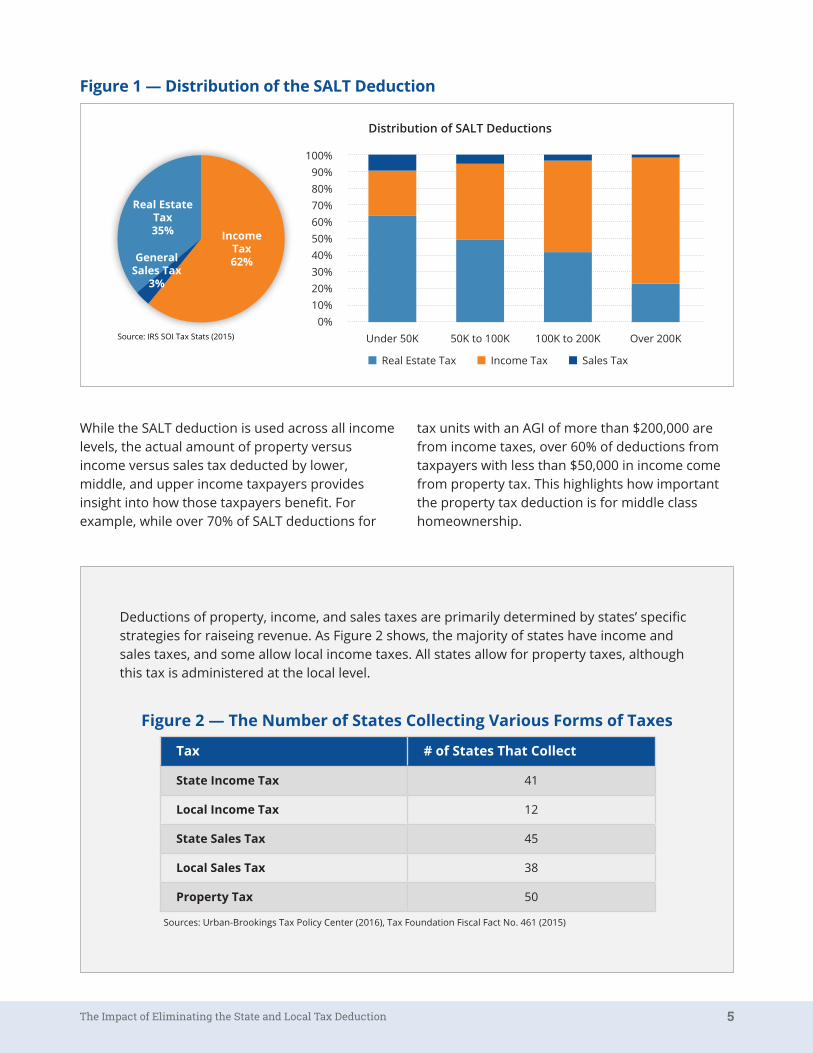
Figure 1 — Distribution of the SALT Deduction
Source: IRS SOI Tax Stats (2014)
Figure 2 — The Number of States Collecting Various Forms of Taxes
Tax # of States That Collect
State Income Tax 41
Local Income Tax 12
State Sales Tax 45
Local Sales Tax 38
Property Tax 50
Sources: Urban-Brookings Tax Policy Center (2016), Tax Foundation Fiscal Fact No. 461 (2015)
While the SALT deduction is used across all income levels, the actual amount of property versus income versus sales tax deducted by lower, middle, and upper income taxpayers provides insight into how those taxpayers benefit. For example, while over 70% of SALT deductions for
tax units with an AGI of more than $200,000 are from income taxes, over 60% of deductions from taxpayers with less than $50,000 in income come from property tax. This highlights how important the property tax deduction is for middle class homeownership.
Income Tax62%General
Sales Tax3%
Real Estate Tax35%
Distribution of SALT Deductions
Real Estate Tax Income Tax Sales Tax
Under 50K 50K to 100K 100K to 200K Over 200K
100%90%80%70%60%50%40%30%20%10%
0%
Deductions of property, income, and sales taxes are primarily determined by states’ specific strategies for raiseing revenue. As Figure 2 shows, the majority of states have income and sales taxes, and some allow local income taxes. All states allow for property taxes, although this tax is administered at the local level.
Source: IRS SOI Tax Stats (2015)

6 The Impact of Eliminating the State and Local Tax Deduction
The SALT Deduction by Income LevelContrary to popular opinion, the deduction of state and local taxes does not exclusively benefit the wealthy, even though that argument has been used countless times in attempts to modify or repeal the deduction. In fact, almost 40% of taxpayers making between $50K to $75K per year and more than 70% of taxpayers earning from $100K to $200K per year and use the SALT deduction.
Figure 3 — The Impact of Eliminating the SALT Deduction
Figure 4 — The SALT Deduction by Adjusted Gross Income
Homeowner inEugene, OR
INCOME: $ 75,000STATE INCOME TAX: $ 6,344PROPERTY TAX: $ 4,000SALT DEDUCTION: $ 10,344ADDITIONAL TAX: $ 1,552
Family of 4 inBarrington, IL
INCOME: $ 250,000STATE INCOME TAX: $ 8,750PROPERTY TAX: $ 15,000SALT DEDUCTION: $ 23,750ADDITIONAL TAX: $ 6,650
Couple inChaska, MN
INCOME: $ 150,000STATE INCOME TAX: $ 10,000PROPERTY TAX: $ 4,750SALT DEDUCTION: $ 14,750ADDITIONAL TAX: $ 4,130
Family of 3 inConroe, TX
INCOME: $ 100,000SALES TAX: $ 3,300PROPERTY TAX: $ 6,500SALT DEDUCTION: $ 9,800ADDITIONAL TAX: $ 2,450
In fact, almost 40% of taxpayers making between $50K to $75K per year and more than 70% of taxpayers earning from $100K to $200K per year and use the SALT deduction.
Adjusted Gross Income
# of Total Tax Returns
# of Tax Returns Using SALT Deductions
% Claiming Deduction
SALT Deduction Amount (%)
Under 25K 56,717,580 3,061,430 5% 2%
25K to 50K 35,077110 6,563,670 19% 5%
50K to 75K 19,944,460 7,603,690 38% 8%
75K to 100K 12,925,290 6,903,290 53% 9%
100K to 200K 18,330,660 13,915,460 76% 28%
200K to 500K 5,419,600 5,065,480 93% 21%
500K to 1M 864,920 805,020 93% 8%
1M+ 438,370 400,420 91% 20%
Total 149,726,990 44,318,460 29.6% 100%

The Impact of Eliminating the State and Local Tax Deduction 7
One of the key takeaways from Figure 4 is that over 50% of the total amount of the SALT deduction goes to taxpayers making less than $200,000 a year. In fact, every single taxpayer with income above the standard deduction amount could potentially benefit from deducting SALT. When looking at the total amount deducted by income bracket, it is clear that the SALT deduction benefits taxpayers across all brackets. In fact, the bracket with the most filers and the largest total
amount deducted is from those earning between $100,000 and $200,000 per year in AGI. With a standard deduction of $6,350 per individual and $12,700 for married couples filing jointly, even if Congress were to offset impacts from eliminating the SALT deduction through increases in the standard deduction, the deduction would need to increase significantly. Even if it were to double or triple, a significant portion of taxpayers would still end up with tax increases.
Adjusted Gross Income
Total Number of SALT Deductions
Total $ Deducted Average SALT Deduction*
Deduction as % of AGI
Under 25K 3,061,430 $ 10,715,857,000 $3,500 2%
25K to 50K 6,563,670 $ 26,377,106,000 $4,019 2%
50K to 75K 7,603,690 $ 41,818,805,000 $5,500 3%
75K to 100K 6,903,290 $ 50,018,752,000 $7,246 4%
100K to 200K 13,915,460 $ 154,484,401,000 $11,102 6%
200K to 500K 5,065,480 $ 115,726,717,000 $22,846 7%
500K to 1M 805,020 $ 43,921,403,000 $54,559 8%
1M+ 400,420 $ 109,645,122,000 $273,825 8%
Total 44,318,460 $ 552,708,163,000 $12,471 5.4%
Figure 5 — Total Deduction Amounts
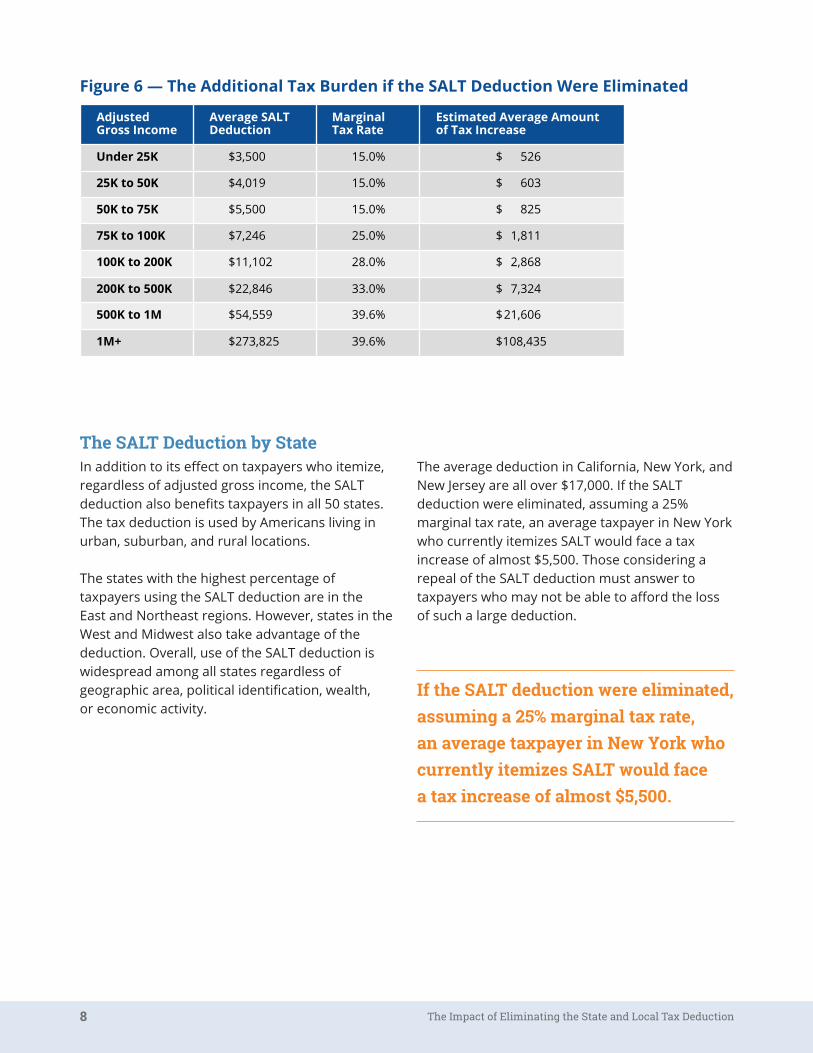
Eliminating the SALT deduction would result in additional taxes. Figure 6 shows the average tax increases for tax units that itemize across each income bracket. On average, taxes paid by taxpayers who itemize deductions would significantly increase. Some other models, such as the Urban-Brookings Microsimulation Model,
which takes into account more variables, the average increase would be over $2,000 if SALT were repealed. Thus, both estimates demonstrate that the repeal of the SALT deduction would have a major and adverse impact on taxpayers. While that impact varies by income, there would be a tax increase for everyone who deducts SALT.
* Calculated as SALT deduction amount divided by number of SALT deductions.
8 The Impact of Eliminating the State and Local Tax Deduction
The SALT Deduction by StateIn addition to its effect on taxpayers who itemize, regardless of adjusted gross income, the SALT deduction also benefits taxpayers in all 50 states. The tax deduction is used by Americans living in urban, suburban, and rural locations.
The states with the highest percentage of taxpayers using the SALT deduction are in the East and Northeast regions. However, states in the West and Midwest also take advantage of the deduction. Overall, use of the SALT deduction is widespread among all states regardless of geographic area, political identification, wealth, or economic activity.
Figure 6 — The Additional Tax Burden if the SALT Deduction Were Eliminated
The average deduction in California, New York, and New Jersey are all over $17,000. If the SALT deduction were eliminated, assuming a 25% marginal tax rate, an average taxpayer in New York who currently itemizes SALT would face a tax increase of almost $5,500. Those considering a repeal of the SALT deduction must answer to taxpayers who may not be able to afford the loss of such a large deduction.
If the SALT deduction were eliminated, assuming a 25% marginal tax rate, an average taxpayer in New York who currently itemizes SALT would face a tax increase of almost $5,500.
Adjusted Gross Income
Average SALT Deduction
Marginal Tax Rate
Estimated Average Amount of Tax Increase
Under 25K $3,500 15.0% $ 526
25K to 50K $4,019 15.0% $ 603
50K to 75K $5,500 15.0% $ 825
75K to 100K $7,246 25.0% $ 1,811
100K to 200K $11,102 28.0% $ 2,868
200K to 500K $22,846 33.0% $ 7,324
500K to 1M $54,559 39.6% $ 21,606
1M+ $273,825 39.6% $ 108,435

The Impact of Eliminating the State and Local Tax Deduction 9
Figure 7 — Percentage of Tax Units that Use the SALT Deduction and the Average Deduction by State
State % with SALT Deductions
Average SALT Deduction*
MD 46% $ 12,931
CT 41% $ 19,664
NJ 41% $ 17,850
DC 40% $ 16,442
VA 37% $ 11,288
MA 37% $ 15,571
OR 36% $ 12,616
UT 35% $ 8,291
MN 35% $ 12,954
NY 35% $ 22,169
CA 34% $ 18,437
GA 33% $ 9,158
RI 33% $ 12,434
CO 32% $ 9,017
DE 32% $ 9,194
IL 31% $ 12,523
WI 31% $ 11,653
NH 31% $ 10,121
WA 30% $ 7,402
IA 29% $ 10,163
HI 29% $ 9,905
NC 29% $ 9,587
PA 29% $ 11,248
AZ 28% $ 7,403
MT 28% $ 9,357
ID 28% $ 8,862
State % with SALT Deductions
Average SALT Deduction*
ME 28% $ 11,431
NE 28% $ 11,088
SC 27% $ 8,765
VT 27% $ 12,407
MI 27% $ 9,648
MO 26% $ 9,886
OH 26% $ 10,444
KY 26% $ 9,955
AL 26% $ 5,918
KS 25% $ 9,425
NV 25% $ 5,989
OK 24% $ 8,201
MS 23% $ 6,302
LA 23% $ 6,742
TX 23% $ 7,823
IN 23% $ 8,756
FL 22% $ 7,373
NM 22% $ 7,091
AR 22% $ 9,116
WY 22% $ 6,306
AK 21% $ 4,931
TN 19% $ 5,611
ND 18% $ 6,864
WV 17% $ 9,462
SD 17% $ 6,098
* Calculated as SALT deduction amount divided by number of SALT deductions.

10 The Impact of Eliminating the State and Local Tax Deduction
The statistics in the earlier sections demonstrate the significance of the deduction for taxpayers at all income levels and across the states. The need to retain the SALT deduction is more evident when analyzing statistics from specific areas of the country.
Consider the map in Figure 8, which shows SALT deductions by congressional district. It is evident that taxpayers across all congressional districts benefit from the SALT deduction. The amount of claims is highest in the Northeast, Midwest, and West Coast. For example, a few districts in New York, New Jersey, Maryland, and Virginia see over 50% of tax payers using the SALT deduction.
Figure 8 — The SALT Deduction by Congressional District
The SALT Deduction by Congressional DistrictHowever, use of the SALT deduction is also common throughout the U.S. Over 40% of taxpayers in districts throughout Georgia, Oregon, Pennsylvania, Minnesota, California, and Michigan use the SALT deduction.
Figure 8 shows the impact across congressional districts. The darker the color on the map, the higher the amount of deduction claimed per congressional district (normalized on a percentile basis). Figure 9 shows the specific impact on example districts, including the approximate additional tax burden, or tax increase on taxpayers that would result from eliminating the SALT deduction.
Percentile of District 10% 20% 30% 40% 50% 60% 70% 80% 90% 100%
% Using SALT Deduction in District
19% 22% 25% 27% 29% 31% 34% 38% 43% 52%

The Impact of Eliminating the State and Local Tax Deduction 11
State District % Using SALT Deduction
Amount of SALT Deduction
Additional Tax Burden by Taxpayers in Congressional District*
TX 8 26% $1,172,458,600.00 $293,114,650.00
OH 12 33% $1,714,441,500.00 $428,610,375.00
WA 8 32% $1,057,498,600.00 $264,374,650.00
IL 6 38% $3,196,473,000.00 $799,118,250.00
NY 23 22% $800,207,000.00 $200,051,750.00
MI 8 35% $1,354,539,800.00 $338,634,950.00
NC 2 32% $1,118,547,210.00 $279,636,802.50
MO 8 17% $348,497,340.00 $87,124,335.00
MA 1 32% $1,055,631,000.00 $263,907,750.00
NJ 9 37% $2,386,285,700.00 $596,571,425.00
CA 22 24% $361,586,800.00 $90,396,700.00
The SALT Deduction and Its Impact on State and Local GovernmentThe SALT deduction reflects a partnership between the federal government and state and local governments. The deduction is fundamental to the way states and localities budget for and provide critical public services, and a cornerstone of the U.S. system of fiscal federalism. It reflects a collaborative relationship between levels of government that has existed for over 100 years. Currently, the SALT deduction is an accepted part of the tax structure that is critical to the stability of state and local government finance.
States, cities, counties, school districts, and other special districts have all established tax rates that operate under the assumption that the federal tax
code provides deductibility. Taxpayers would not accept a tax increase in taxes paid, or double taxation, and they would make their displeasure known — especially those in high-tax jurisdictions. Deprived of SALT as a tool for keeping their tax burden lower, they would push back against the tool that they have available to them — local tax rates, which provide the revenues needed to provide essential public services, such as police officers, teachers, firefighters, and other valuable public servants, along with critically important investments that provide for infrastructure, public safety, healthy communities, and many factors contributing to the quality of life.
Figure 9 — Additional Tax Burden by Congressional District, Example Districts
Note: The additional tax burden assumes a 25% average marginal rate for all taxpayers, and the total estimate amount includes taxes paid by all tax units within the congressional district.

12 The Impact of Eliminating the State and Local Tax Deduction
ConclusionThe elimination of the SALT deduction would have ramifications for taxpayers and state and local governments alike. This report provides a realistic picture of the consequences of the proposal to eliminate the SALT deduction. Virtually all Americans would be affected by a repeal of the SALT deduction. Alternative proposals being discussed, such as increasing the standard deduction or adjusting marginal tax rates, will mitigate the impact of eliminating the SALT deduction for individual taxpayers but will inevitably provide a different distribution of tax expenditures — creating a situation where many tax payers will still face a significant tax increase.
In summary, the thousands of state and local elected and appointed public servants understand the need for tax reform to address the rising
federal deficit and to promote jobs and economic growth. As Congress discusses tax reform proposals, it is essential to consider the impact any changes will have on the bottom lines of state and local governments, the very bodies that bear the burden of over three quarters of the cost of providing the infrastructure that keeps our economy strong. The principle of fiscal federalism underpins the necessity of ensuring that any federal tax reforms allow local and state governments to retain authority over their own tax policies, retaining the deductibility of personal state and local property, sales, and income taxes on federal tax returns. Recognizing the partnership that exists between federal, state, and local governments ensures that taxpayers are not double taxed and maintains the essential public services upon which Americans rely.
CONGRESSIONAL DISTRICT
Tax Impact $306 Million
If local governments reduced taxes to offset any tax increase at the federal level, this would result in job losses, reductions in spending on capital equipment, and decrease in infrastructure investment. Based on typical costs, the amount of revenue lost could be used to support five police officers, 10 teachers, five public works employees, purchases of new capital equipment, such as a fire truck, and over $150 million in infrastructure, that could support new schools, roads, parks, and water/waste water facilities.
CITY
Tax Impact $59 Million
SCHOOLS
Tax Impact $125 Million
STATE
Tax Impact $58 Million
OTHER GOVERNMENTS
Tax Impact $64 Million
Tax rates are obtained from Conroe, TX and Montgomery County, IRS (2014) data is also used. We assumed that 75% of SALT deduction for the 8th Congressional District was from property taxes and an average marginal tax rate of 25%.

The Impact of Eliminating the State and Local Tax Deduction 13
Appendix
State District Party Affiliation
% of Tax Units Using SALT Deduction
Average SALT Deduction*
Average Taxpayer Deduction**
State District Party Affiliation
% of Tax Units Using SALT Deduction
Average SALT Deduction*
Average Taxpayer Deduction**
AK At-Large R 21% $4,932 $1,057 AL 1 R 25% $5,298 $1,335 AL 2 R 22% $4,740 $1,022 AL 3 R 24% $4,814 $1,162 AL 4 R 20% $4,759 $965 AL 5 R 29% $5,650 $1,627 AL 6 R 33% $7,001 $2,332 AL 7 D 28% $6,348 $1,760 AR 1 R 19% $7,181 $1,351 AR 2 R 28% $9,267 $2,599 AR 3 R 25% $10,671 $2,645 AR 4 R 18% $7,074 $1,288 AZ 1 D 27% $6,619 $1,812 AZ 2 R 27% $6,600 $1,749 AZ 3 D 27% $6,972 $1,901 AZ 4 R 27% $6,674 $1,807 AZ 5 R 30% $7,454 $2,240 AZ 6 R 30% $7,454 $2,240 AZ 7 D 30% $7,454 $2,240 AZ 8 R 30% $7,454 $2,240 AZ 9 D 30% $7,454 $2,240 CA 1 R 33% $10,546 $3,432 CA 2 D 38% $22,727 $8,559 CA 3 D 32% $10,129 $3,226 CA 4 R 36% $11,802 $4,249 CA 5 D 38% $15,167 $5,799 CA 6 D 33% $10,803 $3,515 CA 7 D 32% $10,174 $3,283 CA 8 R 30% $8,845 $2,696 CA 9 D 35% $13,356 $4,647 CA 10 R 28% $9,792 $2,749 CA 11 D 44% $18,672 $8,231 CA 12 D 38% $32,428 $12,214 CA 13 D 38% $32,428 $12,214 CA 14 D 40% $34,749 $14,064 CA 15 D 44% $18,672 $8,231 CA 16 D 23% $9,501 $2,159 CA 17 D 42% $30,259 $12,728 CA 18 D 41% $31,193 $12,907 CA 19 D 42% $30,259 $12,728 CA 20 D 35% $22,766 $7,931 CA 21 R 25% $9,932 $2,531 CA 22 R 24% $9,844 $2,348 CA 23 R 29% $14,370 $4,203 CA 24 D 34% $15,492 $5,252 CA 25 R 33% $16,723 $5,549 CA 26 D 33% $16,723 $5,549 CA 27 D 31% $14,042 $4,400 CA 28 D 32% $17,538 $5,563 CA 29 D 32% $17,538 $5,563 CA 30 D 33% $16,723 $5,549 CA 31 D 31% $8,765 $2,697 CA 32 D 32% $17,538 $5,563 CA 33 D 32% $17,538 $5,563 CA 34 D 32% $17,538 $5,563 CA 35 D 31% $14,042 $4,400 CA 36 D 34% $9,699 $3,308 CA 37 D 32% $17,538 $5,563 CA 38 D 34% $17,864 $6,102 CA 39 R 33% $15,575 $5,177 CA 40 D 32% $17,538 $5,563 CA 41 D 34% $9,699 $3,308 CA 42 R 34% $9,699 $3,308 CA 43 D 32% $17,538 $5,563 CA 44 D 32% $17,538 $5,563 CA 45 R 37% $18,200 $6,752 CA 46 D 37% $18,200 $6,752 CA 47 D 34% $17,864 $6,102 CA 48 R 37% $18,200 $6,752 CA 49 R 35% $16,524 $5,776
CA 50 R 34% $12,808 $4,323 CA 51 D 30% $14,545 $4,364 CA 52 D 33% $15,249 $5,106 CA 53 D 33% $15,249 $5,106 CO 1 D 32% $9,758 $3,102 CO 2 D 35% $8,819 $3,115 CO 3 R 26% $7,916 $2,041 CO 4 R 36% $9,487 $3,370 CO 5 R 29% $6,305 $1,826 CO 6 R 42% $9,986 $4,208 CO 7 D 39% $8,180 $3,151 CT 1 D 41% $13,939 $5,754 CT 2 D 39% $13,070 $5,125 CT 3 D 40% $13,803 $5,523 CT 4 D 38% $13,744 $5,271 CT 5 D 40% $13,869 $5,521 DC At-Large D 40% $16,443 $6,541 DE At-Large D 32% $9,195 $2,907 FL 1 R 19% $5,059 $954 FL 2 R 18% $4,711 $859 FL 3 R 17% $4,609 $795 FL 4 R 21% $5,444 $1,166 FL 5 D 21% $5,000 $1,034 FL 6 R 25% $6,769 $1,700 FL 7 D 21% $5,138 $1,072 FL 8 R 21% $6,351 $1,319 FL 9 D 18% $4,582 $813 FL 10 D 19% $4,884 $934 FL 11 R 20% $5,145 $1,015 FL 12 R 20% $5,555 $1,108 FL 13 D 20% $6,494 $1,309 FL 14 D 21% $6,131 $1,259 FL 15 R 19% $5,365 $1,035 FL 16 R 26% $8,900 $2,334 FL 17 R 21% $6,745 $1,393 FL 18 R 26% $10,124 $2,639 FL 19 R 26% $11,789 $3,110 FL 20 D 27% $9,226 $2,512 FL 21 D 28% $9,276 $2,563 FL 22 D 28% $9,276 $2,563 FL 23 D 24% $6,647 $1,570 FL 24 D 24% $6,647 $1,570 FL 25 R 25% $8,623 $2,123 FL 26 R 23% $8,026 $1,831 FL 27 R 22% $6,870 $1,517 GA 1 R 28% $7,701 $2,159 GA 2 D 26% $6,713 $1,714 GA 3 R 33% $7,257 $2,410 GA 4 D 35% $7,934 $2,764 GA 5 D 34% $11,105 $3,810 GA 6 R 38% $11,445 $4,304 GA 7 R 40% $8,881 $3,531 GA 8 R 27% $6,697 $1,798 GA 9 R 31% $7,833 $2,458 GA 10 R 34% $7,529 $2,528 GA 11 R 39% $10,807 $4,163 GA 12 R 26% $6,716 $1,724 GA 13 D 37% $10,116 $3,696 GA 14 R 26% $6,644 $1,726 HI 1 D 30% $9,199 $2,762 HI 2 D 29% $8,911 $2,548 IA 1 R 29% $9,229 $2,651 IA 2 D 27% $9,606 $2,634 IA 3 R 35% $10,460 $3,663 IA 4 R 25% $8,863 $2,229 ID 1 R 28% $8,083 $2,241 ID 2 R 28% $8,497 $2,383 IL 1 D 34% $13,226 $4,471 IL 2 D 33% $12,626 $4,174 IL 3 D 36% $13,763 $4,967
* Calculated as SALT deduction amount divided by number of SALT deductions. ** Calculated as SALT deduction amount divided by number of tax filers.
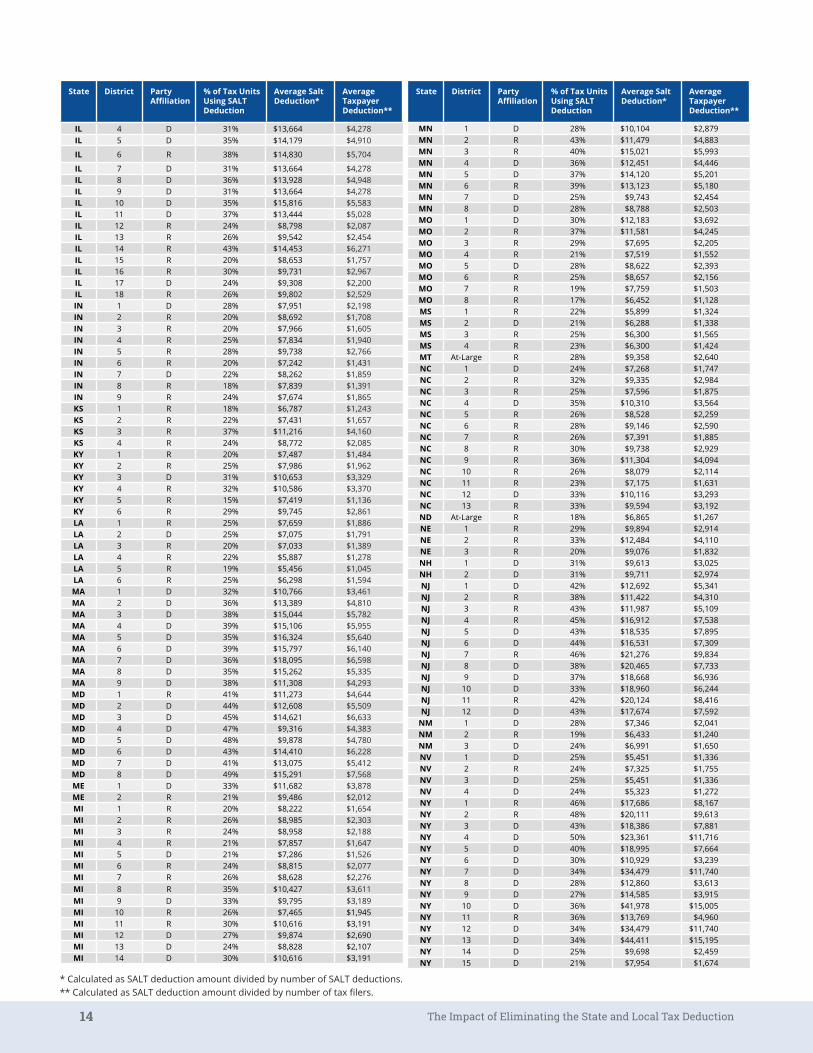
14 The Impact of Eliminating the State and Local Tax Deduction
State District Party Affiliation
% of Tax Units Using SALT Deduction
Average Salt Deduction*
Average Taxpayer Deduction**
State District Party Affiliation
% of Tax Units Using SALT Deduction
Average Salt Deduction*
Average Taxpayer Deduction**
IL 4 D 31% $13,664 $4,278 IL 5 D 35% $14,179 $4,910
IL 6 R 38% $14,830 $5,704
IL 7 D 31% $13,664 $4,278 IL 8 D 36% $13,928 $4,948 IL 9 D 31% $13,664 $4,278 IL 10 D 35% $15,816 $5,583 IL 11 D 37% $13,444 $5,028 IL 12 R 24% $8,798 $2,087 IL 13 R 26% $9,542 $2,454 IL 14 R 43% $14,453 $6,271 IL 15 R 20% $8,653 $1,757 IL 16 R 30% $9,731 $2,967 IL 17 D 24% $9,308 $2,200 IL 18 R 26% $9,802 $2,529 IN 1 D 28% $7,951 $2,198 IN 2 R 20% $8,692 $1,708 IN 3 R 20% $7,966 $1,605 IN 4 R 25% $7,834 $1,940 IN 5 R 28% $9,738 $2,766 IN 6 R 20% $7,242 $1,431 IN 7 D 22% $8,262 $1,859 IN 8 R 18% $7,839 $1,391 IN 9 R 24% $7,674 $1,865 KS 1 R 18% $6,787 $1,243 KS 2 R 22% $7,431 $1,657 KS 3 R 37% $11,216 $4,160 KS 4 R 24% $8,772 $2,085 KY 1 R 20% $7,487 $1,484 KY 2 R 25% $7,986 $1,962 KY 3 D 31% $10,653 $3,329 KY 4 R 32% $10,586 $3,370 KY 5 R 15% $7,419 $1,136 KY 6 R 29% $9,745 $2,861 LA 1 R 25% $7,659 $1,886 LA 2 D 25% $7,075 $1,791 LA 3 R 20% $7,033 $1,389 LA 4 R 22% $5,887 $1,278 LA 5 R 19% $5,456 $1,045 LA 6 R 25% $6,298 $1,594 MA 1 D 32% $10,766 $3,461 MA 2 D 36% $13,389 $4,810 MA 3 D 38% $15,044 $5,782 MA 4 D 39% $15,106 $5,955 MA 5 D 35% $16,324 $5,640 MA 6 D 39% $15,797 $6,140 MA 7 D 36% $18,095 $6,598 MA 8 D 35% $15,262 $5,335 MA 9 D 38% $11,308 $4,293 MD 1 R 41% $11,273 $4,644 MD 2 D 44% $12,608 $5,509 MD 3 D 45% $14,621 $6,633 MD 4 D 47% $9,316 $4,383 MD 5 D 48% $9,878 $4,780 MD 6 D 43% $14,410 $6,228 MD 7 D 41% $13,075 $5,412 MD 8 D 49% $15,291 $7,568 ME 1 D 33% $11,682 $3,878 ME 2 R 21% $9,486 $2,012 MI 1 R 20% $8,222 $1,654 MI 2 R 26% $8,985 $2,303 MI 3 R 24% $8,958 $2,188 MI 4 R 21% $7,857 $1,647 MI 5 D 21% $7,286 $1,526 MI 6 R 24% $8,815 $2,077 MI 7 R 26% $8,628 $2,276 MI 8 R 35% $10,427 $3,611 MI 9 D 33% $9,795 $3,189 MI 10 R 26% $7,465 $1,945 MI 11 R 30% $10,616 $3,191 MI 12 D 27% $9,874 $2,690 MI 13 D 24% $8,828 $2,107 MI 14 D 30% $10,616 $3,191
MN 1 D 28% $10,104 $2,879 MN 2 R 43% $11,479 $4,883 MN 3 R 40% $15,021 $5,993 MN 4 D 36% $12,451 $4,446 MN 5 D 37% $14,120 $5,201 MN 6 R 39% $13,123 $5,180 MN 7 D 25% $9,743 $2,454 MN 8 D 28% $8,788 $2,503 MO 1 D 30% $12,183 $3,692 MO 2 R 37% $11,581 $4,245 MO 3 R 29% $7,695 $2,205 MO 4 R 21% $7,519 $1,552 MO 5 D 28% $8,622 $2,393 MO 6 R 25% $8,657 $2,156 MO 7 R 19% $7,759 $1,503 MO 8 R 17% $6,452 $1,128 MS 1 R 22% $5,899 $1,324 MS 2 D 21% $6,288 $1,338 MS 3 R 25% $6,300 $1,565 MS 4 R 23% $6,300 $1,424 MT At-Large R 28% $9,358 $2,640 NC 1 D 24% $7,268 $1,747 NC 2 R 32% $9,335 $2,984 NC 3 R 25% $7,596 $1,875 NC 4 D 35% $10,310 $3,564 NC 5 R 26% $8,528 $2,259 NC 6 R 28% $9,146 $2,590 NC 7 R 26% $7,391 $1,885 NC 8 R 30% $9,738 $2,929 NC 9 R 36% $11,304 $4,094 NC 10 R 26% $8,079 $2,114 NC 11 R 23% $7,175 $1,631 NC 12 D 33% $10,116 $3,293 NC 13 R 33% $9,594 $3,192 ND At-Large R 18% $6,865 $1,267 NE 1 R 29% $9,894 $2,914 NE 2 R 33% $12,484 $4,110 NE 3 R 20% $9,076 $1,832 NH 1 D 31% $9,613 $3,025 NH 2 D 31% $9,711 $2,974 NJ 1 D 42% $12,692 $5,341 NJ 2 R 38% $11,422 $4,310 NJ 3 R 43% $11,987 $5,109 NJ 4 R 45% $16,912 $7,538 NJ 5 D 43% $18,535 $7,895 NJ 6 D 44% $16,531 $7,309 NJ 7 R 46% $21,276 $9,834 NJ 8 D 38% $20,465 $7,733 NJ 9 D 37% $18,668 $6,936 NJ 10 D 33% $18,960 $6,244 NJ 11 R 42% $20,124 $8,416 NJ 12 D 43% $17,674 $7,592
NM 1 D 28% $7,346 $2,041 NM 2 R 19% $6,433 $1,240 NM 3 D 24% $6,991 $1,650 NV 1 D 25% $5,451 $1,336 NV 2 R 24% $7,325 $1,755 NV 3 D 25% $5,451 $1,336 NV 4 D 24% $5,323 $1,272 NY 1 R 46% $17,686 $8,167 NY 2 R 48% $20,111 $9,613 NY 3 D 43% $18,386 $7,881 NY 4 D 50% $23,361 $11,716 NY 5 D 40% $18,995 $7,664 NY 6 D 30% $10,929 $3,239 NY 7 D 34% $34,479 $11,740 NY 8 D 28% $12,860 $3,613 NY 9 D 27% $14,585 $3,915 NY 10 D 36% $41,978 $15,005 NY 11 R 36% $13,769 $4,960 NY 12 D 34% $34,479 $11,740 NY 13 D 34% $44,411 $15,195 NY 14 D 25% $9,698 $2,459 NY 15 D 21% $7,954 $1,674
* Calculated as SALT deduction amount divided by number of SALT deductions. ** Calculated as SALT deduction amount divided by number of tax filers.

The Impact of Eliminating the State and Local Tax Deduction 15
State District Party Affiliation
% of Tax Units Using SALT Deduction
Average Salt Deduction*
Average Taxpayer Deduction**
State District Party Affiliation
% of Tax Units Using SALT Deduction
Average Salt Deduction*
Average Taxpayer Deduction**
TN 9 D 25% $6,163 $1,538 TX 1 R 19% $5,315 $995 TX 2 R 23% $8,440 $1,922 TX 3 R 37% $8,742 $3,215 TX 4 R 25% $7,202 $1,791 TX 5 R 20% $7,153 $1,464 TX 6 R 24% $6,859 $1,671 TX 7 R 23% $8,440 $1,922 TX 8 R 26% $8,617 $2,242 TX 9 D 28% $8,856 $2,516 TX 10 R 23% $8,743 $1,983 TX 11 R 17% $5,915 $1,027 TX 12 R 26% $7,236 $1,915 TX 13 R 17% $5,614 $929 TX 14 R 25% $6,856 $1,712 TX 15 D 18% $5,173 $921 TX 16 D 16% $5,999 $961 TX 17 R 19% $8,089 $1,556 TX 18 D 23% $8,440 $1,922 TX 19 R 15% $5,544 $829 TX 20 D 20% $7,202 $1,428 TX 21 R 24% $8,450 $1,988 TX 22 R 29% $8,555 $2,443 TX 23 R 16% $6,173 $1,011 TX 24 R 26% $8,025 $2,118 TX 25 R 22% $7,642 $1,677 TX 26 R 26% $8,025 $2,118 TX 27 R 17% $6,022 $1,028 TX 28 D 17% $6,031 $1,022 TX 29 D 23% $8,440 $1,922 TX 30 D 21% $8,721 $1,810 TX 31 R 29% $7,351 $2,138 TX 32 R 27% $8,733 $2,388 TX 33 D 23% $8,099 $1,844 TX 34 D 13% $4,997 $665 TX 35 D 23% $8,261 $1,890 TX 36 R 21% $7,153 $1,518 UT 1 R 36% $7,747 $2,750 UT 2 R 35% $7,544 $2,651 UT 3 R 35% $7,985 $2,790 UT 4 R 36% $7,989 $2,837 VA 1 R 41% $8,987 $3,665 VA 2 R 32% $8,313 $2,668 VA 3 D 31% $8,352 $2,605 VA 4 D 38% $7,839 $2,962 VA 5 R 28% $9,500 $2,624 VA 6 R 27% $7,303 $1,979 VA 7 R 39% $9,161 $3,536 VA 8 D 47% $15,359 $7,195 VA 9 R 19% $7,541 $1,452 VA 10 R 49% $13,562 $6,653 VA 11 D 49% $14,186 $7,015 VT At-Large D 27% $12,408 $3,383 WA 1 D 33% $7,606 $2,534 WA 2 D 32% $6,301 $2,009 WA 3 R 30% $6,901 $2,079 WA 4 R 19% $5,318 $1,017 WA 5 R 23% $5,702 $1,325 WA 6 D 29% $6,238 $1,837 WA 7 D 35% $7,867 $2,715 WA 8 R 32% $7,840 $2,490 WA 9 D 33% $8,074 $2,689 WA 10 D 30% $6,048 $1,800 WI 1 R 33% $11,421 $3,788 WI 2 D 36% $12,305 $4,410 WI 3 D 27% $10,440 $2,806 WI 4 D 34% $12,701 $4,307 WI 5 R 35% $11,478 $4,036 WI 6 R 30% $11,426 $3,467 WI 7 R 27% $9,860 $2,709 WI 8 R 30% $10,580 $3,190 WV 1 R 17% $9,635 $1,601 WV 2 R 21% $8,398 $1,778 WV 3 R 13% $8,565 $1,081 WY At-Large R 22% $6,307 $1,365
NY 16 D 34% $24,678 $8,276 NY 17 D 45% $26,243 $11,902 NY 18 D 43% $21,571 $9,300 NY 19 R 31% $12,501 $3,885 NY 20 D 33% $14,384 $4,818 NY 21 R 23% $11,865 $2,775 NY 22 R 23% $10,766 $2,437 NY 23 R 22% $11,716 $2,588 NY 24 R 29% $12,140 $3,569 NY 25 D 33% $12,896 $4,285 NY 26 D 27% $12,083 $3,319 NY 27 R 29% $12,125 $3,496 OH 1 R 33% $11,684 $3,849 OH 2 R 26% $10,400 $2,737 OH 3 D 30% $11,280 $3,412 OH 4 R 21% $7,873 $1,665 OH 5 R 23% $8,759 $2,031 OH 6 R 15% $7,552 $1,169 OH 7 R 24% $8,360 $1,995 OH 8 R 26% $8,312 $2,138 OH 9 D 27% $10,761 $2,957 OH 10 R 27% $9,283 $2,519 OH 11 D 29% $11,788 $3,438 OH 12 R 33% $11,572 $3,788 OH 13 D 23% $8,905 $2,047 OH 14 R 28% $10,561 $2,997 OH 15 R 28% $9,896 $2,741 OH 16 R 28% $10,444 $2,930 OK 1 R 28% $9,309 $2,570 OK 2 R 18% $5,394 $976 OK 3 R 23% $6,802 $1,546 OK 4 R 25% $7,836 $1,947 OK 5 R 24% $8,842 $2,116 OR 1 D 39% $12,669 $4,976 OR 2 R 31% $10,001 $3,087 OR 3 D 40% $13,953 $5,522 OR 4 D 31% $9,852 $3,095 OR 5 D 36% $12,052 $4,391 PA 1 D 31% $11,132 $3,431 PA 2 D 30% $11,425 $3,446 PA 3 R 21% $8,929 $1,864 PA 4 R 31% $8,957 $2,821 PA 5 R 17% $8,611 $1,485 PA 6 R 40% $13,218 $5,252 PA 7 R 38% $12,456 $4,784 PA 8 R 44% $13,090 $5,707 PA 9 R 19% $8,128 $1,527 PA 10 R 23% $8,443 $1,904 PA 11 R 24% $8,626 $2,035 PA 12 R 24% $10,263 $2,423 PA 13 D 30% $11,425 $3,446 PA 14 D 27% $11,262 $3,016 PA 15 R 31% $9,641 $2,953 PA 16 R 35% $11,394 $4,024 PA 17 D 24% $9,224 $2,253 PA 18 R 26% $11,099 $2,924 RI 1 D 31% $13,081 $4,119 RI 2 D 34% $11,504 $3,888 SC 1 R 31% $9,447 $2,908 SC 2 R 29% $7,927 $2,317 SC 3 R 25% $8,145 $2,076 SC 4 R 29% $8,785 $2,536 SC 5 R 27% $7,741 $2,086 SC 6 D 27% $8,649 $2,370 SC 7 R 21% $7,135 $1,533 SD 0 R 17% $6,098 $1,032 TN 1 R 14% $4,369 $618 TN 2 R 20% $5,587 $1,137 TN 3 R 18% $5,212 $960 TN 4 R 17% $4,086 $678 TN 5 D 22% $6,289 $1,356 TN 6 R 19% $4,343 $814 TN 7 R 22% $5,527 $1,237 TN 8 R 20% $5,338 $1,092
* Calculated as SALT deduction amount divided by number of SALT deductions. ** Calculated as SALT deduction amount divided by number of tax filers.

Related Documents


![TAX DEDUCTION AT SOURCE [TDS] - · PDF fileAssessment tax: Section 191 4 Index ... deduction at lower rates or no deduction at the time ... section no deduction of tax shall be made](https://static.cupdf.com/doc/110x72/5a9e3f1a7f8b9a2e688c80d6/tax-deduction-at-source-tds-tax-section-191-4-index-deduction-at-lower.jpg)