THE IMPACT OF DIGESTIVE ENZYMES IN THE RUMINANT ANIMAL A Dissertation Submitted to the Graduate Faculty of the North Dakota State University of Agriculture and Applied Science By Faithe Elizabeth Keomanivong In Partial Fulfillment of the Requirements for the Degree of DOCTOR OF PHILOSOPHY Major Department: Animal Sciences November 2016 Fargo, North Dakota

Welcome message from author
This document is posted to help you gain knowledge. Please leave a comment to let me know what you think about it! Share it to your friends and learn new things together.
Transcript

THE IMPACT OF DIGESTIVE ENZYMES IN THE RUMINANT ANIMAL
A Dissertation
Submitted to the Graduate Faculty
of the
North Dakota State University
of Agriculture and Applied Science
By
Faithe Elizabeth Keomanivong
In Partial Fulfillment of the Requirements
for the Degree of
DOCTOR OF PHILOSOPHY
Major Department
Animal Sciences
November 2016
Fargo North Dakota
North Dakota State University
Graduate School
Title THE IMPACT OF DIGESTIVE ENZYMES IN THE RUMINANT
ANIMAL
By
Faithe Elizabeth Keomanivong
The Supervisory Committee certifies that this disquisition complies with North Dakota
State Universityrsquos regulations and meets the accepted standards for the degree of
DOCTOR OF PHILOSOPHY
SUPERVISORY COMMITTEE
Dr Kendall Swanson
Chair
Dr Marc Bauer
Dr Joel Caton
Dr Lawrence Reynolds
Dr Kevin Sedivec
Approved
November 16 2016 Dr Greg Lardy
Date Department Chair
iii
ABSTRACT
Understanding the enzymatic activity in ruminant digestive systems is essential for
securing adequate growth reproduction and overall metabolism In order to evaluate the impact
of various nutritional sources and dietary strategies on enzymatic activity five experiments were
designed Experiment 1 examined the influence of nutrient restriction and melatonin
supplementation on maternal and fetal pancreatic development Experiment 2 explored various
phases of the reproductive cycle and the impact of intravenous arginine infusion amid differing
levels of feed intake Experiment 3 determined the effectiveness of realimentation during
advancing stages of gestation Experiments 4 and 5 examined the impact of variable rations on
ruminal pH NH3 VFA total gas and methane concentration and enzymatic activity in steers
consuming rations of fine- vs coarse-rolled corn and 20 vs 40 DDGS (Experiment 4) and
corn vs barley based diets with low- vs moderate-oil DDGS (Experiment 5) Overall nutrient
restriction caused reduced BW pancreatic mass and pancreatic enzyme activity in mature
animals In Experiment 1 the addition of dietary melatonin diminished the impact of nutrient
restriction on maternal pancreatic mass and α-amylase activity while reducing the secretion of
insulin and size of insulin-containing cell clusters Fetal pancreatic enzymes were unaffected by
treatment however pancreatic morphology exhibited greater insulin-containing cell cluster size
in fetuses from adequately fed dams In Experiment 2 arginine infusion did not alter pancreatic
exocrine or endocrine function during the various luteal stage phases In Experiment 3
realimentation during different stages of gestation decreased the impact of reduced feed intake
and in some cases allowed for compensatory gain of the exocrine pancreas The maternal and
fetal endocrine pancreas was unaffected Mature animals had greater changes in pancreatic
exocrine secretions whereas fetuses differed mainly in endocrine function as a result of improper
iv
nutritional status Comparison of pancreatic tissue revealed a greater quantity and larger size of
insulin-containing cell clusters in fetuses which appear to separate as the animal matures
Differences in rumen enzymatic activity was found in Experiments 4 and 5 however despite
changes in lag time of gas production or ruminal degradation rates the concentration of
greenhouse gases (CH4 or CO2) produced were unaffected
v
ACKNOWLEDGEMENTS
I would like to extend my sincere gratitude to all who helped make the completion of this
dissertation possible I am forever indebted to my major professor Dr Kendall Swanson for
giving me the opportunity to obtain my doctoral degree in Animal Science and for his continual
leadership encouragement and patience as I worked to complete this goal I would also like to
thank Dr Marc Bauer Dr Joel Caton Dr Lawrence Reynolds and Dr Kevin Sedivec my
committee members for their guidance and assistance in learning during my time at NDSU
Thank you to the other faculty members that I have had the opportunity to work with (Dr
Kim Vonnahme Dr Pawel Borowicz Dr Carl Dahlen Dr Anna Grazul-Bilska Dr Dale
Redmer Dr Casie Bass Dr Eric Berg Dr Caleb Lemley Dr Leticia Camacho Dr Alison
Meyer Dr Md Borhan and Dr Shafiqur Rahman) The passion and expertise that these
professors show for teaching and research was truly an inspiration to me and I am forever
grateful to you for your contribution to my education and future
Some special thanks go to James Kirsch Marsha Kapphahn Wanda Keller Laurie
Geyer the staff at the Animal Nutrition and Physiology Center Jennifer Young and my fellow
graduate students for their willingness to assist me in laboratory analysis animal care and
handling and comfort during the stress of graduate school
I would also like to thank my parents and siblings (Kristina David and Theodore) for
always being there to listen reassuring me and pushing me to continue in my pursuit of an
advanced degree Without their help none of this would have been possible Finally I would like
to thank my husband Jamie Keomanivong for your ability to make me smile even in the most
stressful of situations and your dedication to stand by my side and take hold of my hand through
it all
vi
DEDICATION
To my best friend and loving husband
Jamie Keomanivong
vii
TABLE OF CONTENTS
ABSTRACT iii
ACKNOWLEDGEMENTS v
DEDICATION vi
LIST OF TABLES xiii
LIST OF FIGURES xv
LIST OF ABBREVIATIONS xvi
CHAPTER 1 INTRODUCTION AND LITERATURE REVIEW 1
11 The Importance of the Ruminant Animal 1
12 Overview of Digestive Enzymes 2
13 Carbohydrates 5
131 Fiber Digestion in the Rumen 5
132 Starch Digestion in the Rumen 6
133 Starch Digestion in the Small Intestine 7
14 Fat 8
141 Fat Digestion in the Rumen 8
142 Fat Digestion in the Small Intestine 8
15 Protein 9
151 Protein Digestion in the Rumen 9
152 Protein Digestion in the Small Intestine 10
16 Production of VFA 11
17 Impact of Nutrition on the Pancreatic Endocrine System 13
18 Development of the Ruminant Digestive System 15
181 Fetal Stage 15
182 Post-natal Growth 17
viii
19 Improving Nutrient Absorption 18
191 Distillerrsquos Inclusion Rate and Feed Processing Methods to Enhance Enzymatic
Activity and Improve Nutrient Utilization 18
192 Addition of Enzymes to Improve Nutrient Utilization 21
110 Environmental Sustainability 23
1101 Methane 24
111 Literature Summary 25
112 Literature Cited 26
CHAPTER 2 INFLUENCE OF NUTRIENT RESTRICTION AND MELATONIN
SUPPLEMENTATION OF PREGNANT EWES ON MATERNAL AND FETAL
PANCREATIC DIGESTIVE ENZYMES AND INSULIN-CONTAINING CLUSTERS 42
21 Abstract 42
22 Implications 43
23 Introduction 44
24 Materials and Methods 45
241 Animals and Dietary Treatments 45
242 Sample Collection 46
243 Pancreatic Protein α-Amylase Trypsin and Lipase Activity Analyses 47
244 Determination of Insulin-Positive Tissue Area in Pancreas 47
245 Histological Analysis 48
246 Insulin Analysis of Blood Plasma 49
247 Statistical Analysis 49
25 Results 49
26 Discussion 57
27 Literature Cited 61
ix
CHAPTER 3 THE IMPACT OF DIET AND ARGININE SUPPLEMENTATION ON
PANCREATIC MASS DIGESTIVE ENZYME ACTIVITY AND INSULIN-
CONTAINING CELL CLUSTER MORPHOLOGY DURING THE ESTROUS CYCLE
IN SHEEP 65
31 Abstract 65
32 Introduction 66
33 Materials and Methods 68
331 Animal Dietary Groups 68
332 Saline and Arg Treatments 69
333 Blood and Tissue Collection 70
334 Serum Insulin Concentration 70
335 Pancreatic Protein α-Amylase and Trypsin Activity Analyses 71
336 Immunohistochemistry 71
337 Histological Analysis 72
338 Statistical Analysis 73
34 Results 73
35 Discussion 76
36 Literature Cited 82
CHAPTER 4 EFFECTS OF REALIMENTATION AFTER NUTRIENT
RESTRICTION DURING MID- TO LATE GESTATION ON PANCREATIC
DIGESTIVE ENZYMES SERUM INSULIN AND GLUCOSE LEVELS AND
INSULIN-CONTAINING CELL CLUSTER MORPHOLOGY 88
41 Abstract 88
42 Introduction 89
43 Materials and Methods 92
431 Animals and Dietary Treatments 92
432 Sample Collection 93
x
433 Analysis of Pancreatic Protein Concentration and α-Amylase and Trypsin
Activity 93
434 Serum Insulin and Glucose Analysis 95
435 Immunohistochemistry 95
436 Histological analysis 96
437 Statistical Analysis 97
44 Results 98
441 Maternal Enzyme Data 98
442 Maternal Endocrine and Histological Data 101
443 Fetal Enzyme Data 103
444 Fetal Endocrine and Histological Analysis 105
445 Comparison of Maternal and Fetal Enzyme Data 107
45 Discussion 108
451 Maternal Enzyme Data 108
452 Maternal Endocrine and Histological Data 110
453 Fetal Enzyme Data 112
454 Fetal Endocrine and Histological Data 113
455 Comparison of Maternal and Fetal Enzyme Data 114
456 Comparison of Maternal and Fetal Endocrine and Histological Data 114
46 Conclusion 115
47 Literature Cited 115
CHAPTER 5 INFLUENCE OF DRY-ROLLED CORN PROCESSING AND
DISTILLERS GRAIN INCLUSION RATE ON RUMINAL PH AMMONIA AND
VOLATILE FATTY ACID CONCENTRATION IN VITRO METHANE
CONCENTRATION AND ENZYME ACTIVITY 124
51 Abstract 124
52 Introduction 125
xi
53 Materials and Methods 127
531 Animals Experimental Design and Dietary Treatments 127
532 Laboratory Analysis 129
533 Ruminal pH Determination 130
534 NH3 and VFA Analysis 130
535 Gas Production Rate 130
536 Ruminal α-Amylase Trypsin Activity and Maltase Activity 131
537 Calculations and Statistical Analysis 132
54 Results 133
55 Discussion 135
56 Conclusion 140
57 Literature Cited 140
CHAPTER 6 IMPACT OF GRAIN SOURCE AND DRIED DISTILLERS GRAIN
WITH SOLUBLES WITH LOW OR MODERATE OIL CONCENTRATIONS ON
RUMINAL PH AMMONIA AND VOLATILE FATTY ACID CONCENTRATION IN
VITRO METHANE AND CARON DIOXIDE CONCENTRATION AND ENZYME
ACTIVITY 146
61 Abstract 146
62 Introduction 147
63 Materials and Methods 148
631 Animals Experimental Design and Dietary Treatments 148
632 Laboratory Analysis 149
633 Ruminal pH NH3 and VFA Analysis 151
634 Gas Production Rate 152
635 Rumen α-Amylase Trypsin Activity and Maltase Activity 153
636 Calculations and Statistical Analysis 153
64 Results 154
xii
65 Discussion 156
66 Literature Cited 162
CHAPTER 7 SUMMARY AND CONCLUSIONS 168
xiii
LIST OF TABLES
Table Page
2-1 Influence of nutrient restriction and melatonin supplementation on maternal BW
pancreas weight and pancreatic enzymes at 130 days of gestation 50
2-2 Influence of nutrient restriction and melatonin supplementation on insulin
concentration and measurements of insulin containing clusters in maternal pancreas
at 130 days of gestation 52
2-3 Influence of nutrient restriction and melatonin supplementation on fetal BW
pancreas weight and pancreatic enzymes at 130 days of gestation 53
2-4 Influence of nutrient restriction and melatonin supplementation on insulin
concentration and measurements of insulin containing clusters in fetal pancreas at
130 days of gestation 54
2-5 Influence of nutrient restriction and melatonin supplementation on plasma insulin
concentrations (uIUmL) at 130 days of gestation 55
2-6 Influence of physiological stage (maternal vs fetal) on digestive enzyme activity and
ratio of insulin-positive staining and islet size at 130 days of gestation 56
3-1 Dietary Composition and Nutrient Analysis 69
3-2 Influence of nutrient restriction and arginine treatment on BW BCS pancreatic mass
and digestive enzymes in non-pregnant ewes 74
3-3 Influence of nutrient restriction and arginine treatment on serum insulin and
measurements of insulin containing clusters in pancreas in non-pregnant sheep 78
4-1 Influence of realimentation after nutrient restriction during mid- to late gestation on
maternal pancreatic digestive enzymes 99
4-2 Influence of realimentation after nutrient restriction during mid- to late gestation on
maternal serum and pancreatic insulin concentration and measurements of insulin-
containing cell clusters 102
4-3 Influence of realimentation after nutrient restriction during mid- to late gestation on
fetal pancreatic digestive enzymes 104
4-4 Influence of realimentation after nutrient restriction during mid- to late gestation on
fetal serum and pancreatic insulin concentration and measurements of insulin-
containing cell clusters 106
4-5 Comparison of maternal vs fetal pancreatic digestive enzymes during mid- to late
gestation 108
xiv
4-6 Comparison of fetal vs maternal serum and pancreatic insulin concentration and
measurements of insulin-containing cell clusters 109
5-1 Dietary composition and analyzed nutrient concentration of diets (DM basis) 128
5-2 Ruminal pH and VFA profiles of steers fed coarse- vs fine-rolled corn with 20 vs
40 dried distillerrsquos grains with solubles (DDGS) 134
5-3 Gas production and in vitro methane concentration of steers fed coarse- vs fine-
rolled corn with 20 vs 40 dried distillerrsquos grains with solubles (DDGS) 136
5-4 Ruminal enzyme activity of steers fed coarse- vs fine-rolled corn with 20 vs 40
dried distillerrsquos grains with solubles (DDGS) 137
6-1 Dietary composition and analyzed nutrient concentration of diets (DM basis) 150
6-2 Analyzed Nutrient Concentration of DDGS (DM basis) 151
6-3 Ruminal NH3 and VFA profiles of steers consuming corn- vs barley-based diets with
variable distillerrsquos oil concentration 155
6-4 Gas production and in vitro CH4 and CO2concentration of steers consuming corn- vs
barley-based diets with variable distillerrsquos oil concentration 157
6-5 Rumen enzyme activity of steers consuming corn- vs barley-based diets with
variable distillerrsquos oil concentration 158
xv
LIST OF FIGURES
Figure Page
1-1 Schematic representation of the production of VFA in the large intestine (from Pryde
et al 2002) 12
2-1 Influence of nutrient restriction and melatonin supplementation on insulin-positive
staining Sections represent the maternal and corresponding fetal pancreatic tissues
of representative ewes fed 5 mgd melatonin and receiving 100 of nutrient
requirements (a and b) and 60 of nutrient requirements (c and d) The white arrows
indicate insulin-containing clusters Magnification 10x 60
3-1 Diet times Treatment interaction on change in BW and final BW in non-pregnant ewes 75
3-2 Influence of diet and treatment on insulin-positive staining 79
4-1 Diagram of experimental design adapted from Camacho et al 2014 94
4-2 Representative images of insulin-containing cell clusters represented by sections of
maternal and corresponding fetal pancreatic tissue of cows receiving 100 NRC
recommendations 97
5-1 Data are represented as ruminal pH over a 24-hr period 133
6-1 Data are represented as ruminal pH over a 24-hr period 159
xvi
LIST OF ABBREVIATIONS
˚Cdegrees Celsius
microL microliter
microm micrometer
ADF acid detergent fiber
ADG average daily gain
ADQ adequate
ARG arginine
BCS body condition score
BSA bovine serum albumin
BW body weight
CCDS condensed corn distillerrsquos solubles
CH4 methane
cm centimeter
CON control
CO2 carbon dioxide
CP crude protein
d day
DGS distillerrsquos grains with solubles
DDGS dried distillerrsquos grains with solubles
DM dry matter
EE ether extract
EDTA ethylenediaminetetraacetic acid
hour hr
g grams
xvii
kgkilograms
L liter
m meters
mm millimeters
MEL melatonin
mL milliliter
mM millimolar
min minute
NaCl sodium chloride
NDF neutral detergent fiber
NUT nutrition
OM organic matter
RES restricted
SEM Standard error of the mean
TBST tris-buffered saline with tween
TEMED tetramethylethylenediamine
U unit
vs versus
WDGS wet distillerrsquos grain with solubles
wk week
wt weight
1
CHAPTER 1 INTRODUCTION AND LITERATURE REVIEW
11 The Importance of the Ruminant Animal
The worldrsquos population is predicted to increase to 11 billion people by 2100 This
accounts for a growth of 53 compared to its current level of 72 billion (World Population
Prospects 2012) Unfortunately it has also been calculated that food insecurity currently affects
nearly 795 million people (FAO 2015) Of these 140 million are children under the age of 5
(WHO 2013)
While many are lead to believe that only undeveloped countries are enduring such
suffering this has proven to be untrue Within the United States nearly 185 of the population is
experiencing poverty (Reynolds et al 2015) and therefore are unable to afford adequate
nutrition The tragedy of undergoing such malnutrition is consequently one of the leading causes
of death and disability
Therefore the need to increase the food supply is significantly related to future health
This includes not only physical and mental health but also plays a strong role in future academic
achievement and financial productivity impacting the nations as a whole (Seligman et al 2010)
Due to such an effect researchers are quickly working to increase the efficiency of livestock
production to provide food and economic growth to the world (Thorton 2010)
In regards to livestock some of the greatest nutritional resources obtained by the
population are provided by ruminants due to their ability to utilize cellulosic feed sources which
would otherwise be indigestible by humans This can be considered a benefit (Oltjen and
Beckett 1996 Jayathilakan et al 2012) In order to produce significant meat and milk products
2
however it is important to consider the efficiency of their digestive tracts and determine the
value of the products generated and also to factor in the environmental impact of the animal
12 Overview of Digestive Enzymes
The anatomy of the ruminant digestive system includes the mouth esophagus four
compartment stomach (rumen reticulum omasum and abomasum) pancreas gall bladder liver
small intestine (duodenum jejunum and ileum) and large intestine (cecum colon and rectum)
The impact of these organs on nutrient utilization is highly variable depending on the feed source
provided and maturity of the animal (Church 1988) Therefore in order to gain a further
understanding extensive research must be continued One area of focus that has gained
considerable interest is on the subject of enzymatic activity
An enzyme can be defined as an organic catalyst that facilitates a chemical reaction
without being affected Within the ruminant animal enzymatic secretions are found throughout
the digestive tract For example the mouth of the ruminant contains salivary glands which
secrete the enzyme known as salivary lipase to begin the breakdown of fat (Van Soest 1982)
These glands are also responsible for the secretion of salivary buffers such as phosphate and
bicarbonate in an effort to keep the pH of the rumen and reticulum within 55 to 75 and
maximize ruminal microbial activity (Franzolin and Dehority 2010)
After ingestion the feed travels down the esophagus and into the rumen and reticulum
Little separation exists between these organs as food and water easily pass between the two Due
to this feed is predominantly exposed to similar microorganisms responsible for the synthesis of
digestive enzymes such as amylase β-glucanase maltase lipase cellulase pectinase protease
xylanase and tannase (Jenkins 1993 Wang and McAllister 2002) Amylase is predominantly
3
responsible for the breakdown of starch into the components of glucans and maltose (Swanson et
al 2000) β-glucanase and maltase then further this breakdown into glucose molecules more
easily available for microorganisms or absorption by the rumen papillae The fats ingested by the
animal undergo breakdown by lipase (Bauchart 1993) while the enzymes responsible for
digestion of the plant cell wall polymers include cellulase pectinase protease and xylanase
Tannase is also an important enzyme as it is responsible for the degradation of specific plant
toxins (Wang and McAllister 2002) While these enzymes are capable of breaking down many
nutrients some feed components continue traveling along the digestive tract for further
degradation
In addition to the rumen fermentation occurs in the omasum at a similar rate The folds
of the omasum begin to absorb fluid contained in the digesta (Prins et al 1972) whereas the
remaining nutrients enter the abomasum Within the abomasum protein is further broken down
by enzymes such as pepsin and rennin (Guilloteau et al 1985) Lysozyme is also produced to
break down the cell walls of the bacteria passing through the abomasum helping to provide
microbial protein (Kisia 2010) Despite an alkaline secretion by chief cells the pH in the
abomasum is typically 2 to 4 (Jackson and Cockcroft 2002) The pH is reduced largely as a
result of H+ that is being secreted and used to continue the digestion of feed particles
Once leaving the abomasum digesta enters the first compartment of the small intestine
known as the duodenum Although the pH in the abomasum was low it is quickly neutralized in
the duodenum as digesta is being subjected to an alkaline bile secretion from the gall bladder and
bicarbonate released by the pancreas (Noble 1978) Enzymes secreted by the pancreas are also
important for the breakdown of nutrients Those most commonly recognized in pancreatic
secretions include amylases lipases and proteases As discussed before amylases are responsible
4
for the breakdown of carbohydrates such as starch into dextrins maltose and isomaltose Next
the enzymes known as maltase and isomaltase become active and continue to digest the maltose
and isomaltose into glucose (Croom et al 1992 Harmon 1993) The enzyme lipase works with
bile salts and colipase to break down triglycerides into monoglycerides and finally free fatty
acids Proteins also face further breakdown in this area by proteases such as elastase gelatinase
chymotrypsin and trypsin Chymotrypsin and trypsin first appear as inactive proenzymes called
chymotrypsinogen and trypsinogen Once these proenzymes are secreted into the duodenum they
are activated by enterokinase (also known as enteropeptidase) secreted from intestinal glands
called the crypts of Lieberkuumlhn (Pizauro et al 2004) and continue the breakdown of the majority
of proteins into peptides In addition to the enzymes discussed here the pancreas is also
responsible for the secretion of ribonuclease and deoxyribonuclease which is responsible for
degrading RNA and DNA
Further activity of these enzymes continues within the brush border of the intestine
Disaccharidases such as maltase lactase isomaltase trehalase etc continue the breakdown of
sugar to allow its absorption through the intestinal wall and into the blood stream
Aminopeptidase and dipeptidase help to further the denaturing of proteins into amino acids
Nuclease is also present and begins the breakdown of nucleotides Nutrients incapable of further
degradation in the small intestine continue to move into the large intestine where microbial
fermentation occurs Finally undigested components (as well as endogenous components) are
excreted from the body through the rectum
While the enzymes that have been listed are commonly secreted it is important to note
that the microbial community within the gastrointestinal tract is highly impacted by the nutrients
5
ingested and this determines the number and composition of enzymes present (Yanke et al
1995)
13 Carbohydrates
131 Fiber Digestion in the Rumen
Fiber is a component of carbohydrates which includes cellulose hemicellulose and
soluble fibers such as fructans pectans galactans and beta-glucans (Parish and Rhinehart
2008) Fibers such as cellulose are commonly composed of crosslinked linear chains of glucose
molecules which are connected in a β-14 linkage (Sujani and Seresinhe 2015) and can be found
in amorphous or crystalline forms The bacteria capable of breaking down these cellulolytic
forms are predominantly Bacteroides succinogenes Ruminococcus albus (degrading amorphous
cellulose) and Ruminococcus flavefaciences (hydrolyzing crystalline cellulose Varga and
Kolver 1997 Morales and Dehority 2014)
Hemicellulose is degraded by hemicellulase through a non-specific hydrolysis of β-14
xylosidic linkages (Kamble and Jadhav 2012) The enzymes involved in the breakdown of
cellulose are C-1 cellulase which breaks up the hydrogen bonds and makes glucose more easily
accessible for further hydrolysis by C-x cellulase which will then degrade the chains of
cellobiose to glucose (Otajevwo 2011) The solubility of hemicellulose occurs much quicker
than cellulose
Once the plant matures lignin has been found to fill spaces between the cell walls in
cellulose hemicellulose and pectin It is able to make the plant fiber highly indigestible due to
the cross links which it forms with the sugar molecules of these components (Moreira et al
2013) The addition of starch or sugar in the diet of ruminants also has a tendency to reduce fiber
6
digestibility (Mertens and Loften 1980 Hoover 1986) Once leaving the rumen no further
digestion occurs in the small intestine as no pancreatic enzymes are capable of breaking down
cellulose Remaining fiber components can be fermented by microbes in the large intestine and
what is remaining is expelled through the rectum
132 Starch Digestion in the Rumen
Cattle saliva contains no amylolytic enzymes but secretions from the nasal labial glands
in the nose do contain amylolytic activity Regardless this amount is not sufficient enough to
contribute to breakdown of starch Instead degradation is primarily conducted by the
microorganisms found in the rumen producing extracellular amylase Some examples of these
microorganisms include Bacteroides amylophilus Streptococcus bovis Succinimonas
amylolytica and Succinovibrio dextrinosolvens (McAllister et al 1990) These bacteria are
responsible for using the amylase to cause fragmentation of the interior glycosidic linkages of the
starch chain which leads to the reduction in its molecular size and forms oligosaccharides such as
maltose maltotriose and sometimes small amounts of free glucose (Harmon 1993) Typically
these oligosaccharides are unaffected by the further action of α- and β-amylases unless large
quantities of enzymes are added
Due to the inability to be broken down amylopectin products are formed containing
maltose maltotriose small amounts of glucose and a mixture of α-limit dextrins The α-limit
dextrins consist of 4-8 glucose moieties and contain α-(16) linkages which canrsquot be hydrolyzed
by amylases Instead they require debranching enzymes such as R-enzyme pullulanase iso-
amylase or α-limit dextrinase (Cerrilla and Martίnez 2003) while the starch that has been
degraded to maltose or glucose undergoes fermentation by saccharolytic microbes such as
7
Bacteroides ruminicola Butyrivibrio fibrosolvens and Selenomonas ruminantium (Walker and
Hope 1964)
133 Starch Digestion in the Small Intestine
Although typically 70 or more of starch is digested in the rumen it is possible that
these nutrients have escaped fermentation and will now be subjected to breakdown by the
pancreas and small intestine (Nocek and Tamminga 1991 Oslashrskov 1986 Owens et al 1986
Harmon et al 2004) Upon entering the small intestine the starch is exposed to pancreatic
amylase Again this initiates the hydrolysis of amylose and amylopectin into branched chain
products and oligomers of 2 or 3 glucose units Brush border disaccharidases such as maltase
and isomaltase then hydrolyze the oligomers Once glucose has been formed it is transferred
from the lumen into the bloodstream through either active transport The active transport of
intestinal glucose is mediated by sodium-dependent glucose transporter 1 (SGLT1) It is found in
the brush border membrane of the enterocytes (Swanson et al 2000 Wood et al 2000 Harmon
2009) Transport is driven by an electrochemical gradient maintained by Na+K+ ATPase and
GLUT2 located in the basolateral membrane The glucose travels from the intestine through the
hepatic portal blood to the liver GLUT2 is responsible for providing basolateral exit as it helps
to facilitate glucose transport across the cell membrane from the liver to the veins throughout the
body (Lohrenz et al 2011 Roumlder et al 2014) Although the starch escaping ruminal digestion
was then subjected to breakdown in the small intestine only 35 to 60 is fully degraded while
the rest continues in the digestive tract to the large intestine to undergo further fermentation
(Harmon et al 2004) The cause for the escape includes insufficient amylase or maltase
activity inadequate glucose absorption the inability to degrade the structural effects or an
increase in the passage rate of the starch (Russell et al 1981 Owens et al 1986)
8
14 Fat
141 Fat Digestion in the Rumen
Fats are commonly added to ruminant diets to increase the energy density provided in a
ration and improve feed efficiency These may be included in either a ruminal protected or non-
protected form Although the non-protected form is broken down in the rumen the protected
forms remain stable until reaching the abomasum and provides direct absorption and digestibility
in the intestine Regardless of their form fats are typically insoluble in water and may be referred
to as lipids and classified into two categories including glycolipids and triglycerides Glycolipids
are those found in the stems and leaves of forages and are composed of two fatty acids linked to
glycerol Triglycerides are the predominant lipid found in cereal grains and distillerrsquos coproducts
(Bauman et al 2003) These are composed of three fatty acids linked to glycerol making it more
efficient at storing energy
In order to undergo breakdown in the rumen lipids are exposed to lipolysis and
biohydrogenation (Hawke and Silcock 1969) Lipolysis is carried out by anaerobic rumen
bacteria such as Anaerovibrio lipolytica Butyrivibrio fibrisolvens Clostridium and
Propionicbacterium (Jenkins 1993 Jenkins et al 2008 Jarvis and Moore 2010) which secrete
the hydrolytic enzymes esterase and lipase These enzymes initiate degradation of ester bonds
holding the fatty acids to their glycerol backbones (Priveacute et al 2015) Once released these fatty
acids are either polyunsaturated or monounsaturated and undergo further degradation via
microbial biohydrogenation of the double bonds
142 Fat Digestion in the Small Intestine
Due to non-protected lipids being hydrolyzed in the rumen the majority of those reaching
the small intestine are in the form of saturated nonesterified fatty acids however some may
9
remain as triglycerides or enter the small intestine as bacterial phospholipids (Arienti et al 1974
Bauchart 1993) Upon reaching the small intestine the esterified lipids undergo emulsification
This includes the cleavage of the ester bonds on the surface of the fat globule again resulting in
the formation of fatty acids and glycerol However because these globules are hydrophobic the
lipase is only capable of cleaving the ester bonds on the outside of the fat globules In order to
mitigate this the liver produces bile to be stored in the gall bladder This bile contains
phospholipids which help to break down the fat globules and create emulsion droplets (Bauer et
al 2005) After this lipase is able to attach to the surface of the emulsion droplets by connecting
to an amphopathic molecule called colipase (Bauchart 1993) This breakdown then forms fatty
acids capable of being absorbed into the small intestine through enterocytes
15 Protein
151 Protein Digestion in the Rumen
Ruminants consume sources of protein and non-protein nitrogen The protein consumed
is classified as rumen degradable or rumen undegradable Bacteria known as Prevotella
(formerly Bacteroides) ruminicola and Butyrivibrio fibrisolvens are found within the rumen and
produce proteolytic enzymes such as proteases peptidases and deaminases to help break down
the rumen degradable protein (Selinger et al 1996 Wallace 1996) while the undegradable
protein maintains its structure The enzymatic action on degradable protein produces amino acids
which are rapidly deaminated into keto-acids and ammonia (NH3) The non-protein nitrogen is
also rapidly degraded to produce NH3 Regardless of its source ruminal bacteria then utilize this
NH3 for the synthesis of microbial crude protein to be passed to the intestine (van der Walt and
Meyer 1988) It has been proposed that 60 to 90 of the nitrogen received through intake in the
10
ruminant diet on a daily basis is converted to NH3 accounting for approximately 50-70 of the
bacterial nitrogen derived (Leng and Nolan 1984) While these numbers seem large it is
important to remember that some microbes also utilize amino acids or peptides rather than
ammonia (Russell et al 1992)
The abundant amount of NH3 produced can also be very beneficial to the ruminal
environment as it helps to keep the pH near a neutral zone to allow greater activity of microbial
species While some NH3 leaves the rumen via absorption through the epithelium and into the
portal vein the rest continues to be flushed into the small intestine
152 Protein Digestion in the Small Intestine
The proteins supplied to the small intestine are the result of ruminally undegradable
dietary protein microbial cells and endogenous secretions (Harmon 1993) and require a greater
amount of time to be broken down As the concentration of bicarbonate secreted by the pancreas
is lower in ruminants than it is in monogastrics proteolysis along the small intestine is
prolonged This allows trypsin chymotrypsin and carboxipeptidase more time to become active
and help to break down some of the remaining protein components into peptides amino acids
Amino acids and small peptides are absorbed through the small intestine The remaining
undegradable protein and microbial crude protein that have not been absorbed will transfer to the
large intestine and undergo fermentation where they will be absorbed or recycled The microbial
proteolytic enzymes present in the cecum are made up of protease deaminase and urease
activities (van der Walt and Meyer 1988) Here the products of fermentation are ammonia and
microbial protein Any urea that has made it to this point of the large intestine is likely to be
converted to NH3 by urease and absorbed into the blood stream Amino acids that are not stored
11
for the synthesis of protein can also be converted to NH3 when the amino-N is removed and urea
is formed while the carbon skeleton is then oxidized to CO2 (Bach et al 2005)
Ammonia that is transported from the digestive tract (primarily the rumen) is typically
sent to the liver for synthesis of urea From here it can be recycled to the saliva or rumen where it
passes through the rumen wall and becomes a source of N to the microbes Urea can also be
transported post-ruminally to the small or large intestine which occurs predominantly under the
control of plasma urea nitrogen Urea not recycled to the gastrointestinal tract is excreted in
urine
16 Production of VFA
While rumen microbes are responsible for providing enzymes and acting as nutrients
they also produce volatile fatty acids (VFA) including acetate isobutyrate butyrate propionate
isovalerate and valerate (Church 1988 Dijkstra 1993) Those most commonly investigated
however include only acetate butyrate and propionate (Jha and Berrocoso 2016) and therefore
will be the focus of the following sections
In general the production of these VFA occurs in the rumen and large intestine as the
dietary carbohydrates such as cellulose hemicellulose pectin starch and soluble sugars are
fermented into glucose This glucose is then used to produce VFA when converted into pyruvate
via the Embden-Meyerhof glycolytic pathway (France and Dijkstra 2005)
Once reaching the stage of pyruvate formation acetate may be obtained in one of two
ways (Figure 1-1)
12
Figure 1-1 Schematic representation of the production of VFA in the large intestine (from Pryde
et al 2002) 1 = Methanogenesis 2 = reductive acetogenesis 3 = butyryl CoAacetate CoA
transferase 4 = phosphotransbutyrylasebutyrate kinase 5 = phosphotransacetylaseacetate
kinase 6 = lactate dehydrogenase 7 = acrylate pathway 8 = succinate decarboxylation
The first involves the conversion via the pyruvate-formate lyase system outlined as
follows pyruvate + CoA rarr acetyl-CoA + formate rarr acetate The second pathway used to
create acetate is known as the pyruvate-ferredoxin oxidoreductase pathway This pathway is
conducted through pyruvate rarr reduced ferredoxin rarr acetyl-CoA rarr acetyl phosphate rarr acetate
and occurs through oxidation and the release of hydrogen (Hungate 1966 Baldwin and Allison
1983)
The synthesis of butyrate also involves two differing pathways The first includes
pyruvate rarr acetyl-CoA rarr acetoacetyl-CoA rarr β-hydroxybutyryl-CoA rarr crotonyl-CoA rarr
butyryl-CoA rarr butyrate while the second requires the reversal of β-oxidation pyruvate rarr
13
acetyl-CoA rarr acetoacetyl-CoA rarr β-hydroxybutyryl-CoA rarr crotonyl-CoA rarr butyryl-CoA rarr
butyryl-phosphate rarr butyrate (Leng 1970 Yarlett et al 1985 Nafikov and Beitz 2007) While
butyrate is formed in the rumen it is predominantly converted to ketone bodies during absorption
through the epithelium In fact 3 times more ketone bodies are found than butyrate in the portal
vein (Lomax and Baird 1983 Lozano et al 2000) Once reaching the liver the remaining
butyrate is also converted into ketone bodies
The level of propionate produced rises when the ruminant animal is consuming high-
grain diets Its leading cause of production is through the dicarboxylic acid pathway pyruvate rarr
oxaloacetate rarr malate rarr fumarate rarr succinate rarr methylmalonyl CoA rarr propionate
However propionate may also be produced through the acrylate pathway pyruvate rarr lactate rarr
acrylate rarr propionate (Baldwin et al 1965 Cheeke and Dierenfeld 2010) After absorption
through the rumen epithelium propionate is transported to the liver through the portal vein
system where it either undergoes a conversion to glucose via gluconeogenesis or is utilized as an
energy source throughout the body via oxidation (Chow and Jesse 1992)
Glucose that is not converted to VFA may also be used as energy for bacterial growth or
converted into gases such as CO2 or CH4
17 Impact of Nutrition on the Pancreatic Endocrine System
Insulin is an important hormone within the body as it is the primary hormone involved in
glycogenesis and regulating the glucose supply to cells Its secretion from the pancreas is
responsible for the proper metabolism of carbohydrates proteins and lipids Insulin also acts as
a major anabolic hormone which functions to preserve nutrients and serve as a regulator of feed
intake This is accomplished by insulin signaling the liver muscle and fat cells to take in the
14
excess glucose from the blood and either store it as glycogen or use it as an energy source
primarily for protein synthesis (Dimitriadis et al 2011 Oh et al 2015) These processes then
work to provide adequate energy for the bodyrsquos growth and functionality which consequently
change drastically depending on what stage of life the animal is in For example the bodyrsquos
energy requirements are high during periods of late gestation or early lactation and more
nutrients will typically need to be consumed during these times (Bell and Bauman 1997)
The amount of feed consumed is not the only area which deserves consideration The
functions of the nutrients provided by the feed are also important While acetate has not been
shown to cause significant effects on insulin secretion both butyrate and propionate have
Excessive butyrate production may indicate a diabetic concern as it has been found that during
periods of inadequate nutrient consumption as is typically seen during early lactation an
increased number of free fatty acids are passed to the liver and initiate increased production of β-
hydroxybutyrate and ketone bodies resulting in ketosis and initiating hypoglycemia During this
time it has also been shown that insulin secretion is lowered resulting in diabetes mellitus
(Brockman 1979)
Propionate has been shown to contribute 32 to 73 of the hepatic glucose synthesis in
ruminants (Oh et al 2015) This is due to propionate acting as the major substrate for
gluconeogenesis It enters the system via propionyl-CoA carboxylase methylmalonyl-CoA
mutase and the cytosolic form of phosphoenolpyruvate carboxykinase (PEPCK) Propionate
shows a high metabolic priority and will continue its impact on gluconeogenesis even if glucose
is adequately supplied (Aschenbach et al 2010) The production of excess levels of propionate
however may cause a reduction in feed intake when cattle are fed diets composed of highly
fermentable feedstuffs (Bradford et al 2006) This has been demonstrated in cattle undergoing
15
infusion of propionate into the rumen and blood stream via the mesenteric vein and portal vein
(Allen et al 2009) Such infusion has been shown to initiate hypophagic responses
In the past researchers have provided supplemental propionate intravenously in an
attempt to counteract the occurrence of growth retardation in Japanese black cattle While the
concentration of insulin in the plasma increased the concentration of glucagon decreased
(Takasu et al 2007) In another study conducted by Sano et al (1999) it was found that the
intravenous injection of propionate resulted in an increased plasma glucose concentration in
growing calves but no changes in the glucose concentrations in lactating animals Regardless of
the lack of change in glucose concentration the concentration of insulin in the blood by both the
growing and lactating cattle increased
Although diabetic conditions are the most well-known harmful effects surrounding
insulin resistance there are many more areas that are impacted such as female fertility through
its action on gonadotropin-releasing hormone and the stimulation of the uptake of amino acids
(Demigneacute et al 1988)
18 Development of the Ruminant Digestive System
181 Fetal Stage
During development the fetus is dependent on its mother for providing adequate
nutrition The nutrients it receives have already undergone significant breakdown in order to
allow it to be absorbed into the blood stream and transferred to the embryo (Dunlap et al 2015)
Despite previous nutrient degradation Guilloteau et al (1984) evaluated the fetal digestive
system of bovines and found the abomasal and pancreatic glands to contain a large number of
digestive enzymes The enzymes discovered included chymosin colipase lipase chymotrypsin
16
and trypsin while pepsin and amylase were not measurable It has also been found that the
weight of the pancreas relative to body weight changed very little throughout the majority of
gestation however during the last three months in utero the pancreatic weight was shown to
increase at a slower rate than whole body weight (Guilloteau et al 2009)
Although the mother is responsible for providing nutritional resources to the fetus there
are times throughout the production year where meeting these needs can be challenging When
faced with this issue changes in the functionality and growth of the fetal digestive system may
occur regardless of genetics (Godfrey and Barker 2000 Reynolds et al 2010) These changes
are known as developmental programming and relate to the impact that the intrauterine
environment has on the health and well-being of the fetus as it advances in maturity (Barker
2004 Langley-Evans 2006 Reynolds and Caton 2012)
The mechanisms controlling developmental programming according to Reynolds and
Caton (2012) include ldquo(1) irreversible alterations in tissue and organ structure and (2) permanent
changes in tissue functionrdquo These changes may occur throughout all stages of fetal development
and cause permanent changes regarding the growth and function of its digestive system (Barker
2004 Reynolds et al 2010 Reynolds and Caton 2012 Oberbauer 2015) Unfortunately not
only is the fetus affected but these issues have been shown to induce multigenerational
consequences transferred via modifications of the epigenetic genome (Pribyl et al 2008)
Although there is much research to be done there have been some advances in
determining how to mitigate the downfalls associated with poor developmental periods of the
fetus One thought for example is to provide the mother with an adequate level of nutrients
before parturition Much of the development of the fetus will occur during the third trimester
and therefore realimentation has been implicated to ldquorescuerdquo fetal development during this
17
time As seen in several species realimentation has been able to increase the body weight of
restricted fetuses to a mass that matches those provided adequate nutrition (Gonzalez et al
2013) The same results were seen regarding organ weights and functionality of the fetal
digestive system (Wiecek et al 2011)
Gaining an understanding of fetal development when faced with malnutrition is
extremely important as well Although offspring may have been negatively influenced during
fetal development they were still able to survive Therefore there are several aspects to
consider If a breed of animals is likely to endure the issue of nutrient restriction for a prolonged
period of time the fact that they are still able to conceive could be extremely beneficial This
however depends on the adaptive ability of the neonates to utilize ingested nutrients in a more
efficient way through adaptation of physiological processes such as exocrine and endocrine
functions More work is needed in this research area
182 Post-natal Growth
Upon birth cattle and sheep are technically non-ruminants because of the closure of the
reticular groove during nursing This closure ensures the nutrients found in the milk are
transported directly to the omasum bypassing reticulorumen degradation While the microbial
environment of the reticulorumen may not be well developed following parturition the animal is
quickly exposed to bacteria protozoa and fungi through nursing and environmental exposure
(Morgavi et al 2015) The mass of the digestive organs also quickly changes as the animal
matures and the diet transitions from milk to solid feed (Jami et al 2013)
Within the first 2 days of extra-uterine life of a bovine the weight of the pancreas varies
little from that present at birth In sheep however the weight is expected to increase by 18
Once a week has passed measurements have shown that the pancreatic weight of both species is
18
increased by 30 of that at birth and from this point on appears to remain relatively stable
(Guilloteau et al 2009)
While the abomasum is the largest compartment of the stomach at birth it has been
shown to decrease in size relative to BW as the animal continues to develop and to ingest greater
amounts of dry matter At this point the reticulorumen begins to expand as it includes the growth
of the rumen papillae to enhance nutrient absorption and increased muscular development to
improve the movement of feed (Harrison et al 1960)
In relation to maternal realimentation many producers are apt to implement
compensatory gain strategies after an animal is born and subjected to nutrient restriction
Compensatory gain is defined as a period of accelerated growth following a lengthy time of
restricted development Meyer and Clawson (1964) suggest that the increased gain is caused by
increased energy utilization in feed Coleman and Evans (1986) investigated compensatory gain
and its relation to breed age and previous rate of gain and found that older-control steers gained
faster than younger-control steers while younger-restricted steers had higher rates of gain than
older-restricted steers These results suggest that the animals previous weight age and rate of
growth can influence how great the compensatory gain will be
19 Improving Nutrient Absorption
191 Distillerrsquos Inclusion Rate and Feed Processing Methods to Enhance Enzymatic
Activity and Improve Nutrient Utilization
Grain-based co-products like distillerrsquos grains are a common feedstuff in finishing diets
in North America because of their accessibility nutritional value and cost per unit of energy
They have proven to be extremely beneficial in improving feed efficiency of cattle In a finishing
19
trial Ham and colleagues (1994) found cattle consuming either wet distillerrsquos grain with solubles
(WDGS) or dried distillerrsquos grain with solubles (DDGS) fed at 40 DM showed faster and more
efficient rates of gain than those fed dried rolled corn alone Additionally Klopfenstein et al
(2008) discovered similar beneficial results across all experiments in his meta-analysis of nine
studies where DGS were fed to feedlot cattle These studies showed that animals consuming the
distillerrsquos grain with solubles (DGS) had both higher average daily gain (ADG) and gain to feed
(GF) ratios than those that were fed only corn-based diets without DGS
With the positive results of increased ADG and gain efficiency seen in feedlot trials
many producers have chosen to incorporate condensed corn distillerrsquos solubles (CCDS)
supplementation to offset the negative impact of grazing inadequate forages (Lardy 2007)
Microorganisms within the rumen slowly degrade the protein found in the low-quality forage and
this low level of degradation causes a deficiency in metabolizable protein which adversely
impacts the animals growth (Klopfenstein et al 2001) By supplementing cattle with an
increasing energy source linear increases in weight gain can occur as was seen by Lake et al
(1974) Morris et al (2005) and MacDonald et al (2007) revealed supplementing forage-fed
steers with DDGS has been shown to improve ADG and GF ratios while decreasing forage
intake as well
In both cases of either feedlot or pasture supplementation the increase in feeding value is
thought to be partially due to the rumen undegradable protein (RUP) in DGS in conjunction with
the idea that the fat may also be slightly protected from ruminal degradation This protection
permits more unsaturated fat to make its way into the duodenum and allows for a higher total
tract fat digestibility (Klopfenstein et al 2008) Higher concentrations of RUP also allow for a
larger number of available amino acids (Belyea et al 2010) and is fundamental in the optimal
20
development and productivity of growing ruminants (Mercer and Annison 1976) Larson et al
(1993) stated that the undegradable protein and fat in WDGS had the potential to raise the
feeding value almost 20 over whole corn while studies by Aines et al (1985) show that DDGS
have a bypass value almost 160 greater than that of soybean meal When consumed through
drinking over 50 of thin stillage bypassed ruminal fermentation (Dehaan et al 1982)
The lower cost of DGs and their potential for increasing cattle performance make the use
of these coproducts an attractive option for feeding livestock However when including DDGS
in cattle rations it is important to consider not only the nutrient variability but also the inclusion
level Buckner et al (2007) conducted a feedlot finishing trial in order to determine the effects of
feeding varying levels of DDGS in corn-based diets on cattle performance In this study Buckner
assigned 250 steers to six different treatments with five pens per treatment and eight steers per
pen Treatments consisted of cattle being fed with 0 10 20 30 40 and 50 DDGS
replacing dry-rolled corn on a DM basis All diets also contained 10 corn silage and 25
ground alfalfa hay to obtain a roughage level of 75 At the conclusion of the 167-day trial
Buckner and colleagues observed quadratic trends in ADG and final BW with increasing levels
of DDGS from 10-40 They also noticed however an increased incidence of
polioencephalomalacia when cattle were fed DDGS at 50 DDGS on a DM basis Because of
these findings Buckner suggests that optimal gains occur when DDGS are included at 20
dietary DM
Additionally in an experiment conducted by Gunn et al (2009) steers with similar body
weight were fed corn-based diets supplemented with either 25 or 50 of dietary DM as DDGS
The researchers found that increasing the inclusion level of DDGS to 50 negatively impacted
the live animal performance and was believed to be partially due to the negative effect of dietary
21
fat on rumen fermentation implying that 50 is too great of an inclusion level to be beneficial
While provision of distillerrsquos grains has many beneficial attributes it is also important to
account for the reduction of starch that occurs during its production (Klopfenstein et al 2008
Subramaniam et al 2016) One approach to improve performance in cattle fed DDGS is to
change the level of the corn grain processing Many different methods of processing feeds have
been used to improve starch availability One method commonly employed by feed mills is to
utilize mechanical processing of the whole grain In addition to increasing starch digestibility
this has also been shown to improve animal performance (Galyean et al 1979 and Galyean
1996) Some of these processing methods include steam flaking dry rolling grinding pelleting
etc The benefit of this is allowing enzymes greater access to the nutrients and helps to increase
ruminal fermentation and post-ruminal digestibility (Xiong et al 1991) When examining starch
digestion steam-rolling caused a greater retention period within the rumen than dry rolling
(Zinn 1994) The longer retention time within the rumen allowed for a greater production and
absorption of VFA (Ortega and Mendoza 2003)
While it has proven to be beneficial to provide ruminants with adequate starch
digestibility the source of the starch was shown to impact nutrient utilization Consumption of
the diet has also been shown to decrease with increasing starch intake (Moharrery et al 2014)
Although a great deal of care is taken in formulating rations it is impossible to obtain a perfectly
consistent product and ensure the animal is eating and using the diet in an effective manner
Therefore the research studying variable rations must continue to be explored
192 Addition of Enzymes to Improve Nutrient Utilization
In order to increase livestock performance and the efficiency of nutrient utilization by
ruminants supplemental enzymes have been developed (Beauchemin et al 1997) While several
22
studies have shown beneficial results for ADG others have found little or negative outcomes
(Kercher 1960 Perry et al 1960 Beauchemin et al 2004) This is likely the result of the
variable feed components included in the diet For example when working to determine the
impact of a mixture of xylanase (Xylanase B Biovance Technologies Inc Omaha NE) and
cellulase products (Spezyme CPreg 17 Genencor Rochester NY) on high grain diets composed
of either 95 corn or barley the only increase in feed efficiency with barley diets while feed
efficiency of cattle fed corn diets remained unaffected (Beauchemin et al 1995) Other studies
have shown that the inclusion of exogenous amylase tended to reduce digestibility lag time as
well as increase the rate of fermentation (Gallo et al 2016) While it may seem extremely
beneficial to increase the breakdown of such nutrients it has been determined that increases in
some enzymatic activity may hinder the response of others For example Harmon (1992) stated
that increases in pancreatic protease content may be associated with decreased amylase content
Increased pancreatic amylase however may be associated with decreased protease and lipase
secretion indicating that there is a significant interaction between the activity of these enzymes
which needs to be considered during ration formulation Another concern may be related to the
idea that the ruminal microorganisms will adapt to the enzymes being supplemented and
therefore stop producing as many enzymes themselves or opportunistic organisms without
extracellular enzymes will benefit
A reason these enzymes have been shown to be beneficial is reflected on their ability to
break down cellulose before entering the rumen As stated before when high grain diets are fed
the pH of the rumen has been shown to drop significantly This drop then impacts the growth and
functionality of the anaerobic microbes responsible for the synthesis of fibrolytic enzymes The
supplemental enzymes however have the ability to counteract this reduction and remain active
23
upon entering the rumen (Muzakhar et al 1998) Approximately 40 to70 of the dry matter
found in a forage-based ration is composed of plant cell walls and when undergoing digestion
typically only 65 of these cell walls are able to be degraded (Beauchemin et al 2004) This
too needs to be taken into consideration
Although the addition of enzymes to ruminant diets may currently be an expensive
process and further research is needed it is quickly gaining interest as would not only influence
feed degradation and nutrient utilization but may also help reduce nutrient excretion and the
generation of greenhouse gases (Li et al 2009)
In Asia rice is a primary crop While the rice itself is not a viable feed source for
ruminants the rice straw is commonly fed Unfortunately the straw is composed largely of
lignin which is hard to digest by the microbes in the rumen Therefore feed additives are
typically utilized during the ensiling process to make the nutrients more available for ruminant
digestion (Oladosu et al 2016) When not being provided to the ruminant the crop straws are
typically burned The burning of crop straws causes the loss of nutrients with calculations
showing a reduction of 30 to 35 of phosphorus 40 of nitrogen 40 to 50 of sulfur and 80 to
85 of potassium which may otherwise have proven to be beneficial to the animal (Dobermann
and Fairhurst 2002)
110 Environmental Sustainability
By 2050 the global number of cattle is predicted to grow to 26 billion whereas goats and
sheep will increase to 27 billion (Thorton 2010) Despite the advantage of providing foods for
human consumption the environmental impact of livestock production also needs to be
considered (Steinfeld 2006) One area of concern is the increase in land needed to provide an
24
adequate feed for ruminants In 2014 it was calculated that livestock encompassed 26 of the
terrestrial surface on the planet (Ripple et al 2014) While 40 of grasslands remain leaving
room for livestock growth in order to keep up with the demands predicted for 2050 it is
believed that some countries will require a 30 to 50 increase in the amount of land used for
animal production (Machovina et al 2015) In addition to the utilization of the land the level of
greenhouse gases emitted from ruminants must also be taken into consideration Researchers
have calculated that agriculture contributes up to 18 of greenhouse gas emission (Steinfeld
2006) while livestock are predicted to be responsible for 3 (Pitesky et al 2009) Much of this
difference is accounted for by the variables included in each calculation such as feed production
and overall transportation Regardless there is no doubt that ruminants are capable of producing
greenhouse gases through enteric fermentation
1101 Methane
The rumen environment is anaerobic and as fermentation continues gases such as carbon
dioxide (CO2) methane (CH4) and hydrogen sulfide (H2SO4) are produced and rise above the
liquid fraction of the rumen and are expelled during eructation While the concentration of CO2
may be more abundant there has always been greater concern over the global warming potential
of CH4 Over a 100-year period CH4 is considered to have a global warming potential 23 times
higher than that of CO2 (IPCC 2000)
Many feeding strategies have been implicated to start helping to reduce methane One of
the most common methods is centered on the inclusion of ionophores into the diet Once
ionophores are included ruminants have been shown to have reduced enteric methane emissions
by 30 (L kg of DMI) during the first 2 weeks or 27 during the first 4 weeks (Guan et al
2006) It is also important to consider not only the concentrate level of the diet but also the
25
length of time the diet is to be provided (Hook et al 2011) This is an important consideration as
the ruminal pH is a major indicator of the carbon and hydrogen concentrations available for the
production of CH4 As stated when ruminants are fed high-concentrate diets their rumen pH
will begin to drop This then impacts the ruminal bacteria responsible for regulating the acetate
to propionate ratio As the ratio begins to decrease CH4 production also will decline (Hatew et
al 2015 Russell 1998)
While the production of VFA are essential to the growth of the animal they also have an
environmental impact through the production of CO2 and H2 When examining the stoichiometry
of VFA production it can be seen that acetate is responsible for producing two moles of CO2 and
four moles of H2 per mole of glucose fermented Methanogens will then shift these compounds
and form one mole of CO2 and one mole of CH4 per mole of glucose fermented Butyrate is also
responsible for generating greenhouse gases through the production of 15 moles of CO2 and 05
moles of CH4 per mole of glucose fermented Propionate however will not result in the
formation of CO2 and requires the input of reducing equivalents leading to a decrease in CH4
production (Sejrsen et al 2006)
111 Literature Summary
Digestive enzymes play a critical role in the breakdown and utilization of nutrients They
also have a profound impact on the production of volatile fatty acids which in turn effects the
endocrine function of the pancreas as well as influence the concentration of greenhouse gases
expelled by the ruminant Therefore the objectives of these studies were to 1) obtain a further
understanding of enzymatic activity relating to the impact of dietary components and level of
maturity (Chapter 2) 2) investigate the effects of arginine infusion during different stages of the
26
estrus cycle (Chapter 3) 3) explore the impact of realimentation on fetal pancreatic development
during various stages of gestation (Chapter 4) 4) and determine the beneficial aspects of rumen
enzymatic function when feeding various levels of distillerrsquos grain with corn grain of different
sizes (Chapter 5) and 5) examine enzymatic activity when feeding a corn vs barley based ration
with variable levels of fat in distillerrsquos grain (Chapter 6) The impact of the enzymes on the
animalrsquos endocrine system VFA production and greenhouse gas production is also important
and has been additionally included in these trials
112 Literature Cited
Aines G T J Klopfenstein and R A Britton 1985 Thin stillage Potential use in ruminant
diets NE Beef Cattle Rpt MP4662
Allen MS B J Bradford and M Oba 2009 Board-invited review The hepatic oxidation
theory of the control of feed intake and its application to ruminants J Anim Sci
873317-3334
Arienti G F A Harrison and W M F Leat 1974 The lipase activity of sheep pancreatic juice
Q J Exp Physiol 6015ndash24
Aschenbach J R N B Kristensen S S Donkin H M Hammon and G B Penner 2010
Gluconeogenesis in dairy cows The secret making of sweet milk from sour dough Life
12869-877
Bach A S Calsamiglia and M D Stern 2005 Nitrogen metabolism in the rumen J Dairy Sci
88E9-E21
Baldwin R L and M J Allison 1983 Rumen metabolism J Anim Sci 57461-477
27
Baldwin R L W A Wood and R S Emery 1965 Lactate metabolism by Peptostreptococcus
els denii Evidence for lactyl coenzyme A dehydrase Biochim Biophys Acta 97 202
Barker D J P 2004 Developmental origins of well-being Philos Trans Royal Soc London
3591359ndash1366
Bauchart D 1993 Lipid absorption and transport in ruminants J Dairy Sci 763864-3881
Bauer E S Jakob and R Mosenthin 2005 Principles of physiology of lipid digestion Asian-
Aust J Anim Sci 18282-295
Bauman D E J W Perfield M J de Veth and A L Lock 2003 New perspectives on lipid
digestion and metabolism in ruminants In lsquoProceedings of the Cornell nutrition
Conferencersquo pp 175ndash189
Beauchemin K A D Colombatto D P Morgavi W Z Yang and L M Rode 2004 Mode of
action of exogenous cell wall degrading enzymes for ruminants Can J Anim Sci
8413-22
Beauchemin K A S D M Jones L M Rode and V J H Sewalt 1997 Effects of fibrolytic
enzyme in corn or barley diets on performance and carcass characteristics of feedlot
cattle Can J Anim Sci 77645-653
Beauchemin K A L M Rode and V J H Sewalt 1995 Fibrolytic enzymes increase fiber
digestibility and growth rate of steers fed dry forages Can J Anim Sci 75641-644
Bell A W and D E Bauman 1997 Adaptations of glucose metabolism during pregnancy and
lactation J Mammary Gland Biol Neoplasia 2265-278
Belyea R L K D Rausch T E Clevenger V Singh D B Johnston and M E Tumbleson
2010 Sources of variation in composition of DDGS Anim Feed Sci and Tech 159122-
130
28
Bradford B J A D Gour A S Nash and M S Allen 2006 Propionate challenge tests have
limited value for investigating bovine metabolism J Nutr 71915-1920
Brockman R P 1979 Roles for insulin and glucagon in the development of ruminant ketosis -a
review Can Vet J 20121-126
Buckner C D T L Mader G E Erickson S L Colgan K K Karges and M L Gibson
2007 Optimum levels of dry distillers grains with solubles for finishing beef steers NE
Beef Cattle Rpt MP9036ndash38
Cerrilla M E O and G M Martίnez 2003 Starch digestion and glucose metabolism in the
ruminant a review Interciencia 7380-386 ISSN 0378-1844
Cheeke P R and E S Dierenfeld 2010 Comparative animal nutrition and metabolism
Wallingford Oxfordshire UK CABI
Church D C (ed) 1988 The ruminant animal digestive physiology and nutrition Prentice-
Hall Englewood Cliffs NJ 564 p
Chow J C and E W Jesse 1992 Interactions between gluconeogenesis and fatty acid
oxidation in isolated sheep hepatocytes J Dairy Sci 752142-2148
Coleman S W and B C Evans 1986 Effect of nutrition age and size on compensatory
growth in two breeds of steers J Anim Sci 631968-1982
Croom W J -Jr L S Bull and I L Taylor 1992 Regulation of pancreatic exocrine secretion
in ruminants a review J Nutr 122191-202
DeHaan K T Klopfenstein R Stock S Abrams and R Britton 1982 Wet distillers
byproducts for growing ruminants NE Beef Cattle Rpt MP4333
Demigneacute C C Yacoub C Morand and C Reacutemeacutesy 1988 Findings on intermediate
metabolism in ruminants Reprod Nutr Dev 281-17
29
Dijkstra J 1993 Production and absorption of volatile fatty acids in the rumen Livestock
Production Science 3961-69
Dimitriadis G P Mitrou V Lambadiari E Maratou and S A Raptis 2011 Insulin effects in
muscle and adipose tissue Diabetes Res Clin Pract 93S52-59
Dobermann A and T H Fairhurst 2002 Rice straw management Better Crops International
167ndash11
Dunlap K A J D Brown A B Keith and M C Satterfield 2015 Factors controlling nutrient
availability to the developing fetus in ruminants J Anim Sci and Biotech 616
FAO 2015 The state of food security in the world Meeting the 2015 international hunger
targets taking stock of uneven progress
France J and J Dijkstra 2005 Volatile fatty acid production in J Dijkstra JM Forbes J
France (Eds) Quantitative Aspects of Ruminant Digestion and Metabolism 2nd CABI
Publishing Wallingford UK157ndash176
Franzolin R and Dehority B A 2010 The role of pH on the survival of rumen protozoa in
steers 2010 R Bras Zootec 392262-2267
Gallo A G Giuberti S Duval M Moschini and F Masoero 2016 Short communication The
effect of an exogenous enzyme with amylolytic activity on gas production and in vitro
rumen starch degradability of small and large particles of corn or barley meals J Dairy
Sci 993602ndash3606
Galyean M L 1996 Protein levels in beef cattle finishing diets industry application university
research and systems results J Anim Sci 742860ndash2870
Galyean M L D G Wagner and R R Johnson 1976 Site and extent of starch digestion in
steers fed processed corn rations J Anim Sci 431088ndash1094
30
Godfrey K M and D J Barker 2000 Fetal nutrition and adult disease Am J Clin Nutr
71(Suppl)1344S-1352S
Gonzalez J M L E Camacho S M Ebarb K C Swanson K A Vonnahme A M Stelzleni
and S E Johnson 2013 Realimentation of nutrient restricted pregnant beef cows
supports compensatory fetal muscle growth J Anim Sci 914797-4806
Guan H K M Wittenberg K H Ominski and D O Krause Efficiency of ionophores in cattle
diets for mitigation of enteric methane J Anim Sci 841896-1906
Guilloteau P T Corring R Toullec and R Guilhermet 1985 Enzyme potentialities of the
abomasum and pancreas of the calf II Effects of weaning and feeding a liquid
supplement to ruminant animals Reprod Nutr Dev 25481-493
Guilloteau P T Corring R Toullec and J Robelin 1984 Enzyme potentialities of the
abomasum and pancreas of the calf I--Effect of age in the preruminant Reprod Nutr
Dev 24315-25
Guilloteau P R Zabielski and J W Blum 2009 Gastrointestinal tract and digestion in the
young ruminant ontogenesis adaptations consequences and manipulations J Physiol
Pharm 6037-46
Gunn P J A D Weaver R P Lemenager D E Gerrard M C Claeys and S L Lake 2009
Effects of dietary fat and crude protein on feedlot performance carcass characteristics
and meat quality in finishing steers fed differing levels of dried distillers grains with
solubles J Anim Sci 872882-2890
Harrison H N R G Warner E G Sander and J K Loosli 1960 Changes in the tissue and
volume of the stomachs of calves following the removal of dry feed or consumption of
inert bulk J Dairy Sci 431301-1312
31
Harmon D L 1992 Impact of nutrition on pancreatic exocrine and endocrine secretion in
ruminants a review J Anim Sci 701290-1301
Harmon D L 1993 Nutritional regulation of postruminal digestive enzymes in ruminants J
Dairy Sci 762102-2111
Harmon D L 2009 Understanding starch utilization in the small intestine of cattle Asian-Aust
J Anim Sci 22915-922
Harmon D L R M Yamka and N A Elam 2004 Factors affecting intestinal starch digestion
in ruminants a review Can J Anim Sci 84309-318
Hatew B S C Podesta H Van Laar W F Pellikaan J L Ellis J Dijkstra and A Bannink
2015 Effects of dietary starch content and rate of fermentation on methane production in
lactating dairy cows J Dairy Sci 98 486-499
Hawke J C and W R Silcock 1969 Lipolysis and hydrogenation in the rumen Biochem J
112131
Hook S E M A Steele K S Northwood A D Wright and B W McBride 2011 Impact of
high-concentrate feeding and low ruminal pH on methanogens and protozoa in the rumen
of dairy cows Microb Ecol 6294-105
Hoover W H 1986 Chemical factors involved in ruminal fiber digestion J Dairy Sci 692755-
2766
Hungate R E 1966 The Rumen and its Microbes Academic Press New York
IPCC 2000 Good practice guidance and uncertainty management in national greenhouse gas
inventories Intergovernmental panel on climate change ICPPOECDIEAIGES
Hayama Japan
32
Jackson P G G P D Cockcroft and Wiley InterScience (Online service) 2002 Clinical
examination of farm animals Oxford UK Blackwell Science
Jami E A Israel A Kotser and I Mizrahi 2013 Exploring the bovine rumen bacterial
community from birth to adulthood ISME J 71069-1079
Jarvis G N and E R B Moore 2010 Lipid metabolism and the rumen microbial ecosystem
In K N Timmis (ed) Handbook of hydrocarbon and lipid microbiology Springer Berlin
Heidelberg p 2246ndash2257
Jayathilakan K K Sultana K Radhakrishna and A S Bawa 2012 Utilization of byproducts
and waste materials from meat poultry and fish processing industries a review Journal
of Food Science and Technology 49278-293
Jenkins T C 1993 Symposium Advances in ruminant lipid metabolism J Dairy Sci 763851-
3863
Jenkins T C R J Wallace P J Moate and E E Mosley 2008 Recent advances in
biohydrogenation of unsaturated fatty acids within the rumen microbial ecosystem J
Anim Sci 86 397ndash412
Jha R and J F D Berrocoso 2016 Dietary fiber and protein fermentation in the intestine of
swine and their interactive effects on gut health and on the environment A review
Animal Feed Science and Technology 212 18-26
Kamble R D and A R Jadhav 2012 Isolation identification and screening of potential
cellulase-free xylanase producing fungi and its production Afr J Biotechnol 1114175-
14181
Kercher J 1960 Value of diallylstilbesterol and Zymo-pabst enzyme preparation for fattening
yearling steers J Anim Sci 19 966
33
Kisia S M 2010 Vertebrates Structures and functions Boca Raton FL CRC Press
Klopfenstein T J G E Erickson and V R Bremer 2008 Board invited review Use of
distillers by-products in the beef cattle feeding industry J Anim Sci 861223-1231
Klopfenstein T J R A Mass K W Creighton and H H Patterson 2001 Estimating forage
protein degradation in the rumen J Anim Sci 79(E Suppl)E208ndashE217
Lake R P R L Hildebrand and D C Clanton 1974 Limited energy supplementation of
yearling steers grazing irrigated pasture and subsequent feedlot performance J Anim
Sci 39827ndash833
Langley-Evans S C 2006 Developmental programming of health and disease Proc Nutr Soc
6597-105
Lardy G 2007 Feeding co products of the ethanol industry to beef cattle AS-1242
httpwwwagndsuedupubsanscibeefas1242pdf Accessed Jan 14 2011
Larson E M R A Stock T J Klopfenstein M H Sindt and R P Huffman 1993 Feeding
value of wet distillers byproducts for finishing ruminants J Anim Sci 712228ndash2236
Leng R A 1970 Biochemistry I (Nitrogen and carbohydrate metabolism) In Phillipson AD
(Ed) Physiology of Digestion in the Ruminant Oriel Press Newcastle Upon Tyne UK
pp 406-421
Leng R A and J V Nolan 1984 Nitrogen metabolism in the rumen J Dairy Sci 671072-
1089
Li X Z C G Yan S H Choi R J Long G K Jin and M K Song 2009 Effects of addition
level and chemical type of propionate precursors in dicarboxylic acid pathway on
fermentation characteristics and methane production by rumen microbes in vitro Asian-
Aust J Anim Sci 22 82-89
34
Lohrenz A K K Duske U Schӧnhusen B Losand H M Seyfert C C Metges and H M
Hammon 2011 Glucose transporters and enzymes related to glucose synthesis in small
intestinal mucosa of mid-lactation dairy cows fed 2 levels of starch J Dairy Sci
944546-4555
Lomax M A and G D Baird 1983 Blood flow and nutrient exchange across the liver and gut
of the dairy cow Effects of lactation and fasting British J Nutr 49481-496
Lozano O C B Theurer A Alio J T Huber A Delgado-Elorduy P Cuneo D DeYoung
M Sadik and R S Swingle 2000 Net absorption and hepatic metabolism of glucose L-
lactate and volatile fatty acids by steers fed diets containing sorghum grain processed as
dry-rolled or steam-flaked at different densities J Anim Sci 781364-1371
MacDonald J C T J Klopfenstein G E Erickson and W A Griffin 2007 Effects of dried
distillers grains and equivalent undegradable intake protein or ether extract on
performance and forage intake of heifers grazing smooth brome grass pastures J Anim
Sci 852614ndash2624
Machovina B K J Feeley and W J Ripple 2015 Biodiversity conservation The key is
reducing red meat consumption Sci Total Environ 536419-431
McAllister T A K ndashJr Cheng L M Rode and C W Forsberg 1990 Digestion of barley
maize and wheat by selected species of ruminal bacteria Appl Environ Microbiol
563146-3153
Mercer J R and E F Annison 1976 Utilization of nitrogen in ruminants Protein Metabolism
and Nutrition EAAP Pub No 16 Butterworths London
Meyer J H and W J Clawson 1964 Undernutrition and subsequent realimentation in rats and
sheep J Anim Sci 23214
35
Mertens D R and J R Loften 1980 The effect of starch on forage fiber digestion kinetics in
vitro J Dairy Sci 631437-1446
Moharrery A M Larsen and M R Weisbjerg 2014 Starch digestion in the rumen small
intestine and hind gut of dairy cows- A meta-analysis Anim Feed Sci Tech 1921-14
Morales M S and B A Dehority 2014 Magnesium requirement of some of the principal
rumen cellulolytic bacteria Animal 81427-1432
Moreira L M F de Paula Leonel R A M Vieira and J C Pereira 2013 A new approach
about the digestion of fibers by ruminants RBSPA 382-395
Morgavi D P E Rathahao-Paris M Popova J Boccard K F Nielsen and H Boudra 2015
Rumen microbial communities influence metabolic phenotypes in lambs Front
Microbiol 61060
Morris S T J Klopfenstein and D Adams 2005 Effects of dried distillers grains on heifer
consumption of low or high quality forage J Anim Sci 82 (Suppl 2)52 (Abstr)
Muzakhar K H Hayashii T Kawaguchi J Sumitani and M Arai 1998 Purification and
properties of α-L-arabinofuranosidase and endo-β-D-14-galactanase from Aspergillus
niger KF-267 which liquefied the okara MIE Bioforum Genetics Biochemistry and
Ecology of Cellulose Degradation Suzuka Japan p 133
Nafikov R A and D C Beitz 2007 Carbohydrate and lipid metabolism in farm animals J
Nutr 137702-705
Noble R C 1978 Digestion absorption and transport of lipids in ruminant animals Prog Lipid
Res 1755-91
Nocek J E and S Tamminga 1991 Site of digestion of starch in the gastrointestinal tract of
dairy cows and its effect on milk yield and composition J Dairy Sci 743598-3629
36
Oberbauer A M 2015 Developmental programming the role of growth hormone J Anim Sci
68
Oh Y K J S Eun S C Lee G M Chu S S Lee and Y H Moon 2015 Responses of blood
glucose insulin glucagon and fatty acids to intraruminal infusion of propionate in
hanwoo Asian-Australas Journal of Animal Science 2200-206
Oladosu Y M Y Rafii N Abdullah U Magaji G Hussin A Ramli and G Miah 2016
Fermentation quality and additives A case of rice straw silage Biomed Res Int
20167985167
Oltjen J W and J L Beckett 1996 Role of ruminant livestock in sustainable agricultural
systems J Anim Sci 71406-1409
Oslashrskov E R 1986 Starch digestion and utilization in ruminants J Anim Sci 631624-1633
Ortega C M E and G D Mendoza 2003 Starch digestion and glucose metabolism in the
ruminant A review Interciencia 28380-386
Otajevwo F D 2011 Cultural conditions necessary for optimal cellulase yield by
cellulolyticbacterial organisms as they relate to residual sugars released in broth medium
Mod Appl Sci 5141-151
Owens F N R A Zinn and Y K Kim 1986 Limits to starch digestion in the ruminant small
intestine J Anim Sci 631634-1648
Parish J A and J D Rhinehart 2008 Fiber in beef cattle diets Mississippi State University
Extension Service publication 2489
Perry T W D D Cope and W M Beeson 1960 Low vs high moisture shelled corn with and
without enzymes and stilbestrol for fattening steers J Anim Sci 19 1284
37
Pitesky M E K R Stackhouse and F M Mitloehner 2009 Clearing the air Livestockrsquos
contribution to climate change Adv Agron 1031-40
Pizauro J M -Jr J A Ferro A C F de Lima K S Routman and M C Portella 2004 The
zymogen-enteropeptidase system A practical approach to study the regulation of enzyme
activity by proteolytic cleavage Biochem Mol Biol Educ 3245-48
Prins R A R E Hungate and E R Prast 1972 Function of the omasum in several ruminant
species Comparative biochemistry and physiology part A Physiology 43155-163
Pribyl J H Krejcova J Pribylova N Mielenz J Kucera and M Ondrakova 2008 Estimation
of genetic potential of bulls in a case of environmental limitation and compensation of
growth J of Agrobiology Vol 25 Iss15-7
Priveacute F J C Newbold N N Kaderbhai S G Girdwood O V Golyshina P N Golyshin N
D Scollan and S A Huws 2015 Isolation and characterization of novel
lipasesesterases from a bovine rumen metagenome Appl Microbiol Biotechnol
995475-5485
Pryde S E S H Duncan G L Hold C S Stewart and H J Flint 2002 The microbiology of
butyrate formation in the human colon FEMS Microbiology Letters 217133-139
Reynolds L P and J S Caton 2012 Role of the pre- and post-natal environment in
developmental programming of health and productivity Mol Cell Endocrinol 35454-59
Reynolds L P M C Wulster-Radcliffe D K Aaron and T A Davis 2015 Importance of
animals in agricultural sustainability and food security J Nutr 1451377-1379
Reynolds L P P P Borowicz J S Caton K A Vonnahme J S Luther C J Hammer K R
Maddock Carlin A T Grazul-Bilska and D A Redmer 2010 Developmental
38
programming The concept large animal models and the key role of uteroplacental
vascular development J Anim Sci 88E61-E72
Ripple W J P Smith H Haberl S A Montzka C McAlpine and D H Boucher 2014
Ruminants climate change and climate policy Nature Climate Change Volume 4
Roumlder P V K E Geillinger T S Zietek B Thorens H Koepsell and H Daniel 2014 The
role of SGLT1 and GLUT2 in intestinal glucose transport and sensing PLoS One
2e89977
Russell J B 1998 The importance of pH in the regulation of ruminant acetate to propionate
ratio and methane production in vitro J Dairy Sci 813222-3230
Russell J B J D OrsquoConnor D G Fox P J Van Soest and C J Sniffen 1992 A net
carbohydrate and protein system for evaluating cattle diets I Ruminal fermentation J
Anim Sci 703551-3561
Russell J R A W Young and N A Jorgensen 1981 Effect of dietary corn starch intake on
pancreatic amylase and intestinal maltase and pH in cattle J Anim Sci 521177-1182
Sano H H Arai A Takahashi H Takahashi and Y Terashima 1999 Insulin and glucagon
responses to intravenous injections of glucose arginine and propionate in lactating cows
and growing calves Can J Anim Sci 309-314
Seligman H K B A Laraia and M B Kushel 2010 Food insecurity is associated with
chronic disease among low-income NHANES participants Journal of Nutrition 140304-
310
Sejrsen K T Hvelplund and M O Nielsen 2006 Ruminant physiology digestion
metabolism and impact of nutrition on gene expression immunology and stress
Wageningen Wageningen Academic Publishers 600
39
Selinger L B C W Forsberg and K -Jr Cheng 1996 The rumen a unique source of
enzymes for enhancing livestock production Anaerobe 2263-284
Steinfeld H 2006 Livestocks long shadow Environmental issues and options Rome Food and
Agriculture Organization of the United Nations
Subramaniam E M G Colazo M Gobikrushanth Y Q Sun A L Ruiz-Sanchez P Ponce-
Barajas M Oba D J Ambrose 2016 Effects of reducing dietary starch content by
replacing barley grain with wheat dried distillers grains plus solubles in dairy cow rations
on ovarian function J Dairy Sci 992762-2774
Sujani S and R T Seresinhe 2015 Exogenous enzymes in ruminant nutrition A review Asian
J Anim Sci 985-99
Swanson K C J C Matthews A D Matthews J A Howell C J Richards and D L
Harmon 2000 Dietary carbohydrate source and energy intake influence the expression
of pancreatic amylase in lambs J Nutr 1302157-2165
Takasu M Y Kishima N Nishii Y Ohba S Maeda K Miyazawa T Murase and H
Kitagawa 2007 Insulin and glucagon secretory patterns during propionate and arginine
tolerance tests in Japanese black cattle with growth retardation J Vet Med Sci 169-72
Thorton P K 2010 Livestock production recent trends future prospects Phil Trans Soc B
3652853-2867
van der Walt J G and J H F Meyer 1988 Protein digestion in ruminants S Afr J Anim Sci
1830-41
Van Soest P J 1982 Nutritional ecology of the ruminant Ithaca Comstock Pub
Varga G A and E S Kolver 1997 Microbial and animal limitations to fiber digestion and
utilization J Nutr 127819S-823S
40
Walker G J and P M Hope 1964 Degradation of starch granules by some amylolytic bacteria
from the rumen of sheep Biochem J 90398
Wallace R J 1996 The proteolytic systems of ruminal microorganisms Ann Zootech 45301-
308
Wang Y and McAllister T A 2002 Rumen microbes enzymes and feed digestion- a review
Asian-Aust J Anim Sci 151659-1676
Wiecek J A Rekiel and J Skomial 2011 Effect of restricted feeding and realimentation
periods on compensatory growth performance and physiological characteristics of pigs
Arch Anim Nutr 6534-35
WHO 2013 httpwwwunscnorglayoutmodulesresourcesfilesrwns5pdf
Wood I S J Dyer R R Hoffman S P Shirazi-Beechey 2000 Expression of the Na+glucose
co-transporter (SGLT1) in the intestine of domestic and wild ruminants Pflugers Arch
441155-162
World Population Prospects The 2012 revision of the world population prospects population
estimates and projections section [Internet] New York Population Division Department
of Economic and Social Affairs UN 2012 [cited 2016 November 16] Available from
httpesaunorgwpp
Xiong Y S J Bartle and R L Preston 1991 Density of steam flaked sorghum grain roughage
level and feeding regime for feedlot steers J Anim Sci 69 1707-1718
Yanke L J L B Selinger and K-J Cheng 1995 Comparison of cellulolytic and xylanolytic
activities of anaerobic rumen fungi Proceedings 23rd Biennial Conf Rumen Function
Chicago IL p 32
41
Yarlett N D Lloyd and A G Williams 1985 Butyrate formation from glucose by the rumen
protozoon Dasytricha ruminantium Biochem J 228187-192
Zinn R A 1994 Influence of flake thickness on the feeding value of steam rolled wheat for
feedlot cattle J Anim Sci 72 21-28
42
CHAPTER 2 INFLUENCE OF NUTRIENT RESTRICTION AND MELATONIN
SUPPLEMENTATION OF PREGNANT EWES ON MATERNAL AND FETAL
PANCREATIC DIGESTIVE ENZYMES AND INSULIN-CONTAINING CLUSTERS1
21 Abstract
Primiparous ewes (n = 32) were assigned to dietary treatments in a 2 times 2 factorial
arrangement to determine effects of nutrient restriction and melatonin supplementation on
maternal and fetal pancreatic weight digestive enzyme activity concentration of insulin-
containing clusters and plasma insulin concentrations Treatments consisted of nutrient intake
with 60 (RES) or 100 (ADQ) of requirements and melatonin supplementation at 0 (CON) or
5 mgd (MEL) Treatments began on day 50 of gestation and continued until day 130 On day
130 blood was collected while ewes were under general anesthesia from the uterine artery
uterine vein umbilical artery and umbilical vein for plasma insulin analysis Ewes were then
euthanized and the pancreas removed from the ewe and fetus trimmed of mesentery and fat
weighed and snap-frozen until enzyme analysis Additionally samples of pancreatic tissue were
fixed in 10 formalin solution for histological examination including quantitative
characterization of size and distribution of insulin-containing cell clusters Nutrient restriction
decreased (P le 0001) maternal pancreatic mass (g) and α-amylase activity (Ug kUpancreas
1 The material in this chapter was co-authored by F E Keomanivong C O Lemley L E Camacho R Yunusova
P P Borowicz J S Caton A M Meyer K A Vonnahme and K C Swanson It has been accepted for
publication by Animal 10(3)440-448 F E Keomanivong had primary responsibility for collecting and analyzing
samples in the field F E Keomanivong was the primary developer of the conclusions that are advanced here F E
Keomanivong also drafted and revised all versions of this chapter K C Swanson served as proofreader and
checked the math in the statistical analysis conducted by F E Keomanivong
43
Ukg BW) Ewes supplemented with melatonin had increased pancreatic mass (P = 003) and α-
amylase content (kUpancreas and Ukg BW) Melatonin supplementation decreased (P = 0002)
maternal pancreatic insulin-positive tissue area (relative to section of tissue) and size of the
largest insulin-containing cell cluster (P = 004) Nutrient restriction decreased pancreatic
insulin-positive tissue area (P = 003) and percent of large (32001 to 512000 microm2) and giant (ge
512001 microm2) insulin-containing cell clusters (P = 004) in the fetus Insulin concentrations in
plasma from the uterine vein umbilical artery and umbilical vein were greater (P le 001) in ewes
receiving 100 of requirements When comparing ewes to fetuses ewes had a greater
percentage of medium insulin-containing cell clusters (2001 to 32000 microm2) while fetuses had
more (P lt 0001) pancreatic insulin-positive area (relative to section of tissue) and a greater (P le
002) percentage of small large and giant insulin-containing cell clusters Larger (P lt 0001)
insulin-containing clusters were observed in fetuses compared to ewes In summary the maternal
pancreas responded to nutrient restriction by decreasing pancreatic weight and activity of
digestive enzymes while melatonin supplementation increased α-amylase content Nutrient
restriction decreased the number of pancreatic insulin-containing clusters in fetuses while
melatonin supplementation did not influence insulin concentration This indicated using
melatonin as a therapeutic agent to mitigate reduced pancreatic function in the fetus due to
maternal nutrient restriction may not be beneficial
22 Implications
Melatonin is a potential therapeutic to overcome negative effects of nutrient restriction
during pregnancy because of its roles in regulating blood flow and gastrointestinal and pancreatic
44
function We hypothesized that melatonin supplementation would positively impact fetal
pancreatic function in nutrient restricted ewes Results indicate nutrient restriction during
gestation had greater impacts on digestive enzyme concentrations in ewes than fetuses and that
nutrient restriction decreased pancreatic insulin concentrations Melatonin supplementation did
not influence fetal pancreatic function suggesting that its role as a therapeutic for overcoming
negative effects of undernutrition during pregnancy on fetal pancreatic development is limited
23 Introduction
Although nutrient restriction can result in reduced performance of both the dam and fetus
the development of proper intervention techniques may mitigate harmful consequences
Understanding the influence of maternal nutrition on fetal development provides the potential to
design supplementation strategies which may help overcome these negative impacts Melatonin
most widely known for its role in regulating circadian rhythms has been shown to increase
utero-placental blood flow when supplemented to pregnant ewes which has the potential to
reduce or offset the negative effects of nutrient restriction on maternal blood flow and return
utero-placental nutrient transfer to normal levels (Lemley et al 2012) Melatonin is synthesized
by many tissues of the body with the largest source being produced in the gastrointestinal tract
(GIT Jaworek et al 2007 and 2012) Melatonin secretion increases with the ingestion of food
and can influence GIT function by causing a reduction in the speed of intestinal peristalsis
thereby slowing food transit time and allowing for greater nutrient absorption (Bubenik 2008)
Melatonin receptors have also been found on the pancreas and can influence pancreatic insulin
secretion glucose homeostasis and provide protective mechanisms against oxidative stress
which can selectively destroy β-cells (Sartori et al 2009 Li et al 2011) Because of its
45
potential influence on nutrient supply and pancreatic function melatonin supplementation may
mitigate negative impacts of maternal nutrient restriction on fetal growth and pancreatic
development We hypothesized that melatonin supplementation may have positive effects on the
functional morphology of the pancreas in nutrient-restricted pregnant ewes and their fetuses
Therefore the objectives were to determine the effect of dietary melatonin supplementation on
pancreatic digestive enzyme activity morphology and plasma insulin levels in undernourished
pregnant ewes and their fetuses
24 Materials and Methods
This experiment was approved by the North Dakota State University Institutional Animal
Care and Use Committee
241 Animals and Dietary Treatments
Animal care and dietary treatments were described previously (Lemley et al 2012)
Briefly 32 nulliparous ewes carrying singletons were selected for the study however one ewe
was removed due to a perforated esophagus which existed before dietary treatment Ewes were
transported on day 28 of gestation to a facility that provided a temperature controlled
environment at 14˚C and a 1212 light-dark cycle with lights on at 0700 and off at 1900 each
day On day 50 of gestation the ewes began their dietary treatments Ewes were individually-
penned and provided 100 (ADQ adequate diet) or 60 (RES restricted diet) of nutrient
recommendations for a pregnant ewe lamb in mid- to late-gestation (NRC 2007) and diets were
supplemented with either 5 mg of melatonin (MEL Spectrum Chemical Mfg Corp Gardena
CA) or no melatonin (CON) in a 2 times 2 factorial arrangement of treatments The four treatment
groups consisted of CONADQ (n = 7) MELADQ (n = 8) CONRES (n = 8) or MELRES (n
46
= 8) The diet was pelleted and contained beet pulp alfalfa meal corn soybean meal and wheat
middlings All melatonin supplemented ewes were fed melatonin-enriched pellets at 1400 (5 hr
before the start of the dark cycle at 1900) The pellets were prepared using melatonin powder
dissolved in 95 ethanol at a concentration of 5 mgml The day prior to feeding 100 g of the
control pellet was placed into a small plastic bag and top dressed with 1 ml of melatonin
solution The ethanol was allowed to evaporate overnight at room temperature in complete
darkness before feeding (Lemley et al 2012) The amount of feed offered to individual ewes
was adjusted weekly based on BW and change in BW to ensure the desired average daily gains
were achieved (Reed et al 2007) Ewes were maintained on their given dietary treatments until
day 130 of gestation
242 Sample Collection
On day 130 of gestation dams were weighed Maternal and fetal blood plasma was
collected as described by Lemley et al (2013) Briefly ewes were anesthetized with 3 mgkg of
BW sodium pentobarbital (Fort Dodge Animal Health Overland Park KS USA) and a catheter
was placed into the maternal saphenous artery The uterus was exposed via a midventral
laparotomy and simultaneous blood samples were collected from the catheterized maternal
saphenous artery and the gravid uterine vein Immediately following collection of maternal
blood the gravid uterine horn was dissected The umbilical cord was located and simultaneous
blood samples were collected from the umbilical artery and umbilical vein Blood samples were
placed into tubes containing EDTA placed on ice and plasma collected after centrifugation at
2000 times g for 20 min Plasma samples were stored at -20deg C until further analysis Following
surgery ewes were euthanized with sodium pentobarbital as described by Lemley et al (2013)
Pancreases were immediately removed from ewes and fetuses and trimmed of mesentery and fat
47
Pancreases were then weighed and a sample of tissue was flash-frozen in liquid nitrogen super-
cooled with isopentane (Swanson et al 2008) until analyses for protein concentration and α-
amylase trypsin and lipase activities A subsample of pancreatic tissue was also fixed in 10
formalin and later embedded in paraffin blocks to be used in immunohistochemistry analyses
243 Pancreatic Protein α-Amylase Trypsin and Lipase Activity Analyses
Pancreatic tissue (025 g) was homogenized in 09 NaCl (225 ml) using a polytron
(Brinkmann Instruments Inc Westbury NY) Protein concentration was measured using the
bicinchoninic acid procedure with bovine serum albumin as the standard (Smith et al 1985)
Activity of α-amylase was determined using the procedure of Wallenfels et al (1978) utilizing a
kit from Teco Diagnostics (Anaheim CA) Trypsin activity was assayed using the methods
described by Geiger and Fritz (1986) after activation with 100 UL enterokinase (Swanson et al
2008) Lipase activity was determined using a colorimetric reagent kit from Point Scientific Inc
(Canton MI) and the methods of Imamura (1984) Analyses were adapted for use on a
microplate spectrophotometer (SpectraMax 340 Molecular Devices Sunnyvale CA) One unit
(U) of enzyme activity equals 1 micromole product produced per min Enzyme activity data are
expressed as Ug wet tissue Ug protein kUpancreas and Ukg BW
244 Determination of Insulin-Positive Tissue Area in Pancreas
Maternal and fetal pancreatic tissue collected from a representative area of the pancreas
was immersion-fixed in formalin and embedded in paraffin blocks with proper and persistent
orientation as described previously (Borowicz et al 2007) From each sample 5-μm tissue
sections were obtained from the blocks and mounted on slides Tissue sections on the slides were
later deparaffinized and rehydrated Slides were incubated in staining enhancer citrate buffer
heated to 95˚C for 5 min then cooled to room temperature Slides were covered in a solution of
48
10 donkey serum and 1 bovine serum albumin diluted in tris-buffered saline for a period of
20 min then incubated with 1100 mouse anti-pig insulin (Santa Cruz Biotech) primary antibody
in 1 BSA and tris-buffered saline at 4˚C on a plate rocker for 24 hrs Next the slides were
washed with tris-buffered saline with added tween 20 (TBST) and incubated with 1100
CFtrade633 Goat Anti-Mouse IgG secondary antibody for one hr in complete darkness A final
wash with TBST was performed and coverslips were applied using mounting medium containing
46- diamidino-2-phenylindole in order to visualize all pancreatic cell nuclei Negative control
slides were prepared by omitting primary antibody
245 Histological Analysis
Photomicrographs were taken with a Zeiss ImagerM2 epifluorescence microscope using
a 10x objective and AxioCam HR camera with a Zeiss piezo automated stage To describe
morphology of the pancreas the mosaic image of a large tissue area of approximately 144
pictures (12 times 12 pictures) on the slide was taken using the MosaiX module of Zeiss AxioVision
software This method allowed creation of a single image covering all the pancreatic tissue
present on the histological slide The MosaiX images were then analyzed using the ImagePro
Premier software (ImagePro Premier 90 Media Cybernetics Silver Spring MD) for the insulin-
positive tissue area per section of tissue and size of insulin-containing clusters The images were
analyzed by creating regions of interest corresponding to the whole area of pancreatic tissue
visible on the picture Within the regions of interest images were segmented based on positive
insulin staining and measurements of total positive insulin staining within pancreatic tissue
expressed as percent as well as of individual insulin-containing clusters Insulin-containing
clusters were further classified based on size in order to perform population density
measurements of small clusters (1 to 2000 μm2) medium clusters (2001 to 32000 μm2) large
49
clusters (32001 to 512000 μm2) and giant clusters (ge 512000 μm2) Insulin positive cell
clusters do not correspond to islets of Langerhans because not every cell in the islet is insulin
positive
246 Insulin Analysis of Blood Plasma
Plasma insulin concentrations were measured using an insulin RIA kit (MP Biomedicals
LLC Santa Ana CA) The intra-assay coefficient of variation was 699
247 Statistical Analysis
Data were analyzed as a completely randomized design with a 2 times 2 factorial
arrangement of treatments using the MIXED procedure of SAS (SAS software version 92 SAS
Institute Inc Cary NC) The model statement included melatonin treatment plane of nutrition
and their interaction The model statement also initially included fetal sex and breeding date
which ranged from early September to late December but were later removed from the model as
they were found not to influence (P gt 025) the measured variables To determine if there were
differences in enzyme activity and islet morphology between ewes and fetuses data were
analyzed using the MIXED procedure of SAS and physiological stage (maternal or fetal)
melatonin treatment plane of nutrition and the interactions between all factors were included in
the model Statistical significance was declared at P lt 005 Tendencies were declared when 005
ge P le 010
25 Results
There were no nutrient restriction times melatonin supplementation interactions in maternal
or fetal data (P ge 005) Consequently the main effects of nutrient restriction and melatonin
supplementation are discussed
50
As expected and previously reported (Lemley et al 2012) nutrient restriction decreased
(P lt 0001) maternal BW (Table 2-1)
Table 2-1 Influence of nutrient restriction and melatonin supplementation on maternal BW
pancreas weight and pancreatic enzymes at 130 days of gestation Dietary Treatments
CON MEL P-Value
Item ADQ RES ADQ RES SEM NUT MEL NUT times
MEL
BW kg 534 417 519 416 134 lt0001 052 062
Pancreas weight g 608 480 661 541 264 lt0001 003 088
Pancreas gkg of BW 117 115 120 131 0072 097 005 074
Protein
mgg tissue 939 103 103 103 870 055 060 059
total gpancreas 571 497 680 539 0486 003 011 047
mgkg of BW 108 120 131 131 113 058 013 057
α- Amylase
Ug 168 101 222 103 177 lt0001 011 014
kUpancreas 102 491 147 595 125 lt0001 003 016
Ukg of BW 194 116 286 145 284 lt0001 003 025
Ug protein 1814 1008 2284 1200 2684 0001 021 059
Trypsin
Ug 109 114 128 103 092 029 062 010
Upancreas 655 549 838 563 571 0002 008 013
Ukg of BW 124 132 162 138 138 056 010 024
Ug protein 116 117 127 105 110 032 096 027
Lipase
Ug 599 720 659 510 735 084 029 007
kUpancreas 366 339 439 281 472 005 087 016
Ukg of BW 688 819 856 683 1045 083 087 014
Ug protein 6469 7075 6613 5420 8566 072 036 028 Data are presented as least square means per treatment plusmn SEM n = 15 or 16 Control CON Melatonin
MELAdequate ADQ Restricted RES Nutrition NUT
Nutrient restriction decreased (P le 0001) maternal pancreas weight (g) and melatonin
supplementation increased (P =003) maternal pancreas weight (g) with a tendency (P = 005) for
an increase in pancreas weight when expressed as gkg BW) Total protein content (g) in the
maternal pancreas was decreased (P le 003) by nutrient restriction and unaltered by melatonin
Maternal pancreatic α-amylase activity (Ug Ug protein kUpancreas and Ukg of BW) was
decreased (P le 0001) by nutrient restriction and increased (kUpancreas and Ukg BW P le
51
003) by melatonin supplementation Nutrient restriction decreased (P = 0002) maternal
pancreatic trypsin activity (Upancreas) while melatonin tended (P le 010) to increase maternal
pancreatic trypsin activity when expressed as Upancreas and Ukg BW No differences were
observed in maternal pancreatic lipase activity in response to nutrient restriction or melatonin
supplementation however nutrient restriction tended (P = 005) to decrease lipase activity when
expressed as kUpancreas Melatonin supplementation decreased (P le 004) pancreatic insulin-
positive tissue area (relative to section of tissue) Ewes consuming 60 of requirements had an
increased percentage of small insulin-containing cell clusters (1 to 2000 microm2 Table 2-2) while
those receiving adequate nutrition had a greater percentage medium insulin-containing cell
clusters (2000 to 32000 microm2) The percentage of large insulin-containing cell clusters was
reduced in ewes supplemented with melatonin Restricted ewes had a tendency for the largest
insulin-containing cell cluster (P = 006) while supplementation with melatonin reduced the size
of the largest insulin-containing cell cluster (microm2 P = 004) There was a tendency (P = 009) for
an interaction between intake and melatonin supplementation
As previously described fetal BW decreased (P lt 001) with nutrient restriction but was
not influenced by melatonin supplementation (Lemley et al 2012 Table 2-3) Fetal pancreatic
weight protein concentration and α-amylase trypsin and lipase activity were not influenced by
nutrient restriction or melatonin supplementation
In reference to Table 2-4 nutrient restriction decreased (P le 004) fetal pancreatic
insulin-positive area (relative to section of tissue) along with the percentage of large and giant
insulin-containing clusters The average size of the cell clusters was reduced (P le 004) in
restricted animals and the size of the largest insulin-containing cell cluster was smaller
52
Table 2-2 Influence of nutrient restriction and melatonin supplementation on insulin concentration and measurements of insulin
containing clusters in maternal pancreas at 130 days of gestation
Dietary Treatments
CON MEL P-Value
ADQ RES ADQ RES SEM NUT MEL NUT times
MEL
Pancreatic insulin-positive area
(relative to section of tissue)
162 258 0897 0773 03822 025 0002 014
Insulin-containing clusters within the
following ranges (micromsup2)
1 to 2000 709 799 774 822 344 004 017 051
2001 to 32000 2896 1982 2252 1776 3429 004 019 049
32001 to 512000 0153 0320 0043 0023 00954 041 003 030
Average size of insulin-containing
clusters (micromsup2)
1870 1818 1664 1341 2970 049 022 062
Smallest insulin-containing cluster
(micromsup2)
224 254 249 250 177 035 049 037
Largest insulin-containing cluster
(micromsup2)
25492 77717 20302 22514 15462 006 004 009
Data are presented as least square means per treatment plusmn SEM n = 15 or 16 Control CON Melatonin MEL Adequate ADQ
Restricted RES Nutrition NUT
53 P
age5
3
Table 2-3 Influence of nutrient restriction and melatonin supplementation on fetal BW
pancreas weight and pancreatic enzymes at 130 days of gestation Dietary Treatment
CON MEL P-Value
Item ADQ RES ADQ RES SEM NUT MEL NUT times
MEL
BW kg 338 321 361 314 0123 001 049 021
Pancreas weight g 335 320 371 318 0234 014 046 040
Pancreas gkg of BW 103 0995 102 101 0070 073 092 085
Protein
mgg tissue 777 833 902 855 498 092 013 029
Total gpancreas 0256 0272 0333 0273 0273 038 012 013
mgkg of BW 768 837 920 871 692 088 017 038
α-Amylase
Ug 340 390 345 384 644 047 099 093
kUpancreas 0105 0131 0124 0124 00236 056 079 058
Ukg of BW 298 398 345 401 742 028 072 076
Ug protein 430 458 390 437 736 060 067 089
Trypsin
Ug 0316 0246 0260 0247 00441 034 052 050
Upancreas 103 0857 0942 0805 0172 035 067 091
Ukg of BW 0307 0256 0263 0259 00487 055 066 062
Ug protein 398 281 299 292 0478 019 034 024
Lipase
Ug 269 336 291 341 820 047 086 091
kUpancreas 0842 114 105 110 02918 052 077 066
Ukg of BW 238 342 289 360 884 031 069 085
Ug protein 3373 3987 3324 3800 9427 055 090 094 Data are presented as least square means per treatment plusmn SEM n = 15 or 16 Control CON Melatonin
MEL Adequate ADQ Restricted RES Nutrition NUT
54
Pag
e54
Table 2-4 Influence of nutrient restriction and melatonin supplementation on insulin concentration and measurements of insulin
containing clusters in fetal pancreas at 130 days of gestation
Dietary Treatments
CON MEL P-Value
Item ADQ RES ADQ RES SEM NUT MEL NUT times
MEL
Pancreatic insulin-positive area
(relative to section of tissue)
638 356 790 319 1764 003 073 057
Insulin-containing clusters within the
following ranges (micromsup2)
1 to 2000 812 838 796 868 306 010 081 043
2001 to 32000 177 156 194 127 287 011 081 039
32001 to 512000 104 0527 101 0528 02458 004 096 095
gt 512001 0060 0000 0022 0000 00204 004 032 032
Average size of insulin-containing
clusters (micromsup2)
2887 1782 2650 1684 5098 004 073 088
Smallest insulin-containing cluster
(micromsup2)
257 258 342 280 483 050 025 049
Largest insulin-containing cluster
(micromsup2)
390841 107067 291253 90411 92209 001 050 063
Data are presented as least square means per treatment plusmn SEM n = 15 or 16 Control CON Melatonin MEL Adequate ADQ
Restricted RES Nutrition NUT
54
55 P
age5
5
Insulin concentrations in the maternal artery at day 130 of gestation tended (P = 009) to
decrease with nutrient restriction and increased (P = 007) with melatonin supplementation
(uIUmL Table 2-5) Plasma insulin concentration decreased (P = 001) in the uterine vein of
nutrient restricted ewes Likewise insulin concentrations in the umbilical artery and vein also
decreased (P lt 0001) with nutrient restriction and was unaltered by melatonin supplementation
Interactions existed between physiological stage (maternal vs fetal) and intake (P lt 005)
for pancreas weight protein content (total gpancreas) α-amylase concentration (Ug and Ug
protein) α-amylase content (kUpancreas and Ukg BW) and trypsin content (Upancreas)
Physiological stage times melatonin interactions were also observed (P lt 005) for pancreas weight
and α-amylase concentration (Ug) and content (kUpancreas) However interactions occurred
primarily because of differences in magnitude between maternal and fetal pancreas with intake
or melatonin group and not because of re-ranking between maternal and fetal measurements
Consequently only the main effects associated with maternal and fetal pancreatic outcomes are
presented (Table 2-6)
Table 2-5 Influence of nutrient restriction and melatonin supplementation on plasma insulin
concentrations (uIUmL) at 130 days of gestation
Dietary Treatments
CON MEL P-Values
Vessel ADQ RES ADQ RES SEM NUT MEL NUT times
MEL
Maternal artery 134 107 141 135 0999 009 007 028
Uterine vein 138 110 154 117 130 001 034 068
Umbilical artery 239 131 204 134 232 lt0001 045 039
Umbilical vein 215 132 198 126 207 lt0001 055 077 Data are presented as least square means per treatment plusmn SEM n = 15 or 16 Control CON
Melatonin MEL Adequate ADQ Restricted RES Nutrition NUT
56 P
age5
6
Table 2-6 Influence of physiological stage (maternal vs fetal) on digestive enzyme activity
and ratio of insulin-positive staining and islet size at 130 days of gestation
Physiological Stage
Item Maternal Fetal SEM P-Value
BW kg 472 33 049 lt0001
Pancreas weight gab 572 34 095 lt0001
Pancreas gkg of BW 122 102 0036 lt0001
Protein
mgg tissue 101 84 36 lt0002
Total gpancreasa 572 028 0176 lt0001
mgkg of BW 123 84 48 lt0001
α-Amylase
Ugab 149 36 68 lt0001
kUpancreasab 895 012 0451 lt0001
Ukg of BWa 185 36 105 lt0001
Ug proteina 1577 429 1004 lt0001
Trypsin
Ug 113 03 033 lt0001
Upancreasa 651 1 206 lt0001
Ukg of BW 139 03 050 lt0001
Ug protein 116 3 39 lt0001
Lipase
Ug 622 309 397 lt0001
kUpancreas 356 10 170 lt0001
Ukg of BW 761 307 494 lt0001
Ug protein 6394 3621 4594 lt0001
Pancreatic insulin-positive area (relative to
section of tissue) a
147 526 0667 00001
Insulin-containing clusters within the
following ranges (micromsup2)
1 to 2000 776 829 156 002
2001 to 32000 223 163 151 001
32001 to 512000a 0135 0777 00961 lt0001
gt 512001a 0 0020 00076 005
Average size of insulin-containing clusters
(micromsup2)
1673 2251 2057 005
Smallest insulin-containing cluster (micromsup2) 251 284 180 018
Largest insulin-containing cluster (micromsup2)a 36505 219893 33647 00003 Data are presented as least square means plusmn SEM n = 31
PndashValues are representative of significance due to physiologic stage aPhysiological stage times intake (P lt 005) bPhysiological stage times melatonin (P lt 005)
57 P
age5
7
Pancreatic mass and all measurements of enzyme activity were greater (P lt 002) in
maternal than fetal pancreas at day 130 of gestation Fetal pancreas had a larger (P lt 0001)
insulin-positive area (relative to section of tissue) and a greater percentage of small insulin-
containing cell clusters (P = 002) Maternal pancreas had a greater number of medium insulin-
containing clusters (P = 001) while the fetal pancreas had a greater percent of large insulin-
containing cell clusters (P lt 0001) A tendency (P = 005) was observed for fetal pancreas to
have a higher percent of giant insulin-containing cell clusters and for the average size of cell
clusters to be larger However due to the high number of small cell clusters the average size
among fetal and maternal pancreases was not significantly different despite the fetal pancreas
exhibiting the largest insulin containing cell clusters (microm2 P lt 0001)
26 Discussion
Nutrient restriction from mid- to late-pregnancy decreased both maternal and fetal BW as
reported previously (Lemley et al 2012) as well as maternal pancreatic mass (g) Fetal
pancreatic mass however was not influenced by nutrient restriction contradicting past research
(Reed et al 2007) which reported that fetal pancreatic mass from undernourished ewes was
decreased compared to those from ewes adequately fed Moreover the melatonin
supplementation strategy did not rescue fetal growth restriction brought about by maternal
nutrient restriction from mid- to late-pregnancy (Lemley et al 2012)
In the growing ruminant an increase in nutrient intake generally increases pancreatic
content of or secretion of exocrine digestive enzymes (Corring 1980 Harmon 1992 Wang et
al 1998 Swanson and Harmon 2002) The ewes in this study on the ADQ treatment had
increased pancreatic α-amylase and trypsin activities compared to ewes on the RES treatment
58 P
age5
8
indicating that changes in feed intake also impact pancreatic exocrine function in mature
pregnant ewes
A study conducted by Jaworek et al (2004) reported that in anaesthetized rats
exogenous melatonin or its precursor L-tryptophan resulted in a dose-dependent increase in
pancreatic α-amylase secretion These increases were believed to be manifested through the
stimulation of cholecystokinin and the triggering of vagal sensory nerves (Jaworek et al 2004)
We also observed this effect of melatonin on maternal pancreatic α-amylase content relative to
BW but did not observe effects of melatonin on fetal pancreatic weight or enzyme activity This
therefore disagrees with our hypothesis as melatonin supplementation had limited effects on the
fetal development of the exocrine pancreas in our study
Past work has suggested that diets containing lower protein concentration than those with
adequate nutrition resulted in decreased pancreatic insulin concentration (Dahri et al 1995)
Other studies have suggested that the β-cell proportional area (relative to total cellular area) and
islet number was decreased in rats undergoing nutrient restriction for a period of 4 weeks when
compared to a control group fed for ad libitum intake (Chen et al 2010) Our results suggested
no effect of global nutrient restriction on insulin-positive area (relative to section of tissue) in
ewes As expected however the insulin-positive area and size of insulin-containing clusters
were reduced in fetuses from restricted ewes Developmental changes in islet size and number
potentially could have effects on development in regards to energetics and function of β-cells
When investigating islet size of the endocrine pancreas pups borne from mothers fed low protein
diets were found to have islet cell proliferation reduced by 12 (Dahri et al 1995)
Plasma insulin concentrations were greater in ADQ ewes and fetuses This was not
surprising as insulin is released in response to nutrient intake (Takahashi et al 2006) Because
59 P
age5
9
these animals were not subjected to nutrient restriction they would have been secreting insulin at
a higher rate to accommodate the rise in blood glucose and to promote protein synthesis
Although no significant differences were observed there were numerically greater insulin
concentrations in the maternal artery in ewes supplemented with melatonin This trend is
unexpected as melatonin supplementation resulted in a decrease in pancreatic insulin-positive
area (relative to section of tissue) Interestingly Lemley et al (2012) reported an interaction
between nutrient restriction and melatonin supplementation on umbilical artery glucose
concentrations suggesting that glucose concentrations were influenced differently compared to
plasma insulin concentration and islet size measurements Melatonin on the other hand did not
influence the insulin-positive area (relative to section of tissue) or insulin-containing cluster
morphology in the fetal pancreas suggesting that supplemental melatonin at the dose and timing
relative to the light-dark cycle that we provided had minimal effects on pancreatic fetal
endocrine function
The concentration of pancreatic digestive enzymes was much lower in the fetal than the
maternal pancreas However when observing the size of insulin-containing clusters fetuses had
a greater number of large islets compared with those of their respective dams amongst all
treatments
Similar results have also been observed when comparing calves to adult cattle (Merkwitz
et al 2012) In the examination of the pancreatic tissue of calves islets of two differing sizes
were discovered The larger islets (perilobular giant islets) were found in a much smaller
quantity while smaller islets (interlobular islets) appeared more frequently These interlobular
islets were shown to persist into adulthood while the perilobular giant islets underwent
regression
60 P
age6
0
Figure 2-1 Influence of nutrient restriction and melatonin supplementation on insulin-positive
staining Sections represent the maternal and corresponding fetal pancreatic tissues of
representative ewes fed 5 mgd melatonin and receiving 100 of nutrient requirements (a and b)
and 60 of nutrient requirements (c and d) The white arrows indicate insulin-containing
clusters Magnification 10x
61 P
age6
1
It has also been shown that mass related metabolic rate tended to decrease with increasing
body size of the organism (Singer 2006) Therefore these differences in fetal islet size and
number may be associated with differences in function of the endocrine pancreas during
development and later in life Further investigation is needed in this area
In conclusion nutrient restriction during gestation has more of an effect on pancreatic
protein and digestive enzyme concentrations in the dam than in the fetus This may be because
the dam is adapting to protect the fetus from changes in nutritional status or because of the much
lower concentrations of enzymes produced in the fetal compared with the maternal pancreas In
contrast to our hypothesis melatonin supplementation did not impact the effect of nutrient
restriction on maternal and fetal pancreatic function and therefore may not be an appropriate
supplementation option to help therapeutically mitigate the effects of maternal nutrient
restriction on pancreatic development
27 Literature Cited
Borowicz P P D R Arnold M L Johnson A T Grazul-Bilska D A Redmer and L P
Reynolds 2007 Placental growth throughout the last two-thirds of pregnancy in sheep
vascular development and angiogenic factor expression Biol Reprod 76259-267
Bubenik G A 2008 Thirty-four years since the discovery of gastrointestinal melatonin J
Physiol Pharmacol 5833-51
Chen L W Yang J Zheng X Hu W Kong and H Zhang 2010 Effect of catch-up growth
after food restriction on the entero-insular axis in rats Nutr Metab (Lond) 745
Corring T 1980 The adaptation of digestive enzymes to the diet its physiological significance
Reprod Nutr Dev 201217-1235
62 P
age6
2
Dahri S B Reusen C Remacle and J J Hoet 1995 Nutritional influences on pancreatic
development and potential links with non-insulin-dependent diabetes Proc Nutr Soc
54345-356
Geiger R and H Fritz 1986 Trypsin In Methods of Enzymatic Analysis (ed Bergmeyer H)
pp 119-128 Elsevier New York USA
Harmon D L 1992 Impact of nutrition on pancreatic exocrine and endocrine secretion in
ruminants a review J Anim Sci 701290-1301
Imamura S and H Misaki 1984 A sensitive method for assay of lipase activity by coupling
with β-oxidation enzymes of fatty acids Selected Topics in Clinical Enzymology Clin
Chem 273
Jaworek J N Katarzyna S J Konturek A Leja-Szpak P Thor and W W Pawlik 2004
Melatonin and its precursor L-tryptophan influence on pancreatic amylase secretion in
vivo and in vitro J Pineal Res 36155-164
Jaworek J K Nawrot-Porabka A Leja-Szpak J Bonior J Szklarczyk M Kot S J Konturek
and W W Pawlik 2007 Melatonin as modulator of pancreatic enzyme secretion and
pancreatoprotector J Physiol Pharmacol 5865-80
Jaworek J J Szklarczyk A K Jaworek K Nawrot-Porąbka A Leja-Szpak J Bonior and M
Kot 2012 Protective effect of melatonin on acute pancreatitis Int J Inflam
2012173675
Lemley C O L E Camacho A M Meyer M Kapphahn J S Caton and K A Vonnahme
2013 Dietary melatonin supplementation alters uteroplacental amino acid flux during
intrauterine growth restriction in ewes Animal 71500-1507
63 P
age6
3
Lemley C O A M Meyer L E Camacho T L Neville D J Newman J S Caton and K A
Vonnahme 2012 Melatonin supplementation alters uteroplacental hemodynamics and
fetal development in an ovine model of intrauterine growth restriction (IUGR) Am J
Physiol Regul Integr Comp Physiol 302R454-R467
Li G G Hou W Lu and J Kang 2011 Melatonin protects mice with intermittent hypoxia
from oxidative stress-induced pancreatic injury Sleep Biol Rhythms 978-85
Merkwitz C P Lochhead J Boumlttger M Matz-Soja M Sakurai R Gebhardt and A M
Ricken 2012 Dual origin development and fate of bovine pancreatic islets J Anat
222358-371
NRC 2007 Nutrient Requirements of Small Ruminants National Academies Press
Washington DC
Reed J J M A Ward K A Vonnahme T L Neville S L Julius P P Borowicz J B
Taylor D A Redmer A T Grazul-Bilska L P Reynolds and J S Caton 2007
Effects of selenium supply and dietary restriction on maternal and fetal BW visceral
organ mass and cellularity estimates and jejunal vascularity in pregnant ewe lambs J
Anim Sci 852721-2733
Sartori C P Dessen C Mathieu A Monney J Bloch P Nicod U Scherrer and H Duplain
2009 Melatonin improves glucose homeostasis and endothelial vascular function in high-
fat diet-fed insulin-resistant mice Endocr 1505311-5317
Singer D 2006 Size relationship of metabolic rate Oxygen availability as the ldquomissing linkrdquo
between structure and function Thermochim Acta 44620-28
64 P
age6
4
Smith P K R I Krohn G T Hermanson A K Mallia F H Gartner M D Provenzano E
K Fujimoto N M Goeke B J Olson and D C Klenk 1985 Measurement of protein
using bicinchoninic acid Anal Biochem 15076-85
Swanson K C and D L Harmon 2002 Dietary influences on pancreatic α-amylase expression
and secretion in ruminants In Biology of the Intestine in Growing Animals (ed R
Zabielski V Lesniewska PC Gregory and B Westrom) pp 515-537 Elsevier Boston
USA
Swanson K C N Kelly H Salim Y J Wang S Holligan M Z Fan and B W McBride
2008 Pancreatic mass cellularity and α-amylase and trypsin activity in feedlot steers fed
diets differing in crude protein concentration J Anim Sci 86909-915
Takahashi H Y Kurose S Kobayashi T Sugino M Kojima K Kangawa Y Hasegawa and
Y Terashima 2006 Ghrelin enhances glucose-induced insulin secretion in scheduled
meal-fed sheep J Endocrinol 18967-75
Wallenfels K P Fold H Niermann H Bender and D Linder 1978 The enzymatic synthesis
by transglucosylation of a homologous series of glycosidically substituted malto-
oligosaccharides and their use as amylase substrates Carbohydr Res 61359-368
Wang W B T Ogawa S Suda K Taniguchi H Uike H Kumagai and K Mitani 1998
Effects of nutrition level on digestive enzyme activities in the pancreas and small
intestine of calves slaughtered at the same body weight Asian Australas J Anim Sci
11375-380
65 P
age6
5
CHAPTER 3 THE IMPACT OF DIET AND ARGININE SUPPLEMENTATION ON
PANCREATIC MASS DIGESTIVE ENZYME ACTIVITY AND INSULIN-
CONTAINING CELL CLUSTER MORPHOLOGY DURING THE ESTROUS CYCLE
IN SHEEP2
31 Abstract
To determine the effect of feed intake and arginine treatment during different stages of
the estrous cycle on pancreatic mass digestive enzyme activity and histological measurements
ewes (n = 120) were randomly allocated to one of three dietary groups control (CON 214 Mcal
metabolizable energykg) underfed (UF 06 x CON) or overfed (OF 2 x CON) over 2 yr Estrus
was synchronized using a controlled internal drug release (CIDR) device for 14 d At CIDR
withdrawal ewes from each dietary group were assigned to one of two treatments Arg (L-Arg
HCl 155 micromolkg BW) or Sal (approximately 10 mL Saline) Treatments were administered 3
times daily via jugular catheter and continued until slaughter on d 5 and 10 of the second estrus
cycle (early luteal phase n = 41 and mid-luteal phase n = 39 year 1) and d 15 of the first estrus
cycle (late luteal phase n = 40 year 2 A blood sample collected from jugular catheters for
serum insulin analysis before slaughter The pancreas was then removed trimmed of mesentery
and fat weighed and a sample snap-frozen until enzyme analysis Additional pancreatic samples
2The material in this chapter was co-authored by F E Keomanivong A T Grazul-Bilska D A Redmer C S
Bass S L Kaminski P P Borowicz J D Kirsch and K C Swanson It has been accepted for publication by
Domestic Animal Endocrinology dio 101016jdomaniend201610001 F E Keomanivong had primary
responsibility for collecting and analyzing samples in the field F E Keomanivong was the primary developer of the
conclusions that are advanced here F E Keomanivong also drafted and revised all versions of this chapter K C
Swanson served as proofreader and checked the math in the statistical analysis conducted by F E Keomanivong
66 P
age6
6
were fixed in 10 formalin solution for histological examination of size and distribution of
insulin-containing cell clusters Data were analyzed as a completely randomized design with a
factorial arrangement of treatments Diet treatment and diet times treatment was blocked by year
and included in the model with initial BW used as a covariate Day of the estrous cycle was
initially included in the model but later removed as no effects (P gt 010) were observed for any
pancreatic variables tested Overfed ewes had the greatest (P lt 0001) change in BW final BW
change in BCS and final BCS A diet times treatment interaction was observed for change in BW
and final BW (P le 0004) Overfed and CON had increased (P lt 0001) pancreas weight (g)
compared to UF ewes Protein concentration (gpancreas) was lowest (P lt 0001) in UF ewes
while protein content (mgkg BW) was greater (P = 003) in UF than OF ewes Activity of α-
amylase (Ug kUpancreas Ukg of BW and Ug protein) and trypsin (Upancreas) was greater
(P le 0003) in OF than UF ewes Serum insulin was greatest (P lt 0001) in OF ewes No effects
were observed for pancreatic insulin-containing cell clusters This study demonstrated that plane
of nutrition affected several measurements of pancreatic function however the dosage of Arg
used did not influence pancreatic function
32 Introduction
One of the biggest challenges in animal production is providing adequate feed with
proper nutrient profiles during each stage of life Sheep breeders are often faced with this
dilemma as grazing flocks can at certain times of the year receive less than 50 of NRC
recommendations (Wu et al 2006) Periods of nutrient restriction impact production and
secretion of pancreatic digestive enzymes (Corring 1980) A decrease in the secretion of
pancreatic digestive enzyme activity due to reduced feed intake influences the breakdown and
67 P
age6
7
absorption of nutrients in the small intestine (Swanson and Harmon 2002 Keomanivong et al
2015a)
Arginine is known to play a role in tissue function and enzyme activity (Wu and Morris
1998) These functions are impacted by the ability of arginine to stimulate secretion of hormones
such as insulin growth hormone glucagon and prolactin and to act as a precursor of proteins
polyamines and nitric oxide (NO) which becomes a powerful vasodilator and biological regulator
of tissues (Wu and Morris 1998 Wu et al 2006 Arciszewski 2007) Based on these
understandings arginine supplementation has been indicated as a possible rescue factor for
detrimental effects caused by nutrient restriction on organ function (Lassala et al 2010)
During different stages of life the animal endures reduced or excess intake and
understanding the effect of diet on the pancreas is crucial The concentration of pancreatic
insulin varies throughout the estrus cycle and depends on plane of nutrition (Morimoto et al
2001 Sartoti et al 2013 Kaminski et al 2015) In addition it has been demonstrated that
pancreatic α-amylase has been influenced by nutritional factors capable of modification by
steroid sex hormones (Khayambashi et al 1971 Karsenti et al 2001) Therefore sex hormones
exert further effects beyond the targeted measurements of reproductive function (Boland et al
2001 Armstrong et al 2003 Kaminski et al 2015) The interaction between day of estrus and
variable feed intake or supplemental arginine on pancreatic function is unclear
We hypothesized that Arg-treatment will affect selected pancreatic functions in non-
pregnant ewes fed inadequate diets compared to ewes fed a maintenance control diet Therefore
the objectives were to determine the effects of different levels of feed intake and arginine
supplementation on pancreatic mass and protein concentration activity of α-amylase and trypsin
68 P
age6
8
insulin-containing cell cluster measurements and serum insulin concentration at the early- mid-
and late-luteal phases of the estrous cycle
33 Materials and Methods
This experiment was approved by the North Dakota State University Institutional Animal
Care and Use Committee
331 Animal Dietary Groups
Animal use and experimental design have been previously described (Kaminski et al
2015) Non-pregnant non-lactating individually-fed Rambouillet ewes (n = 120) between 2 and
5 yr of age and of similar genetic background were studied over 2 yr Ewes initially weighed
602 kg (plusmn a standard deviation of 579 kg) with an initial body condition score of 27 (plusmn a
standard deviation of 024) on a 1 to 5 scale Ewes were housed in a temperature-controlled
environment at 14degC and a 1212 lightdark cycle with lights on at 0700 and off at 1900 each
day Sixty days prior to the beginning of the experiment ewes were stratified by BW and
randomly allocated to one of three dietary groups control (CON 100 National Research
Council (National Research Council 1996) requirements 24 Mcal metabolizable energykg
BW) underfed (UF 06 x CON) or overfed (OF 2 x C Table 3-1)
These respective diets were provided twice daily at 0800 and 1500 for the duration of
the study and were adjusted weekly based on ewe BW to ensure that proper body condition was
achieved The jugular vein of each ewe was cannulated prior to the initiation of the estrous cycle
(Kaminski et al 2015) Estrus was synchronized using a controlled internal drug release (CIDR)
device for 14 d
69 P
age6
9
Table 3-1 Dietary Composition and Nutrient
Analysis
Ingredient ( of Diet DM) Diet DM
Beet pulp 365
Alfalfa meal 223
Corn 182
Soy hulls 200
Soybean meal 30
Nutrient Composition
DM 918
OM of DM 937
CP of DM 116
NDF of DM 374
ADF of DM 253
Calcium of DM 087
Phosphorus of DM 027
332 Saline and Arg Treatments
Approximately 36 hr after CIDR withdrawal ewes were considered in estrus and were
randomly allocated to one of two treatments Arg (L-Arg HCl 155 micromolkg BW) or Sal (~10 mL
Saline Kaminski et al 2015) Ewes receiving Sal were given 5 to 10 mL of sterile saline
solution via the jugular catheter whereas ewes receiving Arg were given 5 to 10 mL of L-Arg-
HCl solution in a dose of 155 μmolkg BW (Sigma St Louis MO USA) Sal or Arg treatments
were initiated on d 0 of the first estrous cycle and occurred three times daily (0700 1400 and
2100) until the end of the experiment The dose of Arg was selected based on studies performed
by Lassala et al (2010 2011) to ensure an increased concentration of Arg in maternal serum
After treatment injection 1 mL of heparin solution was placed into the catheter to prevent
clotting
70 P
age7
0
333 Blood and Tissue Collection
At the early- (d 5 n = 41) or mid- (d 10 n = 39) luteal phase of the second estrous cycle
(Year 1) and at the late-luteal phase (d 15 n = 40) of the first estrus cycle (Year 2) final BW and
BCS were recorded and blood was collected from the jugular catheter using 9-mL Luer
Monovette blood collection tubes (Sarstedt Newton NC USA) After collection blood samples
were allowed to clot for 15 to 20 min at room temperature and centrifuged (Allegra 6R
Centrifuge Beckman Coulter Inc Indianapolis IN USA) for 20 min at 3500 times g Serum was
then aliquoted into 2-mL serum tubes and immediately stored at minus20 degC until further analysis
Ewes were stunned via captive bolt and exsanguinated The pancreas was removed
trimmed of mesentery and fat and a total weight recorded A sample from the body of the
pancreas was snap-frozen in isopentane super-cooled in liquid nitrogen until analyses for protein
concentration and α-amylase and trypsin activities Additional samples of pancreatic tissue were
fixed in 10 formalin solution and later embedded in paraffin blocks to be used in
immunohistochemistry analyses including quantitative characterization of size and distribution
of insulin-containing cell clusters
334 Serum Insulin Concentration
Insulin concentrations in 100 microL of serum were measured with a chemiluminescent
immunoassay on an Immulite 1000 analyzer (Siemens Healthcare Tarrytown NY USA) as
previously described and validated (including specificity) by Vonnahme et al (2010) Briefly
the Immulite 1000 test units contain assay-specific antibody-coated polystyrene beads Once the
protein of interest is bound to the antibodies on the bead it is detected by the binding of an
alkaline phosphatase-labeled assay-specific antibody Dioxetane is the chemiluminescent
alkaline phosphatase substrate and the amount of emitted light is proportional to the amount of
71 P
age7
1
analyte in the sample Biorad Lymphochek standards were used to validate the assay with levels
1 2 and 3 control pools containing low intermediate and high levels of insulin
respectively (Biorad Hercules CA USA) Samples were assayed in duplicate using Immulite
1000 Insulin kits (catalog LKIN1) and the intra-assay CV was 132 The reportable range for
the assay is 2 to 300 microlUmL and the analytical sensitivity is 2 microlUmL
335 Pancreatic Protein α-Amylase and Trypsin Activity Analyses
Pancreatic tissue (025 g) was homogenized in 09 NaCl (225 microl) using a polytron
(Brinkmann Instruments Inc Westbury NY USA) Protein concentration was determined using
the bicinchoninic acid (BCA) procedure with bovine serum albumin (BSA) used as the standard
(Smith et al 1985) Activity of α-amylase was determined using the procedure of Wallenfels et
al (1978) utilizing a kit from Teco Diagnostics (Anaheim CA USA) Trypsin activity was
determined using the methods described by Geiger and Fritz (1986) after activation with 100 UL
enterokinase (Swanson et al 2008a) Analyses were adapted for use on a microplate
spectrophotometer (SpectraMax 340 Molecular Devices Sunnyvale CA USA) One unit (U) of
enzyme activity equals 1 micromole product produced per min Enzyme activity data are expressed
as Ug wet tissue Ug protein kUpancreas and Ukg BW
336 Immunohistochemistry
A representative sample of the body of the pancreas was immersion-fixed in formalin and
embedded in paraffin blocks with proper and persistent orientation and immunohistochemistry
was performed as described previously (Keomanivong et al 2015a Keomanivong et al 2015b)
Tissues were cut (5-μm sections) mounted on slides deparaffinized and rehydrated Slides were
incubated in staining enhancer citrate buffer heated to 95˚C for 5 min then cooled to room
temperature Slides were covered in a solution of 10 donkey serum and 1 bovine serum
72 P
age7
2
albumin diluted in tris-buffered saline for 20 min then incubated with 1100 mouse anti-pig
insulin (Santa Cruz Biotech Dallas TX USA) primary antibody in 1 BSA and tris-buffered
saline at 4˚C on a plate rocker for 24 hr Next the slides were washed with tris-buffered saline
with added tween 20 (TBST) and incubated with 1100 CFtrade633 Goat Anti-Mouse IgG
secondary antibody (Santa Cruz Biotech Dallas TX USA) for one hr in complete darkness A
final wash with TBST was performed and coverslips were applied using mounting medium
containing 46- diamidino-2-phenylindole in order to visualize all pancreatic cell nuclei
Negative control slides were prepared with omitting primary antibody
337 Histological Analysis
Photomicrographs were taken with a Zeiss ImagerM2 epifluorescence microscope (Carl
Zeiss Microscopy Jena Germany) using a 10x objective and AxioCam HR camera with a Zeiss
piezo automated stage To describe morphology of the pancreas the mosaic image of a large
tissue area of approximately 144 pictures (12 times 12 pictures) on the slide was taken using the
MosaiX module of Zeiss AxioVision software This method allowed creation of a single image
of the pancreatic tissue present on the slide (Keomanivong et al 2015a) The MosaiX images
were then analyzed using the ImagePro Premier software (ImagePro Premier 90 Media
Cybernetics Silver Spring MD USA) to determine the insulin-positive tissue area per section of
tissue and size of insulin-containing cell clusters The images were analyzed by creating regions
of interest corresponding to the whole area of pancreatic tissue visible on the picture
(Keomanivong et al 2015b) Within the regions of interest images were segmented based on
positive insulin staining and measurements of total positive insulin staining within pancreatic
tissue expressed as percent as well as of individual insulin-containing cell clusters Insulin-
containing cell clusters were further classified based on size to perform population density
73 P
age7
3
measurements of small clusters (1 to 2000 μm2) medium clusters (2001 to 32000 μm2) and
large clusters (32001 to 512000 μm2) Insulin-positive cell clusters do not correspond to islets
of Langerhans because not every cell in the islet is insulin positive
338 Statistical Analysis
Data were analyzed using the general linear model procedures of SAS 92 (Statistical
Analysis Software SAS Institute Inc Cary NC USA) as a completely randomized design with
a factorial arrangement including diet treatment and diet times treatment Data were initially
analyzed within year with stage of the estrous cycle initially included in the model for year 1
Stage of the estrous cycle did not influence (P gt 010) any of the variables tested and therefore
was removed from the model and the data were combined over all stages and analyzed including
year in the model as a blocking factor and initial BW as a covariate Means were separated using
the least significant difference approach and were considered significant when P le 005
34 Results
Average daily gain and final BW (kg) were greatest (P lt 0001) in OF ewes followed by
CON (Table 3-2) while a diet times treatment interaction was noted with OF ewes treated with Arg
having the greatest values for both measurements (P le 0004 Figure 3-1)
The changes in BCS and final BCS were greatest (P lt 0001) in OF followed by UF ewes
while no differences were noted with Arg treatment Pancreas weight (g) was greater (P lt 0001)
in OF and CON than UF ewes Sheep treated with Arg tended to have a greater (P = 009)
pancreas weight (g) than those treated with Sal Pancreas weight ( of BW) was greater (P lt
001) in UF than OF while CON ewes were intermediate Arg treated ewes tended to have a
greater (P = 009) pancreas weight ( of BW) than ewes treated with Sal
74
Pag
e74
Table 3-2 Influence of nutrient restriction and arginine treatment on BW BCS pancreatic mass and digestive enzymes in non-
pregnant ewes Dietary Group Treatment P-Values
Item UF CON OF SEM Saline Arg SEM Diet Treatment Diet times
Treatment 1Change in BW (kg) -136 -113 792 0811 -244 -209 0686 lt 00001 071 0003
Final BW (kg) 466c 591b 681a 0811 578 581 069 lt00001 071 0003 1Change in BCS
(Score 1-5) -0488c 0482b 121a 00713 0410 0390 00603 lt00001 081 067
Final BCS 224c 317b 391a 00800 310 312 0068 lt00001 084 039
Pancreas Wt
g 580b 685a 727a 212 643 685 179 lt00001 009 028
of BW 125a 117ab 107b 0039 112 120 0033 0004 009 088
Protein
mgg 120 124 120 27 123 120 23 046 033 049
gpancreas 702b 846a 874a 0339 792 823 0293 00006 044 019
mgkg BW 151a 144ab 128b 65 138 144 56 003 047 085
α-Amylase
Ug 915b 136a 168a 1173 136 128 99 lt00001 057 086
kUpancreas 515c 921b 127a 0946 914 888 0799 lt00001 082 092
Ukg of BW 113b 156a 184a 151 153 150 127 0003 087 096
Ug protein 749c 1099b 1359a 870 1090 1049 743 lt00001 069 075
Trypsin
Ug 974 995 109 0657 102 102 055 041 094 054
Upancreas 567b 672ab 791a 477 648 702 402 0003 031 089
Ukg BW 121 115 118 085 113 123 072 089 030 072
Ug protein 809 934 907 580 847 853 489 043 094 035
Data are presented as least square means per treatment plusmn SEM Different letters signify means are different (P lt 005) Underfed UF (n = 42)
Control CON (n = 39) Overfed OF (n = 39) Arginine Arg (n = 59) Saline (n = 61) 1Over the experimental period (5-point scale)
74
75
Pag
e75
Figure 3-1 Diet times Treatment interaction on change in BW and final BW in non-pregnant ewes
Data are presented as least square means per treatment plusmn SEM Different letters signify means are different (P lt 005) Underfed (n =
42) Control (n = 39) Overfed (n = 39) Arginine Arg (n = 59) Saline (n = 61)
75
76 P
age7
6
No differences (P gt 005) in pancreatic protein concentration (mgg) were noted between
dietary groups or Arg vs Sal treatments Protein content (gpancreas) was greater (P = 0001) in
CON and OF ewes than UF while protein ( of BW) was greater (P =003) in UF than OF with
CON intermediate
The concentration (Ug) of α-amylase activity was greater (P lt 0001) in OF and CON
than UF ewes Overfed ewes had the greatest (P lt 0001) content of α-amylase activity
(kUpancreas) followed by CON Both OF and CON had a greater (P = 0003) content of α-
amylase activity relative to BW (Ukg BW) than UF ewes When expressed as Ug protein the
α-amylase activity was greatest (P lt 0001) in OF followed by CON and then UF Arginine
treatment had no impact on α-amylase activity
Trypsin activity (Ug) was not different among treatment groups and when expressed as
Upancreas was greater (P = 0003) in OF than UF with CON not being different from either
dietary group Trypsin activity (Ukg BW and Ug protein) was not different (P gt 005) between
diet or Arg treatment
Serum insulin concentration was greatest (P lt 0001) in OF followed by CON and then
UF ewes (Table 3-3) No effects of diet or Arg treatment (P gt 005) were noted in the pancreatic
insulin-positive area (relative to section of tissue) or size of insulin-containing clusters (microm2)
(Figure 3-2)
35 Discussion
Changes in BW and BCS due to variable amount of feed consumption is well
documented for sheep and other species (Church 1987 Grazul-Bilska et al 2012 Kaminski et
al 2015) Increased change in BW final BW and BCS in ewes provided dietary intake similar
77 P
age7
7
to that in the current study have been previously reported (Grazul-Bilska et al 2012
Keomanivong et al 2015a) as overfed ewes tended to gain weight while those restricted in
nutrient intake lost weight The diet times treatment interactions observed for final BW indicated that
OF ewes infused with Arg had the greatest final BW compared to other treatments This may be
because of the ability of Arg to increase NO production which is the major vasodilatory factor
(Kaminski et al 2015) This could then allow for increased delivery of nutrients ingested by the
overfed ewes However although serum Arg concentration increased with Arg treatment serum
nitric oxide metabolite concentration did not differ between dietary treatments or with Arg
treatment (Kaminski et al 2015) suggesting that these responses may not have been mediated by
changes in NO synthesis Surprisingly a study involving dairy heifers infused with Arg in the
peritoneum demonstrated that the proportion of essential amino acids in plasma was greater in
heifers exposed to a control rather than an Arg treatment (Yunta et al 2015) Infusing the ewes
directly into the jugular vein in the current study however may play a role in the differences
observed as may the difference in the amount of arginine used
The UF ewes in this study had lower pancreatic weight (g) This is likely the result of
reduced metabolizable energy and nutrient intake thus resulting in decreased tissue growth
(Ferrell et al 1986 Swanson et al 2008a Keomanivong et al 2015a) Furthermore because
BW was subjected to a greater decrease than pancreatic weight it is not surprising that UF ewes
had a greater pancreatic weight ( of BW) than OF ewes (Salim et al 2016)
Increasing dietary intake has been associated with greater pancreatic protein
concentration (gpancreas) and the secretion of exocrine digestive enzymes in this and other
studies (Swanson et al 2008b) It has been reported that enhanced pancreatic protein
78
Pag
e78
Table 3-3 Influence of nutrient restriction and arginine treatment on serum insulin and measurements of insulin containing clusters
in pancreas in non-pregnant sheep
Dietary Group Treatment P-Value
Item UF CON OF SEM Saline Arg SEM Diet Treatment Diet times
Treatment
Serum Insulin microIUmL 697b 988b 132a 1142 108 919 0977 0001 024 088
Pancreatic insulin-positive
area (relative to section of
tissue)
142 130 131 01486 139 129 0124 082 058 066
Insulin-containing clusters
within the following ranges
(micromsup2)
1 to 2000 645 677 647 197 648 665 164 043 048 067
2001 to 32000 349 315 345 188 344 328 155 037 047 063
32001 to 512000 0607 0762 0760 02071 0734 0685 01748 083 084 060
Average size of insulin-
containing clusters (micromsup2)
2988 3021 3158 2530 3111 3000 2103 086 069 073
Smallest insulin-containing
cluster (micromsup2)
251 251 250 05 250 250 04 037 093 024
Largest insulin-containing
cluster (micromsup2)
48936 55686 46492 67908 52364 48379 56436 061 062 016
Data are presented as least square means per treatment plusmn SEM Different letters signify means are different (P lt 005) Underfed
UF (n = 42) Control CON (n = 39) Overfed OF (n = 39) Arginine Arg (n = 59) Saline (n = 61)
78
79 P
age7
9
Figure 3-2 Influence of diet and treatment on insulin-positive staining Sections represent
pancreatic tissues of ewes receiving each diet and treatment Magnification 10x UF-Sal
(Underfed Saline) UF-Arg (Underfed Arginine) CON-Sal (Control Saline) CON-Arg (Control
Arginine) OF-Sal (Overfed Saline) OF-Arg (Overfed Arginine)
80 P
age8
0
concentration may increase the hydrolysis of nutrients in the small intestine (Corring 1980
Harmon 1992 Swanson et al 2000 Swanson and Harmon 2002)
An increase in the content (Upancreas) of α-amylase and trypsin activity in OF ewes was
observed in the current study which is likely due to increased feed intake (Wang et al 2000
Swanson et al 2008b) resulting in increases in enzyme concentration (Ug pancreas) or
increased tissue mass (g) of the pancreas and therefore tissue enzyme content Because no
difference in the concentration of trypsin (Ug) was noted in this experiment the increase in
content of trypsin activity was likely due to increased tissue mass whereas the increase in α-
amylase content was due to increases in both enzyme concentration and tissue mass
Insulin concentration in serum was greater in OF than CON and UF ewes in the current
study Similarly greater insulin concentration in overfed and lower insulin concentration in
underfed animals were reported by others (Church 1987 Diskin et al 2003 Adamiak et al
2005 Tsiplakou et al 2012 Kiani 2013 Kaminski et al 2015) In this study serum insulin
concentration was not affected by treatment with Arg In addition Arg treatment during late
pregnancy did not affect plasma insulin concentration in ovine fetuses (Oliver et al 2001) In
contrast high doses of Arg increased insulin concentration in ovine fetuses at late pregnancy
and Arg supplementation increased insulin concentration in calves (Gresores et al 1997 Huumlsier
and Blum 2002) Furthermore Arg infusion caused an acute increase in insulin concentration in
ovine fetuses and dairy cows (Vicini et al 1988) These data indicate that Arg effects on insulin
production depends on dose reproductive status and species On the other hand direct
associations between feed intake and serum insulin concentration is well documented for several
species (Keomanivong et al 2015a)
81 P
age8
1
The morphology of insulin containing cell cluster sizes was not affected by diet or Arg-
treatment Although NO has been previously shown to cause changes in exocrine and endocrine
function of the monogastric pancreas itrsquos function on ovine pancreatic function seems to be less
clear (Spinas 1999 Arciszewski 2007 Kaminski et al 2015) It is also possible that pancreatic
morphology of the ewes was unaltered due to the fact that the animals were mature and
pancreatic development had already been achieved While differences have been observed in our
previous studies involving pregnant ewes (Keomanivong et al 2015a) the amount of time spent
under nutrient restriction was significantly longer and there may be different responses within
pregnant and non-pregnant ewes
In the present and our previous study (Kaminski et al 2015) pancreatic measurements
andor insulin concentration were not affected by stages of the estrous cycle that is characterized
by changes of progesterone secretion These results may be due to the fact that the days
examined are close enough that pancreatic enzyme activity and insulin-cluster morphology were
not different
In summary results obtained from the current experiment have demonstrated that diet but
not Arg treatment or stage of the estrous cycle affected pancreatic function including mass
digestive enzyme activity and serum insulin concentration These results are supported by the
findings in the companion study of Kaminski et al (2015) who noted a greater impact of diet
than Arg or stage of the estrous cycle on measurements of serum metabolites (glucose) and
selected hormones (insulin-like growth factor 1 leptin and progesterone) Thus contrary to our
hypothesis dose and duration of Arg-treatment used was ineffective as a therapeutic to overcome
compromised nutrition in ewes but plane of nutrition seems to be a major regulator of pancreatic
exocrine function
82 P
age8
2
36 Literature Cited
Adamiak S J K Mackie R G Watt R Webb and K D Sinclair 2005 Impact of nutrition
on oocyte quality cumulative effects of body composition and diet leading to
hyperinsulinemia in cattle Biol Reprod 73918-926
Arciszewski M B 2007 Expression of neuronal nitric oxide synthase in the pancreas of sheep
Anat Histol Embryol 36375-381
Armstrong D G J G Gondg and R Webb 2003 Interactions between nutrition and ovarian
activity in cattle physiological cellular and molecular mechanisms Repro Supp
61403-414
Boland M P P Lonergan and D OrsquoCallaghan 2001 Effect of nutrition on endocrine
parameters ovarian physiology and oocyte and embryo development Theriogenology
551323-1340
Church D C 1987 The ruminant animal digestive physiology and nutrition Prentice Hall
Englewood Cliffs NJ
Corring T 1980 The adaptation of digestive enzymes to the diet its physiological significance
Reprod Nutr Dev 201217-1235
Diskin M G D R Mackey J F Roche and J M Sreenan 2003 Effects of nutrition and
metabolic status on circulating hormones and ovarian follicle development in cattle Anim
Reprod Sci 78345-370
Ferrell C L L J Koong and J A L Nienaber 1986 Effects of previous nutrition on body
composition and maintenance energy costs of growing lambs Br J Nut 56595-605
83 P
age8
3
Geiger R and H Fritz 1986 Trypsin Methods of Enzymatic Anal H Bergmeyer ed Acad
Press New York NY 119-128
Grazul-Bilska A T E Borowczyk J J Bilska L P Reynolds D A Redmer J S Caton and
K A Vonnahme 2012 Overfeeding and underfeeding have detrimental effects on
oocyte quality measured by in vitro fertilization and early embryonic development in
sheep Domestic Anim Endocrin 43289-298
Gresores A S Anderson D Hood G O Zerbe and W W Hay -Jr 1997 Separate and joint
effects of arginine and glucose on ovine fetal insulin secretion Am J Physiol 272E68-
73
Harmon D L 1992 Impact of nutrition on pancreatic exocrine and endocrine secretion in
ruminants a review J Anim Sci 701290-1301
Huumlsier B R and J W Blum 2002 Metabolic and endocrine changes in response to endotoxin
administration with or without oral arginine supplementation J Dairy Sci 851927-1935
Kiani A 2013 Temporal changes in plasma concentrations of leptin IGF-1 insulin and
metabolites under extended fasting and re-feeding conditions in growing lambs Int J
Endocrinol Metab 1134-40
Kaminski S L D A Redmer C S Bass D H Keisler L S Carlson K A Vonnahme S T
Dorsam and A T Grazul-Bilska 2015 The effects of diet and arginine treatment on
serum metabolites and selected hormones during the estrous cycle in sheep
Theriogenology 83808-816
Karsenti D Y Bacq J F Breacutechot N Mariotte S Vol and J Tichet 2001 Serum amylase and
lipase activities in normal pregnancy a prospective case-control study Am J
Gastroenterol 96697-699
84 P
age8
4
Keomanivong F E L E Camacho C O Lemley E A Kuemper R D Yunusova P P
Borowicz J D Kirsch K A Vonnahme J S Caton and K C Swanson 2015a Effects
of realimentation after nutrient restriction during mid- to late-gestation on pancreatic
digestive enzymes serum insulin and glucose levels and insulin-containing cell cluster
morphology J Anim Physiol Anim Nutr (In press doi101111jpn12480)
Keomanivong F E C O Lemley L E Camacho R Yunusova P P Borowicz J S Caton
A M Meyer K A Vonnahme and K C Swanson 2015b Influence of nutrient
restriction and melatonin supplementation of pregnant ewes on maternal and fetal
pancreatic digestive enzymes and insulin-containing clusters Animal 91-9
Khayambashi H M Boroumand A Boroumand F Hekmatyar and R C Barnett 1971 In
vitro inhibition of bovine serum and pancreatic amylase by progesterone Nature
230529-531
Lassala A F W Bazer T A Cudd S Datta D H Keisler M C Satterfield T E Spencer
and G Wu 2010 Parenteral administration of l-Arginine prevents fetal growth restriction
in undernourished ewes J Nutr 1401242-1248
Lassala A F W Bazer T A Cudd S Datta D H Keisler M C Satterfield T E Spencer
and G Wu 2011 Parenteral administration of L-arginine enhances fetal survival and
growth in sheep carrying multiple fetuses J Nutr 141849-855
Morimoto S M A Cerbόn A Alvarez-Alvarez G Romero-Navarro and V Diacuteaz-Saacutenchez
2001 Insulin gene expression pattern in rat pancreas during the estrous cycle Life Sci
682979-2985
National Research Council 1996 Nutrient requirements of beef cattle 7th ed National
Academy Press Washington DC
85 P
age8
5
Oliver M H P Hawkins B H Breier P L Van Zijl S A Sargison and J E Harding 2001
Maternal undernutrition during the periconceptual period increases plasma taurine levels
and insulin response to glucose but not arginine in the late gestational fetal sheep
Endocrinology 1424576-4579
Salim H K M Wood J P Cant and K C Swanson 2016 Influence of feeding increasing
levels of dry or modified wet corn distillers grains plus solubles in whole corn grain-
based finishing cattle diets on pancreatic α-amylase and trypsin activity Can J Anim
Sci 96294-298
Sartori R M M Guardieiro R S Surjus L F Melo A B Prata M Ishiguro M R Bastos
and A B Nascimento 2013 Metabolic hormones and reproductive function in cattle
Anim Reprod 10199-205
Smith P K R I Krohn G T Hermanson A K Mallia F H Gartner M D Provenzano E
K Fujimoto N M Goeke B J Olson and D C Klenk 1985 Measurement of protein
using bicinchoninic acid Anal Biochem 15076-85
Spinas G A 1999 The dual role of nitric oxide in islet szlig-cells News Physiol Sci 1449-54
Swanson K C and D L Harmon 2002 Dietary influences on pancreatic α-amylase expression
and secretion in ruminants In Biology of the Intestine in Growing Animals (ed R
Zabielski V Lesniewska PC Gregory and B Westrom) pp 515-537 Elsevier Boston
USA
Swanson K C N Kelly H Salim Y J Wang S Holligan M Z Fan and B W McBride
2008a Pancreatic mass cellularity and α-amylase and trypsin activity in feedlot steers
fed diets differing in crude protein concentration J Anim Sci 86909-915
86 P
age8
6
Swanson K C N Kelly Y J Wang M Ko S Holligan M Z Fan and B W McBride
2008b Pancreatic mass cellularity and a-amylase and trypsin activity in feedlot steers
fed increasing amounts of a high-moisture-corn based diet Can J Anim Sci 88 303-
308
Swanson K C J C Matthews A D Matthews J A Howell C J Richards and D L
Harmon 2000 Dietary carbohydrate source and energy intake influence the expression
of pancreatic α-amylase in lambs J Nutr 92157-2165
Tsiplakou E S Chadio and G Zervas 2012 The effect of long term under- and over-feeding
of sheep on milk and plasma fatty acid profiles and on insulin and leptin concentrations
J Dairy Res 79192-200
Vonnahme K A J S Luther L P Reynolds C J Hammer D B Carlson D A Redmer and
J S Caton 2010 Impacts of maternal selenium and nutritional level on growth
adiposity and glucose tolerance in female offspring in sheep Domest Anim Endocrin
39240-248
Wallenfels K P Fold H Niermann H Bender and D Linder 1978 The enzymic synthesis
by transglucosylation of a homologous series of glycosidically substituted malto-
oligosaccharides and their use as amylase substrates Carb Res 61359-368
Wang X B K Taniguchi and T Obitsu 2000 Response of pancreatic exocrine secretion in
sheep fed different type and amount of hay Asian Aus J Anim Sci 131004-1049
Wu G F W Bazer J M Wallace and T E Spencer 2006 Board-Invited Review
Intrauterine growth retardation implications for the animal sciences J Anim Sci
842316-2337
87 P
age8
7
Wu G and S M Morris Jr 1998 Arginine metabolism nitric oxide and beyond Biochem J
3361-17
Vicini J L J H Clark W L Hurley and J M Bahr 1988 Effects of abomasal or intravenous
administration of arginine on milk production milk composition and concentrations of
somatotropin and insulin in plasma of dairy cows J Dairy Sci 71658-665
Yunta C K A Vonnahme B R Mordhorst D M Hallford C O Lemley C Parys and A
Bach 2015 Arginine supplementation between 41 and 146 days of pregnancy reduces
uterine blood flow in dairy heifers Theriogenology 8443-50
88 P
age8
8
CHAPTER 4 EFFECTS OF REALIMENTATION AFTER NUTRIENT RESTRICTION
DURING MID- TO LATE GESTATION ON PANCREATIC DIGESTIVE ENZYMES
SERUM INSULIN AND GLUCOSE LEVELS AND INSULIN-CONTAINING CELL
CLUSTER MORPHOLOGY3
41 Abstract
This study examined effects of stage of gestation and nutrient restriction with subsequent
realimentation on maternal and fetal bovine pancreatic function Dietary treatments were
assigned on d 30 of pregnancy and included control (CON 100 requirements n = 18) and
restricted (R 60 requirements n = 30) On d 85 cows were slaughtered (CON n = 6 R n =
6) remained on control (CC n = 12) and restricted (RR n = 12) or realimented to control (RC
n = 11) On d 140 cows were slaughtered (CC n = 6 RR n = 6 RC n = 5) remained on control
(CCC n = 6 RCC n = 5) or realimented to control (RRC n = 6) On d 254 remaining cows
were slaughtered and serum samples were collected from the maternal jugular vein and umbilical
cord to determine insulin and glucose concentrations Pancreases from cows and fetuses were
removed weighed and subsampled for enzyme and histological analysis As gestation
progressed maternal pancreatic α-amylase activity decreased and serum insulin concentrations
increased (P le 003) Fetal pancreatic trypsin activity increased (P lt 0001) with advancing
3The material in this chapter was co-authored by F E Keomanivong L E Camacho C O Lemley E A Kuemper
R D Yunusova P P Borowicz J D Kirsch K A Vonnahme J S Caton and K C Swanson It has been
accepted for publication by Journal of Animal Physiology and Animal Nutrition doi 101111jpn12480 F E
Keomanivong had primary responsibility for collecting and analyzing samples in the field F E Keomanivong was
the primary developer of the conclusions that are advanced here F E Keomanivong also drafted and revised all
versions of this chapter K C Swanson served as proofreader and checked the math in the statistical analysis
conducted by F E Keomanivong
89 P
age8
9
gestation Fetal pancreases subjected to realimentation (CCC vs RCC and RRC) had increased
protein and α-amylase activity at d 254 (P le 002) while trypsin (Ug protein P= 002)
demonstrated the opposite effect No treatment effects were observed for maternal or fetal
pancreatic insulin-containing cell clusters Fetal serum insulin and glucose levels were reduced
with advancing gestation (P le 003) The largest maternal insulin-containing cell cluster was not
influenced by advancing gestation while fetal clusters grew throughout (P = 001) These effects
indicate that maternal digestive enzymes are influenced by nutrient restriction and there is a
potential for programming of increased fetal digestive enzyme production resulting from
previous maternal nutrient restriction
42 Introduction
The nutrient requirements of gestating cattle along with nutrient availability in
feedstuffs fluctuate throughout the year and meeting dietary needs can be challenging (Freetly et
al 2005 Freetly et al 2008) Dietary variations such as changes in feed intake and
composition influence the production and secretion of pancreatic digestive enzymes important
for the break down and absorption of feed in the small intestine (Swanson and Harmon 2002a
Mader et al 2009) Studies have also shown significant nutritional impacts on pancreatic
endocrine function (Fowden et al 1989 Sano et al 1999) The majority of experiments
evaluating nutritional effects on pancreatic function in cattle have been conducted in growing
animals and less is known about the impacts of nutrition and gestational stage on pancreatic
function and development in mature cows and their fetuses respectively
Maternal nutrition is responsible for both direct and indirect effects on fetal growth
Fowden and Hill (2001) have shown in ovine species that the pancreatic content of insulin
90 P
age9
0
increases in the fetus during gestation as long as the dam is provided with adequate nutrition
Restricted diets however may lead to reduced pancreatic endocrine cell number (Bertram and
Hanson 2001) as well as permanent deficiencies of insulin secretion and β-cell proliferation
(Winick and Noble 1966 Weinkove et al 1974 Snoeck et al 1990 Dahri et al 1995) The
proportion of insulin containing tissue within the pancreas of sheep may also be decreased in
nutrient restricted fetuses (Limesand et al 2005) This effect is thought to be caused by
diminished mitotic cell division however the impact on the pancreas of bovine tissue is
unknown
Responses of the gastrointestinal tract and associated tissues to pregnancy and time of
gestation have been evaluated and some authors suggest that in times of nutritional stress the
maternal body compensates for the loss of nutrients to the developing fetus by sacrificing
maternal metabolic needs (Molle et al 2004 Reed et al 2007) The fetus is also able to adapt to
periods of restriction by decreasing the rate of cell division which could induce lifelong changes
in the organ and whole animal functionality (Barker and Clark 1997) Such an effect is termed
developmental programming (Reynolds et al 2010 Zhang 2010)
In many species realimentation has been able to increase the body weight of restricted
animals to a level that matches non-restricted contemporaries (Funston et al 2010 Meyer et al
2010) Realimentation of nutrient restricted animals was also successful in returning the weights
of internal organs to those of their control counterparts (Zubair and Leeson 1994) Although the
growth of the conceptus is minimal during early gestation changes in cell proliferation can still
occur (Schoonmaker 2013) Carlsson et al (2010) reported noticeable pancreatic glucagon
staining at d 25 with insulin apparent at d 26 Also between d 89 to 105 small sections of insulin
clusters were beginning to assemble into larger groups Changes in these developmental patterns
91 P
age9
1
have the potential to alter pancreatic function after conception Although current knowledge of
bovine pancreatic growth is minimal numerous studies conducted in ewes undergoing nutrient
restriction from early to mid-gestation followed by realimentation until parturition indicate
significant compensatory growth of other areas of the body such as in placentomes (Foote et al
1958 Robinson et al 1995 McMullen et al 2005) and fetal musculature (Gonzalez et al
2013) While the majority of fetal growth has been shown to occur during late gestation it is
important to determine the most effective timing of realimentation during gestation to avoid
adverse physiological effects such as impaired growth or organ function postnatally
The pancreas has important exocrine and endocrine roles and there is limited information
on the functional and morphological changes that take place during gestation especially in cattle
Determining the physiological effects associated with dietary variation is also critical for
obtaining a comprehensive understanding of pancreatic development and maintenance The
objective of this study was to determine the impact of different lengths of nutrient restriction
during early- and mid-gestation and subsequent realimentation at different stages of gestation on
pancreatic function and development in fetuses We hypothesize that fetal pancreatic
development and maintenance will be altered by nutritional treatment of the mother during
advancing gestational age Moreover we believe nutrient restriction will be detrimental to
pancreatic function while increasing the duration of realimentation may help rescue pancreatic
development returning it to a level matching that of control animals Therefore the effects of
advancing gestation were evaluated (d 85 140 and 254) using cows receiving adequate nutrition
(NRC 2000) The impacts of dietary intake were assessed by comparing control to restricted
treatments and by comparing different lengths of realimentation were accessed by comparing
cows realimented for differing periods as compared to controls on d 85 140 and 254
92 P
age9
2
43 Materials and Methods
All animal care handling and sample collection was approved by the NDSU Institutional
Animal Care and Use Committee
431 Animals and Dietary Treatments
Animal use and treatment design have been described previously (Camacho et al 2014)
Briefly 34 non-lactating cross-bred multiparous cows were artificially inseminated Pregnancy
was verified on d 25 or 26 post-insemination using transrectal Doppler ultrasonography Cows
were trained to use the Calan gate feeding system (American Calan Northwood NH USA) with
exclusive access to feeders through electronic transponders in order to measure individual feed
intake Diets were composed of grass hay (86 DM 8 CP 685 NDF 415 ADF 58
TDN and 13 EE) Intake was adjusted every two weeks relative to body weight (BW) and
dietary dry matter (DM) intake was adjusted to meet NRC recommendations according to the
stage of gestation (average requirements for periods from d 30 to 85 d 86 to 140 d 141 to 197
and d 198 to 254) Intake for the control cows was 133 134 141 and 157 of BW (DM
basis) for periods of d 30 to 85 d 86 to 140 d 141 to 197 and d 198 to 254 with restricted
groups receiving 60 of the control cows relative to BW There were no feed refusals over the
experimental period Mineral and vitamin supplement (12 Ca 5 Mg 5 K 180 mgkg Co
5100 mgkg Cu 375 mgkg I 12 Fe 27 Mn 132 mgkg Se 27 Zn 570000 IUkg Vit
A 160000 IUkg Vit D-3 2700 IUkg Vit E Camacho et al 2014) was top-dressed three
times a week at a rate of 018 of hay DMI to meet requirements relative to BW change of the
cows (ie fed at a constant percentage of the total diet) On d 30 of pregnancy cows were
randomly assigned to dietary treatments (n = 4 to 5pen with greater than 1 dietary treatment per
pen) 1) control (CON 100 requirements n = 18) and 2) restricted (R 60 requirements n =
93 P
age9
3
30) On d 85 cows were slaughtered (CON n = 6 R n = 6) remained on control (CC n = 12)
and restricted (RR n = 12) or 3) were realimented to control (RC n = 11) On d 140 cows were
slaughtered (CC n = 6 RR n = 6 RC n = 5) remained on control (CCC n = 6 RCC n = 5) or
were realimented to control (RRC n = 6) At d 254 all remaining cows were slaughtered (CON
n = 6 RCC n = 5 RRC n = 6 Figure 4-1 Camacho et al 2014)
432 Sample Collection
On slaughter d 85 (early-gestation) 140 (mid-gestation) and 254 (late-gestation) of
pregnancy cows were weighed and slaughtered via captive bolt and exsanguination Blood
samples were collected from the maternal jugular vein and umbilical cord allowed to clot and
centrifuged at 2000 times g for 20 min to separate serum which was stored at -80degC for later analysis
of insulin and glucose concentration Pancreases were removed from both the cow and fetus and
trimmed of mesentery and fat Pancreases were weighed and a subsample of tissue was taken
from the body of the pancreas (Swanson et al 2004) and flash-frozen in isopentane that was
super-cooled in liquid nitrogen and then stored at -80˚C until analyses for protein and α-amylase
and trypsin activities A section of pancreatic tissue with an area of approximately 15 cm2 was
fixed in 10 formalin and later embedded in paraffin blocks to be used in
immunohistochemistry analyses
433 Analysis of Pancreatic Protein Concentration and α-Amylase and Trypsin Activity
Pancreatic tissue (025 g) was homogenized in a 09 NaCl solution (225 mL) using a
polytron (Brinkmann Instruments Inc Westbury NY USA) Protein concentration was
measured using the Pierce Bicinchoninic acid (BCA) Protein Assay Kit (Fisher Scientific
Pittsburgh PA USA) with bovine serum albumin (BSA) used as a standard diluted in saline
94
Pag
e94
100 NRC
CON (n = 18)
CC (n = 12) CCC (n = 6)
RC (n = 11) RCC (n = 5)
R (n= 30)
RR (n = 12) RRC (n = 6)
d 0 d 30 d 85 d 140 d 254
Tissue Collection Tissue Collection Tissue Collection
Figure 4-1 Diagram of experimental design adapted from Camacho et al 2014 Multiparous non-lactating beef cows were fed
grass hay to meet or exceed NRC recommendations (NRC 2000) until day 30 of gestation Dietary treatments were assigned on d
30 of pregnancy and included control (CON 100 requirements n = 18) and restricted (R 60 requirements n = 30) On d 85
cows were slaughtered (CON n = 6 R n = 6) remained on control (CC n = 12) and restricted (RR n = 12) or realimented to
control (RC n = 11) On d 140 cows were slaughtered (CC n = 6 RR n = 6 RC n = 5) remained on control (CCC n = 6 RCC
n = 5) or were realimented to control (RRC n = 6) On d 254 all remaining cows were slaughtered
94
95 P
age9
5
(09 NaCl) Activity of α-amylase was determined using the procedure of Wallenfels et al
(1978) utilizing a kit from Teco Diagnostics (Anahein CA USA) Trypsin activity was assayed
using the methods described by Geiger and Fritz (1986) after activation with 100 UL
enterokinase (Glazer and Steer 1977 Swanson et al 2002b) Analyses were adapted for use on
a microplate spectrophotometer (SpectraMax 340 Molecular Devices Sunnyvale CA USA)
One unit (U) of enzyme activity equals 1 micromole product produced per min Enzyme activity data
are expressed as Ug wet tissue kUpancreas or Upancreas Ukg BW and Ug protein
434 Serum Insulin and Glucose Analysis
Serum samples were analyzed for insulin by using an immunoassay system (Immulite
1000 Siemens Medical Solutions Diagnostics Los Angeles CA Grazul-Bilska et al 2012)
The interassay coefficient of variation (CV) for the low pool was 43 and 20 for the high
pool and the intra-assay CV was 876 Serum was analyzed for glucose using the
hexokinaseglucose-6-phosphate dehydrogenase method (Farrance 1987) using a kit from
Thermo Scientific (Pittsburgh PA USA) and a microplate reader (Synergy H1 Microplate
reader BioTek Instruments Winooski VT USA)
435 Immunohistochemistry
Maternal and fetal pancreatic tissue was immersion-fixed in formalin and embedded in
paraffin blocks (Grazul-Bilska et al 2009) From each sample 5-μm sections were obtained
from the blocks maintaining at least 100 μm between sections Tissue sections on the slides were
then deparaffinized and rehydrated After rehydration slides were incubated in a staining
enhancer citrate buffer heated to 95˚C for 5 minutes then cooled to room temperature Slides
were then covered in a solution of 10 donkey serum and 1 bovine serum albumin diluted in
tris-buffered saline for a period of 20 minutes Slides were incubated with 1100 mouse anti-pig
96 P
age9
6
insulin (Santa Cruz Biotech Dallas TX USA) in 1 BSA and tris-buffered saline overnight at
4˚C on a plate rocker The following day the slides were washed with tris-buffered saline with
added tween 20 (TBST) and incubated with 1100 CFtrade633 Goat Anti-Mouse IgG secondary
antibody for one hr in complete darkness A final wash with TBST was performed and coverslips
were applied using mounting medium containing 4 6- diamidino-2-phenylindole in order to
visualize all pancreatic cell nuclei
436 Histological analysis
Photomicrographs were taken with a Zeiss ImagerM2 epifluorescence microscope (Carl
Zeiss Microscopy Jena Germany) using a 10x objective and AxioCam HR camera with a Zeiss
piezo automated stage To describe morphology of the pancreas the mosaic image of a large
tissue area of approximately 144 pictures (12 times 12 pictures) on the slide was taken using the
MosaiX module of Zeiss AxioVision software This method allowed creation of a single image
covering all the pancreatic tissue present on the histological slide The MosaiX images were then
analyzed using the ImagePro Premier software (ImagePro Premier 90 Media Cybernetics
Silver Spring MD USA) for the insulin-positive tissue area (per section of tissue) and size of
insulin-containing cell clusters (Figure 4-2)
The images were analyzed by creating regions of interest corresponding to the whole area of
pancreatic tissue visible on the picture Within the regions of interest images were segmented
based on positive insulin staining and measurements of total positive insulin staining within
pancreatic tissue expressed as percent as well as of individual insulin-containing cell clusters
Insulin-containing cell clusters were further classified based on size in order to perform
population density measurements of small clusters (1 to 2000 μm2) medium clusters (2001 to
32000 μm2) large clusters (32001 to 512000 μm2) and giant clusters (ge 512000 μm2) Insulin-
97 P
age9
7
Figure 4-2 Representative images of insulin-containing cell clusters represented by sections
of maternal (left image a) and corresponding fetal (right image b) pancreatic tissue of cows
receiving 100 NRC recommendations (Tissues have been stained for insulin as shown in
white) Magnification 10x
positive cell clusters do not correspond to islets of Langerhans because not every cell in the islet
is insulin positive
437 Statistical Analysis
Data were analyzed as a completely randomized design Fetal sex was removed from the
model when significance was found to have a P-Value greater than 02 Therefore treatment was
included in the model statement for the dams while treatment and sex was included for the
fetuses Differences between means were determined using contrast statements analyzing linear
and quadratic effects in the control group (CON CC and CCC) over time to determine effects of
advancing gestation Contrast statement coefficients for linear and quadratic effects with unequal
spacing of day of gestation were determined using the interactive matrix language (IML)
procedure of SAS (statistical analysis software version 92 SAS Institute Inc Cary NC USA)
98 P
age9
8
Effects of dietary treatments were determined using contrast statements within slaughter day (d
85 d 140 or d 254 of gestation) to determine the effect of nutrient restriction on d 85 (CON vs
R) nutrient restriction on d 140 (CC vs RR and RC) nutrient restriction vs realimentation on d
140 (RC vs RR) nutrient realimentation on d 254 (CCC vs RCC and RRC) and the effect of
length of realimentation (RCC vs RRC) Linear and quadratic measurements and comparisons of
CON vs R treatments could not be obtained for fetal enzyme activity at d 85 as the pancreas was
too small for analysis Comparison of fetal enzymes from d 140 to d 254 was achieved using the
MIXED procedure of SAS and values using this method are indicated with the symbol dagger in
Tables 3 and 4 To determine if there were differences in enzyme activity and endocrine
measurements between dams and fetuses data were analyzed using the MIXED procedure of
SAS Physiological stage (maternal or fetal) treatment and the interactions between these
factors were included in the model Significance was declared at P le 005 and a tendency was
reported if 005 gt P le 010
44 Results
441 Maternal Enzyme Data
Body weight was not influenced by advancing gestation or dietary treatment except for a
tendency (P = 010) for CC cows to be heavier than RC and RR cows (Table 4-1)
Also Camacho et al (2014) found when comparing CC to RR cows RR cows had
decreased BW (P = 005) compared with CC cows (data not shown) Maternal pancreas absolute
weight (g) was not influenced by advancing gestation Maternal pancreas absolute weight (g)
was not influenced by nutrient restriction on d 85 tended to decrease (P = 008) in RC and RR
when compared to CC cows at d 140 was not influenced by realimentation on d 254 (CCC vs
99
Pag
e99
Table 4-1 Influence of realimentation after nutrient restriction during mid- to late gestation on maternal pancreatic digestive
enzymes Stage of Gestation
Early (Day 85) Mid (Day 140) Late (Day 254) p-value
Item CON R CC RC RR CCC RCC RRC SEM L Q
CON
vs R
CC
vs
RC
and
RR
RC
vs
RR
CCC
vs
RCC
and
RRC
RCC
vs
RRC
BW kg 558 540 606 571 531 610 619 606 287 022 035 062 010 030 094 073
Pancreas weight g 393 441 474 380 400 470 518 389 401 022 023 036 008 072 073 002
Pancreas gkg of BW 0706 0817 0783 0660 0747 0771 0835 0652 00594 049 041 016 025 029 069 003
Protein
mgg tissue 119 132 136 123 130 114 116 119 94 045 008 028 038 058 075 079
Total gpancreas 461 578 644 471 525 540 603 469 648 060 004 017 005 054 096 013
mgkg of BW 0083 0107 0106 0082 0098 0088 0097 0078 00094 096 006 006 014 023 095 015
α- Amylase
Ug 203 138 161 102 155 978 101 963 3541 003 086 016 043 027 098 091
kUpancreas 780 616 734 399 623 462 531 392 1561 010 075 042 022 030 100 052
Ukg of BW 139 110 122 689 121 761 848 652 2681 007 092 041 039 016 097 059
Ug protein 1676 1036 1142 789 1159 869 925 791 2320 002 031 004 053 025 097 067
Trypsin
Ug 119 0767 0984 135 0958 0917 0723 0441 02061 036 063 012 047 016 016 032
Upancreas 433 333 463 507 378 435 371 177 824 096 076 035 083 026 009 009
Ukg of BW 0797 0615 0753 0885 0715 0729 0588 0289 01430 073 089 033 077 038 008 013
Ug protein 100 587 700 111 743 836 710 364 1745 062 022 007 026 013 014 015 CON or C = control fed at 100 of NRC (2000) recommendations R = restricted fed at 60 of NRC (2000)
recommendations starting at d 30 and continuing until d 85 (R) or 140 (RR) n = 6 6 6 5 6 6 5 6 for CON R CC RC RR
CCC RCC and RRC treatments respectively L = linear effects of stage of gestation with CON CC and CCC treatments Q =
quadratic effects of stage of gestation with CON CC and CCC treatments CON vs R CC vs CR and RR RC vs RR CCC vs
RCC and RRC RCC vs RRC = contrast statements within slaughter days (d 85 d 140 or d 254 of gestation)
99
100 P
age1
00
RCC and RRC) and was greater (P = 002) in cows undergoing a longer realimentation period
(RCC vs RRC) Pancreas weight relative to BW (gkg BW) was not influenced by advancing
gestation was not influenced by nutrient restriction on d 85 or 140 (CON vs R CC vs RC and
RR and RC vs RR) was not influenced by realimentation on d 254 (CCC vs RCC and RRC)
and was greater (P = 003) in cows undergoing a longer realimentation period (RCC vs RRC) at
d 254 No linear effects were observed for protein concentration (mgg tissue) a tendency (P =
008) was observed for quadratic effects over gestation with an increase noted for control
treatments from d 85 to d 140 and a decrease until d 254 Dietary treatment did not influence
protein concentration (mgg tissue) Linear effects of advancing gestation were not present for
protein content (total gpancreas) quadratic effects (P = 004) were observed for control
treatments with advancing gestation with an increase from d 85 to d 140 followed by a decrease
until d 254 and d 140 protein content (gpancreas) was greater in CC cows (P = 005) than in
restricted cows (RC and RR) No other treatment effects were observed for protein content
(gpancreas) Advancing gestation did not impact protein content relative to BW (mgkg of BW)
however there was a tendency for a quadratic effect (P = 006) with an increase observed from d
85 to d 140 and a decrease until d 254 At d 85 pancreatic protein content relative to BW (mgkg
BW) tended to be greater (P = 006) in cows subjected to restriction (R vs CON) Dietary
treatment had no other effects on maternal protein content relative to BW (mgkg BW)
The progression of gestation resulted in a linear decrease (P le 003) in α-amylase (Ug)
and no quadratic or dietary treatment effects Content of α-amylase (kUpancreas) was not
affected by advancing gestation or dietary treatment A trend (P = 007) for a linear decrease in
total α-amylase activity relative to BW (Ukg BW) was observed and no other effects of α-
amylase activity relative to BW (Ukg BW) were observed A linear decrease (P = 002) in
101 P
age1
01
specific α-amylase activity (Ug protein) was observed with advancing gestation no quadratic
effects were observed CON cows had greater (P = 004) specific α-amylase activity (Ug
protein) than R cows at d 85 and dietary treatment had no other effects
Concentration of trypsin activity (Ug) was not influenced by advancing gestation or by
dietary treatment Advancing gestation or dietary treatment did not influence trypsin content
(Upancreas) until d 254 when RCC and RRC cows tended (P = 009) to have decreased total
trypsin activity (Upancreas) compared with CCC cows and RRC cows tended to have decreased
(P = 009) total trypsin activity (Ug pancreas) compared with RCC cows Total trypsin activity
relative to BW (Ukg of BW) was not influenced by advancing gestation or dietary treatment
until d 254 where there was a trend (P = 008) in trypsin activity relative to BW to be greater in
CCC cows than those subjected to prior restriction (RCC and RRC) Specific maternal trypsin
activity (Ug protein) was not influenced by advancing gestation however at d 85 CON cows
had greater specific trypsin activity than R cows No other dietary treatment effects on specific
trypsin activity (Ug protein) were observed
442 Maternal Endocrine and Histological Data
A linear increase (P = 002) in insulin concentration (microIUmL) in jugular serum occurred
as gestation progressed (Table 4-2) and no dietary treatment effects were observed
Glucose (mgdL) was not influenced by advancing gestation or dietary treatment on d 85
Cows on the RR treatment tended to have greater (P = 009) concentrations of jugular serum
glucose (mgdL) than RC cows on d 140 and jugular serum glucose was not influenced by
treatment on d 254
Pancreatic insulin positive area (relative to section of tissue) and percent of small insulin-
containing cell clusters were not influenced by gestational stage or dietary treatment Advancing
102
Pag
e10
2
Table 4-2 Influence of realimentation after nutrient restriction during mid- to late gestation on maternal serum and pancreatic
insulin concentration and measurements of insulin-containing cell clusters Stage of Gestation
Early (Day 85) Mid (Day 140) Late (Day 254) P-value
Item CON R CC RC RR CCC RCC RRC SEM L Q
CON
vs R
CC
vs
RC
and
RR
RC
vs
RR
CCC
vs
RCC
and
RRC
RCC
vs
RRC
Insulin microIUmL 517 887 927 507 102 135 132 148 2514 002 063 026 057 014 086 063
Glucose mgdL 934 995 961 838 949 906 886 854 4738 057 051 032 021 009 049 062
Pancreatic insulin-positive
tissue area (relative to section of
tissue)
108 131 126 116 117 0971 118 0943 05041 076 058 071 080 097 083 059
Insulin-containing cell clusters
within the following ranges
(microm2)
1 to 2000 569 452 567 571 555 491 489 637 1082 044 078 039 095 087 043 012
2002 to 32000 368 439 397 391 408 484 476 339 908 019 090 053 096 084 031 009
32001 to 512000 636 109 360 280 364 179 300 148 3185 018 061 025 087 077 087 058
Average size of insulin-
containing cell clusters (microm2) 7032 10946 6001 5160 5992 5409 6583 4109 24935 054 080 021 082 072 098 026
Smallest insulin- containing cell
clusters (microm2) 251 273 248 251 248 254 254 252 82 060 052 004 086 067 083 070
Largest insulin-containing cell
clusters (microm2) 57820 87886 111610 50122 58091 39301 54520 58200 43889 046 009 058 009 084 064 092
102
103 P
age1
03
gestation as well as dietary treatment on d 85 or d 140 did not influence the proportion of
medium insulin-containing cell clusters There was a tendency for medium insulin-containing
cell clusters during late-gestation (d 254 P = 009) to be greater in cows undergoing
realimentation at d 85 vs d 140 (RCC vs RRC) Proportion of large insulin-containing cell
clusters and the average size of insulin-containing cell clusters were not influenced by advancing
gestation or dietary treatment Advancing gestation did not influence the size of the smallest
insulin-containing cell cluster Cows offered an adequate diet had the smallest insulin-containing
cell clusters (P = 004) when compared to restricted animals on d 85 with no influences on d 140
and d 254 There was a trend for a quadratic effect (P = 009) for the size of the largest insulin-
containing cell cluster with the largest cluster observed on d 140 no treatment effects were
observed on d 85 there was a trend (P = 009) for the CC treatment to have the largest clusters
compared with RC and RR cows on d 140 and no effects were observed on d 254
443 Fetal Enzyme Data
There was a quadratic effect (P lt 0001) with advancing gestation for fetal BW (kg) and
pancreas weight (g) as weights increased to a greater extent from mid- to late- than from early- to
mid-gestation Fetal BW (kg) and pancreas weight (g) were not influenced by dietary treatment
(Table 4-3)
Relative pancreas weight (gkg BW) was not influenced by dietary treatment Although
the pancreas at d 85 was too small for enzyme analysis a comparison of controls at d 140 and
254 was performed to evaluate differences in relation to gestational stage Pancreatic protein
concentration (mgg tissue) was not influenced by advancing gestation or by dietary treatment on
d 140 but realimented cows (RCC and RRC) had greater (P = 0001) protein concentration than
104
Pag
e10
4
Table 4-3 Influence of realimentation after nutrient restriction during mid- to late gestation on fetal pancreatic digestive enzymes Stage of Gestation
Early (Day 85) Mid (Day 140) Late (Day 254) P-value
Item CON R CC RC RR CCC RCC RRC SEM
L or
Mid-
vs
Latedagger Q
CON
vs R
CC
vs
RC
and
RR
RC
vs
RR
CCC
vs
RCC
and
RRC
RCC
vs
RRC
BW kg 0117 0204 200 216 209 345 351 371 1121 lt0001 lt0001 095 092 096 022 019
Pancreas weight g 0105 0524 138 190 126 241 236 254 09499 lt0001 lt0001 073 085 062 071 018
Pancreas gkg of BW 0901 107 0756 0837 0737 0706 0659 0690 00825 052 098 012 074 038 073 078
Protein
mgg tissue - - 816 828 818 843 129 127 1010 084 - - 095 094 0001 093
Total gpancreas - - 0096 0169 0071 204 305 328 03195 lt0001 - - 095 082 0005 061
mgkg of BW - - 0062 0070 0061 0059 0087 0089 00104 081 - - 076 053 002 089
α- Amylase
Ug - - 0676 0730 0923 116 501 665 11981 075 - - 091 091 0002 031
kUpancreas - - 0003 0000 0005 0029 0120 0168 00301 051 - - 100 090 0002 024
Ukg of BW - - 0436 0708 0647 0825 321 445 07113 067 - - 076 095 0001 020
Ug protein - - 799 903 104 145 376 539 9104 058 - - 086 091 0005 019
Trypsin
Ug - - 0120 0170 0143 0564 0669 0625 00729 lt0001 - - 065 079 032 065
Upancreas - - -0220 0508 -0567 142 158 158 20009 lt0001 - - 093 070 049 099
Ukg of BW - - 0085 0127 0100 0401 0440 0424 00478 lt0001 - - 060 068 080 080
Ug protein - - 132 225 149 823 483 497 1121 lt0001 - - 067 063 002 093 1CON or C = control fed at 100 of NRC (2000) recommendations R = restricted fed at 60 of NRC (2000) recommendations
starting at d 30 and continuing until d 85 (R) or 140 (RR) n = 6 6 6 5 6 6 5 6 for CON R CC RC RR CCC RCC and RRC
treatments respectively L = linear effects of stage of gestation with CON CC and CCC treatments Q = quadratic effects of stage
of gestation with CON CC and CCC treatments CON vs R CC vs CR and RR RC vs RR CCC vs RCC and RRC RCC vs RRC =
contrast statements within slaughter days (d 85 d 140 or d 254 of gestation) The fetal pancreas at d 85 was too small for enzyme analysis and therefore was excluded from the data set as indicated by a dashed
line (-) Linear contrast for BW pancreas weight (g) and pancreas weight (gkg BW) CC vs CCC for all other variables
104
105 P
age1
05
CCC cows at d 254 Total protein content (gpancreas) increased (P lt 0001) from d 140 to d
254 was not influenced by treatment on d 140 and was greater (P = 0005) in realimented
groups (RCC and RRC) compared to CCC at d 254
Gestational stage did not influence concentration and content of α-amylase activity (Ug
kUpancreas Ukg BW and Ug protein) nor did dietary treatment on d 140 However
realimentation increased (P = 002) α-amylase activity as compared to controls (RCC and RRC
vs CCC)
As gestation advanced from d 140 to d 254 trypsin activity (Ug Upancreas Ukg of
BW and Ug protein) increased Trypsin specific activity (Ug protein) was not affected by
dietary treatment on d 140 but on d 254 trypsin activity (Ug Upancreas Ukg of BW and Ug
protein) was greater (P = 002) in CCC vs RCC and RRC cows
444 Fetal Endocrine and Histological Analysis
Serum insulin (microIUmL) concentration in the uterine umbilical cord decreased (P lt
0001) from d 140 to 254 but was not influenced by dietary treatment Serum glucose (mgdL)
decreased from d 140 to 254 (P = 003) but was not influenced by dietary treatment Pancreatic
insulin-positive tissue area (relative to section of tissue) linearly increased (P = 003) as gestation
progressed (Table 4-4) was not affected by treatment on d 85 demonstrated a trend (P = 007)
for fetuses from RR cows to have reduced insulin-positive tissue area compared to those
realimented at day 85 (RC) on d 140 and was not influenced by treatment on d 254
The percent of small insulin-containing cell clusters was not influenced by gestational
stage or dietary treatment The number of medium clusters (2001 to 32000 microm2) responded
quadratically (P = 002) with percentage of cell clusters increasing to a greater extent between d
85 to 140 than d 140 to 254 Dietary treatment did not influence number of medium clusters The
106
Pag
e10
6
Table 4-4 Influence of realimentation after nutrient restriction during mid- to late gestation on fetal serum and pancreatic insulin
concentration and measurements of insulin-containing cell clusters Stage of Gestation
Early (Day 85) Mid (Day 140) Late (Day 254) P-value
Item CON R CC RC RR CCC RCC RRC SEM L Q
CON
vs R
CC
vs
RC and
RR
RC vs
RR
CCC
vs
RCC and
RRC
RCC vs
RRC
Insulin microIUmL - - 775 729 780 194 190 181 601 lt0001 - - 078 054 091 091 Glucose mgdL - - 910 101 105 262 284 433 2148 003 - - 063 088 070 062
Pancreatic insulin-positive
tissue area (relative to section of tissue) 319 505 101 171 108 121 107 815 3629 003 016 068 016 007 038 040
Insulin-containing cell
clusters within the following ranges (microm2)
1 to 2000 738 885 696 623 714 599 611 604 991 016 097 025 071 033 092 094
2001 to 32000 102 984 307 361 289 383 387 383 5828 lt0001 002 096 067 019 097 094 32001 to 512000 0456 0315 0618 0945 0539 117 0997 121 0378 006 081 077 065 026 085 050
gt 512001 0031 -0062 0052 -0031 0059 0266 0210 0180 01217 005 055 055 067 044 048 077
Average size of insulin-containing cell clusters
(microm2) 1859 215 3440 2857 3205 8867 6786 6817 1716 001 071 060 082 088 032 099
Smallest insulin-containing cell clusters (microm2) 251 255 246 245 249 245 250 246 47 030 043 053 073 036 048 024
Largest insulin-containing
cell clusters (microm2) 100022
902280 522837 282972 526970 2260855 1752921 1427699 779045 001 064 090 084 074 031 062 aCON or C = control fed at 100 of NRC (2000) recommendations R = restricted fed at 60 of NRC (2000) recommendations
starting at d 30 and continuing until d 85 (R) or 140 (RR) n = 6 6 6 5 6 6 5 6 for CON R CC RC RR CCC RCC and RRC
treatments respectively L = linear effects of stage of gestation with CON CC and CCC treatments Q = quadratic effects of stage
of gestation with CON CC and CCC treatments CON vs R CC vs CR and RR RC vs RR CCC vs RCC and RRC RCC vs RRC
= contrast statements within slaughter days (d 85 d 140 or d 254 of gestation)
106
107 P
age1
07
percent of large clusters (32001 to 512000 microm2) tended to increase (P = 006) as gestation
progressed and was not influenced by dietary treatment The percentage of giant clusters (gt
512001 microm2) increased (P = 005) with advancing gestation but was not influenced by dietary
treatment The average size of insulin-containing cell clusters increased (P = 001) with
advancing gestation and was not influenced by dietary treatment The size of the smallest cluster
did not differ with advancing gestation and between dietary treatments The size of the largest
cluster increased (P = 001) as gestation progressed and was not influenced by dietary treatment
445 Comparison of Maternal and Fetal Enzyme Data
The relative pancreatic weight (gkg of BW) in the cows and fetuses was not influenced
by treatment (Table 4-5) The fetal pancreas had a greater (P lt 0001) percent of pancreatic
insulin-positive tissue area (relative to section of tissue Table 4-6) than maternal pancreas
Fetal pancreatic tissue had a larger percent (P lt 0001) of small insulin-containing cell
clusters than maternal tissue A greater percent of medium insulin-containing cell clusters (P lt
0001) and large insulin-containing cell clusters (P lt 0001) were observed in maternal tissues
compared with fetal tissues A greater percent of giant insulin-containing cell clusters were
observed in fetal pancreatic tissue (P = 0002) The average size of the insulin-containing cell
clusters was greater (P = 005) in the maternal compared with the fetal pancreas while the
smallest clusters were not different among maternal and fetal tissues The largest clusters (P lt
0001) were observed in fetal tissue as compared to maternal tissue
Interactions for physiological stage and treatment effects were observed for trypsin
activity (Ug Upancreas Ukg of BW Ug protein) insulin concentration (microIUmL) and
glucose concentration (mgdL) Interactions were also observed for the pancreatic insulin-
108 P
age1
08
Table 4-5 Comparison of maternal vs fetal pancreatic digestive enzymes
during mid- to late gestation
Physiological Stage
Item Maternal Fetal SEM P-Value
BW kga 590 188 764 lt0001
Pancreas weight ga 438 130 1085 lt0001
Pancreas gkg of BW 0742 0738 00240 092
Protein
mgg tissueb 123 977 384 lt0001
Total gpancreas 542 147 1942 lt0001
mgkg of BW 0092 0072 00039 lt0001
α- Amylase
Ug 119 244 10034 lt0001
kUpancreas 524 0053 44205 lt0001
Ukg of BW 896 167 7774 lt0001
Ug protein 946 214 6581 lt0001
Trypsin
Ugb 0896 0386 00567 lt0001
Upancreasb 388 780 22939 lt0001
Ukg of BWb 0660 0269 00411 lt0001
Ug proteinb 744 398 0553 lt0001 Data are presented as least square means plusmn SEM n = 48 aTreatment (p le 005) bPhysiological stage times Treatment (p le 005)
positive area (relative to section of tissue) percentage the average size of insulin-containing cell
clusters (microm2) and the largest insulin-containing cell cluster (microm2) The observed interactions
however were primarily because of differences in magnitude of response to treatment between
maternal and fetal tissues and therefore will not be discussed further
45 Discussion
451 Maternal Enzyme Data
The increase in pancreatic weight (g and gkg BW) in cows realimented for a longer
period (RCC vs RRC) may be due to the increased amount of time that the realimented cows
were exposed to greater intake resulting in compensatory growth Prolonged restriction in DM
intake and subsequent metabolizable energy in addition to the timing of gestation can have
109 P
age1
09
Table 4-6 Comparison of fetal vs maternal serum and pancreatic insulin concentration and
measurements of insulin-containing cell clusters
Physiological Stage P - Value
Item Maternal Fetal SEM
Insulin microIUmLab 1101 483 1854 lt0001
Glucose mgdLab 899 639 592 0003
Pancreatic insulin-positive tissue area
(relative to section of tissue) ab 106 952 0574 lt0001
Insulin-containing cell clusters within the
following ranges (microm2)
1 to 2000a 555 685 238 lt0001
2001 to 32000a 408 287 175 lt0001
32001 to 512000 327 076 0577 lt0001
gt 512001 0000 008 0020 0002
Average size of insulin-containing cell
clusters (microm2) b 5770 4162 5933 005
Smallest insulin-containing cell clusters
(microm2) 252 248 16 012
Largest insulin-containing cell clusters
(microm2) ab 60513 848290 119740 lt0001
Data are presented as least square means plusmn SEM n = 48 aTreatment (p le 005) bPhysiological stage times Treatment (p le 005)
significant effects on tissue growth and development impacting the organrsquos overall mass (Ferrell
et al 1986)
While little is known about the effects of pregnancy on pancreatic digestive enzymes in
mature cattle a linear decrease was observed in α-amylase activity with advancing gestation
Mizoguchi and Imamichi (1986) found that during the progression of pregnancy pancreatic α-
amylase in mice decreased to levels lower than that of the non-pregnant controls They believed
the change in activity to be related to hormones such as adrenaline glucagon thyroxine and
cortisol The cows in the current study may also have been exposed to elevated levels of
adrenaline and cortisol as it is possible that they experienced greater stress through feed
restriction and the additional strain of pregnancy Croom et al (1992) also reported that the
110 P
age1
10
nervous system plays a major role in the control of pancreatic exocrine secretion and states that
stimulation of the vagus nerve causes enhanced secretion of α-amylase Because the vagus nerve
interfaces with the parasympathetic nervous system it seems logical that as adrenaline or cortisol
block this interface α-amylase activity would be reduced
Although no differences in trypsin activity were observed due to nutrient restriction in the
current study several trends during late gestation indicate that previously nutrient restricted cows
had a reduced capacity for trypsin production compared to that of their control treatment
counterparts Examination of realimentation strategies also indicate an impact on trypsin at d 254
with animals enduring prolonged restriction exhibiting an even greater reduction than those
realimented early in gestation Animals experiencing prolonged nutrient restriction are often
more likely to exhibit signs of reduced capacity of digestive enzymes despite realimentation
(Huquet et al 2006)
452 Maternal Endocrine and Histological Data
A study conducted by Reynolds et al (1990) tested the effects of day of gestation on
maternal plasma insulin and glucose concentration and found no effect of day of gestation Their
findings do not agree with the results of this trial as cows on the present study exhibited an
increase in serum insulin concentration (microIUmL) as gestation progressed Several reasons may
exist for the results observed here The first possible cause might be related to the insulin
resistance that frequently accommodates advancing gestation (Salin et al 2012) As a result of
insulin resistance the bodyrsquos normal cellular response to the hormone is reduced and the
pancreas of these animals often begins producing more insulin as a way of compensation
Another potential cause may be the increased amount of metabolizable protein provided to the
cows through realimentation because of increased dietary feed intake A study done by
111 P
age1
11
Sletmoen-Olson et al (2000b) evaluated the impact of three different levels of undegradable
intake protein (low medium and high) resulting in increased supply of metabolizable protein
provided during late gestation (months 7 8 and 9) The researchers found that the plasma insulin
levels increased when levels of UIP offered increased They also found that insulin levels
escalated during months 8 and 9 corresponding to late gestation Along with the cows being
realimented in the current trial the amount of feed offered also increased to ensure the animals
were provided with enough feed to meet NRC recommendations These increases in insulin
concentration may have been caused by the greater levels of amino acids found in the
supplements (Sletmoen-Olson et al 2000a) and the ability of these amino acids to stimulate
insulin production
A quadratic effect in pancreatic insulin concentration with advancing gestation was noted
with CC cows having the greatest values for the largest insulin-containing cell clusters at d 140
which is similar to results from multiple studies that report a substantial increase in serum and
plasma insulin levels during mid-gestation of ewes which then seem to decrease as pregnancy
progresses to final term (Blom et al 1976 Vernon et al 1981) While the differing
realimentation strategies did not influence endocrine measurements in the maternal pancreas
trends were observed on d 254 with cows exposed to early realimentation having a greater
percentage of medium insulin-containing cell clusters when compared against those remaining
restricted until d 140 Perhaps this observation can be explained by compensatory gain as the
pancreas of animals subjected to earlier realimentation would likely be working to secrete
sufficient levels of insulin into the bodyrsquos blood stream to offset the loss caused by previous
nutrient restriction Therefore the pancreas could have developed a greater number of medium
112 P
age1
12
insulin-containing cell clusters capable of secreting larger quantities of insulin and compensating
for prior dietary insults
453 Fetal Enzyme Data
As expected a gain in fetal weight was observed as pregnancy progressed with the
majority of fetal growth and development occurring during the last third of gestation (Robinson
et al 1977) as indicated by the quadratic effect with advancing gestation The lack of an effect
of dietary treatments on fetal BW (g) or pancreas weight (g or gkg BW) agree with the findings
of Long et al (2010) who found no differences in BW or pancreas weight of fetuses from
nutrient restricted dams regardless of realimentation strategy Pancreas weight (g) protein
concentration (total gpancreas) and trypsin activity (Ug Upancreas Ukg of BW and Ug
protein) increased from d 140 to d 254 In agreement with our findings increases in bovine fetal
pancreatic digestive enzymes were also observed as gestation progressed in a study conducted by
Track et al (1972) who noted the rising levels of trypsin activity continued until the calves had
reached 12 weeks post-partum Unfortunately no postpartum measurements could be collected
during this study
At d 254 a clear impact of realimentation can be observed when evaluating pancreatic
enzyme activity The RCC and RRC treatments had greater protein concentration and content
(mgg gpancreas and gkg BW) and α-amylase activity (Ug kUpancreas Ukg of BW Ug
protein) indicating that the pancreas may have been subjected to compensatory development with
an overshot in compensation Trypsin activity (Ug protein) however was greater in the CON
treatment This suggests a potential programming effect of early- to mid-gestation nutrient
restriction on fetal pancreatic development of the exocrine pancreas
113 P
age1
13
454 Fetal Endocrine and Histological Data
In the current study both insulin (microIUmL) and glucose (mgdL) concentration decreased
from d 140 to d 254 While the majority of fetal growth occurs in the last trimester Aldoretta et
al (1998) reported that the fetal pancreas of ovine species develops in the late first to early
second trimester This allows for the production of measurable insulin concentrations by mid-
gestation Additionally studies in cattle have shown that serum insulin levels increase from 90 to
150 days of gestation and then begin to decline as pregnancy continues (Padodar et al 2014)
DrsquoAgostino et al (1985) also noted a decrease in pancreatic insulin concentrations of the fetal
bovine between the mid-second and third trimester This reduction may be the result of the
pancreas compensating for its rapidly developing exocrine function (Frazier et al 1981)
Progression of gestation resulted in an increase in fetal pancreatic insulin-positive tissue
area (relative to section of tissue) along with percent of medium large and giant insulin-
containing cell clusters An increase was also found in the average size of clusters and in the size
of the largest clusters found within each area of pancreatic tissue analyzed Although we
observed linear increases there was a numerically greater increase from early- to mid-gestation
than from mid- to late-gestation which agrees with the plasma insulin data
At d 140 the percentage of insulin-positive tissue area (relative to section of tissue)
tended to decrease in fetuses from cows subjected to prolonged nutrient restriction Dietary
treatment had no impact on the size or distribution of insulin-containing cell clusters Results
from studies conducted in sheep by Limesand et al (2006) and Fowden and Hill (2001) reported
pancreatic islets from nutritionally deprived fetuses had reduced mass and insulin secretion A
study by Gonzalez et al (2013) investigating fetal muscle fiber reported that realimentation after
nutrient restriction until d 140 was able to support compensatory growth and return fiber size and
114 P
age1
14
muscle progenitor numbers to those of control fetuses in bovine animals by d 254 The
conclusions drawn by the authors may explain the lack of differences in fetal tissue at d 254
While the theory behind compensatory growth is well documented the results found in this study
appear to be more likely due to the maternal ability to maintain fetal pancreatic endocrine
development as well as maintain their own metabolic needs in the face of nutrient restriction
455 Comparison of Maternal and Fetal Enzyme Data
Cows in this study had greater digestive enzyme activity than fetuses The immaturity of
the fetal exocrine pancreatic function is expected as fetuses receive their nutrition from the dams
and therefore are not required to directly digest any feed components (Snoeck et al 1990)
456 Comparison of Maternal and Fetal Endocrine and Histological Data
The concentration of insulin in umbilical serum was greater than that in the maternal
jugular vein The level of glucose in the umbilical cord however was lower than that in
maternal circulation This is not surprising as glucose is transported across the placenta resulting
in a constant supply from the dam and further fetal gluconeogenesis is limited (Porter 2012)
Similar to a recent study in sheep the insulin-positive tissue area (relative to section of
tissue) was greater in fetuses than dams (Keomanivong et al 2015) A greater percentage of
small and giant insulin-containing cell clusters along with the largest clusters measured were
found in fetal pancreatic tissue Maternal tissue had a greater percentage of medium and large
insulin-containing cell clusters The differences found between fetal and maternal pancreatic
insulin-positive tissue area (relative to section of tissue) and the size distribution of insulin-
containing cell clusters indicates a dramatic shift in endocrine functionality as the fetus develops
Merkwitz et al (2012) also examined the morphology of the fetal and cow pancreas and found
islets of two differing sizes The percent of smaller islets (interlobular islets) was greater in fetal
115 P
age1
15
tissue Larger islets (perilobular giant islets) were also present although they appeared less
frequently Islets of intermediate size were shown to persist into adulthood while perilobular
giant islets underwent regression Results from the current study support these findings as
demonstrated in Figure 4-2 It is also not surprising that the average size of maternal insulin
containing cell clusters would be greater than that found in fetal tissue The increased number of
small clusters along with the limited giant clusters found in fetal tissue in contrast to the greater
percentages of medium and large clusters found in maternal tissue could therefore reasonably
result in a larger average size of insulin-containing cell clusters in maternal tissue More work is
needed in this area however to determine the timing of regression and the impact on pancreatic
function as the calf matures
46 Conclusion
Our results suggest that maternal digestive enzymes are influenced by nutrient restriction
and that the fetal pancreas undergoes significant shifts of escalation and regression in endocrine
and exocrine function due to stage of gestation and maternal nutrient restriction Realimentation
was able to reverse the impact of restriction and in some cases increase the concentration of
fetal pancreatic protein and enzyme activity as compared to the controls It is not known if these
differences would persist after parturition and into adulthood Feeding strategies during mid- to
late gestation can alter pancreatic physiology of the cow and fetal pancreatic development
47 Literature Cited
Aldoretta P W T D Carver and W W Hay -Jr 1998 Maturation of glucose-stimulated
insulin secretion in fetal sheep Biol Neonate 73375-386
116 P
age1
16
Barker D J and P M Clark 1997 Fetal undernutrition and disease in later life Rev Reprod
2105-112
Bertram C E and M A Hanson 2001 Animal models and programming of the metabolic
syndrome Brit Med Bull 60103-121
Blom A K K Hove and J J Nedkvitne 1976 Plasma insulin and growth hormone
concentrations in pregnant sheep I diurnal variations in mid- and late pregnancy Acta
Endocrinologica 82553-560
Camacho L E C O Lemley M L Van Emon J S Caton K C Swanson and K A
Vonnahme 2014 Effects of maternal nutrient restriction followed by realimentation
during early and mid-gestation on beef cows I Maternal performance and organ weights
at different stages of gestation J Anim Sci 92520-529
Carlsson G L R S Heller P Serup and P Hyttel 2010 Immunohistochemistry of pancreatic
development in cattle and pig Anatomia Histologia Embryologia 39107-119
Croom W J -Jr L S Bull and I L Taylor 1992 Regulation of pancreatic exocrine secretion
in ruminants a review J Nutr 1221191-202
DrsquoAgostino J J B Field and M L Frazier 1985 Ontogeny of immunoreactive insulin in the
fetal bovine pancreas Endocrinol 1161108-1116
Dahri S B Reusen C Remacle and J J Hoet 1995 Nutritional influences on pancreatic
development and potential links with non-insulin-dependent diabetes Proc Nutr Soc
54345-356
Farrance I 1987 Plasma glucose methods a review Clin Biochem Rev 855ndash68
Ferrell C L L J Koong and J A L Nienaber 1986 Effects of previous nutrition on body
composition and maintenance energy costs of growing lambs Brit J Nutr 56595-605
117 P
age1
17
Foote W C A L Pope C R Earl A B Chapman and L E Casida 1958 Reproduction in
the yearling ewe as affected by breed and sequence of feeding levels II Effects on fetal
development J Anim Sci 18463ndash474
Fowden A L and DJ Hill 2001 Intra-uterine programming of the endocrine pancreas Brit
Med Bull 60123-142
Fowden A L P Hughes and R S Comline 1989 The effects of insulin on the growth rate of
the sheep fetus during late gestation Q J Exp Physiol 74703-714
Frazier M L R A Montagna and G F Saunders 1981 Insulin gene expression during
development of the fetal bovine pancreas Biochem 20367-371
Freetly H C C L Ferrell and T G Jenkins 2005 Nutritionally altering weight gain patterns
of pregnant heifers and young cows changes the time that feed resources are offered
without any differences in production J Anim Sci 83916-1026
Freetly H C J A Nienaber and T Brown-Brandl 2008 Partitioning of energy in pregnant
beef cows during nutritionally induced body weight fluctuation J Anim Sci 86370-
377
Funston R N D M Larson and K A Vonnahme 2010 Effects of maternal nutrition on
conceptus growth and offspring performance implications for beef cattle production J
Anim Sci 88E205-E215
Glazer G and M L Steer 1977 Requirements for activation of trypsinogen and
chymotrypsinogen in rabbit pancreatic juice Anal Biochem 77130ndash140
Gonzalez J M L E Camacho S M Ebarb K C Swanson K A Vonnahme A M Stelzleni
and S E Johnson 2013 Realimentation of nutrient restricted pregnant beef cows
supports compensatory fetal muscle growth J Anim Sci 914797-4806
118 P
age1
18
Grazul-Bilska A T J S Caton W Arndt K Burchill C Thorson E Borowczyk J J Bilski
D A Redmer L P Reynolds and K A Vonnahme 2009 Cellular proliferation in
ovine fetal ovaries Effects of energy restrictions and selenium in maternal diet
Reproduction 137699ndash707
Grazul-Bilska A T E Borowczyk J J Bilski L P Reynolds D A Redmer J S Caton and
K A Vonnahme 2012 Overfeeding and underfeeding have detrimental effects on
oocyte quality measured by in vitro fertilization and early embryonic development in
sheep Dom Anim Endocrinol 43289ndash298
Huguet A G Savary E Bobillier Y Lebreton and I Le Hueumlrou-Luron 2006 Effects of level
of feed intake on pancreatic exocrine secretions during the early post weaning period in
piglets J Anim Sci 842965-2972
Keomanivong F E C O Lemley L E Camacho R Yunusova P P Borowicz J S Caton
A M Meyer K A Vonnahme and K C Swanson 2015 Influence of nutrient
restriction and melatonin supplementation of pregnant ewes on maternal and fetal
pancreatic digestive enzymes islet morphology and plasma insulin concentration
Animal 91-9
Limesand S W J Jensen J C Hutton and W W Hay 2005 Diminished β-cell replication
contributes to reduced β-cell mass in fetal sheep with intrauterine growth restriction Am
J Physiol 288R1297-R1305
Limesand S W P J Rozance G O Zerbe J C Hutton and W W Hay 2006 Attenuated
insulin release and storage in fetal sheep pancreatic islets with intrauterine growth
restriction Endocrinology 1471488-1497
119 P
age1
19
Long N M M J Prado-Cooper C R Krehbiel U DeSilva R P Wetteman 2010 Effects of
nutrient restriction of bovine dams during early gestation on postnatal growth carcass
and organ characteristics and gene expression in adipose tissue and muscle J Anim Sci
883251-3261
Mader C J Y R Montanholi Y L Wang S P Miller I B Mandell B W McBride and K
C Swanson 2009 Relationships among measures of growth performance and efficiency
with carcass traits visceral organ mass and pancreatic digestive enzymes in feedlot
cattle J Anim Sci 871548-1557
McMullen S J C Osgerby J S Milne J M Wallace and D C Wathes 2005 The effects of
acute nutrient restriction in the mid-gestational ewe on maternal and fetal nutrient status
the expression of placental growth factors and fetal growth Placenta 2625ndash33
Merkwitz C P Lochhead J Boumlttger M Matz-Soja M Sakurai R Gebhardt and A M
Ricken 2012 Dual origin development and fate of bovine pancreatic islets J Anat
222358-71
Mizoguchi J and T Imamichi 1986 Decrease in amylase (EC 34214) synthesis in lactating
rats Brit J Nutr 57291-299
Molle J D C E J Scholljegerdes S L Lake V Nayigihugu R L Atkinson L R Miller S
P Ford W J Means J S Caton and B W Hess 2004 Effects of maternal nutrient
restriction during early to mid-gestation on cow and fetal visceral organ measurements
Proc WSASAS 55405ndash409
Meyer A L J J Reed K A Vonnahme S A Soto-Navarro L P Reynolds S P Ford B W
Hess and J S Caton 2010 Effects of stage of gestation and nutrient restriction during
120 P
age1
20
early to mid-gestation on maternal and fetal visceral organ mass and indices of jejunal
growth and vascularity in beef cows J Anim Sci 882410-2424
National Research Council 2000 Nutritional Requirements of Beef Cattle 7th rev ed Natl
Acad Press Washington DC
Padodar R J J S Arya and J Ninan 2014 Assessment of blood glucose and serum insulin
profiles at different stages of gestation in triple cross-bred cattle Indian J Anim Res
4894-96
Porter T E 2012 Development and function of the fetal endocrine system Endocrinology of
Pregnancy 13387-406
Reed J J M A Ward K A Vonnahme T L Neville S L Julius P P Borowicz J B
Taylor D A Redmer A T Grazul-Bilska LP Reynolds and J S Caton 2007 Effects
of selenium supply and dietary restriction on maternal and fetal body weight visceral
organ mass and cellularity estimates and jejunal vascularity in pregnant ewe lambs J
Anim Sci 85 721-2733
Reynolds L P P P Borowicz J S Caton K A Vonnahme J S Luther C J Hammer K R
Maddock Carlin A T Grazul-Bilska and D A Redmer 2010 Developmental
programming The concept large animal models and the key role of uteroplacental
vascular development J Anim Sci 88E61-72
Reynolds L P C L Ferrell D A Robertson and J Klindt 1990 Growth hormone insulin
and glucose concentrations in bovine fetal and maternal plasma at several stages of
gestation J Anim Sci 68725-733
Robinson J S C K Kind F Lok P Owens and J Owen 1995 Placental control of fetal
growth Reprod Fert Dev 7333ndash344
121 P
age1
21
Robinson J J I McDonald C Fraser and I McHattie 1977 Studies on reproduction in
prolific ewes I Growth of the products of conception J Agric Sci Cambridge 88539-
552
Salin S J Taponen K Elo I Simpura A Vanhatalo R Boston and T Kokkonen 2012
Effects of abomasal infusion of tallow or camelina oil on responses to glucose and insulin
in dairy cows during late pregnancy J Dairy Sci 953812-5206
Sano H A Takebeyashi Y Kodama H Nakamura H Ito Y Arino T Fujita H Takahashi
and K Ambo 1999 Effect of feed restriction and cold exposure on glucose metabolism
in response to feeding and insulin in sheep J Anim Sci 772564-2573
Schoonmaker J 2013 Effect of maternal nutrition on calf health and growth Tri-State Dairy
Nutr Conf 63-80
Sletmoen-Olson K A J S Caton K C Olson D A Redmer J D Kirsch and L P
Reynolds 2000a Undergraded intake protein supplementation II Effects on plasma
hormone and metabolite concentrations in periparturient beef cows fed low-quality hay
during gestation and lactation J Anim Sci 78456-463
Sletmoen-Olson K A J S Caton K C Olson and L P Reynolds 2000b Undergraded intake
protein supplementation I Effects on forage utilization and performance of periparturient
beef cows fed low quality hay J Anim Sci 78449-455
Snoeck A C Remacle B Reusens and J J Hoet 1990 Effects of low protein diet during
pregnancy on the fetal rat endocrine pancreas Biol Neonate 57107ndash118
Swanson K C J A Benson J C Matthews and D L Harmon 2004 Pancreatic exocrine
secretion and plasma concentration of some gastrointestinal hormones in response to
abomasal infusion of starch hydrolyzate andor casein J Anim Sci 821781-1787
122 P
age1
22
Swanson K C and D L Harmon 2002a Dietary influences on pancreatic α-amylase
expression and secretion in ruminants Biology of the Intestine in Growing Animals R
Zabielski V Lesniewska PC Gregory and B Westrom ed 515ndash537 Elsevier Boston
MA
Swanson K C J C Matthews C A Woods and D L Harmon 2002b Postruminal
administration of partially hydrolyzed starch and casein influences pancreatic alpha-
amylase expression in calves J Nutr 132376-381
Swanson K C N Kelly H Salim Y J Wang S Holligan M Z Fan and B W McBride
2014 Pancreatic mass cellularity and α-amylase and trypsin activity in feedlot steers fed
diets differing in crude protein concentration J Anim Sci 86909ndash915
Track N S M Bokermann C Creutzfeldt H Schmidt and W Creutzfeldt 1972 Enzymatic
and ultrastructural development of the bovine exocrine pancreas Comp Biochem
Physiol 43B313-332
Vernon R G R A Clegg and D J Flint 1981 Metabolism of sheep adipose tissue during
pregnancy and lactation adaptation and regulation Biochem J 200307-314
Weinkove C E A Weinkove and B L Pimstone 1974 Microassays for glucose and insulin
South African Med J 48365ndash368
Winick M and A Noble 1996 Cellular response in rats during malnutrition at various ages J
Nutr 89300ndash306
Zhang L 2010 Fetal pancreatic beta-cell development and insulin secretion in ovine maternal
over-nutrition and under-nutrition models Univ of Wyoming Laramie WY Doctoral
Thesis
123 P
age1
23
Zubair A K and S Leeson 1994 Effect of early feed restriction and realimentation on heat
production and changes in sizes of digestive organs of male broilers Poult Sci 73529-
538
124 P
age1
24
CHAPTER 5 INFLUENCE OF DRY-ROLLED CORN PROCESSING AND
DISTILLERS GRAIN INCLUSION RATE ON RUMINAL PH AMMONIA AND
VOLATILE FATTY ACID CONCENTRATION IN VITRO METHANE
CONCENTRATION AND ENZYME ACTIVITY
51 Abstract
The objective was to determine the effects of degree of dry-rolled corn processing and
dried distillerrsquos grains with solubles (DDGS) inclusion rate on ruminal pH NH3 and volatile
fatty acid (VFA) concentration total in vitro gas and methane production and enzyme activity in
cattle fed high-concentrate diets Eight ruminally cannulated Holstein steers (526 plusmn 36 kg) were
assigned randomly to four dietary treatments in a 2 times 2 factorial arrangement consisting of 1)
65 coarse-rolled corn (25 mm) with 20 DDGS 2) 45 coarse-rolled corn with 40 DDGS
3) 65 fine-rolled corn (17 mm) with 20 DDGS and 4) 45 fine-rolled corn with 40
DDGS Diets met NRC recommendations and were offered for ad libitum intake The
experimental design was a 4 times 4 Latin square with 17 d periods allowing for 7 d of diet
adaptation 7 d of sample collection and 3 d of rest in which all steers were offered an
intermediate ration Results showed no differences in ruminal pH among treatments However
steers consuming 40 DDGS tended (P = 007) to have a pH less than 55 for a longer period of
time (hd) than those consuming 20 DDGS Ruminal NH3 was greater in steers receiving 20
DDGS (P = 002) Steers fed fine-rolled corn had greater (P = 002) concentrations of butyric
acid while those consuming coarse-rolled corn tended (P = 006) to have greater levels of
isovaleric acid No difference in DM degradation rate was noted between treatments In vitro
methane concentration of the headspace was unaffected by treatment Steers fed diets containing
125 P
age1
25
20 DDGS had greater (P lt 0001) ruminal α-amylase activity (UL ruminal fluid ULkg
starch disappearance) while those fed 40 DDGS had greater (P = 001) trypsin activity (ULkg
CP disappearance) An interaction between degree of corn processing times DDGS was noted for
measurements of trypsin activity (ULkg CP disappearance P = 002) and maltase (UL of
ruminal fluid P = 0004) In conclusion these differences are likely the result of the final
nutrient profile of each treatment Overall there were minimal effects on ruminal fermentation
and in vitro methane concentration with increasing degree of dry-rolling or DDGS inclusion
indicating limited effects on ruminal health and environmental sustainability
52 Introduction
Ethanol is a commonly produced alternative fuel which is largely manufactured in the
USA using corn grown in the midwestern part of the country The production of ethanol also
supplies a by-product known as dried corn distillerrsquos grains with solubles (DDGS) which
provides a valuable feed source for ruminants (Dicostanzo and Write 2012) In addition to being
an economical supplement DDGS provides approximately 10 more energy than corn
(Klopfenstein et al 2008) as well as nearly 30 protein 5 to 10 fat and 1 phosphorus (Jacob
et al 2010) Feeding DDGS often results in improved feed efficiency in finishing cattle
(Swanson et al 2014)
Although the available information on particle size reduction of rolled corn when fed
with DDGS is limited Loe et al (2006) reported an increase in intake when offering finely vs
coarsely rolled corn in diets containing corn gluten feed The rate of digestibility has also been
shown to increase in cattle consuming mechanically processed corn grain (Galyean et al 1979
126 P
age1
26
Galyean 1996) However attention must be given to diet formulation when implementing
various processed corn to avoid issues with ruminal acidosis
While it is crucial to prevent acidosis studies have shown that diets containing more corn
relative to forage will lower the pH of the rumen which may result in a reduction in the NH3
concentration (Zhang et al 2015) These results are likely due to the ability of the starch-
fermenting bacteria to assimilate NH3 and increase propionate production (Lana et al 1998
Russell 1998) This change in the acetatepropionate ratio is associated with a reduction in CH4
emission from the rumen (Luepp et al 2009) The quantity of CH4 being produced during the
enteric fermentation of diets high in starch may also be reduced as cattle fed these diets produce
less hydrogen in the rumen In addition an improved feed efficiency provides a shorter time to
market allowing less opportunity of CH4 emission to occur (Swanson et al 2014)
The effects of feeding distillerrsquos grains on CH4 production have been variable Distillerrsquos
grains contain greater concentrations of fat and fiber The fat found in these by-products may
reduce or eliminate protozoa as well as methanogenic bacteria in the rumen helping to mitigate
CH4 emissions by altering the hydrogen sink through bio-hydrogenation via propionate
production (Masseacute et al 2014) Fiber however is concentrated nearly 3-fold during ethanol
production and possesses greater methanogenic potential than that of starch (Behlke et al 2008)
The microbes in the rumen are responsible for the enzymatic activity and consequential
nutrient breakdown and the production of VFA and CH4 When cattle consume diets high in
starch the amylolytic organisms are likely to become more prevalent (Hobson and Stewart
2012) whereas diets containing greater amounts of DDGS may cause a rise in CP and thereby
increase the activity of trypsin (Gao et al 2015)
127 P
age1
27
Corn distillerrsquos grains commonly are mixed with cattle rations in ranges from 10 to 50
(DM basis) depending on the goal of supplementation With this in mind developing feeding
strategies is important to determine the optimum corn processing method and DDGS inclusion
rates to obtain the greatest benefit for the ruminal environment and subsequent nutrient
breakdown Due to the greater concentrations of starch found in the diets containing 65 corn
and 20 DDGS we hypothesized that ruminal pH would be lower in the steers fed the 20
DDGS diets We also hypothesized that the CH4 emission would decrease as more reducing
equivalent would be shifted toward propionate production while acetate production decreased In
terms of rumen enzyme activity we hypothesized that ruminal digestive enzymes would change
with diet because of changes in substrate available for fermentation Therefore the objective of
this study was to determine the influence of the degree of dry-rolled corn processing and dried
distillerrsquos grains with solubles (DDGS) inclusion rate on ruminal pH NH3 and volatile fatty acid
(VFA) concentration total in vitro gas and CH4 production and enzyme activity in cattle fed
high-concentrate diets
53 Materials and Methods
531 Animals Experimental Design and Dietary Treatments
All animal care handling and surgical procedures were approved by the North Dakota
State University Animal Care and Use Committee
Eight Holstein steers weighing 526 plusmn 36 kg were surgically fitted with a ruminal cannula
(Bar Diamond Inc Parma ID) and were used in a 4 times 4 Latin square design consisting of 4
periods with 4 dietary treatments Two animals were assigned to each treatment per period to
determine the impact of dry-rolled corn processing and DDGS inclusion rate on ruminal pH
128 P
age1
28
ammonia and VFA concentration gas production and enteric CH4 concentration and ruminal
digestive enzyme activity Steers were housed in individual tie stalls (10 times 22 m) in a
temperature controlled environment at the North Dakota State University Animal Nutrition and
Physiology Center Dietary treatments (Table 5-1) were offered to ensure ad libitum intake and
approximately 6 feed refusal daily
Table 5-1 Dietary composition and analyzed nutrient concentration of
diets (DM basis) Coarse-rolled corn Fine-rolled corn
Dietary component of DM
20
DDGS
40
DDGS
20
DDGS
40
DDGS
Coarse-rolled corn 650 450 - -
Fine-rolled corn - - 650 450
DDGSa 200 400 200 400
Grass-legume hay 50 50 50 50
Corn silage 50 50 50 50
Limestone 156 190 156 190
Urea 085 - 085 -
Salt 020 020 020 020
Vitamin premix 001 001 001 001
Trace mineral premix 005 005 005 005
Monensintylosin premix 003 003 003 003
Fine-ground corn 205 256 205 256
Chromium oxide 025 025 025 025
Feed Analysis
DM of as fed 822 829 824 836
OM of DM 949 937 951 938
CP of DM 163 179 159 174
aNDF of DM 271 302 245 305
ADF of DM 902 111 847 110
Ether extract of DM 445 492 377 486
Calcium of DM 079 093 076 100
Phosphorus of DM 041 054 041 053
Starch of DM 480 394 482 408
DIP of DMb 580 720 580 720 Calculated NRC 1996 aDried corn distillerrsquos grains with solubles (DDGS) bDegradable intake protein (DIP)
Treatments consisted of 1) 65 coarse-rolled corn (25 mm) and 20 DDGS and 2)
45 coarse-rolled corn and 40 DDGS 3) 65 fine-rolled corn (17 mm) and 20 DDGS and
129 P
age1
29
4) 45 fine-rolled corn and 40 DDGS Diets were formulated to meet or exceed requirements
for degradable intake protein (DIP) metabolizable protein (MP) vitamins and minerals (NRC
1996) Before the initiation of the experiment steers were adapted to high grain diets over a
period of 21 days A preliminary 7 days on the animalrsquos respective treatment preceded 7 days of
sample collection for each period This was then followed by a 3-day rest period where steers
were offered an intermediate diet to allow for adaptation to the next dietary treatment
532 Laboratory Analysis
Coarse- and fine-rolled corn samples were analyzed for particle size following the
procedure of ASAE (2003) using a sieve shaker (Tyler Ro-TapW S Tyler Mentor OH)
Thirteen sieves including a bottom pan were used The sieves ranged in size from 3360 to 53
μm Particle size was calculated using the equations of Baker and Herrman (2002) and the
geometric mean diameter was reported (Swanson et al 2014) Complete rations were mixed
prior to each period and stored in a cooler at 4deg C
Orts were collected at 0700 daily Each animalrsquos consumption was calculated and
animals were immediately offered fresh feed by 0800 Feed samples were collected immediately
following ration mixing and were composited over each collection period All samples were
stored at -20˚C until analyses
Feed samples were dried for 48 hrs at 60˚C in a forced air Grieve SB-350 oven (The
Grieve Corporation Round Lake IL USA) and ground to pass a 2-mm screen using a Wiley
mill (Model 3 Arthur H Thomas Philadelphia PA USA) Feed samples were analyzed for
DM and ash (Procedure numbers 93401 200111 and 94205 respectively AOAC 1990) CP
(Kjeldahl method) as well as aNDF and ADF (Goering and Van Soest 1970) Starch was
130 P
age1
30
analyzed using the methods of Herrera-Saldana and Huber (1989) on a microplate
spectrophotometer (Synergy H1 Microplate reader BioTek Instruments Winooski VT USA)
533 Ruminal pH Determination
Ruminal pH was determined using a wireless pH sensor (Kahne Ltd Auckland NZ)
with measurements taken every 5 min from d 3 to 5 of the collection period Sensors were
calibrated with 70 and 40 pH solutions before each period and were manually inserted into the
rumen and placed in the liquid phase of the ventral sac
534 NH3 and VFA Analysis
Approximately 200 mL of ruminal fluid was collected into Whirl-pak bags (Nasco Fort
Atkinson WI and Modesto CA USA 532-mL) from d 3 to 5 in a manner that allowed a sample
to be collected every other hr in a 24-hr cycle Samples were taken at 0200 0800 1400 and
2000 hr on d 3 0400 1000 1600 and 2200 hr on d 4 and 0600 1200 1800 and 0000 hr
on d 5 and stored frozen (minus20degC) until the end of the collection period at which point they were
thawed equally composited and centrifuged at 2000 times g for 20 min The liquid portion was
filtered through a 045-microm filter and the supernatant separated and analyzed for NH3 (Broderick
and Kang 1980) Ruminal VFA concentrations were determined by GLC (Hewlett Packard
5890A Series II GC Wilmington DE) and separated on a capillary column (Nukol Supelco
Bellefonte PA) using 2-ethyl butyric acid as the internal standard (Goetsch and Gaylean 1983)
535 Gas Production Rate
Gas production was measured on d 1 and d 7 of each collection period with 2 replicates
per animal and therefore 8 replicates per treatment Dietary samples were dried for 48 hr at
60˚C in a forced air Grieve SB-350 oven (The Grieve Corporation Round Lake IL) and ground
to pass a 2-mm screen using a Wiley mill (Model 3 Arthur H Thomas Philadelphia PA) The
131 P
age1
31
in vitro procedure consisted of adding 0375 g of the treatment diet to a fermentation vessel (Gas
Pressure Monitor Ankom Technology Corp Macedon NY) along with 2125 mL of a
McDougallrsquos buffer (McDougall 1948) and ruminal fluid in a 41 ratio McDougallrsquos buffer was
prepared by 0700 the morning of each analysis with the collection of ruminal fluid immediately
following Each module was purged with CO2 sealed and then placed in an oscillating water
bath at 39degC for 24 h with the oscillation set at 125 rpm A wireless gas pressure monitoring
system was used to measure the changes in pressure inside the flask relative to atmospheric
pressure as a consequence of the gas produced during fermentation Data obtained from this
system were converted from pressure to volume using the formula reported by Loacutepez et al
(2007)
To measure the concentration of CH4 in the headspace of the Ankom flask 15 mL of gas
was collected at 24 hr of incubation from the septa port using a gas tight syringe and analyzed
using subsequent gas chromatograph (GC) (Model No 8610C SRI Instruments Torrance CA
90502 Borhan et al 2012)
536 Ruminal α-Amylase Trypsin Activity and Maltase Activity
Ruminal fluid (100 microL) was added to a 09 NaCl solution (700 microL) Activity of α-
amylase was determined using the procedure of Wallenfels et al (1978) utilizing a kit from Teco
Diagnostics (Anahein CA) Trypsin activity was assayed using the methods described by Geiger
and Fritz (1986 Swanson et al 2008) Maltase activity was determined using the methods
described by Bauer (1996) with a modification of the Turner and Moran (1982) technique
Analyses were adapted for use on a microplate spectrophotometer (SpectraMax 340 Molecular
Devices) One unit (U) of enzyme activity equals 1 micromole product produced per min Enzyme
activity data are expressed as α-amylase UL ruminal fluid α-amylase ULkg starch intake α-
132 P
age1
32
amylasekg starch disappearance trypsin UL ruminal fluid trypsin ULkg CP intake trypsin
ULkg CP disappearance and maltase UL ruminal fluid
537 Calculations and Statistical Analysis
Data were analyzed as a 2 times 2 factorial using the Mixed procedure of SAS (SAS Inst
Inc Cary NC) The model included the effects of animal period degree of dry-roll processing
(coarse vs fine) DDGS inclusion rate (20 vs 40 DDGS) and the interaction between degree of
dry-roll processing times DDGS inclusion rate Ruminal pH and the concentration of VFA over time
were measured using the Mixed procedure of SAS with the model including animal period corn
DDGS hr corn times DDGS corn times hr and DDGS times hr
Individual measurements of gas production were calculated using a nonlinear model in
SAS and the equation gas=A(1-exp(-(b(time-c)+d(sqrt(time)-sqrt(c))))) where A is equal to
the asymptotic gas volume formation (mL) b is equal to the fractional rate (hr-1) c is the lag time
before measurable gas production (hr) and d is a constant (hr-12 France et al 2005)
Degradation rate at 1 12 and 24 hr were calculated using the predicted components of the gas
production model Gas production model components and degradation rates were analyzed using
repeated measures (run d 1 and d 7) in the MIXED procedure of SAS with the effects of animal
period degree of dry-roll processing (coarse vs fine) DDGS inclusion rate (20 vs 40 DDGS)
degree of dry-roll processing times DDGS inclusion rate run degree of dry-roll corn processing times
run DDGS inclusion rate times run and degree of dry-roll processing times DDGS inclusion rate times run
Appropriate (minimize information criterion) covariance structures were utilized (Wang and
Goonewarden 2004) There were no interactions between run and dietary treatments so only
main effect means of degree dry-roll processing and DDGS inclusion rate are presented
Statistical significance was declared at P le 005
133 P
age1
33
54 Results
Feed intake was not influenced by corn particle size or DDGS inclusion rate (124 plusmn 140
kg DM) No differences were observed in ruminal pH between treatments (P gt 005) however
the amount of time the rumen spent below pH 55 tended (P = 007) to be longer in cattle fed
diets supplemented with 40 DDGS (Figure 5-1)
Figure 5-1 Data are represented as ruminal pH over a 24-hr period Effects of dry-rolled corn
processing method (P = 085) dried distillerrsquos grains with solubles (DDGS) inclusion level (P =
012) Dry-rolled corn processing methodDDGS inclusion level (P = 072) and hr of the day (P
lt 0001) The number of hr below a pH reading of 55 tended to be greater (P = 007) in cattle
consuming 40 vs 20 DDGS
Ruminal NH3 concentration was greater (P = 002) in diets containing 20 DDGS
(Table 5-2)
500
520
540
560
580
600
620
640
660
680
00
00
01
00
02
00
03
00
04
00
05
00
06
00
07
00
08
00
09
00
10
00
11
00
12
00
13
00
14
00
15
00
16
00
17
00
18
00
19
00
20
00
21
00
22
00
23
00
pH
Fine-Rolled Corn 20 DDGS
Coarse-Rolled Corn 20 DDGS
Fine-Rolled Corn 40 DDGS
Coarse-Rolled Corn 40 DDGS
Time of Feeding
134
Pag
e13
4
Table 5-2 Ruminal pH and VFA profiles of steers fed coarse- vs fine-rolled corn with 20 vs 40 dried
distillerrsquos grains with solubles (DDGS)
Coarse-rolled
corn
Fine-rolled corn P-Values
20
DDGS
40
DDGS
20
DDGS
40
DDGS SEMa Corn DDGS
Corn
times
DDGS
Hr
Ruminal pH 596 568 588 570 0134 085 012 072 lt0001
Minimum 531 504 522 510 0197 094 032 068 -
Maximum 669 677 704 678 0214 044 069 049 -
Time lt 55 hd 302 111 466 582 2125 040 007 014 -
Ruminal NH3 mM 133 104 134 98 1331 087 002 080 lt0001
Total VFA mM 184 183 197 198 97 014 099 091 lt0001
VFA mol100 mol
Acetic 331 341 320 327 144 041 056 092 018
Propionic 220 247 252 222 219 087 096 020 lt0001
Isobutyric 279 277 248 258 0159 012 082 073 lt0001
Butyric 174 153 196 214 168 002 093 024 045
Isovaleric 165 147 119 109 207 006 050 084 lt0001
Valeric 824 851 883 102 0642 010 023 042 005
AcetatePropionate 165 152 139 170 34 084 066 028 0001 Data are presented as least square means per treatment plusmn SEM n = 8
134
135 P
age1
35
The concentration of butyric acid was greater (P = 002) in cattle consuming fine-rolled
corn while isovaleric acid tended (P = 006) to be greater in cattle consuming coarse-rolled corn
The in vitro gas production measurements showed no significant differences between
treatments (Table 5-3)
Steers fed diets containing 20 DDGS had greater (P lt 0001) ruminal α-amylase
activity (UL ruminal fluid ULkg starch disappearance) while steers consuming rations with
40 DDGS had greater (P = 001) trypsin activity (ULkg CP disappearance Table 5-4)
Trypsin activity was also shown to have an interaction between degree of corn processing
times DDGS when calculated as ULkg CP disappearance (P = 002) The diet composed of coarse-
rolled corn with 40 DDGS had the lowest (P = 0004) maltase activity (UL of ruminal fluid)
55 Discussion
A previous study by Gonzalez et al (2012) found that increased distribution of feeding
throughout the day can moderate ruminal pH by decreasing the amount of acid production per
unit of time and increasing the salvation rate and frequency Despite being offered feed for ad
libitum intake it is interesting to note the pH was the highest at 0800 each day These results are
likely due to the addition of salivary buffers such as bicarbonate and phosphate ions as the
animal awoke and the rumen prepared for the ingestion of fresh feed (Erdman 1988)
It is also interesting to note that diets high in starch are more likely to cause a lower
ruminal pH Despite the lack of starch found in distillerrsquos grains cattle consuming 40 DDGS
tended to have a ruminal pH lower than 55 for a longer period of time than those consuming
20 DDGS While this may seem surprising it has also been shown that decreasing the particle
size of corn grain decreases ruminal pH (Krause and Combs 2003) The decrease in
136
Pag
e13
6
Table 5-3 Gas production and in vitro methane concentration of steers fed coarse- vs fine-rolled corn with
20 vs 40 dried distillerrsquos grains with solubles (DDGS)
Coarse-rolled corn Fine-rolled corn P - Values
20
DDGS
40
DDGS
20
DDGS
40
DDGS SEM Corn DDGS
Corn
times
DDGS
A mL 187 161 163 171 267 079 076 053
b hr-1 0147 0110 0112 0084 00203 015 012 083
c hr 0202 0036 0128 -0011 01070 058 017 090
d hr-12 163 161 214 162 0545 064 062 065
Ruminal degradation rate (hr-1) at
1 hr 0263 0213 0263 0293 00964 058 089 059
12 hr 0185 0157 0174 0177 00411 090 074 068
24 hr 0176 0150 0164 0164 00365 098 070 070
Methane of gas 108 121 115 126 126 068 044 094 Data are presented as least square means per treatment plusmn SEM n = 4 per treatment A = asymptote b =
fractional rate (hr-1) c = lag time (hr) d = rate constant (hr-12) gas=A(1-exp(-(b(time-c)+d(sqrt(time)-
sqrt(c)))))
136
Pag
e13
7
Table 5-4 Ruminal enzyme activity of steers fed coarse- vs fine-rolled corn with 20 vs 40 dried distillerrsquos grains
with solubles (DDGS)
Coarse-Rolled Fine-Rolled P-Values
20
DDGS
40
DDGS
20
DDGS
40
DDGS SEM
Corn DDGS Corn
times
DDGS
Hr
α-Amylase
UL Ruminal fluid 1491 1297 1500 1097 1048 013 lt0001 011 002
ULkg Starch intake 264 267 254 228 229 007 041 028 004
ULkg Starch
disappearance 8610 6244 8850 5533 6414
058 lt0001 027 005
Trypsin
UL Ruminal fluid 2359 2185 2156 2394 1927 098 081 013 035
ULkg CP intake 1214 1020 1102 1111 1155 088 020 015 052
ULkg CP disappearance 3055a 3083a 2597a 3623b 2758 084 001 002 046
Maltase
UL Ruminal fluid 323a 276b 300ab 324a 191 030 033 0004 0003 Data are presented as least square means per treatment plusmn SEM n = 8
137
138 P
age1
38
ruminal pH with increasing DDGS inclusion also could be related the pH of DDGS as research
has suggested that the low pH of DDGS can directly decrease ruminal pH (Felix et al 2012)
The greater ruminal NH3 concentration in diets containing 20 DDGS was somewhat
unexpected as research has shown that reduced CP typically results in reduced ruminal ammonia
concentration (Frank et al 2002 Todd et al 2006) However diets containing 20 DDGS also
included urea to meet the DIP requirement (NRC 1996) Consequently the increase in NH3 may
have been the result of the urea being rapidly hydrolyzed to ammonia by bacterial urease (Habib
et al 2009)
In regards to the VFA concentration studies conducted by Secrist et al (1995) and
Plascenia et al (2009) reported that the concentration of butyrate was higher in cattle consuming
coarse-rolled corn Therefore initially we would have expected propionate to be higher in diets
containing fine-rolled corn This increase is generally associated with an increase in butyrate
While only the concentration of butyrate was shown to increase in the current study this may
indicate the rate of fermentation of soluble fiber in the DDGS is more rapid than first
hypothesized
No differences were seen in the overall in vitro gas production measurements and the
lack of response of CH4 concentration in the headspace of the in vitro flasks to dietary treatment
is similar to the results observed for the ruminal acetatepropionate ratios Acetate production vs
propionate production has been shown to be associated with increased CH4 concentration (Moss
et al 2000 and Whitelaw et al 1984) As no changes to the acetatepropionate ratio were found
in the current study it was not surprising that CH4 concentrations did not differ between steers
from the different dietary treatments
139 P
age1
39
The degree of dry-rolled processing in this study generally did not influence ruminal pH
and in vitro gas or CH4 production potentially because of adequate buffering occurring in both of
the diets Perhaps if a larger difference in rolled-corn particle size or DDGS inclusion rate was
used in our study differences in ruminal fermentation parameters and in vitro gas production
would be more prevalent
The greater ruminal α-amylase activity (UL ruminal fluid ULkg starch disappearance)
found in diets containing 20 DDGS was likely because of the greater amount of corn (and thus
starch) in the 20 DDGS diets with the ratio being 6520 cornDDGS while diets containing
40 DDGS had 4540 cornDDGS These results indicate that the greater levels of starch
found within the grain stimulated the ruminal microbes to increase α-amylase production for
starch breakdown
The increased trypsin activity (ULkg CP disappearance) in steers consuming rations
with 40 DDGS is likely due to the increased true protein concentrations found in the DDGS
which would require more trypsin for protein breakdown The increased level of CP found
within diets containing 40 DDGS in addition to the increased exposure of the fine-rolled corn
grain was likely the cause of the greater production of microbial trypsin (ULkg CP
disappearance)
Diets high in starch require the ruminal microbes to hydrolyze starch into maltose and
glucose (Coleman 1969) Due to the starch being removed during the processing of DDGS and
the lower inclusion rate of the coarse-rolled-corn (Secrist et al 1995) it is not surprising that
maltase (UL of ruminal fluid) in treatments containing coarse-rolled corn with 40 DDGS is
lowest
140 P
age1
40
56 Conclusion
In conclusion it seems that the ratio of corn grain to level of DDGS in a cattle ration has
a greater impact on in vitro gas production than the corn processing method It may be that
differences in available dietary starch were not significant enough to cause a change in the
amount of gas produced and despite a rise in ruminal butyrate acetate and propionate were not
affected which may have reduced the likelihood of hydrogen capture and subsequent CH4
mitigation The increased concentrations of starch in diets containing 20 DDGS along with the
higher CP levels in DDGS resulted in tendencies for increased α-amylase and trypsin activity
respectively suggesting that the ruminal microbes are adapting to changes in substrate Overall
using fine- vs coarse-rolled corn and 20 vs 40 inclusion rate of distillerrsquos grains did not result
in any large differences in the ruminal environment
57 Literature Cited
AOAC 1990 Official Methods of Analysis 15th Ed ed Arlington VA
ASAE 2003 Method of determining and expressing fineness of feed materials by sieving
ASAE Standard ASAE S3192
Baker S and T Herrman 2002 Evaluating particle size MF-2051 Feed Manufacturing Dept
Grain Sci Ind Kansas State Univ Manhattan
Bauer M L 1996 Nutritional regulation of small intestinal glucose absorption in ruminants
PhD dissertation University of Kentucky Lexington
Behlke E J TG Sanderson T J Klopfenstein and J L Miner 2008 Ruminal methane
production following the replacement of dietary corn with dried distillerrsquos grains
Nebraska Beef Rep 50
141 P
age1
41
Borhan M S S Rahman and H K Ahn 2012 Dry anaerobic digestion of fresh feedyard
manure a case study in a laboratory setting Int J Emerg Sci 2509-525
Broderick G A and J H Kang 1980 Automated simultaneous determination of ammonia and
total amino acids in ruminal fluid and in vitro media J Dairy Sci 6364-75
Coleman G S 1969 The metabolism of starch maltose glucose and some other sugars by the
rumen ciliate Entodinium caudatum J Gen Microbiol 87303-332
Dicostanzo A and C L Wright 2012 Feeding ethanol coproducts to beef cattle In Liu K S
Rosentrater K A editors Distillers grains Production properties and utilization CRC
Press Boca Raton FL 237-264
Erdman R A 1988 Dietary buffering requirements of the lactating dairy cow A review J
Dairy Sci 713246ndash3266
Felix T L T A Murphy and S C Loerch 2012 Effects of dietary inclusion and NaOH
treatment of dried distillerrsquos grains with solubles on ruminal metabolism of feedlot cattle
J Anim Sci 90 4951-4961
France J S Lopez E Kebread A Bannink M S Dhanoa and J Dijkstra 2005 A general
compartmental model for interpreting gas production profiles Anim Feed Sci Technol
123-124
Frank B M Persson and G Gustafsson 2002 Feeding dairy cows for decreased ammonia
emission Livestock Prod Sci 76171ndash179
Galyean M L 1996 Protein levels in beef cattle finishing diets Industry application university
research and systems results J Anim Sci 742860-2870
Galyean M L D G Wagner and F N Owens 1979 Corn particle size and site and extent of
digestion by steers J Anim Sci 49204-210
142 P
age1
42
Gao W A Chen B Zhang P Kong C Liu and J Zhao 2015 Rumen degradability and post-
ruminal digestion of dry matter nitrogen and amino acids of three protein supplements
Asian-Australas J Anim Sci 28485-493
Geiger R and H Fritz 1986 Trypsin In Bergmeyer H editor Methods of Enzymatic
Analysis New York Elsevier 119-128
Goering H K and P J Van Soest 1970 Forage analyses Agriculture Handbook 379 Agric
Res Serv US Dept of Agriculture
Gonzalez L A X Manteca S Calsamiglia K S Schwartzkopf-Genswein and A Ferret
2012 Ruminal acidosis in feedlot cattle Interplay between feed ingredients rumen
function and feeding behavior (a review) Anim Feed Sci Technol 17266-79
Goetsch A L and M L Gaylean 1983 Influence of feeding frequency on passage of fluid
particulate markers in steers fed a concentrate diet Can J Anim Sci 63727-730
Habib M A M S Hossain and A K F H Bhuiyan 2009 Impact of urea-based diets on
production of Red Chittagong cattle Bangladesh Veterinarian 2674-79
Herrera-Saldana R and J T Huber 1989 Influence of varying protein and starch
degradabilities on performance of lactating cows J Dairy Sci 721477-1483
Hobson P N and C S Stewart 2012 The rumen microbial ecosystem Springer Science and
Business Media
Jacob M E Z D Paddock D G Renter K F Lechtenberg and T G Nagaraja 2010
Inclusion of Dried or Wet Distillersrsquo Grains at Different Levels in Diets of Feedlot Cattle
Affects Fecal Shedding of Escherichia coli O157H7 Appl Environ Microbiol 767238-
7242
143 P
age1
43
Klopfenstein T J G E Erickson and V R Bremer 2008 Board-invited review Use of
distillers by-products in the beef cattle feeding industry J Anim Sci 861223-1231
Krause K M and D K Combs 2003 Effects of forage particle size forage source and grain
fermentability on performance and ruminal pH in midlactation cows J Dairy Sci
861382-1397
Lana R P J B Russell and M E Van Amburgh 1998 The role of pH in regulating ruminal
methane and ammonia production J Anim Sci 762190-2196
Leupp J L G P Lardy K K Karges M L Gibson and J S Caton 2009 Effects of
increasing level of corn distillers dried grains with solubles on intake digestion and
ruminal fermentation in steers fed seventy percent concentrate diets J Anim Sci
872906-2912
Loe E R M L Bauer and G P Lardy 2006 Grain source and processing in diets containing
varying concentrations of wet corn gluten feed for finishing cattle J Anim Sci 84986-
996
Loacutepez S M S Dhano J Dijkstra A Bannink E Kebreab and J France 2007 Some
methodological and analytical considerations regarding application of the gas production
technique Anim Feed Sci Technol 135139-156
Masseacute D I G Jarret C Benchaar and N M Cata Saady 2014 Effect of corn Dried Distiller
Grains with Solubles (DDGS) in dairy cow diets on manure bioenergy production
potential Animal 482-92
Moss A R J P Jouanyb and J Newboldc 2000 Methane production by ruminants its
contribution to global warming Ann Zootech 49231-253
144 P
age1
44
National Research Council 1996 Nutrient Requirements of Beef Cattle 7th Ed National
Academy Press Washington DC
Plascencia A V M Gonzaacutelez-Vizcarra M A Lόpez-Soto D May L C Pujol G F Ruiz
and S H Vega 2009 Influence of cracked coarse ground or fine ground corn on
digestion dry matter intake and milk yield in Holstein cows J Appl Anim Res 35149-
154
Russell J B 1998 The importance of pH in the regulation of ruminal acetate to propionate ratio
and methane production in vitro J Dairy Sci 813222-3230
Secrist D S W J Hill F N Owens and S D Welty 1995 Effects of corn particle size on
feedlot steer performance and carcass characteristics Anim Sci Res Rep 99-104
(httpwwwansiokstateeduresearch researchreport)
Swanson K C N Kelly H Salim Y J Wang S Holligan M Z Fan and B W McBride
2008 Pancreatic mass cellularity and α-amylase and trypsin activity in feedlot steers fed
diets differing in crude protein concentration J Anim Sci 86909-915
Swanson K C A Islas Z E Carlson R S Goulart T C Gilbery and M L Bauer 2014
Influence of dry-rolled corn processing and increasing dried corn distillerrsquos grains plus
solubles inclusion for finishing cattle on growth performance and feeding behavior J
Anim Sci 922531-2357
Todd R W N A Cole and N R Clark 2006 Reducing Crude Protein in beef cattle diets
reduces ammonia emissions from artificial feedyard surfaces J Environ Qual 35404-
411
145 P
age1
45
Turner R J and A Moran 1982 Heterogeneity of sodium-dependent D-glucose transport sites
along the proximal tubule Evidence from vesicle studies Am J Physiol 242F406-
F414
Wallenfels K P Fold H Niermann H Bender and D Linder 1978 The enzymatic synthesis
by transglycosylation of a homologous series of glycosidically substituted malto-
oligosaccharides and their use as amylase substrates Carbohydrate Research 61359-68
Wang Z and L A Goonewardene 2004 The use of MIXED models in the analysis of animal
experiments with repeated measures data Can J Anim Sci 841-11
Whitelaw F G M J Eadie L A Bruce and W J Shand 1984 Methane formation in
faunated and ciliate-free cattle and its relationship with rumen volatile fatty acid
proportions Brit J Nut 52261-275
Zhang X H Zhang Z Wang X Zhang H Zou C Tan and Q Peng 2015 Effects of dietary
carbohydrate composition on rumen fermentation characteristics and microbial
population in vitro Italian J Anim Sci 143366
146 P
age1
46
CHAPTER 6 IMPACT OF GRAIN SOURCE AND DRIED DISTILLERS GRAIN WITH
SOLUBLES WITH LOW OR MODERATE OIL CONCENTRATIONS ON RUMINAL
PH AMMONIA AND VOLATILE FATTY ACID CONCENTRATION IN VITRO
METHANE AND CARON DIOXIDE CONCENTRATION AND ENZYME ACTIVITY
61 Abstract
This study was conducted to examine the effect of grain source (rolled-corn vs rolled-
barley) and dried distillerrsquos grains with solubles (DDGS) oil concentration (low = 45 vs
moderate = 79) on ruminal pH ammonia (NH3) and volatile fatty acid (VFA) concentrations
in vitro enteric methane (CH4) and carbon dioxide (CO2) production and digestive enzyme
activity Eight ruminally cannulated Holstein steers (715 plusmn 614 kg) were randomly assigned to
four dietary treatments in a 2 times 2 factorial arrangement consisting of 1) rolled-corn and low-oil
DDGS 2) rolled-corn and moderate-oil DDGS 3) rolled-barley and low-oil DDGS and 4)
rolled-barley and moderate-oil DDGS Diets were formulated to meet NRC recommendations
and were offered for ad libitum intake The experiment was designed as a 4 times 4 Latin square with
24-d periods allowing for 7 d of diet adaptation 7 d of sample collection and a 10-d transition
period in which all steers were offered an intermediate ration Feed intake was greater (P = 001)
in steers consuming low-oil DDGS diets No differences were noted for rumen NH3 or total VFA
concentration There was a trend (P = 005) for isovaleric acid to be greater in diets containing
moderate-oil DDGS while valeric acid was greater (P = 003) in rolled-barley rations The lag
time in gas production was greater (P = 003) in corn-based rations while diets containing barley
had a faster (P = 003) degradation rate Total CH4 and CO2 concentration showed no difference
between treatments Grain times DDGS interactions (P lt 003) were observed when evaluating α-
147 P
age1
47
amylase (UL ruminal fluid and Ukg starch intake) with steers consuming rolled-barley and
moderate-oil DDGS diets having the lowest activity Steers provided rolled-corn diets had the
greatest (P = 001) α-amylase activity (Ukg starch disappearance) Grain times DDGS interactions
(P lt 003) were observed when evaluating trypsin as steers consuming rolled-corn diets and low-
oil DDGS had the greatest enzyme activity (UL ruminal fluid Ukg CP intake Ukg CP
disappearance) Maltase activity (UL ruminal fluid) was greater (P = 001) in steers provided
rolled-corn rations Steers consuming diets with low-oil DDGS also exhibited greater (P lt 0001)
maltase activity Despite variation in rumen enzyme activity ruminal pH was not influenced by
dietary treatment These results indicate that feeding different grain sources (corn or barley) or
DDGS with differing oil concentration (moderate or low) were not detrimental to the ruminal
microbes or environment
62 Introduction
Corn and barley are commonly used in cattle rations throughout North America This is
largely due to the grain accessibility and the need to provide sufficient amounts of dietary energy
for effective growth and development Due to the high starch concentration and thus dietary NE
found in corn it is one of the most prevalent choices Although barley has been shown to contain
5 to 10 percent less energy than corn (Milner et al 1995) it also is a common feed source
because its starch is more available for rapid ruminal digestion This rapid digestion has been
shown to result in a greater production of VFA within the ruminal fluid (Aschenbach et al
2011) which can lead to acidotic conditions and consequently reduced rumen function of
amylolytic bacteria and protozoa impeding the breakdown of starch (Stone et al 2004) Despite
148 P
age1
48
this issue barley is known to contain greater concentrations of protein and a more balanced
supply of amino acids allowing for the possibility of reduced supplementation (Salo et al 2016)
Distillerrsquos grains are also typically incorporated into rations to reduce feed costs while
maintaining an energy value similar to or greater than grain (Klopfenstein et al 2008
Dicostanzo 2012) In recent years ethanol plants have begun extracting greater levels of oil to
be used in biodiesel production and providing additional commodities for a value-added market
(Saunders et al 2009 Bremer et al 2014)
Different grain sources and changes in distillerrsquos by-products have the potential to impact
cattle production in both negative and positive ways through altered nutrient composition
thereby affecting the rumen environment including impacting the microbial and enzymatic action
on feed (Hobson and Stewart 2012) Therefore the objective of this study was to determine the
impact of corn- vs barley-based grains in combination with low- vs moderate-oil concentration
distillerrsquos grain on ruminal pH ammonia (NH3) and volatile fatty acid (VFA) concentration in
vitro gas production and enteric methane (CH4) and carbon dioxide (CO2) concentration and
ruminal digestive enzyme activity
63 Materials and Methods
631 Animals Experimental Design and Dietary Treatments
All animal care handling and surgical procedures were approved by the North Dakota
State University Animal Care and Use Committee
Eight Holstein steers weighing 715 plusmn 614 kg were surgically fitted with a ruminal
cannula (Bar Diamond Inc Parma ID) randomly assigned to four dietary treatments in a 2 times 2
factorial arrangement Two animals were assigned to each treatment per period to determine the
149 P
age1
49
impact of grain source (rolled-corn vs rolled-barley) and dried distillerrsquos grains with solubles
(DDGS) oil concentration (low = 45 vs moderate = 79) on ruminal pH ammonia (NH3) and
volatile fatty acid (VFA) concentration in vitro enteric methane (CH4) and carbon dioxide (CO2)
concentration and digestive enzyme activity Steers were housed in individual tie stalls (10 times
22 m) in a temperature-controlled environment Dietary treatments (Tables 6-1 and 6-2) were
offered to ensure ad libitum intake and approximately 6 feed refusal daily
Dietary treatments consisted of 1) rolled-corn and low-oil DDGS 2) rolled-corn and
moderate-oil DDGS 3) rolled-barley and low-oil DDGS and 4) rolled-barley and moderate-oil
DDGS Diets were formulated to meet or exceed requirements for degradable intake protein MP
vitamins and minerals (NRC 1996) Corn silage was used as the source of forage and was
included in the diet at 20 on a DM basis Before the initiation of the experiment steers were
adapted to high grain diets over 21 days Each treatment period consisted of 24 days allowing for
7 d of diet adaptation 7 d of sample collection and a 10-d rest period in which all steers were
offered an intermediate dietary transition before being provided the next dietary treatment
632 Laboratory Analysis
Dietary treatments were prepared weekly and stored at 4˚C Samples were collected
immediately following ration mixing and preserved at -20˚C until analyses Orts were collected
at 0700 daily Each animalrsquos consumption was calculated and animals were offered fresh feed
by 0800
150 P
age1
50
Table 6-1 Dietary composition and analyzed nutrient concentration of diets (DM basis)
Rolled-Corn Rolled-Barley
Dietary Component of DM Low-Oil
DDGS Moderate-
Oil DDGS
Low-Oil
DDGS Moderate-
Oil DDGS
Rolled Corn 50 50 - -
Barley - - 50 50
Low-Oil DDGS 25 25 Moderate-Oil DDGS 25 25
Corn Silage 20 20 20 20
Limestone 2 2 2 2
Urea 015 015 - -
Salt 005 005 005 005
Vitamin Premixb 001 001 001 001
Mineral Premixc 005 005 005 005
Monensind 002 002 002 002
Tylosine 001 001 001 001
Fine-ground corn 246 246 261 261
Chromium oxide 025 025 025 025
Feed Analysis
DM of as fed 891 972 890 970
OM of DM 831 903 825 900
CP of DM 137 140 148 148
aNDF of DM 298 318 326 347
ADF of DM 119 125 133 141
Ether Extract of DM 349 418 240 311
Calcium of DM 109 116 115 107
Phosphorus of DM 046 046 050 048
Starch of DM 436 421 371 375 aCalculated NRC 1996 bContained 48510 kIUkg vitamin A and 46305 kIUkg vitamin D cContained 362 Ca 256 Cu16 Zn 65 Fe 40 Mn 1050 mgkg I and 250 mgkg
Co dContained 1764 g monensinkg premix eContained 882 g tylosinkg premix
151 P
age1
51
After each trial period feed samples were dried for 48 hrs at 60˚C in a forced air Grieve
SB-350 oven (The Grieve Corporation Round Lake IL USA) and ground to pass a 2-mm
screen using a Wiley mill (Model 3 Arthur H Thomas Philadelphia PA USA) Feed samples
were analyzed for DM and ash (Procedure numbers 93401 200111 and 94205 respectively
AOAC 1990) CP (Kjeldahl method) and aNDF and ADF (Goering and Van Soest 1970) Starch
was analyzed using the methods of Herrera-Saldana and Huber (1989) using a microplate
spectrophotometer (Synergy H1 Microplate reader BioTek Instruments Winooski VT USA)
633 Ruminal pH NH3 and VFA Analysis
Approximately 200 mL of ruminal fluid was collected into whirl-pak bags (Nasco 532-
mL) from d 3 to 5 in a manner that allowed a sample to be collected every other hr in a 24-hr
cycle Samples were taken at 0200 0800 1400 and 2000 hr on d 3 0400 1000 1600 and
2200 hr on d 4 and 0600 1200 1800 and 0000 hr on d 5 During collections ruminal pH was
immediately measured using an IQ Scientific pH meter (Hach Company Loveland CO USA)
before being allowed to cool Once pH was recorded samples were stored frozen (minus20deg C) until
the end of the collection period at which point they were thawed equally composited and
centrifuged at 2000 times g for 20 min The liquid portion was filtered through a 045-microm filter and
Table 6-2 Analyzed Nutrient Concentration of DDGS (DM basis)
Item
Low-Oil
DDGS
Moderate-
Oil DDGS
DM of as fed 872 905
OM of DM 803 851
CP of DM 316 326
aNDF of DM 348 461
ADF of DM 109 142
Ether Extract of DM 45 79
Calcium of DM 004 004
Phosphorus of DM 104 093
Starch of DM 887 357
152 P
age1
52
the supernatant separated and analyzed for NH3 (Broderick and Kang 1980) Ruminal VFA
concentrations were determined by GLC (Hewlett Packard 5890A Series II GC Wilmington
DE USA) and separated on a capillary column (Nukol Supelco Bellefonte PA USA) using 2-
ethyl butyric acid as the internal standard (Goetsch and Gaylean 1983)
634 Gas Production Rate
Gas production was measured on d 1 and d 7 of each collection period with 2 replicates
per animal and therefore 8 replicates per treatment The in vitro procedure consisted of adding
0375 g of the treatment diet to an Ankom fermentation vessel (Gas Pressure Monitor Ankom
Technology Corp Macedon NY USA) along with 2125 mL of a McDougallrsquos buffer
(McDougall 1948) and ruminal fluid solution in a 41 ratio McDougallrsquos buffer was prepared by
0700 the morning of each analysis with the collection of ruminal fluid immediately following
Each module was purged with CO2 sealed with the Ankom pressure monitor cap (Ankom
Technology Corp) and then placed in an oscillating water bath (Northwest Scientific
Incorporated) at 39degC for 24 h with the oscillation set at 125 rpm A wireless gas pressure
monitoring system was used to measure the changes in pressure inside the flask relative to
atmospheric pressure as a consequence of the gas produced during fermentation Data were
transferred via an Ankom wireless system to a computer equipped with software that allows the
data to be stored in a spreadsheet Data obtained from this system were converted from pressure
units to volume units (mL) using the formula reported by Loacutepez et al (2007)
To measure the concentration of methane produced in the headspace of the Ankom flask
15 mL of gas was collected from the septa port using a gas tight syringe and tested using
subsequent gas chromatograph (GC) analysis (Model No 8610C SRI Instruments Torrance
CA USA 90502 Borhan et al 2012)
153 P
age1
53
635 Rumen α-Amylase Trypsin Activity and Maltase Activity
Ruminal fluid (100 microL) was added to a 09 NaCl solution (700 microL) and homogenized
using a Vortex Genie 2 mixer from Sigma-Aldrich (St Louis MO USA) Activity of α-amylase
was determined using the procedure of Wallenfels et al (1978) utilizing a kit from Teco
Diagnostics (Anahein CA USA) Trypsin activity was assayed using the methods described by
Geiger and Fritz (1986) Maltase activity was determined using the methods described by Bauer
(1996) with a modification of the Turner and Moran (1982) technique Analyses were adapted
for use on a microplate spectrophotometer (SpectraMax 340 Molecular Devices) One unit (U)
of enzyme activity equals 1 micromole product produced per min Enzyme activity data are
expressed as α-amylase UL ruminal fluid α-amylase Ukg starch intake α-amylase Ukg starch
disappearance trypsin UL ruminal fluid trypsin Ukg crude protein intake trypsin Ukg crude
protein disappearance and maltase UL ruminal fluid
636 Calculations and Statistical Analysis
Data were analyzed as a 2 times 2 factorial using the Mixed procedure of SAS (SAS Inst
Inc Cary NC) The model included the effects of animal period grain source (rolled-corn vs
rolled-barley) and dried distillerrsquos grains with solubles (DDGS) oil concentration (low vs
moderate) and the interaction between Grain times Oil Ruminal pH and the concentration of VFA
over time were measured using the Mixed procedure of SAS with the model including animal
period Grain Oil Hr Grain times Oil Grain times Hr and Oil times Hr
Individual measurements of gas production were calculated using a nonlinear model in
SAS and the equation gas=A(1-exp(-(b(time-c)+d(sqrt(time)-sqrt(c))))) where A is equal to
the asymptotic gas formation (mL gas) b is equal to the fractional rate (hr-1) c is the lag time
before measurable gas production (hr) and d is a rate constant (hr-12 France et al 2005)
154 P
age1
54
Degradation rate at 1 12 and 24 hr were calculated using the predicted components of the gas
production model Gas production data were analyzed using repeated measures (run d 1 and d 7)
in the MIXED procedure of SAS with the effects of animal period grain source (rolled-corn vs
rolled-barley) and dried distillerrsquos grains with solubles (DDGS) oil concentration (low vs
moderate) Graintimes Oil run Grain times run Oil times run and Grain times Oil times run Appropriate
(minimize information criterion) covariance structures were utilized (Wang and Goonewarden
2004) There were no interactions between run and dietary treatments so only main effect
means of Grain and Oil are presented Statistical significance was declared at P le 005
64 Results
Feed intake was greater (P = 001) in steers consuming low-oil DDGS The concentration
of ruminal NH3 in the current trial was not different between treatments despite the use of barley
vs corn (Table 6-3)
Total VFA concentration also showed no difference (P gt 005) however a trend (P =
005) was observed with isovaleric acid concentration to be higher in diets with moderate-oil
DDGS while valeric acid concentration was lower (P = 003) in diets containing rolled-corn
155
Pag
e15
5
Table 6-3 Ruminal NH3 and VFA profiles of steers consuming corn- vs barley-based diets with variable distillerrsquos oil concentration
Rolled-Corn Rolled-Barley P - Values
Low-Oil
DDGS Moderate-
Oil DDGS
Low-Oil
DDGS Moderate-Oil
DDGS SEM Grain Oil Grain
times Oil Hr
Feed Intake kgd 217 212 219 215 084 019 001 073 -
Ruminal ammonia mM 138 111 109 104 148 026 033 033 lt0001
Total VFA mM 197 193 184 186 92 030 091 072 lt0001
VFA mol100 mol
Acetic 311 330 332 306 174 092 083 021 068
Proprionic 228 237 234 235 160 089 075 080 lt0001
Isobutyric 371 370 386 370 0211 073 071 074 lt0001
Butyric 220 193 186 199 189 046 072 030 035
Isovaleric 112 123 958 115 0728 012 005 057 lt0001
Valeric 921 797 114 108 1057 003 039 076 001
AcetatePropionate 149 148 155 140 0147 095 060 063 lt0001 Data are presented as least square means per treatment plusmn SEM n = 8
155
156 P
age1
56
The lag time in gas production was longer (P = 003) in corn vs barley-based rations The
rate of ruminal degradation was greater (P = 003) for barley at 1 hr and tended to be greater at
12 hr (P = 006) and 24 hr (P = 007) No differences (P gt 005) in CH4 and CO2 concentration
were observed among the dietary treatments (Table 6-4)
Ruminal α-amylase activity (UL ruminal fluid Ukg starch intake P = 002) was greater
in steers consuming low-oil DDGS while an interaction (P = 003) between grain source and
DDGS oil concentration for ruminal α-amylase activity (UL ruminal fluid Ukg starch intake P
= 002) was observed as barley diets with moderate oil DDGS had the lowest activity Activity of
α-amylase (Ukg starch disappearance) was greater (P = 001) in corn-based rations Steers fed
the diet containing corn with low-oil DDGS had the greatest (interaction P le 003) trypsin
activity (Ukg CP intake and Ukg CP disappearance) while steers fed corn-based diets (P =
001) and low-oil DDGS (P lt 001) had greater maltase activity (UL ruminal fluid Table 6-5)
Ruminal pH was not influenced (P = 013) by dietary treatment but was shown to change
depending on the hr of the day (P lt 0001 Figure 6-1) with time points near 0700 being the
highest
65 Discussion
Ruminal ammonia concentrations are impacted by the amount and degradability of the
crude protein in the diet along with the rate of fermentation (Oh et al 2008) The concentration
of ruminal ammonia however was not influenced by the dietary treatments in the current trial
This is likely formulated to contain similar levels of CP and because grain type and DDGS oil
concentration did not greatly affected protein metabolism in the rumen
157
Pag
e15
7
Table 6-4 Gas production and in vitro CH4 and CO2concentration of steers consuming corn- vs barley-based diets with
variable distillerrsquos oil concentration
Rolled-Corn Rolled-Barley P - Values
Low-Oil
DDGS
Moderate-Oil
DDGS
Low-Oil
DDGS
Moderate-Oil
DDGS SEM Grain Oil
Grain
times
Oil
A mL 188 116 191 121 524 087 017 097
b hr-1 0153 0126 0100 0095 00282 013 056 067
c hr 0148 0144 0057 0027 00484 003 072 078
D hr-12 0482 0456 0407 0297 01374 039 061 075
Ruminal degradation rate (hr-1) at
1 hr 0128 0110 0227 0198 04253 003 057 089
12 hr 0108 0100 0174 0147 00304 006 056 076
24 hr 0105 0098 0168 0142 00293 007 056 074
Methane of gas 222 248 244 233 158 080 061 022
CO2 of gas 594 558 571 545 216 041 017 084
CH4CO2 0385 0462 0443 0440 00333 057 025 022 Data are presented as least square means per treatment plusmn SEM n = 4 per treatment A = asymptote b = fractional rate (hr-1) c = lag time (hr) d
= rate constant (hr-12) gas=A(1-exp(-(b(time-c)+d(sqrt(time)-sqrt(c)))))
157
158
Pag
e15
8
Table 6-5 Rumen enzyme activity of steers consuming corn- vs barley-based diets with variable distillerrsquos oil
concentration
Rolled-Corn Rolled-Barley
Low-Oil
DDGS
Moderate-
Oil DDGS
Low-Oil
DDGS
Moderate-
Oil DDGS SEM Grain Oil
Grain times
Oil
Feed Intake kgd 217 212 219 215 084 019 001 073
Amylase
UL Ruminal fluid 132a 131a 144a 106b 135 045 002 003
ULkg Starch Intake 982ab 102ab 116a 860b 1216 094 008 002
ULkg Starch
Disappearance 9969 10030 9094 7258 7671 001 020 017
Trypsin
UL Ruminal fluid 275a 218b 207b 211b 144 0002 002 001
ULkg CP Intake 875a 705b 633b 644b 522 lt0001 005 003
ULkg CP
Disappearance 6106a 4565b 4835b 4541b 3992 001 0001 002
Maltase
UL Ruminal fluid 334 258 280 222 280 0009 lt0001 056 Data are presented as least square means per treatment plusmn SEM n = 8
158
159 P
age1
59
Figure 6-1 Data are represented as ruminal pH over a 24-hr period Effects of Grain (P = 013)
Oil (P = 024) Grain times Oil (P = 024) and Hr of the day (P lt 0001)
After testing the effect of moderate vs high fat diets Chan et al (1997) found an increase
in the level of butyric acid in the ruminal fluid from cattle fed the high fat rations while acetate
and propionate were unaffected The levels of acetate and propionate were also not influenced in
the current study However despite the varying levels of DDGS oil no effects on butyric acid
were seen Although the total VFA concentration along with acetate butyrate and propionate
showed no differences between dietary treatments there was an impact on isovaleric acid and
valeric acid with isovaleric acid tending to be greater in moderate-oil DDGS rations while valeric
acid was greater in barley-based rations These results are surprising as valeric acid is increased
during the microbial deamination and decarboxylation of valine leucine and isoleucine (Raun
1961) and these amino acids are generally found to be higher in corn The lower concentrations
550
600
650
0200 0400 0600 0800 1000 1200 1400 1600 1800 2000 2200 2400
pH
Time of Feeding
Rolled-Corn Low Oil DDGS
Rolled-Corn Moderate Oil DDGS
Rolled-Barley Low Oil DDGS
Rolled-Barley Moderate Oil DDGS
160 P
age1
60
of valeric acid found in the rumen fluid of the steers consuming rolled-corn are similar to results
seen in a study conducted by Payne and Morris (1970) When examining the effect of adding
urea to high grain rations they found the proportion of n-valeric acid to be lower in the ruminal
fluid from steers provided the supplement In order to provide a sufficient level of protein
rolled-corn diets in the current study were also supplemented with urea However no overall
effects were seen on ruminal NH3 concentration
It has been shown that rolled corn is not digested as extensively in the rumen as rolled
barley (Galloway et al 1993 Yang et al 1997) This may indicate why the gas production lag
time was greater in corn-based rations while the rumen degradation rates were lower The
increased lag time until gas production may also have been greater in corn-based rations related
to previous rankings based on lower enzymatic and in situ starch and dry matter degradation
rates compared to barley (Herrera-Saldana et al 1990)
Many studies have indicated that providing cattle with rations composed of high grain
rather than forage will result in reduced methane concentration In fact when evaluating variable
grain sources previous research has estimated CH4 losses of cattle consuming corn-based rations
to be around 35 of GE intake (Houghton et al 1996) while for cattle consuming barley-based
diets it is predicted to result in a loss of 65 to 12 of GE (Johnson et al 2000) Other studies
have found reductions in methane when cattle are provided diets with increasing levels of fat
(Gerber et al 2013 Huumlnerberg et al 2013 Masseacute et al 2014) Typically these results will
occur due to the inhibited growth of the rumen protozoa and reduction of methanogens
(Beauchemin and McGinn 2004 Knapp et al 2014) However no differences were found in the
total in vitro gas production of CH4 and CO2 concentration in the current study This may
indicate that the rations provided were not different enough to cause a variation in methane
161 P
age1
61
production Overall the finding that the acetatepropionate ratio was unaffected by treatment is
consistent with the lack of an effect in methane concentration as the acetate propionate ratio is
often the greatest indicator of methane production (Russell 1998)
An interaction for lowered ruminal α-amylase activity (UL ruminal fluid Ukg starch
intake) was observed in barley diets containing moderate oil DDGS Reducing the fat
concentration in DDGS generally results in a change in the ruminal acetate-to-propionate ratios
This has been shown to favor amylolytic bacterial growth (DiCostanzo and Crawford 2013) As
no differences were seen in the acetate to propionate levels in the current trial however the
increased α-amylase may be due to the impact of higher DMI by steers fed the low-oil DDGS
diets Another possibility includes the fact that low-fat DDGS have been shown to enhance
ruminal microorganism growth and activity while higher-fat DDGS suppress it (DiCostanzo
2013) The ruminal degradation rate will also influence enzymatic activity as lower levels were
found in steers consuming corn in the current experiment indicating that the rumen bacteria were
producing more amylase in order to further break down the corn during its slower degradation
Steers fed the diet containing corn with low-oil DDGS had the greatest trypsin activity
(Ukg CP intake and Ukg CP disappearance) This may be due to the increased levels of fat in
moderate oil DDGS reducing the interaction of microorganisms with the dietary protein and
reducing its digestibility (Brooks et al 1954) and need for trypsin Another cause may be due to
the protein in barley undergoing faster ruminal degradability than the protein in corn which
therefore would require increased levels of trypsin to meet sufficient breakdown (Nikkhah
2012)
When starch is digested by α-amylase it is broken down into smaller polysaccharides and
disaccharides including maltose (Coleman 1969) This maltose then requires the action of
162 P
age1
62
maltase to continue nutrient breakdown The increased activity of α-amylase in the diets
containing corn would then require greater amounts of maltase
While the ruminal pH was not impacted by dietary treatment it is interesting to note that
the highest pH measurements occurred between 0600 and 0700 This may have been because of
increased salivation acting as a buffer Although the animals were provided feed for ad libitum
intake bunks were cleaned and rations replaced every morning during this time Also during this
time the animals were most active and consumed the greatest portion of feed Rumen pH then
began to drop as the day continued indicating that the rumen microbes were becoming more
active and feed was undergoing nutrient breakdown (Gonzalez et al 2012)
In conclusion reducing oil concentrations of DDGS may be beneficial in improving
rumen enzymatic function which could lead to improved digestion and nutrient utilization The
lack of change in ruminal pH NH3 total in vitro gas production and the concentrations of CH4
and CO2 indicate that feeding high-concentrate diets containing DDGS with differing oil
concentration in both corn- and barley-based diets indicates that there was no negative influence
on ruminal fermentation even though ruminal digestive enzymes seem to be moderated by both
grain source and DDGS oil concentration
66 Literature Cited
AOAC 1990 Official Methods of Analysis 15th Ed ed Arlington VA
Aschenbach J R G B Penner F Stumpff and G Gabel 2011 Ruminant Nutrition
Bauer M L 1996 Nutritional regulation of small intestinal glucose absorption in ruminants
PhD dissertation University of Kentucky Lexington
163 P
age1
63
Beauchemin K A and S M McGinn 2004 Methane emissions from feedlot cattle fed barley
or corn diets J Anim Sci 83 653-661
Bremer M L B L Nuttleman C J Bittner D B Burken G E Erickson J C MacDonald and
T J Klopfenstein 2014 Energy value of de-oiled modified distillers grains plus solubles
in beef feedlot diets J Anim Sci 92 (Suppl 2) 211 (Abstr)
Broderick G A and J H Kang 1980 Automated simultaneous determination of ammonia and
total amino acids in ruminal fluid and in vitro media J Dairy Sci 63 64-75
Brooks C C G B Garner C W Gehrke M E Muhrer and W H Pfander 1954 The Effect
of Added Fat on the Digestion of Cellulose and Protein by Ovine Rumen
Microorganisms1 J Anim Sci 13758-764
Chan S C J T Huber C B Theurer Z Wu K H Chen and J M Simas 1997 J Dairy Sci
80 152-159
Coleman G S 1969 The metabolism of starch maltose glucose and some other sugars by the
rumen ciliate Entodinium caudatum J Gen Microbiol 87 303-332
DiCostanzo A and G I Crawford 2013 Low fat distillers grains with solubles (LF-DDGS) in
feedlot finishing diets Ag Utilization Research Institution Saint Paul MN
Dicostanzo A and C L Wright 2012 Feeding ethanol coproducts to beef cattle In Liu K S
Rosentrater K A editors Distillers grains Production properties and utilization CRC
Press Boca Raton FL 237-264
France J S Lopez E Kebread A Bannink M S Dhanoa and J Dijkstra 2005 A general
compartmental model for interpreting gas production profiles Anim Feed Sci Technol 123-124
164 P
age1
64
Galloway D L A L Goetsch L A Jr Forster A C Brake and Z B Johnson 1993
Digestion feed intake and live weight gain by cattle consuming bermudagrass and
supplemented with different grains J Anim Sci 711288ndash1297
Geiger R and H Fritz Trypsin In Bergmeyer H editor 1986 Methods of Enzymatic
Analysis New York Elsevier 119-128
Gerber P J B Henderson and H P S Makkar 2013 Mitigation of greenhouse gas emission
in livestock production A review of technical options for non-CO2 emissions Food and
Agricultural Organization of the United Nations
Goering H K and P J Van Soest 1970 Forage analyses Agriculture Handbook 379 Agric
Res Serv US Dept of Agriculture
Gonzalez L A X Manteca S Calsamiglia K S Schwartzkopf-Genswein and A Ferret
2012 Ruminal acidosis in feedlot cattle Interplay between feed ingredients rumen
function and feeding behavior (a review) Anim Feed Sci Technol 172 66-79
Goetsch A L and M L Gaylean 1983 Influence of feeding frequency on passage of fluid
particulate markers in steers fed a concentrate diet Can J Anim Sci 63 727-730
Herrera-Saldana R and J T Huber 1989 Influence of varying protein and starch
degradabilities on performance of lactating cows J Dairy Sci 72 1477ndash1483
Herrera-Saldana R J T Huber and M H Poore 1990 Dry matter crude protein and starch
degradability of five cereal grains J Dairy Sci 732386ndash2393
Hobson P N and C S Stewart 2012 The rumen microbial ecosystem Springer Science and
Business Media
Houghton J T L G Meira Foilho B Lim K Tre primeanton I Mamaty Y Bonduki D J Griggs
and B A Callander 1996 Greenhouse Gas Inventory Reference Manual Revised 1996
165 P
age1
65
IPCC Guidelines for National Greenhouse Gas Inventories Vol 3 Agriculture
Intergovernmental Panel on Climate Change Geneva Switzerland
Huumlnerberg M S M McGinn K A Beauchemin E K Okine O M Harstad and T A
McAllister 2013 Effect of dried distillers grains plus solubles on enteric methane
emissions and nitrogen excretion from growing beef cattle J Anim Sci 91 2846-2857
Johnson D E K A Johnson G M Ward and M E Branine 2000 Ruminants and other
animals Chapter 8 Pages 112ndash133 in Atmospheric Methane Its Role in the Global
Environment M A K Khalil ed Springer-Verlag Berlin Heidelberg Germany
Klopfenstein T J G E Erickson and V R Bremer 2008 Board-invited review Use of
distillers by-products in the beef cattle feeding industry J Anim Sci 86 1223-1231
Knapp J R G L Laur P A Vadas W P Weiss and J M Tricarico 2014 Invited review
Enteric methane in dairy cattle production Quantifying the opportunities and impact of
reducing emissions J Dairy Sci 97 3231-3261
Lana R P J B Russell M E Van Amburgh 1998 The role of pH in regulating ruminal
methane and ammonia production J Anim Sci 76 2190-2196
Loacutepez S M S Dhano J Dijkstra A Bannink E Kebreab and J France 2007 Some
methodological and analytical considerations regarding application of the gas production
technique Anim Feed Sci Technol 135 139ndash156
Masseacute D I G Jarret C Benchaar and N M Cata Saady 2014 Effect of corn dried distiller
grains with solubles (DDGS) in dairy cow diets on manure bioenergy production
potential Animal 4 82-92
McDougall E I 1948 Studies on ruminant saliva I The composition and output of sheeps
saliva Biochem J 43 99-109
166 P
age1
66
Milner T J J G P Bowman and B F Sowell 1995 Effects of barley variety or corn on
feedlot performance and feeding behavior Proc West Sect Am Soc Anim Sci and
West Branch Can Soc Anim Sci 46 539-542
Nikkhah A 2012 Barley grain for ruminants a global treasure or tragedy J Anim Sci
Biotech 322
NRC 1996 Nutrient Requirements of Beef Cattle 7th Ed National Academy Press
Washington DC
Oh Y J Kim K Kim C Choi S Kang I Nam D Kim M Song C Kim and K Park 2008
Effects of level and degradability of dietary protein on ruminal fermentation and
concentrations of soluble non-ammonia nitrogen in ruminal and omasal digesta of
Hanwoo steers Asian-Aust J Anim Sci 21392-403
Payne E and J G Morris 1970 The effect of urea supplementation of high grain rations on the
metabolism of fatty acids in the rumen of sheep and cattle Proceedings of the Australian
Society of Animal Production 8 60
Raun N S 1961 Dietary factors affecting volatile fatty acid production in the rumen
Retrospective Theses and Dissertation Paper 1951
Russell J B 1998 The importance of pH in the regulation of ruminal acetate to propionate ratio
and methane production in vitro J Dairy Sci 81 3222-3230
Salo S M Urge and G Animut 2016 Effects of supplementation with different forms of
barley on feed intake digestibility live weight change and carcass characteristics of
Hararghe Highland sheep fed natural pasture J Food Process Technol 7 3
Saunders J A and K A Rosentrater 2009 Properties of solvent extracted low-oil corn
distillers dried grains with solubles Biomass and Bioenergy 33 1486ndash1490
167 P
age1
67
Stone W C 2004 Nutritional approaches to minimize subacute ruminal acidosis and laminitis
in dairy cattle J Dairy Sci 87 E12ndashE26
Turner R J and A Moran 1982 Heterogeneity of sodium-dependent D-glucose transport sites
along the proximal tubule Evidence from vesicle studies Am J Physiol 242 F406-
F414
Wallenfels K P Fold H Niermann H Bender and D Linder 1978 The enzymatic synthesis
by transglycosylation of a homologous series of glycosidically substituted malto-
oligosaccharides and their use as amylase substrates Carbohydrate Research 61 359ndash
68
Wang Z and L A Goonewardene 2004 The use of MIXED models in the analysis of animal
experiments with repeated measures data Can J Anim Sci 841-11
Yang W Z K A Beauchemin K M Koenig and L M Rode 1997 Comparison of hull-less
barley barley or corn for lactating cows Effects on extent of digestion and milk
production J Dairy Sci 802475-24
168 P
age1
68
CHAPTER 7 SUMMARY AND CONCLUSIONS
The enzymes found within the ruminant digestive system play an essential role in the
absorption of nutrients They also have an undeniable impact on the production of VFA and
ruminant produced greenhouse gases With the worldrsquos population growing as quickly as it is
the need to provide sufficient animal products and improve environmental sustainability will
continue to rise Therefore gaining a better understanding of how enzymatic activity is
influenced is crucial
The studies conducted and presented in this dissertation have allowed for the opportunity
to determine how stage of maturity and level of feed intake impacts the production of enzymes in
both the rumen and small intestine It has been shown that the level of enzymatic activity found
in the digestive system of the fetus is highly dependent on its maternal nutrient intake
Unfortunately undergoing periods of feed restriction is common for livestock throughout the
world and being able to determine ways of ensuring appropriate growth and development of the
fetus is essential
The addition of specific supplements to feed has the potential to impact enzymatic
activity In the Experiment 1 we investigated the influence of melatonin supplementation
While nutrient restriction decreased the pancreatic mass of the dam and fetus melatonin was
only able to rescue the maternal tissue Melatonin also increased the α-amylase activity (Ug
kUpancreas Ukg BW) in the dam after it had been reduced during feed restriction While these
results may seem positive both nutrient restriction and melatonin supplementation were found to
result in decreased maternal pancreatic insulin-positive tissue area (relative to section of tissue)
When comparing ewes to fetuses it was found that ewes had a greater percentage of medium
169 P
age1
69
insulin-containing cell clusters (2001 - 32000 microm2) while fetuses had more (P lt 0001)
pancreatic insulin-positive area (relative to section of tissue) and a greater percent of small large
and giant insulin-containing cell clusters While some benefits were seen with supplementation
the results were not enough to recommend melatonin to be used as a therapeutic agent capable of
mitigating reduced pancreatic function due to nutrient restriction
Experiment 2 investigated the impact of providing the essential amino acid arginine to
mature animals during different stages of estrus During this trial it was noted that nutrient
intake influenced body weight of the animal in addition to its pancreatic weight and enzymatic
function with overfed animals having higher enzyme activity The stage of estrus did not affect
pancreatic function The use of arginine did not influence pancreatic function which may indicate
that the dosage used was not sufficient More research on other doses is needed
The influence of maternal nutrition on fetal development has long been an area of
concern However it has been shown that the majority of fetal growth is occurring during the
final trimester of gestation Because of this the advantage of realimentation during the different
stages of pregnancy was examined in Experiment 3 in the hopes of allowing the fetuses to return
to levels matching their control counterparts The results also indicated a benefit in regards to
showing an increase in the protein content and α-amylase activity in the realimentated fetus
Trypsin however showed an opposite effect Regardless the idea of compensatory development
was indicated in this study and when implemented at the appropriate time may prove to provide
a rescue mechanism during times of reduced maternal feed intake
In addition to the level of feed intake the impact of the nutrients provided in the diet is
also important for the determination of enzymatic activity While the feeds offered may be of an
identical grain source such as corn and byproduct such as distillerrsquos grain the initial feed
170 P
age1
70
processing methods and level of DDGS inclusion are capable of altering the rumen environment
In Experiment 4 steers were fed either fine- or course-rolled corn in addition to 20 or 40
DDGS Steers fed diets containing 20 DDGS were found to have greater ruminal α-amylase
activity (UL ruminal fluid α-amylasekg starch disappearance) while those fed 40 DDGS had
greater trypsin activity (trypsinkg CP disappearance) The nutrient profile of the diet had no
impact on the level of gas produced or the concentration of methane While some changes were
observed in enzymatic activity the results indicate that degree of dry-roll processing and DDGS
inclusion level used in this experiment does not impact ruminal health and environmental
sustainability
Finally Experiment 5 examined the impact of providing different grain sources along
with DDGS of different oil concentrations Steers were fed either corn or barley-based rations
along with moderate or low-oil concentration DDGS During this trial it was shown that feeding
corn resulted in greater enzymatic activity when compared to barley and maintained a longer lag
time before producing gas in vitro It was also found that the ruminal degradation rate of barley
was greater than corn However despite the breakdown of these feeds at different rates no
changes in the overall gas production or concentration of methane and carbon dioxide were
observed
As variable results have been found during these studies there is no question that the
nutrition provided to the maternal animal plays a large impact on the development of the fetal
pancreas There is also no denying that nutrition in general will affect the enzymatic activities of
the ruminant digestive system Understand the greatest ways to utilize this knowledge and
improve animal performance and environmental sustainability is key Therefore further
171 P
age1
71
research is warranted and this will forever be an area to explore as the worldrsquos population
continues to increase


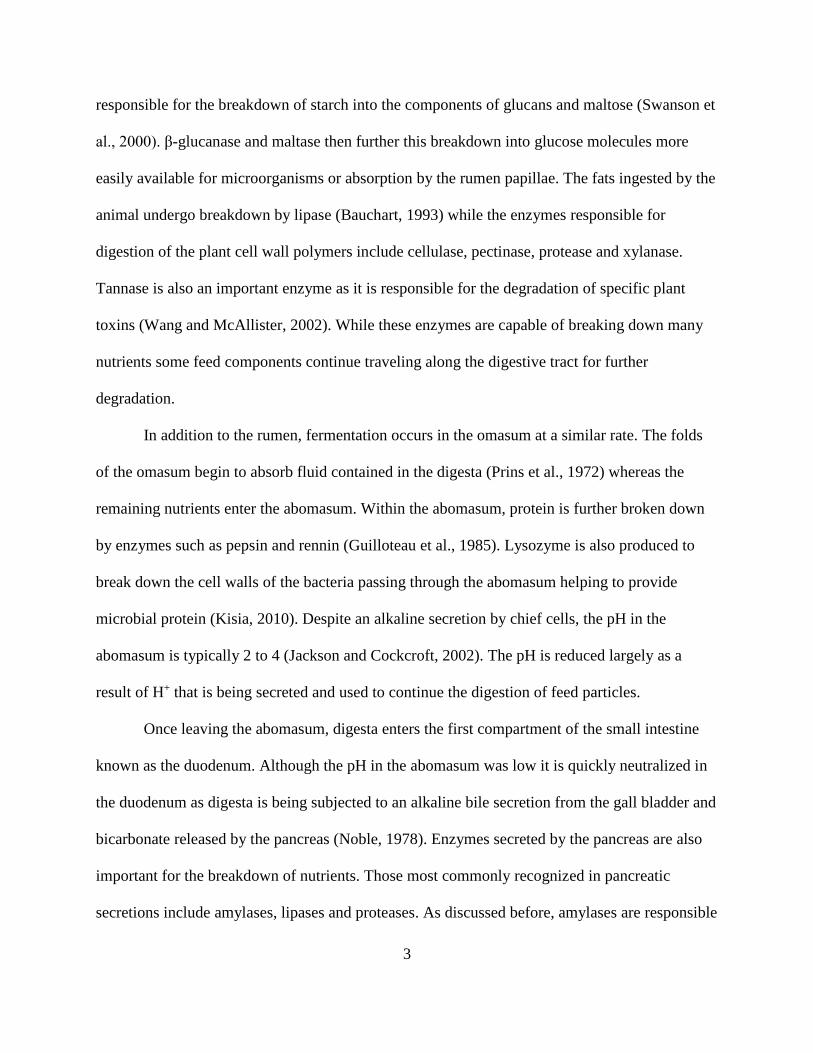

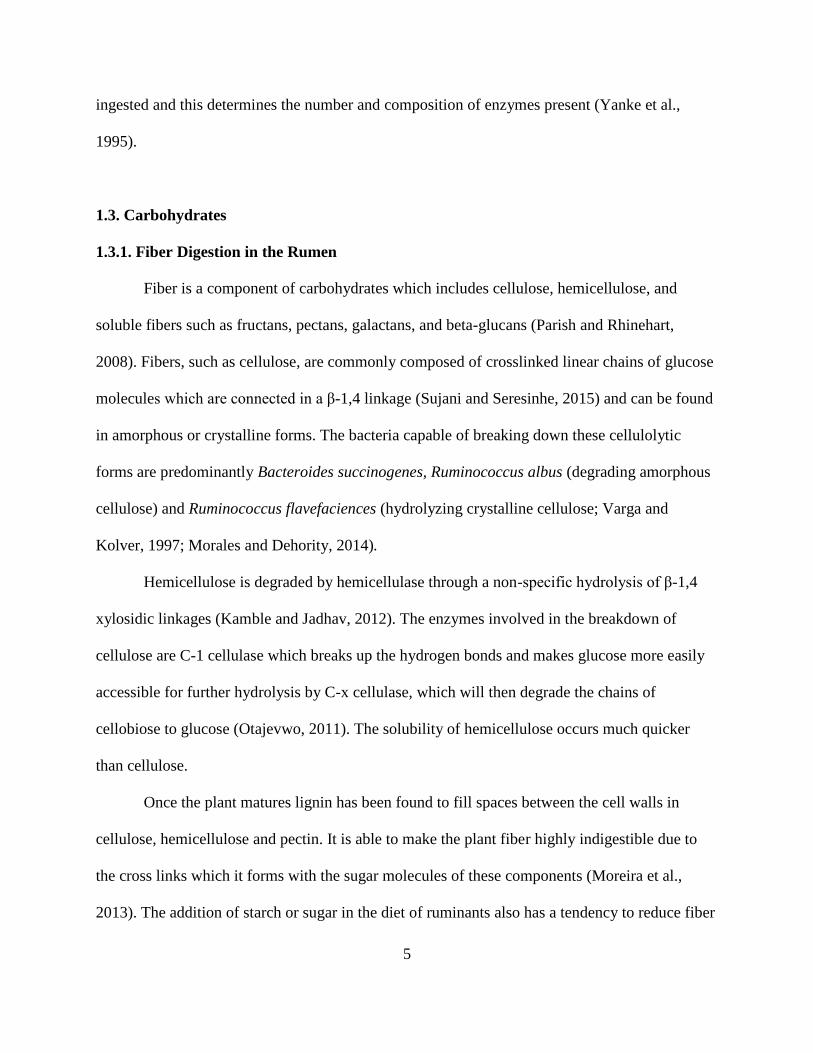


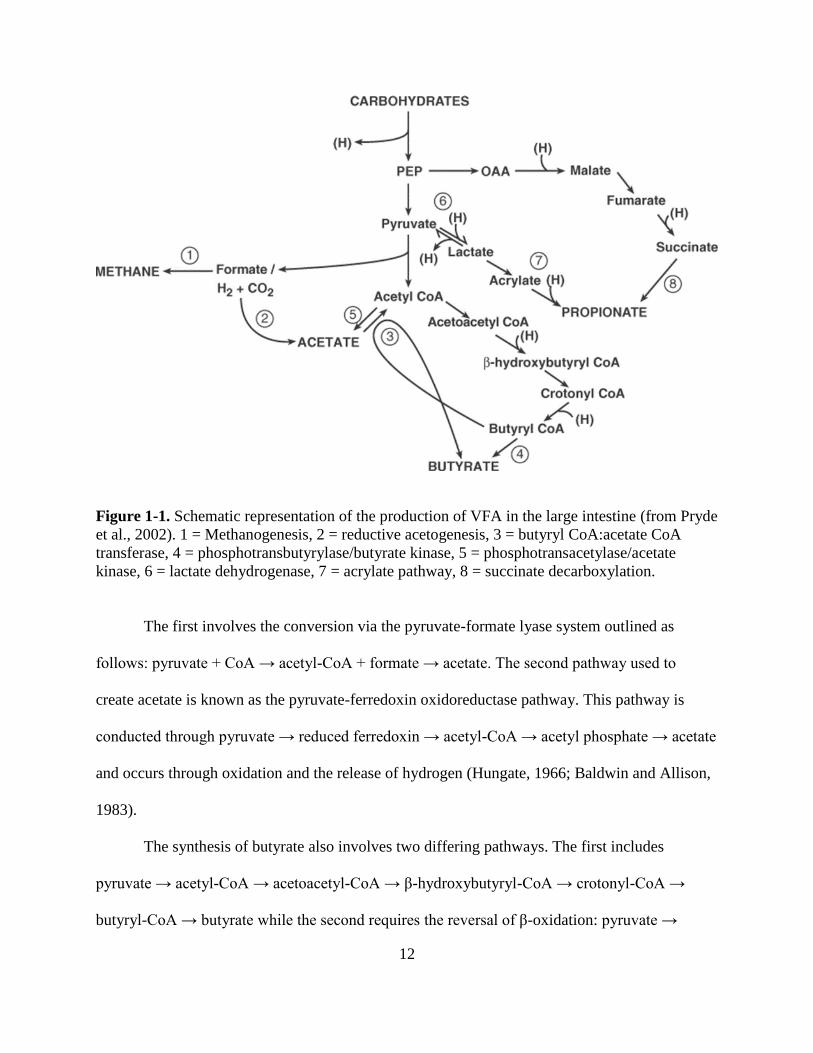


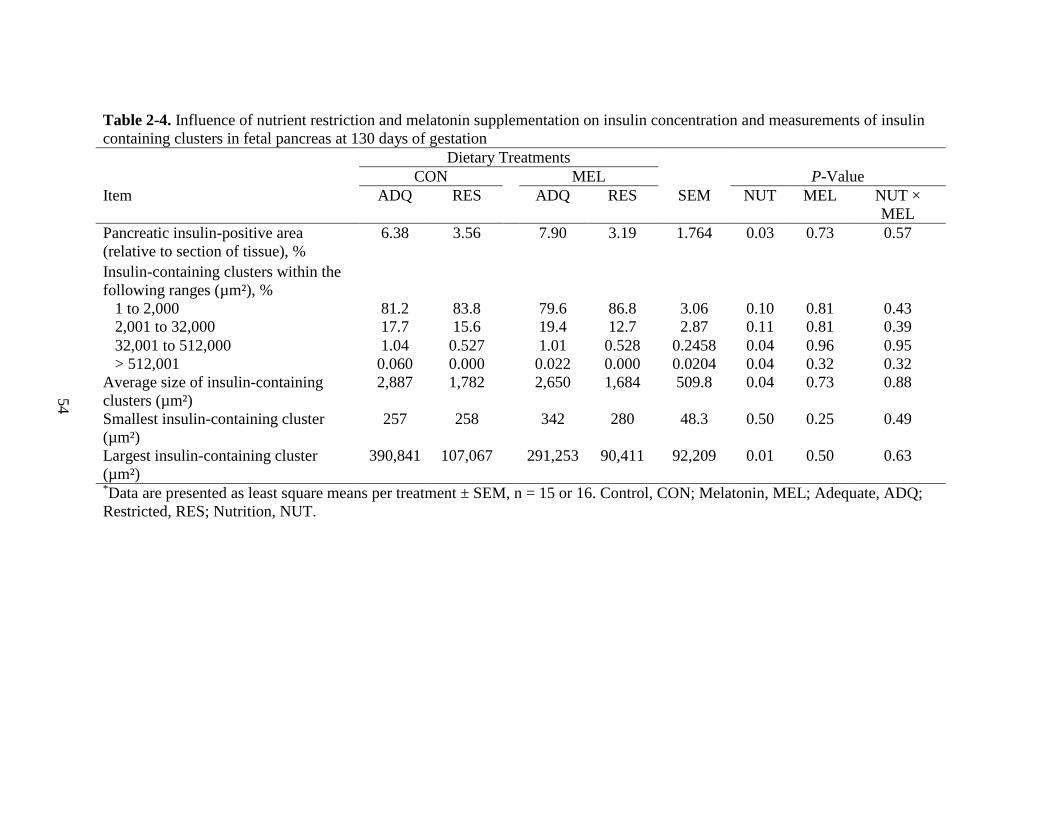
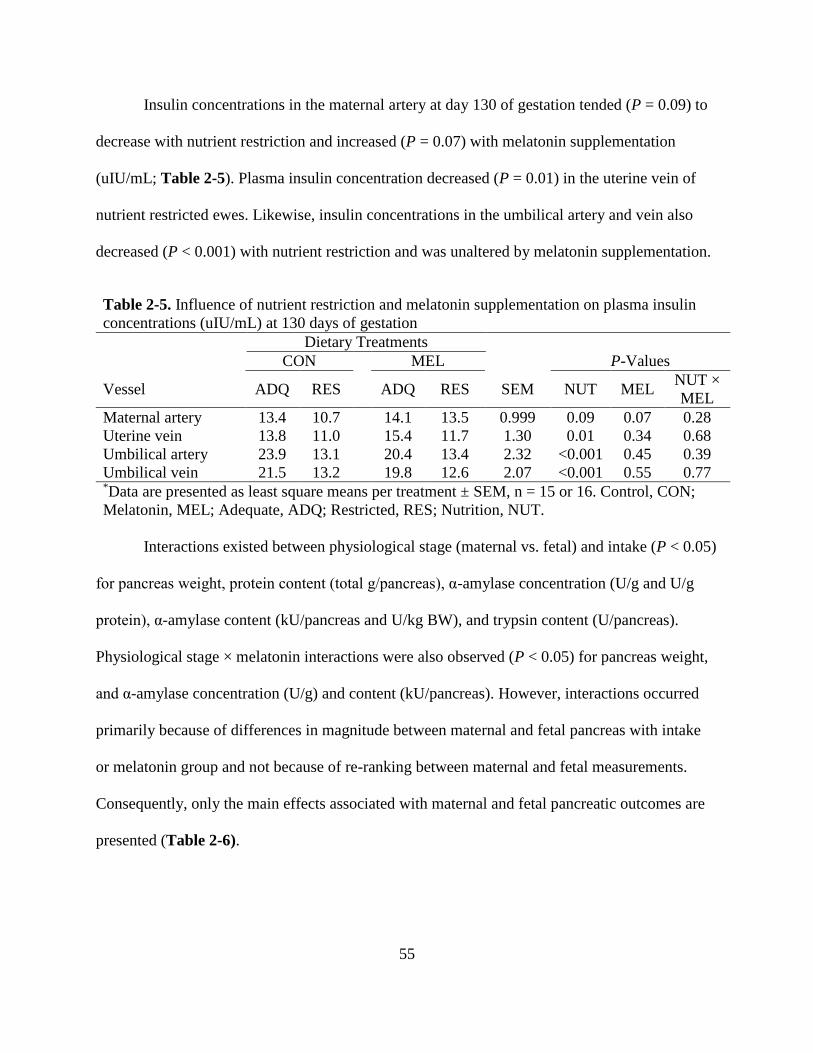

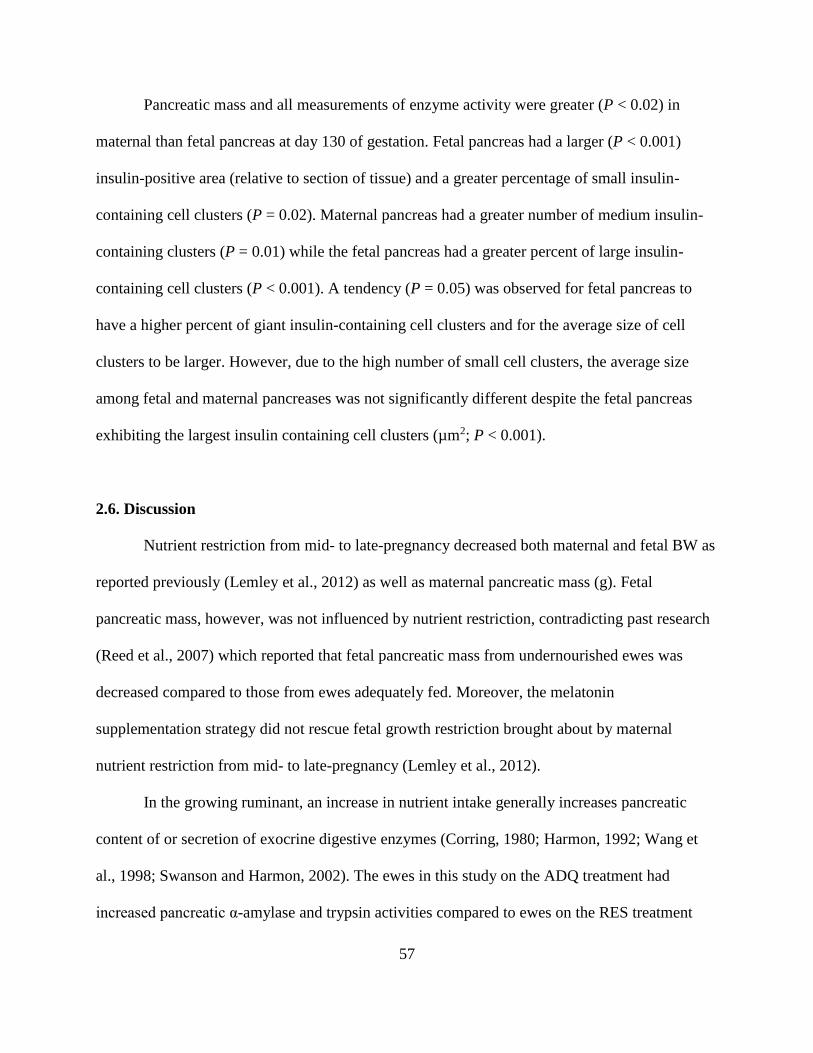
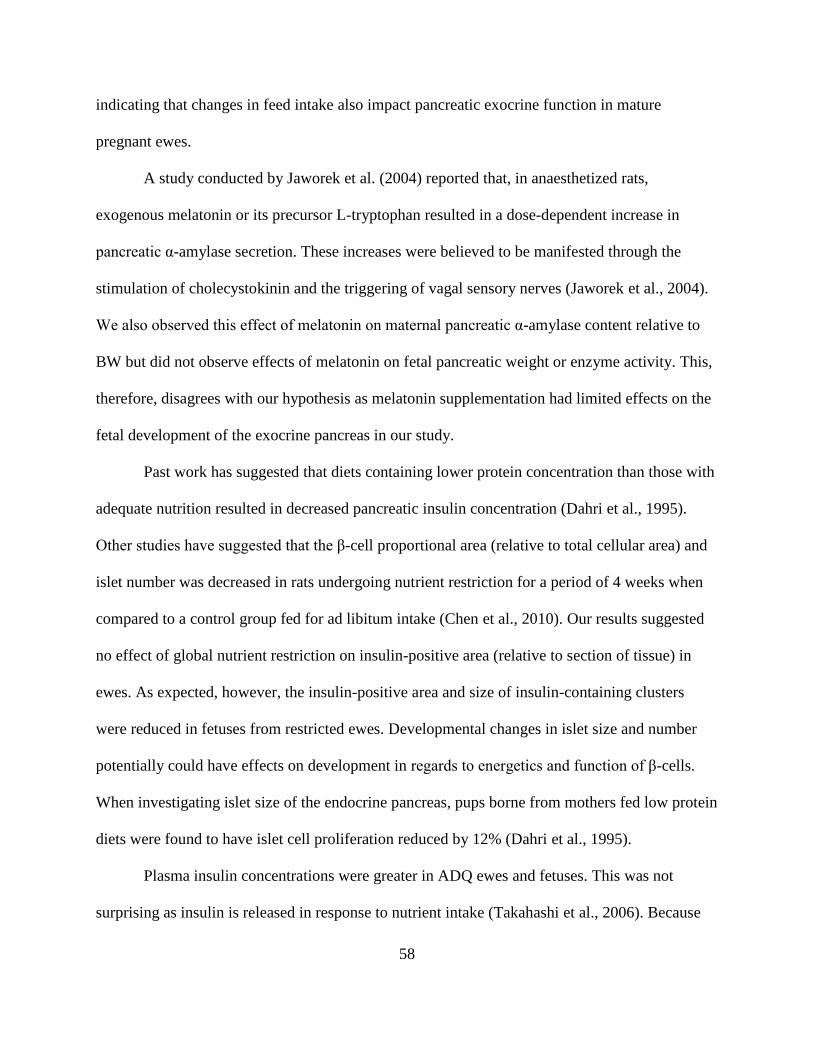

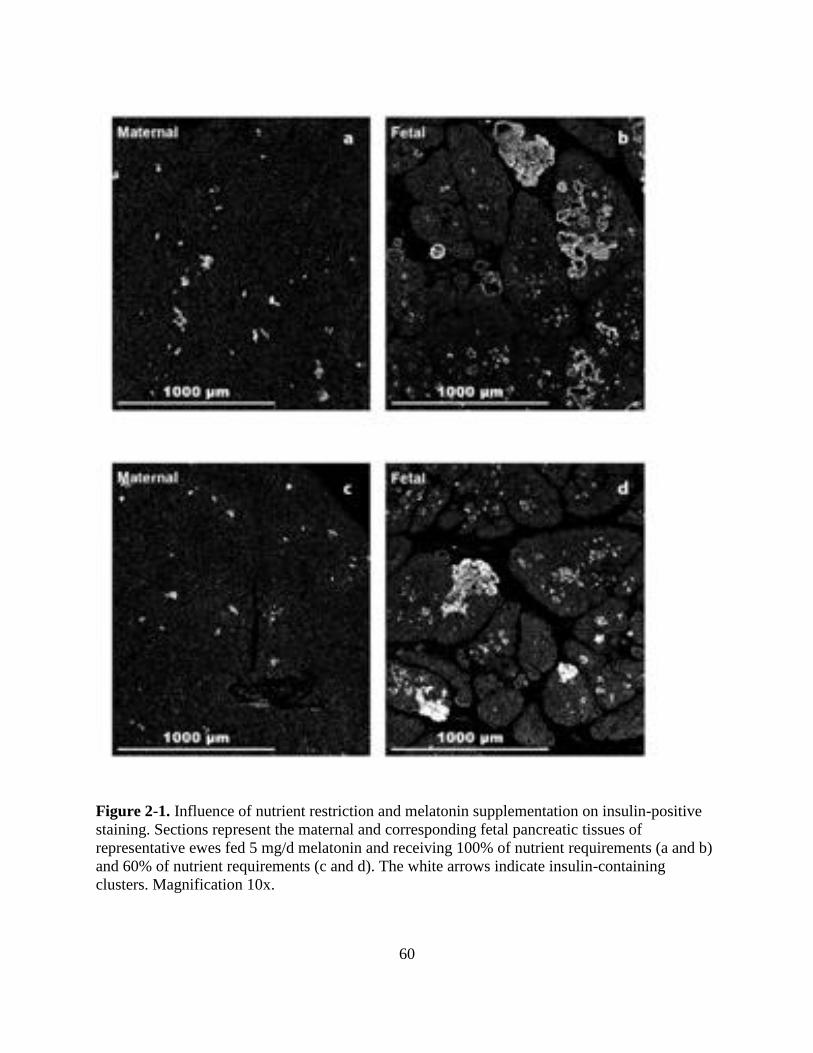


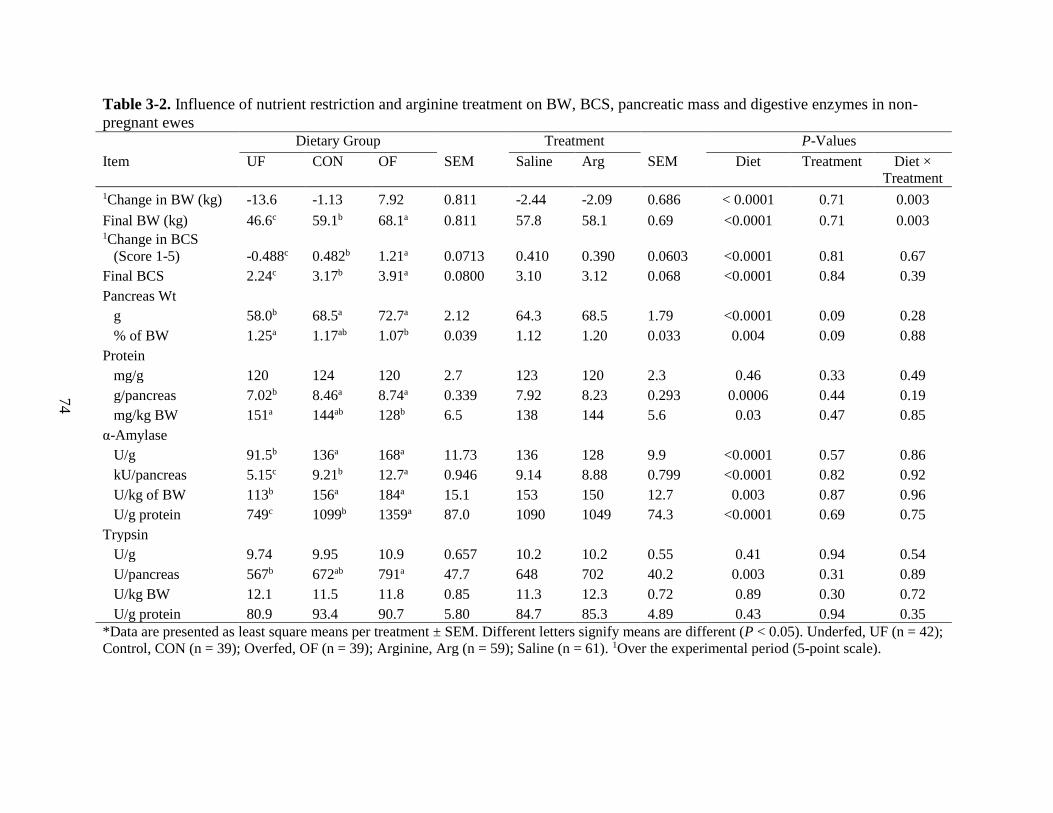
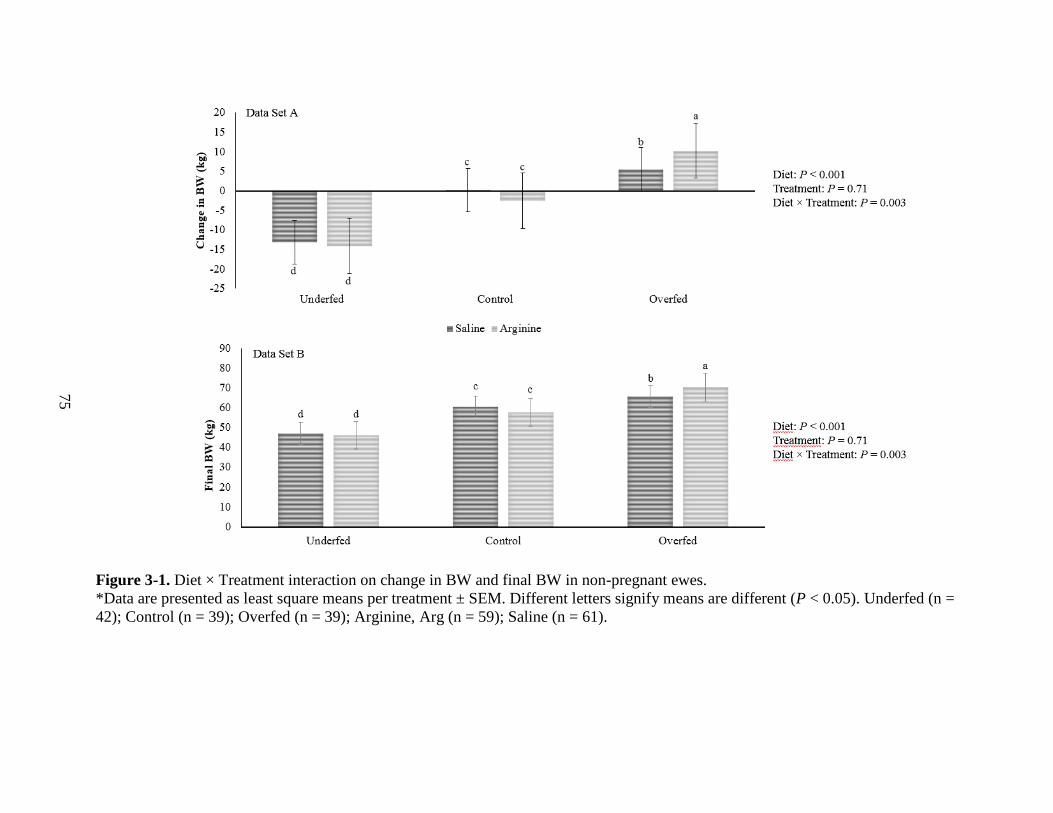


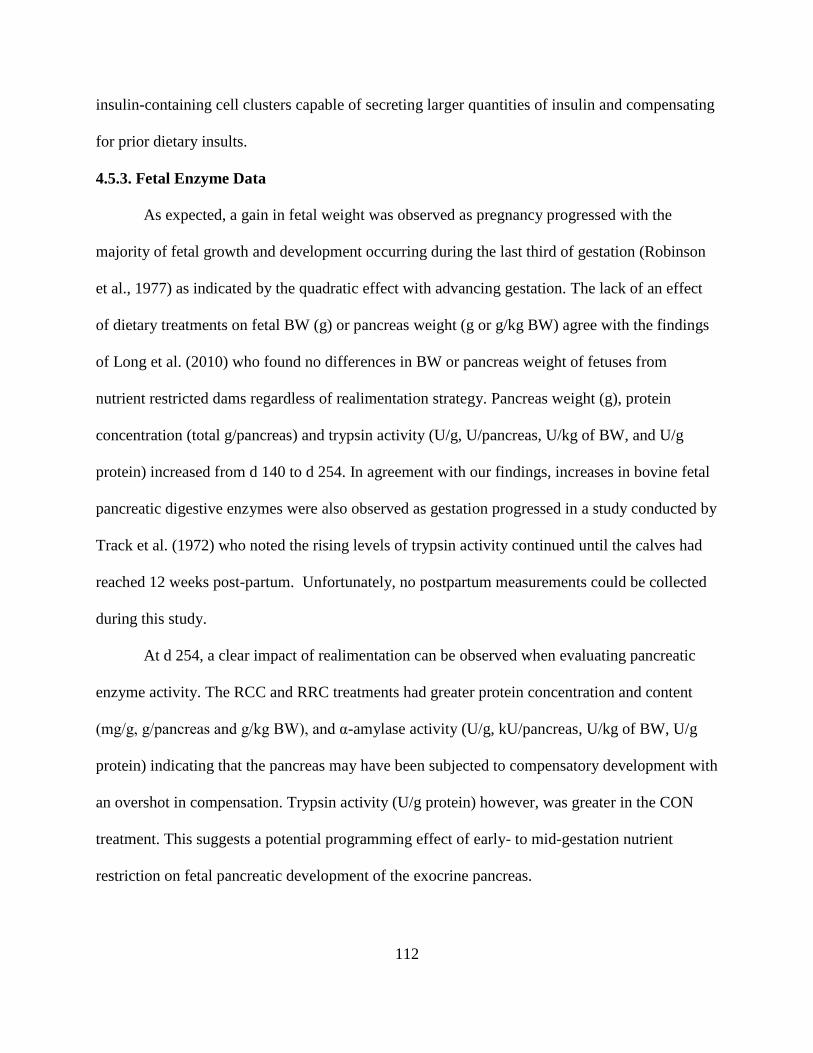
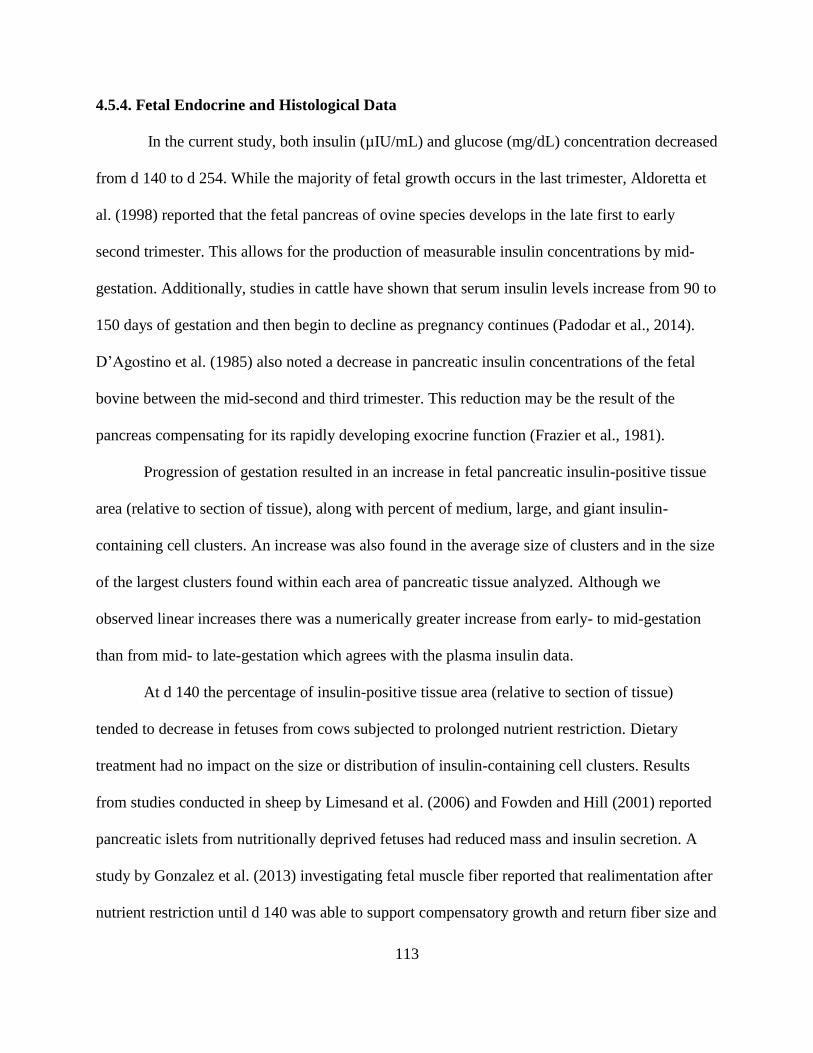
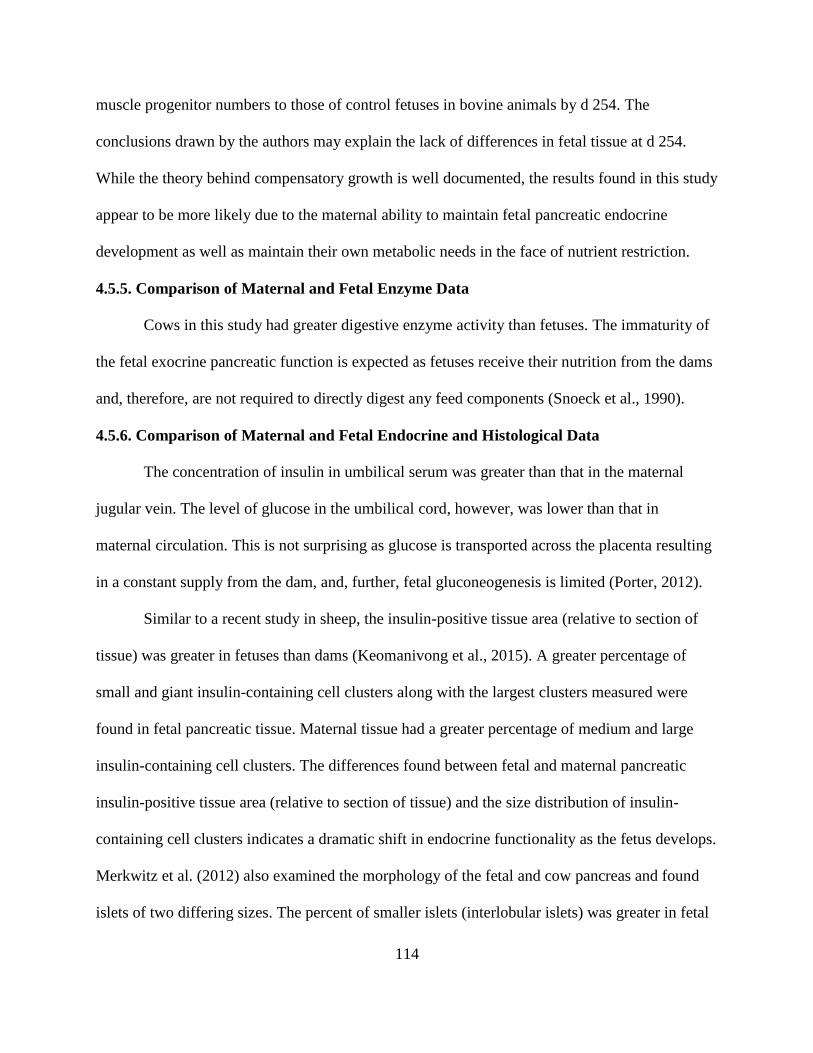


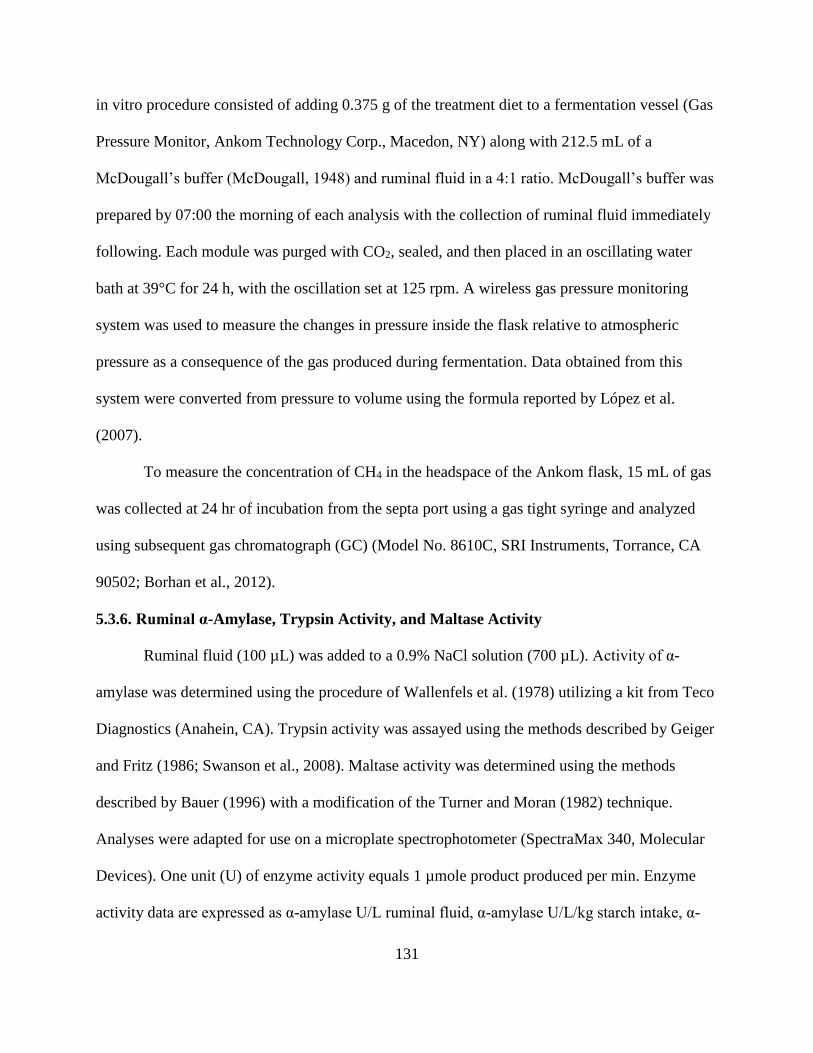


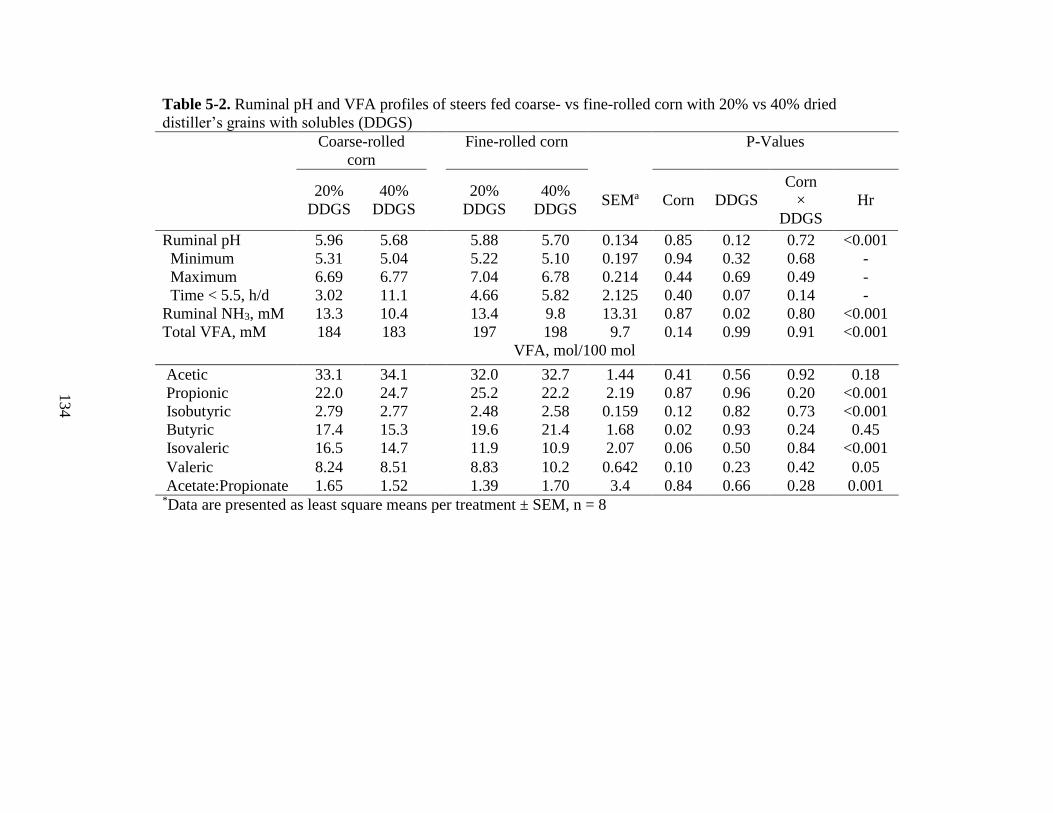
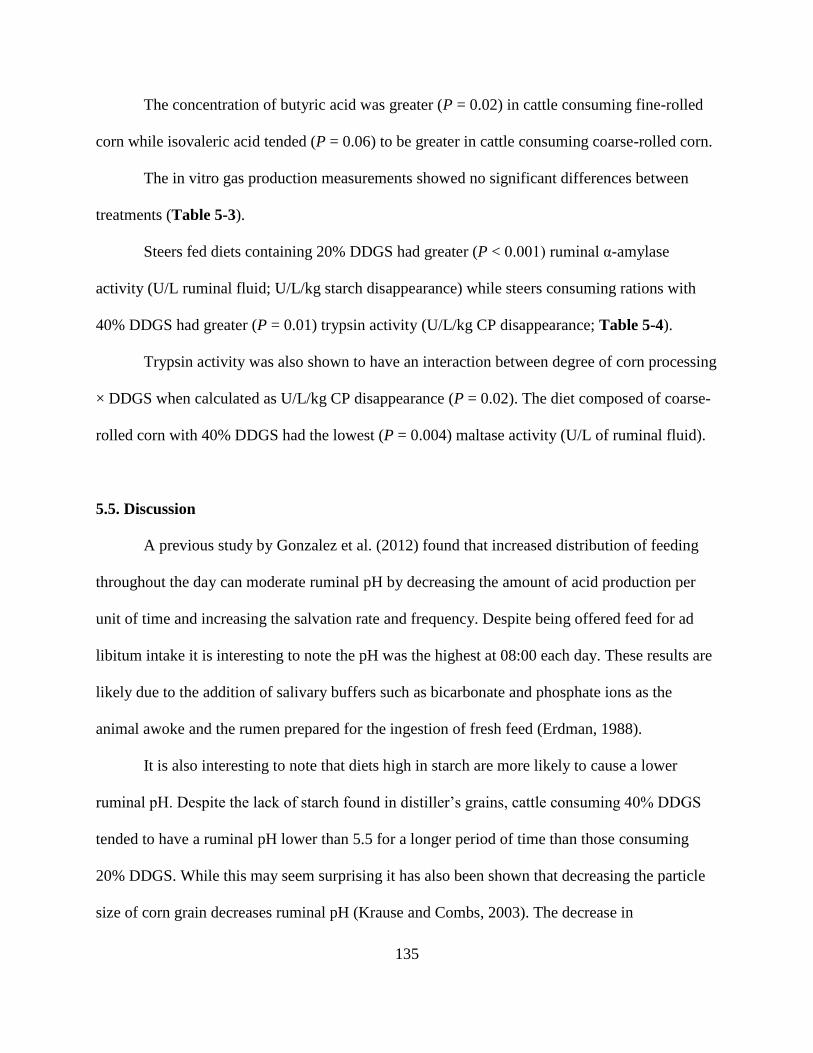

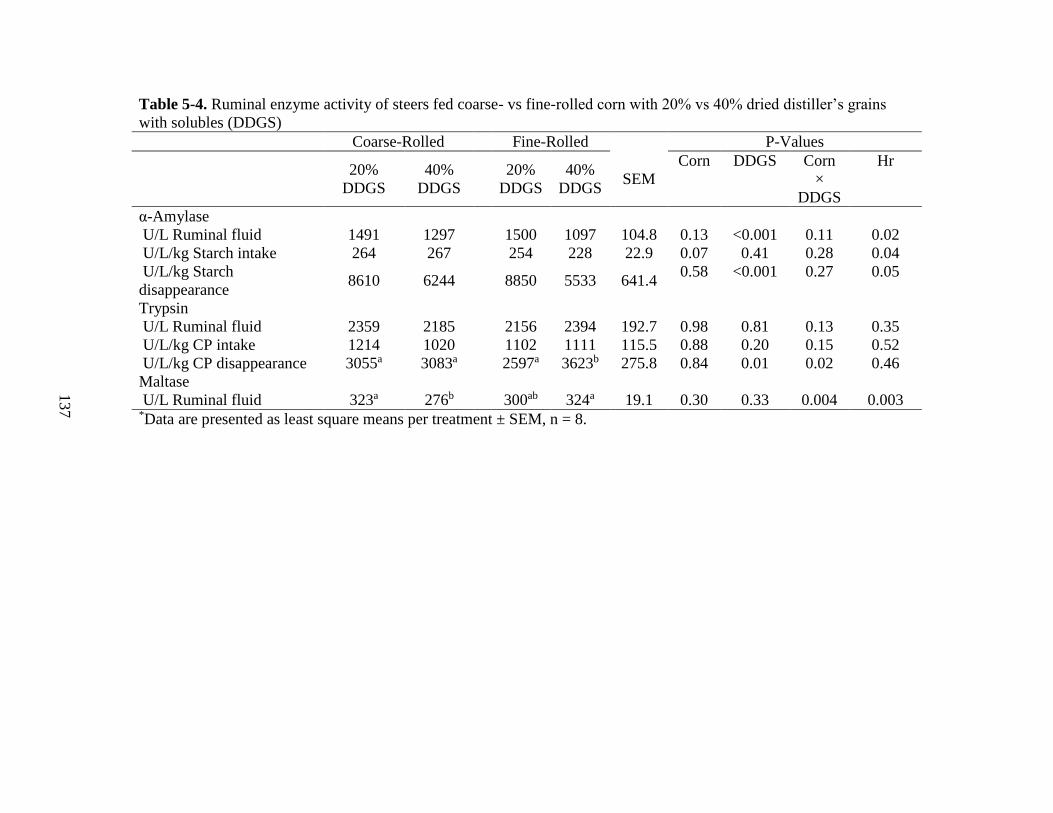


Related Documents