Florida International University FIU Digital Commons FIU Electronic eses and Dissertations University Graduate School 3-26-2015 e Impact of Different Types of Media on Tourists' Behavioral Intentions Jihwan Park Florida International University, jpark092@fiu.edu DOI: 10.25148/etd.FI15032194 Follow this and additional works at: hps://digitalcommons.fiu.edu/etd Part of the Hospitality Administration and Management Commons is work is brought to you for free and open access by the University Graduate School at FIU Digital Commons. It has been accepted for inclusion in FIU Electronic eses and Dissertations by an authorized administrator of FIU Digital Commons. For more information, please contact dcc@fiu.edu. Recommended Citation Park, Jihwan, "e Impact of Different Types of Media on Tourists' Behavioral Intentions" (2015). FIU Electronic eses and Dissertations. 1757. hps://digitalcommons.fiu.edu/etd/1757

Welcome message from author
This document is posted to help you gain knowledge. Please leave a comment to let me know what you think about it! Share it to your friends and learn new things together.
Transcript

Florida International UniversityFIU Digital Commons
FIU Electronic Theses and Dissertations University Graduate School
3-26-2015
The Impact of Different Types of Media onTourists' Behavioral IntentionsJihwan ParkFlorida International University, [email protected]
DOI: 10.25148/etd.FI15032194Follow this and additional works at: https://digitalcommons.fiu.edu/etd
Part of the Hospitality Administration and Management Commons
This work is brought to you for free and open access by the University Graduate School at FIU Digital Commons. It has been accepted for inclusion inFIU Electronic Theses and Dissertations by an authorized administrator of FIU Digital Commons. For more information, please contact [email protected].
Recommended CitationPark, Jihwan, "The Impact of Different Types of Media on Tourists' Behavioral Intentions" (2015). FIU Electronic Theses andDissertations. 1757.https://digitalcommons.fiu.edu/etd/1757

FLORIDA INTERNATIONAL UNIVERSITY
Miami, Florida
THE IMPACT OF DIFFERENT TYPES OF MEDIA ON TOURISTS’ BEHAVIORAL
INTENTIONS
A thesis submitted in partial fulfillment of the
requirements for the degree of
MASTER OF SCIENCE
in
HOSPITALITY MANAGEMENT
by
Jihwan Park
2015

ii
To: Dean Mike Hampton School of Hospitality and Tourism Management
This thesis, written by Jihwan Park, and entitled The Impact of Different Types of Media on Tourists’ Behavioral Intentions, having been approved in respect to style and intellectual content, is referred to you for judgment. We have read this thesis and recommend that it be approved.
_______________________________________ Miranda Kitterlin
_______________________________________ Jinlin Zhao
_______________________________________ Myongjee Yoo, Major Professor
Date of Defense: March 26, 2015 The thesis of Jihwan Park is approved.
_______________________________________ Dean Mike Hampton
School of Hospitality and Tourism Management
_______________________________________ Dean Lakshmi N. Reddi
University Graduate School
Florida International University, 2015

iii
© Copyright 2015 by Jihwan Park
All rights reserved.

iv
DEDICATION
I would like to dedicate my thesis to my beloved family for their endless love, support,
encouragement, and sacrifices.
v
ACKNOWLEDGMENTS
I would like to express thanks to many people. This study would never have been
possible without the guidance of my committee members, help from friends, and support
from my family.
First of all, I would like to express my sincere gratitude to my outstanding
committee, my advisor, Dr. Myongjee Yoo, Dr. Jinlin Zhao, and Dr. Miranda Kitterlin. I
would like to thank for their advice and ideas on my research, and their great support
throughout my research.
To all my friends for helping me overcome all the obstacles and stress and many
thanks to the writing center staff, Shannon Copeland and Corey Ginsberg for helping me
edit my paper.
I would like to thank my elder sisters, Dr. Namsu Park and Dr. Eunhee Park. I
am extremely grateful for them giving me countless valuable ideas, and words of
encouragement.
I am fully indebted to Dr. Myongjee Yoo, my advisor and major professor, for her
understanding, patience, encouragement, wisdom, enthusiasm, and consideration and for
her amazing support and guidance throughout the course of the master’s program. I am
thankful for her passion of my study, openness to new ideas, and putting her efforts into
reading and discussing my paper.
Finally, I would like to sincerely thank all my family members, my lovely Polly,
my sisters, especially my beloved parents who have given endless love to me, believed in
me, and supported all my decisions.

vi
ABSTRACT OF THE THESIS
THE IMPACT OF DIFFERENT TYPES OF MEDIA ON TOURISTS’ BEHAVIORAL
INTENTIONS
by
Jihwan Park
Florida International University, 2015
Miami, Florida
Professor Myongjee Yoo, Major Professor
The primary purpose of this study was to examine how much different types of
media affect a tourist’s decision when choosing a destination to travel. Further, this study
attempted to investigate the impact of the different types of media on a tourist’s
behavioral intentions. A primary field survey was designed for this study to collect data
and multivariate analysis of variance (MANOVA) was performed to analyze the data and
test the hypotheses. As a result, the most influential media form for choosing a
destination to travel was social media, while brochure ranked the last. Subsequently,
demographic factors showed noticeable propensities for the different types of media.
Lastly, media types had a significant impact on three behavioral intentions for traveling
as well. Study findings are expected to provide valuable information to better utilize the
media as a marketing tool for the tourism industry.
Keywords: Media, Media-induced Tourism, Behavioral Intention, Tourist Behavioral
Intention

vii
TABLE OF CONTENTS
CHAPTER PAGE
I. INTRODUCTION ............................................................................................................1 Background ......................................................................................................................1 Purpose of the Study .......................................................................................................3 Research Question ...........................................................................................................4
Summary ..........................................................................................................................5
II. LITERATURE REVIEW ................................................................................................6 Introduction ......................................................................................................................6 Understanding Media .......................................................................................................6 Types of Media ..............................................................................................................11
Television ...................................................................................................................11 Film ............................................................................................................................12 Print Media: Book, Magazine, Newspaper, and Brochure ........................................15 Internet .......................................................................................................................16 Social Media ..............................................................................................................18 Mobile ........................................................................................................................20
Behavioral Intention .......................................................................................................21 Understanding Behavioral Intention ..............................................................................21 Constructs of Behavioral Intention ................................................................................22
Word-of-Mouth ..........................................................................................................22 Revisit Intention .........................................................................................................22 Willingness to Pay More ............................................................................................23
Summary ........................................................................................................................24
III. RESEARCH DESIGN AND METHODOLOGY .......................................................25 Introduction ....................................................................................................................25 Research Hypotheses .....................................................................................................25 Research Models ............................................................................................................26 Research Design .............................................................................................................27
Measurement Method and Scales ..............................................................................27 Study Sample and Data Collection ............................................................................28
Data Analysis Method....................................................................................................29 Summary ........................................................................................................................30
IV. RESULTS ....................................................................................................................31 Introduction ....................................................................................................................31 Sample Profile ................................................................................................................31 Comparison of Media Type ...........................................................................................34 Testing of Hypotheses....................................................................................................36
Multivariate Analysis of Variance (MANOVA) for Study Hypothesis1 ..................36

viii
Multivariate Analysis of Variance (MANOVA) for Study Hypothesis2 ..................48 Summary ........................................................................................................................58
V. CONCLUSION .............................................................................................................59 Introduction ....................................................................................................................59 Discussion of Results .....................................................................................................59 Implication for Management ..........................................................................................62 Limitations .....................................................................................................................64 Recommendation for Future Research ...........................................................................64 Summary ........................................................................................................................65
REFERENCES ..................................................................................................................66
APPENDIX ........................................................................................................................77

ix
LIST OF TABLES
TABLE PAGE
2.1. Conceptualizing Media .................................................................................................7
2.2. The Changing Media .....................................................................................................7
4.1. Demographic Profile of Respondents .........................................................................33
4.2. Descriptive Statistics of Media Type ..........................................................................34
4.3. Reliability of Component Traveling Behavioral Intention .........................................36
4.4. Multivariate Tests for Demographic ...........................................................................37
4.5. Univariate Main Effect for Demographic ...................................................................38
4.6. Descriptive Statistics for gender .................................................................................39
4.7. Test of Equality of Covariance ...................................................................................39
4.8. Post Hoc Test Results for Age Group .........................................................................40
4.9. Descriptive Statistics for Age Group ..........................................................................43
4.10. Post Hoc Test Results for Nationality .......................................................................44
4.11. Descriptive Statistics for Nationality ........................................................................48
4.12. Multivariate Tests for Behavioral Intention ..............................................................49
4.13. Univariate Main effect for Behavioral Intention ......................................................49
4.14. Test of Equality of Covariance .................................................................................50
4.15. Post Hoc Tests for Word-of-Mouth ..........................................................................50
4.16. Descriptive Statistics for Word-of-Mouth ................................................................52
4.17. Post Hoc Tests for Revisit Intention .........................................................................53
4.18. Descriptive Statistics for Revisit Intention ...............................................................55
4.19. Post Hoc Tests for Willingness to Pay More ............................................................56
4.20. Descriptive Statistics for Willingness to Pay More ..................................................57

1
CHAPTER I
INTRODUCTION
Background
Humankind in the twenty-first century lives in a media-saturated world. The
number of Internet users around the world was over 2.5 billion by 2013 (Graham, 2014).
The average weekly using time of the Internet users in US was 10 hours in 2001, the
average weekly Internet using time reached to 16 hours in 2011 (Cao, 2014). Since
humanity needed a medium that is able to convey the information for effective
communication in the process of socialization (Febvre & Martin, 1976), media have been
developed with the advance in technology, and the influence of social, economic, and
political forces throughout history (Pace, 1997). Early mass media is classified into
newspapers, magazines, phonogram, cinema, and radio (McQuail, 2000). The media
formats have been constantly updated as the technology develops, such as the invention
of televisions, the Internet, social media, and so on.
Fodness and Murray (1999) emphasized that it was essential to properly utilize
mass media that was used as a source of major travel information for tourists, such as
television, newspaper, magazines, or the Internet. Precedent studies have proved that
media play an important role in increasing awareness of a destination, destination image
formation and tourists’ intentions to visit (Gartner, 1993; Gartner & Shen, 1992; Govers,
Go, & Kumar, 2007). Additionally, media have played a pivotal role in accelerating for
revitalization of mass tourism in the modern society, and the generalization of tourism
(Yeo, 2011). As a result, a variety of tourist destinations have been discovered to
2
generate growth in the tourism industry as the number of tourists has increased
significantly.
Since people are attentive to seeing the familiar and exotic scenes or experiencing
vicariously, media convey stories and pictures that generate interest and sales (Harrill &
Peterson, 2012). Various types of media, for example magazines, newspaper sections,
blogs, and TV programs provide people desire for traveling as well (Harrill & Peterson,
2012). Jenkins (2006) asserted that numerous information and media types (e.g. print
media, such as newspapers and books; broadcast media, such as radio and television;
entertainment, such as films) are interacting each other. Many media users engage in
“media multitasking” indicating using more than one type of media at once (Devereux,
2013). As Kipphan (2001) categorized media into print media and electronic (new)
media, this study classified nine media into two groups. Print media include book,
magazine, newspaper, and brochure. Electronic media includes television, film, Internet,
social media, and mobile.
Tourists’ behavioral intention has been viewed as an important research topic
both in academia and the tourism industry. In contemporary marketing activities,
tourists’ behavioral intention has become a crucial part in the determination of tourist
destination (Wang, Lu, & Xia, 2012). Tourists’ behavioral intention was considered as a
multi-dimensional concept and was generally measured by 1) positive word-of-mouth, 2)
repurchase intention, and 3) price sensitivity (Cronin & Taylor, 1992; Zeithaml, Berry, &
Parasuraman, 1996). This study examines the relationship between media as a source of
major travel information and tourists’ behavioral intentions that categorized three factors

3
that how much a tourist is willing to try, it includes motivate factor that affects behavior
(Ajzen, 1991).
Purpose of the Study
Various types of media have been found to be effective for travelers when they
choose a destination to travel and when they collect information to plan trips before
making their purchasing decision. In fact, travelers keep on searching for tourist
information even during their trip and continue to use media when they come back from
their trip afterwards. Travelers often share their experiences with new consumers or
other repeaters or convey merits and demerits about the destination through media.
(Cooper, 2005).
As a result, an increasing number of public relations practitioners and even
governmental organizations are using various methods (e.g. e-mails, websites,
multimedia, RSS feeds, social media, etc.) to better communicate with journalists so they
can enhance their media relations with tourists. In particular, more corporate/
governmental organizational websites tend to provide online pressrooms that provide
journalists with access to essential organization information and media materials such as
press releases, fact sheets, backgrounders, newsletters, brochures, photographs and
audio/video clips, and many downloadable materials (Yoo & Kim, 2013).
Therefore, with endless advanced technology developments, numerous
researchers in tourism management have been interested in the role of mass media in
tourism. The majority of the existing studies emphasized the role of the primary source
of its impact on destination image, and highlighted the importance of utilizing media
effectively in terms of marketing (Yeo, 2011).

4
Numerous studies attempted to investigate the impact of media-induced tourism
and mostly focused on media effect and destination image or customer satisfaction.
Besides, many studies only utilized a specific type or few types of media, mostly
television, film, or social media. Unlike the previous studies, this study attempted to
examine the effect of media on behavioral intention. Behavioral intention is important as
it relates to actual purchase behavior. It is crucial how tourists have been affected their
behavioral intentions by media while media technology continue to advance. Moreover,
this study attempted to compare the media effect by including nine different types of
media.
Research Question
Many studies propose the positive impact of media-induced tourism, but there is
limited justification on how different types of media have different influence. Overall,
this study proposes a way to revitalize media when tourists choose a destination to travel.
This study attempts to answer the following research questions:
1) What type of media affects tourist’s travel destination selection the most?
2) Is there a difference in tourist’s media impact on destination selection by
demographic information?
3) How do different types of media affect tourist’s travel behavioral intention?
The purpose of this study is to examine whether behavioral intention: 1) word-of-
mouth, 2) revisit intention, 3) willingness to pay more is influenced by media when
tourists choose a destination. This research aims to understand if media plays a crucial
role on tourists' destination selection and how different types of media impact tourists'

5
traveling intention. Additionally, this study will identify if there exists a preference of
media type depending on the tourists’ demographic information.
Study findings are expected to provide valuable information to better utilize the
media as a marketing tool for tourists' traveling intention. There is limited amount of
empirical research conducted in the hospitality field related to impact of media on tourists’
behavior. Thus, numerous key questions regarding the use of media in the hospitality
industry remain ambiguous and unanswered. It is critical to determine whether media is
effective at reaching tourists and affect their behavior intentions for traveling.
Summary
The impacts and the importance of media in the twenty-first century of human life
reflected actual life in the introduction. The research topic was simply derived from a
curiosity of the media type that most tourists favor. Thus, this study offered a key
concept of how different types of media have different influence, attempted to examine
the effect of media on behavioral intention, and referred to three research questions.

6
CHAPTER II
LITERATURE REVIEW
Introduction
Nine selected media types and behavioral intentions were introduced in the
literature review; it included the definitions of television, film, Internet, social media,
mobile, and print media. The literature review supported the justification of the effects of
media, which impact the tourism industry. The three variables of the behavioral
intentions that were affected by media were selected to be examined this study.
Introducing Media and its Types
Understanding Media
While the word “media” can be defined in various ways based on the researchers,
normally the term “media” is considered a Latin plural form of the singular noun
“medium,” meaning an intervening substance through which something is conveyed.
The media include television, newspapers, music, movies, magazines, books, billboards,
radio, broadcast satellites, and the Internet (Campbell, Martin, & Fabos, 2011).
Devereux uses McQuail as his source to define media by saying McQuail
mentions that media’s rapidly changing feature has “profound consequences” on the
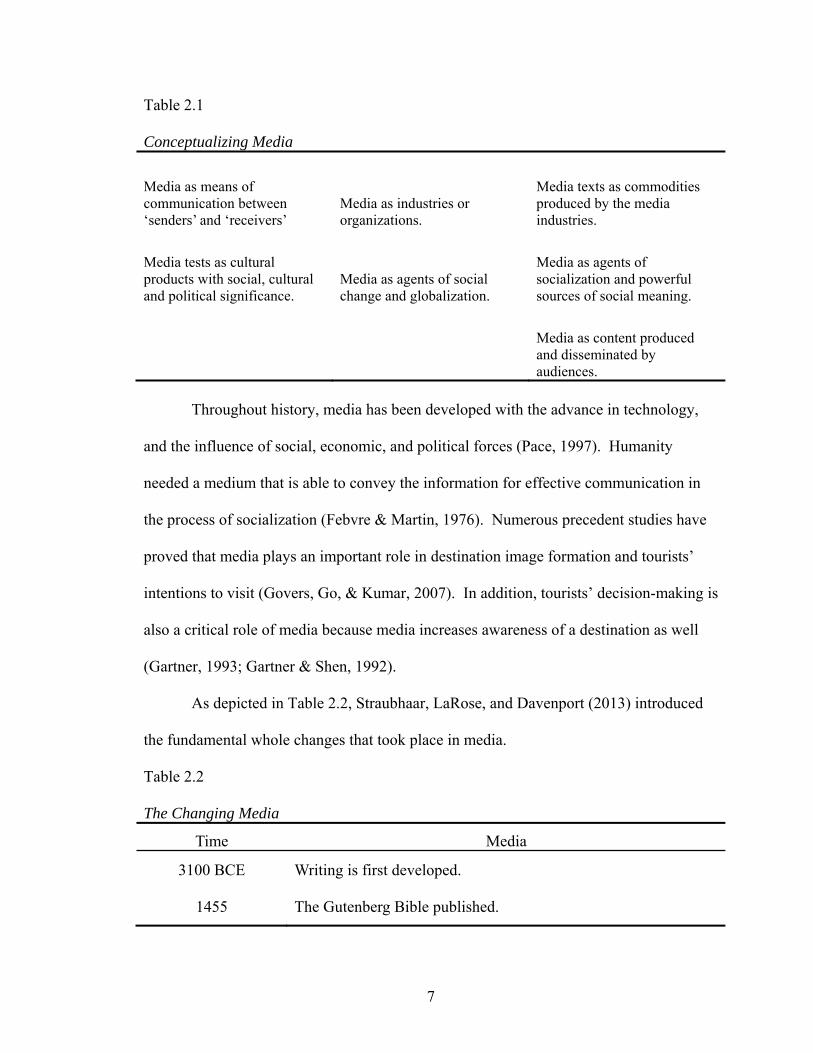
cultural, political, and economic society. Devereux conceptualized media into seven
categories (see Table 2.1) (as cited in McQuail, 2010).
7
Table 2.1
Conceptualizing Media
Media as means of communication between ‘senders’ and ‘receivers’
Media as industries or organizations.
Media texts as commodities produced by the media industries.
Media tests as cultural products with social, cultural and political significance.
Media as agents of social change and globalization.
Media as agents of socialization and powerful sources of social meaning.
Media as content produced and disseminated by audiences.
Throughout history, media has been developed with the advance in technology,
and the influence of social, economic, and political forces (Pace, 1997). Humanity
needed a medium that is able to convey the information for effective communication in
the process of socialization (Febvre & Martin, 1976). Numerous precedent studies have
proved that media plays an important role in destination image formation and tourists’
intentions to visit (Govers, Go, & Kumar, 2007). In addition, tourists’ decision-making is
also a critical role of media because media increases awareness of a destination as well
(Gartner, 1993; Gartner & Shen, 1992).
As depicted in Table 2.2, Straubhaar, LaRose, and Davenport (2013) introduced
the fundamental whole changes that took place in media.
Table 2.2
The Changing Media
Time Media
3100 BCE Writing is first developed.
1455 The Gutenberg Bible published.

8
1690 The first American newspaper appears.
1910 The United States becomes an industrial society.
1949 The Shannon-Weaver communication theory is propounded.
1960 The United States transforms to the first information society.
1962 Digital communication is deployed.
1975 Personal computers are invented. VCRs first reach consumers.
1982 CDs are introduced to consumers.
1989 Communication as Culture is published.
1991 World Wide Web begins.
1995 Computer-generated films are introduced. DVDs are first sold to consumers.
1996 Telecommunications Act passes Congress.
1998 Digital cable first reaches United States homes. Copyright Term Extension Act is enacted by Congress.
2004 Facebook is invented.
2009 HDTV takes over the airwaves.
The printing press led to a formation of mass media in the middle of fifteenth
century (Ramey, 2007). According to Jenkins (2006), various information and media
sources (e.g. print media such as books and newspapers; broadcast media such as radio
and television; entertainment such as films) are collaborating, vertically integrating, and
converging towards the digital sphere. Early mass media is classified into newspapers,
magazines, phonogram, cinema, and radio (McQuail, 2000). The media formats have
been updated as the technology develops; the television was added in the mid-twentieth
century (McQuail, 2000). Fodness and Murray (1999) emphasized the importance of

9
mass media as a source of major travel information for tourists and sorted the media into
television, newspaper, magazines, or the Internet.
Since many studies proved that media had great impacts on tourism industry, they
could be both positive and negative impacts. Gartner et al. (1992) examined that media
have a positive influence on destination image formation when the stories introduce or
describe about a certain place. They asserted that the influence of media would increase
when a message receiver had insufficient knowledge and information of the destination.
Preceding studies also found the negative impacts of bad publicity on the destination
images as well as tourists’ visits to the destinations through media. Baloglu and
McCleary (1999) explained that the relatively bad image of Egypt among Americans
formed because of the news coverage about terror in the country. Similarly, Peel and
Steen (2007) found the negative impact on the specific destination, such as the news
coverage about the national crime levels on Australia’s image. Furthermore, the acerbic
impacts of media coverage for crisis situations, for instance, the tsunami disaster in
Southeast Asia (Henderson, 2007) or terrorist attacks in Bali (Hitchcock & Putra, 2005)
were also mentioned. Namely, these studies indicated the important role of media in the
tourism destination image formation and suggested that media relations in tourism should
be well implemented to evade potential undesirable impacts.
For marketers, it is crucial to acknowledge how tourists acquire information for
making decisions about marketing management, designing effective communication
campaigns, and services delivery (Srinivasan, 1990; Wilkie & Dickson, 1985). Tourists
are willing to gather more information about the destination in terms of accommodation,
transportation, sightseeing, and other activities (Wong & Liu, 2011). Information is

10
collected and used largely for functional reasons or to plan trips (Vogt & Fesenmaier,
1998). Through information collecting process, travelers are able to diminish doubts and
enrich the quality of their trip (Fodness & Murray, 1997). According to Moutinho (1987),
information searching was a part of the process of checking various sources before
consumers make their purchase decision. Consumers perceive the demand for more
knowledge, which catalyzes the will to search for more information for the alternatives.
In a sense, the use of digital media as a key information resource and
communication platform for tourists has significantly grown. These include the provision
of information that can widely be accessed from various forms of online sources, such as
websites, electronic mail, web advertising, blogs, and social networking sites, etc.
Electronic manufacturers have cooperated with telecommunications service providers to
enable tourists worldwide to acquire, store, disseminate and exchange information in
multimedia friendly format about their travel plans and itineraries; make, change, confirm,
or cancel reservations interactively on demand and at their convenience anytime;
communicate and share their travel experiences to their friends and family members
through mobile Internet features, electronic media format (Divinagracia, 2012).
Tourism destination management organizations and many corporations in the
tourism industry have fully acknowledged digital media’s convergence phenomenon and
have disseminated tourism information content concurrently through digital media.
Additionally, they encourage consumption propensities of tourism products and services
across destinations through digital media (Divinagracia, 2012). A large number of
existing studies have showed that media is important in destination image formation and
tourists’ intentions to visit (Govers, Go, & Kumar, 2007). Davies and Cairncross (2014)
11
sorted media into new media: Internet and social media and traditional media: films,
television, books, magazines, and newspapers. Whereas both new and traditional media
will play key roles in influencing the destination choices of tourists, research must also
consider the influence of social groups that then translates through word of mouth.
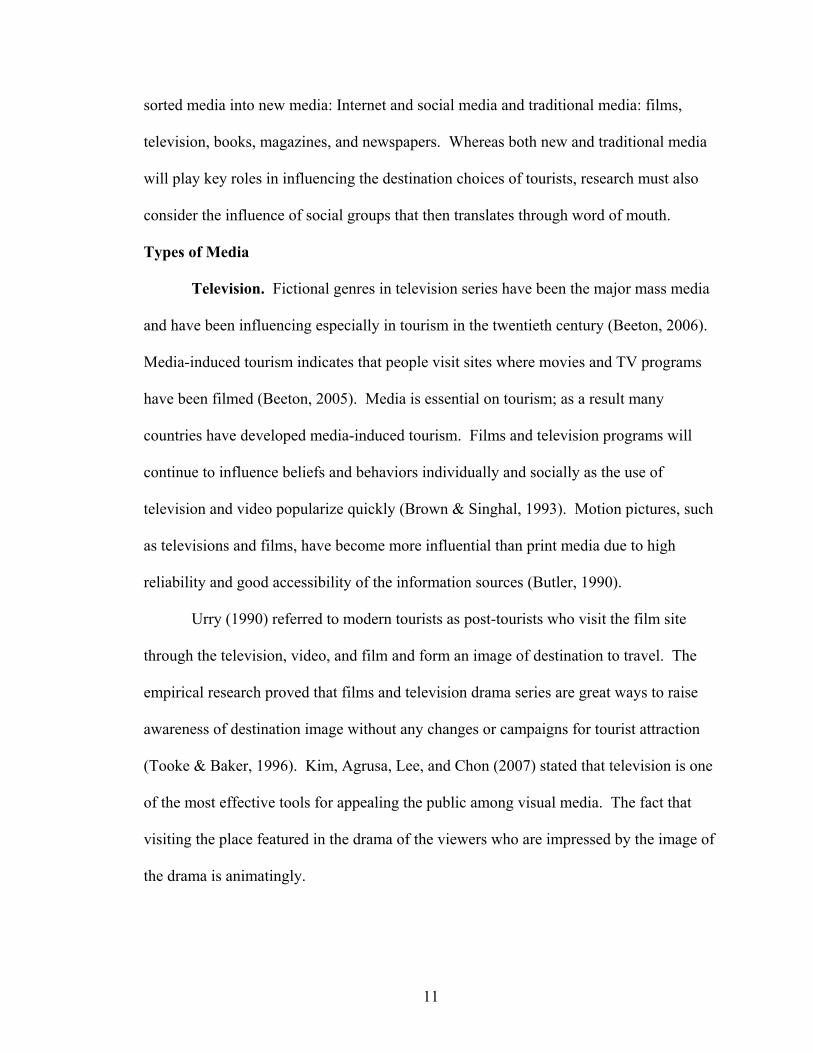
Types of Media
Television. Fictional genres in television series have been the major mass media
and have been influencing especially in tourism in the twentieth century (Beeton, 2006).
Media-induced tourism indicates that people visit sites where movies and TV programs
have been filmed (Beeton, 2005). Media is essential on tourism; as a result many
countries have developed media-induced tourism. Films and television programs will
continue to influence beliefs and behaviors individually and socially as the use of
television and video popularize quickly (Brown & Singhal, 1993). Motion pictures, such
as televisions and films, have become more influential than print media due to high
reliability and good accessibility of the information sources (Butler, 1990).
Urry (1990) referred to modern tourists as post-tourists who visit the film site
through the television, video, and film and form an image of destination to travel. The
empirical research proved that films and television drama series are great ways to raise
awareness of destination image without any changes or campaigns for tourist attraction
(Tooke & Baker, 1996). Kim, Agrusa, Lee, and Chon (2007) stated that television is one
of the most effective tools for appealing the public among visual media. The fact that
visiting the place featured in the drama of the viewers who are impressed by the image of
the drama is animatingly.
12
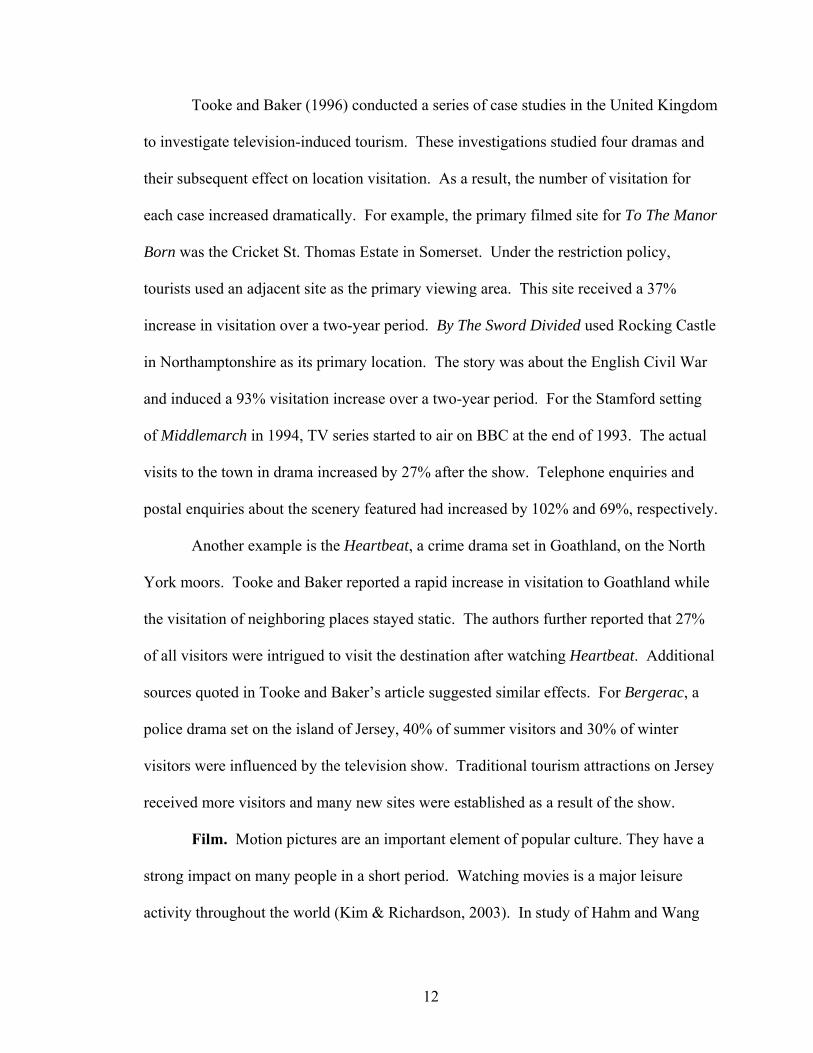
Tooke and Baker (1996) conducted a series of case studies in the United Kingdom
to investigate television-induced tourism. These investigations studied four dramas and
their subsequent effect on location visitation. As a result, the number of visitation for
each case increased dramatically. For example, the primary filmed site for To The Manor
Born was the Cricket St. Thomas Estate in Somerset. Under the restriction policy,
tourists used an adjacent site as the primary viewing area. This site received a 37%
increase in visitation over a two-year period. By The Sword Divided used Rocking Castle
in Northamptonshire as its primary location. The story was about the English Civil War
and induced a 93% visitation increase over a two-year period. For the Stamford setting
of Middlemarch in 1994, TV series started to air on BBC at the end of 1993. The actual
visits to the town in drama increased by 27% after the show. Telephone enquiries and
postal enquiries about the scenery featured had increased by 102% and 69%, respectively.
Another example is the Heartbeat, a crime drama set in Goathland, on the North
York moors. Tooke and Baker reported a rapid increase in visitation to Goathland while
the visitation of neighboring places stayed static. The authors further reported that 27%
of all visitors were intrigued to visit the destination after watching Heartbeat. Additional
sources quoted in Tooke and Baker’s article suggested similar effects. For Bergerac, a
police drama set on the island of Jersey, 40% of summer visitors and 30% of winter
visitors were influenced by the television show. Traditional tourism attractions on Jersey
received more visitors and many new sites were established as a result of the show.
Film. Motion pictures are an important element of popular culture. They have a
strong impact on many people in a short period. Watching movies is a major leisure
activity throughout the world (Kim & Richardson, 2003). In study of Hahm and Wang

13
(2011), they mentioned that film is one of the most important motivational mass media
for tourism. Film tourism is defined as tourist visits to a screened location that was
featured in film, television, or video, also referred to as movie-induced tourism (Hudson
& Ritchie, 2006).
According to Beeton (2005), people visit the film site where the movie has filmed,
experience the film or to get more closed to the celebrities. Riley and Van Doren (1992)
conducted a research about the effect of attracting tourists through film and asserted that
film has an ability to advertise the destination in the long run, which could lead to
enhance the image of the featured destination and increase public awareness of the town
by utilizing the storyline and the perfect camera framing. Additionally, other exploratory
research proved that destinations featuring or being portrayed in films could increase the
number of tourists (Riley & Van Doren, 1992, 1998; Tooke & Baker, 1996). In the
aspect of destination marketing, film-induced destination marketing concepts and have
given attentiveness to mass audiences. Film is also considered as a more credible and
trustworthy mass media source compared to other promotional materials (Connell, 2005;
Tasci, 2009).
As stated by Riley et al. (1992), motion pictures had several advantages over
hallmark events when inducing people to visit: longer periods of location exposure when
compared to the advertising and promotion of hallmark events and locations; vicarious
involvement and identification with locations through movie storylines which allow
greater personal meaning to the beholders of the gaze; enhanced location images through
the use of special effects, movie stars, and picture perfect camera angles; enhanced
location awareness by different market segments through a universally popular medium

14
such as movies; movies as a non-sales form of communication that allowed discovery of
the location as opposed to the hard sell of advertising ; and in-home access to the
locations shown in the movies.
Hahm and Wang (2011) designed the study to assess an impact of a specific
movie featured in Japan. This study found that the film directly influenced the audiences;
the audiences directly captured the positive and the negative specific images of
destination from the film. The image that respondents had became more detailed, and
they declared the strong intention to travel after watching the film (Hahm & Wang, 2011).
These results are consistent with the other research that the featured destination in the
film boosts the existing interest (Iwashita, 2003; Macionis & Sparks, 2009).
Cousins and Andereck’s study (1993) described the strong influence of movies.
For the Durham Bulls (minor league) baseball team, the authors noted a significant
increase in paid spectatorship and a healthy rise in merchandise sales. For the movie, The
Last of the Mohicans, annual visit increased 25% the year after the movie released. The
outstanding natural scenery of Chimney Rock Park, North Carolina was showed in the
movie as an attraction and early American cultures were presented as well.
According to the study of Cousins et al. (1993), the leverage of film-induced
tourism was proved even after the movie released. There was a 74% visitation increase at
Devils Tower National Monument in 1978 where is the scenery of Close Encounters of
the Third Kind and more than 20% of visitors indicated knowledge of the scenery from
the movie in the study that conducted after 12 years (Workman, Zeiger, & Caneday 1990).
Print Media: Book, Magazine, Newspaper, and Brochure. According to
Brown and Chalmers (2003), published guidebooks were the one of the most typical

15
information for tourists. The use of travel guidebooks is widely welcomed by tourists
such as beach tourists, film tourists, etc (Law, Bunnell, & Ong, 2007). Zillinger (2007a,
2007b) found that travel guidebooks played an important role in guided tourism
investigating tourists’ behavior when they traveled. The influence of travel guidebooks
on these processes can generally be divided into two categories. First, guidebooks may
influence the formation of destination images, which may subsequently determine tourist
expectations and satisfaction (Lew, 1992). McGregor (2000) confirmed that guidebooks
facilitate and encourage the formation of certain images of places without actual
visitation. Next, there was a possibility that guidebooks influence individual travel
decisions, either positively or negatively (Lew, 1992). They could give an impression
both the desirable and undesirable aspects of a certain destination and induce tourists to
choose among the product options (Carter, 1998; Lew, 1992). Depending on the extent
of tourists how much they accept the perspectives, their individual interests and demands
would be varied (Lew, 1992).
Robertson and Rogers (2009) defined newspaper was an important medium in the
decision making process of tourists. There were many preceding studies that newspaper
had a carryover effect (Clarke, 1976; Givon & Horsky, 1990; Herrington & Dempsey,
2005; Tull, 1965). According to the study of Kim, Lee, Mjelde, and Lee (2014) about the
carryover effect, for example, newspaper reports had a positive effect on attendance with
this media effect increasing for the first four days after publication. Through information
collecting process, potential tourists were able to solve doubts and enhance the quality of
their trip (Fodness & Murray, 1997).

16
Internet. Nowadays, people generally recognize that the Internet is the most used
information source (Choi & Lee, 2009; Sørensen, 2003). The Internet basically
reformatted the way people gather tourism-related information when they plan to travel
and purchase the trip (Buhalis & Law, 2008). Tourists tend to devote more time and
effort on the more unfamiliar destination when searching for information before making
their purchase decision (Fodness & Murray, 1999). This is a particularly important
process because information search is the first step toward the purchase of a product or
service (Murray, 1991).
The Internet has had a profound impact on business generally since the mid-1990s
(Wirtz, Schilke, & Ullrich, 2010). It has resulted in creating new business models and
provided more choice and information for consumers (Benson & Standing, 2008).
Consequently, a significant amount of destination marketing has also shifted to the web.
In recent years, the World Wide Web approaches have spawned large amounts of user-
generated content in the form of travel blogs and reviews (Huang, Chou, & Lin, 2010).
Thus, the Internet is now considered as a critical factor to the success of tourism products
and services (Buhalis & Licata, 2002; Carson, 2005).
As the Internet has had a significant impact on the tourism sector, this has been
reflected in a number of research studies examining various issues related to the topic
(Law, Qi, & Buhalis, 2010). Xiang and Gretzel (2010) asserted that there are two mega
trends that have developed on the Internet: social media websites and Internet searching.
The changes can significantly impact the tourism system. Being one of the two “mega
trends” that can significantly impact the tourism system. According to Doolin, Burgess,
and Cooper (2002), the tourism industries acknowledged that the design of tourism

17
websites were able to provide a virtual experience for tourists about a destination, and
were able to influence the formation of a tourism destination image in their minds.
The Internet has changed the ways of travelers’ consumptions for hospitality
services besides online web searches and bookings (Ong, 2012). The tourists, in
particular, have greater access to gain more information, compare prices and acquire
overall greater choice and convenience. Indeed, it is argued the Internet has facilitated a
shift of power from travel providers to consumers since they now have access to a wide
range of travel providers on the Internet that often compete on price (Law et al., 2010).
Furthermore, the Internet media have affected many governmental organizations,
and corporates in the hospitality. Travel agencies, for example, use Internet technology
for reservation, accounting, inventory management functions, etc. Global distribution
systems are used for reservations, information search, client management, and reporting
(Standing, Tang-Taye, & Boyer, 2014). Numerous corporate and organizational websites
already have online pressrooms that provide journalists with access to crucial information
and media materials such as press releases, fact sheets, backgrounders, newsletters,
brochures, photographs and audio/video clips, and many downloadable materials (Yoo &
Kim, 2013).
According to Yoo et al. (2013), official state tourism websites have been a role of
major information sources for journalists and tourists. Government-sponsored tourism
websites are considered as credible sources (Cox, Burgess, Sellitto, & Buultjens, 2009)
for the tourists. Their study emphasized that it was important to understand the role of
official websites in online media relations. Consequently, Pettigrew and Reber (2010)
referred an online newsroom on U.S. state tourism website as another type of media.
18
Since the images of the tourism destinations are intangible, tourism destinations are
dependent in media (L’Etang, Falkheimer, & Lugo, 2007). The tourism industry has seen
a huge growth in the sharing of travel information through social media (Schmallegger &
Carson, 2008; Sigala & Marindis, 2009), with the Internet services.
Social media. Social media is one of the fastest growing communication
technologies in the Internet environment and played a significant role in tourism industry
(Blackshaw, 2006; Blackshaw & Nazzaro, 2006; Buhalis & Law, 2008; eMarketer, 2007;
Chan & Guillet, 2011; Xiang & Gretzel, 2010). Social media and the World Wide Web
are two popular media, which have brought about pervasive changes in business-to-
business communication, business-to-customer communication, and customer- to-
customer communication (Kietzmann, Hermkens, McCarthy, & Silvestre, 2011). From
the study of Li and Wang (2011) and Thevenot (2007), they defined social media that the
Internet has evolved from a broadcasting medium to a participatory platform that allows
people to become the “media” themselves for collaborating and sharing information.
It refers to Internet-based online media in which individuals with common
interests, goals, and practices engage in social interactions constructing personal profiles
and sharing information and experiences (Chiu, Hsu, & Wang, 2006). The proliferation
of social media meant that consumers are no longer limited to information provided by
professional reviewers, print guides, and hospitality businesses when they make purchase
decisions on hotels, cruises, tours, and restaurants (Ong, 2012).
In recent years, there are numerous social media types on the Internet. Akar and
Topcu (2011) sorted the major types of social media; social media represents a variety of
forms such as social networks (e.g., Facebook), photo sharing sites (e.g., Flickr,
19
Photobucket), video creating and sharing sites (e.g., YouTube, Ustream), online
communities, microblogging tools (e.g., twitter), social tagging (e.g., Digg), newsreaders
(e.g., Google Reader), public Internet boards and forums, review/rating websites (e.g.,
TripAdvisor), blogs/moblogs, tagging sites, podcasting, wikis, and individual websites.
According to Bodnar’s study in 2010, on each day, more than 3 million photos are
uploaded to Flickr, 5 million tweets, and a million new blog entries are posted on Twitter
and other blog sites. The accessibility of social media is uniquely easy, so that potential
consumers enable to acquire, and share information online by uploading pictures, sharing
the experiences with their friends and family. Additionally, they share information and
knowledge about the product and services as well (Hajli, Bugshan, Lin & Featherman,
2013).
User-review information is likely to be latest, real-time, and compiled by a large
number of consumers (Ong, 2012). Reviews can also affect the morale of the hospitality
team and impact recruitment efforts (Frumkin, 2007). Goeldner and Ritchie (2006) have
shown that most consumers prefer familiarity over novelty when traveling to a new
destination for the first time. Social media is widely used by repeat visitors; they share
their experiences with newcomers or other repeaters and try new things that they have not
experienced before.
Mobile. According to the data of the Cellular Telecommunications & Internet
Association’s (CTIA) wireless industry statistics (2012), the number of the U.S. mobile
phone subscribers was around 322.8 million by June 2011. According to U.S. Census
Bureau, the U.S. population of February 2011 was around 313 million (U.S. Census
Bureau, 2011); in other words, the mobile phone usage rate was over 100%. Additionally,

20
according to the ComScore Reports (Mohamud, 2012), smartphone owners in June 2012
were approximately 114 million in the U.S; it means that nearly one third of U.S. mobile
phone users own smartphones.
Mobile phones have developed with faster processors and enhanced operating
systems and have delivered “smartphones” that allow people to use them as fully
functional computers. Smartphones include features of cellphones with Internet access,
user-friendly interfaces, and various applications that are able to support tourists (Xiang
& Gretzel, 2010; Wang, Park, & Fesenmaier, 2012). With the advent of iPhone from
Apple in 2007, the number of smartphone users gradually increased (Shin, 2014). A
smartphone is recognized as a multi-functional device, such as Internet browser, music
player, GPS navigator, mobile TV, and camera (Shin, 2014). According to the survey
that conducted from the Telegraph (Richmond, 2012), Internet browsing was ranked in
the first place for smartphone usages while making a phone call was ranked in the fifth
place for smartphone usages.
Mobile technology has become naturally and gradually important in society,
meanwhile, mobile Internet services have affected numerous industries all over the world
(IDATE, 2010). Especially, the travel and tourism industry was the one of the industries
that has been affected dramatically by mobile technology (Buhalis, 2003; Middleton,
Fyall, Morgan & Ranchhod, 2009). The mobile Internet services have renovated the
marketing and selling the services of travel service providers, airlines, and other public
and private transport companies, and overall hospitality (Shin, 2014). In addition,
smartphone applications for tourists and mobile system that generates personalized
information or recommendations for travelers are developed (Ahas, Aasa, Roose, Mark,

21
& Silm, 2008; Carlsson & Walden, 2010; Edwards, Blythe, Scott, & Weihong-Guo, 2006;
Kenteris, Gavalas, & Economou, 2009; Meng, Poslad, & Wang, 2009; Wan, 2009).
Behavioral Intention
Understanding Behavioral Intention
Behavioral intention indicates the concept of a person’s predictive or planned
future action. It can be defined as a probability that principle and behavior transfer into
an action, or a subjective possibility that principle and behavior transfer into an action
(Engel, Blackwell & Miniard, 1990). Behavioral intention is also defined that how much
a person is willing to try; it includes motivate factor that affects behavior (Ajzen, 1991).
Tourists’ behavioral intention was considered as a multi-dimensional concept and was
generally measured by 1) positive word-of-mouth, 2) repurchase intention, and 3) price
sensitivity (Cronin & Taylor, 1992; Zeithaml, Berry, & Parasuraman, 1996). Tourists’
behavioral intention study has also focused on tourists′ previous experiences. The
precedent studies have confirmed not only the quality of the tourism experience and past
experiences on tourists’ behavioral intention, but also the effects of tourists′ security
perception of the destination and destination image perception on tourists’ revisit
intention and destination choice (Baker & Crompton, 2000; Bigne, Sanchez, & Sanchez,
2001; Darnell & Johnson, 2001; Kozak, 2001; Petrick, Morais, &Norman, 2001; Petrick
& Backman, 2002; Chen & Tsai, 2007; Jang & Feng, 2007; Chen & Chen, 2010). In the
study of Saiprasert (2011), the author demonstrated behavioral intention into three
dimensions.

22
Constructs of Behavioral Intention
Word-of-Mouth. Interpersonal influence and word-of-mouth are considered the
most significant information source when a consumer exerts a purchase decision. Since
products and service in the hospitality and tourism industry are intangible which are
difficult for consumers to assess prior to their actual experiences, the influences are
especially crucial (Litvin, Goldsmith & Pan, 2008). The study of Kim, Han and Lee
(2001) about the effects of relationship marketing on repeat purchase and word-of-mouth
revealed that greater guest confidence and communication induce higher relationship
quality, consequently, higher relationship quality brings about greater guest commitment
and more repeat purchase and positive word-of-mouth.
Positive tourists’ behavioral intention could be viewed as tourist loyalty and
results in good word-of-mouth referrals (Jang & Feng, 2007). In the industrial field,
tourists’ behavioral intention is integrally or partially considered to have the nature of an
economic phenomenon, and tourist destination development relies on tourists′ positive
word-of-mouth referrals (Darnell & Johnson, 2001). In today’s world, consumers are
interested in providing and responding to electronic word-of-mouth. As a result, the
influence of electronic word-of-mouth has grown gradually (Gretzel, Kang, & Lee, 2008).
Revisit Intention. Repurchase intention refers to the individual’s judgment about
buying again a designated service from the same company, taking into account his or her
current situation and likely circumstances (Hellier, Geursen, Carr, & Ricard, 2003).
Revisit intention is a principal factor of repurchase intention (Huang, Yen, Liu & Chang,
2014). In contemporary marketing activities, especially tourists′ revisit intention has

23
been an essential key point in the determination of tourist destination (Wang, Lu, & Xia,
2012).
Jones and Sasser (1995) indicated that repurchase intention is concerned as a
crucial element for profit and evaluation of stores. Repurchase intention is considered
that consumers are willing to buy the product or service again. Additionally intention to
repurchase is simple, objective, and observable expected purchase behavior (Seiders,
Voss, Grewal, & Godfrey, 2005). Collier and Bienstock (2006) also mentioned that
repurchase intention induces the possibilities of purchase and intention to recommend the
product to friends and family.
There is a large amount of preceding studies that emphasized revisit intention
considering one of the most important consequences of traveler’s involvement. For
instance, according to Leung and Bai (2013), the higher revisit intention was discovered
as travelers got attached with social media. In the study of Wang and Wu (2011), the
authors found that higher involvement of travelers induced higher intention to revisit to
museum. Moital, Vaughan, Edwards, and Peres (2009) suggested that an individual’s
higher involvement on the Internet brought about a higher level of intention to purchase
travel product through the Internet. Lastly, travelers’ involvements positively impact
their revisit intention to destination through the mediation of brand equity and satisfaction
(Kim, Han, Holland, & Byon, 2009).
Willingness to Pay More. A concept of willingness to pay could be defined in
many ways depending on the researchers; willingness to pay was defined as “the
maximum price a buyer is willing to pay for a given quantity of a good” (Franke &
Schreier, 2008; Wertenbroch & Skiera, 2002, p. 228). Lee, Graefe, and Hwang (2013)

24
defined that willingness to pay is spending preferences of tourists. According to
Campbell, Robin, and Daniel (2014), explained as a consumer’s willingness-to-select or
purchase a specific item or product in comparison to a price (e.g. ‘how willing would you
be to pay for a product?’), or, as a conjectural value or price interval (such as a
percentage) assigned to the product (e.g. ‘I would be willing to pay 5%, 10%, or 25%
more for a product’). Additionally, Campbell et al. (2014) mentioned that willingness to
pay is used to measure a consumer’s product preference and how much a customer would
spend. Thus, willingness to pay indicates the maximum limit of the adequate price range
of a product or service (Balderjahn, 2003).
Lee et al. (2013) asserted that mood, feelings, and psychological condition affect
consumer’s willingness to pay. Preceding studies found that consumers’ satisfaction may
affect their expenditure preferences and behaviors (Gu & Ryan, 2008; Kyle, Absher, &
Graefe, 2003; Mooradian & Olver, 1997; Williams, 1989). According to Balderjahn
(2003), consumers can estimate the maximum price that they would be willing to pay for
a certain product without price information. Saiprasert (2011) indicated that repeat visit
is correlated with willingness to pay in terms of using the same product and considering
the destination as the first choice for the purpose.
Summary
From the literature review, media were divided into two groups: print media and
electronic media. Tourists’ behavioral intention was considered as a multi-dimensional
concept; word-of-mouth, revisit intention, willingness to pay more were selected from the
preceding study.
25
CHAPTER III
RESEARCH DESIGN AND METHODOLOGY
Introduction
Research hypotheses, research model, research design, and data analysis methods
were introduced in this chapter. There were two main study hypotheses constructed with
three sub-hypotheses for each. As illustrated in Figure 3.1, the research models were
proposed for the study hypotheses. Research design explained the measurement method,
study samples, and how the data were collected. Lastly, the data analysis method that
referred to descriptive statistics and MANOVA was performed to test hypotheses that
were mentioned.
Research Hypotheses
The findings of the literature review suggest that people are exposed to mass
media that convey enormous amount of information in different ways and provides
support on media-induced tourism. The various types of media influence a destination
image, or travel motivation when people choose a destination to travel. Especially,
demographic factors such as age, gender, and nationality were found to have a different
impact on travel motivation (Andreu, Kozac, Avci, & Cifter, 2005; Baloglu, 1997;
Baloglu & McCkeary, 1999; Chen & Kerstetter, 1999; Pizam &Sussman, 1995; Ritter,
1987, 1989; Walmsley & Jenkins, 1993). Thus, it was assumed that demographic factors
might have an impact on the type of media tourists choose to utilize. Thus, the
hypotheses were set up to investigate whether demographic factors have an impact on the
different types of media selection for traveling and to analyze the degree of influence of
different types media on travel behavioral intention. Due to the sample characteristics,
26
this study specifically chose gender, age, and nationality for demographic factors. This
study selected three constructs of word-of-mouth, revisit intention, willingness to pay
more to measure behavioral intention as the dependent variable (Saiprasert, 2011).
Overall the study hypotheses was derived as following:
H1: Demographic factors have a significant impact on the media types for
choosing a travel destination.
H1a: Gender has a significant impact on the media types for choosing a travel
destination.
H1b: Age has a significant impact on the media types for choosing a travel
destination.
H1c: Nationality has a significant impact on the media types for choosing a travel
destination.
H2: The type of media has a significant impact on tourists’ behavioral intention.
H2a: The type of media has a significant impact on tourists’ word-of-mouth.
H2b: The type of media has a significant impact on tourists’ revisit intention.
H2c: The type of media has a significant impact on tourists’ willingness to pay
more.
Research Models
Causal research models were demonstrated to explore the structure relationship
among demographic factors, types of media, and behavioral intentions. The first study
hypothesis included demographic factors as independent variables and types of media as
dependent variables. The second study hypothesis contained types of media as
independent variables and behavioral intentions as dependent variables.

27
Figure 3.1. Research Models. This figure indicates the research model for the study
hypotheses.
Research Design
Measurement Method and Scales
This study designed a self-administered questionnaire based on the literature
review to collect data. The questionnaire consists of three sections: 1) demographic
information, 2) media type, and 3) behavioral intention. The method was to describe the
profile of potential tourists from various countries and to collect the data thorough
questionnaires to answer the question regarding the media preferences when choosing a
destination to travel, and behavioral intentions.
Primarily, the first section of the questionnaire consisted of seven questions of
demographic information: gender, marital status, age, annual income, ethnicity,
nationality, and education level of the respondents. The second section of the
questionnaire was designed to collect information on the type of media and the influence
of media to tourists. Participants were asked to indicate how the different type of media
(television, films, books, magazines, newspaper, brochures, Internet, social media, and
mobile) affects their decision on choosing a destination to travel. A 7 point-Likert scale,
Demographic Factors
•Gender•Age•Nationality
H1
Types of Media
•Television•Film•Books•Magazines•Newspapers•Brochure•Internet•Social Media•Mobile
H2
Behavioral Intentions
•Word-of-Mouth•Revisit Intention•Willingness to Pay More

28
meaning 1 as “extremely low” to 7 as “extremely high” was used to measure the
respondents’ perception of the importance of media on their travel destination.
Respondents were required to answer the entire section that was appropriate to their
circumstance.
Lastly, the third section of the questionnaire was designed to collect information
on the efficacy of media towards tourists’ traveling behavioral intention. In this section,
the respondents were asked to rate how likely the different types of media affect the
seven dimensions of traveling behavioral intention. According to Saiprasert (2011), the
three components to gauge behavioral intention are composed of the following seven
contents; 1) word-of-mouth (say positive things about the destination to my relatives and
close friends, willing to recommend the destination to my relatives and close friends), 2)
revisit intention (willing to do further visitation of the destination in the future, continue
to visit the destination in the future, consider the destination as my first choice for
traveling), 3) willingness to pay more (visit the destination even if the cost was higher
than other destinations, willing to spend more money for the destination even if the price
increased). The section was deliberate with the 7-point Likert-type scale, with end-
anchors labeled “extremely low” and “extremely high”. A pilot test was taken to ensure
all questions for the questionnaire were designed appropriately.
Study Sample and Data Collection
Prior to data collection, a protocol explaining the study was submitted to
Institutional Review Board (IRB) of Florida International University. Approval was
granted by the IRB to conduct research involving human subjects. The consent form was
either attached to the questionnaires or to the online survey link. Respondents were able

29
to voluntarily decide whether to participate in the survey or not. This study used a non-
probability convenience sampling method. Two hundred questionnaires were distributed
to students, staff, and faculty at Florida International University, Miami, USA.
Additional two hundred questionnaires were distributed to students, staff, and faculty at a
university located in Seoul, Korea. Data for this study was collected from January 12 to
February 20, 2015. Out of the total 400 questionnaires, 43 were deleted due to
incomplete or missing data. Consequently, a total number of 357 usable questionnaires
were collected to be utilized as the study sample. Overall the valid response rate was
approximately 89.3 percent.
Data Analysis Method
First, descriptive statistics were used to compare the media usage on travel
destination selection and examine the demographic information of respondents. Next,
this study performed multivariate analysis of variance (MANOVA) to analyze the data
and test the hypotheses. Data were entered into the Statistical Packages for Social
Sciences (SPSS) 22.0 for data analysis. Assumptions for MANOVA include normal
distribution, linearity, and homogeneity of covariance matrices. The independent
variable was categorical in nature and all dependent variables were continuous. The
assumption of normality was met. Linearity was checked by checking out pairwise
relationships among the dependent variables using scatter plots. The assumption of
homogeneity of covariance matrices was not met. However, this assumption is usually
robust when sample size is relatively large (Hair, Black, Babin, Anderson & Tatham,
2006).

30
Summary
The study was designed based on the literature review. Total eight study
hypotheses were established. A total number of 357 usable samples were collected from
two universities in USA and South Korea. The data were inputted into SPSS and were
analyzed by MANOVA.
31
CHAPTER IV
RESULTS
Introduction
The result chapter covered demographic profile of respondents, comparison of
media types, reliability and validity test, and testing hypotheses. MANOVA was used in
order to test the hypotheses; the different media types as the dependent variables and
demographic factors as the independent variables for the first study hypothesis,
behavioral intentions as the dependent variables and the different media types as the
independent variables for the second study hypothesis. From the multivariate tests, the
variables were found significant. Univariate difference contained the summary tables for
each of the dependent variables. For Post hoc tests, Box’s test of the assumption of
equality of covariance matrices was shown to see whether the assumption of equal
variance and covariance matrices had been met or not. Then, Tamhane’s T2 test was
used for post hoc tests to observe the pairwise difference between the groups. Lastly,
descriptive statistic results that indicated the mean score of the variable groups were
presented.
Sample Profile
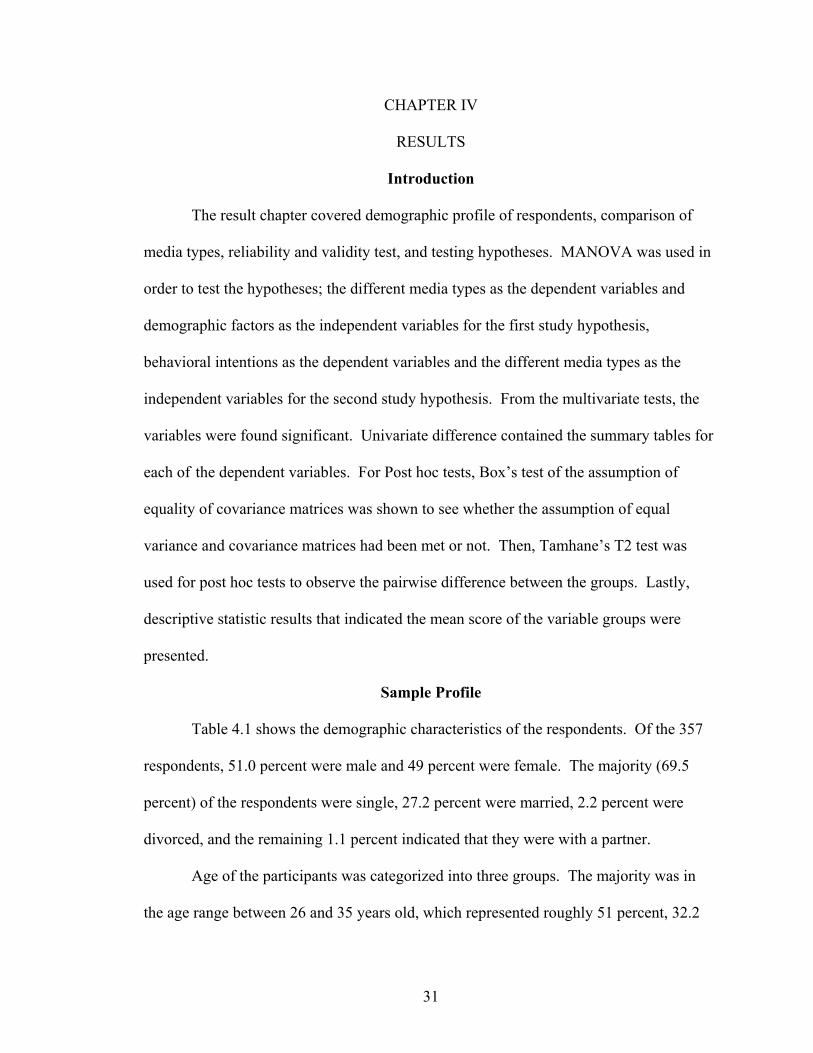
Table 4.1 shows the demographic characteristics of the respondents. Of the 357
respondents, 51.0 percent were male and 49 percent were female. The majority (69.5
percent) of the respondents were single, 27.2 percent were married, 2.2 percent were
divorced, and the remaining 1.1 percent indicated that they were with a partner.
Age of the participants was categorized into three groups. The majority was in
the age range between 26 and 35 years old, which represented roughly 51 percent, 32.2
32
percent were in the age range between 18 and 25 years old. The remaining 16.8 percent
were over 36 years old.
Approximately 29.4 percent had an annual family income of $80,000 to $119,999.
20.7 percent had $39,999 or less, 15.7 percent had between $40.000 and $79,999, 11.8
percent had $120,000 to $159,999, 7.6 percent had between $160,000 and $199,999, and
6.4 percent had $200,000 and over. Approximately 8.4 percent of the respondents
refused to answer their income level.
The ethnicity of the respondents consisted of 68.6 percent Asian, 12.6 percent
Caucasian (Non-Hispanic), 8.1 percent Hispanic, 4.2 percent African American, 3.1
percent mixed race/other, and 2.8 percent American Indian. In terms of nationality, the
respondents were divided into four groups. The majority of the respondents were Korean
(41.5 percent), while 21.8 percent were US citizen, 19.6 percent were Chinese, and 17.1
percent were from other countries. Other countries included Barbados, Belgium, Canada,
Columbia, Cuba, Dominica, France, Germany, Haiti, India, Italia, Jamaica, Japan,
Mexico, Morocco, Pakistan, Panama, Peru, Russia, Taiwan, Trinidad, and Venezuela.
With regard to the education, the majority of all respondents (83.8 percent)
indicated that they earned a bachelor’s degree, 5.9 percent earned a graduate degree
(either master’s or doctorate) 5.3 percent had an associate’s degrees, and 5.1 percent
completed high school.

33
Table 4.1 Demographic Profile of Respondents
Variables N Percentage (%) Gender Male 182 51.0 Female 175 49.0 Total 357 100 Marital Status Single 248 69.5 Married 97 27.2 Divorced 8 2.2 With Partner 4 1.1 Total 357 100 Age 18 – 25 years 115 32.2 26 – 35 years 182 51.0 over 36 years 60 16.8 Total 357 100 Annual Family Income $ 39,999 or less 74 20.7 $ 40,000 - $ 79,999 56 15.7 $ 80,000 - $ 119,999 105 29.4 $ 120,000 - $ 159,999 $ 160,000 - $ 199,999
42 11.827 7.6
$ 200,000 and over 23 6.4 N/A 30 8.4 Total 357 100 Ethnicity Caucasian (Non-Hispanic) 45 12.6 African American/Black 15 4.2 Hispanic 29 8.1 Asian or Pacific Islander 245 68.6 American Indian 10 2.8 Mixed Race/Other 11 3.1 N/A 2 0.6 Total 357 1000
34
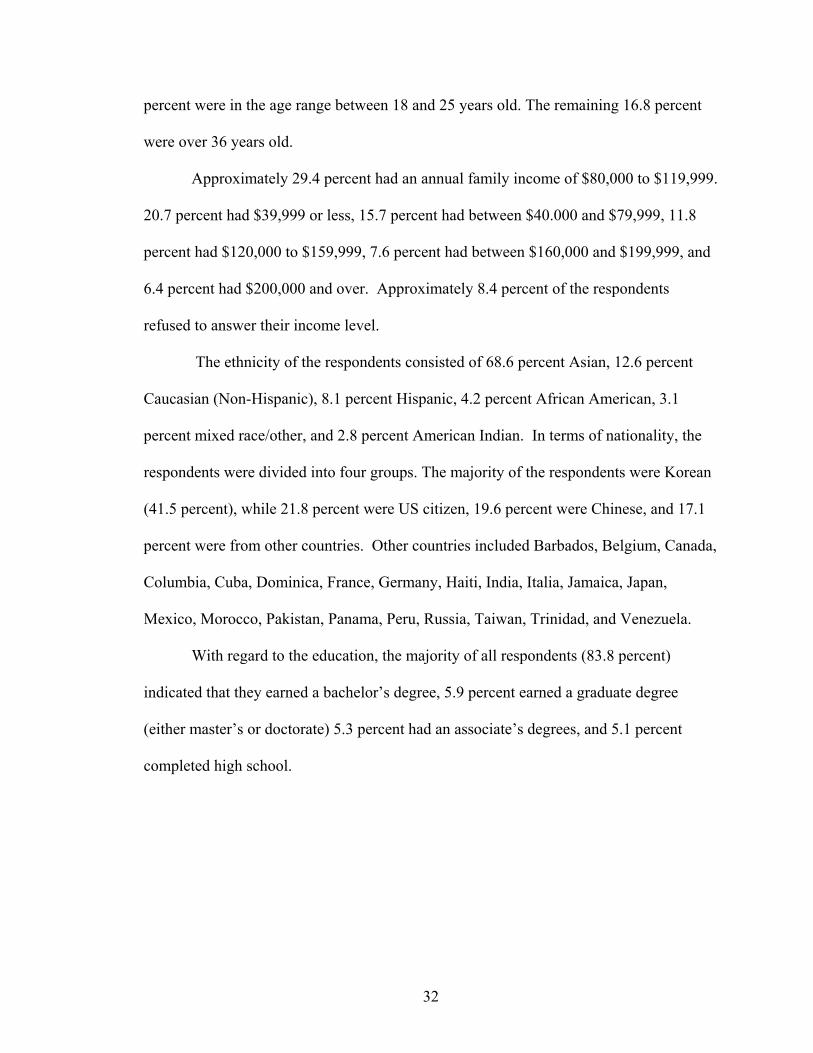
Nationality Korea 148 41.5 China 70 19.6 USA 78 21.8 Other 61 17.1 Total 357 100
Education High school 18 5.1 Associate's Degree 19 5.3 Bachelor's Degree 299 83.8 Master's Degree 14 3.9 Doctoral Degree 7 2.0 Total 357 100
Comparison of Media Type
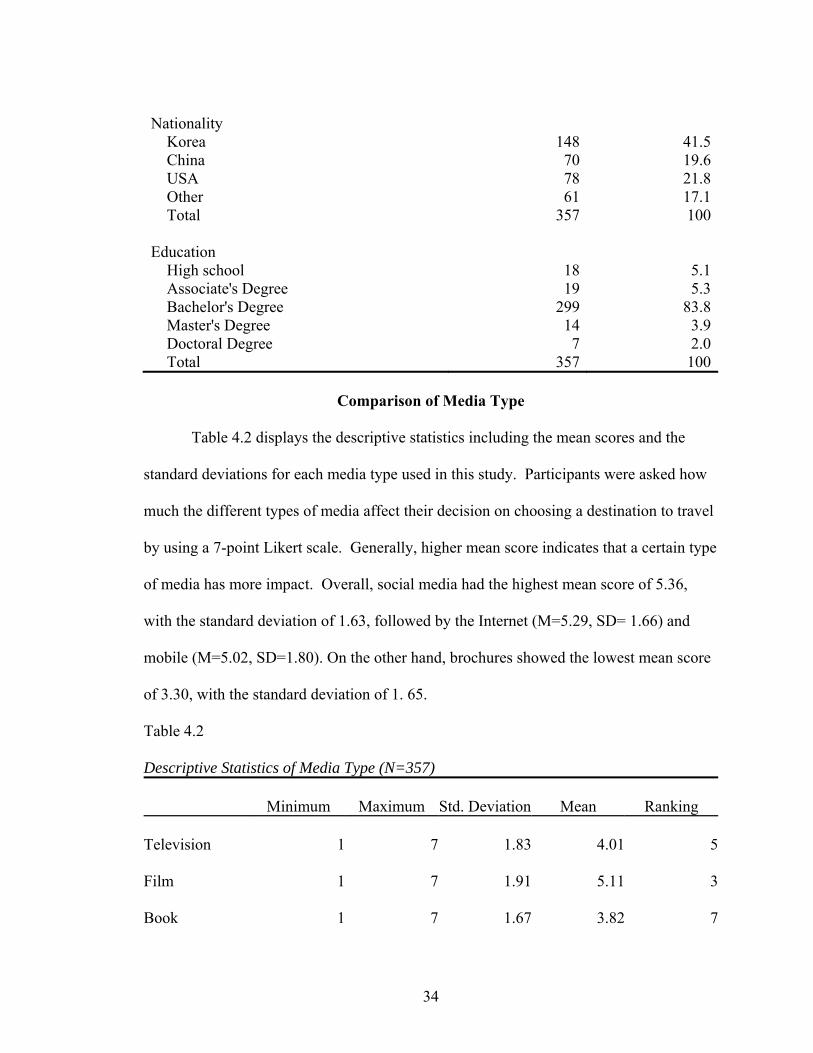
Table 4.2 displays the descriptive statistics including the mean scores and the
standard deviations for each media type used in this study. Participants were asked how
much the different types of media affect their decision on choosing a destination to travel
by using a 7-point Likert scale. Generally, higher mean score indicates that a certain type
of media has more impact. Overall, social media had the highest mean score of 5.36,
with the standard deviation of 1.63, followed by the Internet (M=5.29, SD= 1.66) and
mobile (M=5.02, SD=1.80). On the other hand, brochures showed the lowest mean score
of 3.30, with the standard deviation of 1. 65.
Table 4.2
Descriptive Statistics of Media Type (N=357)
Minimum Maximum Std. Deviation Mean
Ranking Television 1 7 1.83 4.01 5 Film 1 7 1.91 5.11 3 Book 1 7 1.67 3.82 7
35
Magazine 1 7 1.71 3.90 6 Newspaper 1 7 1.74 3.39 8 Brochure 1 7 1.65 3.30 9 Internet 1 7 1.66 5.29 2 Social Media 1 7 1.63 5.36 1 Mobile 1 7 1.80 5.02 4
Reliability and Validity Tests
The reliability in this research was measured by the reliability analysis on SPSS
22.0. Reliability analysis was performed on the three dependent variables used in this
study. According to the literature review, this study computed a total number of three
dependent variables to measure traveling behavioral intention. The three behavioral
intention variables were created by computing mean scores for each related content. For
example, “word-of-mouth” was created by computing the mean score of 1) say positive
things about the destination to my relatives and close friends and 2) willing to
recommend the destination to my relatives and close friends. “Revisit intention” was
created by computing the mean scores of 1) willing to do further visitation of the
destination in the future, 2) continue to visit the destination in the future, 3) consider the
destination as my first choice for traveling. Finally “willingness to pay more” was
created by computing the mean score of 1) visit the destination even if the cost was
higher than other destinations and 2) willing to spend more money for the destination
even if the price increased.
36
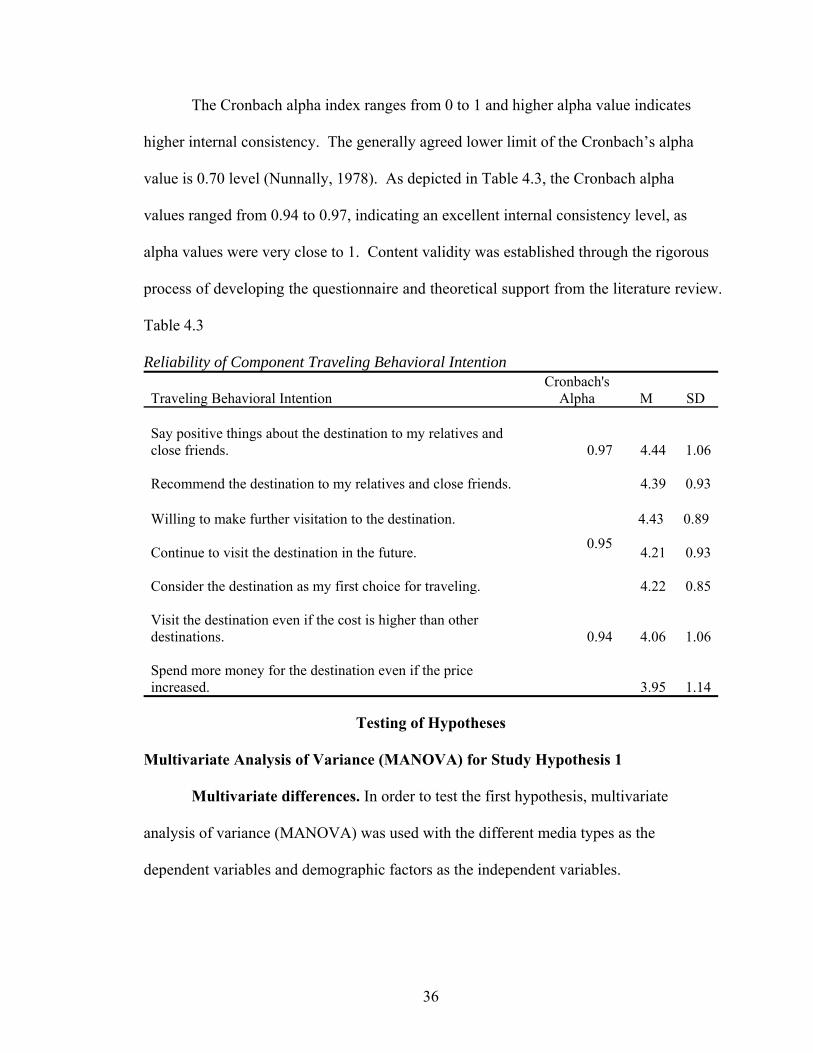
The Cronbach alpha index ranges from 0 to 1 and higher alpha value indicates
higher internal consistency. The generally agreed lower limit of the Cronbach’s alpha
value is 0.70 level (Nunnally, 1978). As depicted in Table 4.3, the Cronbach alpha
values ranged from 0.94 to 0.97, indicating an excellent internal consistency level, as
alpha values were very close to 1. Content validity was established through the rigorous
process of developing the questionnaire and theoretical support from the literature review.
Table 4.3
Reliability of Component Traveling Behavioral Intention Traveling Behavioral Intention
Cronbach's Alpha M SD
Say positive things about the destination to my relatives and close friends. 0.97 4.44 1.06 Recommend the destination to my relatives and close friends. 4.39 0.93 Willing to make further visitation to the destination.
0.95
4.43 0.89 Continue to visit the destination in the future. 4.21 0.93 Consider the destination as my first choice for traveling. 4.22 0.85 Visit the destination even if the cost is higher than other destinations. 0.94
4.06 1.06
Spend more money for the destination even if the price increased. 3.95 1.14
Testing of Hypotheses
Multivariate Analysis of Variance (MANOVA) for Study Hypothesis 1
Multivariate differences. In order to test the first hypothesis, multivariate
analysis of variance (MANOVA) was used with the different media types as the
dependent variables and demographic factors as the independent variables.

37
H1: Demographic factors have a significant impact on the media types for
choosing a travel destination.
H1a: Gender has a significant impact on the media types for choosing a travel
destination.
H1b: Age has a significant impact on the media types for choosing a travel
destination.
H1c: Nationality has a significant impact on the media types for choosing a travel
destination.
Multivariate tests. As shown in Table 4.4, three demographic factors were
significantly different (gender, Wilks’ λ=0.95, F = 1.96, p <0.05; age, Wilks’ λ=0.86,
F=2.76, p <0.05; nationality, Wilks’ λ=0.80, F=2.80, p <0.05) on the media types.
Table 4.4
Multivariate Tests for Demographic
Effect Wilks' Lambda F Sig. Partial Eta Squared
Gender 0.94 1.96 0.04* 0.05 Age 0.86 2.76 0.00* 0.07 Nationality 0.80 2.80 0.00* 0.07
Note. * p <0.05.
Univariate differences. Given the significance of the overall test, follow-up
ANOVA tests were examined. Significant univariate main effects for demographic
factors were obtained for the nine types of media. The different media types were
influenced by three demographic factors on all three dimensions. For gender, television
(F=6.32, p < 0.05, partial η² =0.02) and magazine (F=6.49, p <0.05, partial η² =0.02)
were significant. For age, television (F=4.33, p <0.05, partial η² =0.03), film (F=3.42, p

38
<0.05, partial η² =0.02), magazine (F=5.92, p <0.05, partial η² =0.03), newspaper
(F=10.73, p <0.05, partial η² =0.03), and brochure (F=7.24, p < 0.05, partial η² =0.04)
were significant. For nationality, film (F=4.43, p <0.05, partial η² =0.04), magazine
(F=2.84, p <0.05, partial η² =0.03), brochure (F=5.58, p <0.05, partial η² =0.05), and
mobile (F=7.04, p <0.05, partial η² =0.06) were significant. Overall, H1a, H1b, and H1c
were all supported (see Table 4.5).
Table 4.5
Univariate Main Effect for Demographic
Source
Dependent Variable F Sig. Partial Eta Squared
Gender Television 6.32 0.01* 0.02
Magazine 6.49 0.01*
0.02
Age Television 5.78 0.00* 0.03
Film 22.91 0.00* 0.12
Newspaper 13.46 0.00* 0.07
Brochure 4.38 0.01* 0.02
Internet 12.37 0.00* 0.07
Social Media 10.66 0.00* 0.06
Mobile
7.78 0.00*
0.04
Nationality Film 13.24 0.00* 0.10
Brochure 4.32 0.00* 0.04
Internet 3.13 0.02* 0.03
Social Media 4.28 0.00* 0.04
Mobile 12.06 0.00* 0.09Note. * p <0.05.
Table 4.6 shows the descriptive results of gender. The mean score of male was
significantly different from female for television and magazines. Females (M = 4.70)
showed higher mean scores than males (M=3.94) for television. Similarly, mean score of

39
females (M=4.25) was higher than males (M = 3.50) for magazines. This indicates
females are more influenced by television and magazines than males.
Table 4.6
Descriptive Statistics for Gender
Dependent Variable Gender Mean Std. Error
Television Male 3.94 0.22
Female 4.70 0.18
Magazine Male 3.50 0.21
Female 4.25 0.17
Post hoc tests. As can be seen in Table 4.7, the results show the Box’s test of
equality of covariance matrices. The assumption of equal variance and covariance
matrices has not been met (p <0.05, see Table 6). Thus, Tamhane’s T2 test was used for
post hoc tests to observe the pairwise difference between age groups and nationality.
Table 4.7
Test of Equality of Covariance
Note. * p <0.05.
Table 4.8 shows the result of the post hoc test for age groups. Statistically
significant differences were observed for television, film, newspaper, brochure, Internet,
social media, and mobile. There were no differences for book and magazine between
each age group.
Box's Test of Equality of Covariance Matrices
Box's M 323.71
F 1.77
Sig. 0.00*
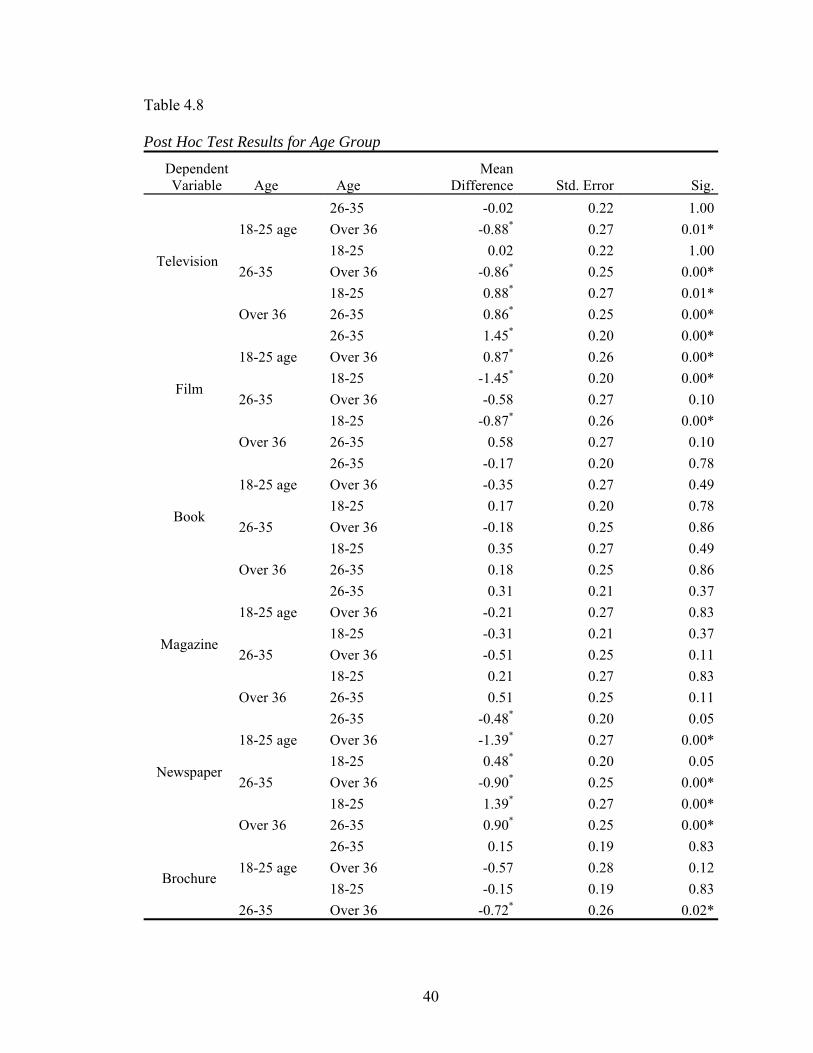
40
Table 4.8
Post Hoc Test Results for Age Group
Dependent Variable Age Age
Mean Difference Std. Error Sig.
Television
18-25 age
26-35 -0.02 0.22 1.00
Over 36 -0.88* 0.27 0.01*
26-35
18-25 0.02 0.22 1.00
Over 36 -0.86* 0.25 0.00*
Over 36
18-25 0.88* 0.27 0.01*
26-35 0.86* 0.25 0.00*
Film
18-25 age
26-35 1.45* 0.20 0.00*
Over 36 0.87* 0.26 0.00*
26-35
18-25 -1.45* 0.20 0.00*
Over 36 -0.58 0.27 0.10
Over 36
18-25 -0.87* 0.26 0.00*
26-35 0.58 0.27 0.10
Book
18-25 age
26-35 -0.17 0.20 0.78
Over 36 -0.35 0.27 0.49
26-35
18-25 0.17 0.20 0.78
Over 36 -0.18 0.25 0.86
Over 36
18-25 0.35 0.27 0.49
26-35 0.18 0.25 0.86
Magazine
18-25 age
26-35 0.31 0.21 0.37
Over 36 -0.21 0.27 0.83
26-35
18-25 -0.31 0.21 0.37
Over 36 -0.51 0.25 0.11
Over 36
18-25 0.21 0.27 0.83
26-35 0.51 0.25 0.11
Newspaper
18-25 age
26-35 -0.48* 0.20 0.05
Over 36 -1.39* 0.27 0.00*
26-35
18-25 0.48* 0.20 0.05
Over 36 -0.90* 0.25 0.00*
Over 36
18-25 1.39* 0.27 0.00*
26-35 0.90* 0.25 0.00*
Brochure 18-25 age
26-35 0.15 0.19 0.83
Over 36 -0.57 0.28 0.12
26-35
18-25 -0.15 0.19 0.83
Over 36 -0.72* 0.26 0.02*

41
Over 36
18-25 0.57 0.28 0.12
26-35 0.72* 0.26 0.02*
Internet
18-25 age
26-35 0.26 0.17 0.34
Over 36 1.25* 0.31 0.00*
26-35
18-25 -0.26 0.17 0.34
Over 36 0.99* 0.31 0.01*
Over 36
18-25 -1.25* 0.31 0.00*
26-35 -0.99* 0.31 0.01*
Social Media
18-25 age
26-35 0.18 0.17 0.65
Over 36 1.13* 0.31 0.00*
26-35
18-25 -0.18 0.17 0.65
Over 36 0.95* 0.31 0.01*
Over 36
18-25 -1.13* 0.31 0.00*
26-35 -0.95* 0.31 0.01*
Mobile
18-25 age
26-35 -0.48 0.20 0.05
Over 36 0.51 0.33 0.33
26-35
18-25 0.48 0.20 0.05
Over 36 0.99* 0.31 0.01*
Over 36
18-25 -0.51 0.33 0.33
26-35 -0.99* 0.31 0.01*Note. * p <0.05
Table 4.9 describes the descriptive statistics for the significant media types. For
television, the mean score of the age group of 36 years old and older (M=5.01) was
significantly different from the age group 18-25 years old (M=4.06) and the age group
26-35 year old (M=4.07). People who are older than 36 years old were influenced by
television more than people who were younger than 36 years old. There was no
difference between the 18-25 years and 26-35 years old group.
For film, the mean score of the age group 18-25 years old (M=5.62) was
significantly different from the age group 26-35 years old (M=4.98), and 36 years old and
older (M=5.42). People who are between 18 and 25 years old are influenced more by
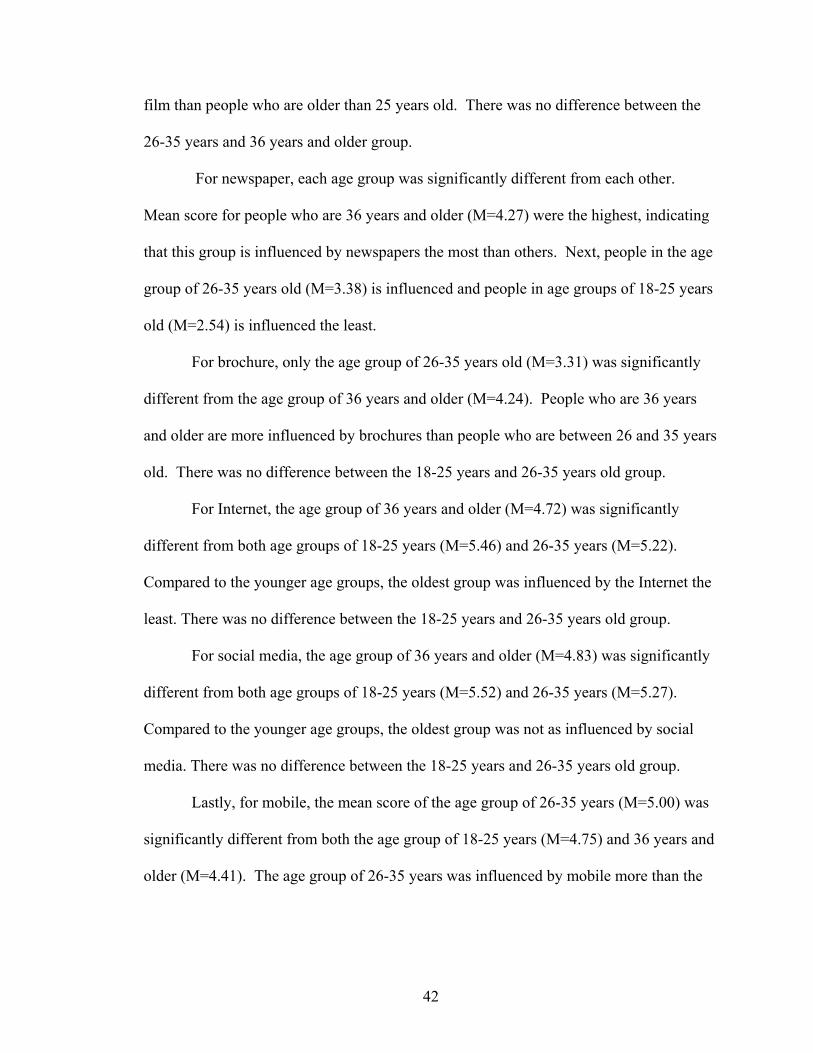
42
film than people who are older than 25 years old. There was no difference between the
26-35 years and 36 years and older group.
For newspaper, each age group was significantly different from each other.
Mean score for people who are 36 years and older (M=4.27) were the highest, indicating
that this group is influenced by newspapers the most than others. Next, people in the age
group of 26-35 years old (M=3.38) is influenced and people in age groups of 18-25 years
old (M=2.54) is influenced the least.
For brochure, only the age group of 26-35 years old (M=3.31) was significantly
different from the age group of 36 years and older (M=4.24). People who are 36 years
and older are more influenced by brochures than people who are between 26 and 35 years
old. There was no difference between the 18-25 years and 26-35 years old group.
For Internet, the age group of 36 years and older (M=4.72) was significantly
different from both age groups of 18-25 years (M=5.46) and 26-35 years (M=5.22).
Compared to the younger age groups, the oldest group was influenced by the Internet the
least. There was no difference between the 18-25 years and 26-35 years old group.
For social media, the age group of 36 years and older (M=4.83) was significantly
different from both age groups of 18-25 years (M=5.52) and 26-35 years (M=5.27).
Compared to the younger age groups, the oldest group was not as influenced by social
media. There was no difference between the 18-25 years and 26-35 years old group.
Lastly, for mobile, the mean score of the age group of 26-35 years (M=5.00) was
significantly different from both the age group of 18-25 years (M=4.75) and 36 years and
older (M=4.41). The age group of 26-35 years was influenced by mobile more than the

43
two age groups. There was no difference between the 18-25 years and 36 years and older
group.
Table 4.9
Descriptive Statistics for Age Group
Dependent Variable Age Mean Std. Error
Television
18-25 4.06 0.25
26-35 4.07 0.23
Over 36 5.01 0.27
Film
18-25 5.62 0.25
26-35 4.98 0.22
Over 36 5.42 0.27
Newspaper
18-25 2.54 0.24
26-35 3.38 0.21
Over 36 4.27 0.26
Brochure
18-25 3.04 0.23
26-35 3.31 0.20
Over 36 4.24 0.25
Internet
18-25 5.46 0.22 26-35 5.22 0.20
Over 36 4.72 0.24
Social Media
18-25 5.52 0.21
26-35 5.27 0.19
Over 36 4.83 0.23
Mobile
18-25 4.75 0.23
26-35 5.00 0.21 Over 36 4.41 0.25
Table 4.10 depicts the results of follow-up post hoc tests to examine the pairwise
difference between nationalities. Statistically significant differences were discovered
among film, brochure, Internet, social media, and mobile. There were no pairwise
difference for television, book, magazine, and newspaper.

44
Table 4.10
Post Hoc Test Results for Nationality
Dependent
Variable Nationality Nationality
Mean
Difference Std. Error0 Sig.
TV
Korea
China 0.38 0.27 0.64
USA 0.07 0.24 1.00
Other -0.19 0.30 0.99
China
Korea -0.38 0.27 0.64
USA -0.31 0.30 0.87
Other -0.58 0.34 0.44
USA
Korea -0.07 0.24 1.00
China 0.31 0.30 0.87
Other -0.26 0.32 0.96
Other
Korea 0.19 0.30 0.99
China 0.58 0.34 0.44
USA 0.26 0.32 0.96
Film
Korea
China -1.59* 0.21 0.00*
USA -0.87* 0.27 0.01*
Other -0.86* 0.30 0.03*
China
Korea 1.59* 0.21 0.00*
USA 0.72* 0.24 0.02*
Other 0.73 0.28 0.06
USA
Korea 0.87* 0.27 0.01*
China -0.72* 0.24 0.02*
Other 0.01 0.32 1.00
Other
Korea 0.86* 0.30 0.03*
China -0.73 0.28 0.06
USA -0.01 0.32 1.00
Book
Korea
China -0.07 0.24 1.00
USA 0.15 0.25 0.99
Other 0.29 0.25 0.81
China
Korea 0.07 0.24 1.00
USA 0.23 0.30 0.97
Other 0.37 0.30 0.78
USA
Korea -0.15 0.25 0.99
China -0.23 0.30 0.97
Other 0.14 0.30 1.00
Other Korea -0.29 0.25 0.81

45
China -0.37 0.30 0.78
USA -0.14 0.30 1.00
Magazine
Korea
China -0.62 0.24 0.05
USA -0.30 0.24 0.78
Other -0.24 0.27 0.94
China
Korea 0.62 0.24 0.05
USA 0.33 0.28 0.82
Other 0.38 0.30 0.76
USA
Korea 0.30 0.24 0.78
China -0.33 0.28 0.82
Other 0.06 0.31 1.00
Other
Korea 0.24 0.27 0.94
China -0.38 0.30 0.76
USA -0.06 0.31 1.00
Newspaper
Korea
China 0.60 0.23 0.06
USA 0.00 0.27 1.00
Other 0.10 0.26 1.00
China
Korea -0.60 0.23 0.06
USA -0.60 0.30 0.24
Other -0.50 0.28 0.40
USA
Korea 0.00 0.27 1.00
China 0.60 0.29 0.24
Other 0.10 0.31 1.00
Other
Korea -0.10 0.26 1.00
China 0.50 0.28 0.40
USA -0.10 0.31 1.00
Brochure
Korea
China -0.05 0.21 1.00
USA -0.70* 0.24 0.02*
Other -0.57 0.26 0.18
China
Korea 0.05 0.21 1.00
USA -0.66 0.26 0.07
Other -0.52 0.28 0.33
USA
Korea 0.70* 0.24 0.02*
China 0.66 0.26 0.07
Other 0.14 0.30 1.00
Other
Korea 0.57 0.26 0.18
China 0.52 0.28 0.33
USA -0.14 0.30 1.00
Internet Korea China -0.21 0.20 0.89

46
USA 0.57 0.27 0.18
Other 0.10 0.25 1.00
China
Korea 0.21 0.20 0.89
USA 0.78* 0.29 0.04*
Other 0.30 0.27 0.85
USA
Korea -0.57 0.27 0.18
China -0.78* 0.29 0.04*
Other -0.47 0.32 0.61
Other
Korea -0.10 0.25 1.00
China -0.30 0.27 0.85
USA 0.47 0.32 0.61
Social Media
Korea
China -0.03 0.20 1.00
USA 0.75* 0.26 0.03*
Other 0.27 0.25 0.86
China
Korea 0.03 0.20 1.00
USA 0.78* 0.29 0.04*
Other 0.30 0.27 0.85
USA
Korea -0.75* 0.26 0.03*
China -0.78* 0.29 0.04*
Other -0.47 0.32 0.61
Other
Korea -0.27 0.25 0.86
China -0.30 0.27 0.85
USA 0.47 0.32 0.61
Mobile
Korea
China 0.68* 0.23 0.02*
USA 1.42* 0.27 0.00*
Other 0.77* 0.26 0.02*
China
Korea -0.68* 0.23 0.02*
USA 0.73 0.32 0.13
Other 0.09 0.31 1.00
USA
Korea -1.42* 0.27 0.00*
China -0.73 0.32 0.13
Other -0.64 0.34 0.33
Other
Korea -0.77* 0.26 0.02*
China -0.09 0.31 1.00
USA 0.64 0.34 0.33Note. * p <0.05.
Table 4.11 shows the descriptive results for the significant media types. For film,
the mean score of Korea (M=4.50) was significantly different from China (M=6.09),

47
USA (M=5.49), and Others (M=5.51). People from China, USA and other countries
were more influenced by film than people from Korea. There was no difference between
China, USA, and other countries.
For brochure, only Korea (M=2.67) was significantly different from USA
(M=3.70). People from USA were more influenced by brochures than people from Korea.
There was no difference between people from China, USA, and other countries.
For Internet, USA (M=4.80) was significantly different from both Korea (M=5.08)
and China (M=5.51). People from Korea and China were more influenced by the Internet
than people from USA. There was no difference between people from Korea, China, and
other countries.
For social media, the mean score of USA (M=4.80) was significantly different
from both Korea (M=5.34) and China (M=5.51). People from Korea and China were
more influenced by social media than people from USA. There was no difference
between people from Korea, China, and other countries.
Lastly, for mobile, the mean score of Korea (M=5.38) was significantly different
from all groups: China (M=5.04), USA (M=3.91), and Other (M=4.76). People from
Korea were more influenced by mobile than people from China, USA, and other
countries. In addition, China (M=5.04) was significantly different from USA (M=3.91).
People from China were more influenced by mobile than people from USA. There was
no difference between people from other countries and China and USA.

48
Table 4.11
Descriptive Statistics for Nationality
Dependent Variable Nationality Mean Std. Error
Film
Korea 4.50 0.29China 6.09 0.39USA 5.49 0.21Other 5.51 0.28
Brochure
Korea 2.67 0.26China 3.35 0.35USA 3.70 0.20Other 4.09 0.25
Internet
Korea 5.08 0.25China 5.51 0.34USA 4.80 0.19Other 5.41 0.24
Social Media
Korea 5.34 0.25China 5.51 0.33USA 4.80 0.18Other 5.41 0.24
Mobile
Korea 5.38 0.27China 5.04 0.36USA 3.91 0.20Other 4.76 0.26
Multivariate Analysis of Variance (MANOVA) for Study Hypothesis 2
Multivariate differences. In order to test the second study hypothesis,
multivariate analysis of variance (MANOVA) was used with behavioral intention as the
dependent variables and media type as the independent variable.
H2: The type of media has a significant impact on tourists’ behavioral intention.
H2a: The type of media has a significant impact on tourists’ word-of-mouth.
H2b: The type of media has a significant impact on tourists’ revisit intention.
H2c: The type of media has a significant impact on tourists’ willingness to pay
more.

49
Multivariate Tests. The overall MANOVA tests of Pillai’s and Wilks’ Lambda
were all significant (p <0.05). Media type had a statistically significant effect on the
combined travel behavioral intention DVs, (Wilks’ λ =0.71, F=48.74, p <0.05, partial η²
=0.11), indicating that overall, H2 was supported. The results of the multivariate test
results are presented in Table 4.12.
Table 4.12
Multivariate Tests for Behavioral Intention
Wilks' Lambda F Sig.
Partial Eta Squared
Wilks' Lambda 0.71 48.74 0.00* 0.11
Note. * p <0.05.
Univariate differences. Given the significance of the overall test, follow-up
ANOVAs were examined. Significant univariate main effects for media types were
obtained for word-of-mouth, revisit intention, and willingness to pay more. Travel
behavioral intention was influenced by media types on all three dimensions: word-of-
mouth (F=44.96, p <0.05, partial η² =0.10); revisit intention (F= 95.96, p <0.05, partial
η²=0.19); and willingness to pay more (F=48.30, p <0.05, partial η² =0.11). Thus, H2a,
H2b, and H2c were all supported.
Table 4.13
Univariate Main Effect for Behavioral Intention Dependent Variable F Sig.
Partial Eta Squared
Word-of-mouth 44.96 0.00* 0.10 Revisit intention 95.96 0.00* 0.19 Willingness to pay more 48.30 0.00* 0.11
Note. * p <0.05.

50
Post hoc tests. According to the Box’s test of equality of covariance matrices,
the assumption of equal variance and covariance matrices has not been met (p <0.05, see
Table 4.14). Thus, Tamhane’s T2 test was performed for post hoc tests to observe the
pairwise difference.
Table 4.14
Test of Equality of Covariance
Note. * p <0.05.
Table 4.15 summarize the results of the post hoc tests for word-of-mouth as the
dependent variable. Overall significant differences were observed for word-of-mouth
between all nine types of media except between television and Internet, mobile; film and
magazine; book and magazine, newspaper, brochure; brochure and magazine, newspaper;
Internet and social media, mobile; social media and mobile.
Table 4.15
Post Hoc Tests Results for Word-of-Mouth
Tele
visi
on
Fil
m
Boo
k
Mag
azin
e
New
spap
er
Bro
chur
e
Inte
rnet
Soc
ial
Med
ia
Mob
ile
Television
0.00* (0.51)
0.00* (1.00)
0.00* (0.80)
0.00* (1.19)
0.00* (1.01)
0.60 (-0.29)
0.01* (-0.46)
1.00 (-0.14)
Film 0.00*
(-0.51) 0.01* (0.49)
0.70 (0.28)
0.00* (0.68)
0.01* (0.49)
0.00* (-0.80)
0.00* (-0.97)
0.00* (-0.66)
Book 0.00*
(-1.00) 0.01*
(-0.49) 1.00
(-0.20) 1.00
(0.19) 1.00
(0.01) 0.00*
(-1.29) 0.00*
(-1.46) 0.00*
(-1.14)
Magazine 0.00*
(-0.80) 0.70
(-0.28) 1.00
(0.20) 0.13
(0.40) 1.00
(0.20) 0.00*
(-1.09) 0.00*
(-1.25) 0.00*
(-0.94)
Box's Test of Equality of Covariance Matrices
Box's M 536.51
F 12.73
Sig. 0.00*

51
Newspaper
0.00* (-1.20)
0.00* (-0.68)
1.00 (-0.20)
0.13 (-0.40)
1.00 (-0.19)
0.00* (-1.48)
0.00* (-1.65)
0.00* (-1.33)
Brochure 0.00*
(-1.00) 0.01*
(-0.49) 1.00
(-0.01) 1.00
(-0.21) 1.00
(0.19) 0.00*
(-1.29) 0.00*
(-1.46) 0.00*
(-1.15)
Internet 0.60
(0.29) 0.00* (0.80)
0.00* (1.29)
0.00* (1.09)
0.00* (1.48)
0.00* (1.29)
1.00 (-0.17)
1.00 (0.15)
Social Media
0.01* (0.46)
0.00* (0.97)
0.00* (1.46)
0.00* (1.25)
0.00* (1.65)
0.00* (1.46)
1.00 (0.17)
0.48 (0.31)
Mobile 1.00
(0.14) 0.00* (0.66)
0.00* (1.14)
0.00* (0.94)
0.00* (1.33)
0.00* (1.15)
1.00 (-0.15)
0.48 (-0.31)
Note. * p < 0.05.
Table 4.16 shows the descriptive results. The mean score of television (M=4.61)
was significantly different from film (M=4.10), book (M=3.61), magazine (M=3.82),
newspaper (M=3.42), brochure (M=3.61), and social media (M=5.07). Television and
social media were more influenced by word-of-mouth than film, book, magazine,
newspaper, and brochure. However, the mean scores between television (M=4.61) and
Internet (M=4.90), and mobile (M=4.75) were not different.
For film, the mean score (M=4.10) was significantly different from book
(M=3.61), newspaper (M=3.42), brochure (M=3.61), Internet (M=4.90), social media
(M=5.07), and mobile (M=4.75). Word-of-mouth was more influenced by the Internet,
social media, and mobile than film, book, newspaper, and brochure. There was no
difference between film and magazine.
Continually, the mean score of book (M=3.61) was significantly different from
Internet (M=4.90), social media (M=5.07), and mobile (M=4.75). Word-of-mouth was
more influenced by Internet, social media, and mobile than book. However, there were
no differences between book and magazine, newspaper, and brochure.
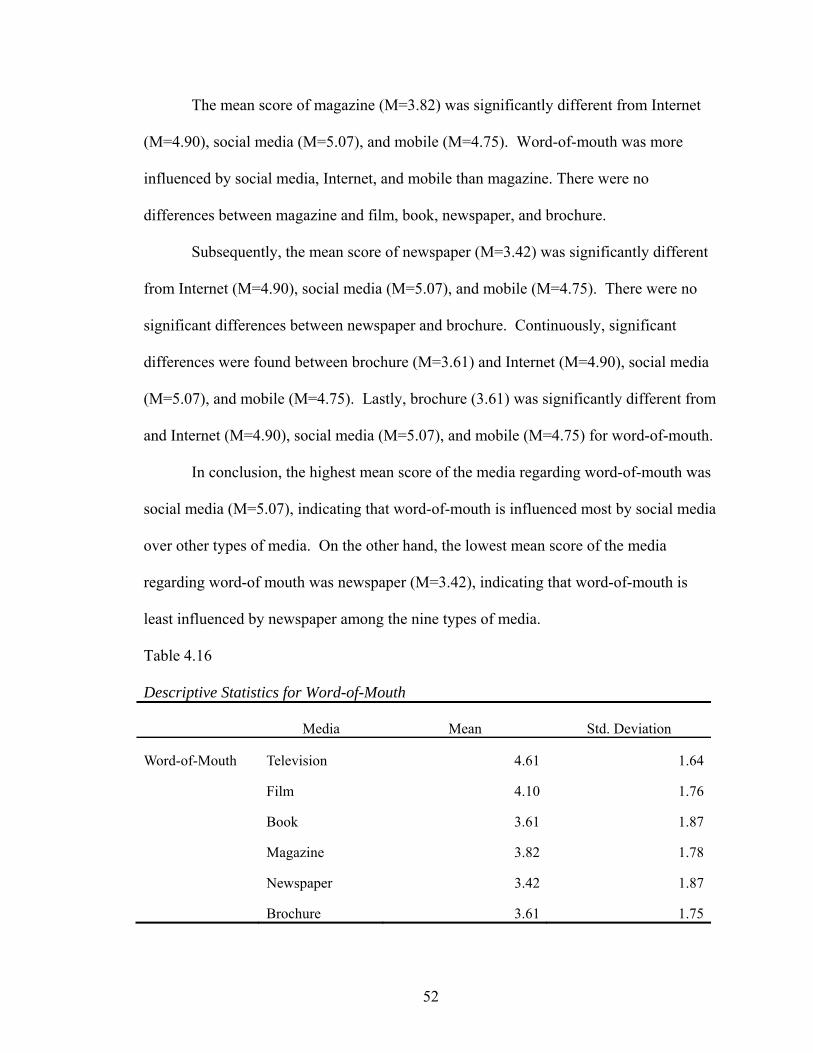
52
The mean score of magazine (M=3.82) was significantly different from Internet
(M=4.90), social media (M=5.07), and mobile (M=4.75). Word-of-mouth was more
influenced by social media, Internet, and mobile than magazine. There were no
differences between magazine and film, book, newspaper, and brochure.
Subsequently, the mean score of newspaper (M=3.42) was significantly different
from Internet (M=4.90), social media (M=5.07), and mobile (M=4.75). There were no
significant differences between newspaper and brochure. Continuously, significant
differences were found between brochure (M=3.61) and Internet (M=4.90), social media
(M=5.07), and mobile (M=4.75). Lastly, brochure (3.61) was significantly different from
and Internet (M=4.90), social media (M=5.07), and mobile (M=4.75) for word-of-mouth.
In conclusion, the highest mean score of the media regarding word-of-mouth was
social media (M=5.07), indicating that word-of-mouth is influenced most by social media
over other types of media. On the other hand, the lowest mean score of the media
regarding word-of mouth was newspaper (M=3.42), indicating that word-of-mouth is
least influenced by newspaper among the nine types of media.
Table 4.16
Descriptive Statistics for Word-of-Mouth
Media
Mean Std. Deviation
Word-of-Mouth Television 4.61 1.64
Film 4.10 1.76
Book 3.61 1.87
Magazine 3.82 1.78
Newspaper 3.42 1.87
Brochure 3.61 1.75

53
Internet 4.90 1.77
Social Media 5.07 1.67
Mobile 4.75 1.87
Total 4.21 1.87
Table 4.17 depicts the results of follow-up post hoc tests to examine the pairwise
difference for revisit intention. Significant differences were observed for revisit intention
except for the following: television and magazine; film and social media; book and
newspaper, brochure; newspaper and brochure; Internet and social media, mobile.
Table 4.17
Post Hoc Tests for Revisit Intention
Tele
visi
on
Fil
m
Boo
k
Mag
azin
e
New
spap
er
Bro
chur
e
Inte
rnet
Soc
ial
Med
ia
Mob
ile
Television
0.00* (-1.29)
0.00* (0.65)
1.00 (0.06)
0.00* (0.72)
0.00* (0.72)
0.00* (-0.96)
0.00* (-1.06)
0.00* (-0.62)
Film 0.00* (1.29)
0.00* (1.93)
0.00* (1.35)
0.00* (2.00)
0.00* (2.00)
0.00* (0.33)
0.34 (0.22)
0.00* (0.66)
Book 0.00*
(-0.65) 0.00*
(-1.93) 0.00*
(-0.58) 1.00
(0.07) 1.00
(0.07) 0.00*
(-1.61) 0.00*
(-1.71) 0.00*
(-1.27)
Magazine 1.00
(-0.06) 0.00*
(-1.35) 0.00* (0.58)
0.00* (0.65)
0.00* (0.66)
0.00* (-1.02)
0.00* (-1.13)
0.00* (-0.69)
Newspaper
0.00* (-0.72)
0.00* (-2.00)
1.00 (-0.07)
0.00* (-0.65)
1.00 (0.00)
0.00* (-1.68)
0.00* (-1.78)
0.00* (-1.34)
Brochure 0.00*
(-0.72) 0.00*
(-2.00) 1.00
(-0.07) 0.00*
(-0.66) 1.00
(0.00) 0.00*
(-1.68) 0.00*
(-1.78) 0.00*
(-1.34)
Internet 0.00* (0.96)
0.00* (-0.33)
0.00* (1.61)
0.00* (1.02)
0.00* (1.68)
0.00* (1.68)
1.00 (-0.10)
0.17 (0.34)
Social Media
0.00* (1.06)
0.34 (-0.22)
0.00* (1.71)
0.00* (1.13)
0.00* (1.78)
0.00* (1.78)
1.00 (0.10)
0.03* (0.44)
Mobile 0.00* (0.62)
0.00* (-0.66)
0.00* (1.27)
0.00* (0.69)
0.00* (1.34)
0.00* (1.34)
0.17 (-0.34)
0.03* (-0.44)
Note. * p <0.05.

54
Table 4.18 shows the descriptive results considering revisit intention. For revisit
intention, the mean score of television (M=4.61) was significantly different from film
(M=4.10), book (M=3.61), newspaper (M=3.42), brochure (M=3.61), Internet (M=4.90),
social media (M=5.07), and mobile (M=4.75). However, There was no difference
between television and magazine.
For film (M=4.10), significance difference was observed between book (M=3.61),
magazine (M=3.82), newspaper (M=3.42), brochure (M=3.61), Internet (M=4.90), and
mobile (M=4.75). However, film was not significantly different from social media.
Continuously, book (M=3.61) was significantly different from magazine (M=3.82),
Internet (M=4.90), social media (M=5.07), and mobile (M=4.75). However, there was no
significant difference between book and newspaper, and brochure.
The mean score of magazine (M=3.82) was significantly different from Internet
(M=4.90), social media (M=5.07), and mobile (M=4.75). The mean score of newspaper
(M=3.42) was significant different from Internet (M=4.90), social media (M=5.07), and
mobile (M=4.75) as well. However, there was no significant difference observed
between newspaper and brochure. The mean score of brochure (M=3.61) was significant
different from Internet (M=4.90), social media (M=5.07), and mobile (M=4.75). The
mean score of Internet (M=4.90) was not significantly different from social media
(M=5.07), and mobile (M=4.75). Lastly, significant difference was found between social
media (M=5.07) and mobile (M=4.75).
In conclusion, the highest mean score of the media regarding revisit intention was
film (M=5.33), indicating that revisit intention is most influenced by film over other
types of media. On the other hand, the lowest mean score of the media regarding revisit
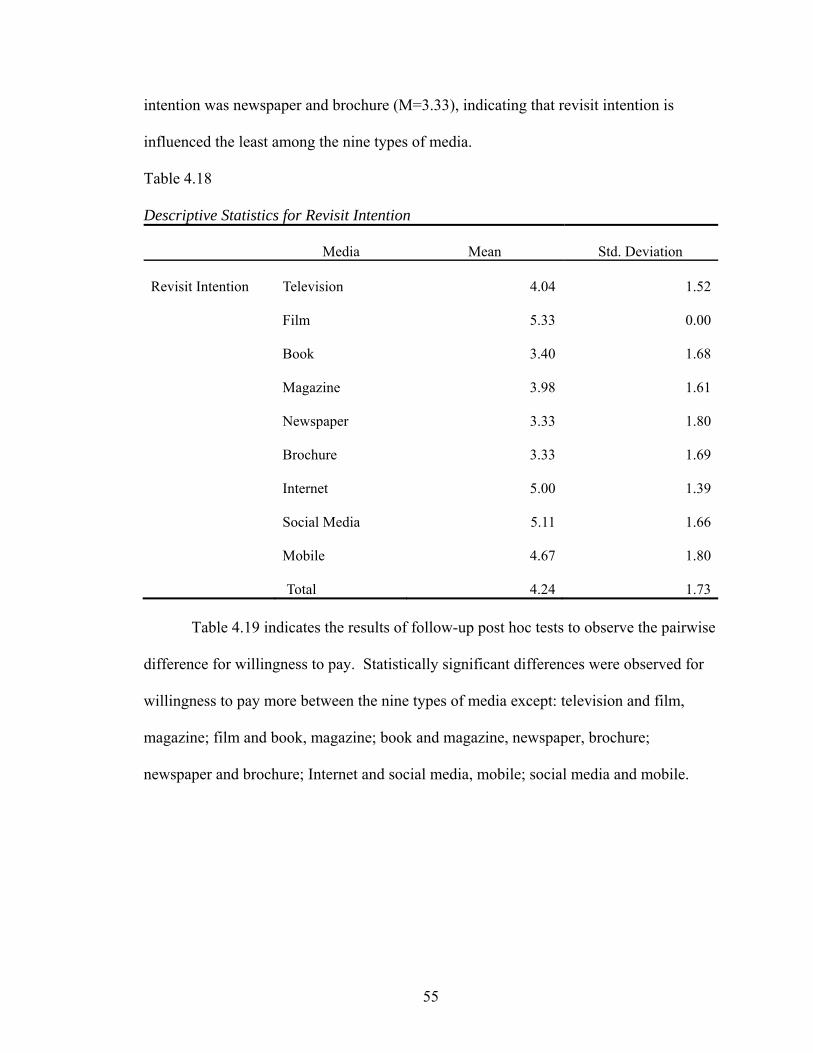
55
intention was newspaper and brochure (M=3.33), indicating that revisit intention is
influenced the least among the nine types of media.
Table 4.18
Descriptive Statistics for Revisit Intention
Media
Mean Std. Deviation
Revisit Intention Television 4.04 1.52
Film 5.33 0.00
Book 3.40 1.68
Magazine 3.98 1.61
Newspaper 3.33 1.80
Brochure 3.33 1.69
Internet 5.00 1.39
Social Media 5.11 1.66
Mobile 4.67 1.80
Total 4.24 1.73
Table 4.19 indicates the results of follow-up post hoc tests to observe the pairwise
difference for willingness to pay. Statistically significant differences were observed for
willingness to pay more between the nine types of media except: television and film,
magazine; film and book, magazine; book and magazine, newspaper, brochure;
newspaper and brochure; Internet and social media, mobile; social media and mobile.
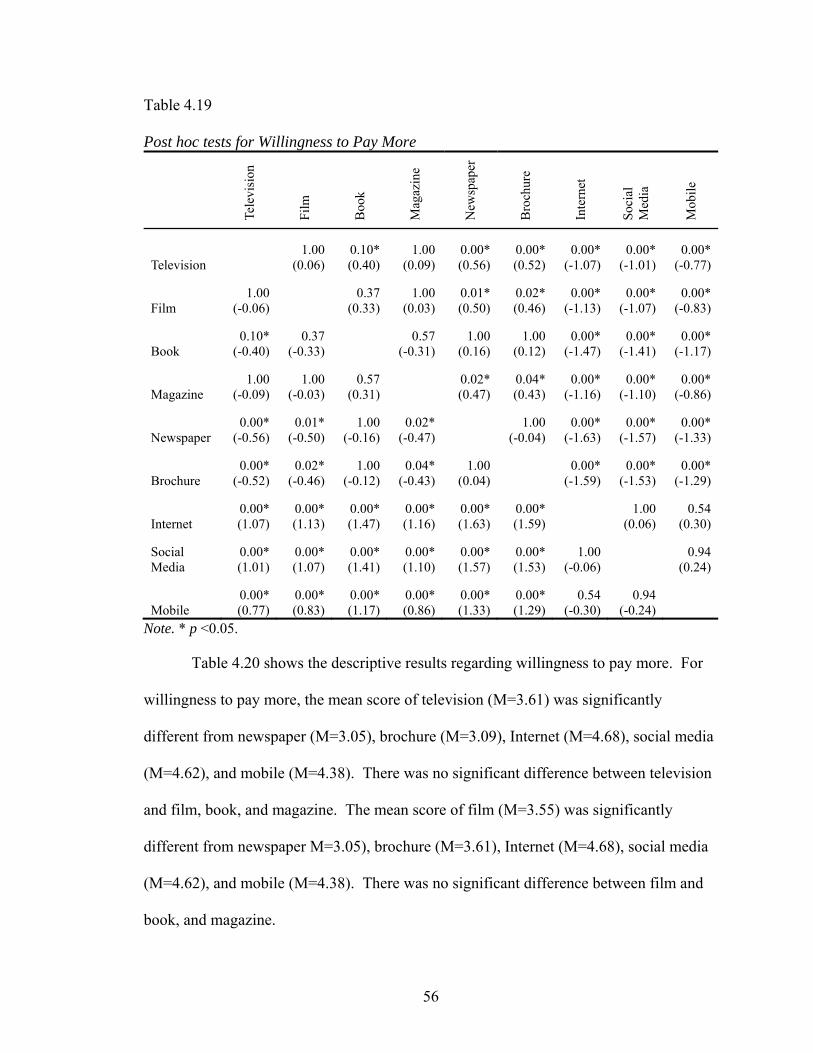
56
Table 4.19
Post hoc tests for Willingness to Pay More
Tele
visi
on
Fil
m
Boo
k
Mag
azin
e
New
spap
er
Bro
chur
e
Inte
rnet
Soc
ial
Med
ia
Mob
ile
Television 1.00
(0.06) 0.10* (0.40)
1.00 (0.09)
0.00* (0.56)
0.00* (0.52)
0.00* (-1.07)
0.00* (-1.01)
0.00* (-0.77)
Film 1.00
(-0.06) 0.37
(0.33) 1.00
(0.03) 0.01* (0.50)
0.02* (0.46)
0.00* (-1.13)
0.00* (-1.07)
0.00* (-0.83)
Book 0.10*
(-0.40) 0.37
(-0.33) 0.57
(-0.31) 1.00
(0.16) 1.00
(0.12) 0.00*
(-1.47) 0.00*
(-1.41) 0.00*
(-1.17)
Magazine 1.00
(-0.09) 1.00
(-0.03) 0.57
(0.31) 0.02* (0.47)
0.04* (0.43)
0.00* (-1.16)
0.00* (-1.10)
0.00* (-0.86)
Newspaper 0.00*
(-0.56) 0.01*
(-0.50) 1.00
(-0.16) 0.02*
(-0.47) 1.00
(-0.04) 0.00*
(-1.63) 0.00*
(-1.57) 0.00*
(-1.33)
Brochure 0.00*
(-0.52) 0.02*
(-0.46) 1.00
(-0.12) 0.04*
(-0.43) 1.00
(0.04) 0.00*
(-1.59) 0.00*
(-1.53) 0.00*
(-1.29)
Internet 0.00* (1.07)
0.00* (1.13)
0.00* (1.47)
0.00* (1.16)
0.00* (1.63)
0.00* (1.59)
1.00 (0.06)
0.54 (0.30)
Social Media
0.00* (1.01)
0.00* (1.07)
0.00* (1.41)
0.00* (1.10)
0.00* (1.57)
0.00* (1.53)
1.00 (-0.06)
0.94 (0.24)
Mobile 0.00* (0.77)
0.00* (0.83)
0.00* (1.17)
0.00* (0.86)
0.00* (1.33)
0.00* (1.29)
0.54 (-0.30)
0.94 (-0.24)
Note. * p <0.05.
Table 4.20 shows the descriptive results regarding willingness to pay more. For
willingness to pay more, the mean score of television (M=3.61) was significantly
different from newspaper (M=3.05), brochure (M=3.09), Internet (M=4.68), social media
(M=4.62), and mobile (M=4.38). There was no significant difference between television
and film, book, and magazine. The mean score of film (M=3.55) was significantly
different from newspaper M=3.05), brochure (M=3.61), Internet (M=4.68), social media
(M=4.62), and mobile (M=4.38). There was no significant difference between film and
book, and magazine.

57
Continually, the mean score of book (M=3.21) was significantly different from
Internet (M=4.68), social media (M=4.62), and mobile (M=4.38). There was no
significant difference between book and magazine newspaper, and brochure. The mean
score of magazine (M=3.52) was significantly different from newspaper (M=3.05),
brochure (M=3.61), Internet (M=4.68), social media (M=4.62), and mobile (M=4.38).
Significant differences were found between newspaper (M=3.05) and Internet (M=4.68),
social media (M=4.62), and mobile (M=4.38). There was no significant difference
between newspaper and brochure. Subsequently, the mean score of brochure (M=3.09)
was significantly different from Internet (M=4.68), social media (M=4,62), and mobile
(M=4.38). The mean score of Internet (M=4.68) was not significantly different from
social media (M=4.62), and mobile (M=4.38). There was no significant difference
between social media (M=5.07) and mobile (M=4.75).
As a result, the highest mean score of the media regarding willingness to pay
more was Internet (M=4.68), indicating that revisit intention is most influenced by
Internet over other types of media. On the other hand, the lowest mean score of the
media regarding willingness to pay more was newspaper (M=3.05), indicating that
willingness to pay more is influenced the least by newspaper among the nine types of
media.
Table 4.20
Descriptive Statistics for Willingness to Pay More
Media
Mean Std. Deviation Willingness To Pay More Television 3.61 1.69
Film 3.55 1.72

58
Book 3.21 1.86
Magazine 3.52 1.71
Newspaper 3.05 1.82
Brochure 3.09 1.78
Internet 4.68 1.57
Social Media 4.62 1.72
Mobile 4.38 1.91
Total 3.75 1.86
Summary
Social media was the most influential media in the comparison of media type,
whereas brochure was the least influential. The different types of media were influenced
by three demographic factors: gender, age, and nationality. Media type had a statistically
significant effect on the behavioral intention: word-of-mouth, revisit intention, and
willingness to pay more.
59
CHAPTER V
CONCLUSION
Introduction
The results of the primary purpose and the hypotheses of this study were
interpreted and discussed in this chapter. This study offered managerial suggestions in
the implication for management in the hospitality industry through the study findings.
Several limitations of this study including sampling method, types of variables, and
collecting data were listed. Lastly, recommendation was indicated in order to improve
the generalizability of the future study.
Discussion of Results
The primary purpose of this study was to examine how much the different types
of media affect a tourist’s decision when choosing a destination to travel. Further, this
study attempted to investigate the impact of different types of media on tourists’
behavioral intentions (word-of-mouth, revisit intention, and willingness to pay more).
Consequently, all study hypotheses were supported.
As a whole, this study was able to classify media into two groups: print media and
electronic (new) media (Kipphan, 2001). Print media includes book, magazine,
newspaper, and brochure. Electronic media includes television, film, Internet, social
media, and mobile. The key findings of the study can be summarized in the following
three areas: the different preferences of a tourist between electronic media (new media)
and print media, demographic differences when choosing media types, and distinctive
features of three behavioral intentions (word-of-mouth, revisit intention, and willingness
to pay more).

60
As a result, the descriptive statistics showed that social media ranked top while
brochure ranked last. Social media being in first place indicates that social media has the
most impact over other forms of media. Continually, the results of media preference
showed to be: Internet, film, mobile, television, magazine, book, newspaper, and
brochure, respectively. The rank was distinctively divided into two groups: electronic
media and print media. Five electronic types of media ranked in the upper ranks and the
four print media remained in the lower ranks. In general, electronic media are preferred
among people and have a greater impact in their lives, especially in the hospitality
industry.
The first study hypothesis tested the mean differences for media between gender,
age, and nationality. Study results indicate that there is a significant impact on media
demographically, thus H1 was supported. Subsequently, gender, age, and nationality
showed to have significant differences for media when choosing a travel destination.
Although gender had a weakly significant difference on the media types, television and
magazine influence females more than males. Both males and females tend to use similar
types of media when choosing a destination to travel except television and magazine.
People who are older than 36 years old are more influenced by television than
people who are younger than 36. Film is the most influential media to the age group
between 18 and 25. Additionally, people who are older than 36 years old are also
influenced by film considerably. There is a specific indication observed; in case of print
media, people who are 36 years and older are distinctively influenced by newspaper and
brochure. On the other hand, as the younger generations are more exposed to the Internet,
61
social media, and mobile, the younger age groups are more influenced by electronic
media.
People from China are distinctively more influenced by film than people from any
other country. For brochure, people from Korea are least affected compared to people
from other countries. For electronic media, such as Internet, social media, and mobile,
people from the USA are influenced the least over people from Korea and China.
The second study hypothesis tested whether media types had an impact on
behavioral intention for traveling. The second study hypothesis was also supported. For
two behavioral intentions: word-of-mouth and willingness to pay more, electronic media,
which include social media, Internet, and mobile, were conspicuously effective compared
to the other types of media, especially, print media. For revisit intention, interestingly,
film was the most influential media; social media, Internet, and mobile followed after it.
As mentioned in the literature review, film has given attentiveness to mass
audiences and film-induced tourism was formed. The results proved that film is one of
the most crucial motivational mass media for tourism and has an ability to attract tourists
and advertise the destination in the long term. However, electronic media are effective
for tourists’ revisiting as well. Therefore, the efficacy of electronic media has been
demonstrated. While previous literature suggests the significant impact of different types
of media, this study specifically emphasizes that the majority people prefer electronic
media. This study provides evidence that advanced Internet-based technologies –
electronic media: Internet, social media, mobile – are influential in the tourism industry
in twenty-first century.

62
Implication for Management
Practically, the findings of this study may suggest some meaningful insights for
destination marketers and tourism related organizations. Subsequently, study findings
remarkably suggest that media as an information source may act as a strategic link to
tourism. Results particularly emphasize the importance of media and advise destination
marketers to carefully consider utilizing the different types of media towards their target
market properly to persuade tourists. Media-induced tourism can also play an imperative
role for positioning strategies for destination marketing.
For example, the fact that film was ranked in the first place for revisit intention
reflects the importance of film-induced tourism and is also considered as one of the most
credible mass media source compared to other promotional materials for tourists’
behavioral intention. Marketers definitely need to consider the film’s unique ability that
attracts tourists and advertises the location shown in the film. Accordingly, the efficacy
of electronic media has been verified from this study, and it has been recognized as the
fastest growing, most prominent, and strongest marketing tools for the tourism industry.
While television and film still influence tourists considerably, the Internet, social media,
and mobile are expected to develop further and motivate even more people around the
world. Thus, tourism organizations and companies should constantly make efforts to
promote destinations through the Internet, engage with potential tourists through social
media, and develop mobile applications that are convenient and resourceful.
Furthermore, as the results of the study indicated that demographic factors
showed noticeable propensities for different types of media; gender, age, and nationality
showed to have significant differences for media when choosing a travel destination.
63
Marketers are able to obtain insights from the results that have implications for targeting
their market more explicitly. As such, marketers can derive the acute and adequate
marketing strategy from the fact that the age group of 36 years and older is more
influenced by traditional media – as the term was defined by Davies and Cairncross
(2013), television, film, book, newspaper, and brochure – for traveling than people who
are younger than 36 years old. On the other hand, electronic media influences people
who are younger more. Thus, marketers should utilize various types of print media when
targeting the comparatively older tourists and more electronic media to induce younger
tourists. This also allows marketers to identify which kinds and which specific sources of
print media and electronic media to advertise on. Instead of copying competitors and
advertising everywhere and anywhere, marketers can find the certain type of sources that
are more prevalent for each age group. Notably, film exclusively influences a broader
range of age groups. Therefore, tourism marketers may find ways, such as sponsoring, to
convince businesses to film their movies on their location.
As media-induced tourism occurs worldwide, tourism organizations or corporates
should also consider the significant differences between nationalities for media
preferences for traveling. According to the result, film, Internet, and social media
showed significantly strong influence in China. Additionally, social media influenced
Korea the most over the other countries. Traveling demand from Asia has been
constantly increasing recently. Hence, particularly film, Internet and social media can be
utilized to attract more travelers from Asia. As a whole, tourism organizations and
companies can develop customized strategies to enhance international tourism by the
proper implementation of media.

64
Limitations
There are limitations that should be considered when assessing this study. Most
importantly, this study includes limitations in sampling by using a non-probability
convenience sampling method. In probability sampling methods, all persons have a
chance to be selected as the study sample and results are more likely to represent the
entire population, thus preferred over non-probability sampling. Non-probability
sampling may be more convenient, but it is not random and it is hard to generalize the
findings (Zikmund, 2003).
Additionally, Media users are more diversified in terms of age, occupation, and
other demographic factors in the real world. However, this study mainly focused on
college students, which is only one of the few target segments of potential tourists.
Moreover, the age and nationality were not evenly distributed among the study sample.
Thus, it may not be appropriate to generalize study findings.
Collecting data via surveys include weaknesses as well. It is extremely
challenging to design a set of standardized questions on what the researcher is attempting
to test. Surveys also include designing issues and execution issues that need to be
considered deeply.
Recommendation for Future Research
In order to enhance the generalizability of the result, replicated studies are
suggested in the future. Future research could replicate this study among different groups,
such as comparing various nationalities, occupations, incomes, etc. It would be more
constructive to have a more sufficient sample size for each age group or specify the
groups into more groups. Comparing the usages of the different types of media

65
depending on the various occupations, the research will be more applicable. The study
would be more interesting to see the differences between different income groups.
Media can be classified in different ways, such as history of media or
characteristics of media: visual media (television, and film), print media (book, magazine,
newspaper, and brochure), digital media (Internet, social media, and mobile), and so on.
Moreover, additional types of media can be included for future studies. Thus, future
researches can be designed in several ways by how to differently classify the various
types of media.
Further studies could explore the relationship between different types of media
and the demographic factors, such as: how the typical value of the different types of
media effectively influences the demographic factors by utilizing regression analysis. It
would help to understand which among the demographic factors are related to media and
to investigate the forms of relationships.
Summary
The valuable study findings were established and mentioned that marketers in the
hospitality industry should acknowledge for better utilizing the different types of media.
Mostly electronic media were preferred over print media among people and had a greater
impact in their lives according to the study findings. Depending on the demographic
factors, there were significant differences for media when people chose a travel
destination. The efficacy of electronic media was differently demonstrated the behavioral
intentions. For word-of-mouth and willingness to pay more, social media was noticeably
effective compared to the other types of media. For revisit intention, film was the most
influential media type compared to the other media types, especially, print media.

66
REFERENCES
Ahas, R., Aasa, A., Roose, A., Mark, Ü., & Silm, S. (2008). Evaluating passive mobile positioning data for tourism surveys: An Estonian case study. Tourism Management, 29(3), 469-486. Ajzen, I. (1991). The theory of planned behavior. Organizational behavior and human decision processes, 50(2), 179-211. Akar, E., & Topçu, B. (2011). An examination of the factors influencing consumers' attitudes toward social media marketing. Journal of Internet Commerce, 10(1), 35-67. Alexandris, K., Dimitriadis, N., & Markata (2002). Can perceptions of service quality predict behavioral intentions? An exploratory study in the hotel sector in Greece. Managing Service Quality, 12(4), 224 – 231. Andranovich, G., Burbank, M. J., & Heying, C. H. (2001). Olympic cities: Lessons Learned from mega-event politics. Journal of Urban Affairs, 23(2), 113-131. Andreu, L., Kozak, M., Avci, N., & Cifter, N. (2006). Market segmentation by motivations to travel: British tourists visiting Turkey. Journal of Travel & Tourism Marketing, 19(1), 1-14. Baker, D. A., & Crompton, J. L. (2000). Quality, satisfaction and behavioral intentions. Annals of tourism research, 27(3), 785-804. Balderjahn, I. (2003). Erfassung der Preisbereitschaft. In Handbuch Preispolitik (pp. 387- 404). Gabler Verlag. Baloglu, S. (1997). The relationship between destination images and sociodemographic and trip characteristics of international travellers. Journal of Vacation Marketing, 3(3), 221-233. Baloglu, S., & McCleary, K. W. (1999). A model of destination image formation. Annals of tourism research, 26(4), 868-897. Beeton, S. (2001). Lights, camera, re-action: How does film-induced tourism affect a country town?. Beeton, S. (2005). Film-induced tourism. Clevedon, UK: Channel View Publications. Beeton, S. (2006). Understanding film-induced tourism. Tourism Analysis, 11(3), 181- 188.

67
Benson, S., & Standing, C. (2008). Information systems: A business approach. Stafford, Australia: Wiley. Bigne, J. E., Sanchez, M. I., & Sanchez, J. (2001). Tourism image, evaluation variables and after purchase behaviour: inter-relationship. Tourism management, 22(6), 607-616. Blackshaw, P. (2006). The consumer-generated surveillance culture. http://www.clickz.com/showPage.html?page=3576076. Accessed 20.08.07. Blackshaw, P., & Nazzaro, M. (2006). Consumer-generated media (CGM) 101: Word-of-mouth in the age of the web-fortified consumer. A Nielsen BuzzMetrics White Paper, Second Edition, Spring. Blackwell, R. D., Miniard, P. W., & Engel, J. F. (2001). Consumer Behavior. Orlando, FL: Harcourt College Publishers. Bodnar, K. (2010) The ultimate list: 300+ social media statistics. Retrieved from http://blog.hubspot.com/blog/tabid/6307/bid/5965/The-Ultimate-List-300-Social- Media-Statistics.aspx?source=Webbiquity Brown, B., & Chalmers, M. (2003, January). Tourism and mobile technology. In ECSCW 2003 (pp. 335-354). Springer Netherlands. Brown, W., & Singhal, A. (1993). Media and prosocial messages. Journal of Popular Film and Television, 21(3), 92–99. Buhalis, D. (2003). eTourism: Information technology for strategic tourism management. Pearson Education. Buhalis, D., & Law, R. (2008). Progress in information technology and tourism management: 20 years on and 10 years after the Internet—The state of eTourism research. Tourism management, 29(4), 609-623. Buhalis, D., & Licata, M. C. (2002). The future of e-tourism intermediaries. Tourism Management, 23(3), 207–220. Burgess, S., Sellitto, C., Cox, C., & Buultjens, J. (2009, June). User-generated content (UGC) in tourism: Benefits and concerns of online consumers. In ECIS (pp. 417-429). Busby, G., & Klug, J. (2001). Movie-induced tourism: The challenge of measurement and other issues. Journal of vacation marketing, 7(4), 316-332.
68
Butler, R. W. (1990). The influence of the media in shaping international tourist patterns. Tourism Recreation Research, 15(2), 46-53. Campbell, J., DiPietro, R. B., & Remar, D. (2014). Local foods in a university setting: Price consciousness, product involvement, price/quality inference and consumer's willingness-to-pay. International Journal of Hospitality Management, 42, 39-49. Campbell, R., Martin, C. R., & Fabos, B. (2011). Media and culture: An introduction to mass communication. Macmillan. Cao, Y. (2014, May). Research of Management Tools and Techniques of Social Media Marketing Time Based on Mathematical and Empirical Analysis. In International Conference on Logistics Engineering, Management and Computer Science (LEMCS 2014). Atlantis Press. Carlsson, C., & Walden, P. (2010). Supporting tourists at the Bomarsund fortress with a mobile value service. Journal of Information Technology Theory and Application (JITTA), 11(1), 4. Carson, D. (2005). An overview of developing regional tourism using information communication technology. In S. Marshall, W. Taylor, & X. Yu (Eds.), Encyclopedia of developing regional communities with information and communication technology. London: Idea Group Reference. Carter, S. (1998). Tourists' and travellers' social construction of Africa and Asia as risky locations. Tourism Management, 19(4), 349-358. Cellular Telecommunications & Internet Association. (2012). Wireless Quick Facts. Retrieved from http://www.ctia.org/advocacy/research/index.cfm/aid/10323 Connell, J. (2005). Toddlers, tourism and Tobermory: Destination marketing issues and television-induced tourism. Tourism Management, 26(5), 763-776. Chan, N. L., & Guillet, B. D. (2011). Investigation of social media marketing: how does the hotel industry in Hong Kong perform in marketing on social media websites?. Journal of Travel & Tourism Marketing, 28(4), 345-368. Chen, C. F., & Chen, F. S. (2010). Experience quality, perceived value, satisfaction and behavioral intentions for heritage tourists. Tourism management, 31(1), 29-35. Chen, P. J., & Kerstetter, D. L. (1999). International students’ image of rural Pennsylvania as a travel destination. Journal of Travel Research, 37(3), 256-266. Chen, C. F., & Tsai, D. (2007). How destination image and evaluative factors affect behavioral intentions?. Tourism management, 28(4), 1115-1122.

69
Chi, C. G. Q., & Qu, H. (2008). Examining the structural relationships of destination image, tourist satisfaction and destination loyalty: An integrated approach. Tourism management, 29(4), 624-636. Chiu, C. M., Hsu, M. H., & Wang, E. T. (2006). Understanding knowledge sharing in virtual communities: An integration of social capital and social cognitive theories. Decision support systems, 42(3), 1872-1888. Choi, H. C., & Lee, S. (2009). Understanding US traveler behavior to Asian countries: A secondary analysis approach. Asia Pacific Journal of Tourism Research, 14(3), 279-299. Clarke, D. G. (1976). Econometric measurement of the duration of advertising effect on sales. Journal of Marketing Research, 345-357. Collier, J. E., & Bienstock, C. C. (2006). Measuring service quality in e-retailing. Journal of service research, 8(3), 260-275. Cooper, C. (2005). Tourism: Principles and practice. Pearson education. Cousins, A., & Andereck, K. (1993). Movie generated tourism in North Carolina: Two case studies. Proceedings of the 24th Travel and Tourism Research Association. Cronin Jr, J. J., & Taylor, S. A. (1992). Measuring service quality: a reexamination and extension. The journal of marketing, 55-68. Darnell, A. C., & Johnson, P. S. (2001). Repeat visits to attractions: a preliminary economic analysis. Tourism management, 22(2), 119-126. Davies, R., & Cairncross, G. (2014). Student tourism and destination choice: exploring the influence of traditional, new, and social media: an Australian case study. Tourism Culture & Communication, 13(1), 29-42. Devereux, E. (2013). Understanding the media. Sage. Divinagracia, L. A., Divinagracia, M. R. G., & Divinagracia, D. G. (2012). Digital Media-Induced Tourism: The Case of Nature-based Tourism (NBT) at East Java, Indonesia. Procedia-Social and Behavioral Sciences, 57, 85-94. Doolin, B., Burgess, L., & Cooper, J. (2002). Evaluating the use of the Web for tourism marketing: a case study from New Zealand. Tourism management, 23(5), 557-561. Edwards, S. J., Blythe, P. T., Scott, S., & Weihong-Guo, A. (2005). Tourist information delivered through mobile devices: findings from the image project. Information Technology & Tourism, 8(1), 31-46.
70
eMarketer. (2008). First summer vacation stop: the Internet. Retrieved from http://www.emarketer.com/Article.aspx?id.1006344&src.article1_newsltr. Febvre, L., & Martin, H. J. (1976). The coming of the book: the impact of printing 1450 1800 (Vol. 10). Verso. Fesenmaier, D. R., Vogt, C. A., & Stewart, W. P. (1993). Investigating the influence of welcome center information on travel behavior. Journal of Travel Research, 31(3), 47-52. Fodness, D., & Murray, B. (1997). Tourist information search. Annals of tourism research, 24(3), 503-523. Fodness, D., & Murray, B. (1999). A model of tourist information search behavior. Journal of Travel Research, 37(3), 220-230. Franke, N., & Schreier, M. (2008). Product uniqueness as a driver of customer utility in mass customization. Marketing Letters, 19(2), 93-107. Frumkin, P. (2007). Everyone’s a critic: Operators adapt to surge in online reviews by patrons. Nation’s Restaurant News, 41(2), 39–42. Gartner, W., and Shen, J. (1992). "The Impact of Tiananmen Square on China's Tourism Image." Journal of Travel Research 30(4):47-52. Gartner, W. C. (1993). Image formation process. In M. Uysal, & D. Fesenmaier (Eds.), Communication and channel systems in tourism marketing (pp. 191–215). New York: Haworth Press. Givon, M., & Horsky, D. (1990). Untangling the effects of purchase reinforcement and advertising carryover. Marketing Science, 9(2), 171-187. Goeldner, C. R., & Ritchie, J. B. (2006). Tourism: Principles, practices, philosophies. John Wiley & Sons. Gold, M. (2005). Different strokes for different folks. Caterer & Hotelkeeper, 195(4401), 26. Govers, R., Go, F. M., & Kumar, K. (2007). Promoting tourism destination image. Journal of Travel Research, 46(1), 15-23. Graham, M. (2014). Inequitable Distributions in Internet Geographies: The Global South Is Gaining Access, but Lags in Local Content. innovations, 9(3-4), 3-19.

71
Gretzel, U., Kang, M., & Lee, W. (2008). Differences in consumer-generated media adoption and use: A cross-national perspective. Journal of Hospitality & Leisure Marketing, 17(1-2), 99-120. Gu, H., & Ryan, C. (2008). Place attachment, identity and community impacts of tourism—the case of a Beijing hutong. Tourism management, 29(4), 637-647. Gursoy, D., & McCleary, K. W. (2004). An integrative model of tourists' information search behavior. Annals of Tourism Research, 31(2), 353-373. Hahm, J., & Wang, Y. (2011). Film-induced tourism as a vehicle for destination marketing: is it worth the efforts?. Journal of Travel & Tourism Marketing, 28(2), 165-179. Hair, J. F., Black, W. C., Babin, B. J., Anderson, R. E., & Tatham, R. L. (2006). Multivariate Data Analysis Sixth Edition Pearson Education. New Jersey, 42-43. Hajli, M., Bugshan, H., Lin, X., & Featherman, M. (2013). From e-learning to social learning–a health care study. European Journal of Training and Development, 37(9), 851-863. Harrill, R., & Peterson, R. R. (2012). Tourism, Conventional Wisdom, and the News Media. Tourism Analysis, 17(6), 813-817. Hellier, P. K., Geursen, G. M., Carr, R. A., & Rickard, J. A. (2003). Customer repurchase intention: A general structural equation model. European journal of marketing, 37(11/12), 1762-1800. Henderson, J. C. (2007). Corporate social responsibility and tourism: Hotel companies in Phuket, Thailand, after the Indian Ocean tsunami. International Journal of Hospitality Management, 26(1), 228-239. Henkel, R., Henkel, P., Agrusa, W., Agrusa, J., & Tanner, J. (2006). Thailand as a tourist destination: Perceptions of international visitors and Thai residents. Asia Pacific Journal of Tourism Research, 11(3), 269-287. Herrington, J. D., & Dempsey, W. A. (2005). Comparing the current effects and carryover of national-, regional-, and local-sponsor advertising. Journal of Advertising Research, 45(01), 60-72. Hirsley, M. Still a Field of Pleasant Dreams. Chicago Tribune (October 1): Section, 3(5). Hitchcock, M., & Darma Putra, I. N. (2005). The Bali bombings: Tourism crisis management and conflict avoidance. Current Issues in Tourism, 8(1), 62-76.
72
Howe, W. (1996). When did the Internet start? A brief capsule history. Huang, C. Y., Chou, C. J., & Lin, P. C. (2010). Involvement theory in constructing bloggers' intention to purchase travel products. Tourism Management, 31(4), 513-526. Huang, C. C., Yen, S. W., Liu, C. Y., & Chang, T. P. (2014). The relationship among brand equity, customer satisfaction, and brand resonance to repurchase intention of cultural and creative industries in Taiwan. The International Journal of Organizational Innovation, 6(3), 106-120. Hudson, S., & Ritchie, J. B. (2006). Promoting destinations via film tourism: An empirical identification of supporting marketing initiatives. Journal of Travel Research, 44(4), 387-396. IDATE . (2010). DigiWorld Yearbook 2010. Montpellier:Author. Iwashita, C. (2003). Media construction of Britain as a destination for Japanese tourists: Social constructionism and tourism. Tourism and Hospitality Research, 4(4), 331-340. Jang, S. S., & Feng, R. (2007). Temporal destination revisit intention: The effects of novelty seeking and satisfaction. Tourism management, 28(2), 580-590. Jenkins, H. (2006). Convergence culture: Where old and new media collide. NYU press. Jones, T. O., & Sasser, W. E. (1995). Why satisfied customers defect. Harvard business review, 73(6), 88. Kaplanidou, K., & Vogt, C. (2006). A structural analysis of destination travel intentions as a function of web site features. Journal of Travel research, 45(2), 204-216. Kenteris, M., Gavalas, D., & Economou, D. (2009). An innovative mobile electronic tourist guide application. Personal and ubiquitous computing, 13(2), 103-118. Kietzmann, J. H., Hermkens, K., McCarthy, I. P., & Silvestre, B. S. (2011). Social media? Get serious! Understanding the functional building blocks of social media. Business horizons, 54(3), 241-251. Kim, H. J., Chen, M. H., & Su, H. J. (2009). The impact of Korean TV dramas on Taiwanese tourism demand for Korea. Tourism Economics, 15(4), 867-873. Kim, H., & Richardson, S. L. (2003). Motion picture impacts on destination images. Annals of tourism research, 30(1), 216-237.
73
Kim, S. (2012). The relationships of on-site film-tourism experiences, satisfaction, and behavioral intentions: The case of Asian audience's responses to a Korean historical TV drama. Journal of Travel & Tourism Marketing, 29(5), 472-484. Kim, S. H., Han, H. S., Holland, S., & Byon, K. K. (2009). Structural relationships among involvement, destination brand equity, satisfaction and destination visit intentions: The case of Japanese outbound travelers. Journal of vacation marketing, 15(4), 349-365. Kim, S. S., Agrusa, J., Lee, H., & Chon, K. (2007). Effects of Korean television dramas on the flow of Japanese tourists. Tourism Management, 28(5), 1340-1353. Kim, T. K., Lee, C. K., Mjelde, J. W., & Lee, H. M. (2014). The carryover effect of newspaper reports on a mega event: Ex post analysis of the 2012 Expo Yeosu Korea. Asia Pacific Journal of Tourism Research, 19(9), 1009-1022. Kipphan, H. (Ed.). (2001). Handbook of print media: technologies and production methods. Springer Science & Business Media. Korea Times. (2005). Winter Sonata. Retrieved March 16, 2005 from http://search.hankooki.com/times/times_view.php?termsS. Kotler, P., Bowen J. T., & Makens J. C. (2009). Marketing for Hospitality and Tourism, 5/e. Pearson Education India. Kozak, M. (2001). Repeaters' behavior at two distinct destinations. Annals of tourism research, 28(3), 784-807. Kyle, G. T., Absher, J. D., & Graefe, A. R. (2003). The moderating role of place attachment on the relationship between attitudes toward fees and spending preferences. Leisure sciences, 25(1), 33-50. Kyoko H (1998) I’ve Got a Ha-Ri Disease. Taipei:Times. LaRose, R., & Straubhaar, J. (2006). Media Now: Understanding Media, Culture, and Technology. New York, Thomson Wadsworth. Law, L., Bunnell, T., & Ong, C. E. (2007). The Beach, the gaze and film tourism. Tourist Studies, 7(2), 141-164. Law, R., Qi, S., & Buhalis, D. (2010). Progress in tourism management: A review of website evaluation in tourism research. Tourism management, 31(3), 297-313.

74
Lee, W. S., Graefe, A. R., & Hwang, D. (2013). Willingness to pay for an ecological park experience. Asia Pacific Journal of Tourism Research, 18(3), 288-302. Lew, A. A. (1992). Place representation in tourist guidebooks: An example from Singapore. Singapore Journal of Tropical Geography, 12(2), 124-137. Leonard-Barton, D. (1990). A dual methodology for case studies: Synergistic use of a longitudinal single site with replicated multiple sites. Organization science, 1(3), 248-266. Leung, X. Y., & Bai, B. (2013). How motivation, opportunity, and ability impact travelers' social media involvement and revisit intention. Journal of Travel & Tourism Marketing, 30(1-2), 58-77. L’Etang, J., Falkheimer, J., & Lugo, J. (2007). Public relations and tourism: Critical reflections and a research agenda. Public Relations Review, 33(1), 68-76. Li, X., & Wang, Y. C. (2011). China in the eyes of western travelers as represented in travel blogs. Journal of Travel & Tourism Marketing, 28(7), 689–719. Liou, D. Y. (2010). Beyond Tokyo Rainbow Bridge: destination images portrayed in Japanese drama affect Taiwanese tourists’ perception. Journal of Vacation Marketing, 16(1), 5-15. Litvin, S. W., Goldsmith, R. E., & Pan, B. (2008). Electronic word-of-mouth in hospitality and tourism management. Tourism management, 29(3), 458-468. Macionis, N., & Sparks, B. (2009). Film-induced tourism: An incidental experience. Tourism Review International, 13(2), 93-101. Maltby, J., Houran, J., Ashe, D., & McCutcheon, L. E. (2001). The self-reported psychological well-being of celebrity worshippers. North American Journal of Psychology, 3, 441–452. McChesney, R. W. (1999). Rich media, poor democracy: Communication politics in dubious times. University of Illinois Press. McGregor, A. (2000). Dynamic texts and tourist gaze: Death, bones and buffalo. Annals of Tourism Research, 27(1), 27-50. McQuail, D. (2010). McQuail's mass communication theory. Sage publications. McQuail, D. (2000). McQuail’s mass communication theory (4th ed.). London: Sage.
75
Meng, D., Poslad, S., & Wang, Y. (2009, September). An intelligent context-aware spatial routing system in mobile environment. In Wireless Communications, Networking and Mobile Computing, 2009. WiCom'09. 5th International Conference on (pp. 1-4). IEEE. Messmer, D. J., & Johnson, R. R. (1993). Inquiry conversion and travel advertising effectiveness. Journal of Travel Research, 31(4), 14-21. Middleton, V. T., Fyall, A., & Morgan, M. with Ranchhod, A.(2009) Marketing in Travel and Tourism. Moital, M., Vaughan, R., Edwards, J., & Peres, R. (2009). Determinants of intention to purchase over the Internet. Anatolia, 20(2), 345-358. Mohamud, A. (2012). EU5 smartphone penetration reaches 55 percent in October 2012. comScore Press Release, Dec. Mooradian, T. A., & Olver, J. M. (1997). “I can't get no satisfaction:” The impact of personality and emotion on postpurchase processes. Psychology & Marketing, 14(4), 379-393. Moutinho, L. (1987). Consumer behaviour in tourism. European journal of marketing, 21(10), 5-44. Natchitoches Parish Tourist Commission (1995). Tourism Statistics – Yearly Totals. Louisiana: Natchitoches Parish Tourist Commission. National Park Service (1975). National Park Service Statistical Abstracts 1975-1995. Socio Economic Studies Division. Denver: Denver Service Center. Ong, B. S. (2012). The perceived influence of user reviews in the hospitality industry. Journal of Hospitality Marketing & Management, 21(5), 463-485. Pace, G. L. (1997). "The Origins of Mass Media in the United States". In Wells, Allen & Hakenen, Ernest A. Mass media & society. Greenwood Publishing Group. p. 10. Peel, V., & Steen, A. (2007). Victims, hooligans and cash-cows: media representations of the international backpacker in Australia. Tourism Management, 28(4), 1057-1067. Petrick, J. F., & Backman, S. J. (2002). An examination of the construct of perceived value for the prediction of golf travelers’ intentions to revisit. Journal of Travel Research, 41(1), 38-45.
76
Petrick, J. F., Morais, D. D., & Norman, W. C. (2001). An examination of the determinants of entertainment vacationers’ intentions to revisit. Journal of Travel Research, 40(1), 41-48. Pettigrew, J. E., & Reber, B. H. (2010). The new dynamic in corporate media relations: How Fortune 500 companies are using virtual press rooms to engage the press. Journal of Public Relations Research, 22(4), 404-428. Pizam, A., & Sussmann, S. (1995). Does nationality affect tourist behavior?. Annals of Tourism Research, 22(4), 901-917. Phillips, W. J., Wolfe, K., Hodur, N., & Leistritz, F. L. (2013). Tourist word of mouth and revisit intentions to rural tourism destinations: A case of North Dakota, USA. International Journal of Tourism Research, 15(1), 93-104. Ramey, C. R. (2007). Mass media unleashed: how Washington policymakers shortchanged the American public. Rowman & Littlefield. pp. 1–2. Richmond, S. (2012). Smartphones hardly used for calls. The Telegraph. Riley, R. W., & Van Doren, C. S. (1992). Movies as tourism promotion: A ‘pull’ factor in a ‘push’ location. Tourism management, 13(3), 267-274. Riley, R., Baker, D., & Doren, C. S. V. (1998). Movie induced tourism. Annals of tourism research, 25(4), 919-935. Ritter, W. (1987). Styles of tourism in the modern world. Tourism Recreation Research, 12(1), 3-8. Ritter, W. (1989). On deserts and beaches: recreational tourism in the Muslim world. Tourism Recreation Research, 14(2), 3-9. Robertson, M., & Rogers, P. (2009). Festivals, cooperative stakeholders and the role of the media: A case analysis of newspaper media. Scandinavian Journal of Hospitality and Tourism, 9(2-3), 206-224. Ross, J. (2003). Clearances could bring thousands in. The Scotsman, 6. Saiprasert, W. (2011). An examination of the medical tourists motivational behavior and perception: A structural model. (Order No. 3460102, Oklahoma State University). ProQuest Dissertations and Theses, 176. Retrieved from http://ezproxy.fiu.edu/login?url=http://search.proquest.com/docview/876176923 accountid=10901. (876176923).

77
Schmallegger, D., & Carson, D. (2008). Blogs in tourism: Changing approaches to information exchange. Journal of vacation marketing, 14(2), 99-110. Seiders, K., Voss, G. B., Grewal, D., & Godfrey, A. L. (2005). Do satisfied customers buy more? Examining moderating influences in a retailing context. Journal of Marketing, 69(4), 26-43. Sharkey, J. (2008). So what do you think? Online reviews of hotels and restaurants flourish. New York Times, p. C5. Sheldon, P. J. (1997). Tourism information technology. Oxon, UK: CAB International. Shin, L. Y. (2014). A Comparative Study of Mobile Internet Usage between the US and Korea. Journal of European Psychology Students, 5(3), 46-55. Shoval, N. (2002). A new phase in the competition for the Olympic gold: The London and New York bids for the 2012 Games. Journal of Urban Affairs, 24(5), 583-599. Sigala, M., & Marinidis, D. (2009). Exploring the transformation of tourism firms’ operations and business models through the use of web map services. In European and Mediterranean Conference on Information Systems (pp. 1-13). Sørensen, A. (2003). Backpacker ethnography. Annals of Tourism Research, 30(4), 847-867. Srinivasan, N. (1990). Pre-purchase external search for information. Review of marketing, 4, 153-89. Standing, C., Tang-Taye, J. P., & Boyer, M. (2014). The Impact of the Internet in Travel and Tourism: A Research Review 2001–2010. Journal of Travel & Tourism Marketing, 31(1), 82-113. Standing, C., & Vasudavan, T. (2001). The impact of electronic commerce on the travel agency sector. Journal of Information Technology Case and Application Research, 3(1), 40-55. Straubhaar, J., LaRose, R., & Davenport, L. (2013). Media now: Understanding media, culture, and technology. Cengage Learning. Tasci, A. D. (2009). Social Distance The Missing Link in the Loop of Movies, Destination Image, and Tourist Behavior?. Journal of Travel Research, 47(4), 494-507. Thevenot, G. (2007). Blogging as a social media. Tourism and Hospitality Research, 7(3-4), 287-289.

78
Tooke, N., & Baker, M. (1996). Seeing is believing: The effect of film on visitor numbers to screened locations. Tourism Management, 17(2), 87–94. Tull, D. S. (1965). The carry-over effect of advertising. The Journal of Marketing, 46-53. Urry, J. (1990). The tourist gaze: Leisure and travel in contemporary societies. London, UK: Sage. U.S. Census Bureau. (2011). Commuting in the United States. Retrieved from http://www.census.gov/prod/2011pubs/acs-15.pdf Vogt, C. A., & Fesenmaier, D. R. (1998). Expanding the functional information search model. Annals of Tourism Research, 25(3), 551-578. Walmsley, D. J., & Jenkins, J. M. (1993). Appraisive images of tourist areas: application of personal constructs. The Australian Geographer, 24(2), 1-13. Wang, C. Y., & Wu, L. W. (2011). Reference effects on revisit intention: Involvement as a moderator. Journal of Travel & Tourism Marketing, 28(8), 817-827. Wang, C., Lu, L., & Xia, Q. (2012). Impact of tourists’ perceived value on behavioral intention for mega events: Analysis of inbound and domestic tourists at Shanghai World Expo. Chinese Geographical Science, 22(6), 742-754. Wang, D., Park, S., & Fesenmaier, D. R. (2012). The role of smartphones in mediating the touristic experience. Journal of Travel Research, 51(4), 371-387. Wertenbroch, K., & Skiera, B. (2002). Measuring consumers’ willingness to pay at the point of purchase. Journal of Marketing Research, 39(2), 228-241. Werthner, H., & Klein, S. (1999). ICT and the changing landscape of global tourism distribution. Electronic markets, 9(4), 256-262. Wilkie, W. L., & Dickson, P. R. (1985). Shopping for appliances: Consumers' strategies and patterns of information search. Marketing Science Institute. Williams, D. R. (1989). Great expectations and the limits to satisfaction: a review of recreation and consumer satisfaction research. General Technical Report Southeastern Forest Experiment Service, USDA Forest Service, (SE-52), 422-438. Wirtz, B. W., Schilke, O., & Ullrich, S. (2010). Strategic development of business models: implications of the Web 2.0 for creating value on the internet. Long Range Planning, 43(2), 272-290.

79
Wong, C. K. S., & Liu, F. C. G. (2011). A study of pre-trip use of travel guidebooks by leisure travelers. Tourism Management, 32(3), 616-628. Workman, C., Zeiger, J., & Caneday, L. (1990). Analysis of Visitation: Report to the Devils Tower Tourism Association. Stillwater OK: Oklahoma State University. Xiang, Z., & Gretzel, U. (2010). Role of social media in online travel information search. Tourism management, 31(2), 179-188. Yeo, Y. (2011). Effects of tourist motivation expectancy on authenticity in tourist experience: Focus on the mediation effect of destination image by mass media (Doctoral dissertation). Retrieved from Riss Yin, R. K. (2013). Case study research: Design and methods. Sage publications. Yoo, K. H., & Kim, J. R. (2013). How US state tourism offices use online newsrooms and social media in media relations. Public Relations Review, 39(5), 534-541. Zeithaml, V., Berry, L. & Parasuraman, A. (1996). The Behavioural Consequences of Service Quality. Journal of Marketing, 60, 31-46. Zikmund, W. G. (2003). Business Research Methods (7th ed.). Mason, Ohio: South- Western. Zillinger, M. (2007). Guided tourism: The role of guidebooks in German tourist behaviour in Sweden. Zillinger, M. (2007). Tourist routes: A time-geographical approach on German car- tourists in Sweden. Tourism Geographies, 9(1), 64-83.

80
APPENDIX: A QUESTIONNAIRE
Demographics Information Q1: What is your GENDER? (Please circle):
Male Female Q2: YOU ARE: (Please circle)
Single Married Divorced With Partner Q3: What is your AGE range? (Please circle):
18 – 25 26 – 35 36 – 45 46 – 55 56 – 65 65 and over
Q4: Please select your approximate ANNUAL FAMILY INCOME (Used for demographic purposes, only) (please circle):
$39,999 or less $40,000 - $79,999 $80,000 - $119,999 $120,000 - $159,999 $160,000 - $199,999 $200,000 and over I respectfully decline to answer
Q5: Which BEST describes YOU? (Please circle):
Caucasian (Non-Hispanic) African American/Black (Non-Hispanic) Hispanic Asian or Pacific Islander American Indian Mixed Race/Other
Q6. What is your NATIONALITY? Q7: What is your HIGHEST level of EDUCATION completed? (Please circle):
High School Associate's Degree Bachelor's Degree Master's Degree Doctoral Degree Education/Trade

81
Q8. Please indicate to what degree each of the following types of media affects your decision on choosing a destination to travel?
Types of Media Extremely low → Extremely high
1 2 3 4 5 6 7
Television (TV)
Film
Book
Magazine
Newspaper
Brochure (Pamphlet)
Internet
Social Media
Mobile

82
Q9. Please rate how the different types of media may have affected your past travel experience or will likely to affect your future intention for traveling. - (Please write down a number from 1 to 7 (Likert) or N/A for each blank space below.) - (Please indicate N/A, if the listed types of media do/ did NOT affect your behavioral intention for traveling.)
Extremely low → Extremely high N/A 1 2 3 4 5 6 7
Traveling Behavioral Intention Media
TV
Film
Book
Magazin
e
New
spap
er
Broch
ure
(Pam
ph
let)
Intern
et
Social M
edia
Mob
ile
Say positive things about the destination to my relatives and close friends.
Recommend the destination to my relatives and close friends.
Willing to make further visitation to the destination.
Continue to visit the destination over and over in the future.
Consider the destination as my first choice for traveling.
Visit the destination even if the cost is higher than other destinations.
Spend more money for the destination even if the price increased.
Related Documents