BRONWYN H. HALL Universityof California at Berkeley and National Bureau of Economic Research The Impact of Corporate Restructuring on Industrial Research and Development MANY CLAIM that the mergers, leveraged buyouts, and restructurings in the U.S. corporate sector during the 1980s had a detrimental effect on industrial spending for research and development. Critics of this recent activity point to the stagnation in real R&D expenditures by the private sector during the 1980s and suggest that these restructurings were a major cause of the decline. I Others view this process as a healthy revitalization of U.S. industry in the face of foreign competition and a changing regulatory and financial environment.2 Why are so many people concerned about this increase in restruc- turing activity? After all, the traditional view of economists (at least since the work of Merton Miller and Franco Modigliani) has been that the investment policy of a firm should be independent of its choice of This paper has benefited from comments on an earlier draft by Martin Baily, Margaret Blair, Ernst Berndt, Victor Fuchs, Zvi Griliches, Richard Levin, Charles Hulten, Martha Schary, and members of the Brookings panel on microeconomics. I am grateful to the National Science Foundation (grant SES-890852 1), the University of California at Berkeley, and the National Bureau of Economic Research for their support of the data preparation effort, and to Hortensia Nevarrez, Helen Chung, and especially Matthew G. Nagler for excellent research assistance. 1. See, for example, National Science Foundation (1989). This report identified 24 companies among the top 200 R&D performers that had undergone mergers or other restructurings in 1984-86. The report found that the R&D expenditures of these firms declined by 5.3 percent from 1986 to 1987, while those for the rest of the sample rose by 5.4 percent. 2. See, for example, Jensen (1986, 1989). 85

Welcome message from author
This document is posted to help you gain knowledge. Please leave a comment to let me know what you think about it! Share it to your friends and learn new things together.
Transcript

BRONWYN H. HALL University of California at Berkeley and National Bureau of Economic Research
The Impact of Corporate Restructuring on Industrial Research and Development
MANY CLAIM that the mergers, leveraged buyouts, and restructurings in the U.S. corporate sector during the 1980s had a detrimental effect on industrial spending for research and development. Critics of this recent activity point to the stagnation in real R&D expenditures by the private sector during the 1980s and suggest that these restructurings were a major cause of the decline. I Others view this process as a healthy revitalization of U.S. industry in the face of foreign competition and a changing regulatory and financial environment.2
Why are so many people concerned about this increase in restruc- turing activity? After all, the traditional view of economists (at least since the work of Merton Miller and Franco Modigliani) has been that the investment policy of a firm should be independent of its choice of
This paper has benefited from comments on an earlier draft by Martin Baily, Margaret Blair, Ernst Berndt, Victor Fuchs, Zvi Griliches, Richard Levin, Charles Hulten, Martha Schary, and members of the Brookings panel on microeconomics. I am grateful to the National Science Foundation (grant SES-890852 1), the University of California at Berkeley, and the National Bureau of Economic Research for their support of the data preparation effort, and to Hortensia Nevarrez, Helen Chung, and especially Matthew G. Nagler for excellent research assistance.
1. See, for example, National Science Foundation (1989). This report identified 24 companies among the top 200 R&D performers that had undergone mergers or other restructurings in 1984-86. The report found that the R&D expenditures of these firms declined by 5.3 percent from 1986 to 1987, while those for the rest of the sample rose by 5.4 percent.
2. See, for example, Jensen (1986, 1989).
85

86 Brookings Papers: Microeconomics 1990
financial structure.3 This implies that the R&D policy of the firm should be unaffected by its choice of leverage. Yet many economists and people in business believe that the increases in debt-equity ratios that today are typical of corporate restructurings and acquisitions put pressure on the firm to use its cash flow to service the long-term debt at the expense of investments, particularly those of a long-term nature such as research and development. The argument is that substituting debt for equity substitutes a fixed interest obligation for the optional dividends that were formerly paid to shareholders, thus leaving the discretionary spending of earnings vulnerable to downturns in the industry or economy.
This argument, while superficially persuasive, has several obvious problems. First, if good (high rate of return) investment projects are available, the firm should be able to finance them by going again to the equity or debt markets when retained earnings are not available. The source of financing for these projects should have nothing whatever to do with whether they are undertaken. Second, if the merger, acqui- sition, or leveraged buyout truly causes good projects to be canceled, the firm should be worth less under the new ownership form, and the shareholders should not have accepted an offer that reflects this lower value, or conversely the buyers should not have been willing to offer more than the current trading price.
Most of those who stress the beneficial effect of takeover and re- structuring activity would agree with the second of the preceding ar- guments, but not the first; that is, they do not rely on Miller-Modigliani in its pure form. The market values the firm's prospects correctly, they argue, but managers have a tendency to make the wrong investment choices (from the point of view of the shareholder). Thus a firm can be "undervalued" by a market that perceives this fact but is not 100 percent certain that a raider will come along to correct the situation. In many cases, diverting the cash being spent on investment projects to interest payments on debt is a good discipline for the firm's managers, they would claim, since managers have a tendency to invest in projects whose return is lower than alternatives that would be available to the firm's shareholders if they instead received the earnings as dividends.4 This "efficient markets" view of corporate restructuring implies that substantial increases in debt should occur in firms and industries (such
3. Modigliani and Miller (1958); and Miller and Modigliani (1961). 4. Jensen (1986).

Bronwyn H. Hall 87
as shrinking, older industries and those without a strong technological base) in which the available investment projects are low return.
Thus there are two arguments implying that increases in corporate restructuring, particularly those associated with increases in leverage, will be associated with declines in R&D spending (and investment in general). These two arguments, however, lead to opposing conclusions about the social cost or benefit of such changes. The first (optimistic?) view is that financial markets are "efficient," but the managers of firms do not always act in the shareholders' interest (agency costs). Because long-term debt provides managerial discipline, and the market knows this, leveraging tends to be seen in industries and situations in which good payback projects are not available (that is, where R&D is low or ought to be). Thus R&D is expected to fall after a (leveraged) acquisition in this story, but this fact has no negative connotation.
The second argument assumes that financial markets are myopic and do not value long-term investments like R&D properly, so firms that undertake them may be undervalued and provide attractive takeover opportunities. After the takeover (or the successful defense of a hostile takeover), potentially "good" R&D projects are cut in order to sustain the interest payments on the increased long-term debt. The implication of this argument is that market myopia is to blame and that the public good may be served by interfering with the takeover process.
The main distinction between these two lines of reasoning is in the results: both suggest that increases in debt will be followed by cuts in R&D projects, but in the first case this is, at the least, privately optimal, whereas in the second, R&D projects with high potential rates of return may be cut. Since we do not observe these projects and their outcomes, it is difficult to choose between these two pictures of the world except by indirect evidence: we can investigate the general question of whether there is market myopia with respect to R&D investment, or we can explore the characteristics of the actual transactions. In which industries do they occur? What kinds of projects appear to be cut? Is there evidence that research and development is actually being threatened?
Financial markets are not completely myopic with respect to R&D spending. This is made clear by studies of two types: a pair of event studies in the finance literature,5 and a series of total market value
5. Jarrell, Lehn, and Marr (1985); and Woolridge (1988).

88 Brookings Papers: Microeconomics 1990
studies including R&D capital.6 The event studies investigate the im- mediate effect on stock prices of an announcement of an increase in R&D spending; if the market is myopic, the announcement of such a long-term investment project should have a negative price effect because the market expects that short-term earnings will be adversely affected. In their study of 62 firms that announced an increase in R&D spending, Gregg Jarrell, Ken Lehn, and Wayne Marr found that the average 20- day appreciation in the stock of such firms was 1.8 percent. J. Randall Woolridge's study controlled more carefully for R&D investment an- nouncements that were accompanied by other earnings news. Never- theless, it found a 30-day excess return of 1.5 percent associated with R&D increases for 45 such announcements. This evidence argues against extreme market myopia.
A drawback of this type of approach, however, is that it says nothing about whether the size of the market reaction is of the right order of magnitude. Does the increase in value of the firm have any connection to the expected present discounted value of the returns to be generated from this investment increase? If not, the market may still be discrim- inating against such investments.
A similar argument, but one applied to managerial myopia rather than to market myopia, is presented by Jeremy Stein: "the more re- luctant managers are to invest, the higher will be the present value of those few projects that they do find sufficiently attractive to undertake and, hence, the more positive should be the market reaction to the announcement of a new investment. '7 The same type of reasoning suggests that value-maximizing managers facing a myopic stock market may choose to undertake only very high return R&D projects, but these would still produce positive announcement effects.
The other type of evidence is a long-term analysis in levels. The basic idea is to regress the total market value of the firm (debt plus equity) on the book value of the assets, both tangible and intangible. Long-run equilibrium implies that all the assets should be priced at their book value on average, at least in the cross section. Departures from a coefficient of unity are interpreted as an overpricing or underpricing of the particular asset by the market. The regressions are usually per-
6. Griliches (1981); Cockburn and Griliches (1987); and Hall (1988b). 7. Stein (1988, p. 77).
Bronwyn H. Hall 89
formed with the intangible assets (the stock of R&D capital or patents, advertising, and so on) measured relative to the physical assets, so that the coefficient measures the relative price of such capital. (A coefficient of unity is not imposed on the tangible assets.) The results here strongly indicate that R&D capital is not seriously underpriced: lain Cockburn and Zvi Griliches obtain a coefficient of around 1.4, while I get about 0.9 using a larger sample of firms for more years. Both studies find a coefficient for tangible assets that is insignificantly different from unity. However, belief that this coefficient represents the market's pricing of R&D investment rests crucially on the choice of depreciation rate to construct the R&D capital.8 If the depreciation rate were actually higher than the 15 percent used in both studies (a likely possibility, since for these purposes the depreciation rate we want measures the decline in the appropriable R&D capital), the true value of the coefficient would be even higher. An interesting finding in both studies is that the val- uation of the current R&D flow is even higher than that predicted by the coefficient of the stock, which does suggest that rapid depreciation is taking place.
Taken together, these pieces of evidence seem to rule out total market myopia toward long-term investment as a reasonable hypothesis; no one who reads the glossy annual reports of high-technology companies, which trumpet their R&D spending, would seriously entertain the idea that the market does not value it at all. However, there are limitations to this approach: the event studies do not really tell whether the order of magnitude is correct, only that the sign was right. The market value studies are flawed in that there is typically a one-to-one relationship between the "depreciation'" of research and development and the coef- ficient of the stock; one cannot tell precisely whether financial markets value the R&D stock correctly, but only that they value it.
In this paper I take a different approach to investigating whether financial markets discriminate against long-term investments (and thus ignore the returns to such investment while encouraging financial re- structurings). I focus on the R&D characteristics and outcomes of the actual restructurings that occur, and then I attempt informally to see
8. This is not a new point. See, for example, Griliches (1981). For a discussion of the evidence on depreciation or decay rates for the appropriable revenues from R&D expen- ditures, see Pakes and Schankerman (1984).

90 Brookings Papers: Microeconomics 1990
which of the two descriptions of the world mentioned earlier seems consistent with the facts.
The goal of the paper is to assess the empirical evidence on the effects of corporate restructuring on industrial research spending. I focus specifically on the manufacturing sector of the economy, where most industrial research and development is performed. To this end, I have constructed a new panel data set for U.S. manufacturing firms from the Compustat files.9 It contains public data on the R&D spending and other characteristics of about 2,500 firms from 1959 through 1987 (annual data). 10 I use this file to investigate the actual consequences for R&D spending of the different types of changes in corporate structure in the past ten years: mergers and acquisitions, both public and private, leveraged buyouts, and increases in debt levels that are not accompanied by ownership changes. After collecting the evidence, I assess what the results can and cannot tell us about the questions posed at the beginning of the introduction.
Trends in R&D and Corporate Restructuring
In spite of attempts by researchers here and abroad to find better measures of innovative activity, expenditures on research and devel- opment remain the most widely available and best measured of the so- called "scientific indicators." II Since they are also almost the only data on innovation available at the firm level at this time, I rely on them exclusively in what follows.12
Figure 1 shows three different measures of the level of real industrial R&D expenditures between 1972 and 1987.13 The solid curve is the
9. Standard and Poor Corporation (1978-87 editions). 10. Hall (1990). 1 1. See National Science Foundation (1987); OECD (various years); Statistics Canada,
Ministry of Supply and Services (various years); and other national and international pub- lications on science indicators.
12. In the past I and my coauthors have also used patent statistics for this purpose. See Griliches, Pakes, and Hall (1987) for a summary of this work. Because we found patents and R&D to be highly correlated, with patents a far noisier measure than R&D, and because budget and time constraints preclude the data construction effort needed to add individual- firm patent counts to my new panel data set, I have chosen not to use patents here.
13. All series in this figure have been deflated by an updated version of the "Griliches- Jaffe" R&D deflator, which is a weighted average of a labor cost index and the implicit price deflator in the nonfinancial corporate sector. See Hall and others (1988).

Bronwyn H. Hall 91
Figure 1. Industrial R&D Spending, 1972-87
Billions of 1982 dollars
60 Private industrial R&D
50 - (NSF) ,, > Industrial R&D
40 - (Compustat) - Industrial R&D
30 - (domestic firms only)
20 -
10
1973 1975 1977 1979 1981 1983 1985 1987
Source: Author's computations based on National Science Foundation (1987).
total amount of R&D expenditure that industrial firms funded them- selves (that is, R&D that was not paid for by the government or other source), as reported to the National Science Foundation.14 While re- search and development grew at an average rate of close to 7 percent a year in real terms between 1979 and 1984, the rate of growth dropped to 2 percent a year from 1984 to 1987; examination of aggregate in- vestment patterns during the same period shows a smaller decline, from a growth rate of 4 percent a year to approximately zero. 15 Is this decline related to the increase in corporate restructuring, as some would sug- gest? Certainly the timing is right: the total size (in terms of number of employees) of corporate restructurings remained roughly constant between 1978 and 1984, doubled suddenly in 1985, and increased again in 1986 to three times its earlier level (see table 1). Before I discuss this table in detail, I will digress slightly to describe briefly how it and my data set were constructed.
The empirical results in this paper are based on the first results of an effort to build a new panel of data on Compustat firms in manufac-
14. National Science Foundation (1987). 15. Economic Report of the President (1989, table B- 17).

92 Brookings Papers: Microeconoinics 1990
turing. It contains data from 1959 through 1987 for firms on Compustat during at least one year between 1976 and 1987.16 This sample consists of about 2,500 manufacturing firms in existence sometime between 1976 and 1987, augmented by a few nonmanufacturing firms that were for- merly manufacturing firms or that acquired manufacturing firms during the period. In the course of the construction of this panel data set, I identified about 1,200 firms that had exited by the last year (1987). For all of these firms, I looked up in a variety of printed sources the reason for exit (type of acquisition, bankruptcy, liquidation, name change, or other reason), the actual year of the event, the stock market at the time of exit (acquisition or liquidation price), and the name of the acquirer. 17
About 480 of these exits had been acquired during the period by other publicly traded firms, about 100 by foreign firms, and about 250 went private through a leveraged buyout or other transaction. Approximately 130 went bankrupt or were liquidated. The remainder were not true exits, but were name changes or delistings from the stock exchanges. 18
This list of exits is a key input into the study of corporate restruc- turings since all such events that involve an entire firm will appear on this list unless a firm restructures by buying back its stock and issuing a large amount of debt (that is, by increasing its leverage ratio sub- stantially). I attempted to identify these cases as well by computing the change in long-term debt for each firm from year to year and dividing it by the market capitalization of the firm at the beginning of the year (that is, by the sum of debt and equity). Firms with changes in debt that were larger than 75 percent of this number in any one year were deemed to have restructured during that year.
16. Hall (1990). 17. Key sources are the Wall Street Journial Index (Dow Jones Books); Capital Chaniges
Reporter (Chicago: Commerce Clearing House); and the Directory of Obsolete Securities (Jersey City, N.J.: Financial Information, Inc.).
18. The delistings are a small fraction of the total (about 30 firms, mostly very small). They generally were delisted because of financial distress (valueless stock) or because shareholders' interest fell below the cutoffs imposed by the exchanges. To a great extent, firms of this type exit for another reason, such as liquidation or acquisition, but the few that I could not identify as having done so ended up in this class. The name changes and other reorganizations are larger in number (about 200 firms during the period), and for these firms I attempted to splice the data for the reorganized or renamed firm, when I can find it on the file, to the data from the old firm. Most of the time I was successful in this effort.

Bronwyn H. Hall 93
Table 1. Corporate Restructuring, Publicly Traded Firms in Manufacturing Sector, 1977-87 Thousands of employees unless otherwise specified
Total Acquisitiotns Leveraged Year employees Public Foreign Private buiyouts Levelaginga
1977 20,917 66.0 1.3 10.4 0.6 30.7 1978 21,169 191.8 46.9 17.9 0 22.5 1979 21,999 311.3 11.9 15.5 1.3 58.7 1980 21,284 152.8 24.8 1.6 13.6 150.4 1981 20,880 310.0 15.6 42.4 19.4 142.6
1982 19,806 186.2 38.3 49.6 35.2 256.0 1983 20,138 298.0 0.0 14.9 33.1 33.9 1984 20,034 188.0 2.2 104.7 93.5 73.6 1985 19,279 382.7 111.4 52.1 132.9 146.9 1986 18,526 656.3 190.5 84.1 172.6 116.1 1987 17,898 179.9 201.4 63.9 226.2 113.5
Total . . . 2,924.3 644.4 457.0 728.9 1,144.9
Average size . . . 6.6 7.6 2.6 9.6 6.5
Source: Standard and Poor (1978-87). a. Leveraging firms are those whose increase in long-term debt in any one year was greater than 75 percent of the sum of
their debt and equity at the beginning of the year.
Table 1 shows that acquisitions of all types (where size is measured by the number of employees) have been increasing in the manufacturing sector during the 1980s, with the increase in acquisitions by privately held or foreign firms occurring somewhat later than the rise in leveraging or acquisitions as a whole. In 1977, only one half of 1 percent of employment in this sector was affected by these transactions, whereas in 1986 (the last year for which complete data are available) 6.6 percent of employment was.
Does my panel data set show the same type of aggregate R&D behavior as the National Science Foundation numbers? To answer this question, look again at figure 1: the top curve is the total R&D expen- diture by firms in my sample. 19 The closeness of this series to the NSF
19. Initial analysis of the data for firms in my sample revealed a shortfall in the number of firms with good data in 1987. Compustat had not yet updated the data series for ap- proximately 140 of the 1,650 firms in my sample. Those that were missing data were predominantly smaller firms from the over-the-counter file. In order not to bias the inter- pretation of the trends too much, I adjusted the 1987 figures to reflect the fraction of the firms that were missing 1987 data, using the employment figures for these firms from the previous year. This yields about a 7 percent increase in any totals for 1987, including those in figures 1 and 2.

94 Brookings Papers: Microeconomics 1990
data up until about 1984 is a bit misleading since neither one is a subset of the other. The primary differences are that the NSF numbers include research and development by nonpublicly traded firms, and the Com- pustat numbers (my sample) contain foreign-performed research and development as well as domestic. I show both series so that one can get some idea of how my sample reflects the economy as a whole. The increasing divergence in the two series is undoubtedly due to the in- creasing presence of foreign firms on U.S. stock market exchanges and the increasing performance of U.S. research and development abroad (which is included in the Compustat numbers, but not in the NSF numbers).
Figure 1 also shows the R&D expenditures for Compustat firms with the expenditures by foreign-owned firms removed (the bottom curve).20 This series tracks the NSF series very closely until the last two or three years, where it does not show the same type of decline (remember that the 1987 numbers are partially estimated because of the incompleteness of the sample for this year). The remaining discrepancy is undoubtedly due to the few privately held firms in the United States that report research and development to NSF, but are not required to file lOKs with the Securities and Exchange Commission.
Figure 2 shows the same result in a different way: the growth rates of real R&D expenditure from NSF and for the domestic portion of the Compustat sample are very close until 1986, when my data show less of a decline than do the NSF data; the major remaining discrepancy is due to research and development performed abroad by U. S. firms, which may indeed have been increasing. My data are adequate for drawing conclusions about the effects of corporate restructuring on aggregate R&D, although changes in the very recent past may be somewhat im- precisely measured because the Compustat data show much less of a decline than the NSF data.
Private Acquisitions and Leveraged Buyouts
I begin by examining a type of restructuring that has been specifically attacked as a major cause of declines in R&D spending, but which turns
20. In 1972 this spending comprised only 3 percent of the total, but by 1987 it had risen to 18 percent. Including spending by foreign-owned firms in the total would seriously bias conclusions about aggregate R&D spending by U.S. firms.

Bronwyn H. Hall 95
Figure 2. Growth of Real Industrial R&D Spending, 1973-87
Percent
10 - NSF estimates
8 - Compustat 8 % < ~< estimates
-2 _ 'I
-4 -
-6 l 1973 1975 1977 1979 1981 1983 1985 1987
Source: Author's calculations based on Standard and Poor (1978-87).
out to be a very minor part of the story in manufacturing: the "going private" transaction and in particular the leveraged buyout (LBO). "Leveraged buyout" is the general term used for a transaction that changes both the ownership and financial structure of a public corpo- ration. In a typical buyout, the firm changes from a public company to one that is privately held by a small group of investors including man- agement, and the equity of the firm is replaced to a large extent by corporate debt held by banks, insurance companies, and other pur- chasers of high-yield debt. The benefits of this kind of restructuring are held to be twofold. First, for some firms, debt may be a relatively cheaper form of financing than equity. Second, concentrating the own- ership of the firm in the hands of a few managers and friendly banks may reduce or eliminate the agency costs that arise when the ownership of the firm is widely dispersed among public shareholders.
Kohlberg, Kravis, and Roberts, an investment firm that assists in a great many of these transactions, summarizes its criteria for selecting companies as follows: a history of profitability and steady cash flow, products with well-known brand names and strong market position, low-cost producers, potential for real growth without cyclical swings in profitability, and products that are not subject to rapid technological

96 Brookings Papers: Microeconomics 1990
change.21 The goal seems clear: minimize volatility in earnings and ensure a stable source of rents so that the debt taken on can be serviced. These criteria, particularly the last one, will not generally select in favor of firms for which research and development is an important part of the corporate strategy. A steady cash flow increases the probability that the leveraged buyout offer will dominate an offer financed in a different manner (under the assumptions that markets are efficient, at least at acquisition time, and that debt is cheaper than equity because of its tax treatment).
It is perhaps natural that practitioners of the leveraged buyout should focus on servicing the debt incurred by the transaction and that they should therefore appear to be focused exclusively on the cash flow properties of the asset in question. However, Oliver Williamson takes an alternative, although complementary, view of the motivation of the leveraged buyout.22 He argues that it will take place in a firm where the leverage ratio is out of alignment because of the maturity of the line of business and the size of the tangible assets. Although these characteristics are correlated with smooth cash flow, there are important differences: for example, a major asset of many firms experiencing leveraged buyouts is not redeployble but can be relied upon to generate a steady source of rents. This asset may be loosely labeled "brand name recognition. " It is created by a combination of investments, tangible and intangible (advertising), and it is likely to be greater in more mature firms.
The assets created by investments in research and development are precisely those that are not very redeployable (and are often difficult to transfer without substantial investments by the receiving firm): the knowledge of how to operate a new process or make a new product. A bank evaluating the foreclosure option is likely to discount an R&D laboratory and the human capital vested in its employees far more highly than it will discount the value of an office building or factory full of general purpose equipment. Thus both cash flow and asset specificity considerations argue strongly that leveraged buyouts will not take place in firms and industries in which research and development is important.
21. Kohlberg, Kravis, Roberts, and Co. (1989). 22. Williamson (1988).

Bronwyn H. Hall 97
In the following empirical investigation I confirm that this is indeed the case.
In my sample of approximately 700 acquisitions of publicly traded manufacturing firms between 1977 and 1988, I was able to identify about 80 acquisitions as leveraged buyouts using several sources: a list supplied to me by Steven Kaplan, the Wall Street Journal articles re- porting the event, and the Merger and Acquisition Sourcebook, which reports the type of financing used to make an acquisition.23 The re- mainder of the acquisitions in which the acquirer was not another pub- licly traded firm (about 180 of them) were generally smaller and could not be clearly identified as management or leveraged buyouts, although it is very likely that a large number of them were.24
Table 2 shows the total number of acquisitions each year between 1977 and 1987 and the number of those that were leveraged buyouts and other "going private" transactions.25 To give an idea of the in- creasing size and importance of the leveraged buyouts, the table shows the total employment involved, the average number of employees in each type of deal, and the percent of manufacturing sector employment that was affected. The number and size of each leveraged buyout in- creased during the mid-1980s, while the private acquisitions remained roughly constant in size (but increasing in number). However, note that only in 1987 did the number of employees affected rise above 1 percent of the total. Although a great deal of ink has been spilled about these types of transactions, they are still small relative to the sector as a whole.
23. Approximately two-thirds of these leveraged buyouts were also management buy- outs, in the sense that current management ended up owning a controlling interest in the new company.
24. I also cross-checked my lists of leveraged buyouts and going-private transactions against the list in Lehn and Poulsen (1989). Their sample consists of all going-private events announced in the Wall Street Journal between 1980 and 1987, so their sample is a subset of mine in time but a superset in industry coverage. Sixty-five out of 76 of my leveraged buyouts and 60 of my 173 going-private transactions appeared on their list; they clearly identify the going-private transaction with an increase in leverage, so I think it highly likely that at least those 60 are indistinguishable from my leveraged buyouts except with respect to size.
25. Excluded from this table are transactions that took place in 1988 and 1989 because this part of the sample is incomplete and would give a misleading picture of the aggregate. This reduces the total number of acquisitions from about 830 to 780.

Table 2.
Leveraged
Buyouts
and
"Going
Private"
Transactions,
Manufacturing
Sector,
1977-87
Percent of
total
Number
Average
employmenta
employment
Other
"Going
"Going
Leveraged
"going
private"
Leveraged
private"
Leveraged
private"
Year
Acquisitions
buyouts
transactionsb
buyouts
transactionsb
buyouts
transactionsb
1977
29
1
6
0.6
1.7
0.003
0.05
1978
59
0
11
n.a.
1.6
.
.
.
0.08
1979
48
1
8
1.3
1.9
0.006
0.07
1980
41
2
2
6.8
0.8
0.07
0.01
1981
71
3
16
6.5
2.6
0.10
0.20
1982
63
8
17
4.4
2.9
0.17
0.25
1983
68
9
13
3.7
1.1
0.16
0.07
1984
89
19
26
4.9
4.0
0.47
0.52
1985
96
12
28
11.1
1.9
0.69
0.27
1986
117
11
27
15.7
3.1
0.93
0.45
1987
99
10
19
22.7
3.4
1.26
0.38
Total
780
76
173
...
...
.
.
.
.
Industry
average
.
.
.
.
.
.
.
.
.
9.6
2.6
.
.
.
.
Source:
Standard
and
Poor
(1978-87).
n.a.
Not
available.
a. In
thousands of
year-round
employees.
b.
Acquisitions
where
the
acquirer
was
not
publicly
traded,
but
the
acquisition
could
not be
identified as a
leveraged
buyout in
any of
my
sources.
Bronwyn H. Hall 99
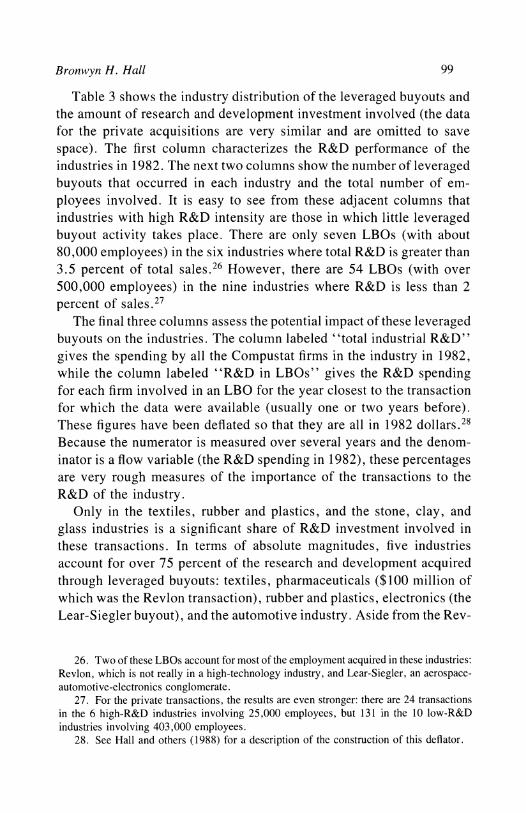
Table 3 shows the industry distribution of the leveraged buyouts and the amount of research and development investment involved (the data for the private acquisitions are very similar and are omitted to save space). The first column characterizes the R&D performance of the industries in 1982. The next two columns show the number of leveraged buyouts that occurred in each industry and the total number of em- ployees involved. It is easy to see from these adjacent columns that industries with high R&D intensity are those in which little leveraged buyout activity takes place. There are only seven LBOs (with about 80,000 employees) in the six industries where total R&D is greater than 3.5 percent of total sales.26 However, there are 54 LBOs (with over 500,000 employees) in the nine industries where R&D is less than 2 percent of sales.27
The final three columns assess the potential impact of these leveraged buyouts on the industries. The column labeled "total industrial R&D" gives the spending by all the Compustat firms in the industry in 1982, while the column labeled "R&D in LBOs" gives the R&D spending for each firm involved in an LBO for the year closest to the transaction for which the data were available (usually one or two years before). These figures have been deflated so that they are all in 1982 dollars.28 Because the numerator is measured over several years and the denom- inator is a flow variable (the R&D spending in 1982), these percentages are very rough measures of the importance of the transactions to the R&D of the industry.
Only in the textiles, rubber and plastics, and the stone, clay, and glass industries is a significant share of R&D investment involved in these transactions. In terms of absolute magnitudes, five industries account for over 75 percent of the research and development acquired through leveraged buyouts: textiles, pharmaceuticals ($100 million of which was the Revlon transaction), rubber and plastics, electronics (the Lear-Siegler buyout), and the automotive industry. Aside from the Rev-
26. Two of these LBOs account for most of the employment acquired in these industries: Revlon, which is not really in a high-technology industry, and Lear-Siegler, an aerospace- automotive-electronics conglomerate.
27. For the private transactions, the results are even stronger: there are 24 transactions in the 6 high-R&D industries involving 25,000 employees, but 131 in the 10 low-R&D industries involving 403,000 employees.
28. See Hall and others (1988) for a description of the construction of this deflator.

Table 3.
Leveraged
Buyouts, by
Industry,
1977-87
Industrv
ratio of
1982
industrial
R&D to
sales,
Number
Employees
R&D
R&D in
LBOs
Percent of
Inidustrya
1982
(percent)
of
LBOs
(thousands)
(millions of
dollars)
(1982
dollars)
R&D in
LBOs
Food
and
kindred
products
0.57
11
142.4
917.0
6.6
0.7
Textiles
and
apparel
0.25
16
201.1
73.0
60.1
82.3
Chemicals
excluding
drugs
2.66
1
6.3
4,033.6
2.4
0.06
Pharmaceuticals
and
medical
equipment
5.54
4
43.9
3,556.4
118.8
3.3
Petroleum
refining
and
extraction
0.53
0
n.a.
3,548.2
n.a.
0
Rubber
and
miscellaneous
plastics
1.90
5
51.7
733.4
59.1
8.1
Stone,
clay,
and
glass
1.16
3
63.2
263.0
23.7
9.0
Primary
metals
0.66
2
10.0
370.4
4.2
1.1
Fabricated
metal
products
0.92
8
31.7
331.6
12.3
3.7
Engines,
farm
and
construction
equipment
2.47
3
14.8
1,125.2
22.7
2.0
Office,
computer,
and
accounting
equipment
6.25
0
n.a.
7,858.5
n.a.
0
Other
machinery,
not
electric
2.00
6
13.9
617.3
8.2
1.3
Electric
equipment
and
supplies
3.72
1
1.2
2,891.5
1.3
0.04
Electronic
equipment
4.22
1
29.1
5,902.3
35.0
0.6
Motor
vehicles
and
transportation
equipment
3.38
5
91.9
2,969.5
74.1
2.5
Aircraft
and
aerospace
3.88
0
n.a.
3,249.6
n.a.
0
Professional
and
scientific
equipment
6.31
1
3.5
746.5
9.5
1.3
Lumber,
wood,
and
paper
1.08
3
7.1
701.8
0.6
0.09
Miscellaneous
manufacturers
0.19
6
17.0
448.1
3.8
0.8
Total
1.81
76
728.9
40,341.9
442.8
1.1
Source:
Standard
and
Poor
(1978-87).
n.a.
Not
available.
a.
The
composition of
industry
classes is
given in
the
appendix
table.

Bronwvyn H. Hall 101
Ion and Lear-Siegler deals, the main story seems to be one in which the leveraged buyout facilitates the shrinkage of an older, low-tech- nology industry.29 Such industries already have had low R&D spending for a long time, so increases in LBO activity have very little effect. Another way to see this is to note that the 729,000 employees involved are about 4 percent of the total employment in 1982, while the $443 million of R&D is only 1 percent of the total in 1982. The industries involved as well as the relative unimportance of research and devel- opment confirm that LBO activity is largely confined to sectors that are not technologically oriented.
The subsequent history of firms that went private through leveraged buyouts is difficult to study because in many cases they no longer were required to file lOKs with the Securities and Exchange Commission. This is in fact one of the stated reasons for going private. But for at least some of these LBOs, it is possible to find publicly reported post- buyout data. In his sample of about 40 LBOs, Kaplan finds that only 7 were performing R&D before or after the buyout.30 Abbie Smith examines the post-buyout performance of 58 management buyouts, most of which were leveraged transactions (three-quarters of them doubled their debt and had a debt-capital ratio above 0.83 after the management buyout). These firms perform little or no research and development (80 percent report no R&D expenditure and only five report expenditures in excess of $5 million before the management buyout). For the small number of R&D-performing firms in the sample, she finds no decline in the ratio of R&D to sales after the buyout.31
Using an entirely different sampling methodology (the establishment- based Census of Manufacturers coupled with data from the National Science Foundation RD-I survey), Frank Lichtenberg and Donald Sie- gel analyzed the 43 firms that underwent LBOs between 1981 and 1986 and are also in the NSF RD-I survey.32 They found that the R&D
29. This fact has already been noted by Kaplan (1989); and Lichtenberg and Siegel (1989).
30. Steven Kaplan, private communication, 1989. 31. Smith (1989). 32. Lichtenberg and Siegel (1989, p. 29). Their sample of entire-firm LBOs between
1981 and 1986 consists of 80 LBOs that account for about 70 percent of the aggregate LBO value during that period. Although there is undoubtedly substantial overlap with my sample of 62 during the same period, the samples will not be identical.

102 Brookings Papers: Microeconomics 1990
intensity of those firms that were performing R&D increased by roughly the same amount as that of non-LBO firms during the same period, although the average intensity of even the R&D-performing firms that underwent LBOs was half that of the sample of R&D performers as a whole. This last fact is entirely consistent with my results and with those of Kaplan and Smith.
Restructurings that take manufacturing firms private do not pose a major threat to R&D investment in the United States. This is not because research and development is necessarily maintained at the same levels after such transactions (which often do involve increased levels of debt), but because R&D-intensive firms and high-technology industries are not good candidates for these acquisitions. Even in those cases in which an R&D-performing firm does undergo a leveraged buyout, the newly private firm tends to maintain the same pattern of investment. These facts, together with Lichtenberg's and Siegel's results on productivity increases following LBOs, lend credence to the "efficient markets" view of this type of restructuring activity.33 The next section discusses a far more important set of acquisitions: those by other publicly traded firms. These affect three times as many employees as do private ac- quisitions.
Acquisition Activity in the Manufacturing Sector
Hypotheses about the effects of mergers and acquisitions within the manufacturing sector on R&D spending and innovation are somewhat murkier than those I discussed in the previous section. To the extent that the forces driving these types of mergers are synergistic, one ex- pects that R&D-performing firms will acquire other firms when their R&D output can be put to use and also that mergers between R&D- performing firms in similar industries will be followed by reductions in R&D intensity if there are scale economies in research and devel-
33. Lichtenberg and Siegel (1989, p. 32). They find significant increases in productivity growth at the plant level in the five years following a leveraged buyout and substantial reductions in central office overhead expense, which argues for the efficiency-enhancing aspects of these transactions.

Bronwynz H. Hall 103
opment.34 These hypotheses do not imply particularly negative con- sequences from increased merger activity. In addition, if the merged firms eliminate duplicative research and development, there may be a social as well as a private benefit. The view that such transactions have a negative impact seems to arise from the idea that undervalued R&D- intensive firms are being bought up in order to reduce their R&D spend- ing and milk their current profitable activities for cash (in other words, from the idea that the market is myopic).
The evidence to date favors the synergistic motive for mergers in- volving R&D-intensive firms. Using a large panel of U.S. manufac- turing firms (with data on both parties in approximately 300 acquisitions), I investigated the relationship between R&D investment and the increase in acquisition activity in the U.S. corporate sector in the early 1980s as well as the R&D characteristics of the merging firms.35 A strong predictor of acquisition of one firm by another was their similarity in R&D intensity, even when I controlled for mergers in the same industry. R&D-intensive firms like to buy other R&D-intensive firms whether or not they are in the same industry. This evidence is consistent with earlier evidence that firms like to diversify into industries where they can make use of their specialized knowledge and R&D output.36
When I examined the change in R&D intensity for the combined firms before and after merger over two- and three-year intervals, I did not find significant declines in spending, although the relatively short intervals after merger and small samples at the industry level made the tests somewhat less than conclusive. Using a much smaller sample of significant financial restructurings (nine observations) Herbert Fusfeld reached the same conclusion.37 In both studies, there is evidence that longer periods after merger should be examined, and neither study differentiated acquisitions on the basis of diversification. In addition, the National Science Foundation's recent study of 24 major mergers and restructurings shows a substantial decline in R&D spending after
34. Although this prediction cannot be precisely stated in light of the arguments in Fisher and Temin (1973), the general idea holds that increased scale economies in the production of innovative output will lead to reductions in R&D for a firm that does not change its strategy or product mix too much after an acquisition.
35. Hall (1988a). 36. Lemelin (1982); and MacDonald (1985). 37. Fusfeld (1987).

104 Brookings Papers: Microeconomics 1990
acquisition or other restructuring.38 All of this suggests that the question is worth further investigation.
Why are the NSF's results different from mine and Fusfeld's? There are several possibilities: it used a different data source (the RD- I survey conducted for the NSF by the Census Bureau, which is confidential); it examined a somewhat more recent period; it focused specifically on restructurings that are not necessarily acquisitions; and it used a dif- ferent measure of R&D performance (the level of R&D expenditures rather than R&D intensity). The differences between the two data sources for R&D spending (the 1OK report and the RD-I survey) are unlikely to be systematically biased, although they are undoubtedly different.39 However, as Lichtenberg and Siegel point out, the NSF sample con- sisted of 1 major LBO and 7 other restructurings in addition to 16 acquisitions, so the samples are not directly comparable.40 The most important difference is that NSF used the level of R&D investment rather than the intensity, which is the relevant concept if one is interested in aggregate behavior but is misleading at the firm level, since it fails to adjust for the overall change in the average size of manufacturing firms during the same period. The discrepancy is magnified both because the majority of these restructurings seem to be directed at shrinking the firms and because the overall size of the manufacturing sector was shrinking at the same time. If R&D falls proportionately, it is not obviously a distinct phenomenon (although some might argue a causal relationship).
Using the 340 acquisitions in my new sample for which there were data before and after the acquisition, I repeated the test for post- acquisition declines in R&D intensity from my earlier study (there is about 80 percent overlap in the samples). The distribution of two-year changes in combined-firm R&D intensity for firms that participated in mergers and for those that did not is shown in figures 3 and 4. For firms that were not acquired, the average two-year change over the whole
38. National Science Foundation (1989). 39. At the individual-firm level, the primary differences are that the NSF numbers do
not include R&D spending by U.S. firms abroad, nor do they include contracted out research or some routine engineering expenditures (Burke, 1985). None of these differences (which affect a subset of the firms, mostly the larger ones) is likely to be large enough to change conclusions about R&D growth in firms undergoing acquisition.
40. Lichtenberg and Siegel (1989, p. 31).

Broniwyn H. Hall 105
Figure 3. Two-Year Change in R&D Intensity (includes non-R&D performers)
Percent of firms 60 -
5 - Acquisitions 50 _ | (336 firms)
o All 40 - (1,772 firms)
30-
20-
10
0 -1.75 -1.25 -0.75 -0.25 0.25 0.75 1.25 1.75 2.25 2.75
Change in ratio of R&D to sales (percent)
Source: See figure 2.
Figure 4. Two-Year Change in R&D Intensity for Acquiring and Nonacquiring Firms
Percent of firms 45 -
40 - Acquisitions 35 - (227 firms)
30 - ~ ~ ~ ~ ~ ~ ~ ~ ~ ~ ~ OAll 30urce:(1,174 firms)
25-
20-
15-
10
5
0 Af -1.75 -1.25 -0.75 -0.25 0.25 0.75 1.25 1.75 2.25 2.75
Change in ratio of R&D to sales (percent)
Source: See figure 2.

106 Brookings Papers: Microeconomics 1990
1976 to 1987 period is used. Figure 3 shows the changes for all firms, including those that report no research and development during the period. Figure 4 shows the changes only for those firms that do have R&D data before and after the acquisition.41 Figure 3 tells a slightly different story from my 1987 paper: there does appear to be a significant difference between the distributions for mergers and nonmergers. This is confirmed by a nonparametric Wilcoxon test for differences in the distribution, which yields a X2(l) = 7.2. The difference between the two distributions is small, but it is significant. However, it does not occur when the sample is confined to firms that reported research and development both before and after the acquisition; for the data of figure 4 the Wilcoxon test yields a X2(l) = 1 .0. (In spite of the similarity of figures 3 and 4, the smaller sample and number of declines in firms that did not merge yield this insignificant result.) This implies that most of the decline is coming from R&D-performing firms that are absorbed into firms that do not report research and development.42 Unfortunately, because many of these firms are much smaller than those that acquire them, it is not possible to tell whether their R&D spending has been cut or the acquirer simply has not deemed it "material" enough to justify reporting.
To examine this question in a different way and to investigate whether the result has changed over time, I focus on the change in R&D intensity of the acquiring firms by performing a simple comparison of means while controlling for differences across industry and time in the average firm R&D intensity. In other words, I ask the question: In the years
41. Firms are mandated by the Financial Accounting Standards Board and the SEC to report R&D expenditures, if they are "material," in their annual reports. Most of the firms in the technology sector do so, particularly since they view it as a positive signal for investors. When research and development is not reported, it usually means that the R&D to sales ratio is very low. However, there can be exceptions to this rule for some firms in some years; for the small number of cases where this happens for one year out of many with positive R&D, I have interpolated the missing number.
42. There are about 80 such firms in the sample, and about 50 firms that did not report R&D before being acquired, but whose acquirers did afterward. The number of acquirers that switch from reporting R&D to nonreporting or vice-versa around the time of acquisition is about 30, with a larger number electing to stop reporting (20) than start (10). Thus more firms choose to treat R&D spending as nonmaterial after acquisition than switch to reporting it, which leads to a small decline in average R&D intensity when these firms are included. However, the probability of making a reporting switch, conditional on the state in which the firm finds itself before acquisition, is the same for either nonreporting or reporting.

Bronwyn H. Hall 107
Figure 5. R&D Intensity of Acquiring Firms Relative to Industry, 1977-87
Ratio of R&D to sales (percent) 0.50 - Year of
acquisition
_ - One year after acquisition
-0.50 - Two years after
A ~~~~~~~~acquisition
-1.50 .. _I.-../. acquisition -2.00 .
1977 1979 1981 1983 1985 1987 Year of acquisition
Source: See figure 2.
immediately following the transaction, how does the R&D intensity of those firms in my sample that acquired other firms differ from that of other firms in the same industry during the same period? I regress the R&D intensity for each firm-year observation on a set of industry and year dummies and on dummies for whether this particular firm is zero, one, two, or three years away from having acquired another firm in my sample. This regression is performed with the hypothesized "acquisi- tion" effect assumed to be constant over all the years and to vary from year to year. If the acquisition mix is changing over time, this latter method is required to avoid biasing the estimates of the effect. It also reveals whether the difference in my results with data through 1985 and 1987 is caused by a shift in behavior.
The results of these regressions are shown in figure 5 (for R&D- performing firms only) and summarized in table 4 for both groups. The top half of this table shows results for all the firms in all the years; any observations that have no R&D data are treated as zero R&D obser- vations (which most but not all of them will be). The bottom half of table 4 shows the same thing only for those firms that report R&D expenditures. For all firms, the average effect is negative, and it in-

108 Brookings Papers: Microeconornics 1990
Table 4. Postacquisition R&D Intensitya
Dumnmy if acquisition occurred
1 year 2 years 3 years F- Other variables This year before before before staltisticb
20,197 observations (iniclludes non-R&D performners) Year dummies,
industry dummies - .238(.191) - .304(.205) - .347(.228) - .261(.253) 1.67 Year dummies,
(RIS) - 1 -.095(.113) -.129(.122) -.145(.135) -.040(.150) 0.73 Year dummies,
(RIS)-2 -.202(.144) -.215(.155) -.263(.172) -.171(.191) 1.66
12,291 observations (R&D petformers onily) Year dummies,
industry dummies - .605(.281) - .762(.301) - .815(.340) - .739(.375) 4.79 Year dummies,
(RIS) - 1 -.235(.173) -.280(.185) -.301(.209) -.157(.230) 1.58 Year dummies,
(RIS) 2 -.446(.217) -.487(.232) -.551(.262) -.407(.289) 3.54
Source: Author's calculations; anid Standard and Poor ( 1978-87). a. The dependent variable is the R&D to sales ratio (percent). b. For a test that the four acquisition effects are zero.
creases one or two years out from the acquisition, reaching almost one half of 1 percent in the second year after the acquisition. However, even in this year the coefficient is not significant at conventional levels (a t-statistic of 1.6), and the individual-year effects vary widely and are all insignificant. The predominant effect appears to be negative, but there is huge variability in R&D performance even within an in- dustry, and this dominates the estimates of the differences of the means. The results when the sample is confined to R&D-performing firms are stronger and statistically significant: relative to their industry, R&D- performing firms that make acquisitions have become less R&D-inten- sive over time (observe the decline in table 4).
Measuring intensities relative to industry means tells something about the type of firms making acquisitions but not much about the actual change postacquisition. Therefore table 4 also shows the postacquisition means relative to the firm's own lagged R&D intensity instead of the average industry level, and I find that the effects are smaller and less significant. However, the first lag of R&D intensity occurs during the year in which the acquisition took place, which may be an atypical year

Bronwyn H. Hall 109
for the firm's data. Therefore, table 4 also shows the results for R&D intensity lagged twice (using the year before acquisition to control for the acquiring firm's average R&D to sales ratio). These results are closer to those I obtain when I control only for the R&D intensity of the firm's two-digit industry, and they are somewhat more precisely estimated. They seem to indicate that R&D performers reduce their R&D intensity by about one half of 1 percent following an acquisition.43 I checked whether this reduction might have something to do with scale economies in research and development by including a dummy for the approximately 100 firms that acquired others in the same two-digit industry. These firms, I found, increased their R&D intensity rather than reducing it as implied by the hypothesis, although the average amount of the increase was not significant (not shown).
Figure 5 displays these results in somewhat more detail for the R&D- performing firms: it shows how the difference in mean R&D intensity between acquiring and nonacquiring firms evolves relative to the firms' two-digit industry. The four lines in the figure show the effects zero to three years from the date of the acquisition. The acquisitions in the later years are followed by far greater declines in R&D intensity, and the declines appear to be permanent, in the sense that they do not become any smaller even three years after the acquisition. Although still insig- nificant, the declines are quite large in economic terms, a change of intensity of more than 1 percent in some years.44
Because of the near constancy of the effect over several years after the acquisition, I chose to constrain the acquisition effect to be per-
43. The difference between these results (which show marginally significant declines for R&D performers and not for the whole sample) and those in figures 3 and 4 (which show the reverse) arises from the different approaches I took to measure the effect. In the first I averaged over the whole period and included the preacquisition behavior of the target, whereas in the second I focused on the acquirer only and allowed for a shifting effect over time. The results in table 4 are probably a slightly more informative way of looking at the problem since the small size of many of the acquisitions means that their R&D tends to be absorbed by nonreporting firms in many cases.
44. The lack of conventional statistical significance may be due to the inadequacy of the probability model I am using to construct the test. However, the major defect in my model is that I treat each firm-year as a random draw net of time and industry effects, rather than allowing for correlation across years for each firm. One expects that allowing for such correlation would actually lower the significance level. One can get an idea of what the result would be by looking at the t-statistics for the regression, where I include the firm's own lagged R&D intensity (the second, third, fifth, and sixth rows of table 4), which is almost like including a fixed-firm effect in the model.

110 Brookings Papers: Microec onomic s 1990
Figure 6. R&D Intensity of Acquiring Firms after Acquisition, 1977-87
Ratio of R&D to sales (percent) 0.4 - Relative to
0.2 industry - - Relative to
0 R&D intensity J/ %%% ~~~~lagged
-) 2 04 . * < s > ,, ., ...... Relative to % . .- ss .. ....R&D intensity
-0.6 % lagged twice
-0.8
- 1.0
-1.2
-1.4 1977 1979 1981 1983 1985 1987
Year of acquisition
Source: See figure 2.
manent (that is, to permanently lower the expected R&D intensity of the acquiring firm). These results are shown in figure 6, which compares the R&D intensity relative to that of a firm's industry and to its own lagged intensity. The pattern here is striking: over time, the ratios of R&D to sales for acquiring firms are falling substantially relative to their industry, but when I control for the past R&D to sales ratio of the firm itself, there is no such decline (for one lag) or only a small effect (for two lags). This suggests that the mix of firms performing acqui- sitions from 1977 to 1987 was shifting toward those with low R&D intensity relative to their own industry.
What should we conclude from this? Even if we concede that the interpretation of the results is difficult because we cannot assume a one- way causal relationship between the making of an acquisition and the R&D intensity of the firm in succeeding years (since both are aspects of a particular corporate strategy of a particular firm), the fact remains that evidence of a large systematic decline in R&D intensity after ac- quisition is slim, with the following two qualifications. First, there may be a negative effect during the 1980s (a succession of negative coef-

Bronwyn H. Hall 111
ficients), even though the evidence in the 1977-81 period was mixed. Second, what effect there is appears to be cumulative and permanent since it is still growing slightly in the second and third years after the merger. The permanence of the effect suggests that the acquisition and associated decline in research and development may represent a long- term shift in strategy by the firm, rather than just transitory adjustment costs.
Figure 6 helps to reconcile this result with my earlier Wilcoxon test for differences in the growth of R&D intensity between acquiring and nonacquiring firms. It shows that it makes a big difference how finely one controls for preacquisition R&D intensity (that is, whether one uses firm or industry levels during the 1980s). Clearly, the firms making acquisitions have shifted during the 1980s toward the less R&D-inten- sive ones within an industry. In the next section of the paper, I dem- onstrate that even the small negative effect of making an acquisition on R&D spending that was in evidence during this period could be due to the fact that many of these acquisitions are financed with debt.
Leverage and Research and Development
Increases in debt levels for R&D spending are followed by declines in R&D intensity as predicted by the hypotheses cited earlier. This finding is fairly robust to the specification of leverage and R&D inten- sity. The small negative effects on R&D following acquisitions (see table 4 and figures 5 and 6) are due to the associated increases in leverage rather than to the acquisitions themselves (that is, the acquisition effects are insignificant once changes in leverage are taken into account).
Why might leverage be particularly negative for R&D investment? Many authors have suggested reasons why the cost of external capital (debt or equity) may be higher for R&D projects than for physical investments. Hayne Leland and David Pyle, as well as Richard Kihl- strom and Steve Matthews, argue that there is a moral hazard problem in transferring information about a risky project from an entrepreneur (firm) to investors (shareholders or debt holders), which leads to a preference for retained earnings as a source of finance for this type of investment.45 Sudipto Bhattacharya and Jay Ritter have shown that if
45. Leland and Pyle (1977); and Kihlstrom and Matthews (1990).

112 Brookings Papers: Microeconomics 1990
there is a cost for revealing information about innovative projects to the market (and hence to potential competitors), firms will also find the cost of external capital higher than that of internal finance.46 In the case of debt finance there is an additional problem, since banks (and other bondholders) often prefer some sort of tangible security that can be sold in the event of default. In cases where retained earnings are not available for R&D investment, such as new startups, substantial equity shares (in the form of venture capital), not long-term bonds, are the rule.
These arguments, together with old and new empirical evidence on liquidity and investment, restore the link between investment and the source of finance that was broken by Franco Modigliani and Merton Miller.47 The arguments also imply that the cost of external finance, especially debt, will be higher when investment projects are more un- certain, will produce fewer redeployable assets, will have knowledge externalities, and will be subject to more severe asymmetric information problems between owners and managers. Internal finance will be pre- ferred more for innovation and R&D investment than for ordinary in- vestment; an implication of this is that an exogenous increase in the fraction of earnings devoted to interest expense, such as that caused by an increase in long-term debt, will penalize these types of investments.
Testing this hypothesis is difficult because investors are not unaware of this link between investment and financial policy. A finding that leverage decreases R&D investment may only imply that the investment opportunities of particular firms at particular times do not have a high enough expected return to justify the cost of financing them. Therefore, reducing R&D while increasing debt may be the optimal policy for a firm, at least privately. In spite of the problem of interpretation, it is worthwhile to investigate the consequences of substantial leverage in- creases; full consideration of the simultaneity problem awaits further work.48
I followed two approaches in gathering the facts on leveraged re- structurings. The first approach, similar to the one I used for acquisi-
46. Bhattacharya and Ritter (1983). 47. For examples of old and new evidence, see Meyer and Kuh (1957); and Fazzari,
Hubbard, and Petersen (1988). 48. It is not simply a problem of simultaneity of the leverage and investment decision;
the problem is also that individual-firm rationality in this setting may not be socially optimal since this type of investment has been shown repeatedly to have substantial externalities.

Bronwyti H. Hall 113
tions, simply compared the mean R&D intensity of leveraging firms with the others. The second used the more traditional investment regres- sion framework to investigate the consequences of increases in leverage on future R&D investment. Both yielded similar results: strong evidence of declines in R&D investment following substantial increases in le- verage.
I defined a "leveraged restructuring" as a firm-year when the in- crease in a firm's long-term debt was greater than 75 percent of its total market value (debt plus equity) at the beginning of the year. There were 177 of these restructurings; their size-weighted distribution by year is given in the last column of table 1. Unlike the other types of restruc- turings, these refinancings show two periods of increased activity: the early 1980s and 1985 to 1987.
Table 5 presents the industry and R&D characteristics of the firms involved in such restructurings. Unlike the leveraged buyouts shown earlier, these transactions took place in all types of industries, although there does seem to be a preference for those that are relatively capital intensive (chemicals; petroleum; stone, clay, and glass; machinery; motor vehicles; aircraft) and avoidance of the truly high-technology industries (electronics, professional and scientific instruments). This confirms the importance of redeployable assets in debt financing. The firms in question are less R&D intensive than the others in their industry. (Compare the fraction of industry employment with the fraction of industry R&D or the average R&D intensity with the 1982 industry intensity shown in table 3.) Thus even here the inappropriateness of high leverage for R&D-intensive firms is evident.
I performed the same kind of investigation of post-transition R&D intensity as I did of manufacturing sector acquisitions. When I computed the average R&D intensity of leveraging firms zero to three years after the transaction, relative to the firms in their industry, I found again that the changes in R&D intensity were essentially permanent after leverage as they had been after acquisition. Therefore, I treated these effects as such in order to reduce the year-to-year sampling variability.
Figure 7 shows what happens to the R&D intensity of firms after a major leveraging event, relative to their industry and relative to the firms' history. The effects are similar to those shown in figure 6: the mix of firms undergoing leveraging shifted in the late 1970s and early 1980s toward non-R&D-intensive firms and the R&D intensity of lever-

Table 5.
Financial
Restructurings
with
Substantial
Debt-Equity
Changes,
1977-87a
R&D
Employees
Percent
industry
(millions of
Percent
industry
R&D
Industryb
Number
(Thousands)
employees
1982
dollars)
R&D
intensityc
Food
and
kindred
products
14
32.0
1.6
1.7
0.2
0.1
Textiles
and
apparel
11
63.0
10.8
3.3
4.5
0.1
Chemicals,
excluding
drugs
5
138.5
10.5
546.3
13.5
1.3
Pharmaceuticals
and
medical
instruments
5
46.2
5.7
109.6
3.1
4.0
Petroleum
refining
and
extraction
5
224.9
13.1
400.9
11.3
0.8
Rubber
and
miscellaneous
plastics
7
8.1
2.0
0.3
0.04
0.3
Stone,
clay,
and
glass
5
30.6
11.6
30.5
11.6
0.4
Primary
metals
11
30.3
4.0
1.8
0.5
0.1
Fabricated
metal
products
9
15.3
3.2
5.4
1.6
0.3
Engines,
farm
and
construction
equipment
7
13.0
3.0
20.5
1.8
1.0
Office,
computer,
and
accounting
equipment
7
65.0
5.4
278.1
3.5
7.6

Other
machinery,
not
electric
18
90.9
18.4
113.7
18.4
2.0
Electric
equipment
and
supplies
8
29.3
1.9
13.5
0.5
0.2
Electronic
equipment
6
2.8
0.2
3.5
0.06
1.5
Motor
vehicles
and
transportation
equipment
9
168.5
10.4
460.9
15.5
0.4
Aircraft
and
aerospace
5
88.2
7.6
102.7
3.2
1.3
Professional
and
scientific
equipment
2
2.2
0.4
0.0
0
0.0
Lumber,
wood,
and
paper
14
21.5
2.8
10.1
1.4
0.5
Miscellaneous
manufacturers
29
69.3
2.8
1.6
0.4
0.3
Total
177
1,139.6
.
.
.
2,104.4
.
.
.
...
Industry
average
.
.
.
.
.
.
5.8
.
.
.
5.2
1.0
Source:
Standard
and
Poor
(1978-87).
a. A
restructuring is
defined to be a
firm
whose
long-term
debt
increases in
one
year by
more
than 75
percent of
the
total
market
value of
the
firm.
b.
The
composition of
industry
classes is
given in
the
appendix
table.
c.
Ratio of
R&D
expenditures to
sales
(percent).

116 Brookings Papers: Microeconomics 1990
Figure 7. R&D Intensity of Leveraging Firms after Leveraging, 1977-87
Ratio of R&D to sales (percent) 0.5 - Relative to
industry
\ - - Relative to 0 ~~~~~~~~~~~~~~~~~R&D intensity
5 r .... / , Relative to R&D intensity lagged twice
-1.0
-1.5
-2.0 X l l l l l l l 1977 1979 1981 1983 1985 1987
Year of leverage
Source: See figure 2.
aging firms declined substantially. Although the effect is smaller when I control for the firms' own behavior, there is still a decline in R&D spending that is roughly constant throughout the period (about one half of 1 percent of sales).49 The individual-year effects are still jointly insignificant, but the overall decline has a t-statistic of 3.0 (remember that neither of these tests is completely valid because of the lack of independence across observations). The absolute magnitude of the ef- fect is rather large: a difference of 1 percent in R&D intensity is a 20 percent difference in R&D if the average level is 5 percent of sales (which is typical of R&D-performing firms).
This first approach to studying the effects of leverage treated it as though it were a discrete event in order to compare the results directly to those for the other restructurings. However, the change in the le- verage for these firms is actually distributed as a continuous variable, for which I have arbitrarily chosen a cutoff of 0.75 to define a restruc-
49. Figures 6 and 7 use only data for R&D-performing firms, about 11,000 firm-year observations; the results are very similar if I use all 19,000 observations and treat firms that do not report R&D for one or more years as having zero R&D during those years.

Bronwyn H. Hall 117
turing.50 To make the results more precise and to relate this work more closely to the traditional investment literature, I give the results of several R&D investment equations in tables 6 and 7.
Table 6 shows the results of a regression of R&D intensity of all the firms on the first three lags of the leverage changes; the coefficients in this regression are the change in R&D intensity (measured in percent) per an absolute change in leverage ratio, measured as the increase in debt in the year divided by the total market value of the firm (debt plus equity). I have again included year, industry, and the lagged R&D intensity for the firm as controls. The results are quite interesting: whether one looks at all firms or only at R&D performers, R&D intensity falls following an increase in leverage. The full effect is about - 0.6 to -0.8, and it takes at least three years to work (using the numbers in the second and fourth columns). At the cutoff change in leverage used earlier, this is an absolute change of 0.5 to 0.6 percent in the R&D to sales ratio, which is consistent with figure 7. For a typical R&D- performing firm with an R&D to sales ratio of 3.7, this would imply a decline in R&D spending of about 15 percent, which is not negligible. Of course, most firms in most years do not experience this kind of leverage increase, so the aggregate declines will not be huge.
In this regression I investigated the role of acquisitions by including a dummy for firms that had acquired one of the firms in the sample during the past three years. I also interacted that dummy with the change in leverage to see if there was a separate additive effect from acqui- sitions. (The results on leverage were not significantly affected by in- cluding these variables, so I show only the combined regression.) The acquisition effect in figure 6 is largely accounted for by controlling for changes in leverage.5' The F-statistic for including these variables is very insignificant, in part because the coefficients are so poorly mea- sured. Leverage does not appear to have any greater effect when it is
50. To check the results, I also used 0.5 as a cutoff. As expected, the negative coef- ficients were slightly smaller and more precisely measured due to the larger sample. This suggests that using a continuous variable as I do in the following may be a better idea.
51. An earlier version of this paper (November 1989) investigated the question of debt- financed acquisitions somewhat more thoroughly and concluded that they were difficult to identify in the data, mostly because many debt increases and acquisitions that occurred in the same year appeared to be unrelated. In addition, acquisitions associated with increases in leverage did not appear to be different from acquisitions in general. The results in table 6 support this idea.

Table 6.
R&D
Intensity
and
Changes in
Leverage,
1977-87a
Includes
non-R&D
performers
R&D-performing
firms
only
Variablesb
(16,498
observations)
(9,982
observations)
Leverage
effect
for all
firms
ALev -
-.38(.15)
-.19(
10)
-.51(.27)
-.33(.18)
ALev- 2
-
.29(.15)
-.24(.10)
-.23(.27)
-.27(.18)
ALev-3
-.31(.14)
-.15(.10)
-.33(.26)
-.19(.18)
Acquiring
firms
postacquisition
(relative)
Intercept
-.08(.14)
-.03(.09)
-.39(.21)
-
.18(.14)
ALev- 1
-.06(.49)
-
.18(.33)
-.36(.86)
-
.13(.60)
ALev - 2
-.
13(.47)
.02(.32)
-.74(.84)
-.26(.58)
ALev 3
-
.16(.48)
.11(.32)
-.43(.90)
.21(.62)
Other
variables
Year
dummies,
Year
dummies,
Year
dummies,
Year
dummies,
in
regression
industry
dummies
RIS_2
industry
dummies
RIS2
Standard
error
3.29
2.22
3.95
2.74
F-statisticc
0.23
0.14
2.03
0.72
(DF)
(4,16462)
(4,16479)
(4,9946)
(4,9963)
Source:
Author's
calculations;
and
Standard
and
Poor
(1978-87).
a.
The
dependent
variable is
the
R&D to
sales
ratio of
the
firm in
each
year.
b.
ALev is
the
change in
long-term
debt
during
the
year
divided by
the
total
market
value of
the
firm
(debt
plus
equity) at
the
beginning of
the
year.
c.
This is
the
F-statistic
for a
test
that
the
hypothesized
acquisition
effects
are
zero in a
regression
that
also
includes
the
leverage
variables.
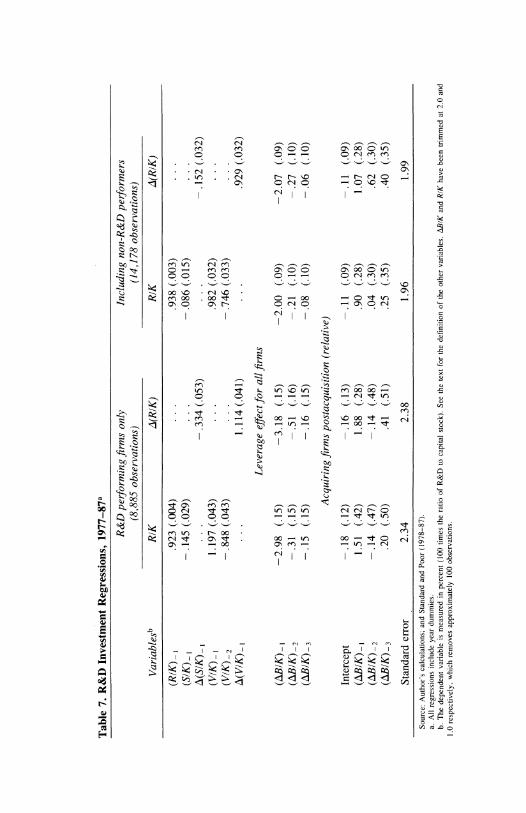
Table 7.
R&D
Investment
Regressions,
1977-87a
R&D
performing
firms
only
Including
non-R&D
performers
(8,885
observations)
(14,178
observations)
Variablesb
RIK
A(RIK)
RIK
A(RIK)
(RIK)1
.923
(.004)
...
.938
(.003)
...
(SIK)_
-.145
(.029)
.
.
-.086
(.015)
...
A(SIK)_
.
.
.
-
.334
(.053)
.
.
.
-.152
(.032)
(VIK)_,
1.197
(.043)
...
.982
(.032)
...
(VIK)-2
-.848
(.043)
.
..
-.746
(.033)
...
\(VIK)- I
...
1.114
(.041)
...
.929
(.032)
Leverage
effect
for all
firms
(ABIK)1
-2.98
(.15)
-3.18
(.15)
-2.00
(.09)
-2.07
(.09)
(ABIK)-2
-.31
(.15)
-.51
(.16)
-.21
(.10)
-.27
(.10)
(ABIK)-3
-.15
(.15)
-.16
(.15)
-.08
(.10)
-.06
(.10)
Acquiring
firms
postacquisition
(relative)
Intercept
-.18
(.12)
-.16
(.13)
-.11
(.09)
-.11
(.09)
(ABIK)-1
1.51
(.42)
1.88
(.28)
.90
(.28)
1.07
(.28)
(ABIK) -2
-.14
(.47)
-.14
(.48)
.04
(.30)
.62
(.30)
(ABIK)-3
.20
(.50)
.41
(.51)
.25
(.35)
.40
(.35)
Standard
error
2.34
2.38
1.96
1.99
Source:
Author's
calculations;
and
Standard
and
Poor
(1978-87).
a.
All
regressions
include
year
dummies.
b.
The
dependent
variable is
measured in
percent
(100
times
the
ratio of
R&D to
capital
stock).
See
the
text
for
the
definition of
the
other
variables.
ABIK
and
RIK
have
been
trimmed at
2.0
and
1.0
respectively,
which
removes
approximately
100
observations.

120 Brookings Papers: Microeconomics 1990
associated with making an acquisition of a publicly traded firm, a fact that is consistent with the idea that these types of acquisitions are just another kind of investment and are driven by other considerations.52
In table 6, measuring changes in leverage as changes in debt divided by lagged market value creates problems of interpretation, since lagged equity value, besides being a measure of the firm's current capitali- zation, is also a forecast of its future prospects, which are likely to influence its R&D spending decisions. Because equity appears in the denominator of the Lev variable, this positive association between eq- uity and research and development will appear as a negative relationship between changes in leverage and R&D spending. Because of this prob- lem, and because I would like to compare my results with previous work on investment,53 I present in table 7 the results of a set of R&D investment regressions of the conventional type, which include output (sales) S and Tobin's q (market value of equity V) variables along with lagged changes in long-term debt. All variables have been normalized by capital stock (K) at the beginning of the period in which they are measured. To avoid simultaneity problems, only lagged values of the righthand side variables are included.54 The regressions are estimated in levels and in first differenced form.
Table 7 shows that the results in table 6 are not an artifact of my choice of leverage measure. The effect of changes in debt on R&D spending is strongly negative, although now almost immediate, possibly reflecting the fact that the leverage variable ABIK has far less transitory error than the one measured with equity in the denominator. The sep- arate acquisition effects are even less significant than before. The coef- ficients on the other variables are not affected by the inclusion of the leverage and acquisition variables, and they have the standard inter-
52. For the 265 firms that acquired other publicly traded firms during this period, the three-year growth (relative to all other firms) in sales and R&D following the acquisition was almost identical: -2.7 percent and -3.8 percent respectively. For the 177 firms that experienced major increases in leverage, the same numbers were 3.0 percent and -21.7 percent.
53. See, for example, Hall and Hayashi (1989) and Lach and Schankerman (1989) and the references therein. For a recent set of investment equations at the firm level, see Fazzari, Hubbard, and Petersen (1988).
54. In this panel data setting, where variables are highly correlated within the firm, this is almost equivalent to instrumental variables with lagged values of the contemporary variables used as instruments.

Bronwyn H. Hall 121
pretations. RIK is very serially correlated at the firm level, and Tobin's q has a small but very significant positive effect. The only puzzle is the small negative coefficient on sales in the presence of q.
The size of the leverage effect is quite large for highly leveraging firms: for a firm whose debt increases by the amount of its capital stock (there are about 70 such cases), the RIK ratio falls by at least one third following the restructuring. For the 250 cases in which the debt in- creased by at least one-half the book value of its capital stock, the RI K ratio falls by an average of 25 percent. These magnitudes are com- parable with the results in table 6, which uses the R&D to sales ratio instead.
R&D intensity does seem to decline after restructurings that increase leverage, and the small declines after acquisitions are associated with increased leverage rather than the acquisition itself. Although this fact is interesting, and is consistent with anecdotal evidence, the data do not show whether the forgone projects are ones that should have been funded. In other words, I have not answered the question posed at the beginning: Are these firms levering up because the innovation oppor- tunities available to them are not attractive, or are they levering up because they fear that the market will underprice their equity if they continue their current R&D investment strategy?
Conclusion
Leveraged buyouts and other private acquisitions of publicly traded manufacturing firms are frequently taking place in sectors where R&D investment and innovation have not been important, at least to the industry as a whole. The industries and firms in question are those with the steady cash flow necessary to service the debt. They are mostly small firms in the consumer nondurable industries (food, textiles, the auto parts sector of the motor vehicle industry, the tire sector of the rubber and plastics industry, and miscellaneous manufacturing) or in- dustries that have been downsizing for some time under pressure from foreign competition and reduced innovative opportunities (textiles again, fabricated metals, and stone, clay, and glass).
The total amount of R&D spending from 1977 to 1987 was $767 million, a small fraction of the industrial R&D budget of $40 billion

122 Brookings Papers. Microeconomics 1990
in 1982. Even if this research and development were to be cut drasti- cally, it would have little impact on total spending. (Although this R&D disappeared from my aggregate statistics since the firms went private- and ceased to report to the SEC-there is evidence from Kaplan and from Lichtenberg and Siegel that in any case these firms did not reduce their spending as a result of the transaction.)55
The most dramatic results of restructuring were in those transactions in which a firm moved to a substantially higher debt position than it had been in before; here the size of the decline in R&D intensity was about 0.8 percent (from 3.4 percent to 2.6 percent) for the 1982-87 period. These results contrast with those for leveraged buyouts since many of these firms were doing significant amounts of research and development beforehand. The result is robust in the sense that it appears in a conventional investment equation as well as in the pre- and post- transaction differences in R&D intensity.
There was mixed evidence as to whether the acquiring firms in the publicly traded manufacturing sector reduced their R&D intensity as a result of the acquisition. Firms involved in acquisitions seemed to ex- perience permanent declines in their R&D intensity relative to other firms in their industry, but this effect was stronger in the later part of the period than in the earlier and was partly due to the fact that the mix of firms making acquisitions shifted during the 1980s toward firms with lower R&D intensities. Although the statistical evidence was weak, the size of the effect was large in economic terms, amounting to a one- half of 1 percent decline in R&D intensity for those firms engaged in research and development (that is, from an overall mean of 3.4 percent to 2.9 percent) for the 1982-87 period. This decline turned out to be associated with the more leveraged of the acquisitions, lending credence to arguments that cash flow affects R&D spending. The results on this question, however, are very imprecise, in spite of the large samples involved. This statistical imprecision serves to remind us that the over- whelming characteristic of a sample of firms is the variability of their experiences and the number of factors actually involved in predicting outcomes; of necessity, I have focused only on a limited part of the story.
55. Kaplan (1989); and Lichtenberg and Siegel (1989).

Bronwyn H. HaIl 123
Does the finding that increased leverage is associated with declines in R&D spending at the firm level explain the decline in the growth rate of industrial R&D spending in the late 1980s? It certainly accounts for some of the decline, but not all, for several reasons. For these firms there were two periods of substantial leverage increase during the period in question: 1978 to 1981, when the average change in the debt-capital ratio for all firms was about 0.045, and 1984 to 1987, when the change was about 0.043. During the earlier period, R&D spending overall was growing substantially. Even in the later period, the decline in overall R&D spending implied by this kind of leverage increase is about 0.8 percent, which will not account for the observed decline in growth rates. However, if the analysis is confined to the 250 firms with large debt-capital increases cited earlier, the reduction in R&D spending attributable to these increases (from the regressions in table 7) is ap- proximately $1 billion, which is 2.5 percent of the total in 1982. This begins to look like the right order of magnitude to explain figure 2, although these computations are approximate.
Regardless of whether one believes that leverage is efficiency en- hancing or that it leads to a decline in productive investment, the link between leverage and reduced R&D spending has been established. The more extreme forms of leverage increase (leveraged buyouts and other such transactions) are occurring in industries not normally considered innovative, and they seem to have other efficiency benefits. To me, this is evidence that the agency cost hypothesis is the correct one and that these transactions are beneficial on the whole. The pattern of ac- quisitions within the manufacturing sector is for firms to buy others like themselves (in industry and R&D behavior). Reductions in in- vestment do not seem to follow these acquisitions. I interpret these findings as at least neutral on the question of whether mergers are good or bad for innovation.
However, R&D spending in general may be an unintended victim of the current trend in the United States to shift the source of financing toward debt.56 This is because R&D's particular characteristics make
56. In 1979 the cost of equity capital and debt capital after corporate taxes and personal taxes was approximately equal. The overall effect of tax reform in the early 1980s was to lower both rates while making equity capital twice as expensive as debt capital (Hatsopolous, Krugman, and Poterba, 1988). This is the driving force behind the increase in leverage documented here.

124 Brookings Papers: Microeconomics 1990
it unsuited to that type of corporate environment. The evidence pre- sented here supports this hypothesis, but unfortunately it is not con- clusive. I have not demonstrated that the projects that have been eliminated following these restructurings were worthwhile (had high social or even private returns). Far more work needs to be done before the problem can be precisely identified and solutions suggested.
Appendix Table
Table A-1. Composition of Industry Classes
Industry SIC groups included
Food and kindred products 20 Textiles and apparel 22, 23 Chemicals, excluding drugs 28, excluding 2830, 2844 Pharmaceuticals and medical equipment 2830, 2844, 3841, 2843 Petroleum refining and extraction 29 Rubber and miscellaneous plastics 30 Stone, clay, and glass 32 Primary metals 33 Fabricated metal products 34, excluding 3480 Engines, farm and construction equipment 3510-3536 Office, computer, and accounting
equipment 3570, 3573 Other machinery, not electric 35, excluding 3510-3536, 357 Electric equipment and supplies 36, excluding 3650-3679 Electronic equipment 3650-3679 Motor vehicles and transportation 37, excluding 3720-3729,
equipment 3760 Aircraft and aerospace 3720-3729-3760 Professional and scientific equipment 38, excluding 3841, 3843 Lumber, wood, and paper 24, 25, 26 Miscellaneous consumer goods 21, 31, 3900-3989, 3480 Miscellaneous manufacturers, n.e.c.a 27, 3990
a. Not elsewhere classified.

Comments and Discussion
Comment by Ernst Berndt: Bronwyn Hall's paper is most timely. Public concern-perhaps even alarm-about the effects on industrial R&D efforts of changes in corporate ownership has been heightened by a recent National Science Foundation report alleging that among the top 200 R&D performers in the United States, levels of R&D declined 5.3 percent from 1984 to 1986 for firms involved in mergers or other restructurings whereas R&D levels for the rest of the sample increased 5.4 percent.
R&D is obviously a very important activity, and it is particularly important to those of us who have chosen careers in which research plays a central role. Our instincts may well be that less R&D is wor- risome, for it is obviously productive and worthwhile. But in inter- preting this paper it is worth asking what would one expect to happen to R&D after mergers or restructuring and how might that match with what might be reasonable ideas of changes in private and social welfare?
As Hall notes, there is a great deal of empirical evidence supporting the hypothesis that R&D activities frequently involve positive exter- nalities, and that social returns are substantially higher than private gains. Therefore, to the extent mergers result in greater internalization of some of these externalities, they might provide greater incentives for private R&D spending. However, mergers could also mitigate re- dundant R&D among rival firms and could result in the exploitation of economies of scale and scope, thereby reducing incentives for further R&D after a merger.
Finally, the entire process of corporate restructuring might very well focus some attention on how efficiently our nation's private R&D lab-
. sc

126 Brookings Papers: Microeconomics 1990
oratories are in fact managed, and one could argue that the discipline of such restructuring might result in more efficiently managed facilities. How all these costs and benefits add up is, of course, an empirical issue, but it is worth reminding ourselves that even if R&D intensity were found to decline with increases in mergers, acquisitions, and other restructurings, social welfare would not necessarily be reduced. Whether the resulting second or third best postmerger equilibrium would be closer to a first best point is not at all clear a priori.
Bronwyn Hall's paper addresses a number of empirical matters as- sociated with the effects of various types of corporate restructurings on R&D. She reports some very strong findings and a number of less convincing (yet very provocative) results. Most important, she helps us focus scarce research time much more precisely.
Problems of measurement have always bedeviled empirical work in R&D. Appropriately, therefore, Hall begins by comparing an aggregate R&D measure constructed by her and her colleagues at the National Bureau of Economic Research-itself a massive effort-based on Com- pustat data. The data are restricted to publicly traded firms, but they include both foreign and domestic R&D, and she compares this with a National Science Foundation data series on industrial R&D that is for domestic firms only but includes both publicly traded and private firms. Though they are non-nested, the two series track each other rather well until the 1980s, when the divergence between them becomes large. In fact, in Hall's total R&D and domestic-only series, the sharp decline observed by the NSF after 1986 does not appear to be present. Is the foundation's warning worth heeding? One obviously awaits the revised 1987 and new 1988 data with great interest.
A second empirical matter Hall examines is the impact of leveraged buyouts on R&D intensity. Because of considerations of required cash flow and asset specificity, she argues that buyout activities will probably be focused on firms and industries in which risky, high-technology R&D is relatively unimportant. The empirical evidence is consistent with her arguments. Leveraged buyouts tend to occur in shrinking, older, low- technology industries.
Other evidence is somewhat unclear on whether the R&D intensity of restructuring firms declines or remains the same. These results lead her to conclude that buyouts that take manufacturing firms private do not have a significant quantitative impact on aggregate R&D in the

Bronwyn H. Hall 127
United States. As a result, further research on this matter is unlikely to be productive.
The third empirical problem examined here is the change in the intensity of R&D in firms before and after merger. Consistent with her earlier research, she finds evidence of declines in intensity after merger, but the declines are statistically insignificant, partly because the extent of variability in her dependent variable-R&D intensity-is extremely large, even within an industry. There is a massive amount of hetero- geneity in these data.
The conflict between Hall's findings and those reported by the NSF, by the way, apparently occurs because Hall analyzes R&D intensity- the ratio of R&D to sales-while the NSF examines levels of R&D. Since most restructurings have been directed at shrinking firms, declines in the level of R&D can be entirely consistent with the absence of any significant declines in R&D intensity. It will obviously be very im- portant to try to update this data set to include 1988.
The paper also investigates whether the source of financing for ac- quisitions affects R&D intensity after a merger. I find this the most interesting part of the paper, although the empirical results are certainly not surprising. The first result is that for many firms, changes in what the author calls a leverage ratio variable, which are caused by acqui- sition activity, are frequently small. This leads Hall to examine the effect of leverage, whether acquisition-induced or not, on R&D inten- sity.
Arguing on the basis of moral hazard and asymmetric information, she suggests that costs of external finance, especially debt, will be higher for R&D than for other types of investment and that an exogenous increase in the portion of earnings committed to interest expense (such as that caused by an increase in long-term debt) will penalize R&D investment.
This raises a very serious problem of simultaneity because leveraged change and R&D intensity are both choice variables. Do those who decide to perform less R&D also then choose to increase their leverage? Or is it the other way around? Hall acknowledges this potential problem but essentially ignores the issue. She proceeds by defining a leveraged restructuring as occurring whenever the increase in long-term debt is greater than 75 percent of the total debt plus the market value of the firm at the beginning of the year.

128 Brookings Papers: Microeconomics 1990
Although she finds some rather large negative effects on R&D in- tensity in the leveraging firm for several years after the restructuring transaction, the estimates are imprecise and statistically insignificant. Hall experiments with cutoffs other than 75 percent, and then simply regresses R&D intensity for all firms on the first three annual legs of leverage changes, along with control variables for year, industry, and lagged R&D intensity. Here her finding is strong and clear. R&D in- tensity falls following an increase in leverage. Further, when acquisition dummy variables and their interaction terms are added, the variables are statistically insignificant. The conclusion is that although leverage affects R&D, it does not appear to have any differential effect when it is associated with making an acquisition. That should not be surprising. Moreover, although R&D intensity does appear to decline after restruc- turings that increase leverage, whether such declines are warranted on efficiency grounds is not clear.
As for other matters, throughout the paper Hall measures the size of a firm by the number of its employees. This method does provide a useful and perhaps dramatic way of comparing the effects of mergers and restructurings over time in the manufacturing sector, but using employment rather than sales as a measure of size can be misleading. The reason is that gains in labor productivity in the past decade have been substantial in the U.S. manufacturing sector, and the decline in the proportion of the labor force employed in this sector is much larger than the decline in the proportion of real GNP emanating from it. Indeed, the share of real GNP emanating from manufacturing has been a re- markably stable 22 to 25 percent for more than 20 years, whereas the employment share is now less than 18 percent.
A second point is that the theoretical framework underlying the regressions for R&D intensity, especially those in table 6, is somewhat unclear. Think of this equation as one for determining the ratio of capital to output. Note that R&D intensity is a dependent variable, rather than changes in R&D levels (which would be R&D investment) or changes in R&D intensity. Although variables for market value are included in the denominator of the leverage variables, sales variables are not in the regressor set. Thus how this equation would relate to any of the in- vestment or capital-output literature, including that on R&D, is not clearly spelled out. Although the development of a full structural model is clearly beyond the scope of this paper, I would have preferred that

Bronwyn H. Hall 129
Hall relate her framework more closely to the theoretical and econo- metric literature on R&D investment.
In summary, this is a useful and well-written paper. Its primary contribution is that it helps one to formulate much more clearly any plausible hypotheses regarding the effects of restructuring and R&D. It sharpens one's thinking.
Comment by Richard C. Levin: Bronwyn Hall is to be applauded for her painstaking efforts to assemble comprehensive data on publicly traded manufacturing firms that were acquired from 1977 through 1987. Anyone who has engaged in work of this type knows that Standard and Poor's does not make such a task easy. Hall's work augments the value of previous efforts that she and others have undertaken to create NBER's R&D master file, which has been and continues to be an indispensable resource for research on technological change.
The work reported in Hall's paper also warrants our admiration. Her study of the effects of corporate restructuring on industrial research and development is a splendid example of what can and cannot be accom- plished with simple, descriptive data analysis. Appropriately she dis- tinguishes three types of transactions: private acquisitions of publicly traded firms (including transactions that can be identified as leveraged buyouts), acquisitions of one publicly traded firm by another, and sig- nificant increases in a firm's ratio of debt to market value where no acquisition is involved. Without formulating or testing any specific structural models, but simply by letting the data speak, she establishes interesting facts about each type of transaction.
Transactions that take a public firm private are the least amenable to data analysis because post-transaction data are unavailable for many firms. Hall does about as much as one can do with the pretransaction data. She demonstrates that leveraged buyouts tend to occur in industries with below-average R&D intensity and that even within these industries the firms involved in buyouts account for a small fraction of R&D effort. Overall, firms involved in leveraged buyouts between 1977 and 1987 represented about 4 percent of employment in the manufacturing sector but only 1 percent of the sector's R&D. It seems reasonable to conclude with Hall that even if these firms abandoned their R&D ac- tivities after going private, the buyouts could not have been responsible for a significant decline in total manufacturing R&D.

130 Brookings Papers. Microeconomics 1990
Hall's analysis of public acquisitions produces results that are less clear cut but interesting nonetheless. The first results are obtained by comparing the distribution of two-year changes in the R&D intensity of entities before and after merger with the distribution of average two- year changes for all nonmerging firms in the sample. Nonparametric tests indicate that merger produces a small but significant leftward (negative) shift in the distribution. In this analysis, however, firms that cease to report R&D after merger are assumed to have done no R&D. When the sample is limited to firms that report R&D both before and after merger, no decline is observed. If there is an overall decline, it is attributable to those firms that cease to report R&D after merger.
Hall recognizes that nonreporting does not necessarily mean non- performance, but she fails to give full consideration to the implications. There might be no overall decline if a sufficient number of firms switched to nonreporting status after an acquisition but continued to perform some R&D. Such an outcome is not impossible to imagine. Firms are required to report R&D expenditures when they are "material," but an accounting rule of thumb is that materiality means 1 percent of sales. If a firm acquired another firm sufficiently less R&D intensive than itself, the R&D intensity of the merged entity might fall below the 1 percent threshold and remain unreported, even if there were no cut in the R&D actually performed. Statistically correct inference is compli- cated because the truncation is imperfect; some firms choose to report R&D at levels below the 1 percent threshold and others do not. Even without resolving the inference problem formally, Hall could explore whether the conclusion of relative decline is robust to alternative as- sumptions about the distribution of R&D actually performed by nonre- porting firms.
Hall's analysis of public acquisitions produces several other inter- esting findings. The R&D intensity of a typical merged firm appears to be significantly less than the average for the acquiring firm's industry (and the gap is growing over time). Postacquisition R&D intensity is also less than the combined R&D intensity of merging firms before merger, but the gap is smaller and there is no change in the relationship over time. Hall's interpretation is that acquiring firms are (and are becoming) less R&D intensive than other firms in their industries, but an equally plausible interpretation is that acquired firms are (and are becoming) less R&D intensive than acquiring firms. This question could

Bronwyn H. Hall 131
be resolved by looking at the distribution of acquiring and acquired firms across industries. Indeed, it is surprising that Hall did not provide this information, since she reports the industrial distribution of both leveraged buyouts (table 3) and financial restructuring (table 5).
In the final section of her paper, Hall finds that increases in leverage lead to decreases in R&D intensity that are substantial and statistically significant. When account is taken of changes in leverage, no remaining independent effect of acquisitions on R&D is statistically discernible.
It would be comforting to conclude that acquisitions have had no effect on R&D investment but, alas, the evidence is not decisive. Sup- pose, for example, that defending against hostile takeovers was a prin- cipal motive for increasing leverage. If some firms increased leverage to avoid being acquired, and others found leverage to be the only available means to finance an acquisition, and both types of newly leveraged firms reduced R&D, the data might well support Hall's con- clusion that leveraging affects R&D but the fact of acquisition does not. Yet it is clear in this example that there is a relationship between acquisition and reduced R&D.
This example illustrates the well-known general point that a fact (even when established as a result of careful data analysis) may be consistent with two or more mutually inconsistent theories. Hall is well aware of this limitation on her method of analysis. She observes that a negative relationship between leverage and R&D is consistent with two theories of financial market behavior: one involves agency costs and the other systematic market undervaluation of long-term projects. She notes that although both theories predict that R&D will decline as a result of leveraging, the result is efficient in the first instance but inefficient in the second. Without formulating and testing complete structural models, she cannot reach a definitive conclusion about which view is better supported by the data.
Just as reduced R&D arising from greater leverage might increase efficiency (in the presence of substantial agency costs), so might reduced R&D arising from mergers increase efficiency. For example, a merger of technologically related firms might permit considerable savings of resources devoted to redundant R&D projects. For this reason, the effects of mergers on technological performance might be more usefully studied by examining a measure of innovative output, such as patents, instead of a measure of inputs, such as R&D.

132 Brookinigs Papers: Microeconomics 1990
An interesting and related possibility is that, if R&D projects are lumpy, merger might permit a more efficient portfolio of projects to be selected; there might be less Hotelling-like crowding around the most desired locations in "project space." This phenomenon could not be directly illuminated by measuring the effect of mergers on either the amount of R&D or the number of patents; its investigation would require detailed data on the characteristics and funding levels of specific R&D projects before and after merger.
General Discussion: Some participants pointed out that there are likely to be both firm and industry effects on R&D spending after a restruc- turing. Lawrence Summers asserted that a decrease in R&D demand by one firm might, by reducing the cost of R&D, lead to an increase in R&D demand by other firms in the same industry. He also claimed that a change in the cost of capital brought about by restructuring activity would have an effect on total R&D spending. According to Summers, restructurings have potentially opposing effects on the cost of capital, meaning that R&D spending might be pulled in either of two directions. If restructuring activity is caused by a strong stock market and high price-earnings ratios, the cost of capital is lowered and R&D spending increases. But if restructuring involves only increasing wealth without increasing anything else, the demand for new funds would increase, pushing up real interest rates and discouraging R&D activity.
Bronwyn Hall did not deny Summers's point but said that her paper made no attempt to tackle that issue. She said she knew of no current empirical methodology to determine the effects of restructurings on industrywide R&D outlays.
Andrei Shleifer said that one cannot separate takeovers from lever- age. If a takeover involves an increase in leverage, a cut in R&D must be attributed not only to the increase in leverage, but also to whatever caused the takeover itself.
Robert Crandall wondered whether the firms involved in restructur- ings were, on average, underperforming within their own industries before their restructurings and were therefore likely candidates to reduce their future R&D spending.
Susan Rose-Ackerman questioned whether a disastrous fall in the market value of a firm's stock would make it appear that it was restruc- turing by leveraging up. Bronwyn Hall replied that the definition of the

Bronwyn H. Hall 133
variable she used to determine whether a firm was restructuring ("debt this year minus debt last year divided by debt last year plus equity last year") mitigated the problem caused by equity swings.
William Nordhaus maintained that R&D activity is not a scale-free phenomenon. Larger firms, he said, tend to have greater ratios of R&D to sales. This makes it necessary to look at the way acquisitions and leveragings affect firm size to determine the final effects on R&D. Nordhaus pointed out that his argument ran counter to Richard Levin's proposition that the agglomeration of different entities would enable duplicate research to be avoided, leading to a reduction in R&D and a negative correlation between R&D intensity and firm size. Bronwyn Hall disagreed with Nordhaus's argument. She conceded that in certain industries-petroleum and chemicals-R&D intensity increases with firm size. She asserted, however, that in other industries the empirical evidence has shown there has been a slight fall in R&D intensity among the largest firms.
References
Bhattacharya, Sudipto, and Jay R. Ritter. 1983. "Innovation and Communi- cation: Signaling with Partial Disclosure." Review of Economic Studies 50(April):331-46.
Burke, Mary V. 1985. A Comparative Analysis of Information on National Industrial R&D Expenditures, special report 85-311. Washington.
Cockburn, lain, and Zvi Griliches. 1987. "Industry Effects and Appropriability Measures in the Stock Market's Valuation of R&D and Patents," working paper 2465. Cambridge, Mass.: National Bureau of Economic Research. December.
Economic Report of the President. January 1989. Fazzari, Steven M., R. Glenn Hubbard, and Bruce C. Petersen. 1988. "Fi-
nancing Constraints and Corporate Investment." Brookings Papers on Eco- nomic Activity 1: 141-206.
Fisher, Franklin M., and Peter Temin. 1973. "Returns to Scale in R&D: What Does the Schumpeterian Hypothesis Imply?" Journal of Political Economy 81 (January-February):56-70.
Fusfeld, Herbert I. 1987. "Corporate Restructuring-What Impact on U.S. Industrial Research?" Research Management 30(July-August): 10-77.
Griliches, Zvi. 1981. "Market Value, R&D, and Patents." Economic Letters 7(no. 2):183-87.
Griliches, Zvi, Ariel Pakes, and Bronwyn H. Hall. 1987. "The Value of Patents as Indicators of Inventive Activity." In Economic Policy and Technological Performance, edited by Partha Dasgupta and Paul Stoneman. Cambridge University Press.

134 Brookings Papers: Microeconomics 1990
Hall, Bronwyn H. 1988a. "The Effect of Takeover Activity on Corporate Research and Development." In Corporate Takeovers: Causes and Con- sequences, edited by Alan J. Auerbach. University of Chicago Press.
. 1988b. "The Value of Intangible Corporate Assets: An Empirical Study of the Components of Tobin's Q." National Bureau of Economic Research and University of California at Berkeley. November.
. 1990. "The Manufacturing Sector Master File: 1959-1987." National Bureau of Economic Research and the University of California at Berkeley.
Hall, Bronwyn H., and others. 1988. "The R&D Master File Documentation," working paper 72. Cambridge, Mass.: National Bureau of Economic Re- search.
Hall, Bronwyn H., and Fumio Hayashi. 1989. "Research and Development as an Investment," Technical working paper 2973. Cambridge, Mass.: Na- tional Bureau of Economic Research.
Hatsopolous, George N., Paul R. Krugman, and James Poterba. 1988. Overconsurnption. Washington: American Business Conference.
Jarrell, Gregg A., Ken Lehn, and Wayne Marr. 1985. "Institutional Owner- ship, Tender Offers, and Long-Term Investments." Securities and Exchange Commission (April).
Jensen, Michael C. 1986. "Agency Cost of Free Cash Flow, Corporate Fi- nance, and Takeovers." American Economic Review (December 1985, Pa- pers and Proceedings, 1985) 76:323-29.
. 1989. "Eclipse of the Public Corporation." Harvard Business Review 67(September-October):61-74.
Kaplan, Steven N. 1989. "Management Buyouts: Evidence on Post-Buyout Operating Changes." University of Chicago Graduate School of Business.
Kihlstrom, Richard E., and Steve A. Mathews. 1990. "Managerial Incentives in an Entrepreneurial Stock Market Model," discussion paper 876. Univer- sity of Pennsylvania (March).
Kohlberg, Kravis, Roberts, and Co. 1989. "Presentation on Leveraged Buy- outs." January.
Lach, Saul, and Mark Schankerman. 1989. "Dynamics of R&D and Investment in the Scientific Sector." Journal of Political Economy 97(August):880- 904.
Lehn, Kenneth, and Annette Poulsen. 1989. "Free Cash Flow and Stockholder Gains in Going Private Transactions." Journal of Finance 44(July):771- 87.
Leland, Hayne E., and David H. Pyle. 1977. "Informational Asymmetries, Financial Structure, and Financial Intermediation." Journal of Finance 32(May):371-87.
Lemelin, Andre. 1982. "Relatedness in the Patterns of Industry Diversifica- tion." Review of Economics and Statistics 64(November):646-57.
Lichtenberg, Frank R., and Donald Siegel. 1989. "The Effects of Leveraged Buyouts on Productivity and Related Aspects of Firm Behavior," NBER paper 3022. Cambridge, Mass.: National Bureau of Economic Research.

Bronwyn H. Hall 135
MacDonald, James M. 1985. "R&D and the Directions of Diversification." Review of Economics and Statistics 67(November):583-90.
Meyer, John R., and Edwin Kuh. 1957. The Investment Decision: An Empirical Study. Harvard University Press.
Miller, Merton H., and Franco Modigliani. 1961. "Dividend Policy, Growth, and the Valuation of Shares." Journal of Business 34(October):411-33.
Modigliani, Franco, and Merton H. Miller. 1958. "The Cost of Capital, Cor- poration Finance and the Theory of Investment." American Economic Re- view 48(June):261-97.
National Science Foundation. 1987. Science and Engineering Indicators. Washington.
1989. Science Resource Studies Highlights, NSF 88-3 1 (March). OECD (Organization for Economic Cooperation and Development). Various
years. OECD Science and Technology Indicators. Paris. Pakes, Ariel, and Mark Schankerman. 1984. "The Rate of Obsolescence of
Patents, Research Gestation Lags, and the Private Rate of Return to Research Resources." In R&D, Patents, and Productivity, edited by Zvi Griliches. University of Chicago Press.
Smith, Abbie. 1989. "Corporate Ownership Structure and Performance: The Case of Management Buyouts." University of Chicago. February.
Standard and Poor. 1978-87. Compustat Annual Industrial, Over-the-Counter and Research Files. New York.
Statistics Canada, Ministry of Supply and Services. Various years. Canadian Science Indicators. Ottawa.
Stein, Jeremy C. 1988. "Takeover Threats and Managerial Myopia." Journal of Political Economy 96(February):61-80.
Williamson, Oliver E. 1988. "Corporate Finance and Corporate Governance." Journal of Finance 43(July):467-91.
Woolridge, J. Randall. 1988. "Competitive Decline and Corporate Restruc- turing: Is a Myopic Stock Market to Blame?" Journal of Applied Corporate Finance 1(Spring):26-36.
Related Documents


