International Journal of Economic Sciences Vol. III / No. 4 / 2014 70 The Impact of Contactless Payment on Spending Tobias Trütsch ABSTRACT This paper estimates the effect of contactless payment on the spending ratio in terms of transactions for different transaction types at the point-of-sale. The specific devices that are investigated are debit and credit cards, to which the feature is embedded. Data is drawn from a national representative survey on consumer payment behavior in the US in 2010. Using propensity score matching to control for selection, the estimation shows that the contactless feature yields to a significant increase in the spending ratio at the point-of-sale for both payment methods. The average treatment effect on the treated for credit and debit cards is roughly 8 and 10 percent, respectively. These findings indicate that the private industry can highly benefit from the innovation with respect to new revenue streams. This paper contributes to the existing literature in payment economics by analyzing one of the most recent payment products. Keywords: contactless payment, payment innovation, spending habits, credit and debit cards, near- field communication (NFC), propensity score matching JEL-Classification: C21, D12, D14, O33 Author Tobias Trütsch University of St.Gallen, ES-HSG, Holzstrasse 15, 9010 St.Gallen, Switzerland, E-mail: [email protected], Phone +41 71 224 75 14

Welcome message from author
This document is posted to help you gain knowledge. Please leave a comment to let me know what you think about it! Share it to your friends and learn new things together.
Transcript
International Journal of Economic Sciences Vol. III / No. 4 / 2014
70
The Impact of Contactless Payment on Spending
Tobias Trütsch
ABSTRACT
This paper estimates the effect of contactless payment on the spending ratio in terms of transactions
for different transaction types at the point-of-sale. The specific devices that are investigated are
debit and credit cards, to which the feature is embedded. Data is drawn from a national
representative survey on consumer payment behavior in the US in 2010. Using propensity score
matching to control for selection, the estimation shows that the contactless feature yields to a
significant increase in the spending ratio at the point-of-sale for both payment methods. The
average treatment effect on the treated for credit and debit cards is roughly 8 and 10 percent,
respectively. These findings indicate that the private industry can highly benefit from the innovation
with respect to new revenue streams. This paper contributes to the existing literature in payment
economics by analyzing one of the most recent payment products.
Keywords: contactless payment, payment innovation, spending habits, credit and debit cards, near-
field communication (NFC), propensity score matching
JEL-Classification: C21, D12, D14, O33
Author
Tobias Trütsch University of St.Gallen, ES-HSG, Holzstrasse 15, 9010 St.Gallen, Switzerland,
E-mail: [email protected], Phone +41 71 224 75 14

International Journal of Economic Sciences Vol. III / No. 4 / 2014
71
1 Introduction
The way consumers make daily payments has changed significantly in recent years due to
innovations such as debit, credit and prepaid cards, online banking and mobile payments among
others. By 2010, consumers in the US have undertaken within a month on average 50 percent of
their transactions by payment cards, 40 percent by paper instruments such as cash and 9.2 percent
by electronic and other instruments (Foster et al., 2013). Meanwhile, new forms of retail payment
innovations have come up among which contactless payment.1
This paper investigates the impact of contactless payment on individual spending in terms of
transactions for different transaction types at the point-of-sale (POS). This new form of payment
device has mainly been developed by the private industry sector for revenue purposes. The specific
technology is embedded in the most prominent payment cards and mobile phones. Its convenience,
safety and efficiency, which is expected to be perceived as superior to cash, should support the
proliferation of electronic payments and substitution away from cash, which still accounts for a
significant share of transactions.
Understanding the effect of contactless payment on individual spending habits is crucial for three
main reasons. First and foremost, there is limited knowledge on the adoption and usage behavior of
the contactless payment innovation due to its very recent emergence and establishment. Retailers
can use the information for evaluating whether to invest in the most up-to-date payment terminals in
order to have full gains of the newest payment technologies because an efficient payment process is
one of the most crucial conditions to reduce waiting lines at the counter and consequently a decline
in sales inferring from negative shopping experiences.
Second, the findings provide information on specific usage and adoption patterns among cashless
payment means, which may be relevant for financial intermediaries with respect to managerial,
promotional and revenue purposes. In general, increasing card transactions that they might process
will result in rising revenue streams generated through their fees.
Third, the paper provides information for policy makers with regards to evaluating and
implementing interchange fee regulation for payment cards, which is an ongoing issue in several
countries (cf. Weiner and Wright, 2005) such as the US (Johnson, 2014), Switzerland (Brouzos,
2014) and the European Union (European Parliament, 2014).2 For instance, more card transactions
imply higher costs on shop owners due to the current interchange fee structure, as it is demon-
strated in Wakamori and Welte (2012). Additionally, Wiechert (2009) concludes for Swiss retailers
that contactless payment increases the payment costs for retail shops even more dramatically since
it would mean the transfer of low-cost cash payments to cards implying a higher burden on
1 Contactless payment is based on the near-field communication (NFC) technology, which is a standard radio
communication technology that allows to connect devices within 4 cm range by waving or tapping the objects without
providing a signature or PIN for verification. The feature is usually embedded in conventional payment cards, but also
in other devices such as mobile phones and key fobs. For instance, contactless credit cards allow making instantaneous
payment transactions by just waving the card over the card reader. The terms 'NFC' and 'contactless' are used
interchangeably in this study. 2 I refer to Rochet and Wright, 2010; Evans and Schmalensee, 2005; Rochet and Tirole, 2002 and Rochet, 2003 among
others for a theoretical consideration of the interchange fee regulation and to Jaeger et al. (2011) with special focus on
Switzerland.

International Journal of Economic Sciences Vol. III / No. 4 / 2014
72
interchange fees. The cost increase is more accentuated for micro than macro payments.3 However,
the provision of an efficient and cheap payment service is crucial to underpin the sound operation of
the economy. This is also highlighted in the new strategic focus for financial services announced by
the president of the Federal Reserve Bank of Cleveland (Pianalto, 2012), which specifically
considers payment preferences of end consumers when making future decisions about the payment
system. Providing such information in this paper contributes to support the decision-making
process.
This paper can be seen as complementary to the strands of literature in payment economics and
makes a contribution in the context of financial innovation (e.g. Alvarez and Lippi, 2009; Amromin
and Chakravorti, 2007; Drehmann et al., 2004; Humphrey et al., 2001; von Kalckreuth et al., 2009;
Schuh and Stavins, 2010) and may be relevant for the literature in the two-sided markets as well
(e.g. Rysman, 2007; Rochet and Tirole, 2002; Rochet and Wright, 2010). Although the model in
this paper does not account for price sensitivity and the two-sidedness in terms of merchant
decisions, the study gives insights in the individual adoption and usage of contactless payment cards
under the interchange fee regulation in 2010 from a consumer's point of view.4
The topic is also relevant in the context of efficient payment methods. Checkout time is an
important determinant for the choice of payment means. This is highlighted in Klee (2006) who
finds evidence that debit cards are preferred over checks to save time. Contactless payment allows
to pay efficiently and may therefore lead to higher transaction frequency. Borzekowski and Kiser
(2008) quantify the effect of contactless debit cards in the US applying rank-order-logit models and
prospect an increase in market share of contactless debit cards compared to cash, check and credit
cards because merchants can save up to 0.03 USD per transaction by accepting contactless debit
cards, which is exclusively driven by faster checkout.5
There is substantial literature on the relationship between reward programs, interest free periods and
use of credit cards, which this paper is related to since time savings at the checkout are associated
with pecuniary incentives. Participation in loyalty programs and access to interest free periods tend
to increase credit card use at the expense of alternative payment methods such as debit cards and
cash (Simon et al., 2009; Agarwal et al., 2010; Ching and Hayashi, 2010; Carbó-Valverde and
Linares-Zegarra, 2009; Arango et al., 2011). There are also some consumer-side studies conducted
by the private industry sector. For example, Mastercard (2013) observes an increased usage of
Mastercard-PayPass payment cards both in terms of value spending and transaction frequency.6
This research, however, tend to be biased because it might serve as a sales argument for merchants
and the data is restricted to Mastercard customers only. This paper aims to provide more objective
research to gain insights in individual payment habits in the context of retail payment innovations.
The novelty of this study is twofold. On the one hand, due to the very recent emergence of
contactless payment, it exists only limited knowledge of its effect on individual payment habits.
3 Avoiding the cost increase for retailers entails growth in sales or reduction in operation costs. If both are not sufficient,
an overall card fees reduction or a discount for micro payment transactions is more appropriate (Wiechert, 2009). 4 In July 2010, the Dodd-Frank Wall Street Reform was enacted capping interchange fees of debit cards at 0.12 USD
per transaction compared to 0.44 USD before the reform (Board of Governors of the Federal Reserve System, 2011).
The interchange fee of credit cards was roughly around 3 percent of the transaction amount in 2010 (Visa USA, 2010). 5 With average costs of 0.70 USD per debit card transaction.
6 The Mastercard-PayPass payment card is NFC-enabled.

International Journal of Economic Sciences Vol. III / No. 4 / 2014
73
This paper fills the gap in this relatively new field. On the other hand, using unique, detailed and
representative individual survey data from the US dated 2010 allows to investigate the causal effect
of contactless payment on spending of the most prominent payment cards (credit and debit cards)
for different transaction types (POS payments distinguished by retail and services payments) by
applying propensity score matching to control for selection bias, which is inherent in this setting.
Since the data set encompasses the rating of perceived characteristics such as ease of use, security,
speed, setup costs of numerous payment instruments, I also can control for unobserved
heterogeneity (cf. Jonker, 2007; Kim et al., 2006; Ching and Hayashi, 2010).
My empirical analysis yields the following important results. Using the 2010 Survey of Consumer
Payment Choice (SCPC) I estimate the impact of contactless payment on the spending ratio at the
individual level. First, I find that the average treatment effect on the treated of contactless credit
cards leads to an increase in the spending ratio of 8.3 percent at the POS while the effect for retail
and services purchases is 4.8 and 3.5 percent, respectively. Second, the average treatment effect on
the treated of contactless debit cards exerts a positive effect on the spending ratio of 10 percent at
the POS. In terms of retail and services payments the impact results in 4.5 percent. Sensitivity
analysis shows that the results are robust to unobserved heterogeneity.
The structure of the paper is as follows. Section 2 derives the theoretical framework and section 3
describes the data. In section 4, I elaborate my estimation strategy and present the econometric
model. Section 5 includes the results of the empirical analysis and section 6 concludes.
2 Theoretical Considerations
The theoretical background for this study is drawn from technology acceptance models, which aim
at explaining the adoption and usage conditions of innovations. There are numerous models that
explain technology adoption and use from different points of view, from which I choose the most
tailored to the research question.
Technology Acceptance Model (TAM). This model explains when individuals will accept and
make use of a technology and has originally been applied to predict end-user acceptance of
information systems within organizations. The model consists of two main technology acceptance
measures: Perceived Usefulness and Perceived Ease of Use. Davis (1989, p. 320) defines the former
as “the degree to which a person believes that using a particular system would enhance his or her
job performance”. Enhanced efficiency, time savings and convenience are subjects to Perceived
Usefulness, which are pertaining to contactless payment (Wang, 2008), and therefore should foster
its deployment. Perceived Ease of Use is specified as “the degree to which a person believes that
using a particular system would be free from effort” (Davis, 1989, p. 320). Accordingly, contactless
payment is more likely to be used if it is easy to handle.
Innovation Diffusion Theory (IDT). The theory, developed by Rogers (2003), explains how and
why innovations spread through societies. It basically consists of two interrelated processes, namely
the diffusion and adoption process. The former can be described as a macro process that explains
how innovations spread through societies whereas the latter is a micro process focusing on the
individual's decision making process of adopting innovations.

International Journal of Economic Sciences Vol. III / No. 4 / 2014
74
The innovation-decision process consists of five consecutive stages: (1) Knowledge, (2) Persuasion,
(3) Decision, (4) Implementation, and (5) Confirmation (Rogers, 2003). In the Knowledge stage, the
individual learns about the emergence of an innovation influenced by prior conditions (previous
practice, problems and needs, innovativeness, and norms of the social system) and by his own
characteristics (socioeconomic characteristics, personality variables and communication behavior).
Thus, some adoption mechanisms are predetermined. Subsequently, opinions are formed about the
innovation in the Persuasion stage where six innovation characteristics affect the adoption of
innovations: relative advantage, complexity, compatibility, trialability, and observability (Rogers,
2003). The first three concepts are similar to the ones in the previous TAM-model.
Out of these constructs, the first three of them have provided the most accurate prediction for the
intention to use NFC-enabled mobile credit cards (Leong et al., 2013). With respect to complexity,
(mobile) contactless payment is expected to increase the convenience of payments and therefore
usage by reducing the need for coins and cash in small transactions (Mallat et al., 2004). In the third
stage, the Decision stage, the individual finally chooses to adopt or reject the innovation based on
the former stages.
Unified Theory of Acceptance and Use of Technology (UTAUT). This model represents an
extension of the previous TAM and IDT model (among others) and explains user intentions and
subsequent usage behavior (Venkatesh et al., 2003). The model consists of four key effects and four
moderating factors. While the first three core constructs – Performance Expectancy (PE), Effort
Expectancy (EE), and Social Influence (SI) – directly influence the behavioral intention, the forth
construct – Facilitating Conditions (FC) – has a direct impact on use behavior. The four remaining
factors Gender, Age, Experience, and Voluntariness of Use thereby moderate the initial key effects.
Empirical testing has shown that PE, which is similar to Perceived Usefulness in the IDT model, is
the strongest predictor of intention in the context of the UTAUT. Time savings, usefulness and
convenience are concepts which measure performance expectancy and are positively related to
contactless payment (Yu, 2012). These characteristics should therefore advance the usage of
contactless payment. Gender studies have revealed that PE is especially salient for men since they
tend to be more task-oriented. Also, age differences determine technology adoption (Venkatesh et
al., 2003).
EE is evaluated by questions about the difficulty of learning, interacting and becoming skillful in
applying new technologies (Yu, 2012). Venkatesh et al. (2003) show that this construct is only
significant for users with a non-existing or low experience level, becoming non-significant over
periods of extended and sustained usage. EE is more salient for women than for men whereas
increasing age is associated with difficulties in processing complex stimuli (Venkatesh et al., 2003).
This implies younger cohorts to be more prone to contactless payment.
SI suggests that individuals' behavior is affected by the way in which they believe others will view
them as a result of having used the technology (Venkatesh et al., 2003). Its role in technology
acceptance decisions is complex and influences individuals through three mechanisms: compliance,
internalization and identification. The latter two intend to alter an individual's belief structure and/or
to cause an individual to respond to potential social status gains. The former mechanism causes an
individual to alter his intention in response to social pressure. Positively attributed characteristics of

International Journal of Economic Sciences Vol. III / No. 4 / 2014
75
contactless payment such as transaction speed and convenience positively alters the individual's
belief structure and hence can positively influence usage. However, the reliance on others' opinions,
i.e. manifested itself in social pressure, is particularly significant in the early stages of the
technology experience when individuals are uninformed. This in turn will attenuate over time since
a more instrumental (rather than social) basis will affect the technology usage due to increased
experience (Venkatesh et al., 2003). Social Influence is more salient for women regarding the
technology acceptance decision process since they tend to be more sensitive to others' opinions.
Moreover, elderly people are more likely to place increased salience on social influences since they
possess higher affiliation needs (Venkatesh et al., 2003).
In conclusion, the adoption and usage of contactless payment is influenced by various factors that
are partly predetermined and therefore it follows a non-random pattern.
3 Data
3.1 Source
Data is drawn from the Federal Reserve Bank of Boston that supports the Consumer Payments
Research Center (CPRC), which regularly conducts the Survey of Consumer Payment Choice
(SCPC).7 It is a rich nationally-representative and publicly-available data set on consumer payment
behavior in the US. The survey focuses on the adoption and use of nine common payment
instruments including cash.8 Also, the perceptions on method of payment attributes are questioned
and information on demographics is provided. The latest publicly-accessible data dates back to
2010 and was administrated online by the RAND Corporation, using RAND's American Life Panel,
to a random sample of 2102 US consumers primarily in October during fall 2010 whose responses
were weighted to represent all US consumers ages 18 years and older. The reporting unit of the
SCPC is an individual consumer in the US. The reason to monitor individuals rather than
households stems from the fact that it is unlikely that the head of the household can track the
payment behavior of all household members in detail. However, some information about each
reporting consumer's household is collected in the survey such as income. It is worth noting that the
estimates are not adjusted for seasonal variation, inflation or item non-response (missing values).
Also, the tumultuous years after the financial crisis in 2008 accompanied by a severe recession
could have led to unusual reporting of the number of payments.
3.2 Description
The survey specifically asks respondents if one of their credit and debit cards was equipped with the
contactless feature, but unfortunately does not provide exact information on the usage of the
technology. Instead, detailed statistics on the usage of conventional credit and debit cards are
available as well as their adoption rates. Table 1 shows the market shares of contactless and
conventional credit and debit cards as well as the corresponding use of the latter. It reveals that
about 9 percent (187 individuals) of the entire sample of 2084 respondents reported that their credit
card is equipped with the contactless feature, whereas approximately 12 percent (258 individuals)
7 See Foster et al. (2013) for a comprehensive description of the data.
8 These include check, bank account number payment, online banking bill payment, money order, traveler's check,
debit, credit and stored-value cards.
International Journal of Economic Sciences Vol. III / No. 4 / 2014
76
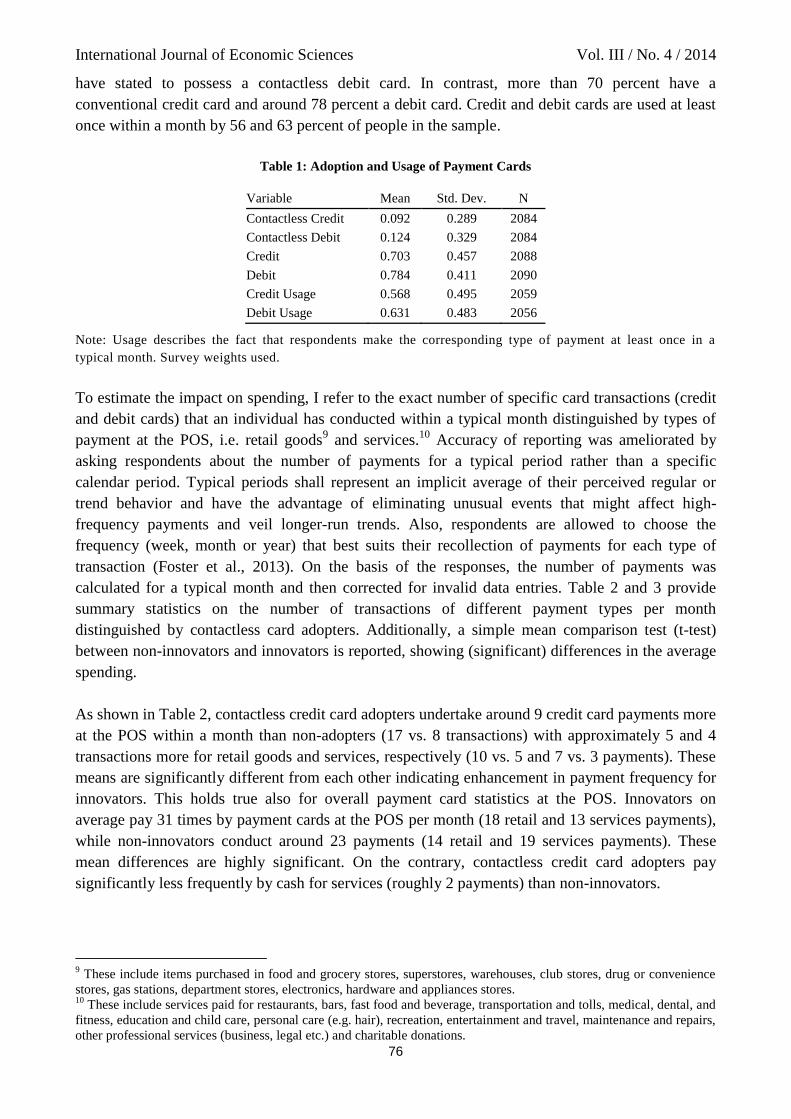
have stated to possess a contactless debit card. In contrast, more than 70 percent have a
conventional credit card and around 78 percent a debit card. Credit and debit cards are used at least
once within a month by 56 and 63 percent of people in the sample.
Table 1: Adoption and Usage of Payment Cards
Variable Mean Std. Dev. N
Contactless Credit 0.092 0.289 2084
Contactless Debit 0.124 0.329 2084
Credit 0.703 0.457 2088
Debit 0.784 0.411 2090
Credit Usage 0.568 0.495 2059
Debit Usage 0.631 0.483 2056
Note: Usage describes the fact that respondents make the corresponding type of payment at least once in a
typical month. Survey weights used.
To estimate the impact on spending, I refer to the exact number of specific card transactions (credit
and debit cards) that an individual has conducted within a typical month distinguished by types of
payment at the POS, i.e. retail goods9 and services.
10 Accuracy of reporting was ameliorated by
asking respondents about the number of payments for a typical period rather than a specific
calendar period. Typical periods shall represent an implicit average of their perceived regular or
trend behavior and have the advantage of eliminating unusual events that might affect high-
frequency payments and veil longer-run trends. Also, respondents are allowed to choose the
frequency (week, month or year) that best suits their recollection of payments for each type of
transaction (Foster et al., 2013). On the basis of the responses, the number of payments was
calculated for a typical month and then corrected for invalid data entries. Table 2 and 3 provide
summary statistics on the number of transactions of different payment types per month
distinguished by contactless card adopters. Additionally, a simple mean comparison test (t-test)
between non-innovators and innovators is reported, showing (significant) differences in the average
spending.
As shown in Table 2, contactless credit card adopters undertake around 9 credit card payments more
at the POS within a month than non-adopters (17 vs. 8 transactions) with approximately 5 and 4
transactions more for retail goods and services, respectively (10 vs. 5 and 7 vs. 3 payments). These
means are significantly different from each other indicating enhancement in payment frequency for
innovators. This holds true also for overall payment card statistics at the POS. Innovators on
average pay 31 times by payment cards at the POS per month (18 retail and 13 services payments),
while non-innovators conduct around 23 payments (14 retail and 19 services payments). These
mean differences are highly significant. On the contrary, contactless credit card adopters pay
significantly less frequently by cash for services (roughly 2 payments) than non-innovators.
9 These include items purchased in food and grocery stores, superstores, warehouses, club stores, drug or convenience
stores, gas stations, department stores, electronics, hardware and appliances stores. 10
These include services paid for restaurants, bars, fast food and beverage, transportation and tolls, medical, dental, and
fitness, education and child care, personal care (e.g. hair), recreation, entertainment and travel, maintenance and repairs,
other professional services (business, legal etc.) and charitable donations.

International Journal of Economic Sciences Vol. III / No. 4 / 2014
77
Table 2: Number of Payment Types by Contactless Credit Card Adopters per Month
Non-Innovator Innovator t-Test
Variable Mean Std. Dev. Max. N Mean Std. Dev. Max. N Mean Diff
CC POS 8.36 16.61 117.4 1869 17.1 25.44 108.71 188 −8.67***
CC Retail 4.99 10.72 100 1851 9.81 14.83 65.22 188 −4.67***
CC Services 3.45 7.61 95.66 1849 7.39 12.34 86.96 186 −3.99***
DC POS 15.09 23.03 139.14 1868 14.52 24.14 130.45 185 0.67
DC Retail 9.22 15.13 108.71 1857 8.59 15.37 86.97 184 0.67
DC Services 6.06 10.49 100 1834 5.95 10.58 43.48 185 0.00
SVC POS 0.39 1.81 20 1849 0.21 1.1 12 183 0.18
SVC Retail 0.24 1.26 20 1843 0.15 0.87 10 182 0.08
SVC Services 0.15 0.77 8.69 1839 0.06 0.31 2 181 0.09*
Overall Card POS 23.61 26.72 165.22 1886 30.77 35.48 173.93 190 −7.82**
Overall Card Retail 14.21 17.57 109.71 1884 17.9 21.27 108.71 190 −3.92*
Overall Card Services 9.41 12.4 105 1884 13.01 16.91 86.96 189 −3.90**
Cash POS 16.56 19.26 130.45 1881 14.05 17.87 108.71 187 3.01
Cash Retail 9.52 12.72 100 1822 8.38 11.65 65.22 185 1.07
Cash Services 7.27 9.91 86.96 1813 5.75 8.66 43.48 185 1.95**
Total POS 42.84 38.24 245.5 1893 47.05 42.87 217.41 191 −4.62
Total Retail 24.91 24.19 153.19 1893 27.25 26.31 148.84 191 −2.75
Total Services 17.93 19.32 158 1893 19.8 20.41 91.73 191 −1.87
Note: Survey weights used. Subcategories do not sum to main category due to rounding and weighting. For
brevity, the minimum is dropped but equals zero for every type of payment. T-test of mean differences of
innovator and non-innovator. They can differ from true values due to rounding and weighting. Significance
levels 1% ***, 5% ** and 10% *. CC represents credit cards, DC debit cards and SVC stored -value cards.
Overall card payments are the sum of CC, DC and SVC payments. Total point-of-sale (POS) payments are the
sum of overall card POS payments, cash POS payments plus check and money order payments.
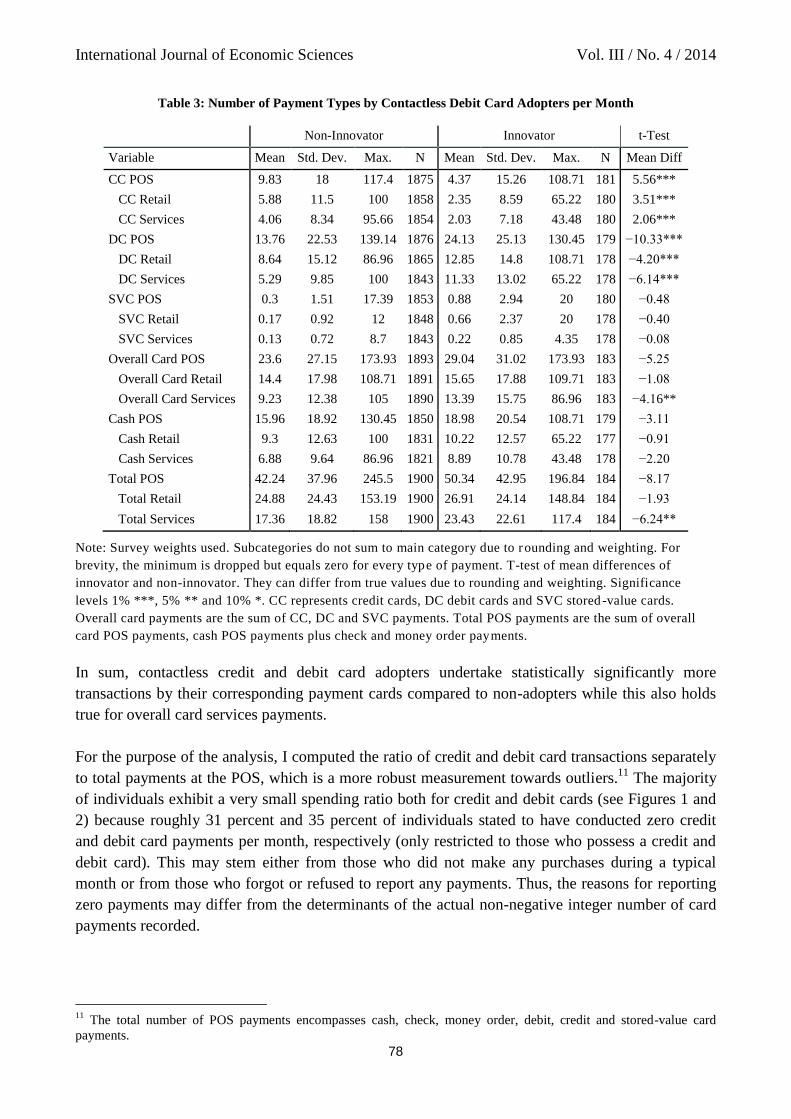
Table 3 distinguishes the number of transactions by contactless debit card adopters and non-
adopters. Mean comparison tests between adopters and non-adopters reveal that statistically
significant differences in the transaction frequency exist. Innovators buy goods and services at the
POS by debit cards more frequently than non-innovators, namely 4 and 6 transactions more within a
month (13 vs. 9 and 11 vs. 5 payments, respectively). Also, their overall card and total POS
payments for services exceed those of non-adopters by 4 and 6 transactions, respectively. In
contrast, they transact 5 payments fewer by credit cards at the POS (4 vs. 10 transactions) than non-
innovators.
International Journal of Economic Sciences Vol. III / No. 4 / 2014
78
Table 3: Number of Payment Types by Contactless Debit Card Adopters per Month
Non-Innovator Innovator t-Test
Variable Mean Std. Dev. Max. N Mean Std. Dev. Max. N Mean Diff
CC POS 9.83 18 117.4 1875 4.37 15.26 108.71 181 5.56***
CC Retail 5.88 11.5 100 1858 2.35 8.59 65.22 180 3.51***
CC Services 4.06 8.34 95.66 1854 2.03 7.18 43.48 180 2.06***
DC POS 13.76 22.53 139.14 1876 24.13 25.13 130.45 179 −10.33***
DC Retail 8.64 15.12 86.96 1865 12.85 14.8 108.71 178 −4.20***
DC Services 5.29 9.85 100 1843 11.33 13.02 65.22 178 −6.14***
SVC POS 0.3 1.51 17.39 1853 0.88 2.94 20 180 −0.48
SVC Retail 0.17 0.92 12 1848 0.66 2.37 20 178 −0.40
SVC Services 0.13 0.72 8.7 1843 0.22 0.85 4.35 178 −0.08
Overall Card POS 23.6 27.15 173.93 1893 29.04 31.02 173.93 183 −5.25
Overall Card Retail 14.4 17.98 108.71 1891 15.65 17.88 109.71 183 −1.08
Overall Card Services 9.23 12.38 105 1890 13.39 15.75 86.96 183 −4.16**
Cash POS 15.96 18.92 130.45 1850 18.98 20.54 108.71 179 −3.11
Cash Retail 9.3 12.63 100 1831 10.22 12.57 65.22 177 −0.91
Cash Services 6.88 9.64 86.96 1821 8.89 10.78 43.48 178 −2.20
Total POS 42.24 37.96 245.5 1900 50.34 42.95 196.84 184 −8.17
Total Retail 24.88 24.43 153.19 1900 26.91 24.14 148.84 184 −1.93
Total Services 17.36 18.82 158 1900 23.43 22.61 117.4 184 −6.24**
Note: Survey weights used. Subcategories do not sum to main category due to rounding and weighting. For
brevity, the minimum is dropped but equals zero for every type of payment. T-test of mean differences of
innovator and non-innovator. They can differ from true values due to rounding and weighting. Significance
levels 1% ***, 5% ** and 10% *. CC represents credit cards, DC debit cards and SVC stored -value cards.
Overall card payments are the sum of CC, DC and SVC payments. Total POS payments are the sum of overall
card POS payments, cash POS payments plus check and money order payments.
In sum, contactless credit and debit card adopters undertake statistically significantly more
transactions by their corresponding payment cards compared to non-adopters while this also holds
true for overall card services payments.
For the purpose of the analysis, I computed the ratio of credit and debit card transactions separately
to total payments at the POS, which is a more robust measurement towards outliers.11
The majority
of individuals exhibit a very small spending ratio both for credit and debit cards (see Figures 1 and
2) because roughly 31 percent and 35 percent of individuals stated to have conducted zero credit
and debit card payments per month, respectively (only restricted to those who possess a credit and
debit card). This may stem either from those who did not make any purchases during a typical
month or from those who forgot or refused to report any payments. Thus, the reasons for reporting
zero payments may differ from the determinants of the actual non-negative integer number of card
payments recorded.
11
The total number of POS payments encompasses cash, check, money order, debit, credit and stored-value card
payments.

International Journal of Economic Sciences Vol. III / No. 4 / 2014
79
Figure 1: Share of Credit Card Payments per Month at the POS
Figure 2: Share of Debit Card Payments per Month at the POS
The data set also provides rich information about consumer demographic characteristics and
financial status. Tables 4 and 5 give insights in demographic characteristics and financial status of
contactless credit and debit card holders separately. Obviously, referring to Table 4, the sample of
contactless credit card adopters is more skewed towards higher income and education brackets as
well as higher asset shares. For instance, 14 percent of individuals earning 125000 USD above
possess a contactless credit card, which is also observable for 25 percent of individuals who have
completed some post graduate studies. On average, innovators also withdraw money less frequently
than non-innovators and are mostly male, working and married compared to non-innovators.

International Journal of Economic Sciences Vol. III / No. 4 / 2014
80
Table 4: Sample Summary Statistics of Credit Card Adopters
Non-Innovator Innovator
Variable Mean Std. Dev. Min. Max. N Mean Std. Dev. Min. Max. N
Income (in 1000)
<25 0.26 0.44 0 1 1890 0.13 0.34 0 1 190
25-49 0.28 0.45 0 1 1890 0.22 0.41 0 1 190
50-74 0.21 0.41 0 1 1890 0.26 0.44 0 1 190
75-99 0.11 0.32 0 1 1890 0.19 0.39 0 1 190
100-124 0.08 0.26 0 1 1890 0.07 0.25 0 1 190
>125 0.07 0.26 0 1 1890 0.14 0.35 0 1 190
Education
<High School 0.05 0.22 0 1 1893 0.08 0.27 0 1 191
High School 0.4 0.49 0 1 1893 0.28 0.45 0 1 191
Some College 0.29 0.45 0 1 1893 0.23 0.42 0 1 191
College 0.15 0.36 0 1 1893 0.17 0.37 0 1 191
Post Graduate 0.11 0.32 0 1 1893 0.25 0.43 0 1 191
Employment
Working 0.62 0.49 0 1 1893 0.7 0.46 0 1 191
Retired 0.19 0.39 0 1 1893 0.18 0.39 0 1 191
Unemployed 0.1 0.3 0 1 1893 0.06 0.24 0 1 191
Marital Status
Single 0.2 0.4 0 1 1893 0.08 0.27 0 1 191
Married 0.62 0.49 0 1 1893 0.77 0.42 0 1 191
Others
Male 0.48 0.5 0 1 1893 0.57 0.5 0 1 191
Age 46.6 16.82 18 109 1893 45.2 15.7 21 88 191
HH Members 1.4 1.56 0 9 1893 1.08 1.22 0 5 191
Assets 1.31 8.21 0 100 1807 1.54 8.19 0 78 183
Cash WD 6.15 12.31 0 434.8 1885 3.74 3.67 0 30.4 191
Note: Survey weights used. Subcategories do not sum to main category due to rounding and weighting. Cash
withdrawals (WD) per month. Assets (in 1000) do not include houses.
Contrarily, the sample of contactless debit card adopters is more skewed towards the lower income
and education brackets as well as lower wealth status, as high-lighted in Table 5. Approximately 32
percent of innovators earn less than 25000 USD and around 40 percent graduated from high school.
Furthermore, they are mostly male, working, younger and single compared to non-innovators. Also,
they withdraw cash around twice as much as non-innovators (10 vs. 5 withdrawals). This reflects
higher preferences for out-of-the-way rather than credit payments, which cash and debit cards can
provide. Contactless debit card holders seem not to adopt contactless payment for the purpose of
reducing cash transactions, which could indicate complementarity of cash and debit cards.

International Journal of Economic Sciences Vol. III / No. 4 / 2014
81
Table 5: Sample Summary Statistics of Debit Card Adopters
Non-Innovator Innovator
Variable Mean Std. Dev. Min. Max. N Mean Std. Dev. Min. Max. N
Income (in 1000)
<25 0.23 0.42 0 1 1895 0.32 0.47 0 1 184
25-49 0.27 0.44 0 1 1895 0.28 0.45 0 1 184
50-74 0.21 0.41 0 1 1895 0.23 0.42 0 1 184
75-99 0.13 0.33 0 1 1895 0.07 0.25 0 1 184
100-124 0.08 0.27 0 1 1895 0.04 0.2 0 1 184
>125 0.08 0.27 0 1 1895 0.06 0.23 0 1 184
Education
<High School 0.05 0.21 0 1 1900 0.1 0.3 0 1 184
High School 0.38 0.48 0 1 1900 0.44 0.5 0 1 184
Some College 0.29 0.45 0 1 1900 0.28 0.45 0 1 184
College 0.16 0.36 0 1 1900 0.11 0.32 0 1 184
Post Graduate 0.13 0.34 0 1 1900 0.07 0.25 0 1 184
Employment
Working 0.61 0.49 0 1 1900 0.73 0.45 0 1 184
Retired 0.2 0.4 0 1 1900 0.11 0.31 0 1 184
Unemployed 0.09 0.29 0 1 1900 0.11 0.31 0 1 184
Marital Status
Single 0.18 0.38 0 1 1900 0.23 0.42 0 1 184
Married 0.64 0.48 0 1 1900 0.59 0.49 0 1 184
Others
Male 0.47 0.5 0 1 1900 0.56 0.5 0 1 184
Age 47.2 16.87 18 109 1900 41.1 14.49 19 77 184
HH Members 1.31 1.5 0 9 1900 1.79 1.72 0 8 184
Assets 1.34 8.27 0 100 1818 1.28 7.76 0 80 172
Cash WD 5.35 9.98 0 434.82 1893 10.1 20.05 0 130.5 184
Note: Survey weights used. Subcategories do not sum to main category due to rounding and weighting. Cash
withdrawals (WD) per month. Assets (in 1000) do not include houses.
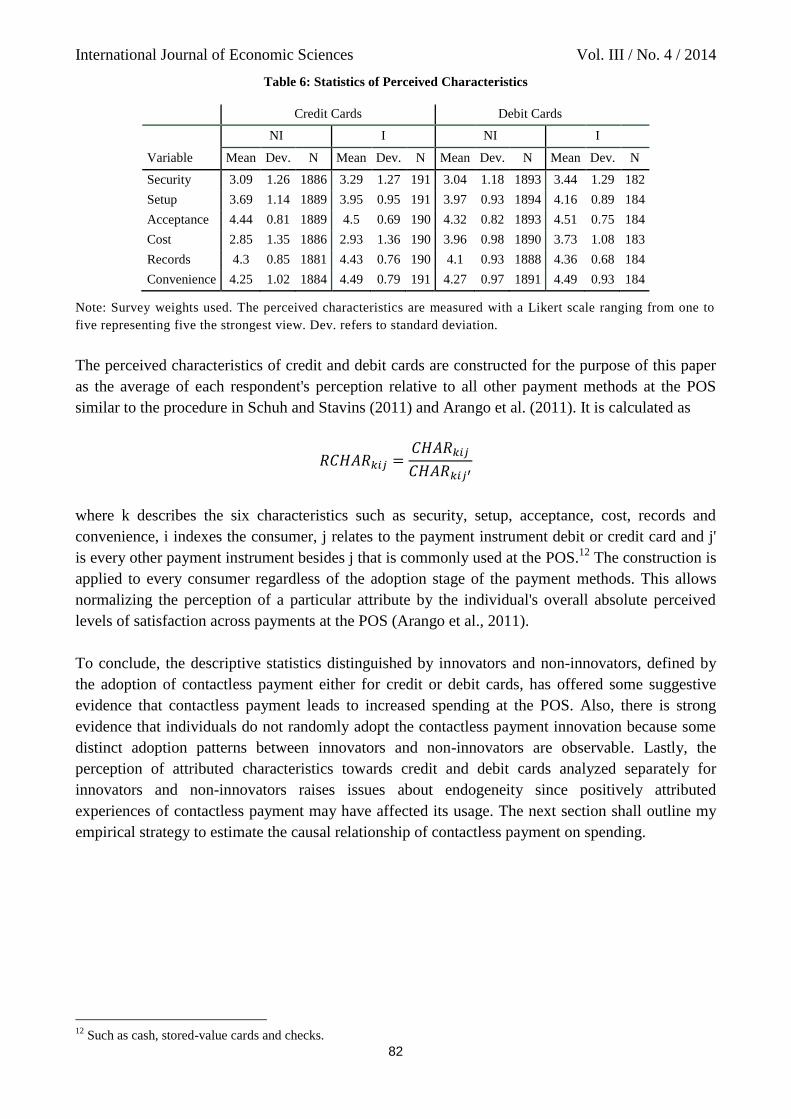
Previous studies have found significant evidence that perceptions about payment attributes such as
costs, safety and convenience improve the explanation of consumer payment decisions since they
largely account for unobservable preferences (e.g. Jonker, 2007; Schuh and Stavins, 2011). The
SCPC explicitly asks respondents to evaluate their perceptions about debit and credit cards in terms
of security, setup, acceptance, cost, records and convenience on a categorical scale from one to five,
where the latter implies the strongest view. Innovators in general rate the six characteristics listed as
higher than non-innovators implying that contactless payment might have subtly and positively
altered the perception and affinity towards these cards (see Table 6). It is noteworthy that especially
convenience is highly attributed to contactless payment. Costs for debit cards are perceived as lower
by innovators than non-innovators in contrast to credit cards, which costs are rated higher by
contactless credit card adopters.
International Journal of Economic Sciences Vol. III / No. 4 / 2014
82
Table 6: Statistics of Perceived Characteristics
Credit Cards Debit Cards
NI I NI I
Variable Mean Dev. N Mean Dev. N Mean Dev. N Mean Dev. N
Security 3.09 1.26 1886 3.29 1.27 191 3.04 1.18 1893 3.44 1.29 182
Setup 3.69 1.14 1889 3.95 0.95 191 3.97 0.93 1894 4.16 0.89 184
Acceptance 4.44 0.81 1889 4.5 0.69 190 4.32 0.82 1893 4.51 0.75 184
Cost 2.85 1.35 1886 2.93 1.36 190 3.96 0.98 1890 3.73 1.08 183
Records 4.3 0.85 1881 4.43 0.76 190 4.1 0.93 1888 4.36 0.68 184
Convenience 4.25 1.02 1884 4.49 0.79 191 4.27 0.97 1891 4.49 0.93 184
Note: Survey weights used. The perceived characteristics are measured with a Likert scale ranging from one to
five representing five the strongest view. Dev. refers to standard deviation.
The perceived characteristics of credit and debit cards are constructed for the purpose of this paper
as the average of each respondent's perception relative to all other payment methods at the POS
similar to the procedure in Schuh and Stavins (2011) and Arango et al. (2011). It is calculated as
where k describes the six characteristics such as security, setup, acceptance, cost, records and
convenience, i indexes the consumer, j relates to the payment instrument debit or credit card and j'
is every other payment instrument besides j that is commonly used at the POS.12
The construction is
applied to every consumer regardless of the adoption stage of the payment methods. This allows
normalizing the perception of a particular attribute by the individual's overall absolute perceived
levels of satisfaction across payments at the POS (Arango et al., 2011).
To conclude, the descriptive statistics distinguished by innovators and non-innovators, defined by
the adoption of contactless payment either for credit or debit cards, has offered some suggestive
evidence that contactless payment leads to increased spending at the POS. Also, there is strong
evidence that individuals do not randomly adopt the contactless payment innovation because some
distinct adoption patterns between innovators and non-innovators are observable. Lastly, the
perception of attributed characteristics towards credit and debit cards analyzed separately for
innovators and non-innovators raises issues about endogeneity since positively attributed
experiences of contactless payment may have affected its usage. The next section shall outline my
empirical strategy to estimate the causal relationship of contactless payment on spending.
12
Such as cash, stored-value cards and checks.

International Journal of Economic Sciences Vol. III / No. 4 / 2014
83
4 Methodology
4.1 Identifying Assumptions
To estimate the relationship between contactless payment and the spending ratio one can use
standard OLS regression:
where is the share of transactions of individual i for payment method j, where j relates to
debit or credit cards, relative to every other payment instrument j' besides j that is commonly used
at the POS, takes the value of one if the individual is an innovator, i.e. a contactless payment
adopter for payment method j, are the observed characteristics for individual i and is the error
term.13
It is necessary that the variable is strictly exogenous to obtain an unbiased estimate of the
causal parameter α. However, as the descriptives have shown, it is most likely that the adoption of
the contactless feature ( ) is non-randomly assigned and thus the estimate may be biased and
inconsistent (selection bias). There is great concern that some unobserved variables cause
individuals to select into treatment and simultaneously to make more card payments. For instance,
individuals could deliberately adopt contactless payment because they pay generally more by
payment cards resulting in higher preferences towards the contactless technology. The utility of
contactless payment might be much greater for these individuals than for others.
Moreover, it might be the case that is correlated with some other variables that could also have
an impact on the number of payments and cannot be measured directly (omitted variable bias). For
instance, individuals that frequently use payment cards are specifically addressed by card issuers
promoting the use of the contactless feature. Another important unobserved factor that might
determine the adoption and usage of contactless payment could be an individual's affinity for new
technologies, labeled personal innovativeness that influences preferences for electronic payments
and the likelihood of adopting payment innovations.14
Further, it is most likely that contactless payment and spending suffer from reverse causality since
contactless payment may induce individuals to make more transactions or individuals could adopt
contactless payment to meet their personal preferences for frequent usage of payment cards. It is
thus not evident if innovation drives spending or vice-versa.
13
Other payment methods used at the POS are cash, stored-value cards, checks and money order. 14
One might also consider the fact that the payment market is inherently characterized by a special market structure, i.e.
the two-sided market, where network effects are predominant. To put it differently, the value of contactless payment for
a consumer depends on the number of others using it. If the critical level of users had not been exceeded, the merchants
would not invest in payment terminals and offer this payment method due to small economies of scale. This is typically
referred to as the chicken-and-egg problem. Hence, the adoption and usage of contactless payment may face feedback
effects, implying that consumers will actually choose contactless payment conditional on the number of terminals
available that allow deploying this technology. However, this issue cannot be addressed adequately in the estimation
due to data restrictions.
International Journal of Economic Sciences Vol. III / No. 4 / 2014
84
These biases all stem from endogeneity, i.e. the regressor is correlated with the error term . In
these circumstances, OLS provides biased estimates of the effect of the treatment .15
A common
and reliable methodology to control for endogeneity is the instrumental variable (IV) research
design providing high order of internal validity. In this sense, the IV (or alternatively the excluded
instrument) must be highly correlated with the endogenous explanatory variable - the treatment -
and must not be correlated with the error term . However, the IV estimates are only as good as the
excluded instruments used. It has been cumbersome to find plausible instruments in this context.
A significant amount of unobserved heterogeneity can be captured by the inclusion of individuals'
perceptions on payment cards characteristics (Jonker, 2007; Kim et al., 2006; Ching and Hayashi,
2010).16
Also, some proxy variables that account for personal innovativeness help to control for
unobservables. Therefore, the issue of endogeneous treatment is largely mitigated. However, the
problem of non-random assignment into treatment has to be eliminated.
4.2 Estimation Strategy
To cope with the problem of selection into treatment, I apply propensity score matching (PSM) that
generally provides a high order of internal validity (Nichols, 2007). Regarding the measurement of
the difference in spending between innovators and non-innovators at the POS, I define the potential
outcome ( ) as the ratio of transactions for individual i and payment method j, where j
relates to debit or credit cards, relative to every other payment instrument j′ besides j that is
commonly used at the POS, and where equals one if individual i receives treatment ( = 1) of
payment method j and zero otherwise ( = 0).17
According to Caliendo and Kopeinig (2005), the treatment effect for an individual i and payment
method j can be written as
However, the problem arises that only one of the potential outcomes is observed for each individual
i, where i = 1, ..., N and N denotes the total population. Therefore, the individual treatment effect
cannot be estimated and one has to focus on (population) average treatment effects, which can be
measured by invoking some identifying assumptions. Under the assumption that the selection into
treatment solely depends on the observables and the potential outcome is independent on the
treatment assignment, the PSM gives consistent and efficient estimates of the average treatment
effects. This is a strong assumption known as unconfoundedness or conditional independence
assumption. It implies that the decision to adopt contactless payment is random and exogeneous to
other variables such as the number of payment card transactions. Given this assumption, the average
15
Only with strong distributional assumptions on and i, i.e. both parameters are normally distributed implying the
effect of the treatment does not vary across individuals, the causal effect may be consistently estimated by OLS
(Nichols, 2007). However, one can hardly think of such a homogeneous effect in reality. 16
Some other endogeneity issues may arise since it is far from clear-cut whether the perceived characteristics of
contactless payment lead to more spending or is it that the gained positive experiences of spending by contactless cards
induce the perceived characteristics to raise. 17
Other payment methods used at the POS are cash, stored-value cards, checks and money order.

International Journal of Economic Sciences Vol. III / No. 4 / 2014
85
difference in the spending ratio is thus defined as the expectation of the difference in the spending
ratio of adopters and non-adopters. The parameters to be estimated are
where the ATE ( ) represents the average treatment effect and the ATT ( ) the average
treatment effect on the treated that measures the mean effect of the treatment for the sample of
innovators. This effect is more relevant in this context since individuals tend to become more and
more contactless payment adopters due to the diffusion process of the innovation.
Since conditioning on all relevant covariates is restricted in case of high dimensions, Rosenbaum
and Rubin (1983) suggest using balancing scores such as the propensity score. It requires that all
variables relevant to the probability of being selected into treatment may be observed and included
in . In a first step, the PSM estimates each individual's probability of receiving the treatment
, i.e. the probability of adopting contactless payment for payment method j,
conditional on the observables , and matches individuals with similar predicted propensities
in a second step. This allows the untreated units to be used to construct an unbiased
counterfactual for the treatment group. Based on the propensities provided by Logit or Probit
estimation, the ratio of spending of seemingly similar individuals is then compared and averaged.
The PSM estimators for and then result in
whereas equals the number of innovators. The estimators are the mean differences in outcomes
weighted by the propensity score.
Another requirement besides the conditional independence assumption is the overlap assumption
ensuring that individuals with the same have positive probability of both adopting and non-
adopting contactless payment, such that . This ensures to have a comparison
group in the sample.
4.3 Sensitivity Analysis
If selection is not exclusively on observables, the estimator will be both biased and inefficient. In
order to check if the estimates are robust and to calculate how sensitive the estimates are to
unobserved variables, I estimated the Rosenbaum bounds (RB), which provide evidence on the
degree to which significant results hinge on the unconfoundedness assumption that, however,
cannot directly be tested because this would mean to explicitly observe variables that affect
International Journal of Economic Sciences Vol. III / No. 4 / 2014
86
selection into treatment (Rosenbaum, 2002). The participation probability of payment innovation is
given by
where equals one if individual i receives treatment of payment method j and zero otherwise,
are the observed characteristics for individual i, F is the cumulative density function, is the
unobserved variable and γ is the effect of on the participation decision into treatment. The log-
odds ratios for matched individuals with the same characteristics
if there is no hidden bias, γ = 0, implying that the participation probability is exclusively determined
by and there is no unobserved variable that simultaneously affect the probability of receiving
treatment and the outcome variable. However, two individuals with identical X will have different
chances of treatment if there is hidden bias, γ > 0, so that the log-odds will be
. In fact, the sensitivity analysis evaluates how changing the values of γ affects
inference of the treatment effect while the RB are the bounds on the odds ratio that either of the two
matched individuals will receive treatment (Rosenbaum, 2002).
5 Estimation Results
First, to estimate the effect of contactless payment on the ratio of spending, I obtained the
propensity score of adopting contactless credit or debit cards separately for each individual, where
contactless payment adopters represent the treatment and non-adopters the control group. Second, I
compared the share of credit and debit card transactions to the total POS transactions of individuals
in the treatment and control group with the same propensity scores and average it over the whole
sample N and subsample N1 resulting in the ATE and ATT. The results of the ATT are of greater
interest in this context. I thereby applied the Stata module psmatch2 to implement PSM, which is
provided by Leuven and Sianesi (2003).
Regarding the inclusion of optimal covariates in the propensity score model, only those that are
unaffected by participation should be considered, i.e. they should be time invariant or measured in
advance of the treatment (Caliendo and Kopeinig, 2005). According to theory (e.g. Venkatesh et al.,
2003; Rogers, 2003) and previous research on contactless payment (Fujiki and Tanaka, 2009; Lee
and Kwon, 2002; Wang, 2008), I estimated two Logit models separately for contactless credit and
debit cards that control for demographics, financial status, perceptions on card attributes, personal
innovativeness, the number of cash withdrawals and residential states.18
The corresponding link
tests indicate that the Logit models are properly specified.
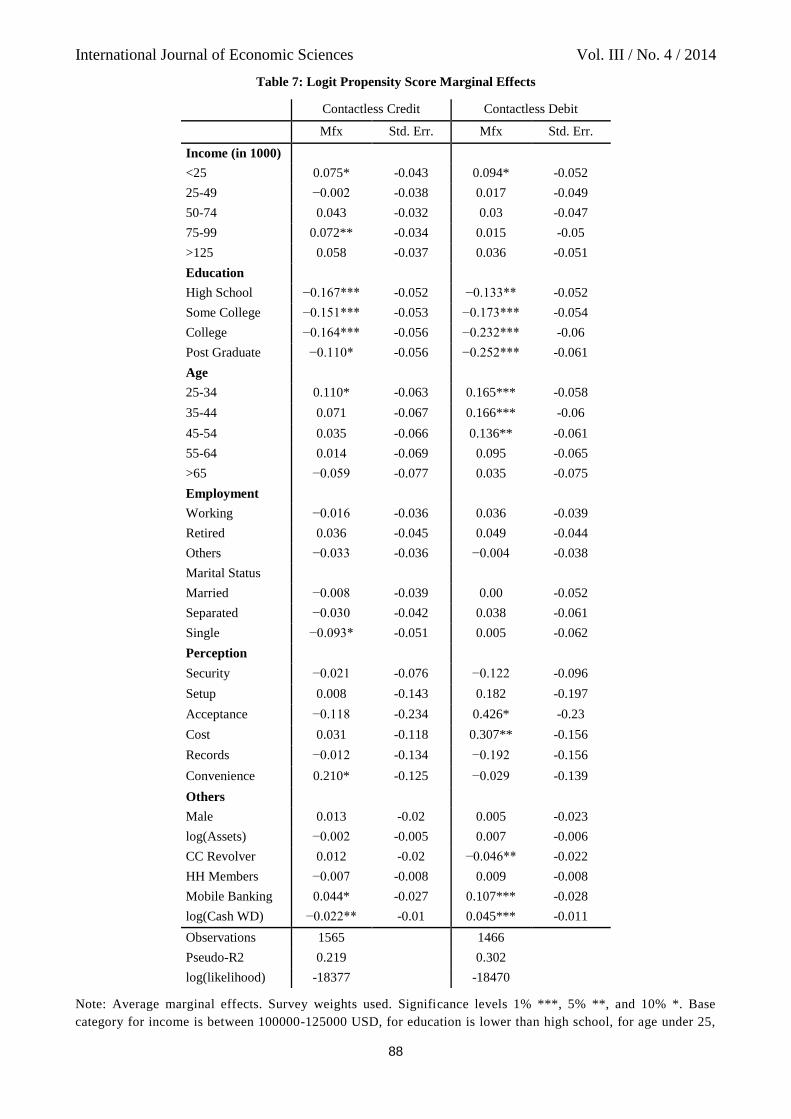
The marginal effects of the Logit estimations both for contactless credit and debit cards are
displayed in Table 7. It is observable that the number of cash withdrawals, education, some income
and age brackets, as well as certain perceptions and whether being single and having adopted
mobile banking are statistically significant effects in describing the adoption of contactless credit
cards, holding all else constant. The probability of adopting contactless credit cards for individuals
earning between 75000 and 99000 USD is 7.2 percent higher than for those earning 100000-125000
18
For more details on the theoretical background, see section 2.

International Journal of Economic Sciences Vol. III / No. 4 / 2014
87
USD and 11 percent higher for people aging 25-34 compared to people younger than 25 years.
Singles and college graduates are less likely to adopt contactless payment compared to widowed
(-9.3 percent) and also less likely than high school graduates (-16.4 percent), respectively. A one
percent increase in the number of cash withdrawals lowers the probability of adopting contactless
credit cards by 2.2 percent, whereas the adoption of mobile banking raises the probability by 4.4
percent. This may give evidence that personal innovativeness has a crucial effect on the adoption
behavior of innovations. As convenience of credit cards in relation to all other payment methods
increases, individuals are more likely to adopt contactless credit (21 percent). This is a strong
indicator that contactless credit cards may meet this requirement.
International Journal of Economic Sciences Vol. III / No. 4 / 2014
88
Table 7: Logit Propensity Score Marginal Effects
Contactless Credit Contactless Debit
Mfx Std. Err. Mfx Std. Err.
Income (in 1000)
<25 0.075* -0.043 0.094* -0.052
25-49 −0.002 -0.038 0.017 -0.049
50-74 0.043 -0.032 0.03 -0.047
75-99 0.072** -0.034 0.015 -0.05
>125 0.058 -0.037 0.036 -0.051
Education
High School −0.167*** -0.052 −0.133** -0.052
Some College −0.151*** -0.053 −0.173*** -0.054
College −0.164*** -0.056 −0.232*** -0.06
Post Graduate −0.110* -0.056 −0.252*** -0.061
Age
25-34 0.110* -0.063 0.165*** -0.058
35-44 0.071 -0.067 0.166*** -0.06
45-54 0.035 -0.066 0.136** -0.061
55-64 0.014 -0.069 0.095 -0.065
>65 −0.059 -0.077 0.035 -0.075
Employment
Working −0.016 -0.036 0.036 -0.039
Retired 0.036 -0.045 0.049 -0.044
Others −0.033 -0.036 −0.004 -0.038
Marital Status
Married −0.008 -0.039 0.00 -0.052
Separated −0.030 -0.042 0.038 -0.061
Single −0.093* -0.051 0.005 -0.062
Perception
Security −0.021 -0.076 −0.122 -0.096
Setup 0.008 -0.143 0.182 -0.197
Acceptance −0.118 -0.234 0.426* -0.23
Cost 0.031 -0.118 0.307** -0.156
Records −0.012 -0.134 −0.192 -0.156
Convenience 0.210* -0.125 −0.029 -0.139
Others
Male 0.013 -0.02 0.005 -0.023
log(Assets) −0.002 -0.005 0.007 -0.006
CC Revolver 0.012 -0.02 −0.046** -0.022
HH Members −0.007 -0.008 0.009 -0.008
Mobile Banking 0.044* -0.027 0.107*** -0.028
log(Cash WD) −0.022** -0.01 0.045*** -0.011
Observations 1565 1466
Pseudo-R2 0.219 0.302
log(likelihood) -18377 -18470
Note: Average marginal effects. Survey weights used. Significance levels 1% ***, 5% **, and 10% *. Base
category for income is between 100000-125000 USD, for education is lower than high school, for age under 25,

International Journal of Economic Sciences Vol. III / No. 4 / 2014
89
for employment unemployed and for marital status widowed. For brevity, coefficients of residential state
dummies are not displayed
I find evidence that education, younger cohorts, low income individuals, certain perceived
attributes, the number of cash withdrawals and whether to revolve on credit cards or not are, ceteris
paribus, statistically significant factors that predict the adoption of contactless debit cards. For
instance, people that attended college are 23 percent less likely to adopt contactless debit cards
compared to lower than high school attendants. As costs of debit cards decrease and acceptance
increase, the probability to adopt contactless debit rises by around 30 and 42 percent, respectively,
implying the importance of supply-side factors. Credit card revolvers are 4.6 percent less likely to
adopt contactless debit, which may suggest that these heavily rely on the provisioning of credit,
which debit cards cannot provide. Also, a one percentage increase in cash withdrawals raises the
probability to adopt contactless debit by 4.5 percent indicating some complementarity between cash
and debit cards. As opposed to theory, gender does not have any influence on the adoption patterns
of contactless payment.
The relationship between the spending ratio and the propensity score for innovators and non-
innovators both for credit and debit cards is depicted in Figure 3 and 4. It can be inferred that as the
propensity score increases, adopters have a higher ratio of transactions. This relationship is slightly
stronger for contactless credit adopters than non-adopters (0.7 vs. 0.67) while for contactless debit
adopters, the correlation is less pronounced (0.13 vs. 0.79).
Figure 3: Spending vs. Propensity Score of Contactless Credit Cards
Note: Logit propensity score, share of credit card payments at the POS
Figure 4: Spending vs. Propensity Score of Contactless Debit Cards

International Journal of Economic Sciences Vol. III / No. 4 / 2014
90
Note: Logit propensity score, share of debit card payments at the POS
Common Support. Figure 5 and 6 exhibit the distribution of the propensity scores of contactless
payment adopters and non-adopters both for credit and debit cards. They visually show that the
common support assumption is fulfilled. It is also worth noting that the identified heterogeneity
between these two groups, which is discussed in section 3.2, is recognizable. Thereby, the majority
of cases within the control group concentrate on the interval from 0 to 0.1, where those of the
treatment group mostly lie above 0.1. Consequently, individuals differ from the covariates being
used in the analysis.
Figure 5: Common Support for Contactless Credit Cards
Note: Logit propensity score
Figure 6: Common Support for Contactless Credit Cards
Note: Logit propensity score
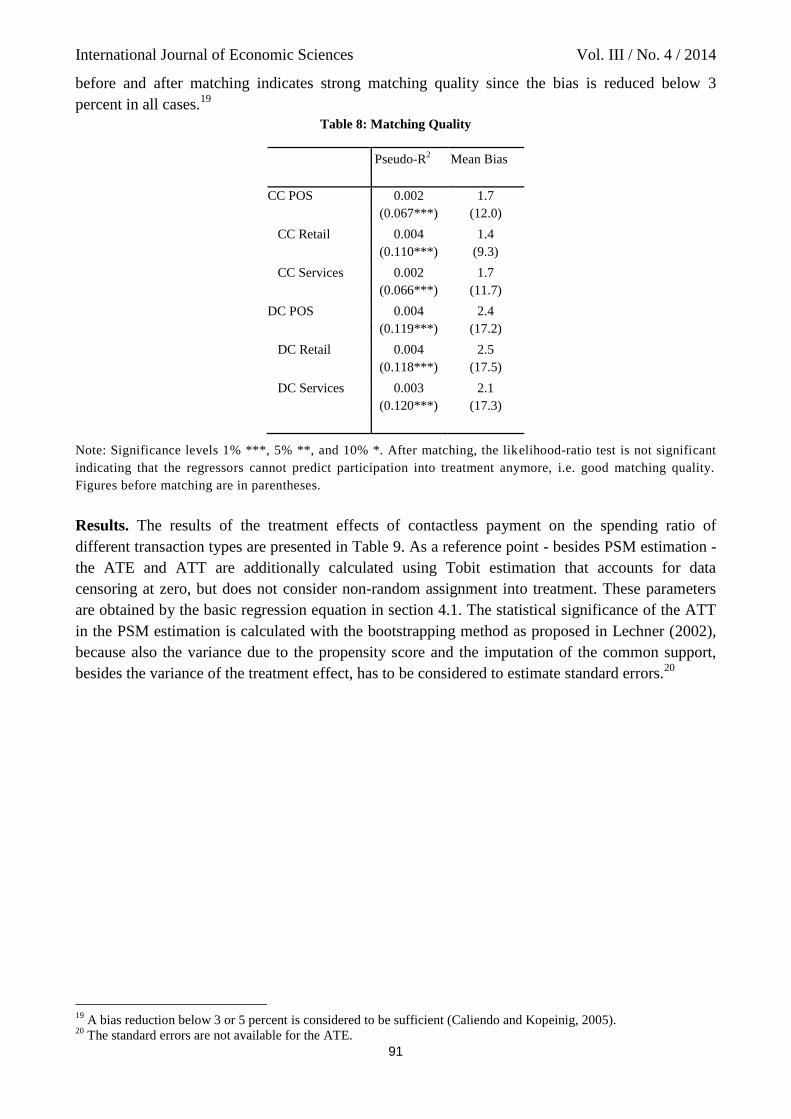
Matching Quality. To test whether unequally distributed covariates between the groups are in sum
well balanced by the propensity score, I here present test statistics of the matching quality in Table
8. After matching, significant differences between the control and treatment group should not be
observable anymore. There are various matching algorithms, from which I chose kernel matching
due to many comparable untreated individuals (Caliendo and Kopeinig, 2005). The test statistics
show that the Pseudo-R2 is close to zero and statistically insignificant in all cases, implying that
none of the covariates is suitable to predict participation anymore. Furthermore, the mean bias
International Journal of Economic Sciences Vol. III / No. 4 / 2014
91
before and after matching indicates strong matching quality since the bias is reduced below 3
percent in all cases.19
Table 8: Matching Quality
Pseudo-R2 Mean Bias
CC POS 0.002 1.7
(0.067***) (12.0)
CC Retail 0.004 1.4
(0.110***) (9.3)
CC Services 0.002 1.7
(0.066***) (11.7)
DC POS 0.004 2.4
(0.119***) (17.2)
DC Retail 0.004 2.5
(0.118***) (17.5)
DC Services 0.003 2.1
(0.120***) (17.3)
Note: Significance levels 1% ***, 5% **, and 10% *. After matching, the likelihood-ratio test is not significant
indicating that the regressors cannot predict participation into treatment anymore, i.e. good matching quality.
Figures before matching are in parentheses.
Results. The results of the treatment effects of contactless payment on the spending ratio of
different transaction types are presented in Table 9. As a reference point - besides PSM estimation -
the ATE and ATT are additionally calculated using Tobit estimation that accounts for data
censoring at zero, but does not consider non-random assignment into treatment. These parameters
are obtained by the basic regression equation in section 4.1. The statistical significance of the ATT
in the PSM estimation is calculated with the bootstrapping method as proposed in Lechner (2002),
because also the variance due to the propensity score and the imputation of the common support,
besides the variance of the treatment effect, has to be considered to estimate standard errors.20
19
A bias reduction below 3 or 5 percent is considered to be sufficient (Caliendo and Kopeinig, 2005). 20
The standard errors are not available for the ATE.
International Journal of Economic Sciences Vol. III / No. 4 / 2014
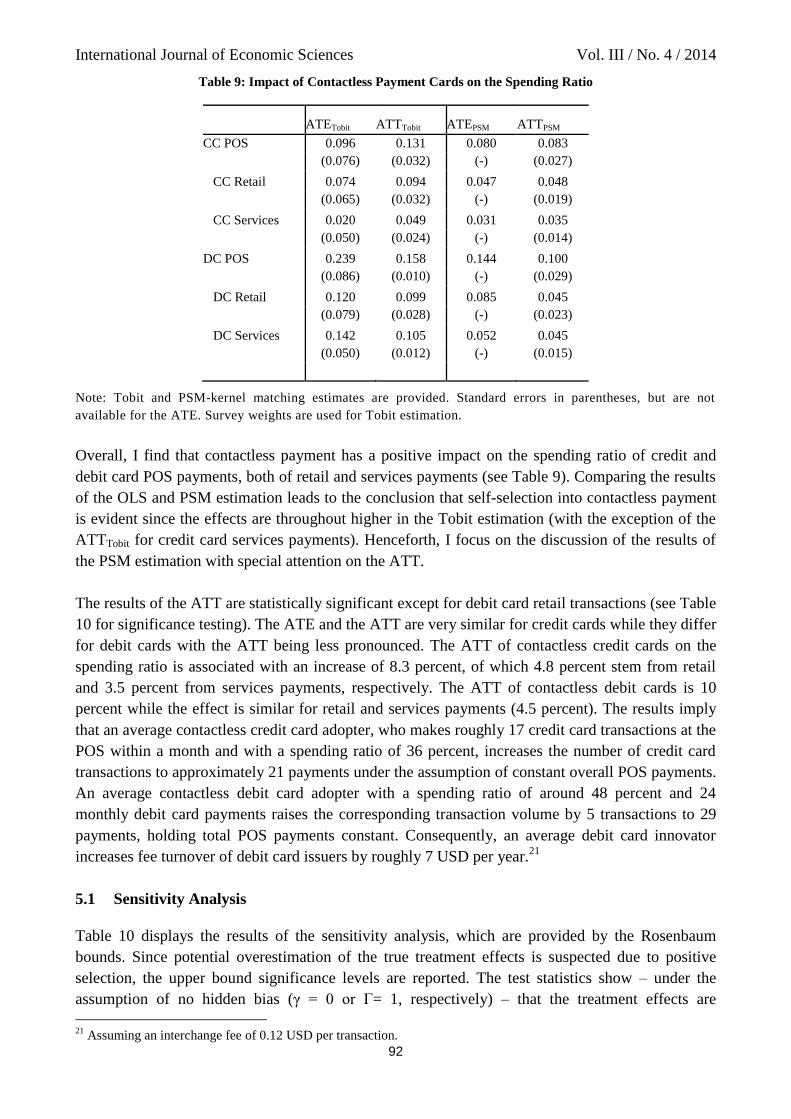
92
Table 9: Impact of Contactless Payment Cards on the Spending Ratio
ATETobit ATTTobit ATEPSM ATTPSM
CC POS 0.096 0.131 0.080 0.083
(0.076) (0.032) (-) (0.027)
CC Retail 0.074 0.094 0.047 0.048
(0.065) (0.032) (-) (0.019)
CC Services 0.020 0.049 0.031 0.035
(0.050) (0.024) (-) (0.014)
DC POS 0.239 0.158 0.144 0.100
(0.086) (0.010) (-) (0.029)
DC Retail 0.120 0.099 0.085 0.045
(0.079) (0.028) (-) (0.023)
DC Services 0.142 0.105 0.052 0.045
(0.050) (0.012) (-) (0.015)
Note: Tobit and PSM-kernel matching estimates are provided. Standard errors in parentheses, but are not
available for the ATE. Survey weights are used for Tobit estimation.
Overall, I find that contactless payment has a positive impact on the spending ratio of credit and
debit card POS payments, both of retail and services payments (see Table 9). Comparing the results
of the OLS and PSM estimation leads to the conclusion that self-selection into contactless payment
is evident since the effects are throughout higher in the Tobit estimation (with the exception of the
ATTTobit for credit card services payments). Henceforth, I focus on the discussion of the results of
the PSM estimation with special attention on the ATT.
The results of the ATT are statistically significant except for debit card retail transactions (see Table
10 for significance testing). The ATE and the ATT are very similar for credit cards while they differ
for debit cards with the ATT being less pronounced. The ATT of contactless credit cards on the
spending ratio is associated with an increase of 8.3 percent, of which 4.8 percent stem from retail
and 3.5 percent from services payments, respectively. The ATT of contactless debit cards is 10
percent while the effect is similar for retail and services payments (4.5 percent). The results imply
that an average contactless credit card adopter, who makes roughly 17 credit card transactions at the
POS within a month and with a spending ratio of 36 percent, increases the number of credit card
transactions to approximately 21 payments under the assumption of constant overall POS payments.
An average contactless debit card adopter with a spending ratio of around 48 percent and 24
monthly debit card payments raises the corresponding transaction volume by 5 transactions to 29
payments, holding total POS payments constant. Consequently, an average debit card innovator
increases fee turnover of debit card issuers by roughly 7 USD per year.21
5.1 Sensitivity Analysis
Table 10 displays the results of the sensitivity analysis, which are provided by the Rosenbaum
bounds. Since potential overestimation of the true treatment effects is suspected due to positive
selection, the upper bound significance levels are reported. The test statistics show – under the
assumption of no hidden bias (γ = 0 or Γ= 1, respectively) – that the treatment effects are
21
Assuming an interchange fee of 0.12 USD per transaction.

International Journal of Economic Sciences Vol. III / No. 4 / 2014
93
statistically significant indicating that no selection bias occurs, i.e. those who have a contactless
feature do not have higher spending ratios even without participating with the exception of debit
card retail payments.22
Further, the results reveal that the treatment effects for credit and debit card
POS payments are still significant even if a confounding factor would alter the odds of the adoption
of contactless credit cards (Γ = 1.25) and debit cards (Γ = 1.5). The upper bound Hodges-Lehman
point estimates indicate that in case of Γ = 1.25, the treatment effect for credit and debit card POS
payments is still 4.7 and 7.4 percent, respectively.
Table 10: Rosenbaum Bounds Sensitivity Analysis and Significance Test
1 1.25 1.5 1.75 2 Std. Err.ATTPSM
CC POS 0.001 0.038 0.206 0.494 0.752 0.045**
(0.078) (0.047) (0.023) (0.000) (-0.021)
CC Retail 0.026 0.229 0.591 0.854 0.962 0.019***
(0.035) (0.014) (-0.005) (-0.021) (-0.033)
CC Services 0.059 0.356 0.726 0.923 0.984 0.014**
(0.021) (0.005) (-0.009) (-0.018) (-0.027)
DC POS 0.000 0.008 0.061 0.206 0.423 0.032***
(0.106) (0.074) (0.048) (0.024) (0.005)
DC Retail 0.124 0.483 0.807 0.949 0.990 0.036
(0.025) (0.001) (-0.017) (-0.033) (-0.046)
DC Services 0.005 0.074 0.288 0.575 0.798 0.078***
(0.037) (0.020) (0.007) (-0.003) (-0.011)
Note: Upper bound significance levels are displayed (p-values). Upper bound Hodges-Lehman point estimates
are in parentheses. Standard errors for the PSM estimation of the ATT are calculated using 100 bootstrap
replications taking into account the propensity score while for the ATE it is not applicable .
6 Conclusion
The aim of this paper was to investigate the effect of contactless payment on spending in terms of
transactions for different transaction types at the point-of-sale using a comprehensive US data set
(SCPC). Controlling for selection into treatment by propensity score matching, my analysis reveals
that recent retail payment innovation such as contactless credit and debit cards lead to an increase in
the spending ratio by roughly 8 and 10 percent for credit and debit cards, respectively. The results
are insensitive to any hidden bias.
The results provide evidence that faster and more convenient payment products that can be
deployed at the POS such as contactless payment induce individuals to undertake more frequent
transactions. These findings give advice for contactless card issuers to actively promote the
payment product and thus accelerate the diffusion process, which finally is expected to lead to
increasing revenue streams. Also, they show that policy makers should pay attention on regular
market monitoring to ensure balanced fee structures in the payment market, as more frequent
transactions put higher burdens on shop owners. Under the current interchange fee structure, for
22
Note that .
International Journal of Economic Sciences Vol. III / No. 4 / 2014
94
instance, incremented costs for merchants due to more frequent debit card usage cannot be
compensated by the reduction in costs due to faster checkout.23
The analysis faces several limitations. First, the major downside of the data set entails the absence
of information on the exact spending in terms of volume and value of contactless devices. It only
reports their adoption rate. In fact, there may exist two different and independent processes
determining the adoption in the first and the usage of contactless payment in the second stage. For
instance, contactless payment adopters could never use the technology, but instead pay more
frequently by conventional payment cards than those who do not possess a contactless card,
resulting in a possible overestimation of the corresponding effect. Payment diaries that report each
transaction in detail would help to obtain more accurate results. Additionally, the effect on value
spending could then be investigated.
Secondly, the data set does not obtain supply-side factors that obviously play a crucial role in the
context of individual payment preferences. In this sense, the question raises how generalizable the
setting of the empirical study and the results are. There are major cultural and institutional
differences between the US and European payment composition at present stemming from history.
High actual payment card usage in the US can be traced back to the historical reliance on check use
in conjunction with an undeveloped giro system whereas the importance of credit transfers and
debit cards in Europe originated from the historical establishment of the postal giro system. There
seems to be a predominant inertia in payment instrument use and the current patterns depend
strongly on the past composition (Humphrey et al., 1996). Therefore, specific payment patterns in
the two payment areas may have a significant impact on the strength of the effects. Also, the US
may experience greater network effects since the diffusion of contactless payment terminals is
already at an advanced stage.
23
Given the fee of 0.12 USD and the reduction of 0.03 USD per transaction (cf. Board of Governors of the Federal
Reserve System, 2011; Borzekowski and Kiser, 2008).
International Journal of Economic Sciences Vol. III / No. 4 / 2014
95
References
Agarwal, S., Chakravorti, S. and Lunn, A. (2010) Why do banks reward their customers to use their
credit cards?, Working Paper 2010-19, Federal Reserve Bank of Chicago.
Alvarez, F. and Lippi, F. (2009) Financial innovation and the transactions demand for cash,
Econometrica, 77(2), 363-402.
Amromin, G. and Chakravorti, S. (2007) Debit card and cash usage: A cross-country analysis,
Working Paper 2007-04, Federal Reserve Bank of Chicago.
Arango, C., Huynh, K. P. and Sabetti, L. (2011) How do you pay? The role of incentives at the
point-of-sale, Working Paper 2011-23, Bank of Canada.
Board of Governors of the Federal Reserve System (2011) 2009 Interchange Revenue, Covered
Issuer Cost, and Covered Issuer and Merchant Fraud Loss Related to Debit Card Transactions,
[Online]. www.federalreserve.gov/paymentsystems (26.05.2014).
Borzekowski, R. and Kiser, E. K. (2008) The choice at the checkout: Quantifying demand across
payment instruments, International Journal of Industrial Organization, 26, 889-902.
Brouzos, J. (2014) Kreditkartengebühren: Weko schaltet sich ein, Handelszeitung, Ausgabe vom
12.03.2014, [Online]. www.handelszeitung.ch.
Caliendo, M. and Kopeinig, S. (2005) Some practical guidance for the implementation of propen-
sity score matching, IZA Discussion Paper No. 1588.
Carbó-Valverde, S. and Linares-Zegarra, J. M. (2009) How effective are rewards programs in
promoting payment card usage? Empirical evidence, Working Paper Series No. 1141, European
Central Bank, [Online]. www.ecb.europa.eu (27.12.2010).
Ching, A. T. and Hayashi, F. (2010) Payment card rewards programs and consumer payment
choice, Journal of Banking and Finance, 34(8), 1773-1787.
Davis, F. D. (1989) Perceived usefulness, perceived ease of use, and user acceptance of information
technology, MIS Quarterly, 13(3), 319-340.
Drehmann, M., Goodhart, C. and Krueger, M. (2004) The challenges facing currency usage: Will
the traditional transaction medium be able to resist competition from new technologies?, Economic
Policy, 56, 195-227.
European Parliament (2014) MEPs back cap on card payment fees, Committees Committee on
Economic and Monetary Affairs, Press Release 20.02.14, [Online]. www.europarl.europa.eu
(20.03.14).

International Journal of Economic Sciences Vol. III / No. 4 / 2014
96
Evans, D. and Schmalensee, R. (2005) The economics of interchange fees and their regulation: An
overview, Proceedings in Payments System Research Conferences, Federal Reserve Bank of
Kansas City, issue May, 73-120.
Foster, K., Schuh, S. and Zhang, H. (2013) The 2010 survey of consumer payment choice, Re-
search Data Reports No. 13-2, The Federal Reserve Bank of Boston.
Fujiki, H. and Tanaka, M. (2009) Demand for Currency, New Technology and the Adoption of
Electronic Money: Evidence Using Individual Household Data, Discussion Paper No. 2009-E-27,
Institute for Monetary and Economic Studies, Bank of Japan, [Online]. www.imes.boj.or.jp
(27.12.2010).
Humphrey, D. B., Kim, M. and Vale, B. (2001) Realizing the gains from electronic payments: cost,
pricing and payment choice, Journal of Money, Credit and Banking, 33(2), 216 234.
Humphrey, D. B., Pulley, L. B. and Vesala, J. (1996) Cash, paper and electronic payments: A cross-
country analysis, Journal of Money, 28(4), 914 939.
Jaeger, F., Höppli, T. and Koller, J. (2011) Studie: Schweizer Kreditkartenmarkt, St.Gallen:
Executive School of Management, Technology and Law (ES-HSG), [Online]. www.es.unisg.ch
(15.09.13).
Johnson, J. J. (2014) Debit Card Interchange Fees and Routing: Interim Final Rule.
Jonker, N. (2007) Payment instruments as perveived by consumers: Results from a household
survey, De Economist, 155, 21-38.
Kim, B.-M., Yilmazer, T. and Widdows, R. (2006) Adoption of internet banking and consumers'
payment choices, Working Paper, Purdue University.
Klee, E. (2006) Paper or Plastic? The effect of time on check and debit card use at grocery stores,
Working Paper, Board of Governors of the Federal Reserve System.
Lechner, M. (2002) Some practical issues in the evaluation of heterogenous labour market pro-
grammes by matching methods, Journal of Royal Statistical Society, 165, 59-82.
Lee, J. and Kwon, K.-N. (2002) Consumers' use of credit cards: Store credit card usage as an
alternative payment and financing medium, The Journal of Consumer Affairs , 36(2), 239-262.
Leong, L.-Y., Hewb, T.-S., Tan, G. W.-H. and Ooi, K.-B. (2013) Predicting the determinants of the
NFC-enabled mobile credit card acceptance: A neural networks approach, Expert Systems with
Applications, 40, 5604-5620.
Leuven, E. and Sianesi, B. (2003) PSMATCH2: Stata module to perform full Mahalanobis and
propensity score matching, common support graphing, and covariate imbalance testing, Boston
College Department of Economics, Statistical Software Components. Version 4.0.10 10feb2014.
[Online.] http://ideas.repec.org/c/boc/bocode/s432001.html (11.06.2014).

International Journal of Economic Sciences Vol. III / No. 4 / 2014
97
Mallat, N., Rossi, M. and Tuunainen, V. K. (2004) Mobile banking services, Communications of
the ACM, 47(5), 42-46.
Mastercard (2013) Mastercard paypass performance insights, [Online]. http://mastercard-
mobilepartner.com (04.07.2013).
Nichols, A. (2007) Causal inference with observational data, The Stata Journal, 7(4), 507-541.
Pianalto, S. (2012) Collaborating to Improve the U.S. Payments System, [Online].
www.clevelandfed.org (22.10.12).
Rochet, J. (2003) The theory of interchange fees: A synthesis of recent contributions, Review of
Network Economics, 2(2), 97-124.
Rochet, J. and Tirole, J. (2002) Cooperation among competitors: Some economics of payment card
associations, RAND Journal of Economics, 33(4), 549-570.
Rochet, J.-C. and Wright, J. (2010) Credit card interchange fees, Journal of Banking and Finance ,
34(8), 1788-1797.
Rogers, E. M. (2003) Diffusion of Innovation (5th ed.), The Free Press, New York.
Rosenbaum, P. R. (2002) Observational Studies, New York: Springer, 2nd ed.
Rosenbaum, P. R. and Rubin, D. B. (1983) The central role of the propensity score in observational
studies for causal effects, Biometrika, 70(1), 41-55.
Rysman, M. (2007) An empirical analysis of payment card usage, Journal of Industrial Economics,
55, 1-36.
Schuh, S. and Stavins, J. (2010) Why are (some) consumers (finally) writing fewer checks? The
role of payment characteristics, Journal of Banking and Finance, 34(8), 1745-1758.
Schuh, S. and Stavins, J. (2011) How consumers pay: Adoption and use of payments, Working
Paper No. 12-2, Federal Reserve Bank of Boston.
Simon, J., Smith, K. and West, T. (2009) Price incentives and consumer payment behaviour,
Research Discussion Paper, Reserve Bank of Australia.
Venkatesh, V., Morris, M. G., Davis, G. B. and Davis, F. D. (2003) User acceptance of information
technology: Toward a unified view, MIS Quarterly, 27(2), 425-478.
Visa USA (2010) Visa U.S.A. Interchange Reimbursement Fees, [Online]. www.usa.visa.com
(26.05.2014).

International Journal of Economic Sciences Vol. III / No. 4 / 2014
98
von Kalckreuth, U., Schmidt, T. and Stix, H. (2009) Choosing and using payment instruments:
Evidence from German micro-data, Working Paper Series No. 1144, European Central Bank,
[Online]. www.ecb.europa.eu (12.04.2011).
Wakamori, N. and Welte, A. (2012) Why Do Shoppers Use Cash? Evidence from Shopping Diary
Data, Working Paper 2012-24, Bank of Canada.
Wang, Y. (2008) Determinants affecting consumer adoption of contactless credit card: An empirical
study, Cyber Psychology and Behavior, 11(6), 687-689.
Weiner, S. and Wright, J. (2005) Interchange fees in various countries: Developments and deter-
minants, Review of Network Economics, 4, 290-323.
Wiechert, T. J. P. (2009) The Economics of Contactless Payment: An Analysis of the Financial
Impact of Near Field Communication on Stationary Retailers, Dissertation, University of St.Gallen.
Yu, C.-S. (2012) Factors affecting individuals to adopt mobile banking: empirical evidence from the
utaut model, Journal of Electronic Commerce Research, 13(2), 104-121.
Related Documents