Journal of Policy Modeling 25 (2003) 1–41 The impact of China’s WTO accession on patterns of world trade Zhi Wang ∗ School of Computational Sciences, George Mason University, Room 5141, 1800 M Street NW, Washington, DC 20036-5831, USA Received 1 February 2001; received in revised form 1 November 2001; accepted 1 March 2002 Abstract This paper evaluates the impact of China’s WTO accession on patterns of world trade and economic growth by a recursive dynamic, 17-region, 25-sector computable general equilibrium (CGE) model with import embodied technology transfer based on actual market access commitments that China and Taiwan have made to date. The simulation results show that the major gains from WTO accession would accrue to China itself, but the rest of the world, especially developed countries and Asian newly industrialized economies, as well as least developed countries, would also benefit due to the expansion of world trade and improvement of their international terms of trade. Only certain developing countries with an endowment structure similar to China, like those in South America and Southeast Asia, may experience keener competition in labor-intensive exports and lower prices for their products. © 2002 Society for Policy Modeling. Published by Elsevier Science Inc. All rights reserved. JEL classification: F1; F02; C68 Keywords: CGE model; WTO accession; China Zhi Wang is a senior research scientist at the School of Computational Sciences of George Mason University and was an economist with Economic Research Services, US Department of Agriculture. Views expressed in this paper are those of the author and do not represent the opinions of the institution with which he is affiliated. ∗ Tel.: +1-202-694-5381; fax: +1-202-694-6662. E-mail address: [email protected] (Z. Wang). 0161-8938/02/$ – see front matter © 2002 Society for Policy Modeling. PII:S0161-8938(02)00196-5

Welcome message from author
This document is posted to help you gain knowledge. Please leave a comment to let me know what you think about it! Share it to your friends and learn new things together.
Transcript
Journal of Policy Modeling25 (2003) 1–41
The impact of China’s WTO accession onpatterns of world trade�
Zhi Wang∗
School of Computational Sciences, George Mason University, Room 5141, 1800 M Street NW,Washington, DC 20036-5831, USA
Received 1 February 2001; received in revised form 1 November 2001; accepted 1 March 2002
Abstract
This paper evaluates the impact of China’s WTO accession on patterns of world tradeand economic growth by a recursive dynamic, 17-region, 25-sector computable generalequilibrium (CGE) model with import embodied technology transfer based on actual marketaccess commitments that China and Taiwan have made to date. The simulation results showthat the major gains from WTO accession would accrue to China itself, but the rest of theworld, especially developed countries and Asian newly industrialized economies, as wellas least developed countries, would also benefit due to the expansion of world trade andimprovement of their international terms of trade. Only certain developing countries withan endowment structure similar to China, like those in South America and Southeast Asia,may experience keener competition in labor-intensive exports and lower prices for theirproducts.© 2002 Society for Policy Modeling. Published by Elsevier Science Inc. All rights reserved.
JEL classification: F1; F02; C68
Keywords: CGE model; WTO accession; China
� Zhi Wang is a senior research scientist at the School of Computational Sciences of George MasonUniversity and was an economist with Economic Research Services, US Department of Agriculture.Views expressed in this paper are those of the author and do not represent the opinions of the institutionwith which he is affiliated.
∗ Tel.: +1-202-694-5381; fax:+1-202-694-6662.E-mail address: [email protected] (Z. Wang).
0161-8938/02/$ – see front matter © 2002 Society for Policy Modeling.PII: S0161-8938(02)00196-5
2 Z. Wang / Journal of Policy Modeling 25 (2003) 1–41
1. Introduction
Both China and Taiwan are important players in international trade. By theend of 2000, the volume of China’s merchandise exports and imports had reachedUS$249.2 billion and US$225.1 billion, respectively. It was doubled more thantwice in 10 years, much faster than world trade growth as a whole, which onlyincreased 83% during the same period. Taiwan’s exports and imports totaledUS$288.4 billions in 2000. And the total external trade of China, Hong Kong, andTaiwan reached US$810 billion in 1999 (after minus US$137 billion intra-tradebetween the three Chinese economies), far exceed the total trade of Japan (US$731billion) and equal to nearly half of that of the United States. Their roles will likelyincrease as the integration among the three Chinese economies intensifies by therecent unification of Hong Kong and Macao with China and China’s anticipantentry to the World Trade Organization (WTO).
The rapid emergence of China as a world trade power has raised concerns indeveloped and developing economies alike over its potential impact on the worldmarket. With China’s impending accession to the WTO, the effect of China’s WTOmembership on the patterns of world trade and economic growth has also drawnintense interest in both academic and policy discussions. This has led to a substan-tial and still growing volume of literature in analyzing the potential consequence ofthe rise of China and its integration into the global trading system. However, mostrecent studies on China’s WTO accession focus on welfare effects and structuraladjustment in China and its major trade partners (Gilbert & Wahl, 2000). Only alimited effort has been made in understanding its role in shaping the future patternsof world trade.
To fulfil their membership requirements at the WTO, both China and Taiwanhave to implement their commitment to adopt broad and deep trade liberalizationmeasures to bring their trade regime consistent with WTO rules. Implementation ofthese liberalization measures implies a substantial reduction in tariffs and non-tariffbarriers across all economic sectors in one of the world’s largest and most rapidlyexpanding markets. Obviously, it will not only change China’s and Taiwan’s re-source allocation among their domestic production and export sectors, but will alsoaffect the structure of China’s and Taiwan’s trade with their trade partners. Worldtrade patterns and production in other countries will have to adjust to accommodatesuch changes. What opportunities will the growing and liberalizing of Chinese mar-kets likely bring to developing and developed countries around the world? Whatchallenges will the rest of the world face as the tremendous low-cost Chinese laborforce is integrated into the world economy? How will the increase in the exportcompetitiveness of Chinese products affect world markets? Who will gain? Whowill lose? What are the geographical and sectoral distributions of those gains andlosses? To answer those questions and better understand the future patterns ofglobal trade in the 21st century, I used a 17-region, 25-sector recursive dynamiccomputable general equilibrium (CGE) model with import embodied technologytransfer to estimate the differences in world trade and economic growth under
Z. Wang / Journal of Policy Modeling 25 (2003) 1–41 3
alternative scenarios of the world trade liberalization with or without China andTaiwan’s participation. The model includes China’s and Taiwan’s major tradingpartners in both developed and developing countries and covers major productionand trade activities in the world economy from 1997 to 2010. Simulation resultsshow that although China will gain the most from its WTO accession, the rest of theworld, especially developed countries and Asian newly industrialized economies,as well as least developed countries, would also benefit due to the expansion ofworld trade and improvement of their international terms of trade. Only certaindeveloping countries with a endowment structure similar to China, like those inSouth and Southeast Asia, may experience keener competition in labor-intensiveexports and lower prices for their products. Although the numerical model is quitelarge (there are more than 30,000 equations in each simulation period), simulationresults are followed transparently from the model’s (conceptually straightforward)structure based on basic theory of international trade.
The rest of the paper is organized as follows:Section 2outlines the basic struc-ture of the model used in the evaluation.Section 3describes major assumptions inthe baseline calibration and simulation scenario designs. Major simulation resultsand underlying economic forces shaping those results are presented and discussedin Section 4. Section 5ends the paper with its conclusions and limitations.
2. Structure of the model
The model used in this paper is an extension of the CGE models used in theChina’s WTO accession study byWang (1997a, 1997b, 1999)with import embod-ied technology transfer and trade policy induced TFP growth. It is part of a familyof models used widely to analyze the impact of global trade liberalization andstructural adjustment programs. It focuses on the real side of the world economyand incorporates considerable detail on sectoral output and real trade flows, bothbilateral and global. While not designed to generate short-term macroeconomicforecasts, the model could be linked to a macro economic model including as-set flows and generating macro scenarios. Given a macro scenario, however, thismodel could then be used to determine the resulting real trade flows and sectoralstructural adjustments for each region in a recursive dynamic framework. Underassumptions on a likely path of future world economic growth, it generates thepattern of production and trade resulting from world economic adjustment to theshocks specified in the alternative scenarios.
In this study, 17 fully endogenized regions and 25 production sectors in eachregion are specified to represent the world economy. The 17 regions are: (1) theUnited States, (2) Canada, (3) West Europe, (4) Japan, (5) Australia and NewZealand, (6) Mexico, (7) Korea, (8) Singapore, (9) Taiwan, (10) Hong Kong, (11)China, (12) South East Asia (ASEAN, includes Malaysia, Thailand, Philippines,Indonesia, and Viet Nam), (13) South Asia (Indian, Bangladesh, Nepal, Pakistan,and Sri Lanka), (14) Latin American MFA restricted countries (Central Amer-

4 Z. Wang / Journal of Policy Modeling 25 (2003) 1–41
ica and Caribbean, Brazil, Colombia, Peru, Uruguay), (15) Mid-East and SouthAfrican MFA restrict countries (Turkey, Botswana, rest of South African cus-tom Union, and rest of Middle East), (16) Low income South African countries(Malawi, Mozambique, Tanzania, Zambia, and rest of sub-Saharan Africa) and(17) Rest of the world.
The 25 sectors are: (1) rice, (2) wheat, (3) other grains, (4) oilseeds, (5) plantbased fiber, (6) other non-grain crops, (7) livestock, (8) meats and dairy products,(9) processed food, (10) beverage and tobacco, (11) forestry and fishery, (12)mineral products, (13) energy products, (14) textile, (15) wearing apparel, (16)leather, shoes and sport goods, (17) other light manufactures, (18) wood and paperproducts, (19) manufactured intermediates, (20) motor vehicles and parts, (21)other transport equipment, (22) electronic equipment, (23) other machinery, (24)utility, housing and construction, (25) transportation and traded services, a portionof which is allocated to international shipping.
There are six primary factors of production: agricultural land, natural resources,capital, agricultural labor, unskilled-labor, and skilled-labor. Skilled- and unskilled-laborers have basic education in common, but skilled-laborers usually have moreadvanced training. While the agricultural laborers are those who have little or noeducation and work only in farm sectors. Natural resources are sector specific,while other primary factors are assumed to be mobile across sectors, but immobileacross regions. Land and agricultural laborers are only used in agricultural sectors.
The model is able to capture three types of gains from trade liberalization:
1. The gains from more efficient utilization of production resources, whichlead to a one-time permanent increase in GDP and social welfare.
2. More rapid physical capital accumulation, which compounds the efficiencygain from trade liberalization.
3. The model incorporates a capital and intermediate goods imports embodiedtechnology transfer among regions, which links sector specific TFP growthwith each region’s imports of capital and technology-intensive products.The technology transfer is assumed to flow in one direction — from moredeveloped regions to less developed regions. Empirical evidences suggestthat there is strong positive feedback between trade expansion and produc-tivity growth. Trade liberalization increases the prevalence of technologytransfer as trade barriers are reduced. Firms in the liberalized regions willimport more capital and technology-intensive goods as both investment andintermediate inputs from abroad at cheaper prices. Those goods are usuallyembodied with advanced technology from other countries, thus stimulatingproductivity growth for all production factors.
Accumulation patterns for capital stock in the model depend upon depreciationand gross real investment rates, the latter set exogenously based on forecasts fromthe Oxford world macroeconomic model (Oxford Economic Forecasting, 1999).However, household savings, government surplus (deficit), and foreign capital

Z. Wang / Journal of Policy Modeling 25 (2003) 1–41 5
inflows (foreign savings) are assumed to be perfect substitutes and collectivelyconstitute the source of gross investment in each region. Given the assumptionthat aggregate real investment is determined as a share of real GDP, changes in thetrade balance, which directly affects foreign savings, are assumed to have only apartial effect on aggregate real investment in the region. Instead, they lead to anequilibrium adjustment in the domestic savings rate, which partially offsets thechange in foreign savings.
Household savings decisions are endogenous in the model. They representfuture consumption goods for the household with zero subsistence quantity(by assuming inter-temporal separable preferences, ELES demand systems). Aneconomy-wide consumer price index is specified as the price of savings and repre-sents the opportunity cost of giving up current consumption in exchange for futureconsumption (Wang & Kinsey, 1994). Government surplus (deficit) is the differ-ence between government tax revenues and its expenditures, the latter fixed as apercentage of each region’s real GDP based on forecasts from the Oxford model.
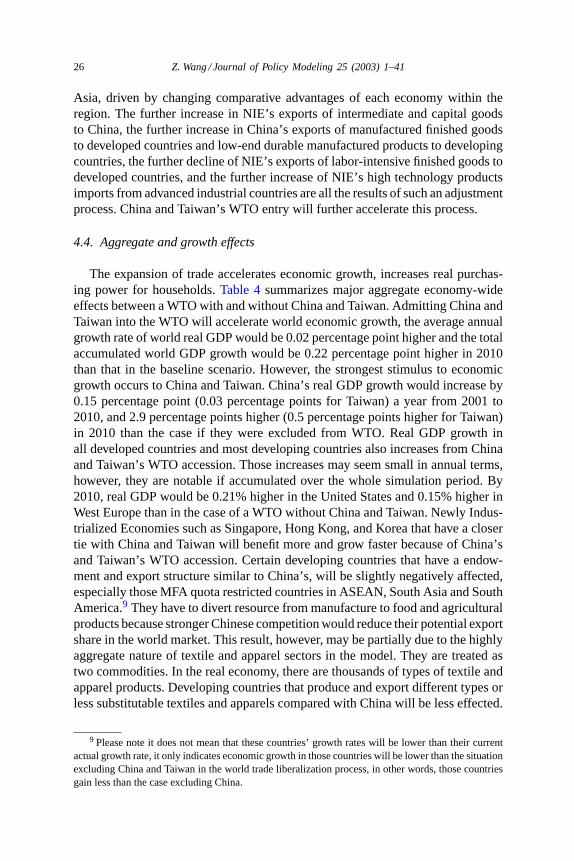
Foreign capital inflows or outflows are determined by the accumulation of thebalance of trade, which is also fixed as a percentage of GDP in each region basedon the Oxford model’s projections except for the United States. The model doesnot include financial markets and portfolio investment. The trade balance is theonly source of foreign savings (either inflow or outflow). There is no explicitspecification of foreign direct investment (FDI). However, it is counted by tradeflows, because in order to convert FDI into production capital, technology andequipment have to be purchased via domestic or international trade.
Agricultural labor and urban unskilled labor are not substitutable in productionfunctions, but are linked by rural–urban migration flows. These flows are endoge-nous in the model and are driven by the rural–urban wage differential and structuralchanges in production and trade. The increase in the skilled labor force is basedon the growth in the stock of tertiary educated labor in each region estimated bythe World Bank (Ahuja & Filmer, 1995), which provides an indication of changesin the number of those qualified for employment as professional and technicalworkers. That is, as tertiary education grows, the share of skilled labor force growscorrespondingly.
There are an economy-wide and a set of sector specific TFP growth variables foreach region in the model. The economy-wide TFP variable is solved endogenouslyin the baseline calibration to match a pre-specified path of real GDP growth in eachregion based on forecasts from the Oxford model. Then the economy-wide TFPvariable is fixed when alternative scenarios are simulated, in such a case, the growthrate of real GDP and the sector-specific TFP variables that link productivity growthand imports are solved endogenously.
Similar toHertel, Will, Koji, and Dimaranan (1995), the multi-fiber arrangement(MFA) quota rents are assumed to be captured by exporting countries as exporttaxes. These export tax rates are adjusted endogenously to equate with quotas.Such a treatment assumes that all quotas are binding constraints at the equilibrium.Consistent with this modeling practice, we divide developing countries subject to

6 Z. Wang / Journal of Policy Modeling 25 (2003) 1–41
MFA quota restrictions into quota binding and non-binding regions1 based onhistorical trade statistics. Quantity constraints only apply to those regions withbinding quotas.
The model is implemented by the General Algebraic Modeling System (GAMS;Brooke, Kendrick, & Meeraus, 1988) and solved in levels. A detailed algebraicspecification of the model and the correspondence between sectors in the model,GTAP and ISIC are available upon request.
3. Baseline calibration and simulations design
Both China’s and Taiwan’s market accession commitments for WTO member-ship include a complex package of trade and investment liberalization measures.In this paper, however, only the following five aspects are considered: (1) tariffreduction in both agricultural and manufacturing products (China and Taiwan); (2)elimination of non-tariff barriers in manufacturing sectors (China and Taiwan); (3)reduction of non-tariff barriers in agricultural commodities and liberalization ofimport quota on agricultural products (China and Taiwan). The accelerated growthof import quota of rice in Taiwan and wheat and plant based fiber in China, andelimination of such quotas in 2005; (4) opening of major service sectors (China);and (5) the phase out of MFA quota on textile and clothing (China and Taiwan).Once China and Taiwan become members of the WTO, their exports in textileand apparel in North America and European markets will be subject to acceleratedMFA quota growth from 2001 to 2004 similar to other developing countries thatare WTO members. The remaining quota restriction will be eliminated at the year2005 according to the Agreement on Textiles and Clothing (ATC).2
Because both China’s and Taiwan’s market accession commitments to WTOentry will be phased in over a transition period, a baseline from 1998 to 2010 is es-tablished first as Scenario I (the Uruguay Round Case) under a set of assumptions.It generates a reference growth path of the world economy with the implementa-tion of the Uruguay Round trade liberalization, but without China’s and Taiwan’sparticipation. This calibrated “benchmark” will serve as a basis of comparison forcounterfactural simulation conducted in Scenario II.
Table 1summarizes the major macro economic assumptions and results fromthe baseline calibration. It uses the economy-wide TFP variable in each region asa residual and adjustment mechanism to match the pre-specified real GDP growth
1 There are 11 developing regions in the model, 9 of them are subject to binding MFA quotas. Theyare Korea, Singapore, Taiwan, Hong Kong, China, ASEAN, South Asia, Latin America MFA restrictedcountries, Mid-East and Africa MFA restricted countries. While Low income Africa countries and restof the world are modeled as MFA quota non-binding countries.
2 On January 1, 1995, the ATC entered into force and replaced the old multi-fiber arrangements(MFA). The ATC provides for the elimination of the quotas and the complete integration of textiles andapparel into the WTO regime over a 10-year transition period ending on January 1, 2005. All WTOcountries are subject to ATC disciplines, and only WTO members are eligible for ATC benefits.

Z.W
ang/Journal
ofPolicy
Modeling
25(2003)
1–417
Table 1Major assumptions for baseline calibration in the modela
UnitedStates
WesternEurope
Japan Australia &New Zealand
Canada Mexico Korea Singapore HongKong
Taiwan China ASEAN SouthAsia
Latin AmericaMFA
Mid-East &Africa MFA
Low incomeAfrica
Rest ofthe world
Worldaverage
Average annual growth rate (%), 2000–2010Real GDP 3.0 2.5 2.5 3.3 2.8 4.9 4.9 5.1 5.3 4.6 7.6 5.1 5.8 3.8 6.6 3.8 5.6 3.5Labor force 0.8 −0.1 −0.2 1.0 0.6 2.4 1.1 0.3 0.2 0.8 0.8 1.9 2.2 1.8 3.1 3.0 1.5 1.5Skill labor 3.1 3.7 2.9 6.7 5.6 2.4 1.1 0.1 4.0 4.1 2.9 5.6 2.2 1.8 6.4 6.4 5.7 4.0TFP 0.7 1.0 1.2 1.0 1.9 0.1 1.9 1.1 1.8 0.9 3.7 1.4 2.2 1.3 3.6 0.7 3.1 1.5
Capital stock 4.7 2.7 2.5 3.8 3.6 6.6 5.3 6.7 4.6 6.6 9.1 5.8 5.5 3.1 2.7 2.6 3.6 3.8Gross investment 4.4 3.5 2.7 2.9 3.5 10.5 5.1 5.1 6.4 3.6 7.6 5.1 5.8 3.8 6.6 3.8 5.6 4.4
Governmentspending
1.9 1.4 1.9 2.6 2.2 3.0 2.8 5.1 7.1 3.4 8.3 5.1 5.8 3.8 6.6 3.8 5.6 2.6
Exports 3.7 3.3 1.0 3.6 2.8 5.0 4.1 4.5 3.1 4.4 7.6 6.3 7.7 4.0 7.0 3.1 5.9 4.3Imports 3.4 3.5 3.8 3.1 3.2 6.2 5.3 4.8 4.7 4.2 6.3 5.1 6.2 4.3 5.8 3.7 5.1 4.3
HH consumption 2.8 2.3 2.9 3.3 2.8 3.4 5.9 6.2 5.7 5.2 7.7 4.9 5.8 3.9 6.6 3.9 5.6 3.4Total absorption 3.0 2.4 2.7 3.1 2.8 5.4 5.4 5.5 6.0 4.6 7.7 5.0 5.8 3.8 6.6 3.8 5.6 3.6
Average annual agricultural labor force migration (1000 persons), 2000–2010Agricultural labor
migration35 75 42 5 5 124 45 0 0 13 4774 1536 2729 446 1233 1164 1716 13942
Labor composition (%), 2000Agricultural labor 2.2 4.6 4.4 5.4 2.6 21.8 11.2 0.2 0.7 8.7 67.8 52.7 61.1 22.3 30.3 65.7 27.6 45.8Unskilled labor 64.2 66.0 78.1 60.1 58.5 66.8 78.1 74.4 78.9 76.5 24.3 41.4 34.7 68.1 56.6 30.1 55.8 42.9Skilled labor 33.6 29.5 17.6 34.5 39.0 11.4 10.7 25.4 20.5 14.8 7.9 5.8 4.1 9.6 13.1 4.2 16.6 11.3
Labor composition (%), 2010Agricultural labor 2.0 4.2 3.7 5.0 2.3 19.1 9.5 0.3 0.7 7.4 61.8 46.5 57.0 19.3 20.8 61.7 23.4 42.2Unskilled labor 55.7 53.2 72.3 35.2 34.8 69.5 79.9 75.0 69.5 72.0 28.4 45.2 38.8 71.1 61.2 32.5 51.7 43.5Skilled labor 42.3 42.7 24.0 59.9 63.0 11.4 10.7 24.8 29.9 20.6 9.8 8.3 4.1 9.6 18.1 5.8 24.9 14.4
Gross investment as % of real GDP2000 19.8 18.8 24.7 21.9 18.8 22.9 29.3 45.1 29.2 23.8 37.3 32.0 22.7 18.8 21.4 14.9 20.22010 22.6 20.7 25.2 21.2 20.2 38.2 29.9 45.1 32.4 21.6 37.3 32.0 22.7 18.8 21.4 14.9 20.2
Government spending as % of nominal GDP2000 16.2 18.8 9.5 17.7 17.9 9.3 8.7 10.5 7.8 12.4 12.1 9.7 11.0 17.0 21.3 10.3 11.72010 14.5 16.8 8.9 16.6 16.8 7.7 7.1 10.5 9.2 11.1 12.9 9.7 11.0 17.0 21.3 10.3 11.7
Balance of trade as % of nominal GDP2000 −3.0 1.2 2.9 −1.7 2.7 0.4 4.8 11.8 3.1 1.7 1.9 6.2 −1.3 −1.1 −0.4 −5.1 −2.12010 −2.4 2.2 1.0 0.1 2.8 −4.2 0.5 8.2 −3.1 1.8 0.8 7.7 −1.3 −1.3 −0.4 −5.1 −1.9
a Data in bold face are based on forecast by Oxford macro economic model and set exogenously during the calibration (Oxford Economic Forecasting, 1999). Economy-wide TFP growth is a weighted average (Dormarweights) of sector level TFP growth generated by the model endogenously.

8 Z. Wang / Journal of Policy Modeling 25 (2003) 1–41
rate under assumptions on the three major macro economic variables (gross invest-ment, government spending, and balance of trade) in the model. It incorporates theimpact of the recent Asian financial crisis by imposing actual negative GDP growthduring 1998–1999 and current account surplus of the affected regions. All the threemacro-variables from 2000 to 2010 are specified as percentages of GDP and arebased on forecasts by the Oxford model. China’s imports of wheat and plant-basedfiber and Taiwan’s imports of rice are subject to quota control with a 3% annualgrowth rate. Those quotas are also assumed to be binding and a NTB rate adjustedendogenously to clear the market.3 Because China and Taiwan are excluded fromthe WTO under this scenario, their exports in textile and clothing are subjectedto a constant growth in MFA quotas and the quantity restriction continues after2005. All other MFA quota restricted regions are subjected to accelerate quotagrowth and the termination of the quota system in 2005. The base quota growthrates are calculated from bilateral data provided by the International Textiles andClothing Bureau in Geneva. The accelerated annual quota growth rate is 25% forWTO members during 1998 to 2001, then an additional 27% is applied to the last3 years of ATC implementation.
In Scenario II (the Accession Case), all the macro economic assumptions andexogenous growth factors are the same as in Scenario I, but with both China andTaiwan joining the global trade liberalization process. The extent of China’s tariffreduction is aggregated from the Harmonized Commodity Description and CodingSystem (HS) tariff schedules at six-digit level based on the US–China agreement(November 1999) and weighted by 1998 import data from China’s Customs. Theimport quotas for wheat and plant fiber is assumed to grow at a 5% annual rateand will be eliminated at the year 2005, and replaced by a 15% uniform tariff.Taiwan’s tariff reduction is based on Taiwan’s official WTO offer provided by itscouncil of Agriculture. It is also aggregated from the six-digit HS tariff schedulesand weighted by Taiwan’s import data during 1997–2000 from the World TradeAtlas. All non-tariff barriers of manufacturing products in both China and Taiwanare reduced by 20% each year from 2001 and set to 0% in 2005, while non-tariffbarriers of agricultural commodities are reduced 10% a year and eliminated to zeroin 2010. A 50% cut in protection on traded service is also implemented to representthe opening of major service sectors in China’s WTO offer. The base year servicesector protection rate in China was adopted fromHoekman (1995). Both China’sand Taiwan’s tariff rates for all sectors each year in the simulation period andChina and Taiwan’s initial NTB rates are listed inTable 2a and b. Because Chinaand Taiwan become WTO members under this scenario, their exports of textileand apparel are subjected to the same treatment as other developing countries.
It is well known that China’s tariff collection is significantly below its normaltariff level because of a large volume of processed trade and extensive import duty
3 Martin (2001)used China’s average historical import levels from 1961 to 1997 as a guide, pointedout wheat imports would be subject to import quotas relatively frequently, maize imports less frequently,and rice imports very infrequently.
Z.W
ang/Journal
ofPolicy
Modeling
25(2003)
1–419
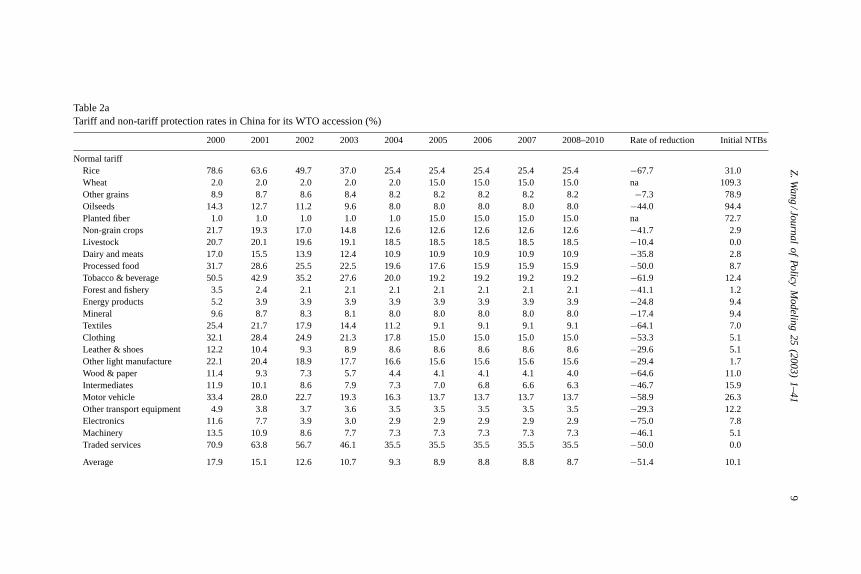
Table 2aTariff and non-tariff protection rates in China for its WTO accession (%)
2000 2001 2002 2003 2004 2005 2006 2007 2008–2010 Rate of reduction Initial NTBs
Normal tariffRice 78.6 63.6 49.7 37.0 25.4 25.4 25.4 25.4 25.4 −67.7 31.0Wheat 2.0 2.0 2.0 2.0 2.0 15.0 15.0 15.0 15.0 na 109.3Other grains 8.9 8.7 8.6 8.4 8.2 8.2 8.2 8.2 8.2 −7.3 78.9Oilseeds 14.3 12.7 11.2 9.6 8.0 8.0 8.0 8.0 8.0 −44.0 94.4Planted fiber 1.0 1.0 1.0 1.0 1.0 15.0 15.0 15.0 15.0 na 72.7Non-grain crops 21.7 19.3 17.0 14.8 12.6 12.6 12.6 12.6 12.6 −41.7 2.9Livestock 20.7 20.1 19.6 19.1 18.5 18.5 18.5 18.5 18.5 −10.4 0.0Dairy and meats 17.0 15.5 13.9 12.4 10.9 10.9 10.9 10.9 10.9 −35.8 2.8Processed food 31.7 28.6 25.5 22.5 19.6 17.6 15.9 15.9 15.9 −50.0 8.7Tobacco & beverage 50.5 42.9 35.2 27.6 20.0 19.2 19.2 19.2 19.2 −61.9 12.4Forest and fishery 3.5 2.4 2.1 2.1 2.1 2.1 2.1 2.1 2.1 −41.1 1.2Energy products 5.2 3.9 3.9 3.9 3.9 3.9 3.9 3.9 3.9 −24.8 9.4Mineral 9.6 8.7 8.3 8.1 8.0 8.0 8.0 8.0 8.0 −17.4 9.4Textiles 25.4 21.7 17.9 14.4 11.2 9.1 9.1 9.1 9.1 −64.1 7.0Clothing 32.1 28.4 24.9 21.3 17.8 15.0 15.0 15.0 15.0 −53.3 5.1Leather & shoes 12.2 10.4 9.3 8.9 8.6 8.6 8.6 8.6 8.6 −29.6 5.1Other light manufacture 22.1 20.4 18.9 17.7 16.6 15.6 15.6 15.6 15.6 −29.4 1.7Wood & paper 11.4 9.3 7.3 5.7 4.4 4.1 4.1 4.1 4.0 −64.6 11.0Intermediates 11.9 10.1 8.6 7.9 7.3 7.0 6.8 6.6 6.3 −46.7 15.9Motor vehicle 33.4 28.0 22.7 19.3 16.3 13.7 13.7 13.7 13.7 −58.9 26.3Other transport equipment 4.9 3.8 3.7 3.6 3.5 3.5 3.5 3.5 3.5 −29.3 12.2Electronics 11.6 7.7 3.9 3.0 2.9 2.9 2.9 2.9 2.9 −75.0 7.8Machinery 13.5 10.9 8.6 7.7 7.3 7.3 7.3 7.3 7.3 −46.1 5.1Traded services 70.9 63.8 56.7 46.1 35.5 35.5 35.5 35.5 35.5 −50.0 0.0
Average 17.9 15.1 12.6 10.7 9.3 8.9 8.8 8.8 8.7 −51.4 10.1

10Z
.Wang
/Journalof
PolicyM
odeling25
(2003)1–41
Table 2a (Continued )
2000 2001 2002 2003 2004 2005 2006 2007 2008–2010 Rate of reduction Initial NTBs
Tariff after taking processing trade and duty exemption into accountRice 72.4 58.6 45.8 34.0 23.4 23.4 23.4 23.4 23.4 −67.7 31.0Wheat 1.6 1.5 1.5 1.5 1.5 11.1 11.1 11.1 11.1 na 89.7Other grains 5.9 5.8 5.7 5.6 5.5 5.5 5.5 5.5 5.5 −7.3 78.9Oilseeds 11.8 10.5 9.2 7.9 6.6 6.6 6.6 6.6 6.6 −44.0 94.3Planted fiber 0.9 0.1 0.1 0.1 0.1 1.6 1.6 1.6 1.6 na 6.9Non-grain crops 14.6 13.0 11.4 10.0 8.5 8.5 8.5 8.5 8.5 −41.7 2.9Livestock 7.2 7.0 6.8 6.7 6.5 6.5 6.5 6.5 6.5 −10.4 0.0Dairy and meats 11.1 10.1 9.1 8.1 7.1 7.1 7.1 7.1 7.1 −35.8 2.8Processed food 20.6 18.6 16.6 14.6 12.7 11.5 10.3 10.3 10.3 −50.0 8.5Tobacco & beverage 25.7 21.8 17.9 14.0 10.1 9.8 9.8 9.8 9.8 −61.9 12.4Forest and fishery 2.5 1.7 1.6 1.5 1.5 1.5 1.5 1.5 1.5 −41.1 1.2Energy products 3.8 2.9 2.9 2.9 2.9 2.9 2.9 2.9 2.9 −24.8 9.4Mineral 4.2 3.8 3.6 3.5 3.5 3.4 3.4 3.4 3.4 −17.4 9.4Textiles 0.9 0.8 0.6 0.5 0.4 0.3 0.3 0.3 0.3 −64.1 7.0Clothing 0.6 0.5 0.5 0.4 0.3 0.3 0.3 0.3 0.3 −53.3 5.1Leather & shoes 0.2 0.2 0.2 0.2 0.1 0.1 0.1 0.1 0.1 −29.5 5.1Other light manufacture 1.6 1.5 1.4 1.3 1.2 1.1 1.1 1.1 1.1 −29.4 1.7Wood & paper 4.6 3.7 2.9 2.3 1.8 1.7 1.6 1.6 1.6 −64.6 11.0Intermediates 3.7 3.2 2.7 2.5 2.3 2.2 2.1 2.1 2.0 −46.7 15.9Motor vehicle 25.0 21.0 17.0 14.5 12.2 10.3 10.3 10.3 10.3 −58.9 26.3Other transport equipment 4.2 3.3 3.2 3.1 3.0 3.0 3.0 3.0 3.0 −29.3 12.2Electronics 3.3 2.2 1.1 0.8 0.8 0.8 0.8 0.8 0.8 −75.0 7.8Machinery 4.0 3.2 2.5 2.2 2.1 2.1 2.1 2.1 2.1 −46.1 5.1Traded services 71.0 63.9 56.8 46.2 35.5 35.5 35.5 35.5 35.5 −50.0 0.0
Average 8.0 6.9 5.9 5.0 4.2 4.1 4.1 4.1 4.0 −49.6 9.6
Data source: China’s tariff cut is aggregated by the author from six-digit Harmonized Commodity Description and Coding System (HS) tariff schedulesbased on US–China agreement(November 1999) and weighted by 1998 import data from China’s Customs. The tariff rate for wheat and plant based fiber are in quota rate. China’s non-tariff barrier (NTB) is the differencebetween import protection rate in version five GTAP database and China’s tariff after adjustment for duty exemptions. Industrial products are modified on additional information fromZhang,Zhang, and Wan (1998)andLi, Wang, Zhai, and Xu (1998). Detailed data on processing trade and duty exemption are kindly provided by Dr. Shunli Yao based on the China trade databasemaintained at the University of California — Davis (Yao & Feenstra, 1999). The base year service sector protection rate was adopted fromHoekman (1995)and they are tariff equivalent ofnon-tariff barriers.

Z.W
ang/Journal
ofPolicy
Modeling
25(2003)
1–4111
Table 2bTariff rates in Taiwan for its WTO accession (%)
2000 2001 2002 2003 2004 2005 2006 2007 2008 2009 2010 Rate of reduction Initial NTBs
Rice 0.0 0.0 0.0 0.0 0.0 0.0 0.0 0.0 0.0 0.0 0.0 na 2.4Wheat 7.0 7.0 7.0 7.0 7.0 7.0 7.0 7.0 7.0 7.0 7.0 0.0 0.0Other grains 0.2 0.2 0.2 0.1 0.1 0.1 0.1 0.1 0.1 0.1 0.1−71.4 0.8Oilseeds 0.4 0.4 0.0 0.0 0.0 0.0 0.0 0.0 0.0 0.0 0.0−98.3 1.9Planted fiber 0.0 0.0 0.0 0.0 0.0 0.0 0.0 0.0 0.0 0.0 0.0 na 0.5Non-grain crops 17.5 14.7 11.8 11.5 11.2 11.0 10.8 10.8 10.8 10.8 10.8−38.0 10.2Livestock 1.5 1.6 1.7 1.4 1.4 1.4 1.4 1.4 1.4 1.4 1.4 −8.3 0.0Dairy and meats 5.2 4.9 4.7 4.5 4.4 4.4 4.3 4.3 4.3 4.3 4.3−16.8 7.6Processed food 13.7 12.9 12.1 11.7 11.5 11.3 11.2 11.2 11.2 11.2 11.2−18.3 4.6Tobacco & beverage 19.3 17.3 15.4 15.4 15.4 15.3 15.3 15.3 15.3 15.3 15.3−20.7 30.1
Forest and fishery 9.4 8.8 8.2 8.0 7.8 7.7 7.6 7.6 7.6 7.6 7.6−18.3 9.7Energy products 2.9 2.7 2.6 2.5 2.5 2.4 2.4 2.4 2.4 2.4 2.4−15.5 2.8Mineral 5.4 5.0 4.6 4.5 4.4 4.3 4.3 4.3 4.3 4.3 4.3 −21.7 0.8Textiles 6.8 6.5 6.2 6.2 6.1 6.1 6.1 6.1 6.1 6.1 6.1−10.6 0.8Clothing 12.9 12.2 11.4 11.3 11.3 11.3 11.3 11.3 11.3 11.3 11.3−13.0 0.3Leather & shoes 4.8 4.7 4.5 4.4 4.3 4.2 4.2 4.2 4.2 4.2 4.2−13.2 0.6Other light manufacture 3.7 3.0 2.3 2.2 2.2 2.1 2.1 2.1 2.1 2.1 2.1−43.7 1.1Wood & paper 3.0 1.9 0.7 0.7 0.7 0.7 0.7 0.7 0.7 0.7 0.7−76.8 1.1Intermediates 3.4 2.9 2.3 2.1 1.9 1.9 1.9 1.9 1.9 1.9 1.9−45.5 0.7Motor vehicle 38.4 35.4 32.4 29.7 27.1 24.7 22.3 20.5 18.7 16.9 15.2−60.2 0.0Other transport equipment 1.4 1.4 1.3 1.3 1.2 1.2 1.2 1.2 1.2 1.2 1.2−15.5 0.8Electronics 2.6 1.6 0.5 0.5 0.5 0.5 0.5 0.5 0.5 0.5 0.5−81.1 0.6Machinery 4.7 3.9 3.1 3.1 3.0 3.0 3.0 3.0 3.0 3.0 3.0−35.8 0.2Traded services 0.0 0.0 0.0 0.0 0.0 0.0 0.0 0.0 0.0 0.0 0.0 na na
Average 4.7 3.9 3.3 3.1 3.0 2.9 2.8 2.8 2.7 2.7 2.6−43.9 1.2
Data source: Taiwan’s tariff cut is aggregated by the author from six-digit Harmonized Commodity Description and Coding System (HS) tariff schedules basedon Taiwan’s official WTO offer provided by Council for Agriculture, Taiwan and weighted by its import data from 1997 to 2000 from World Trade Atlas. The weightsof each year are 0.1, 0.2, 0.3, and 0.4, respectively. Taiwan’s non-tariff barrier (NTB) is the difference between import protection rate in version five GTAP database.

12 Z. Wang / Journal of Policy Modeling 25 (2003) 1–41
exemptions. By 1998, more than 50% of all imports in China were inputs usedin production of exports and exempted from tariff collections. It implies that theChinese economy is more open than it seems and the exiting import restriction hasbeen largely lifted prior to China’s WTO accession. Several studies have shown thatwithout accounting the presence of duty exemptions in China’s trade regime leadsto serious overestimate on the impact of China’s WTO entry at both aggregateand sectoral levels (Ianchovichina, Martin, & Fukase, 2000; Lejour, 2000). Byusing 1998 China’s Custom Statistics, I incorporated China’s processing trade andduty exemption pattern by sectors and by import sources into simulation design,which scale down the tariff level by routine specific information. The tariff ratesin the lower panel ofTable 2aare the tariff level that take duty exemption intoconsideration, which are substantially lower than normal tariff (listed in the uppanel ofTable 2a) and is much closer to China’s actual tariff collect rate at theaggregate level.
For each of the two scenarios, the CGE model generates results regarding theeffects on social welfare, terms of trade, the volume of trade, output, consumption,the real wages paid to each factor, and changes in prices and resource allocation.The differences in results generated by the two simulation scenarios provide es-timates of the impact of China’s and Taiwan’s accession to the WTO. However,those estimates should be regarded as outcomes from conditional projections ratherthan as forecasts. In reality, actual trade and output patterns are affected by manymore factors than just trade liberalization, such as domestic macroeconomic andincome policy changes.
4. Simulation results
4.1. Basic economic forces shaping results
Trade theory suggested that world trade patterns are determined by the rela-tive costs in delivering commodities by trading nations. Although many factors,such as distance, technical efficiency, prices of intermediate inputs, etc., may in-fluence such costs, the relative scarcity of factor endowments is the most basicdeterminant.4 A country tends to export commodities that require relatively
4 Trade theories generally identify two types of international trade. Among developed industrialcountries with similar endowments and technology, intra-industry trade is more common. Whereasbetween developed and developing economies with different factor endowments and stages of tech-nology development, trade is usually on an inter-industry basis. In my model, all trade data refer totrade with economies outside that region. Trade flows within the region were netted out and treatedas another source of domestic demand when the model database was constructed. The nature of thebase year trade data, the wide range in factor endowment and stages of economic development of themodeled regions, suggest that perhaps the traditional Heckscher–Ohlin arguments (based on differentfactor endowment) may explain the trade pattern among them to a large extent as demonstrated by thebase year trade data.
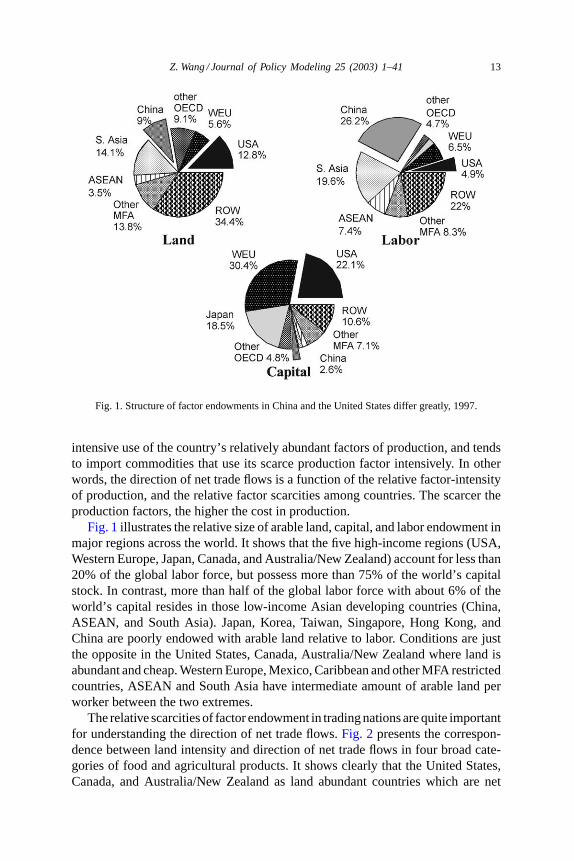
Z. Wang / Journal of Policy Modeling 25 (2003) 1–41 13
Fig. 1. Structure of factor endowments in China and the United States differ greatly, 1997.
intensive use of the country’s relatively abundant factors of production, and tendsto import commodities that use its scarce production factor intensively. In otherwords, the direction of net trade flows is a function of the relative factor-intensityof production, and the relative factor scarcities among countries. The scarcer theproduction factors, the higher the cost in production.
Fig. 1illustrates the relative size of arable land, capital, and labor endowment inmajor regions across the world. It shows that the five high-income regions (USA,Western Europe, Japan, Canada, and Australia/New Zealand) account for less than20% of the global labor force, but possess more than 75% of the world’s capitalstock. In contrast, more than half of the global labor force with about 6% of theworld’s capital resides in those low-income Asian developing countries (China,ASEAN, and South Asia). Japan, Korea, Taiwan, Singapore, Hong Kong, andChina are poorly endowed with arable land relative to labor. Conditions are justthe opposite in the United States, Canada, Australia/New Zealand where land isabundant and cheap. Western Europe, Mexico, Caribbean and other MFA restrictedcountries, ASEAN and South Asia have intermediate amount of arable land perworker between the two extremes.
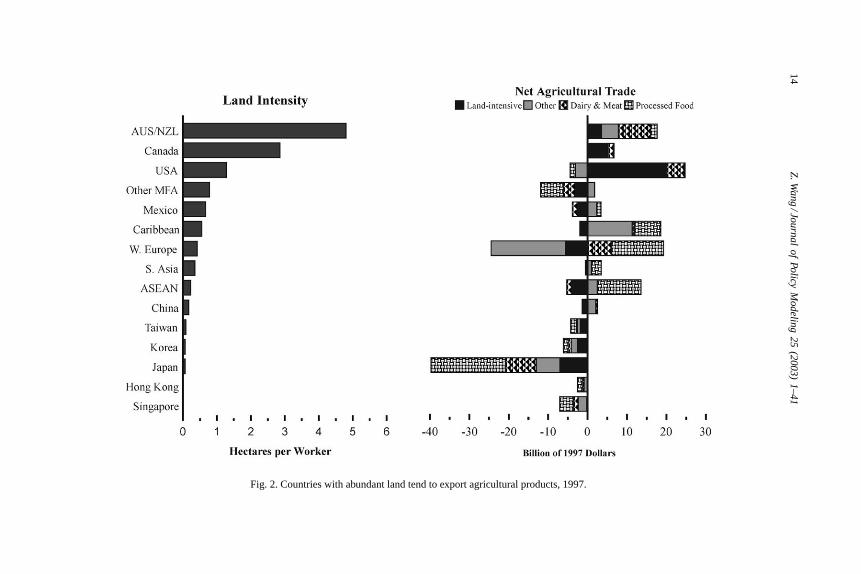
The relative scarcities of factor endowment in trading nations are quite importantfor understanding the direction of net trade flows.Fig. 2 presents the correspon-dence between land intensity and direction of net trade flows in four broad cate-gories of food and agricultural products. It shows clearly that the United States,Canada, and Australia/New Zealand as land abundant countries which are net
14Z
.Wang
/Journalof
PolicyM
odeling25
(2003)1–41
Fig. 2. Countries with abundant land tend to export agricultural products, 1997.

Z. Wang / Journal of Policy Modeling 25 (2003) 1–41 15
exporters in almost all food and agricultural products, especially those land-intensive products such as grains, cotton and oilseeds. It also shows that Japan,Korea, Singapore, Hong Kong, and Taiwan as land scarce economies which are netimporters of all food and agricultural products. Western Europe, Mexico and otherLatin American MFA restricted countries, ASEAN and South Asia with intermedi-ate land endowments, are net exporters and net importers of different agriculturalproducts. The European countries are net exporters of meat and milk products,and processed food, but net importers of land-intensive products. ASEAN, SouthAsia and other MFA restricted countries are net exporters of non-grain crops, andprocess food, which is often labor-intensive, but net importers of land-intensiveagricultural products.
China also seems consistent with this pattern as its market forces play a moreand more important role in determining production and trade driven by its mar-ket oriented economic reform. As a land scarce economy, it is a net importerof land-intensive agricultural products, but a net exporter of labor-intensive agri-cultural commodities such as non-grain crops. The on-going domestic economicreform and trade liberalization as China implements its WTO commitment, willreinforce market forces and push China’s agricultural production and trade furtheraway from its current grain self-sufficiency policy in the years to come.
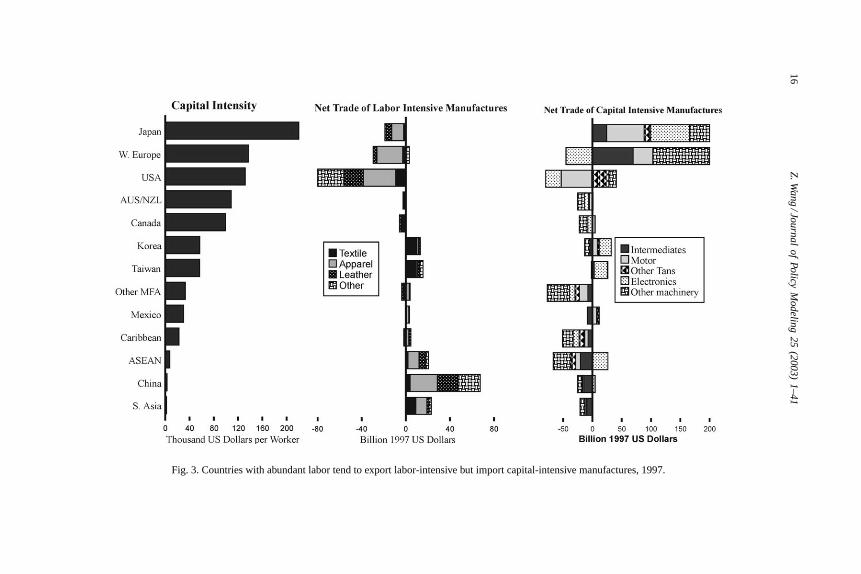
Fig. 3 presents the correspondence between capital intensity and directionof net trade flows for different kinds of manufactured goods. They show that,labor-intensive manufactured goods (textile, apparel, shoes, and other light manu-factures) are the major net imports for Japan, West Europe, and the United States,while capital and skill-intensive manufactures (manufactured intermediates, motorvehicles, machinery and other transport equipment) are their major net exports.The trade patterns of labor abundant MFA restricted developing countries suchas China, ASEAN, and South Asia are quite similar. They are net exporters oflabor-intensive manufactured goods and net importers of capital-intensive man-ufactured goods. At an intermediate level of capital intensity, Taiwan and othernewly industrialized economies such as Korea and Singapore are net suppliers andnet demanders of different skill/capital-intensive manufactured goods, while re-maining net exporters of labor-intensive manufactured goods. However, upstreamproducts such as textiles are a major portion of their net exports of such products,with more labor-intensive exports such as apparel play less and less role as theyfurther shift such production to China and other developing countries. This trendwill become more obvious in simulation results reported later.
Numerous studies (Gereffi, 1998) noticed the important role that Asian NIEshave played in the system of global division of labor along a world commodity pro-duction chain that spans many economies, with each economy performing certaintasks in which it has a comparative advantage. The developed countries usuallyprovide high-technology software and hardware for the NIEs because of their sup-per R&D capabilities. In turn, the NIEs provide intermediates and capital goods fortheir directly invested firms in a developing country because of their manufacturingtechnology and management expertise, while developing countries produce and
16Z
.Wang
/Journalof
PolicyM
odeling25
(2003)1–41
Fig. 3. Countries with abundant labor tend to export labor-intensive but import capital-intensive manufactures, 1997.

Z. Wang / Journal of Policy Modeling 25 (2003) 1–41 17
export finished goods such as apparel or electronic products to developed countriesbecause their cheap labor and raw materials.
Obviously, industrial countries such as the United States and China are gen-erally not competing economically for international trade at their current stageof development because their comparative advantages differ greatly.Their dif-ferent factor endowment structures and difference in technology developmentmake their trade complementary. Other developing countries compete with eachother and with China for exporting labor-intensive goods and electronic prod-ucts in industrial countries, and to attract FDI from those countries. Similarly,Japan, Western Europe, and the United States compete to meet the demand fortechnology/capital-intensive goods markets in China and other developing coun-tries, and to benefit from investment opportunities there.
The structure of factor endowments in China, Taiwan and their major trad-ing partners as well as their position in the system of the world division of laboris also the basic economic force shaping the direction of impact of China’s andTaiwan’s WTO entry on the world production and trade. Joining the WTO, espe-cially when industrial countries eliminate restrictions on imports of labor-intensivemanufactures such as textile and apparel from China, would further realize China’scomparative advantage in producing such goods and increase its net exports.The expansion of labor-intensive manufactures in China would cause resourcesto be bid away from farming and drive up demand for agricultural and capital/technology-intensive goods. This would increase China’s net agricultural andcapital/technology-intensive imports and push up world market prices for suchproducts. The opposite impact would occur to most developed economies be-cause of their different endowment structures. Developing countries whose en-dowment structures are similar to China’s will encounter keener competition inworld labor-intensive goods markets and face lower prices for their exports.
The impact of China’s and Taiwan’s WTO accession is also affected by China’sand Taiwan’s current import protection structure and the structure of tariff cut intheir WTO offers (which is listed inTable 2a and b, respectively). The larger theinitial distortion, the deeper the tariff cuts in the offers, the greater the inducedimpact. However, the relative factor scarcity and intensity in production discussedabove are the more fundamental force driving the impact and its resulted adjustmentpattern in the world economy. Production resources will be released from thosepreviously highly protected industries in China and Taiwan, and draw into sectorswhere China and Taiwan have comparative advantages, thus enabling them tobecome a more efficient supplier in world manufacture goods market.
4.2. Impact on world net trade patterns
Fig. 4shows the time path of net trade flows in agricultural, labor-intensive andcapital-intensive products for China during the simulation period under the twoscenarios. Even excluded from the WTO, China’s net exports of labor-intensiveproducts and net import of food and agricultural products will continue to increase
18 Z. Wang / Journal of Policy Modeling 25 (2003) 1–41
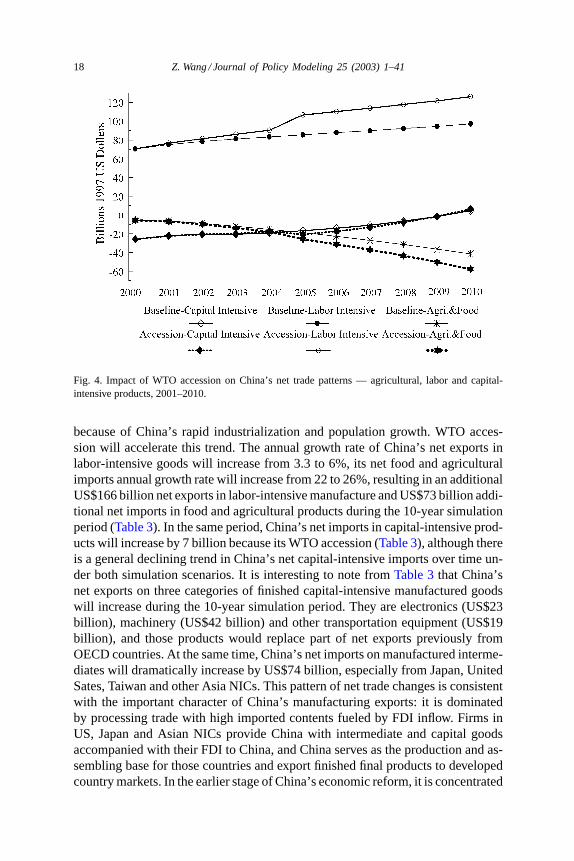
Fig. 4. Impact of WTO accession on China’s net trade patterns — agricultural, labor and capital-intensive products, 2001–2010.
because of China’s rapid industrialization and population growth. WTO acces-sion will accelerate this trend. The annual growth rate of China’s net exports inlabor-intensive goods will increase from 3.3 to 6%, its net food and agriculturalimports annual growth rate will increase from 22 to 26%, resulting in an additionalUS$166 billion net exports in labor-intensive manufacture and US$73 billion addi-tional net imports in food and agricultural products during the 10-year simulationperiod (Table 3). In the same period, China’s net imports in capital-intensive prod-ucts will increase by 7 billion because its WTO accession (Table 3), although thereis a general declining trend in China’s net capital-intensive imports over time un-der both simulation scenarios. It is interesting to note fromTable 3that China’snet exports on three categories of finished capital-intensive manufactured goodswill increase during the 10-year simulation period. They are electronics (US$23billion), machinery (US$42 billion) and other transportation equipment (US$19billion), and those products would replace part of net exports previously fromOECD countries. At the same time, China’s net imports on manufactured interme-diates will dramatically increase by US$74 billion, especially from Japan, UnitedSates, Taiwan and other Asia NICs. This pattern of net trade changes is consistentwith the important character of China’s manufacturing exports: it is dominatedby processing trade with high imported contents fueled by FDI inflow. Firms inUS, Japan and Asian NICs provide China with intermediate and capital goodsaccompanied with their FDI to China, and China serves as the production and as-sembling base for those countries and export finished final products to developedcountry markets. In the earlier stage of China’s economic reform, it is concentrated

Z.W
ang/Journal
ofPolicy
Modeling
25(2003)
1–4119
Table 3Differences between a WTO with and without China: accumulated sectoral net trade by region during 2001–2010 (billion US dollars)
UnitedStates
WesternEurope
Japan Australia &New Zealand
Canada Mexico Korea Singapore HongKong
Taiwan China ASEAN SouthAsia
Latin AmericaMFA
Mid-East &Africa MFA
Low incomeAfrica
Rest ofthe world
Rice −0.3 0.0 −0.2 −0.1 0.0 0.0 0.0 0.0 0.0 0.0 −2.3 2.8 0.3 0.0 0.0 0.0 0.0Wheat 1.7 −0.2 −0.2 1.8 11.1 0.0 −0.1 0.0 0.0 0.0 −14.8 −0.2 0.5 0.1 0.0 0.0 0.2Other grains −0.4 0.0 −0.1 5.3 2.4 0.1 0.3 0.0 0.0 0.1 −7.3 −0.1 0.0 0.0 0.1 0.0 −0.3Oilseeds 13.6 −0.2 −0.2 −0.1 −0.7 −0.1 0.0 0.0 0.0 0.1 −16.7 0.0 0.1 3.9 0.0 0.0 0.3Planted fiber 5.9 0.2 −0.1 0.7 0.0 0.2 −0.1 0.0 0.0 −0.2 −11.6 0.2 0.7 0.3 0.2 1.1 2.3Non-grain crops −0.4 −0.8 −0.3 −0.6 −1.3 0.3 −0.2 −0.1 0.0 −1.3 −0.1 0.0 1.8 1.7 0.2 −0.3 1.6
Sub-total 20.2 −1.1 −1.0 7.0 11.4 0.5 −0.2 −0.2 0.0 −1.3 −52.8 2.7 3.5 6.0 0.5 0.8 4.0
Livestock −0.6 −0.6 −0.1 −2.2 −1.0 0.1 −0.1 0.0 0.0 0.3 3.7 0.0 0.3 0.0 0.1 0.0 0.1Dairy and meats 0.9 0.5 −0.3 −0.8 −0.5 0.1 0.0 0.1 0.0 −0.5 −0.8 0.2 0.2 0.4 0.2 0.0 0.5Processed food 2.6 6.7 −1.1 −0.2 0.8 0.1 −0.2 1.6 0.6 −1.0 −12.4 −0.2 1.9 0.8 0.1 −0.1 0.2Tobacco & beverages 3.9 9.6 0.8−0.1 −0.1 0.2 −0.1 0.2 0.8 −5.8 −10.3 0.2 0.1 0.3 0.1 0.0 0.4
Sub-total 6.8 16.1 −0.7 −3.3 −0.8 0.4 −0.4 1.9 1.3 −7.0 −19.8 0.2 2.5 1.5 0.4 −0.2 1.1
Forest and fishery 0.2 0.2 0.3 0.6 0.0 0.0 0.0 0.0 −0.1 −0.4 −1.1 −0.3 0.4 0.1 0.0 −0.1 0.1Energy products −0.5 0.4 −0.8 −0.6 −0.2 0.6 −0.3 3.5 −0.1 −2.0 −11.4 1.6 2.3 0.7 4.1 0.1 2.4Mineral products −0.3 −1.0 −0.8 0.1 −0.4 0.2 −0.3 −0.2 0.1 −0.6 0.3 0.7 1.9 0.9 −0.1 −0.1 −0.1Wood & paper 1.9 0.2 0.5−0.1 −0.8 0.4 1.3 −0.3 1.3 −0.5 −11.1 4.3 0.6 0.8 0.2 0.0 1.3
Sub-total 1.3 −0.4 −0.8 0.0 −1.4 1.1 0.7 3.1 1.3 −3.4 −23.3 6.3 5.2 2.5 4.1 −0.1 3.8
Textiles 1.8 −4.2 6.7 0.1 0.6 −0.5 5.5 −0.1 6.5 10.5 −35.0 3.3 2.5 0.2 0.5 −0.1 1.7Clothing −6.4 −10.9 −4.2 −0.4 −1.0 −4.8 −3.3 −0.3 −11.4 −2.1 160.8 −20.1 −36.8 −21.1 −10.4 −0.3 −27.4Leather & shoes −1.0 −8.1 −0.5 −0.2 0.1 −0.4 0.1 −0.2 −0.1 0.2 22.3 −7.0 0.6 −2.3 −0.4 −0.1 −3.1Other light manufacture −0.5 −8.9 −2.0 −0.2 −0.2 −0.3 −0.7 −0.2 0.2 −1.6 17.6 −1.0 1.8 −0.3 −2.7 −0.5 −0.6
Sub-total −6.1 −32.1 0.0 −0.6 −0.6 −6.0 1.5 −0.7 −4.8 7.0 165.7 −24.9 −31.9 −23.4 −12.9 −0.9 −29.3
Intermediates 7.0 0.6 17.7 0.3 −1.6 1.0 10.5 0.5 3.0 11.4 −73.7 7.4 5.5 2.4 1.4 0.0 6.8Motor vehicle 3.1 3.7 11.5−0.9 −0.6 3.6 −3.1 −0.2 −0.1 −8.5 −16.9 1.5 2.2 3.1 0.1 0.0 1.5Other transport equipment −9.3 −4.6 −4.8 −0.5 −1.3 0.0 −3.6 0.0 0.0 2.2 18.6 1.5 1.9 0.7 0.0 −0.1 −0.6Electronics −7.0 −6.5 −5.1 0.2 −1.3 −1.1 −3.9 −0.5 1.9 3.6 23.0 −4.1 0.8 0.6 0.0 0.1 −0.6Machinery −10.5 −17.0 −12.3 −0.7 −3.1 −0.8 −3.1 −1.4 0.6 0.0 41.7 2.3 2.8 1.7 0.2 0.4 −0.8
Sub-total −16.7 −23.8 7.0 −1.8 −7.9 2.7 −3.2 −1.6 5.4 8.8 −7.3 8.5 13.2 8.5 1.7 0.4 6.2
Traded services 6.0 15.0 −5.6 −1.4 −0.9 1.9 −3.5 −3.4 −3.7 −2.2 −27.8 5.1 7.0 4.5 3.0 −0.5 6.5Construction 0.0 −0.9 −0.9 0.0 0.0 0.0 0.0 0.0 0.0 0.0 1.6 0.1 0.1 0.2 0.0 0.0 0.1
Total 11.5 −27.2 −2.0 −0.1 −0.3 0.7 −5.2 −1.0 −0.7 1.9 36.2 −2.0 −0.4 −0.2 −3.2 −0.5 −7.5
20 Z. Wang / Journal of Policy Modeling 25 (2003) 1–41
in the labor-intensive sector and now is happening in the above mentioned threecategories of capital-intensive products.5
Where would those additional net labor-intensive exports from China go andwhere would those additional net imports in food and agricultural products byChina come from?Table 3shows that part of those increased labor-intensive ex-ports from China will go to markets in industrial countries, where import demandincreases because of the elimination of MFA quotas, while part of them are sub-stitutes of net exports originally from other MFA restricted developing countriesin Asia and Latin America (more than 70%).Table 3also shows that a large partof those increased net import of land-intensive agricultural products to China af-ter it joins the WTO will come from land abundant developed countries such asAustralia, Canada and the United States, but a significant portion (about a third)of them will come from other developing countries. The major underlying reasonis that China’s entry to the WTO diverts exports of labor-intensive products fromother developing countries to China. The labor-intensive sectors in those regionscannot attract as many production resources as they could when WTO excludesChina and Taiwan because of reduced profitability from lower world prices for theirmanufacturing exports. Therefore, more factors of production will remain in thosecountries’ agricultural sectors. At the same time, the increased agricultural importdemand from China and Taiwan pushes up world food prices, agricultural exportsbecome relatively profitable and agricultural imports become relative expensive. Itresults in an expansion of production and exports of agricultural products in thosecountries (remember most of those countries have an intermediate agricultural landendowment inFig. 2, i.e., they have a higher land/labor ratio than China). However,the increase of production in labor-intensive sectors in China also demands moremanufactured inputs from the world market, causing the manufacturing sector toexpand and agriculture production to decline in Japan, Korea and Taiwan, thusincreasing their net import demand for food and agricultural products, as shownin Table 3. Another underlying reason for this disparity other than relative scarcityof agricultural production factors in those countries is that they are in a higherstage of economic development and have the technology to produce what China’smanufacturing sector demands. Because of their lower stage of economic devel-opment, most developing countries do not have such capacity or are not able toproduce what China’s manufacture sector needs at a competitive cost.
Why do China’s net imports in capital-intensive products show a decliningtrend over time in both simulation scenarios (Fig. 4)? It indicates that exports insome capital-intensive products from China are rising and there is an industrialupgrade process going on as China continues to grow and industrialize. There arethree fundamental factors that contribute to this trend. First, there are quantitativeconstraints such as MFA quotas in developed countries’ markets that limit China’s
5 Based on China Custom Statistics, 93% of China’s electronic equipment exports was processexports in 1998, while the numbers for other machinery and other transport equipment were 71 and77%, respectively.

Z. Wang / Journal of Policy Modeling 25 (2003) 1–41 21
growth potential in producing labor-intensive products and cause China to divert itsproduction resources to other manufacturing activities, including capital-intensivesectors. Second, China was undergoing rapid investment growth and capital ac-cumulation during the last decade. During 1991–2000, China was the largest FDIrecipient among developing countries, with over US$320 billion FDI inflows. Thedirect impact is the booming of capital-intensive manufacturing industries. As tradetheory points out, an increase in the supply of capital will lead to an increase in theoutput of the sector which uses capital intensively, and a reduction in the output inother sectors that use other factors intensively (Rybczynski theorem). Finally, asmentioned earlier, China’s manufacturing exports usually contain very high importcontents with low value-added rates because the rapid growth of processing tradein recent years, which may exaggerate the extent of industrial upgrade in China’sexports.6
Joining the WTO cannot fundamentally change this trend, because China ulti-mately will upgrade its industrial structure during its modernization, as most newlyindustrialized countries are doing now. But as bothFig. 4andTable 3show, join-ing the WTO will increase China’s net imports in capital-intensive products aboutUS$7 billion over the 10-year simulation period. This is because the expansion oflabor-intensive sector will bid productive resources away from capital-intensiveproduction on the one hand, and increase domestic demand for such products onthe other hand, causing exports to decline and imports to increase.
4.3. Impact on trade flow adjustment between China, Taiwan and their majortrade partners
Since the late 1980s, adjustment of trade flow among East Asian countries andbetween East Asia and developed economies has reflected the reorganization ofvarious global commodity productions among these countries. The basic trend isintermediate and capital goods were exported from Asian newly industrializedeconomies to China, where Chinese workers processed those intermediate goodsinto finished products and exported them to the developed countries, especiallythe United States. At the same time, exports from East Asian newly industrializedeconomies to developed countries have been substituted by exports of their directinvestment firms in China and thus dramatically declined. As a result, for exam-ple, Taiwan’s trade with both the United States and China has radically shifted.7
Simulation results show that this redirection of trade flow will further accelerate
6 For example, the largest items of electronics exports in 1995 were radio cassette players andtelephone sets. They are produced from imported semi-processed materials and assembled by spareparts from abroad for re-exports. The portion of production process conducted in China was basicallylabor intensive in nature.
7 In 1986, Taiwan’s exports to the United States accounted for 48% of its total exports whileTaiwan’s exports to China accounted for only 2%. In 1999, Taiwan’s exports to the United Statesaccounted for 25% of its total exports while Taiwan’s exports to China accounted for 18%.
22 Z. Wang / Journal of Policy Modeling 25 (2003) 1–41
after both China and Taiwan enter the WTO. With the reduction of trade barriers,total exports increase significantly for both China and Taiwan during the 10-yearsimulation period as shown inFigs. 5 and 6. China and Taiwan trade more witheach other and the increased trade is almost totally concentrated in manufacturingsectors (US$18 billion labor-intensive and US$59 billion capital intensive). Sucha dramatic increase of trade flows in industrial product reflects that the interdepen-dence of manufacturing activities across Taiwan Strait is deepening at acceleratedspeed, firms on both sides are further integrated via input–output linkage. Most ofTaiwan’s export expansion to China are intermediate and capital goods demandedby Taiwanese FDI firms in China, which includes textiles (US$14.5 billion), man-ufacture intermediates (US$23.1 billion), electronics (US$9.9 billion), and othermachinery (US$5.1 billions). The relatively smaller increase of China’s export toTaiwan comes from Taiwan’s current highly restrictive import policy for goodsfrom China on which the model simulation is based, and there is no non-tariff bar-rier reduction across the Taiwan Strait is incorporated into the simulation design.However, even under current restrictive trade across the Strait, trade flows willincrease substantially after both China and Taiwan enters the WTO.
While increasing its exports to China dramatically, Taiwan reduces its labor-intensive exports to many of its trade partners. Nearly 90% of its increased exportsbecause WTO accession will go to China. This is because Taiwan as a newly in-dustrialized economy is upgrading its industrial structure and becoming a strongcompetitor in the world market for manufactured goods, especially in electronicproducts and high-end labor-intensive goods. Despite its manufacturing exportexpansion to China reduces its labor-intensive exports to other economies, it in-creases its exports of capital and technology-intensive goods, especially electronicproducts to rest of the world (its electronic exports increase US$18 billion, or morethan 12% over the baseline).
Interestingly, different from Taiwan,Fig. 6shows that when China increases itsexports to Taiwan, its exports in labor-intensive consumer goods and electronicsproducts to other countries do not decline but increase dramatically. Different fromTaiwan, there is no trade diversion in manufactured products for China, its exportsof manufactured products to other countries increase much rapidly than its sale toTaiwan. There are two factors contribute to this interesting trade pattern. First, theexpansion of imports of capital and intermediate goods from Taiwan enhances thecapacity of China to export manufactured goods. Second, the manufactured goodsfrom Taiwan to China usually contain a large portion of semi-processed productsand parts for assembling or further processing operations in China, then re-exportto industrial countries.8 The dramatic increase of such products imported fromTaiwan further boost China’s manufactured exports.
It is evident fromFigs. 5 and 6that WTO entry would increase the complemen-tary of manufacturing industries across the Taiwan Strait, allow the combination of
8 The processing trade (processing and assembling, processing with import materials) was 46.7%of China’s total exports in 1995, and more than a half of its exports (55.8%) in 1996.

Z.W
ang/Journal
ofPolicy
Modeling
25(2003)
1–4123
Fig. 5. Impact on trade flow adjustment: increase Taiwan’s exports of intermediates and capital goods to China, decrease of labor-intensive finished products to theUnited States, billion of 1997 US dollars, 2001–2010 accumulated.

24 Z. Wang / Journal of Policy Modeling 25 (2003) 1–41
Fig. 6. Impact on trade flow adjustment: increase China’s finished products to developed countries,intermediate and capital goods to developing countries, billions of 1997 dollars 2001–2010 accumu-lated.
Taiwan’s capital and know-how to efficient use of the huge reservoir of low-cost la-bor in China, making both China and Taiwan stronger competitors of manufacturedproducts in the world market. Therefore, there is also a simultaneous expansion ofcapital and technology-intensive exports from both China and Taiwan except formotor vehicle sector, especially for electronics, machinery, and other transporta-tion equipment. It indicates that WTO entry will facilitate the industrial upgradeprocess for both economies and enable them to become a stronger competitor inproducing relatively sophisticated manufactured products (such as computers andmotor bicycles) to meet the demand for low-end capital and technology-intensiveproducts from both developed and developing economies.
Another interesting phenomenon is the dramatic increase of manufactured ex-ports from China to the United Sates during the 10-year simulation period. Itsuggests that after China and Taiwan enter the WTO, US trade deficit with Chinamay increase. However, total US trade deficit may not change very much as shownin Table 4because of the reduction of U.S trade deficit with Taiwan and otherAsian countries due to China’s WTO accession. As China exports more finishedmanufactured products to the United Sates, it will import more intermediate andcapital inputs from Taiwan, Hong Kong, Korea, and Singapore, increasing its tradedeficit with those newly industrialized economies. Such an adjustment is a contin-uation of Taiwan, Hong Kong and Korea shifting their trade surplus with industrialcountries to China started from the late 1980s due to production relocation in East
Z.W
ang/Journal
ofPolicy
Modeling
25(2003)
1–4125
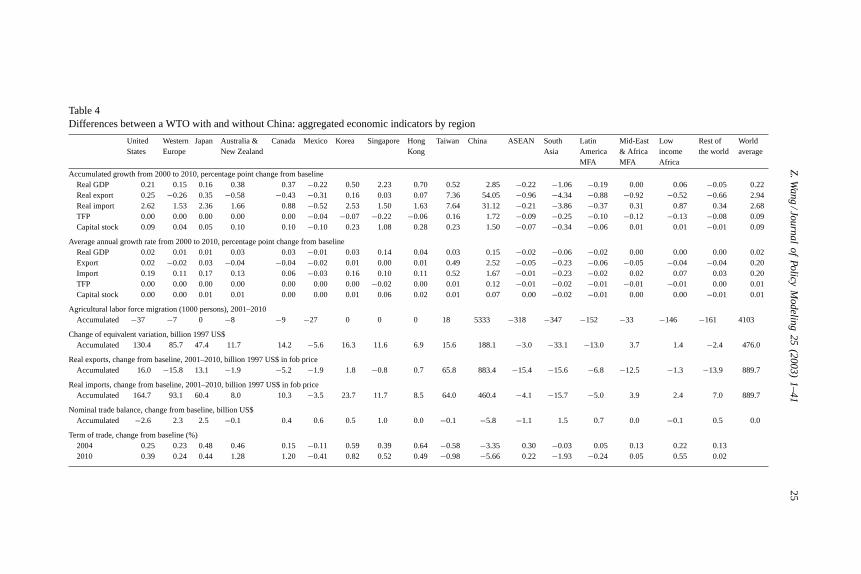
Table 4Differences between a WTO with and without China: aggregated economic indicators by region
UnitedStates
WesternEurope
Japan Australia &New Zealand
Canada Mexico Korea Singapore HongKong
Taiwan China ASEAN SouthAsia
LatinAmericaMFA
Mid-East& AfricaMFA
LowincomeAfrica
Rest ofthe world
Worldaverage
Accumulated growth from 2000 to 2010, percentage point change from baselineReal GDP 0.21 0.15 0.16 0.38 0.37−0.22 0.50 2.23 0.70 0.52 2.85 −0.22 −1.06 −0.19 0.00 0.06 −0.05 0.22Real export 0.25 −0.26 0.35 −0.58 −0.43 −0.31 0.16 0.03 0.07 7.36 54.05 −0.96 −4.34 −0.88 −0.92 −0.52 −0.66 2.94Real import 2.62 1.53 2.36 1.66 0.88 −0.52 2.53 1.50 1.63 7.64 31.12 −0.21 −3.86 −0.37 0.31 0.87 0.34 2.68TFP 0.00 0.00 0.00 0.00 0.00 −0.04 −0.07 −0.22 −0.06 0.16 1.72 −0.09 −0.25 −0.10 −0.12 −0.13 −0.08 0.09Capital stock 0.09 0.04 0.05 0.10 0.10−0.10 0.23 1.08 0.28 0.23 1.50 −0.07 −0.34 −0.06 0.01 0.01 −0.01 0.09
Average annual growth rate from 2000 to 2010, percentage point change from baselineReal GDP 0.02 0.01 0.01 0.03 0.03−0.01 0.03 0.14 0.04 0.03 0.15 −0.02 −0.06 −0.02 0.00 0.00 0.00 0.02Export 0.02 −0.02 0.03 −0.04 −0.04 −0.02 0.01 0.00 0.01 0.49 2.52 −0.05 −0.23 −0.06 −0.05 −0.04 −0.04 0.20Import 0.19 0.11 0.17 0.13 0.06 −0.03 0.16 0.10 0.11 0.52 1.67 −0.01 −0.23 −0.02 0.02 0.07 0.03 0.20TFP 0.00 0.00 0.00 0.00 0.00 0.00 0.00−0.02 0.00 0.01 0.12 −0.01 −0.02 −0.01 −0.01 −0.01 0.00 0.01Capital stock 0.00 0.00 0.01 0.01 0.00 0.00 0.01 0.06 0.02 0.01 0.07 0.00−0.02 −0.01 0.00 0.00 −0.01 0.01
Agricultural labor force migration (1000 persons), 2001–2010Accumulated −37 −7 0 −8 −9 −27 0 0 0 18 5333 −318 −347 −152 −33 −146 −161 4103
Change of equivalent variation, billion 1997 US$Accumulated 130.4 85.7 47.4 11.7 14.2 −5.6 16.3 11.6 6.9 15.6 188.1 −3.0 −33.1 −13.0 3.7 1.4 −2.4 476.0
Real exports, change from baseline, 2001–2010, billion 1997 US$ in fob priceAccumulated 16.0 −15.8 13.1 −1.9 −5.2 −1.9 1.8 −0.8 0.7 65.8 883.4 −15.4 −15.6 −6.8 −12.5 −1.3 −13.9 889.7
Real imports, change from baseline, 2001–2010, billion 1997 US$ in fob priceAccumulated 164.7 93.1 60.4 8.0 10.3 −3.5 23.7 11.7 8.5 64.0 460.4 −4.1 −15.7 −5.0 3.9 2.4 7.0 889.7
Nominal trade balance, change from baseline, billion US$Accumulated −2.6 2.3 2.5 −0.1 0.4 0.6 0.5 1.0 0.0 −0.1 −5.8 −1.1 1.5 0.7 0.0 −0.1 0.5 0.0
Term of trade, change from baseline (%)2004 0.25 0.23 0.48 0.46 0.15 −0.11 0.59 0.39 0.64 −0.58 −3.35 0.30 −0.03 0.05 0.13 0.22 0.132010 0.39 0.24 0.44 1.28 1.20 −0.41 0.82 0.52 0.49 −0.98 −5.66 0.22 −1.93 −0.24 0.05 0.55 0.02
26 Z. Wang / Journal of Policy Modeling 25 (2003) 1–41
Asia, driven by changing comparative advantages of each economy within theregion. The further increase in NIE’s exports of intermediate and capital goodsto China, the further increase in China’s exports of manufactured finished goodsto developed countries and low-end durable manufactured products to developingcountries, the further decline of NIE’s exports of labor-intensive finished goods todeveloped countries, and the further increase of NIE’s high technology productsimports from advanced industrial countries are all the results of such an adjustmentprocess. China and Taiwan’s WTO entry will further accelerate this process.
4.4. Aggregate and growth effects
The expansion of trade accelerates economic growth, increases real purchas-ing power for households.Table 4summarizes major aggregate economy-wideeffects between a WTO with and without China and Taiwan. Admitting China andTaiwan into the WTO will accelerate world economic growth, the average annualgrowth rate of world real GDP would be 0.02 percentage point higher and the totalaccumulated world GDP growth would be 0.22 percentage point higher in 2010than that in the baseline scenario. However, the strongest stimulus to economicgrowth occurs to China and Taiwan. China’s real GDP growth would increase by0.15 percentage point (0.03 percentage points for Taiwan) a year from 2001 to2010, and 2.9 percentage points higher (0.5 percentage points higher for Taiwan)in 2010 than the case if they were excluded from WTO. Real GDP growth inall developed countries and most developing countries also increases from Chinaand Taiwan’s WTO accession. Those increases may seem small in annual terms,however, they are notable if accumulated over the whole simulation period. By2010, real GDP would be 0.21% higher in the United States and 0.15% higher inWest Europe than in the case of a WTO without China and Taiwan. Newly Indus-trialized Economies such as Singapore, Hong Kong, and Korea that have a closertie with China and Taiwan will benefit more and grow faster because of China’sand Taiwan’s WTO accession. Certain developing countries that have a endow-ment and export structure similar to China’s, will be slightly negatively affected,especially those MFA quota restricted countries in ASEAN, South Asia and SouthAmerica.9 They have to divert resource from manufacture to food and agriculturalproducts because stronger Chinese competition would reduce their potential exportshare in the world market. This result, however, may be partially due to the highlyaggregate nature of textile and apparel sectors in the model. They are treated astwo commodities. In the real economy, there are thousands of types of textile andapparel products. Developing countries that produce and export different types orless substitutable textiles and apparels compared with China will be less effected.
9 Please note it does not mean that these countries’ growth rates will be lower than their currentactual growth rate, it only indicates economic growth in those countries will be lower than the situationexcluding China and Taiwan in the world trade liberalization process, in other words, those countriesgain less than the case excluding China.

Z. Wang / Journal of Policy Modeling 25 (2003) 1–41 27
Those gains to economic growth from China’s and Taiwan’s trade liberalizationare mainly generated from three sources that reinforce each other: (1) more effi-cient allocation of production factors through increased specialization accordingto each country’s comparative advantage, including the migration of additionalagricultural labor to manufacture activities, which increase labor productivity; (2)more rapid physical capital accumulation, so that there will be more physical capitalstock available in the economy; which compounds the efficiency gain; and (3) morerapid growth of TFP due to speeding technology transfer via expansion of capitaland intermediate goods imports from advanced industrial countries. The additionalcapital accumulation and TFP growth in each region due to China’s and Taiwan’sWTO accession are reported in the first half ofTable 4. Since both China and Taiwanadopt dramatic liberalization measures to meet the WTO entry requirement in thesimulation exercises, it is expected that they will subject to the largest impact fromall the above three sources and gain the most from their WTO membership. For in-stance, physical capital accumulation in China will be 1.5% higher in year 2010 and5.3 million additional agricultural laborers will become production workers in var-ious manufacturing sectors over the 2001–2010 period if China is admitted into theWTO.
As classical trade theory indicates, removing trade distortions leads to furtherrealization of each region’s comparative advantage, more efficient allocation ofproduction factors, and expansion of trade. This type of efficiency gain is drivenby each region’s comparative advantages, resulting in structural adjustment in eachregional economy and reshaping world net trade pattern. In addition, there will bea strong positive feedback between trade expansion and productivity growth. AsChina expands its labor-intensive exports to the world market after joining theWTO, Chinese firms will import more capital and technology-intensive goods asboth investment and intermediate inputs from industrial counties. Those goodsare usually embodied with advanced technology from other countries, thus stim-ulating productivity growth. The simulation results show that WTO membershipwill accelerate China’s TFP growth by about 0.12 percentage points a year, andcontribute significantly to the additional real GDP growth due to its entry to theWTO over the whole simulation period.
Households in China and its major trade partners would benefit from fur-ther realization of each region’s comparative advantage in a freer trade envi-ronment and faster economic growth. As shown in the second half ofTable 4andFig. 7, real purchase power measured by Hicksian equivalent variation risesin almost all regions across the world, about US$47 billion a year on averagefor the world as a whole over 2001–2010 period. Similar to other trade liber-alization exercises, the liberalizer — China and Taiwan, gain the most. How-ever, the rest of the world also gains substantially, especially industrial countries.For example, the US real purchasing power would increase more than US$130billion during the whole simulation period, and about US$24 billion annuallyafter 2010. Only MFA quota restricted developing counties in Asia, SouthAmerica and Mexico slightly lose because trade will be diverted away from those

28 Z. Wang / Journal of Policy Modeling 25 (2003) 1–41
Fig. 7. Measured as equivalent variation (EV), China is the biggest gainer, United States and rest ofthe world also gain — changes of EV between WTO with and without China and Taiwan.
countries to China after China’s WTO entry as discussed in the previous sec-tion.
Generally speaking, developed countries and newly industrialized economies inAsia would benefit relatively more than other developing countries from China’sWTO entry because of their factor endowment and stage of technology devel-opment are different from China’s. Favorable changes in international terms oftrade induced by integrating China into the world market are another fundamen-tal factor. As we discussed earlier, joining the WTO and obtaining the benefit ofphasing out the MFA will enable China to dramatically increase its productionand exports of labor-intensive products, thus intensifying competition in the worldmarket. This will in turn reduce export prices in developing countries and importprices in developed countries, the largest final market for such products. The ex-pansion of China’s production and trade in labor-intensive manufactures result inhigher demand for capital and skill-intensive manufactured goods, thus driving upthe world prices for such products, which are major exports from developed andnewly industrialized countries. Such a world price movement would improve in-ternational terms of trade for developed countries relative to developing countries(as shown in the bottom ofTable 4), thus enabling them to benefit relatively morefrom China’s WTO accession. However, terms of trade may also improve due toChina’s and Taiwan’s WTO entry for those least developed countries whose devel-opment stage is behind China. This is because major exports from those countriesare primary products, which will face a higher world price because of the increasedworld demand, while the expansion of low-end capital and technology-intensive
Z. Wang / Journal of Policy Modeling 25 (2003) 1–41 29
manufacturing products from China and Taiwan to those countries will lower theirimport prices.
4.5. Impact on the US and world labor-intensive markets and implications forother suppliers of such products
Figs. 8 and 9plot world market shares of textile and apparel in major countrygroups respectively. The figures illustrate the difference between the two simulationscenarios. It shows a trend of flat world textile market share and slowly increasingworld apparel share for China during the simulation period if it is excluded fromthe WTO. Other MFA quota restricted suppliers such as countries in ASEAN,South Asia and South America would benefit the most under such a scenario, theirmarket share of apparel would increase from 26% at 2000 to more than 30% in2010. However, if China joins the WTO and obtains the benefits from phasingout MFA quotas for its textile and apparel exports, its world market share forapparel would increase from 25 to 28% during the MFA phase out period, andjump to 40% when MFA is eliminated at the year of 2005, and increase to 44%at the year of 2010. This gain would be at the expense of all other suppliers,but especially those MFA restricted suppliers, such as the countries in Asia andSouth America. Their market share would increase considerably less than underScenario I (Fig. 9). The combined world export share for all OECD countries onlyloses about 1 percentage point between the two scenarios compared with a morethan 9 percentage point difference for those MFA restricted developing countries.In contrast, the difference of China’s textile world market share under the twoscenarios is quite small (less than 1%) and both are flat during the simulation period(Fig. 8). The response from other suppliers is also different with the apparel market.The world market share of textiles for China’s neighboring newly industrializedcountries (Korea, Taiwan, Hong Kong) and Japan actually increase more rapidlythan that of China, and in an upward trend. This difference between the performanceof China’s textile and apparel exports in the world market after its WTO entry andthe responses from other suppliers reflect the difference between textile and apparelindustries and production relocation among East Asian economies. Comparedwith apparel industry, textile industry is relatively capital intensive and is oftencharacterized by large-scale production operations, while apparel production isrelative labor-intensive and more consistent with China’s overall factor endowmentstructure and comparative advantages.
In response to the dramatic expansion in apparel and other labor-intensive ex-ports in China there are different adjustment patterns in exports between China’sAsian neighboring NIEs and OECD countries. Contracting to production and ex-ports decline in both apparel and textile industries in most OECD countries, AsianNIEs reduce their clothing production and exports on one hand, but increase theirtextile production and exports on the other hand. This disparity in adjustment re-flects the continuing trend that labor-intensive production is further shifting fromAsian NIEs to China as a result of the production relocation process discussed in

30Z
.Wang
/Journalof
PolicyM
odeling25
(2003)1–41
Fig. 8. Changes in share of world textile market between a WTO with or without China, 2000–2010.

Z.W
ang/Journal
ofPolicy
Modeling
25(2003)
1–4131
Fig. 9. Changes in share of world apparel market between a WTO with or without China, 2000–2010.

32 Z. Wang / Journal of Policy Modeling 25 (2003) 1–41
the previous section. Reduction of trade distortion will accelerate this trend andenable vertical integration between the Asian NIEs and China in manufacture pro-duction. The Asian NIEs are becoming upstream suppliers of intermediate inputsand market channels for China’s labor-intensive products, while China is becom-ing a downstream processing and assembling base for Asian NIEs, thus enablingthem as a whole to become a more efficient producers in world manufacture goodsmarket.
Comparing the performance of China’s labor-intensive exports in restricted andunrestricted US markets help further highlight the differences between with andwithout the benefits from phasing out MFA quotas for exports of China’s andother MFA quota restricted suppliers in developed countries’ market.Figs. 10and 11plot China’s and other major suppliers’ shares of apparel and leatherproducts, footwear & travel goods in the US market over the simulation period.Apparel represents the restricted market in the model since its imports are un-der strict quota constraints in the United Sates.10 Leather products, footwear &travel goods represent the unrestricted market, with no quantitative restrictionsassumed.Fig. 11demonstrates clearly that China’s exports out perform both otherAsian and South American suppliers in the unrestricted market by a large marginduring the entire simulation period whether China joins the WTO or not. How-ever, access to the WTO will increase the growth of China’s US import marketshare by about 6%, sustaining China in a leading market position after the year2010.
In the restricted apparel market, however, WTO membership will make a sig-nificant difference for both China and other restricted suppliers. If China is ex-cluded from the WTO (Scenario I), the share of its apparel products in the USmarket would increase very slowly (less than 1 percentage point,Fig. 10) dur-ing the whole simulation period. While other apparel suppliers, especially thoseMFA restricted suppliers in Asia would increase by more than 14 percentagepoints, and take more than 40% of US market in 2010. If China enters the WTOand obtains the benefit from elimination of MFA quotas, however, its share inthe US apparel import market will dramatically increase in the year 2005 by30 percentage points when the quantitative restrictions are removed. While themarket share of other restricted suppliers in Asia would decline 11 percentagepoints. Such results highlight the high substitutability of labor-intensive productsamong developing countries, especially between China and other Asian devel-oping countries, and the competitive pressure on world labor-intensive exportmarkets that would result from fully integrating China into the world tradingsystem.
10 Estimates of price effects of US quotas on China’s exports of apparel and historical data on quotafill rates during the 1990s suggest that the quotas are very restrictive. Based on weekly license pricesand the 1996 US import level, the tax equivalents for China’s exports of apparel were estimated at37%. In contrast, tax equivalents for other restricted countries only range from 0.5 to 26% (Linkins,1999).

Z.W
ang/Journal
ofPolicy
Modeling
25(2003)
1–4133
Fig. 10. Changes in share of US appreal import market between a WTO with or without China, 2000–2010.

34Z
.Wang
/Journalof
PolicyM
odeling25
(2003)1–41
Fig. 11. Changes in share of US leather, shoes and travel goods import market between a WTO with or without China, 2000–2010.

Z. Wang / Journal of Policy Modeling 25 (2003) 1–41 35
4.6. Impact on China’s imports and implication for major land andcapital-intensive product suppliers
Entering the WTO, China will obtain the benefits from WTO membership suchas the MFA quota phase out under the ATC, but also has to implement its com-mitment to further open its vast market to all its trade partners. The reductionof import protection and expansion of labor-intensive manufacture will stimulateChina’s imports, especially in land and capital-intensive products.Fig. 12 illus-trates the difference in China’s real food and agricultural imports between thetwo scenarios by sectors, time and geographical origin. It shows that if Chinaenters the WTO in the beginning of 2001 and fulfill its major market access com-mitment to date by 2005, its total imports of food and agricultural products willincrease by about US$82 billion over the 10-year simulation period. More than60% of those imports are land-intensive products (grains, oilseeds and plant fiber).Only about 10% of the total gains by world agricultural product suppliers occurduring the first 4 years, when the quota system on wheat and cotton is still inplace despite China’s commitment on tariff reduction is concentrated during thefirst 4 years. It implies that quantity constraints and non-tariff barriers have moreprofound impact on agricultural imports than tariffs in China. The geographicaldistribution of those gains is consistent with the factor endowment structure ofthose supplier countries. All land abundant major agricultural commodity sup-pliers (Australia/New Zealand, Canada, and the United States) gain significantly,with about a third of those gains going to the United States alone. While coun-tries with a relatively lower land endowment such as W. Europe mainly benefitfrom exporting products that are less land-intensive such as processed food andbeverages. Developing countries with intermediate endowment of arable land alsoexport more land-intensive products to China because labor-intensive manufac-turing activities become relative less profitable for them due to China’s WTOentry.
Because the current size of China’s trade is only about 4% of the world total,the change in China’s exports and imports due to WTO entry will only have amoderate impact on the world market. However, there are at least two excep-tions. As discussed earlier, changes of China’s trade in apparel products willinduce significant impact on the world labor-intensive export market. Anotherexample is its impact on the world market for land-intensive agricultural prod-ucts. Fig. 13 plots out the shares of world land-intensive agricultural importsfor China, low-income South Africa countries and other major agricultural im-port region groups during the simulation period. It shows that WTO accessionwill dramatically increase China’s share in world land-intensive agricultural im-port market from less than 7% in 2000 to nearly 20% in 2010. The reductionof agricultural protection, especially eliminating quota restriction according toWTO rules is the direct reason for such an import boom. There is another indirectgeneral equilibrium drive, however. The expansion of manufacturing productionand the additional migration of agricultural labor to production workers in China

36Z
.Wang
/Journalof
PolicyM
odeling25
(2003)1–41
Fig. 12. Difference of China’s imports in food and agricultural products between a WTO with or without China, 2001–2010.

Z.W
ang/Journal
ofPolicy
Modeling
25(2003)
1–4137
Fig. 13. Changes in market share of world land-intensive agricultural imports, 2000–2010.
38Z
.Wang
/Journalof
PolicyM
odeling25
(2003)1–41
Fig. 14. Difference in China’s imports in capital-intensive products between a WTO with or without china, 2001–2010.
Z. Wang / Journal of Policy Modeling 25 (2003) 1–41 39
due to its WTO accession will increase China’s domestic demand for agriculturalproducts on one hand, and bid away other scarce resources such as land and capitalfrom agricultural production, thus lowering the growth rate of domestic supply onthe other hand, both cause the import surge and will push up world price foragricultural products. However, the impact on food imports by least developedeconomies such as countries in low-income South Africa is very limited becausethe improvement of their international terms of trade as shown inFig. 13 andTable 4.
Fig. 14presents the difference in China’s real imports of capital-intensive prod-ucts between a WTO with or without China and Taiwan. Over the 10-year sim-ulation period, China will import about 264 billion dollar more capital-intensivemanufactures because its WTO membership. Nearly 50% of those imports areintermediate goods, 12% of them is motor vehicle and parts, while electronic andother machinery constitute another 20 and 13% respectively. The three major in-dustrial regions (West Europe, United States, and Japan) gain the most, seizingmore than 50% of those new sales to China. Asia newly industrialized countries(Taiwan, Hong Kong, Singapore and Korea) also gain significantly, account foranother 35%, while all other developing countries in the world only take about12%. The sector structure of those new imports also consistent with the capitalendowment and technology development stage of economies that supply thoseproducts. For example, the three advanced industrial counties would seize morethan 90% of the gain in motor vehicle and parts, and about 60% of the gain inmachinery and equipment, while about 80% gain by the Asia NICs are in inter-mediates and electronic products. However, the Asia NICs are in the process ofindustrial structure upgrade and are becoming more and more important suppli-ers of capital-intensive goods to China. For instance, they would take about oneof thirds of the new machinery sales to China after China join the WTO as thesimulation results indicate.
In order to modernize its economy and raise productivity, China needs toimport large amounts of technology and capital-intensive commodities, estimatedat about 317 billion US dollar a year by the year 2010 if it enter the WTO in2001. As its export-oriented industries create more and more foreign exchangeduring its modernization, China’s import capacity for such commodities will tendto grow continuously. This will convert its massive infrastructure needs into effec-tive demand and thus extend the export market for firms in developed and newlyindustrialized countries.
5. Conclusions and limitations
This paper provides a relative comprehensive assessment of the impact ofChina’s WTO accession on the patterns of world trade and economic growthbased on actual market access commitments that China and Taiwan have madeto date. It estimates changes of net trade flows and economic growth rate for

40 Z. Wang / Journal of Policy Modeling 25 (2003) 1–41
China and its major trade partners by using a recursive dynamic, multi-region,multi-sector CGE model. The simulation results show that the major efficiencygains from WTO accession would accrue to China itself, but rest of the world,especially developed countries and Asian newly industrialized economies, as wellas least developed countries, would also benefit. However, integrating China intothe global trading system could induce more competition on labor-intensive prod-ucts and reduce their prices. The expansion of labor-intensive sectors in Chinacould increase its net imports on agricultural and capital-intensive products, driveup their price, thus improving industrial and land abundant countries’ terms oftrade. Some developing countries with a endowment structure similar to China,like those in South and Southeast Asia, would experience keener competition inlabor-intensive exports and lower prices for their products. More production factorswill remain in their food and agricultural sectors and increase their net agriculturalexports.
The simulation results also show that China’s WTO entry will have a profoundimpact on world labor-intensive export and primary agricultural import market.Its world market share of apparel extends by about 15 percentage points, reducingother countries, especially those MFA restricted countries’ share in the worldmarket. China also increases its land-intensive agricultural imports dramatically,its share in total world imports are more than doubled. However, its impact onfood import by least developed countries is very limited because of the expansionof agricultural production worldwide and the improvement of international termsof trade for those countries.
The results of this paper provide useful insights in understanding the impact ofChina’s accession to the WTO and demonstrate that CGE model can be a valuabletool for trade policy evaluation. However, there are several obvious limitationsthat need to be mentioned. First, it does not take into account other major as-pects of WTO membership, such as reduction of barriers in foreign investment,protection of intellectual property rights, securing market access, enforcement ofcommitment, and cooperation in dispute settlement. It at best captures only oneaspect of the issue at hand. Second, China has not yet finalized all terms of itsWTO entry when this analysis was finished. There are still uncertainties in thesize of its trade concessions, the time schedule of implementation for each of theliberalization measures, and the length of the phase-in period, especially in regardto quantitative restriction on imports and barriers to service trade. A relativelystylized representation of trade liberalization measures in these areas was adoptedin the simulation design. Third, the CGE model used in this paper is a highly styl-ized simplification of the world economy, and is far from perfect (Wang, 1997a).Finally, there are uncertainties about the size of parameters, such as elasticitiesof substitution of products from different sources and elastcities between capitalgoods imports and TFP growth. The actual size of the impact is very sensitiveto those key parameters. Therefore, the results reported in this paper need to beinterpreted with caution: they can be viewed as indicative but not as precise realoutcomes.

Z. Wang / Journal of Policy Modeling 25 (2003) 1–41 41
References
Ahuja, V., & Filmer, D. (1995).Educational attainment in developing countries: New estimates andprojections disaggregated by gender. World Bank Policy Research Working Paper 1489, Washing-ton, DC.
Brooke, A., Kendrick, D., & Meeraus, A. (1988).GAMS: A user’s guide. New York: The ScientificPress.
Gereffi, G. (1998). Commodity Chains and regional divisions of labor in East Asia. In E. M. Kim (Ed.),The four Asian tigers: Economic development and the global political economy (pp. 93–124). SanDiego, CA: Academic Press.
Gilbert, J., & Wahl, T. (2000).Applied general equilibrium assessments of trade liberalization in China.Paper presented at the workshop China’s Accession to the WTO: An Overview of Recent Analyses.CPB Netherlands Bureau for Economic Policy Analysis and Chinese Academy of Social Sciences,Beijing, China, October 19–20, 2000.
Hoekman, B. (1995). Assessing the general agreement on trade in services. In W. Martin & A. Winters(Eds.),The Uruguay Round and the developing economies. World Bank Discussion Paper 307.
Hertel, T., Martin, W., Koji, Y., & Dimaranan, B. (1995). Liberalizing manufactures trade in a changingworld economy. In M. Will & A. Winters (Eds.),The Uruguay Round and the developing economies.World Bank Discussion Papers 307.
Ianchovichina, E., Martin, W., & Fukase, E. (2000).Comparative study of trade liberalization regimes:The case of China’s accession to the WTO. Paper presented at the third conference of GlobalEconomic Analysis, Melbourne, Australia, June 20–30, 2000.
Lejour, A. (2000).China and the WTO: The impact on China and the world economy. Paper presentedat the third conference of Global Economic Analysis, Melbourne, Australia, June 20–30, 2000.
Linkins, L. (1999).Estimating the tax equivalents of US textile and apparel quotas. Research Note No.99-08-A. Office of Economics, US International Trade Commission.
Li, S., Wang, Z., Zhai, F., & Xu, L. (1998, December).The global and domestic impact of China joiningthe World Trade Organization. Washington Center for China Studies and Development ResearchCenter, The State Council, People’s Republic of China.
Martin, W. (2001). Implication of reform and WTO accession for China’s agricultural trade policies.Journal of Economic Transition (forthcoming).
Oxford Economic Forecasting. (1999).The Oxford world macroeconomic model, an overview. Oxford,UK: Abbey House.
Wang, Z. (1997a).The impact of China and Taiwan joining the World Trade Organization on US andWorld Agricultural Trade: A computable general equilibrium analysis. Technical Bulletin, No.1858, USDA, Economic Research Service.
Wang, Z. (1997b). China and Taiwan access to the World Trade Organization: Implications for USagriculture and trade.Agricultural Economics, 17, 239–264.
Wang, Z. (1999). Impact of China’s WTO entry on labor intensive export market — A recursivedynamic CGE analysis.The World Economy, 22(3), 379–405.
Wang, Z., & Kinsey, J. (1994). Consumption and saving behavior under strict and partial rationing.China Economic Review — An International Journal, 5, 83–100.
Yao, S., & Feenstra, R. (1999).China and Hong Kong international trade data (for use at UC Davis).Institute of Governmental Affairs, UC Davis.
Zhang, S., Zhang, Y., & Wan, Z. (1998).Measuring the costs of protection in China. Institute forInternational Economics, Washington, DC.
Related Documents