The impact of business regulatory reforms on economic growth Jamal Ibrahim Haidar ⇑ The World Bank, Washington, DC, United States Paris School of Economics, Paris, France University of Paris 1 Pantheon-Sorbonne, Paris, France article info Article history: Received 24 June 2011 Revised 12 May 2012 Available online 25 May 2012 JEL classification: O12 O17 O50 P48 Keywords: Growth Reform Development Regulations Doing Business Institutions abstract Haidar, Jamal Ibrahim—The impact of business regulatory reforms on economic growth I investigate the link between business regulatory reforms and eco- nomic growth in 172 countries. I create a 5 year dataset on busi- ness regulatory reforms from the World Bank’s Doing Business reports. Then, I test the hypothesis that business regulatory reforms increase economic growth, using data on micro-economic reforms. These data do not suffer the endogeneity issues associated with other datasets on changes in economic institutions. The results provide a robust support for the claim that business regula- tory reforms are good for economic growth. The paper establishes that, on average, each business regulatory reform is associated with a 0.15% increase in growth rate of GDP. J. Japanese Int. Econo- mies 26 (3) (2012) 285–307. The World Bank, Washington, DC, Uni- ted States; Paris School of Economics, Paris, France; University of Paris 1 Pantheon-Sorbonne, Paris, France. Ó 2012 Elsevier Inc. All rights reserved. 1. Introduction The World Bank has been publishing the annual Doing Business reports since 2004 to investigate the scope and manner of regulations that enhance business activity and those that constrain it. These reports compare countries 1 on the basis of quantitative indicators of business regulations. A fundamen- tal premise of business regulations is that economic activity requires good rules – rules that establish and 0889-1583/$ - see front matter Ó 2012 Elsevier Inc. All rights reserved. http://dx.doi.org/10.1016/j.jjie.2012.05.004 ⇑ Address: Paris School of Economics, Paris, France. E-mail addresses: [email protected], [email protected], [email protected] 1 The Doing Business 2011 dataset covers 183 countries. J. Japanese Int. Economies 26 (2012) 285–307 Contents lists available at SciVerse ScienceDirect Journal of The Japanese and International Economies journal homepage: www.elsevier.com/locate/jjie

Welcome message from author
This document is posted to help you gain knowledge. Please leave a comment to let me know what you think about it! Share it to your friends and learn new things together.
Transcript
J. Japanese Int. Economies 26 (2012) 285–307
Contents lists available at SciVerse ScienceDirect
Journal of The Japanese andInternational Economies
journal homepage: www.elsevier .com/locate/ j j ie
The impact of business regulatory reforms on economicgrowth
Jamal Ibrahim Haidar ⇑The World Bank, Washington, DC, United StatesParis School of Economics, Paris, FranceUniversity of Paris 1 Pantheon-Sorbonne, Paris, France
a r t i c l e i n f o a b s t r a c t
Article history:Received 24 June 2011Revised 12 May 2012Available online 25 May 2012
JEL classification:O12O17O50P48
Keywords:GrowthReformDevelopmentRegulationsDoing BusinessInstitutions
0889-1583/$ - see front matter � 2012 Elsevier Inhttp://dx.doi.org/10.1016/j.jjie.2012.05.004
⇑ Address: Paris School of Economics, Paris, FranE-mail addresses: [email protected], Jama
1 The Doing Business 2011 dataset covers 183 co
Haidar, Jamal Ibrahim—The impact of business regulatory reformson economic growth
I investigate the link between business regulatory reforms and eco-nomic growth in 172 countries. I create a 5 year dataset on busi-ness regulatory reforms from the World Bank’s Doing Businessreports. Then, I test the hypothesis that business regulatoryreforms increase economic growth, using data on micro-economicreforms. These data do not suffer the endogeneity issues associatedwith other datasets on changes in economic institutions. Theresults provide a robust support for the claim that business regula-tory reforms are good for economic growth. The paper establishesthat, on average, each business regulatory reform is associatedwith a 0.15% increase in growth rate of GDP. J. Japanese Int. Econo-mies 26 (3) (2012) 285–307. The World Bank, Washington, DC, Uni-ted States; Paris School of Economics, Paris, France; University ofParis 1 Pantheon-Sorbonne, Paris, France.
� 2012 Elsevier Inc. All rights reserved.
1. Introduction
The World Bank has been publishing the annual Doing Business reports since 2004 to investigatethe scope and manner of regulations that enhance business activity and those that constrain it. Thesereports compare countries1 on the basis of quantitative indicators of business regulations. A fundamen-tal premise of business regulations is that economic activity requires good rules – rules that establish and
c. All rights reserved.

286 J.I. Haidar / J. Japanese Int. Economies 26 (2012) 285–307
clarify property rights and reduce the cost of resolving disputes; rules that increase the predictability ofeconomic interactions and provide contractual partners with certainty and protection against abuse(Acemoglu et al., 2001; Djankov et al., 2002). The objective is regulations designed to be efficient, acces-sible to all and simple in their implementation. Djankov et al. (2006) and Haidar (2009) show in crosscountry regressions that burdensome business regulatory procedures are negatively correlated withGDP growth. This paper is different in two different ways. First, while Djankov et al. (2006) and Haidar(2009) focus on 1 year, much less countries, a lower number of indicators, and a narrower geographicscope, this paper looks at a 5-year period, a larger regulatory scope, and a broader set of countries. Sec-ond, the main independent variable in Djankov et al. (2006) and Haidar (2009) is different. The authorslook at the regulatory status at 1 year but this paper considers a more interesting and important variable,regulatory reform (not status) at a given year and over time. They consider that growth is a function ofthe existing regulatory framework. I argue that the level of income can be a function of existing regula-tory framework but a change in income level is more of a function of how regulatory framework changesand improves.
This paper uses the World Bank Doing Business indicators as proxies of business regulations, iden-tifies business regulatory reforms by Doing Business reforms, and goes further towards answering thequestion about whether regulatory reforms enhance economic growth by studying a major determi-nant of economic growth: regulatory reforms governing business activity.
A vibrant private sector – with firms making investments, creating jobs, and improving productiv-ity – promotes growth and expands opportunities for poor people (OECD and World Bank, 2006). Tostrengthen private sector, governments around the world have implemented wide-ranging reforms,including macro-stabilization programs, price liberalization, privatization, and trade-barrier reduc-tions. In many countries, however, entrepreneurial activity remains limited, poverty stays high, andgrowth is not significantly far from stagnant. And other countries have spurned orthodox macro re-forms and done well.
Although macro policies are unquestionably important, there is a growing consensus that the qual-ity of business regulation and the institutions that enforce it are a major determinant of prosperity.Hong Kong (China)’s economic success, Botswana’s stellar growth performance, and Hungary’s smoothtransition experience have all been stimulated by a good business regulatory environment.2 However,little research has measured specific aspects of business regulation and analyzed their impact on eco-nomic outcomes such as growth, productivity, investment, informality, corruption, unemployment,and poverty. The lack of systematic knowledge prevents policymakers from assessing how good legaland regulatory systems are and determining what to reform.
The World Bank Doing Business regulatory indicators have four key goals. First, they aim to moti-vate reforms through country benchmarking. Second, they try to inform the design of reforms by high-lighting specifically what needs to be changed. Third, the dataset enriches international initiatives ondevelopment effectiveness. Fourth, the dataset tries to inform theory by producing new indicators thatquantify various aspects of regulation, facilitating tests of existing theories, and contributing to theempirical foundation for new theoretical work on the relation between regulation and development.
Governments around the world reported 1140 business regulatory reforms over the 5 years up to2010.3 Against the backdrop of the global financial and economic crisis, policy makers around the worldcontinue to reform business regulations at the level of the firm, in some areas at an even faster pace thanbefore. Most reforms were nested in broader programs of investment climate reform aimed at enhancingeconomic competitiveness, as in Colombia, Kenya, and Liberia. In structuring their reform programs forthe business environment, governments use multiple data sources and indicators. And, reformers re-spond to many stakeholders and interest groups, all of whom bring important issues and concerns tothe debate. World Bank Group dialogue with governments on the investment climate is designed toencourage critical use of the data, sharpen judgment, avoid a narrow focus on improving rankings,and encourage broad-based reforms that enhance the investment climate. These continued efforts
2 See the World Bank Doing Business (2004) report for details.3 We deduce these reforms from the annual Doing Business reports. The paper looks at these five specific years for (i) data
consistency and (ii) higher country coverage.
J.I. Haidar / J. Japanese Int. Economies 26 (2012) 285–307 287
prompt questions: What is the impact of business regulatory reforms on economic growth? This paperaims to present new findings toward answering this question.
The paper proceeds as follows. Section 2 reviews literature. Section 3 describes data. Section 4 pre-sents main empirical results. Section 5 provides robustness checks, and Section 6 concludes.
2. Literature review
Hall and Jones (1999), Acemoglu et al. (2001), Djankov et al. (2002, 2003, 2004, 2006), among oth-ers4 show that institutions are a major determinant of wealth and long-term growth. Countries that hadbetter political and economic institutions in the past are richer today. I add to the literature on institu-tions and growth by studying a new measure of institutional reforms. The analysis focuses on a particulartype of institutional reforms: business regulations. I use a new country-level data set to establish the im-pact of business regulatory reforms on economic growth.
The relationship between regulations and business activity has been under investigation in manyacademic circles in many articles over the last two decades. Winston (1998) provides a literature re-view, finds that business regulations affect large and most concentrated industries and are sector-spe-cific. However, much fewer studies look at the impact of business regulatory reforms on economicgrowth, partly due to lack of data availability. This study tries to fill a research gap by addressing busi-ness regulatory reforms impact on economic growth.
Various empirical studies look at business regulations trends across countries over the last decade.Djankov et al. (2002) presents new data on the regulation of entry of start-up firms in 85 countries.Countries with heavier regulation of entry have higher corruption and larger unofficial economies,but not better quality of public or private goods. Countries with more democratic and limited govern-ments have lighter regulation of entry. Djankov et al. (2003) finds that formalism is systematicallygreater in civil than in common law countries, and is associated with higher expected duration of judi-cial proceedings, less consistency, less honesty, less fairness in judicial decisions, and more corruption.These results suggest that legal transplantation may have led to an inefficiently high level of proce-dural formalism, particularly in developing countries. Djankov et al. (2004) investigates the regulationof labor markets through employment, collective relations, and social security laws in 85 countries.They find that heavier regulation of labor is associated with lower labor force participation and higherunemployment, especially of the young.
On a related front, Conway et al. (2005) shows that within some countries product market policieshave become more consistent across different regulatory provisions, although relatively restrictivecountries still tend to have a more heterogeneous approach to competition. In general, domestic bar-riers to competition tend to be higher in countries that have higher barriers to foreign trade andinvestment, and high levels of state control and barriers to competition. Also, Djankov et al. (2010)established the impact of time delays on international trade. They estimated a difference gravity equa-tion that controls for remoteness, and find that each additional day that a product is delayed prior tobeing shipped reduces trade by more than 1%. The results that I establish in this paper (in the mainregressions and in Appendix Table A8) are related to the latter paper. Appendix Table A8 shows thateach positive reform in trading-across-borders regulations (i.e. time, costs, and procedures needed toexport or import a cargo) is associated with a 0.88% increase in average economic growth rate. Thus,this paper also highlights the importance of reducing trade costs (as opposed to tariff barriers) to stim-ulate economic growth.
Starting early 2000s, articles focusing on the effect of regulations on economic fundamentals ap-peared. On the business entry regulations front, Desai et al. (2003) finds cross-country correlations be-tween entry regulations and firm entry rates. They explore the impact of the institutional environmenton the nature of entrepreneurial activity across Europe. Greater fairness and greater protection ofproperty rights increase entry rates, reduce exit rates, and lower average firm size. Moreover, Klapperet al. (2004) uses a comprehensive database of firms in Western and Eastern Europe to study how the
4 i.e. Amin and Haidar (2011), Haidar (2009), and Amin and Haidar (forthcoming). Haidar (2009) looks at how the state ofinvestors protections affects income level and growth at one given year. However, this paper looks at how changes in investorprotections, among nine other regulatory aspects, in a given country affect its income growth over time.

288 J.I. Haidar / J. Japanese Int. Economies 26 (2012) 285–307
business environment in a country drives the creation of new firms. They find entry regulations ham-per entry, especially in industries that naturally should have high entry. Also, value-added per em-ployee in naturally ‘‘high entry’’ industries grow more slowly in countries with onerous regulationson entry. And, Viviano (2008) exploits reforms to regional entry regulations in the Italian retail tradesector, finding that entry barriers have a negative impact on employment growth and on the efficiencyof small firms.
On the labor regulations front, Scarpetta et al. (2002) use firm-level survey data from OECD coun-tries to analyze firm entry and exit, finding that higher product market and labor regulations are neg-atively correlated with the entry of small and medium sized firms. In addition, Hasan et al. (2007) findthat labor demand elasticities in Indian manufacturing industries are higher for Indian states withmore flexible labor regulations. And, Besley and Burgess (2004) find that Indian states which imposedtighter labor regulations experienced reduced manufacturing output, employment, investment andproductivity in formal sector manufacturing and increased output in informal manufacturing.
3. Data description
The sample consists of 172 countries for which information on the main variables is available. Thetime period covered by the study is 2006–2010. In the analysis, I utilize several sources of data includ-ing the World Bank’s Doing Business annual reports, World Development Indicators, Polity IV, andFreedom House. Table 1 provides a definition of all variables and their sources. Table 2 provides sum-mary statistics, and Table 3 provides correlations between the main variables.
3.1. Dependent variable
This study primarily focuses on one dependent variable: annual percentage growth rate of incomeper capita, available from the World Bank’s World Development Indicators (WDI). I use the WDI becauseit covers a larger set of countries than the Penn World Tables used by Hall and Jones (1999). By way ofcontext, 2006–2010 was a period of relatively mixed (strong and weak) economic performance acrossthe world. For developed countries, 2006 marked recovery after the US slump of 2001–2005. Amongdeveloping countries, some experienced sharp downturns – notably Argentina and Zimbabwe – butmost have enjoyed growth rates in excess of those of the 1980s and 1990s. GDP growth rates averaged3.92, and this average growth rate ranged between �6.3% (Zimbabwe) and 19.9% (Azerbaijan), asshown in Table 2.
3.2. Explanatory variables
I deduce the main independent variable from World Bank’s Doing Business annual reports. As partof its annual exercise, Doing Business compiles 10 sets of indicators covering various aspects of thebusiness climate including starting a business, paying taxes, obtaining licenses, getting credit, protect-ing investors, employing workers, international trade, property registration, closing a business andenforcement of private contracts. The annual Doing Business report includes information on importantreforms on each of these indicators. I code this information as a dummy variable which equals 1 if acountry implemented a positive reform during the year on a given indicator and 0 otherwise. A posi-tive reform, as defined in Doing Business reports, is one that makes it faster, cheaper or administra-tively easier for local businesses to start and run operations; or a reform that defines and increasesthe protection of property rights. An example is reducing the number of days to get an industry li-cense, eliminating the minimum capital requirement for start-ups, or increasing the legal rights ofcreditors and minority shareholders.
Using this dataset, I define the main independent variable, Reform, as the total number of reformshappening in a country during a certain period of time (i.e. 2006–2010 in Table 4 and 2006–2008 inTable 5). Each individual reform is coded as a dummy variable equal to 1 if a positive reform occurredin one or more of the 10 indicators in a given year and 0 otherwise. The mean value of the variableequals 6.51 and the standard deviation is 4.67 (Table 2). For example, between 2006 and 2010,

Table 1Description of variables.
Variable Description
Economic growth Average GDP growth rates (PPP adjusted and at constant 2005 USD). We take the average valueof the variable over 2006–2010. Source: World Development Indicators, World Bank
Regulatory reforms Total business regulatory reforms as measured by the Doing Business Indices. We use totalnumber of reforms over 2006–2010. A measure of the improvement of the quality of thebusiness climate as experienced by the firms. Doing Business compiles 10 sets of indicatorscovering various aspects of the business climate including starting a business, paying taxes,obtaining licenses, getting credit, protecting investors, employing workers, international trade,property registration, closing a business and enforcement of private contracts. Information isalso available on an annual basis on important reforms on each of these indicators. Thisinformation is coded as a dummy variable which equals 1 if a country implemented a positivereform during the year on a given indicator and 0 otherwise. Source: Doing Business, WorldBank
Foreign directinvestment
Net foreign direct investment as a percentage of GDP. Average values over 2006–2010 are used.Source: World Development Indicators, World Bank
Fixed capital formationgrowth
Average annual growth of gross fixed capital formation based on constant local currency.Aggregates are based on constant 2005 US dollars. Gross fixed capital formation (formerly grossdomestic fixed investment) includes land improvements (fences, ditches, drains, and so on);plant, machinery, and equipment purchases; and the construction of roads, railways, and thelike, including schools, offices, hospitals, private residential dwellings, and commercial andindustrial buildings. Average values over 2006–2010 are used. Source: World DevelopmentIndicators, World Bank
Population Log of average population of the country. Average values over 2006–2010 are used. Source:World Development Indicators, World Bank
Trade The sum of exports and imports as a as a percentage of GDP. Average values over 2006–2010are used. Source: World Development Indicators, World Bank
Government spending The level of government expenditures as a percentage of GDP. Average values over 2006–2010are used. Government expenditures, including consumption and transfers, account for theentire score. Source: Heritage Foundation
Financial freedom Financial freedom is a measure of banking efficiency as well as a measure of independence fromgovernment control and interference in the financial sector. Average values over 2006–2010 areused. Source: Heritage Foundation
Political stability The political stability and absence of violence indicator measures the perceptions of thelikelihood that the government will be destabilized or overthrown by unconstitutional orviolent means, including domestic violence and terrorism. Values are indexed to have a mean ofzero and a standard deviation of one index unit. Positive scores indicate better governance and99% of the values fall between 2.5 and �2.5. Average values over 1996–2009 are used. Source:Kaufmann et al. (2009)
Rule of law The Rule of Law Index is a measure of ‘‘the extent to which agents have confidence in and abideby the rules of society.’’ The degree to which a society’s atmosphere is conducive to regular,orderly social and economic activity and the protection of private property is an importantmeasure of government effectiveness. Values are indexed to have a mean of zero and a standarddeviation of one index unit. Positive scores indicate better governance and 99% of the values fallbetween 2.5 and �2.5. Average values over 1996–2009 are used. Source: Kaufmann et al. (2009)
Control of corruption The average level of the ‘‘freedom from corruption’’ score as measured by the HeritageFoundation’s Index of Economic Freedom, where the average is taken over 1996–2009 values.Source: Heritage Foundation
J.I. Haidar / J. Japanese Int. Economies 26 (2012) 285–307 289
Trinidad and Tobago implemented reforms in paying taxes and access to credit implying a score of 2for the independent variable.
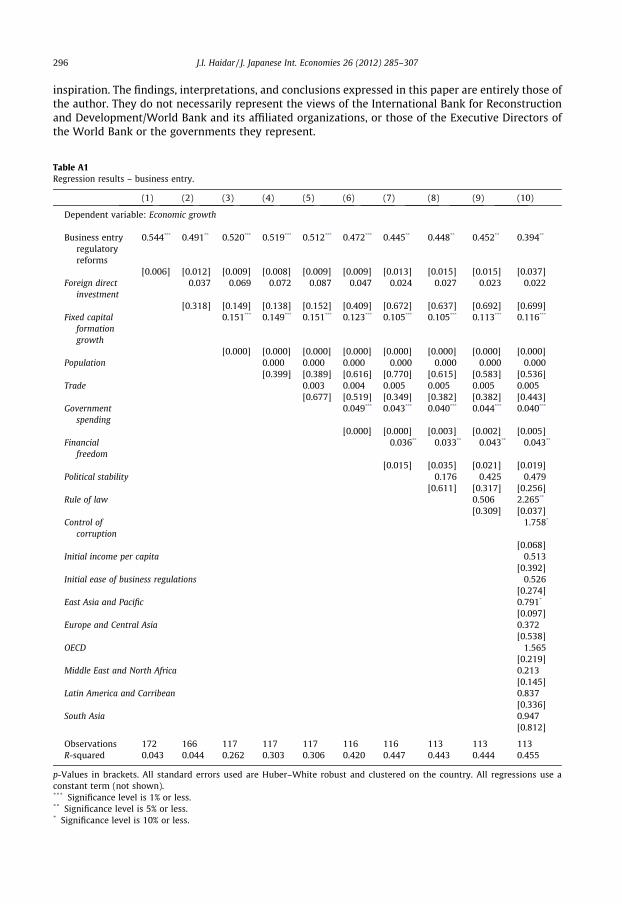
In addition to the main independent variable, Reform, I ran 10 separate regressions using the mainindependent variable as the total number of reforms in each category of regulatory reforms. The re-sults hold. I show the 10 separate regressions in the Appendix (Tables A1–A10).
Information on changes in the quality of the business environment is also available from alterna-tive sources such as Heritage Foundation’s Freedom of the World Index or Fraser Institute’s EconomicFreedom of the World. One could use annual changes in these data to construct a measure of reformsimilar to the ones described above. However, I use the Doing Business data as I consider that it offers
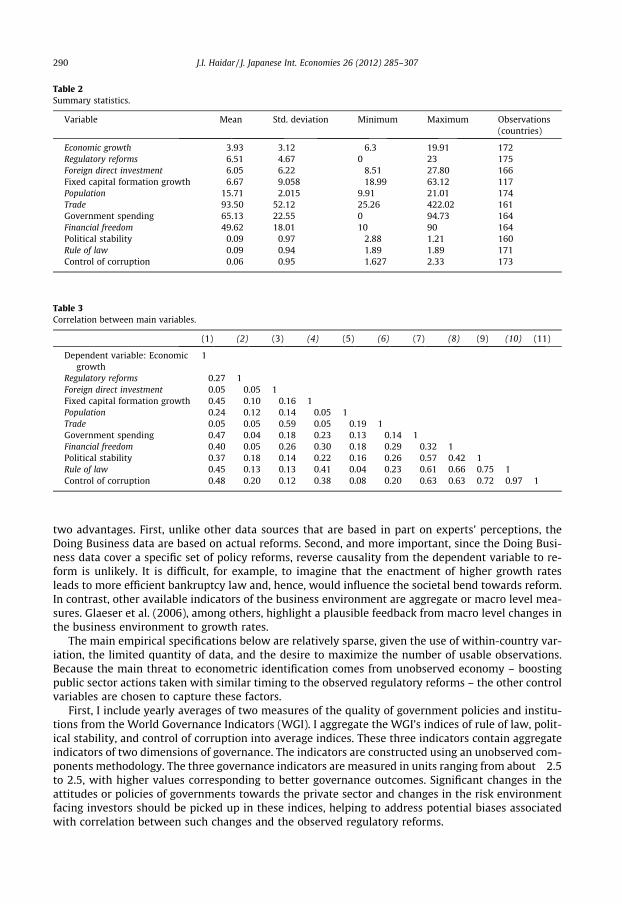
Table 2Summary statistics.
Variable Mean Std. deviation Minimum Maximum Observations(countries)
Economic growth 3.93 3.12 �6.3 19.91 172Regulatory reforms 6.51 4.67 0 23 175Foreign direct investment 6.05 6.22 �8.51 27.80 166Fixed capital formation growth 6.67 9.058 �18.99 63.12 117Population 15.71 2.015 9.91 21.01 174Trade 93.50 52.12 25.26 422.02 161Government spending 65.13 22.55 0 94.73 164Financial freedom 49.62 18.01 10 90 164Political stability �0.09 0.97 �2.88 1.21 160Rule of law �0.09 0.94 �1.89 1.89 171Control of corruption �0.06 0.95 �1.627 2.33 173
Table 3Correlation between main variables.
(1) (2) (3) (4) (5) (6) (7) (8) (9) (10) (11)
Dependent variable: Economicgrowth
1
Regulatory reforms 0.27 1Foreign direct investment �0.05 0.05 1Fixed capital formation growth 0.45 0.10 0.16 1Population 0.24 0.12 �0.14 0.05 1Trade �0.05 0.05 0.59 �0.05 �0.19 1Government spending 0.47 0.04 �0.18 0.23 0.13 �0.14 1Financial freedom �0.40 �0.05 0.26 �0.30 �0.18 0.29 �0.32 1Political stability �0.37 �0.18 0.14 �0.22 �0.16 0.26 �0.57 0.42 1Rule of law �0.45 �0.13 0.13 �0.41 �0.04 0.23 �0.61 0.66 0.75 1Control of corruption �0.48 �0.20 0.12 �0.38 �0.08 0.20 �0.63 0.63 0.72 0.97 1
290 J.I. Haidar / J. Japanese Int. Economies 26 (2012) 285–307
two advantages. First, unlike other data sources that are based in part on experts’ perceptions, theDoing Business data are based on actual reforms. Second, and more important, since the Doing Busi-ness data cover a specific set of policy reforms, reverse causality from the dependent variable to re-form is unlikely. It is difficult, for example, to imagine that the enactment of higher growth ratesleads to more efficient bankruptcy law and, hence, would influence the societal bend towards reform.In contrast, other available indicators of the business environment are aggregate or macro level mea-sures. Glaeser et al. (2006), among others, highlight a plausible feedback from macro level changes inthe business environment to growth rates.
The main empirical specifications below are relatively sparse, given the use of within-country var-iation, the limited quantity of data, and the desire to maximize the number of usable observations.Because the main threat to econometric identification comes from unobserved economy – boostingpublic sector actions taken with similar timing to the observed regulatory reforms – the other controlvariables are chosen to capture these factors.
First, I include yearly averages of two measures of the quality of government policies and institu-tions from the World Governance Indicators (WGI). I aggregate the WGI’s indices of rule of law, polit-ical stability, and control of corruption into average indices. These three indicators contain aggregateindicators of two dimensions of governance. The indicators are constructed using an unobserved com-ponents methodology. The three governance indicators are measured in units ranging from about�2.5to 2.5, with higher values corresponding to better governance outcomes. Significant changes in theattitudes or policies of governments towards the private sector and changes in the risk environmentfacing investors should be picked up in these indices, helping to address potential biases associatedwith correlation between such changes and the observed regulatory reforms.
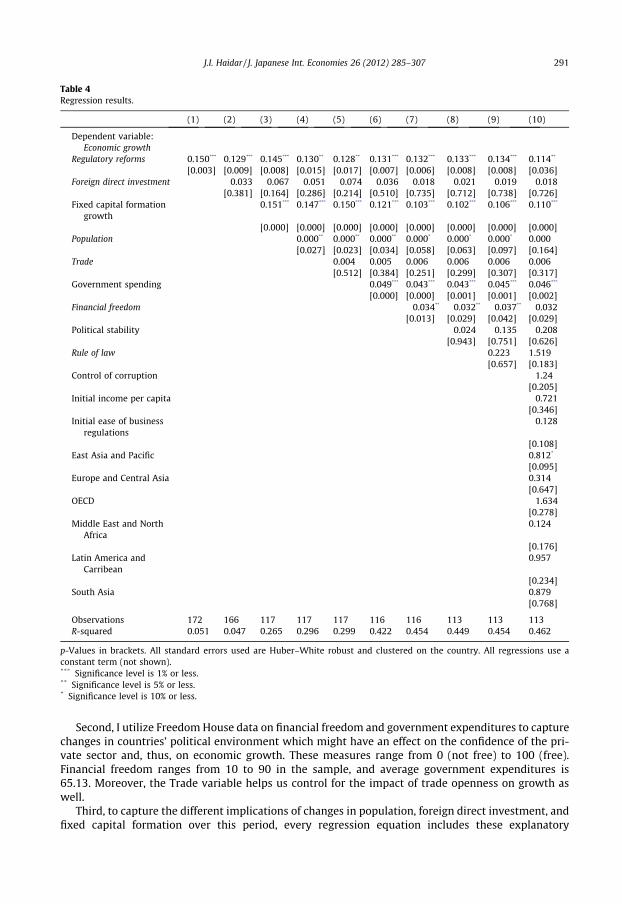
Table 4Regression results.
(1) (2) (3) (4) (5) (6) (7) (8) (9) (10)
Dependent variable:Economic growth
Regulatory reforms 0.150⁄⁄⁄
0.129⁄⁄⁄
0.145⁄⁄⁄
0.130⁄⁄
0.128⁄⁄
0.131⁄⁄⁄
0.132⁄⁄⁄
0.133⁄⁄⁄
0.134⁄⁄⁄
0.114⁄⁄
[0.003] [0.009] [0.008] [0.015] [0.017] [0.007] [0.006] [0.008] [0.008] [0.036]Foreign direct investment �0.033 �0.067 �0.051 �0.074 �0.036 �0.018 �0.021 �0.019 �0.018
[0.381] [0.164] [0.286] [0.214] [0.510] [0.735] [0.712] [0.738] [0.726]Fixed capital formation
growth0.151
⁄⁄⁄0.147
⁄⁄⁄0.150
⁄⁄⁄0.121
⁄⁄⁄0.103
⁄⁄⁄0.102
⁄⁄⁄0.106
⁄⁄⁄0.110
⁄⁄⁄
[0.000] [0.000] [0.000] [0.000] [0.000] [0.000] [0.000] [0.000]Population 0.000
⁄⁄0.000
⁄⁄0.000
⁄⁄0.000
⁄0.000
⁄0.000
⁄0.000
[0.027] [0.023] [0.034] [0.058] [0.063] [0.097] [0.164]Trade 0.004 0.005 0.006 0.006 0.006 0.006
[0.512] [0.384] [0.251] [0.299] [0.307] [0.317]Government spending 0.049
⁄⁄⁄0.043
⁄⁄⁄0.043
⁄⁄⁄0.045
⁄⁄⁄0.046
⁄⁄⁄
[0.000] [0.000] [0.001] [0.001] [0.002]Financial freedom �0.034
⁄⁄ �0.032⁄⁄ �0.037
⁄⁄ �0.032[0.013] [0.029] [0.042] [0.029]
Political stability �0.024 �0.135 �0.208[0.943] [0.751] [0.626]
Rule of law 0.223 1.519[0.657] [0.183]
Control of corruption �1.24[0.205]
Initial income per capita �0.721[0.346]
Initial ease of businessregulations
�0.128
[0.108]East Asia and Pacific 0.812
⁄
[0.095]Europe and Central Asia 0.314
[0.647]OECD �1.634
[0.278]Middle East and North
Africa0.124
[0.176]Latin America and
Carribean0.957
[0.234]South Asia 0.879
[0.768]
Observations 172 166 117 117 117 116 116 113 113 113R-squared 0.051 0.047 0.265 0.296 0.299 0.422 0.454 0.449 0.454 0.462
p-Values in brackets. All standard errors used are Huber–White robust and clustered on the country. All regressions use aconstant term (not shown).*** Significance level is 1% or less.** Significance level is 5% or less.* Significance level is 10% or less.
J.I. Haidar / J. Japanese Int. Economies 26 (2012) 285–307 291
Second, I utilize Freedom House data on financial freedom and government expenditures to capturechanges in countries’ political environment which might have an effect on the confidence of the pri-vate sector and, thus, on economic growth. These measures range from 0 (not free) to 100 (free).Financial freedom ranges from 10 to 90 in the sample, and average government expenditures is65.13. Moreover, the Trade variable helps us control for the impact of trade openness on growth aswell.
Third, to capture the different implications of changes in population, foreign direct investment, andfixed capital formation over this period, every regression equation includes these explanatory
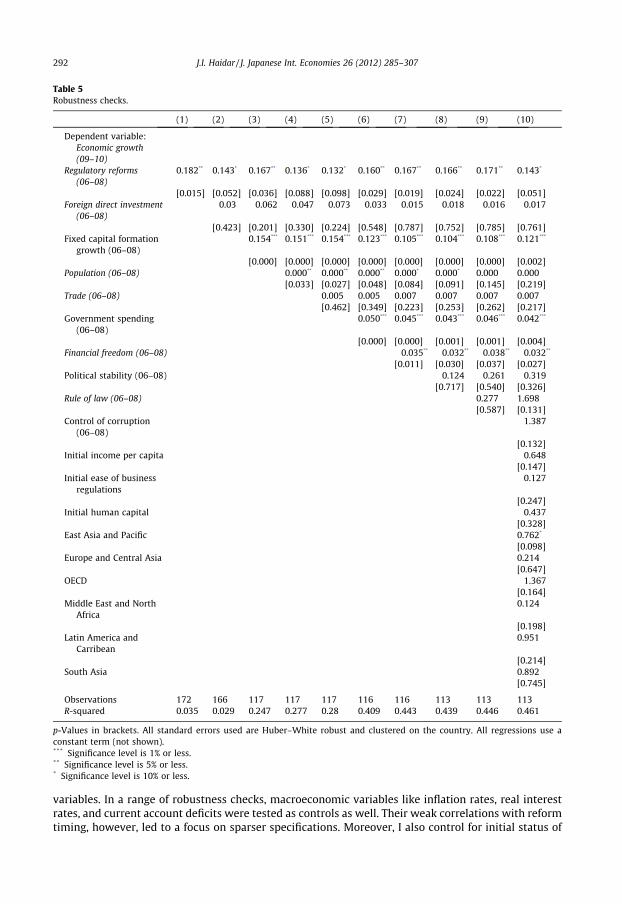
Table 5Robustness checks.
(1) (2) (3) (4) (5) (6) (7) (8) (9) (10)
Dependent variable:Economic growth(09–10)
Regulatory reforms(06–08)
0.182⁄⁄
0.143⁄
0.167⁄⁄
0.136⁄
0.132⁄
0.160⁄⁄
0.167⁄⁄
0.166⁄⁄
0.171⁄⁄
0.143⁄
[0.015] [0.052] [0.036] [0.088] [0.098] [0.029] [0.019] [0.024] [0.022] [0.051]Foreign direct investment
(06–08)�0.03 �0.062 �0.047 �0.073 �0.033 �0.015 �0.018 �0.016 �0.017
[0.423] [0.201] [0.330] [0.224] [0.548] [0.787] [0.752] [0.785] [0.761]Fixed capital formation
growth (06–08)0.154
⁄⁄⁄0.151
⁄⁄⁄0.154
⁄⁄⁄0.123
⁄⁄⁄0.105
⁄⁄⁄0.104
⁄⁄⁄0.108
⁄⁄⁄0.121
⁄⁄⁄
[0.000] [0.000] [0.000] [0.000] [0.000] [0.000] [0.000] [0.002]Population (06–08) 0.000
⁄⁄0.000
⁄⁄0.000
⁄⁄0.000
⁄0.000
⁄0.000 0.000
[0.033] [0.027] [0.048] [0.084] [0.091] [0.145] [0.219]Trade (06–08) 0.005 0.005 0.007 0.007 0.007 0.007
[0.462] [0.349] [0.223] [0.253] [0.262] [0.217]Government spending
(06–08)0.050
⁄⁄⁄0.045
⁄⁄⁄0.043
⁄⁄⁄0.046
⁄⁄⁄0.042
⁄⁄⁄
[0.000] [0.000] [0.001] [0.001] [0.004]Financial freedom (06–08) �0.035
⁄⁄ �0.032⁄⁄ �0.038
⁄⁄ �0.032⁄⁄
[0.011] [0.030] [0.037] [0.027]Political stability (06–08) �0.124 �0.261 �0.319
[0.717] [0.540] [0.326]Rule of law (06–08) 0.277 1.698
[0.587] [0.131]Control of corruption
(06–08)�1.387
[0.132]Initial income per capita �0.648
[0.147]Initial ease of business
regulations�0.127
[0.247]Initial human capital �0.437
[0.328]East Asia and Pacific 0.762
⁄
[0.098]Europe and Central Asia 0.214
[0.647]OECD �1.367
[0.164]Middle East and North
Africa0.124
[0.198]Latin America and
Carribean0.951
[0.214]South Asia 0.892
[0.745]
Observations 172 166 117 117 117 116 116 113 113 113R-squared 0.035 0.029 0.247 0.277 0.28 0.409 0.443 0.439 0.446 0.461
p-Values in brackets. All standard errors used are Huber–White robust and clustered on the country. All regressions use aconstant term (not shown).*** Significance level is 1% or less.** Significance level is 5% or less.* Significance level is 10% or less.
292 J.I. Haidar / J. Japanese Int. Economies 26 (2012) 285–307
variables. In a range of robustness checks, macroeconomic variables like inflation rates, real interestrates, and current account deficits were tested as controls as well. Their weak correlations with reformtiming, however, led to a focus on sparser specifications. Moreover, I also control for initial status of
05
10Av
erag
e G
DP
Gro
wth
0 5 10 15 20 25Total Business Regulatory Reforms
Fitted values AvgGDPgrowth
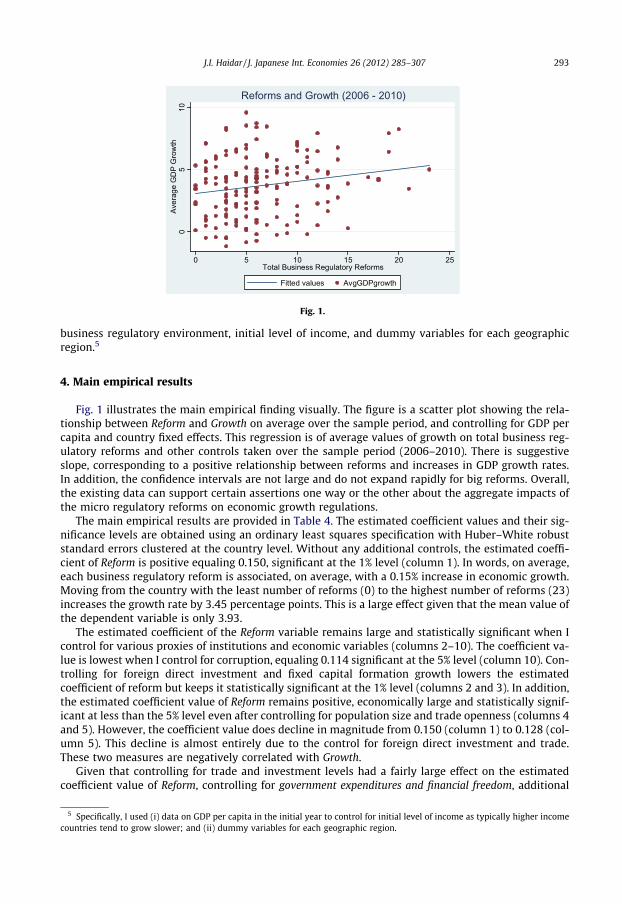
Reforms and Growth (2006 - 2010)
Fig. 1.
J.I. Haidar / J. Japanese Int. Economies 26 (2012) 285–307 293
business regulatory environment, initial level of income, and dummy variables for each geographicregion.5
4. Main empirical results
Fig. 1 illustrates the main empirical finding visually. The figure is a scatter plot showing the rela-tionship between Reform and Growth on average over the sample period, and controlling for GDP percapita and country fixed effects. This regression is of average values of growth on total business reg-ulatory reforms and other controls taken over the sample period (2006–2010). There is suggestiveslope, corresponding to a positive relationship between reforms and increases in GDP growth rates.In addition, the confidence intervals are not large and do not expand rapidly for big reforms. Overall,the existing data can support certain assertions one way or the other about the aggregate impacts ofthe micro regulatory reforms on economic growth regulations.
The main empirical results are provided in Table 4. The estimated coefficient values and their sig-nificance levels are obtained using an ordinary least squares specification with Huber–White robuststandard errors clustered at the country level. Without any additional controls, the estimated coeffi-cient of Reform is positive equaling 0.150, significant at the 1% level (column 1). In words, on average,each business regulatory reform is associated, on average, with a 0.15% increase in economic growth.Moving from the country with the least number of reforms (0) to the highest number of reforms (23)increases the growth rate by 3.45 percentage points. This is a large effect given that the mean value ofthe dependent variable is only 3.93.
The estimated coefficient of the Reform variable remains large and statistically significant when Icontrol for various proxies of institutions and economic variables (columns 2–10). The coefficient va-lue is lowest when I control for corruption, equaling 0.114 significant at the 5% level (column 10). Con-trolling for foreign direct investment and fixed capital formation growth lowers the estimatedcoefficient of reform but keeps it statistically significant at the 1% level (columns 2 and 3). In addition,the estimated coefficient value of Reform remains positive, economically large and statistically signif-icant at less than the 5% level even after controlling for population size and trade openness (columns 4and 5). However, the coefficient value does decline in magnitude from 0.150 (column 1) to 0.128 (col-umn 5). This decline is almost entirely due to the control for foreign direct investment and trade.These two measures are negatively correlated with Growth.
Given that controlling for trade and investment levels had a fairly large effect on the estimatedcoefficient value of Reform, controlling for government expenditures and financial freedom, additional
5 Specifically, I used (i) data on GDP per capita in the initial year to control for initial level of income as typically higher incomecountries tend to grow slower; and (ii) dummy variables for each geographic region.

294 J.I. Haidar / J. Japanese Int. Economies 26 (2012) 285–307
measures of overall financial development becomes more important. Columns (6–7) show that control-ling for government expenditures and financial freedom has little effect on the estimated coefficient valueof Reform, and the statistical level of the coefficient stays significant at 1%. Unlike government spending,financial freedom shows a negative correlation with Reform less business climate reforms among thecountries of relatively more financial freedom. Regarding the negative and significant coefficients onfinancial freedom variable, it is a result that initially causes a puzzle but does not contradict expectations.I am expecting that countries with higher levels of financial freedom would enjoy higher growth rates.Nevertheless, the sample period includes a financial crises time span, which affected more sharplycountries with higher levels of financial freedom and more developed systems. Sure, other factorscaused these countries (i.e. US, EU) to have lower growth rates too. This is why I do not consider the re-sult as surprising in this particular context. More importantly, the result does not contradict my expec-tations given the main independent variable does not capture financial freedom.
Reasonably, countries of more political stability, rule of law, and control of corruption need lessbusiness regulatory reforms, as also exhibited in Table 3. The largest impact on the estimated coeffi-cient of Reform occurs when I control for corruption. It decreases from 0.150 (column1) to 0.114 (sig-nificant at the 1% level) due to the control of corruption (column 10). Importantly, the estimatedcoefficient value of Reform holds in terms of economic magnitude and remains statistically significantafter controlling for each of the above economic variables.
In sum, growth is associated with micro-economic reforms, and this association remains strongwhen I control for various measures of institutional quality and economic variables. One concern withthe results discussed above could be statistical significance. That is, while the magnitude of the esti-mated coefficient of Reform is not much affected by the various controls, its statistical significance levelgoes down to from 1% to 5% once I control for population, trade, and corruption. Does this mean that theresults for the Growth–Reform relationship are somewhat weak? It is not necessarily the case because a5% significance level is not necessarily weak. The next section shows that the results hold even after Iallow a lagged impact of reform on growth. Hence, the stated weakness appears to be due to a specifi-cation bias. This matter makes the focus on the lagged impact much more important.
5. Robustness
I repeat the regression exercise using lagged reforms as well as country fixed effects estimators. Therelationship between reforms and growth holds (Table 5). Unlike above, it is stronger in economicmagnitude and still significant at the 5% and 10% levels when I control for FDI, population, and corrup-tion. Based on the estimated coefficients, one additional business regulatory reform in a given countryduring 2006–2008 is associated, on average, with a 0.18% increase in its economic growth during2009–2010.
Unlike other studies that do not go beyond whether a country reformed/not reformed or beyondcounting the regulatory reforms, I consider the timing of reforms at the country–year level for two rea-sons. First, the availability of sequential reform information at the country level allows me to controlfor idiosyncratic patterns in the economic growth variable at the country level. Then, I do not worryabout estimation bias due to unobserved controls that may drive differences in growth rates and areinvariant during the sample period. Second, it helps me to partial out unobserved non-varying heter-ogeneity. For example, the fixed effects estimators that I use are valid in cases where economies withless flexible regulatory frameworks intervene more in their markets via the channel of state ownedenterprises conditional on that such trends are time invariant.
Another worrisome zone is the co-movement of macroeconomic variables. If the timing of reformsis correlated with the business cycle, then the main regression in Table 5 will deliver biased coefficientestimates. And, in fact, such correlation can happen as output rates follow persistent, cyclical pro-cesses with substantial autocorrelation. One example can be when reforms take places during periodsof prosperity. Then, the macroeconomic indicators move downward with the business cycles, causingthe coefficients on reforms in Table 5 to be downward-biased. Another example can be when businessregulatory reforms are motivated by and implemented during periods of macroeconomics downturns.
J.I. Haidar / J. Japanese Int. Economies 26 (2012) 285–307 295
Then, as a result, improvements in the economic framework of a country are expected regardless ofwhether reforms have any impact, causing the coefficients on reforms in Table 5 to be upward-biased.
This section relates changes in economic growth rates to changes in lagged values of regulatory indi-cators and control variables, conditional on the dynamics of the macroeconomic process of economicgrowth. A central difficulty in measuring the impact of a specific business regulatory reform on eco-nomic growth is inability to capture all other simultaneous actions. A fixed-effects regression exploitingvariation within countries over time is capable of measuring impact of reform if the government actionsare distributed over time. But, there is an omitted variables problem in the case where policy makersimplement simultaneous reforms. For example, one government may improve the business regulatoryframework during the same period that it provides more loans to small and medium enterprises. For thisreason, specifically in order not to affiliate the impact of the unobserved policy (i.e. loans to SMEs in thiscase), I control for other institutional variables to address this potential problem.
Table 5 presents the robustness results. It includes total number of reforms and average data formain explanatory variables available for the period 2006–2008 as well as data on average growth ratesbetween 2009 and 2010. I regress average economic growth on lagged reforms. The results for eco-nomic growth rates in all columns hold positive and statistically significant and validate the main re-sults in Table 4. Without any other controls, on average, each additional reform during 2006–2008 isassociated with a 0.182% increase in economic growth during 2009–2010 (column 1, Table 5). I con-trolled for all the variables reported in Table 4 simultaneously. The relationship between growth andreform remains robust to all these checks.
The hypothesis that I propose in the introduction – that business regulatory reforms have a positiveimpact on economic growth – cannot be rejected. The analysis shows that the p-values on businessregulatory reform coefficients are statistically significant at conventional levels, and the confidenceintervals widen substantially after including controls. I tried various ways to increase power by reduc-ing multi-collinearity – i.e. by measuring the impact of reforms in each separate business regulatoryarea as well as by dropping controls – but the positive impact of business regulatory reforms holds.
6. Conclusion
With business regulatory reforms expanding significantly within countries and are being used asbenchmark measures for success of policy makers, the link between the level of reforms and growthis receiving renewed interest. This study expands the previous literature based on anecdotal evidenceand case studies of countries by using new and improved data. The findings confirm that an expansionof micro-economic reforms is likely to increase growth.
This paper studies the impact of business regulatory reforms on economic growth rates over the per-iod 2006–2010. It uses cross-country differences in business regulatory reforms as well as variables thatcapture macroeconomic dynamics. The key empirical finding that we establish in this paper is: over theperiod 2006–2010, there is statistically significant evidence, across 172 countries, for economic growthresponse to business regulatory reforms. There is fairly robust evidence of positive impacts of regulatoryreforms and these estimated impacts are sizeable and plausibly large. Each additional reform during2006–2010 is associated, on average, with a 0.15% increase in economic growth.
In addition, the onset of the global economic crisis has led to a slump in global economic growth. How-ever, the extent to which economic growth has decreased differed among countries which reformed atleast one area during the 3 years that preceded the recent financial crisis to those which did not. Using aunique micro, business regulatory reforms data from the World Bank Doing Business project, this studysignals that reforms, which improved business and investment climate, may have helped to mitigate theeffects of the 2008 global slump in economic growth. Countries with more business regulatory reformsenjoyed higher economic growth rates. Further research can look at whether countries that reformedmore before the recent economic and financial crisis were less affected by the crisis.
Acknowledgments
The author would like to thank two anonymous referees and Takeo Hoshi for helpful commentsand discussions as well as DIMeco (Île-de-France) for financial support. Fatima Zaid Bassam provided
296 J.I. Haidar / J. Japanese Int. Economies 26 (2012) 285–307
inspiration. The findings, interpretations, and conclusions expressed in this paper are entirely those ofthe author. They do not necessarily represent the views of the International Bank for Reconstructionand Development/World Bank and its affiliated organizations, or those of the Executive Directors ofthe World Bank or the governments they represent.
Table A1Regression results – business entry.
(1) (2) (3) (4) (5) (6) (7) (8) (9) (10)
Dependent variable: Economic growth
Business entryregulatoryreforms
0.544⁄⁄⁄
0.491⁄⁄
0.520⁄⁄⁄
0.519⁄⁄⁄
0.512⁄⁄⁄
0.472⁄⁄⁄
0.445⁄⁄
0.448⁄⁄
0.452⁄⁄
0.394⁄⁄
[0.006] [0.012] [0.009] [0.008] [0.009] [0.009] [0.013] [0.015] [0.015] [0.037]Foreign direct
investment�0.037 �0.069 �0.072 �0.087 �0.047 �0.024 �0.027 �0.023 �0.022
[0.318] [0.149] [0.138] [0.152] [0.409] [0.672] [0.637] [0.692] [0.699]Fixed capital
formationgrowth
0.151⁄⁄⁄
0.149⁄⁄⁄
0.151⁄⁄⁄
0.123⁄⁄⁄
0.105⁄⁄⁄
0.105⁄⁄⁄
0.113⁄⁄⁄
0.116⁄⁄⁄
[0.000] [0.000] [0.000] [0.000] [0.000] [0.000] [0.000] [0.000]Population 0.000 0.000 0.000 �0.000 �0.000 �0.000 �0.000
[0.399] [0.389] [0.616] [0.770] [0.615] [0.583] [0.536]Trade 0.003 0.004 0.005 0.005 0.005 0.005
[0.677] [0.519] [0.349] [0.382] [0.382] [0.443]Government
spending0.049
⁄⁄⁄0.043
⁄⁄⁄0.040
⁄⁄⁄0.044
⁄⁄⁄0.040
⁄⁄⁄
[0.000] [0.000] [0.003] [0.002] [0.005]Financial
freedom�0.036
⁄⁄ �0.033⁄⁄ �0.043
⁄⁄ �0.043⁄⁄
[0.015] [0.035] [0.021] [0.019]Political stability �0.176 �0.425 �0.479
[0.611] [0.317] [0.256]Rule of law 0.506 2.265
⁄⁄
[0.309] [0.037]Control of
corruption�1.758
⁄
[0.068]Initial income per capita �0.513
[0.392]Initial ease of business regulations �0.526
[0.274]East Asia and Pacific 0.791
⁄
[0.097]Europe and Central Asia 0.372
[0.538]OECD �1.565
[0.219]Middle East and North Africa 0.213
[0.145]Latin America and Carribean 0.837
[0.336]South Asia 0.947
[0.812]
Observations 172 166 117 117 117 116 116 113 113 113R-squared 0.043 0.044 0.262 0.303 0.306 0.420 0.447 0.443 0.444 0.455
p-Values in brackets. All standard errors used are Huber–White robust and clustered on the country. All regressions use aconstant term (not shown).*** Significance level is 1% or less.** Significance level is 5% or less.* Significance level is 10% or less.

J.I. Haidar / J. Japanese Int. Economies 26 (2012) 285–307 297
Appendix A
See Tables A1–A10.
Table A2Regression results – construction licenses.
(1) (2) (3) (4) (5) (6) (7) (8) (9) (10)
Dependent variable:Economic growth
Construction licensesregulatory reforms
0.225⁄⁄⁄
0.114⁄⁄⁄
0.211⁄⁄⁄
0.226⁄⁄⁄
0.113⁄⁄⁄
0.146⁄⁄
0.122⁄⁄
0.093⁄
0.066⁄⁄
0.117⁄⁄
[0.007] [0.005] [0.009] [0.009] [0.009] [0.026] [0.049] [0.073] [0.038] [0.046]Foreign direct investment �0.038 �0.065 �0.066 �0.085 �0.041 �0.016 �0.019 �0.015 �0.016
[0.314] [0.193] [0.188] [0.173] [0.486] [0.783] [0.747] [0.797] [0.786]Fixed capital formation
growth0.158
⁄⁄⁄0.158
⁄⁄⁄0.160
⁄⁄⁄0.129
⁄⁄⁄0.108
⁄⁄⁄0.107
⁄⁄⁄0.114
⁄⁄⁄0.118
⁄⁄⁄
[0.000] [0.000] [0.000] [0.000] [0.000] [0.000] [0.000] [0.000]Population 0.000 0.000 0.000 �0.000 �0.000 �0.000 �0.000
[0.672] [0.652] [0.905] [0.487] [0.449] [0.427] [0.400]Trade 0.003 0.004 0.006 0.006 0.006 0.005
[0.602] [0.470] [0.305] [0.312] [0.315] [0.386]Government spending 0.052
⁄⁄⁄0.046
⁄⁄⁄0.041
⁄⁄⁄0.045
⁄⁄⁄0.038
⁄⁄⁄
[0.000] [0.000] [0.003] [0.002] [0.008]Financial freedom �0.040
⁄⁄⁄ �0.036⁄⁄ �0.045
⁄⁄ �0.044⁄⁄
[0.008] [0.024] [0.020] [0.020]Political stability �0.267 �0.472 �0.538
[0.461] [0.281] [0.211]Rule of law 0.429 2.615
⁄⁄
[0.403] [0.017]Control of corruption �2.183
⁄⁄
[0.023]Initial income per capita �0.624
[0.437]Initial ease of business
regulations�0.229
[0.115]East Asia and Pacific 0.903
⁄
[0.097]Europe and Central Asia 0.343
[0.736]OECD �1.359
[0.318]Middle East and North
Africa0.235
[0.209]Latin America and
Carribean0.896
[0.328]South Asia 0.786
[0.848]
Observations 172 166 117 117 117 116 116 113 113 113R-squared 0.005 0.008 0.217 0.218 0.220 0.350 0.391 0.389 0.393 0.423
p-Values in brackets. All standard errors used are Huber–White robust and clustered on the country. All regressions use aconstant term (not shown).*** Significance level is 1% or less.** Significance level is 5% or less.* Significance level is 10% or less.
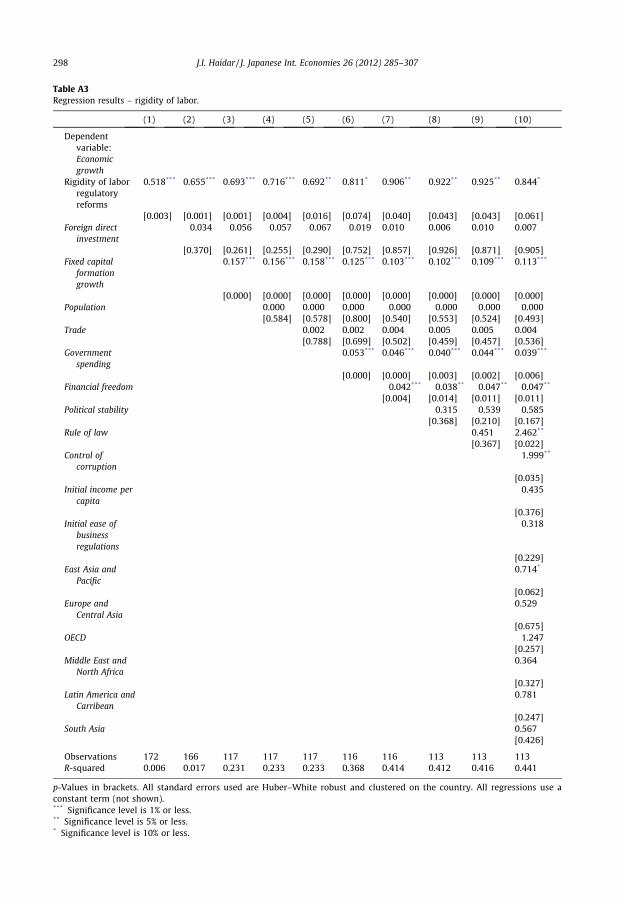
Table A3Regression results – rigidity of labor.
(1) (2) (3) (4) (5) (6) (7) (8) (9) (10)
Dependentvariable:Economicgrowth
Rigidity of laborregulatoryreforms
0.518*** 0.655*** 0.693*** 0.716*** 0.692** 0.811* 0.906** 0.922** 0.925** 0.844*
[0.003] [0.001] [0.001] [0.004] [0.016] [0.074] [0.040] [0.043] [0.043] [0.061]Foreign direct
investment�0.034 �0.056 �0.057 �0.067 �0.019 0.010 0.006 0.010 0.007
[0.370] [0.261] [0.255] [0.290] [0.752] [0.857] [0.926] [0.871] [0.905]Fixed capital
formationgrowth
0.157*** 0.156*** 0.158*** 0.125*** 0.103*** 0.102*** 0.109*** 0.113***
[0.000] [0.000] [0.000] [0.000] [0.000] [0.000] [0.000] [0.000]Population 0.000 0.000 0.000 �0.000 �0.000 �0.000 �0.000
[0.584] [0.578] [0.800] [0.540] [0.553] [0.524] [0.493]Trade 0.002 0.002 0.004 0.005 0.005 0.004
[0.788] [0.699] [0.502] [0.459] [0.457] [0.536]Government
spending0.053*** 0.046*** 0.040*** 0.044*** 0.039***
[0.000] [0.000] [0.003] [0.002] [0.006]Financial freedom �0.042*** �0.038** �0.047** �0.047**
[0.004] [0.014] [0.011] [0.011]Political stability �0.315 �0.539 �0.585
[0.368] [0.210] [0.167]Rule of law 0.451 2.462**
[0.367] [0.022]Control of
corruption�1.999**
[0.035]Initial income per
capita�0.435
[0.376]Initial ease of
businessregulations
�0.318
[0.229]East Asia and
Pacific0.714*
[0.062]Europe and
Central Asia0.529
[0.675]OECD �1.247
[0.257]Middle East and
North Africa0.364
[0.327]Latin America and
Carribean0.781
[0.247]South Asia 0.567
[0.426]
Observations 172 166 117 117 117 116 116 113 113 113R-squared 0.006 0.017 0.231 0.233 0.233 0.368 0.414 0.412 0.416 0.441
p-Values in brackets. All standard errors used are Huber–White robust and clustered on the country. All regressions use aconstant term (not shown).*** Significance level is 1% or less.** Significance level is 5% or less.* Significance level is 10% or less.
298 J.I. Haidar / J. Japanese Int. Economies 26 (2012) 285–307
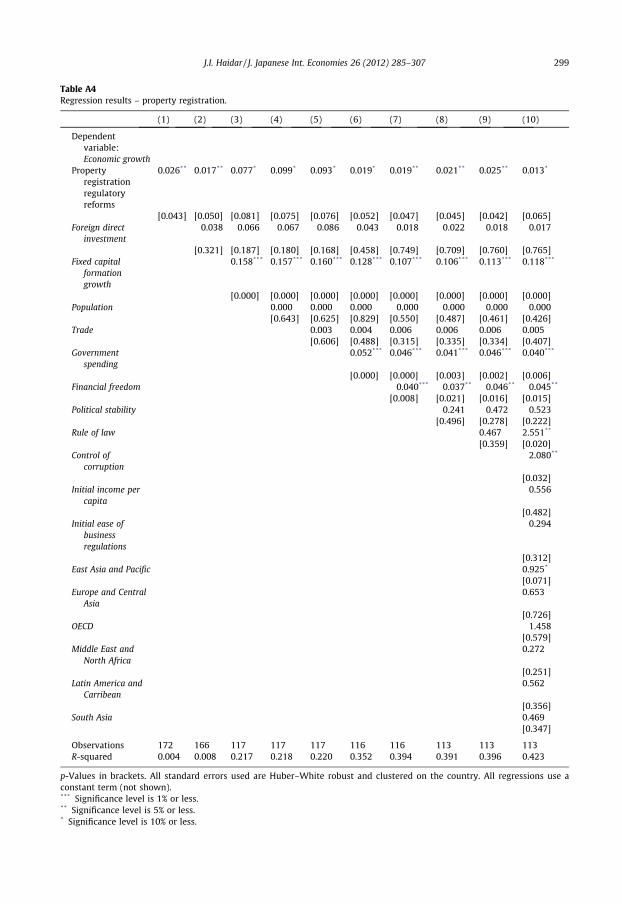
Table A4Regression results – property registration.
(1) (2) (3) (4) (5) (6) (7) (8) (9) (10)
Dependentvariable:Economic growth
Propertyregistrationregulatoryreforms
0.026** 0.017** 0.077* 0.099* 0.093* 0.019* 0.019** 0.021** 0.025** 0.013*
[0.043] [0.050] [0.081] [0.075] [0.076] [0.052] [0.047] [0.045] [0.042] [0.065]Foreign direct
investment�0.038 �0.066 �0.067 �0.086 �0.043 �0.018 �0.022 �0.018 �0.017
[0.321] [0.187] [0.180] [0.168] [0.458] [0.749] [0.709] [0.760] [0.765]Fixed capital
formationgrowth
0.158*** 0.157*** 0.160*** 0.128*** 0.107*** 0.106*** 0.113*** 0.118***
[0.000] [0.000] [0.000] [0.000] [0.000] [0.000] [0.000] [0.000]Population 0.000 0.000 0.000 �0.000 �0.000 �0.000 �0.000
[0.643] [0.625] [0.829] [0.550] [0.487] [0.461] [0.426]Trade 0.003 0.004 0.006 0.006 0.006 0.005
[0.606] [0.488] [0.315] [0.335] [0.334] [0.407]Government
spending0.052*** 0.046*** 0.041*** 0.046*** 0.040***
[0.000] [0.000] [0.003] [0.002] [0.006]Financial freedom �0.040*** �0.037** �0.046** �0.045**
[0.008] [0.021] [0.016] [0.015]Political stability �0.241 �0.472 �0.523
[0.496] [0.278] [0.222]Rule of law 0.467 2.551**
[0.359] [0.020]Control of
corruption�2.080**
[0.032]Initial income per
capita�0.556
[0.482]Initial ease of
businessregulations
�0.294
[0.312]East Asia and Pacific 0.925*
[0.071]Europe and Central
Asia0.653
[0.726]OECD �1.458
[0.579]Middle East and
North Africa0.272
[0.251]Latin America and
Carribean0.562
[0.356]South Asia 0.469
[0.347]
Observations 172 166 117 117 117 116 116 113 113 113R-squared 0.004 0.008 0.217 0.218 0.220 0.352 0.394 0.391 0.396 0.423
p-Values in brackets. All standard errors used are Huber–White robust and clustered on the country. All regressions use aconstant term (not shown).*** Significance level is 1% or less.** Significance level is 5% or less.* Significance level is 10% or less.
J.I. Haidar / J. Japanese Int. Economies 26 (2012) 285–307 299
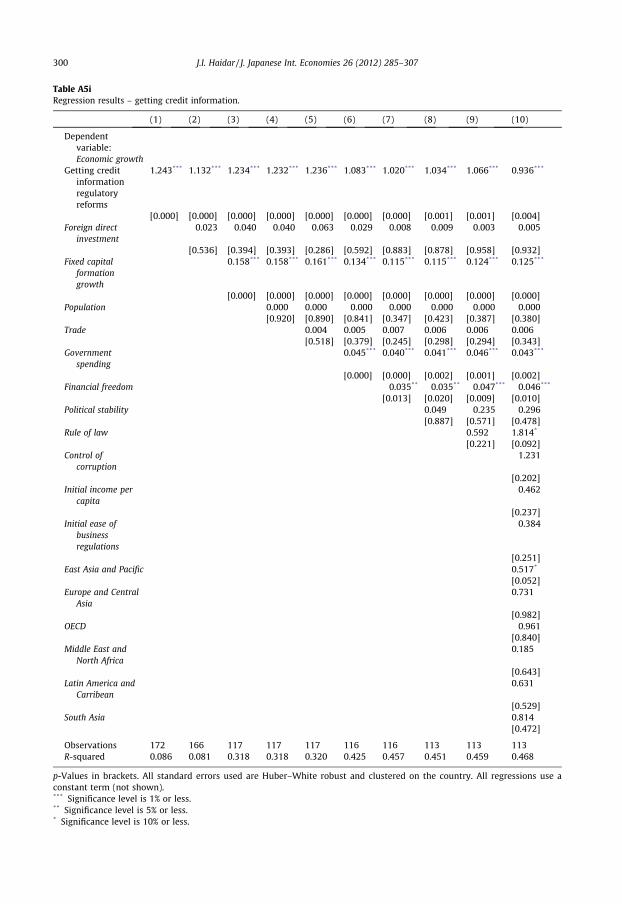
Table A5iRegression results – getting credit information.
(1) (2) (3) (4) (5) (6) (7) (8) (9) (10)
Dependentvariable:Economic growth
Getting creditinformationregulatoryreforms
1.243*** 1.132*** 1.234*** 1.232*** 1.236*** 1.083*** 1.020*** 1.034*** 1.066*** 0.936***
[0.000] [0.000] [0.000] [0.000] [0.000] [0.000] [0.000] [0.001] [0.001] [0.004]Foreign direct
investment�0.023 �0.040 �0.040 �0.063 �0.029 �0.008 �0.009 �0.003 �0.005
[0.536] [0.394] [0.393] [0.286] [0.592] [0.883] [0.878] [0.958] [0.932]Fixed capital
formationgrowth
0.158*** 0.158*** 0.161*** 0.134*** 0.115*** 0.115*** 0.124*** 0.125***
[0.000] [0.000] [0.000] [0.000] [0.000] [0.000] [0.000] [0.000]Population 0.000 0.000 �0.000 �0.000 �0.000 �0.000 �0.000
[0.920] [0.890] [0.841] [0.347] [0.423] [0.387] [0.380]Trade 0.004 0.005 0.007 0.006 0.006 0.006
[0.518] [0.379] [0.245] [0.298] [0.294] [0.343]Government
spending0.045*** 0.040*** 0.041*** 0.046*** 0.043***
[0.000] [0.000] [0.002] [0.001] [0.002]Financial freedom �0.035** �0.035** �0.047*** �0.046***
[0.013] [0.020] [0.009] [0.010]Political stability 0.049 �0.235 �0.296
[0.887] [0.571] [0.478]Rule of law 0.592 1.814*
[0.221] [0.092]Control of
corruption�1.231
[0.202]Initial income per
capita�0.462
[0.237]Initial ease of
businessregulations
�0.384
[0.251]East Asia and Pacific 0.517*
[0.052]Europe and Central
Asia0.731
[0.982]OECD �0.961
[0.840]Middle East and
North Africa0.185
[0.643]Latin America and
Carribean0.631
[0.529]South Asia 0.814
[0.472]
Observations 172 166 117 117 117 116 116 113 113 113R-squared 0.086 0.081 0.318 0.318 0.320 0.425 0.457 0.451 0.459 0.468
p-Values in brackets. All standard errors used are Huber–White robust and clustered on the country. All regressions use aconstant term (not shown).*** Significance level is 1% or less.** Significance level is 5% or less.* Significance level is 10% or less.
300 J.I. Haidar / J. Japanese Int. Economies 26 (2012) 285–307

Table A5iiRegression results – getting credit (legal rights).
(1) (2) (3) (4) (5) (6) (7) (8) (9) (10)
Dependentvariable:Economic growth
Getting credit(legal rights)regulatoryreforms
0.806* 0.866** 0.661 0.676 0.668 0.587 0.569 0.519 0.521 0.421
[0.051] [0.032] [0.128] [0.122] [0.128] [0.145] [0.146] [0.198] [0.197] [0.291]Foreign direct
investment�0.037 �0.065 �0.067 �0.084 �0.041 �0.016 �0.019 �0.015 �0.016
[0.320] [0.182] [0.176] [0.174] [0.477] [0.773] [0.743] [0.795] [0.785]Fixed capital
formationgrowth
0.155*** 0.154*** 0.156*** 0.126*** 0.106*** 0.105*** 0.112*** 0.116***
[0.000] [0.000] [0.000] [0.000] [0.000] [0.000] [0.000] [0.000]Population 0.000 0.000 0.000 �0.000 �0.000 �0.000 �0.000
[0.598] [0.581] [0.828] [0.546] [0.529] [0.502] [0.466]Trade 0.003 0.004 0.006 0.006 0.006 0.005
[0.640] [0.507] [0.330] [0.345] [0.344] [0.418]Government
spending0.051*** 0.045*** 0.041*** 0.045*** 0.040***
[0.000] [0.000] [0.003] [0.002] [0.006]Financial freedom �0.040*** �0.037** �0.046** �0.045**
[0.008] [0.020] [0.015] [0.014]Political stability �0.190 �0.411 �0.475
[0.592] [0.344] [0.267]Rule of law 0.447 2.492**
[0.377] [0.022]Control of
corruption�2.032**
[0.035]Initial income per
capita�0.371
[0.358]Initial ease of
businessregulations
�0.274
[0.163]East Asia and Pacific 0.328*
[0.066]Europe and Central
Asia0.842
[0.751]OECD �0.862
[0.725]Middle East and
North Africa0.293
[0.724]Latin America and
Carribean0.542
[0.386]South Asia 0.651
[0.639]
Observations 172 166 117 117 117 116 116 113 113 113R-squared 0.022 0.034 0.232 0.234 0.236 0.362 0.403 0.398 0.402 0.428
p-Values in brackets. All standard errors used are Huber–White robust and clustered on the country. All regressions use aconstant term (not shown).*** Significance level is 1% or less.** Significance level is 5% or less.* Significance level is 10% or less.
J.I. Haidar / J. Japanese Int. Economies 26 (2012) 285–307 301
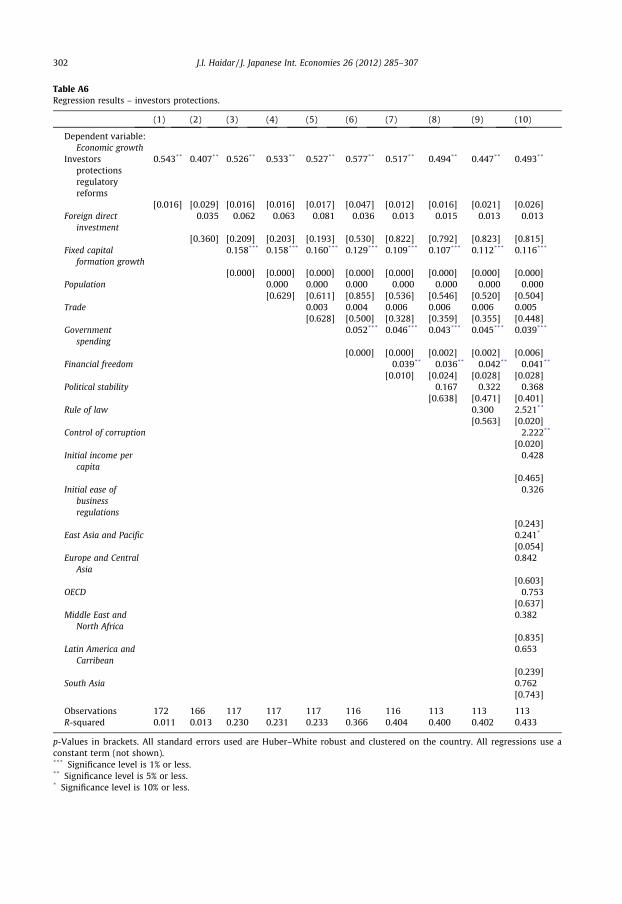
Table A6Regression results – investors protections.
(1) (2) (3) (4) (5) (6) (7) (8) (9) (10)
Dependent variable:Economic growth
Investorsprotectionsregulatoryreforms
0.543** 0.407** 0.526** 0.533** 0.527** 0.577** 0.517** 0.494** 0.447** 0.493**
[0.016] [0.029] [0.016] [0.016] [0.017] [0.047] [0.012] [0.016] [0.021] [0.026]Foreign direct
investment�0.035 �0.062 �0.063 �0.081 �0.036 �0.013 �0.015 �0.013 �0.013
[0.360] [0.209] [0.203] [0.193] [0.530] [0.822] [0.792] [0.823] [0.815]Fixed capital
formation growth0.158*** 0.158*** 0.160*** 0.129*** 0.109*** 0.107*** 0.112*** 0.116***
[0.000] [0.000] [0.000] [0.000] [0.000] [0.000] [0.000] [0.000]Population 0.000 0.000 0.000 �0.000 �0.000 �0.000 �0.000
[0.629] [0.611] [0.855] [0.536] [0.546] [0.520] [0.504]Trade 0.003 0.004 0.006 0.006 0.006 0.005
[0.628] [0.500] [0.328] [0.359] [0.355] [0.448]Government
spending0.052*** 0.046*** 0.043*** 0.045*** 0.039***
[0.000] [0.000] [0.002] [0.002] [0.006]Financial freedom �0.039** �0.036** �0.042** �0.041**
[0.010] [0.024] [0.028] [0.028]Political stability �0.167 �0.322 �0.368
[0.638] [0.471] [0.401]Rule of law 0.300 2.521**
[0.563] [0.020]Control of corruption �2.222**
[0.020]Initial income per
capita�0.428
[0.465]Initial ease of
businessregulations
�0.326
[0.243]East Asia and Pacific 0.241*
[0.054]Europe and Central
Asia0.842
[0.603]OECD �0.753
[0.637]Middle East and
North Africa0.382
[0.835]Latin America and
Carribean0.653
[0.239]South Asia 0.762
[0.743]
Observations 172 166 117 117 117 116 116 113 113 113R-squared 0.011 0.013 0.230 0.231 0.233 0.366 0.404 0.400 0.402 0.433
p-Values in brackets. All standard errors used are Huber–White robust and clustered on the country. All regressions use aconstant term (not shown).*** Significance level is 1% or less.** Significance level is 5% or less.* Significance level is 10% or less.
302 J.I. Haidar / J. Japanese Int. Economies 26 (2012) 285–307

Table A7Regression results – tax payments.
(1) (2) (3) (4) (5) (6) (7) (8) (9) (10)
Dependent variable:Economic growth
Tax paymentsregulatoryreforms
0.130* 0.126* 0.131* 0.138* 0.138* 0.138** 0.139* 0.125* 0.119* 0.129*
[0.076] [0.082] [0.074] [0.055] [0.076] [0.082] [0.053] [0.064] [0.079] [0.092]Foreign direct
investment�0.043 �0.074 �0.076 �0.090 �0.044 �0.021 �0.023 �0.020 �0.019
[0.259] [0.136] [0.128] [0.146] [0.441] [0.718] [0.690] [0.738] [0.742]Fixed capital
formation growth0.157*** 0.156*** 0.158*** 0.125*** 0.107*** 0.105*** 0.111*** 0.116***
[0.000] [0.000] [0.000] [0.000] [0.000] [0.000] [0.000] [0.000]Population 0.000 0.000 0.000 �0.000 �0.000 �0.000 �0.000
[0.542] [0.532] [0.718] [0.656] [0.631] [0.598] [0.535]Trade 0.003 0.003 0.005 0.005 0.005 0.004
[0.696] [0.605] [0.402] [0.451] [0.446] [0.500]Government
spending0.054*** 0.047*** 0.045*** 0.048*** 0.042***
[0.000] [0.000] [0.001] [0.001] [0.004]Financial freedom �0.037** �0.034** �0.042** �0.042**
[0.014] [0.032] [0.026] [0.023]Political stability �0.166 �0.368 �0.445
[0.641] [0.400] [0.304]Rule of law 0.405 2.421**
[0.424] [0.028]Control of corruption �1.993**
[0.039]Initial income per
capita�0.317
[0.354]Initial ease of
businessregulations
�0.437
[0.354]East Asia and Pacific 0.352*
[0.082]Europe and Central
Asia0.731
[0.502]OECD �0.862
[0.728]Middle East and
North Africa0.174
[0.946]Latin America and
Carribean0.742
[0.348]South Asia 0.651
[0.632]
Observations 172 166 117 117 117 116 116 113 113 113R-squared 0.011 0.015 0.229 0.232 0.233 0.367 0.402 0.399 0.403 0.428
p-Values in brackets. All standard errors used are Huber–White robust and clustered on the country. All regressions use aconstant term (not shown).*** Significance level is 1% or less.** Significance level is 5% or less.* Significance level is 10% or less.
J.I. Haidar / J. Japanese Int. Economies 26 (2012) 285–307 303

Table A8Regression results – importing/exporting.
(1) (2) (3) (4) (5) (6) (7) (8) (9) (10)
Dependentvariable:Economic growth
Trading acrossbordersregulatoryreforms
0.881*** 0.786*** 0.698** 0.693** 0.711** 0.452* 0.438* 0.428* 0.433* 0.344*
[0.000] [0.002] [0.011] [0.012] [0.010] [0.085] [0.087] [0.096] [0.092] [0.093]Foreign direct
investment�0.028 �0.048 �0.049 �0.077 �0.040 �0.016 �0.018 �0.014 �0.015
[0.452] [0.318] [0.314] [0.208] [0.482] [0.779] [0.754] [0.809] [0.797]Fixed capital
formationgrowth
0.137*** 0.137*** 0.140*** 0.119*** 0.099*** 0.099*** 0.106*** 0.111***
[0.000] [0.000] [0.000] [0.000] [0.001] [0.001] [0.001] [0.000]Population 0.000 0.000 0.000 �0.000 �0.000 �0.000 �0.000
[0.802] [0.771] [0.981] [0.431] [0.390] [0.365] [0.358]Trade 0.005 0.005 0.007 0.007 0.007 0.006
[0.446] [0.380] [0.236] [0.277] [0.275] [0.352]Government
spending0.047*** 0.041*** 0.038*** 0.042*** 0.038***
[0.000] [0.001] [0.005] [0.003] [0.009]Financial freedom �0.040*** �0.037** �0.046** �0.045**
[0.008] [0.019] [0.014] [0.014]Political stability �0.145 �0.373 �0.443
[0.684] [0.390] [0.302]Rule of law 0.463 2.411**
[0.358] [0.027]Control of
corruption�1.939**
[0.044]Initial income per
capita�0.667
[0.593]Initial ease of
businessregulations
�0.183
[0.401]East Asia and Pacific 0.836*
[0.084]Europe and Central
Asia0.548
[0.837]OECD �1.569
[0.680]Middle East and
North Africa0.383
[0.362]Latin America and
Carribean0.673
[0.467]South Asia 0.57
[0.458]
Observations 172 166 117 117 117 116 116 113 113 113R-squared 0.070 0.066 0.261 0.261 0.265 0.367 0.407 0.403 0.408 0.431
p-Values in brackets. All standard errors used are Huber–White robust and clustered on the country. All regressions use aconstant term (not shown).*** Significance level is 1% or less.** Significance level is 5% or less.* Significance level is 10% or less.
304 J.I. Haidar / J. Japanese Int. Economies 26 (2012) 285–307
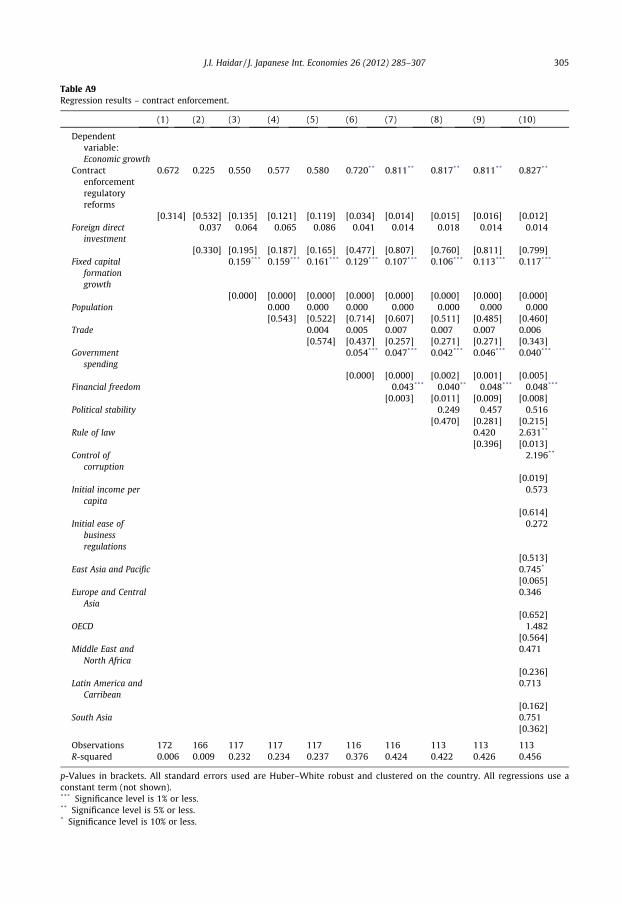
Table A9Regression results – contract enforcement.
(1) (2) (3) (4) (5) (6) (7) (8) (9) (10)
Dependentvariable:Economic growth
Contractenforcementregulatoryreforms
0.672 0.225 0.550 0.577 0.580 0.720** 0.811** 0.817** 0.811** 0.827**
[0.314] [0.532] [0.135] [0.121] [0.119] [0.034] [0.014] [0.015] [0.016] [0.012]Foreign direct
investment�0.037 �0.064 �0.065 �0.086 �0.041 �0.014 �0.018 �0.014 �0.014
[0.330] [0.195] [0.187] [0.165] [0.477] [0.807] [0.760] [0.811] [0.799]Fixed capital
formationgrowth
0.159*** 0.159*** 0.161*** 0.129*** 0.107*** 0.106*** 0.113*** 0.117***
[0.000] [0.000] [0.000] [0.000] [0.000] [0.000] [0.000] [0.000]Population 0.000 0.000 0.000 �0.000 �0.000 �0.000 �0.000
[0.543] [0.522] [0.714] [0.607] [0.511] [0.485] [0.460]Trade 0.004 0.005 0.007 0.007 0.007 0.006
[0.574] [0.437] [0.257] [0.271] [0.271] [0.343]Government
spending0.054*** 0.047*** 0.042*** 0.046*** 0.040***
[0.000] [0.000] [0.002] [0.001] [0.005]Financial freedom �0.043*** �0.040** �0.048*** �0.048***
[0.003] [0.011] [0.009] [0.008]Political stability �0.249 �0.457 �0.516
[0.470] [0.281] [0.215]Rule of law 0.420 2.631**
[0.396] [0.013]Control of
corruption�2.196**
[0.019]Initial income per
capita�0.573
[0.614]Initial ease of
businessregulations
�0.272
[0.513]East Asia and Pacific 0.745*
[0.065]Europe and Central
Asia0.346
[0.652]OECD �1.482
[0.564]Middle East and
North Africa0.471
[0.236]Latin America and
Carribean0.713
[0.162]South Asia 0.751
[0.362]
Observations 172 166 117 117 117 116 116 113 113 113R-squared 0.006 0.009 0.232 0.234 0.237 0.376 0.424 0.422 0.426 0.456
p-Values in brackets. All standard errors used are Huber–White robust and clustered on the country. All regressions use aconstant term (not shown).*** Significance level is 1% or less.** Significance level is 5% or less.* Significance level is 10% or less.
J.I. Haidar / J. Japanese Int. Economies 26 (2012) 285–307 305

Table A10Regression results – bankruptcy.
(1) (2) (3) (4) (5) (6) (7) (8) (9) (10)
Dependentvariable:Economicgrowth
Bankruptcyregulatoryreforms
�0.723** �0.816** �0.838** �0.833** �0.824** �0.374 �0.250 �0.265 �0.266 �0.610*
[0.044] [0.020] [0.018] [0.019] [0.021] [0.280] [0.463] [0.447] [0.446] [0.092]Foreign direct
investment�0.045 �0.056 �0.057 �0.072 �0.038 �0.015 �0.018 �0.014 �0.014
[0.235] [0.244] [0.240] [0.243] [0.511] [0.792] [0.758] [0.810] [0.814]Fixed capital
formationgrowth
0.152*** 0.152*** 0.153*** 0.128*** 0.109*** 0.107*** 0.114*** 0.119***
[0.000] [0.000] [0.000] [0.000] [0.000] [0.000] [0.000] [0.000]Population 0.000 0.000 0.000 �0.000 �0.000 �0.000 �0.000
[0.745] [0.728] [0.928] [0.493] [0.483] [0.457] [0.457]Trade 0.002 0.004 0.006 0.006 0.006 0.004
[0.698] [0.524] [0.338] [0.353] [0.352] [0.508]Government
spending0.048*** 0.043*** 0.038*** 0.042*** 0.031**
[0.000] [0.000] [0.007] [0.005] [0.036]Financial freedom �0.039** �0.035** �0.044** �0.041**
[0.011] [0.030] [0.022] [0.027]Political stability �0.255 �0.476 �0.567
[0.471] [0.275] [0.181]Rule of law 0.445 3.205***
[0.381] [0.005]Control of
corruption�2.740***
[0.007]Initial income per
capita�0.673
[0.481]Initial ease of
businessregulations
�0.294
[0.512]East Asia and Pacific 0.725*
[0.073]Europe and Central
Asia0.659
[0.726]OECD �1.458
[0.571]Middle East and
North Africa0.272
[0.471]Latin America and
Carribean0.581
[0.356]South Asia 0.681
[0.568]
Observations 172 166 117 117 117 116 116 113 113 113R-squared 0.024 0.039 0.254 0.255 0.256 0.356 0.394 0.391 0.396 0.438
p-Values in brackets. All standard errors used are Huber–White robust and clustered on the country. All regressions use aconstant term (not shown).*** Significance level is 1% or less.** Significance level is 5% or less.* Significance level is 10% or less.
306 J.I. Haidar / J. Japanese Int. Economies 26 (2012) 285–307
J.I. Haidar / J. Japanese Int. Economies 26 (2012) 285–307 307
References
Acemoglu, D., Johnson, S., Robinson, A., 2001. The colonial origins of comparative development: an empirical investigation.Amer. Econ. Rev. 91 (5), 1369–1401.
Amin, M., Haidar, J.I., 2011. Trade Facilitations and Country Size. World Bank, Mimeograph.Amin, M., Haidar, J.I., 2012. The cost of registering property: does legal origin matter? Empirical Econ. 42 (3), 1035–1050.Besley, T., Burgess, R., 2004. Can labor regulation hinder economic performance? Evidence from India. Quart. J. Econ. 119 (1),
91–134.Conway, P., Janod, V., Nicoletti, G., 2005. Product Market Regulation in OECD Countries, 1998 to 2003. Economics Department
Working Paper 419, OECD.Kaufmann, D., Kraay, A., Mastruzzi, M., 2009. Governance matters VIII: aggregate and individual governance indicators
1996–2008. Policy Research Working Paper Series 4978, The World Bank..Djankov, S., La Porta, R., Lopez-de-Silanes, F., Shleifer, A., 2002. The regulation of entry. Quart. J. Econ. 117 (1), 1–37.Djankov, S., La Porta, R., Lopez-de-Silanes, F., Shleifer, A., 2003. Courts. Quart. J. Econ. 118 (2), 453–517.Djankov, S., Botero, J., Porta, R., Lopez-De-Silanes, F.C., 2004. The regulation of labor. The Quarterly Journal of Economics 119 (4),
1339–1382.Djankov, S., McLiesh, C., Ramalho, R., 2006. Regulation and growth. Econ. Letters 92 (3), 395–401.Djankov, S., Freund, C., Pham, C., 2010. Trading on time. Rev. Econ. Statist. 92 (1), 166–173.Desai, M., Gompers, P., Lerner, J., 2003. Institutions, Capital Constraints and Entrepreneurial Firm Dynamics: Evidence from
Europe. NBER Working Paper 10165.Haidar, J.I., 2009. Investor protections and economic growth. Econ. Letters 103 (1), 1–4.Hall, R., Jones, C., 1999. Why do some countries produce so much more output per worker than others. Quart. J. Econ. 144 (1),
83–116.Hasan, R., Mitra, D., Ramaswamy, K.V., 2007. Trade reforms, labor regulations, and labor-demand elasticities: empirical evidence
from India. Rev. Econ. Statist. 89 (3), 466–481.Klapper, L., Laeven, L., Rajan, R., 2004. Business Environment and Firm Entry: Evidence from International Data, CEPR Discussion
Papers 4366.OECD, World Bank, 2006. Emerging Good Practice in Managing for Development Results.Scarpetta, S., Hemmings, P., Tressel, T., Woo, J., 2002. The Role of Policy and Institutions for Productivity and Firm Dynamics:
Evidence from Micro and Industry Data, Economics Department working paper 329, OECD.Viviano, E., 2008. Entry regulations and labour market outcomes: evidence from the Italian retail trade sector. Lab. Econ. 15 (6),
1200–1222.Winston, C., 1998. US industry adjustment to economic deregulation. J. Econ. Perspect. 12 (3), 89–110.World Bank Doing Business Database. <http://www.doingbusiness.org>.World Bank Doing Business 2004 Report.
Related Documents