White Paper The Impact of Biosimilar Competition in Europe December 2021 PER TROEIN, Vice President, Strategic Partners, IQVIA MAX NEWTON, Engagement Manager, Global Supplier & Association Relations, IQVIA KIRSTIE SCOTT, Consultant, Global Supplier & Association Relations, IQVIA CHRIS MULLIGAN, PHD, Consultant, Supplier Relations, IQVIA

Welcome message from author
This document is posted to help you gain knowledge. Please leave a comment to let me know what you think about it! Share it to your friends and learn new things together.
Transcript
White Paper
The Impact of Biosimilar Competition in Europe December 2021
PER TROEIN, Vice President, Strategic Partners, IQVIAMAX NEWTON, Engagement Manager, Global Supplier & Association Relations, IQVIAKIRSTIE SCOTT, Consultant, Global Supplier & Association Relations, IQVIACHRIS MULLIGAN, PHD, Consultant, Supplier Relations, IQVIA
Table of contentsIntroduction 1
Key observations 2
COVID-19: The pandemic has impacted certain segments of the biologic market 3
Savings: The savings from biosimilar competition reach an all-time high 5
Access: Development of access to biologic medicines remains challenging 6
Competition: The competitive environment in Europe is changing 8
Future: Ensuring preparedness for the future biosimilar opportunity 10
Methodology 12
Country and therapy area KPIs 14
Human growth hormone (HGH) 14
Epoetin (EPO) 16
Granulocyte-colony stimulating factor (GCSF) 18
Anti-tumour necrosis factor (ANTI-TNF) 20
Fertility (FOLLITROPIN ALFA) 22
Insulins 24
Oncology 26
Low-molecular-weight heparin (LMWH) 28
Parathyroid hormone (teriparatide) 30
Appendix 32
EMA list of approved biosimilars 32
List of Biosimilars under review by EMA 34
iqvia.com | 1
Introduction
The 7th iteration of the ‘Impact of Biosimilar Competition in Europe’ report describes the effects on price, volume, and market share following the arrival of biosimilar competition in Europe. The report consists of observations on competitive markets, and a set of Key Performance Indicators (KPIs) to monitor the impact of biosimilars in 23 European markets.
The report has been a long-standing source of information on the status of the biosimilars market. As the report adds new therapy areas, and as new classes emerge, we have new challenges that we must adapt to. This means that we continue to refine previous definitions to make them more suitable for the current environment. These updated definitions build on the 2020 iterations, and permit improved classification of new and historic dynamics within the market.
This report has been prepared by IQVIA at the request of the European Commission services with initial contributions on defining the KPIs from EFPIA, Medicines for Europe, and EuropaBio. The observations have been developed solely by IQVIA based on the data and analyses performed. The information and views set out in this report are those of its authors and are not to be attributed to, nor necessarily reflect
the views of the European Commission or any of its services. The European Medicines Agency (EMA) has a central role in setting the rules for biosimilar submissions, approving applications, establishing approved indications and monitoring adverse events, and if necessary, issuing safety warnings. We have, when appropriate, quoted their information and statements.
2 | The Impact of Biosimilar Competition in Europe
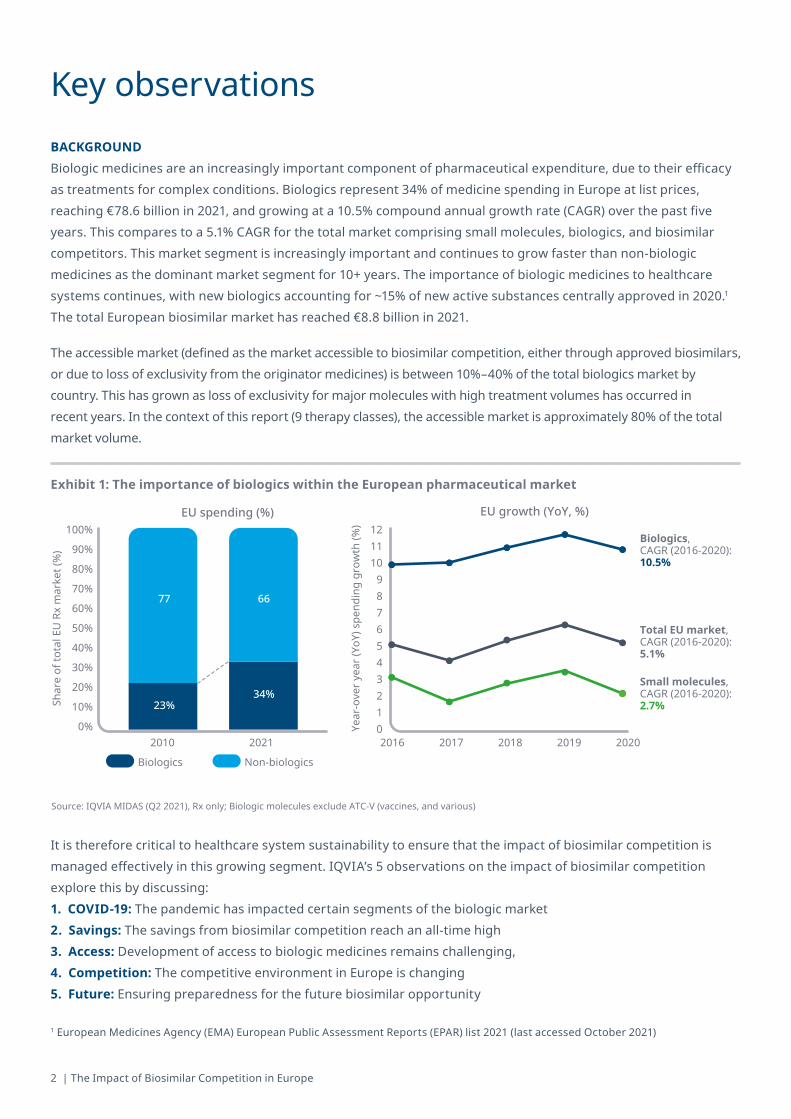
Key observationsBACKGROUND Biologic medicines are an increasingly important component of pharmaceutical expenditure, due to their efficacy as treatments for complex conditions. Biologics represent 34% of medicine spending in Europe at list prices, reaching €78.6 billion in 2021, and growing at a 10.5% compound annual growth rate (CAGR) over the past five years. This compares to a 5.1% CAGR for the total market comprising small molecules, biologics, and biosimilar competitors. This market segment is increasingly important and continues to grow faster than non-biologic medicines as the dominant market segment for 10+ years. The importance of biologic medicines to healthcare systems continues, with new biologics accounting for ~15% of new active substances centrally approved in 2020.1
The total European biosimilar market has reached €8.8 billion in 2021.
The accessible market (defined as the market accessible to biosimilar competition, either through approved biosimilars, or due to loss of exclusivity from the originator medicines) is between 10%–40% of the total biologics market by country. This has grown as loss of exclusivity for major molecules with high treatment volumes has occurred in recent years. In the context of this report (9 therapy classes), the accessible market is approximately 80% of the total market volume.
It is therefore critical to healthcare system sustainability to ensure that the impact of biosimilar competition is managed effectively in this growing segment. IQVIA’s 5 observations on the impact of biosimilar competition explore this by discussing:1. COVID-19: The pandemic has impacted certain segments of the biologic market2. Savings: The savings from biosimilar competition reach an all-time high3. Access: Development of access to biologic medicines remains challenging,4. Competition: The competitive environment in Europe is changing 5. Future: Ensuring preparedness for the future biosimilar opportunity
Exhibit 1: The importance of biologics within the European pharmaceutical market
1 European Medicines Agency (EMA) European Public Assessment Reports (EPAR) list 2021 (last accessed October 2021)
2010 2016 2017 2018 2019 20202021
77 66
23%34%
Biologics Non-biologics
Shar
e of
tota
l EU
Rx
mar
ket (
%)
100%
90%
80%
70%
60%
50%
40%
30%
20%
10%
0%
Biologics, CAGR (2016-2020): 10.5%
Total EU market, CAGR (2016-2020): 5.1%
Small molecules, CAGR (2016-2020): 2.7%
Year
-ove
r yea
r (Yo
Y) s
pend
ing
grow
th (%
) 121110
9876543210
EU spending (%) EU growth (YoY, %)
Source: IQVIA MIDAS (Q2 2021), Rx only; Biologic molecules exclude ATC-V (vaccines, and various)
iqvia.com | 3
1. COVID-19: THE PANDEMIC HAS IMPACTED CERTAIN SEGMENTS OF THE BIOLOGIC MARKET
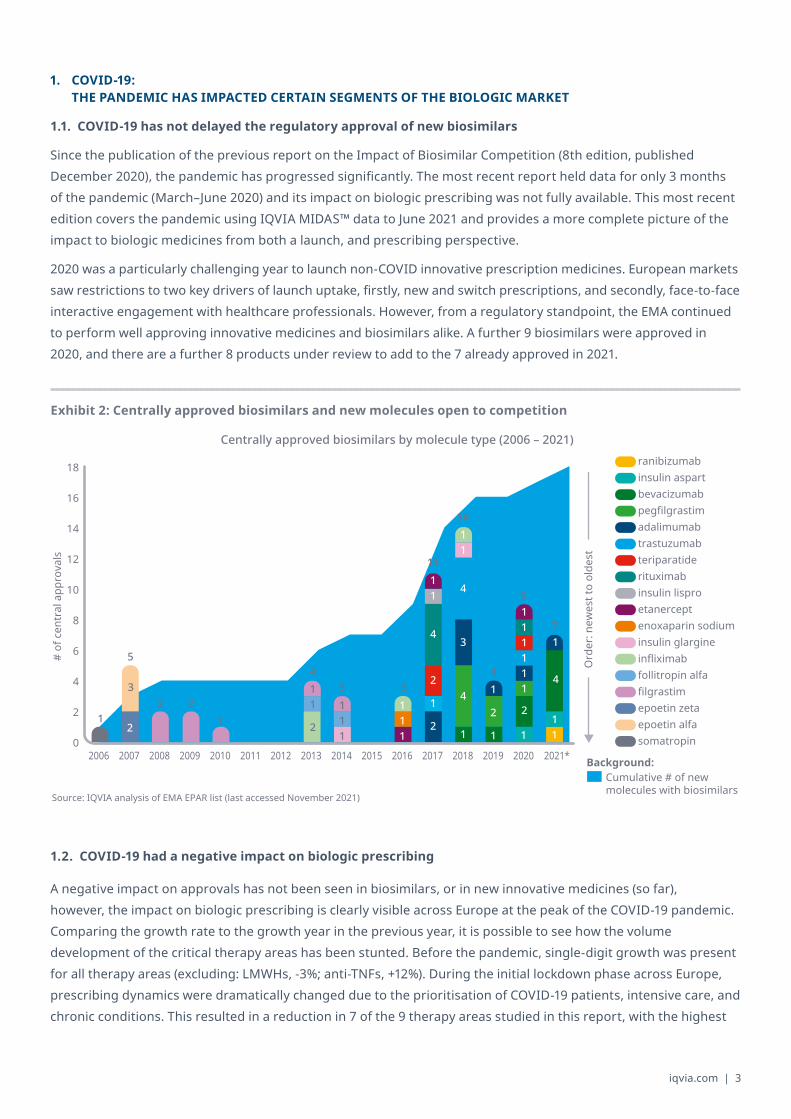
1.1. COVID-19 has not delayed the regulatory approval of new biosimilars
Since the publication of the previous report on the Impact of Biosimilar Competition (8th edition, published December 2020), the pandemic has progressed significantly. The most recent report held data for only 3 months of the pandemic (March–June 2020) and its impact on biologic prescribing was not fully available. This most recent edition covers the pandemic using IQVIA MIDAS™ data to June 2021 and provides a more complete picture of the impact to biologic medicines from both a launch, and prescribing perspective.
2020 was a particularly challenging year to launch non-COVID innovative prescription medicines. European markets saw restrictions to two key drivers of launch uptake, firstly, new and switch prescriptions, and secondly, face-to-face interactive engagement with healthcare professionals. However, from a regulatory standpoint, the EMA continued to perform well approving innovative medicines and biosimilars alike. A further 9 biosimilars were approved in 2020, and there are a further 8 products under review to add to the 7 already approved in 2021.
1.2. COVID-19 had a negative impact on biologic prescribing
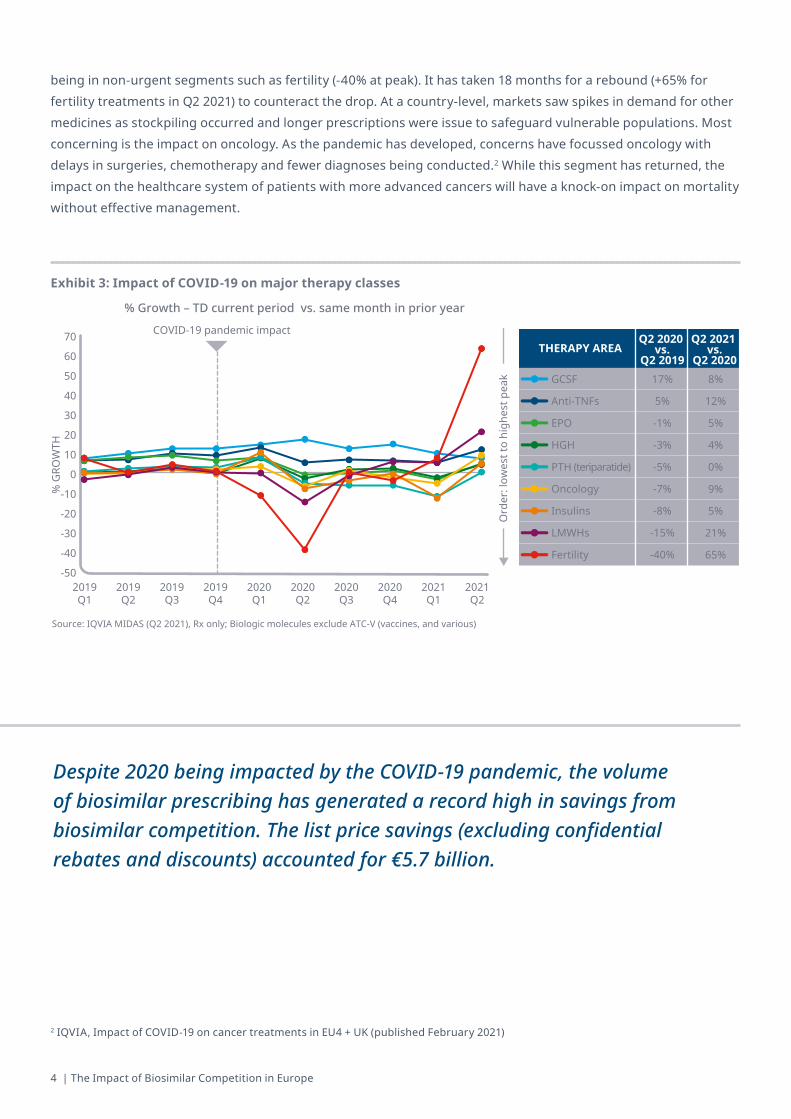
A negative impact on approvals has not been seen in biosimilars, or in new innovative medicines (so far), however, the impact on biologic prescribing is clearly visible across Europe at the peak of the COVID-19 pandemic. Comparing the growth rate to the growth year in the previous year, it is possible to see how the volume development of the critical therapy areas has been stunted. Before the pandemic, single-digit growth was present for all therapy areas (excluding: LMWHs, -3%; anti-TNFs, +12%). During the initial lockdown phase across Europe, prescribing dynamics were dramatically changed due to the prioritisation of COVID-19 patients, intensive care, and chronic conditions. This resulted in a reduction in 7 of the 9 therapy areas studied in this report, with the highest
Exhibit 2: Centrally approved biosimilars and new molecules open to competition
2006 2007 2008 2009 2010 2011 2012 2013 2014 2015 2016 2017 2018 2019 2020 2021*
# of
cen
tral
app
rova
ls
18
16
14
12
10
8
6
4
2
0
Centrally approved biosimilars by molecule type (2006 – 2021)
Source: IQVIA analysis of EMA EPAR list (last accessed November 2021)
Ord
er: n
ewes
t to
olde
st
Cumulative # of newmolecules with biosimilars
ranibizumab insulin aspart
adalimumab
epoetin zeta
pegfilgrastim
infliximab
bevacizumab
trastuzumab teriparatide
enoxaparin sodium
follitropin alfa
insulin lispro
filgrastim
insulin glargine
epoetin alfa
etanercept
somatropin
rituximab
Background:
1 2
2 2 1 2
1 1 2
1 1 1 1
3 1
1 1 1 4
2 2 1
1 1 1
2
3
1 1 4
4
4
1
1
1
1
1
1
1
1 1 1
11
7
4 5
43 3
14
9
4 | The Impact of Biosimilar Competition in Europe
being in non-urgent segments such as fertility (-40% at peak). It has taken 18 months for a rebound (+65% for fertility treatments in Q2 2021) to counteract the drop. At a country-level, markets saw spikes in demand for other medicines as stockpiling occurred and longer prescriptions were issue to safeguard vulnerable populations. Most concerning is the impact on oncology. As the pandemic has developed, concerns have focussed oncology with delays in surgeries, chemotherapy and fewer diagnoses being conducted.2 While this segment has returned, the impact on the healthcare system of patients with more advanced cancers will have a knock-on impact on mortality without effective management.
Exhibit 3: Impact of COVID-19 on major therapy classes
2 IQVIA, Impact of COVID-19 on cancer treatments in EU4 + UK (published February 2021)
2019Q1
2019Q2
2019Q3
2019Q4
2020Q1
2020Q2
2020Q3
2020Q4
2021Q1
2021Q2
% G
ROW
TH
70
60
50
40
30
20
10
0
-10
-20
-30
-40
-50
% Growth – TD current period vs. same month in prior year
COVID-19 pandemic impact
Source: IQVIA MIDAS (Q2 2021), Rx only; Biologic molecules exclude ATC-V (vaccines, and various)
Ord
er: l
owes
t to
high
est p
eak
THERAPY AREAQ2 2020
vs.Q2 2019
Q2 2021 vs.
Q2 202017%
5%
-1%
-3%
-5%
-7%
-8%
-15%
-40%
GCSF
Anti-TNFs
EPO
HGH
PTH (teriparatide)
Oncology
Insulins
LMWHs
Fertility
8%
12%
5%
4%
0%
9%
5%
21%
65%
Despite 2020 being impacted by the COVID-19 pandemic, the volume of biosimilar prescribing has generated a record high in savings from biosimilar competition. The list price savings (excluding confidential rebates and discounts) accounted for €5.7 billion.
iqvia.com | 5
2. SAVINGS: THE SAVINGS FROM BIOSIMILAR COMPETITION REACH AN ALL-TIME HIGH
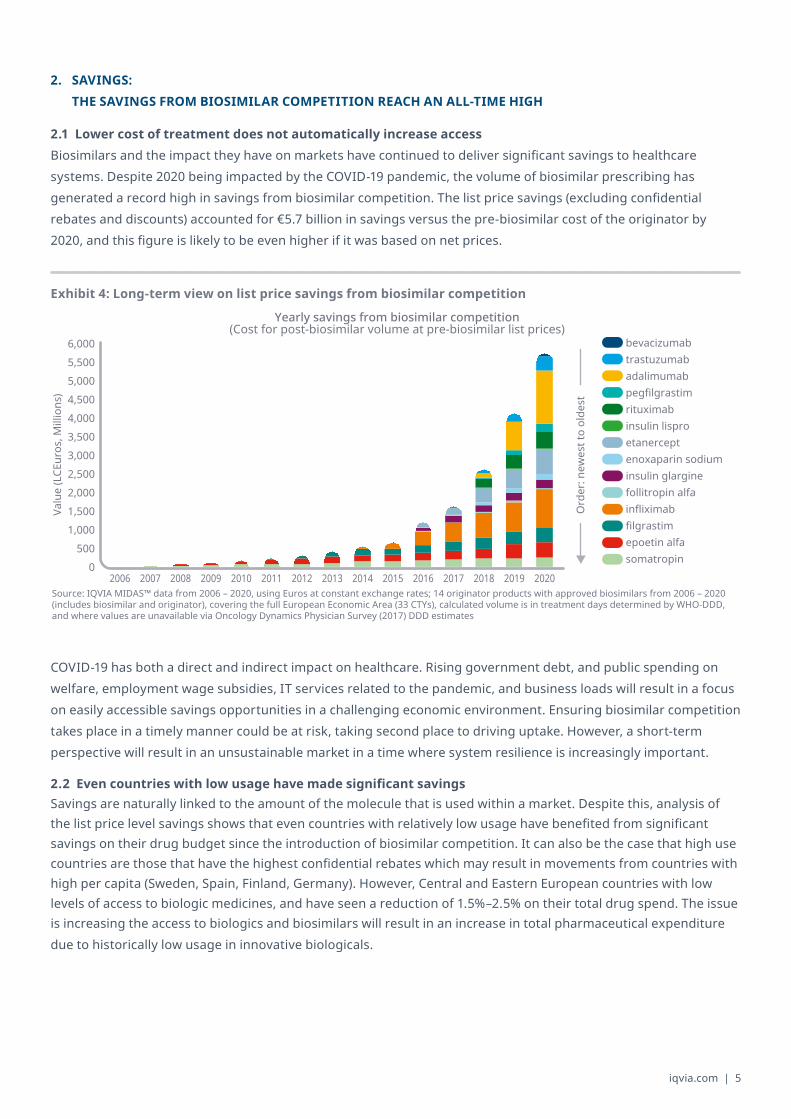
2.1 Lower cost of treatment does not automatically increase access Biosimilars and the impact they have on markets have continued to deliver significant savings to healthcare systems. Despite 2020 being impacted by the COVID-19 pandemic, the volume of biosimilar prescribing has generated a record high in savings from biosimilar competition. The list price savings (excluding confidential rebates and discounts) accounted for €5.7 billion in savings versus the pre-biosimilar cost of the originator by 2020, and this figure is likely to be even higher if it was based on net prices.
COVID-19 has both a direct and indirect impact on healthcare. Rising government debt, and public spending on welfare, employment wage subsidies, IT services related to the pandemic, and business loads will result in a focus on easily accessible savings opportunities in a challenging economic environment. Ensuring biosimilar competition takes place in a timely manner could be at risk, taking second place to driving uptake. However, a short-term perspective will result in an unsustainable market in a time where system resilience is increasingly important.
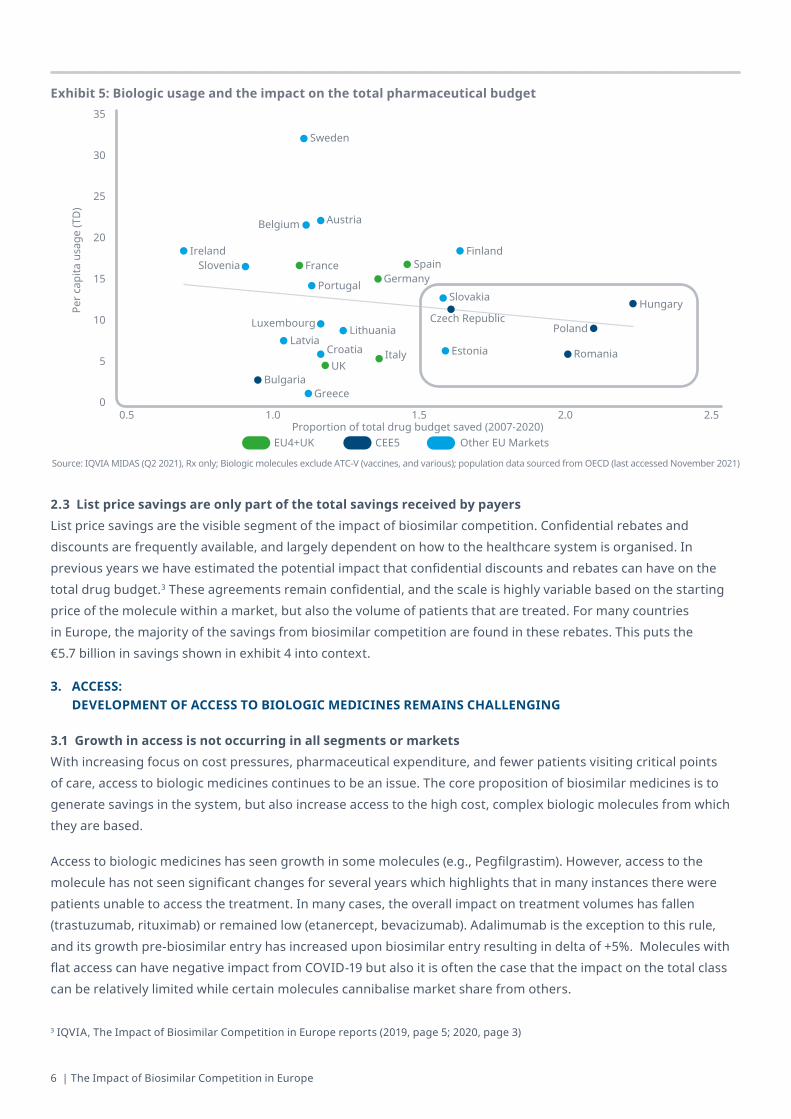
2.2Evencountrieswithlowusagehavemadesignificantsavings Savings are naturally linked to the amount of the molecule that is used within a market. Despite this, analysis of the list price level savings shows that even countries with relatively low usage have benefited from significant savings on their drug budget since the introduction of biosimilar competition. It can also be the case that high use countries are those that have the highest confidential rebates which may result in movements from countries with high per capita (Sweden, Spain, Finland, Germany). However, Central and Eastern European countries with low levels of access to biologic medicines, and have seen a reduction of 1.5%–2.5% on their total drug spend. The issue is increasing the access to biologics and biosimilars will result in an increase in total pharmaceutical expenditure due to historically low usage in innovative biologicals.
Exhibit 4: Long-term view on list price savings from biosimilar competition
2006 2007 2008 2009 2010 2011 2012 2013 2014 2015 2016 2017 2018 2019 2020
Valu
e (L
CEur
os, M
illio
ns)
6,0005,5005,0004,5004,0003,5003,0002,5002,0001,5001,000
5000
Yearly savings from biosimilar competition(Cost for post-biosimilar volume at pre-biosimilar list prices)
Source: IQVIA MIDAS™ data from 2006 – 2020, using Euros at constant exchange rates; 14 originator products with approved biosimilars from 2006 – 2020 (includes biosimilar and originator), covering the full European Economic Area (33 CTYs), calculated volume is in treatment days determined by WHO-DDD, and where values are unavailable via Oncology Dynamics Physician Survey (2017) DDD estimates
Ord
er: n
ewes
t to
olde
st
bevacizumab
insulin glargine
adalimumabtrastuzumab
epoetin alfa
pegfilgrastim
filgrastim
rituximabinsulin lisproetanerceptenoxaparin sodium
follitropin alfainfliximab
somatropin
6 | The Impact of Biosimilar Competition in Europe
2.3 List price savings are only part of the total savings received by payers List price savings are the visible segment of the impact of biosimilar competition. Confidential rebates and discounts are frequently available, and largely dependent on how to the healthcare system is organised. In previous years we have estimated the potential impact that confidential discounts and rebates can have on the total drug budget.3 These agreements remain confidential, and the scale is highly variable based on the starting price of the molecule within a market, but also the volume of patients that are treated. For many countries in Europe, the majority of the savings from biosimilar competition are found in these rebates. This puts the €5.7 billion in savings shown in exhibit 4 into context.
3. ACCESS: DEVELOPMENT OF ACCESS TO BIOLOGIC MEDICINES REMAINS CHALLENGING
3.1 Growth in access is not occurring in all segments or markets With increasing focus on cost pressures, pharmaceutical expenditure, and fewer patients visiting critical points of care, access to biologic medicines continues to be an issue. The core proposition of biosimilar medicines is to generate savings in the system, but also increase access to the high cost, complex biologic molecules from which they are based.
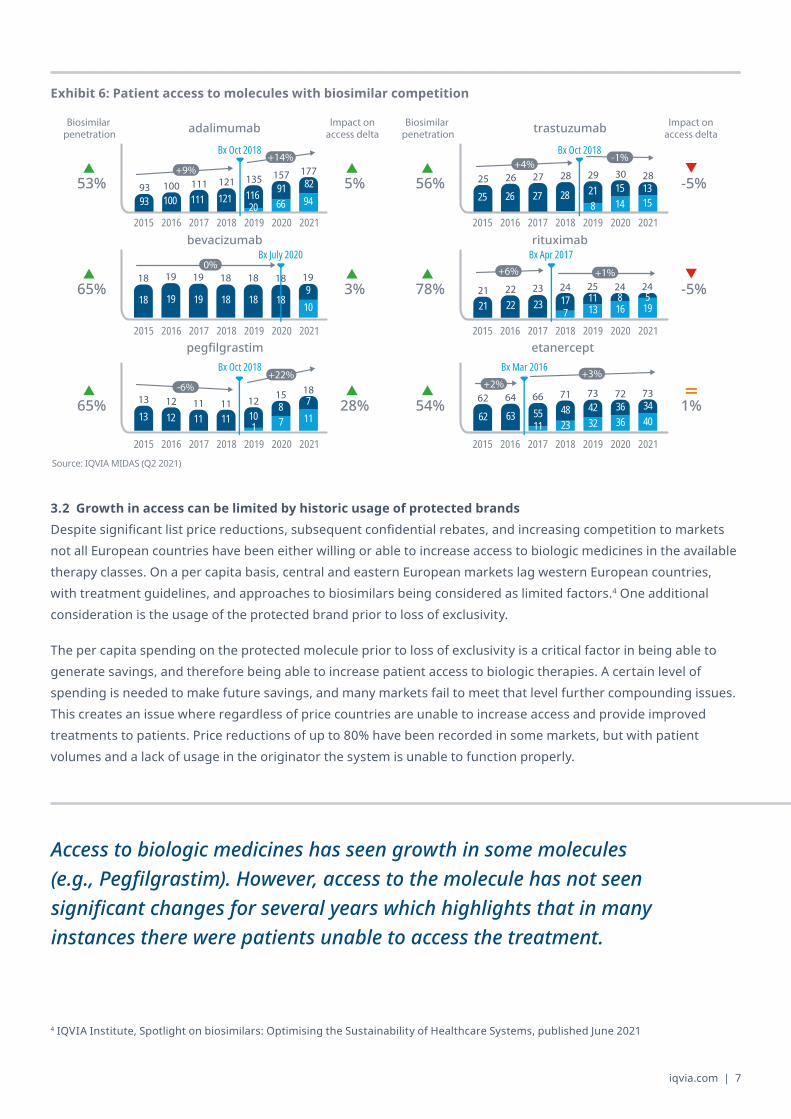
Access to biologic medicines has seen growth in some molecules (e.g., Pegfilgrastim). However, access to the molecule has not seen significant changes for several years which highlights that in many instances there were patients unable to access the treatment. In many cases, the overall impact on treatment volumes has fallen (trastuzumab, rituximab) or remained low (etanercept, bevacizumab). Adalimumab is the exception to this rule, and its growth pre-biosimilar entry has increased upon biosimilar entry resulting in delta of +5%. Molecules with flat access can have negative impact from COVID-19 but also it is often the case that the impact on the total class can be relatively limited while certain molecules cannibalise market share from others.
3 IQVIA, The Impact of Biosimilar Competition in Europe reports (2019, page 5; 2020, page 3)
Exhibit 5: Biologic usage and the impact on the total pharmaceutical budget
EU4+UK CEE5 Other EU Markets
0
5
10
15
20
25
30
35
0.5 1.0 1.5 2.0 2.5Proportion of total drug budget saved (2007-2020)
ItalyCroatia
Czech Republic
Per c
apita
usa
ge (T
D)
Austria
Bulgaria
Belgium
Estonia Romania
FinlandFrance
Germany
Greece
Hungary
Ireland
LatviaLithuaniaLuxembourg Poland
PortugalSlovakia
Slovenia Spain
Sweden
UK
Source: IQVIA MIDAS (Q2 2021), Rx only; Biologic molecules exclude ATC-V (vaccines, and various); population data sourced from OECD (last accessed November 2021)
iqvia.com | 7
4 IQVIA Institute, Spotlight on biosimilars: Optimising the Sustainability of Healthcare Systems, published June 2021
Exhibit 6: Patient access to molecules with biosimilar competition
adalimumab
pegfilgrastim
bevacizumab
trastuzumab
etanercept
rituximab
Biosimilar penetration
Impact on access delta
Biosimilar penetration
Impact on access delta
157
12193 111100 11620
9166
8294
10093 111 121 135177
13 111215
11 1218
Bx Oct 2018
Bx Oct 2018
Bx July 2020
Bx Oct 2018
Bx Apr 2017
Bx Mar 2016
53%
65%
65%
56%
78%
54%
5%
3%
28%
-5%
-5%
1%
2018 20212015 2016 2017 20202019
2018 20212015 2016 2017 20202019
2018 20212015 2016 2017 20202019 2018 20212015 2016 2017 20202019
2018 20212015 2016 2017 20202019
2018 20212015 2016 2017 20202019
18 19 19 18 189
1113 12 11 101
87
711
25 26 27 28 29 30 28
288
25 2726 21 1514
1315
21 252422 23 24 2411
21 227
23 1713
816
519
62 64 66 71 73 72 73
485562 6342 36 34
11 23 32 36 40
+9%
-6%
+4%
+6%
+2%
-1%
+1%
+3%
0%
+14%
+22%
19
10
1818 19 19 18 18
18
Source: IQVIA MIDAS (Q2 2021)
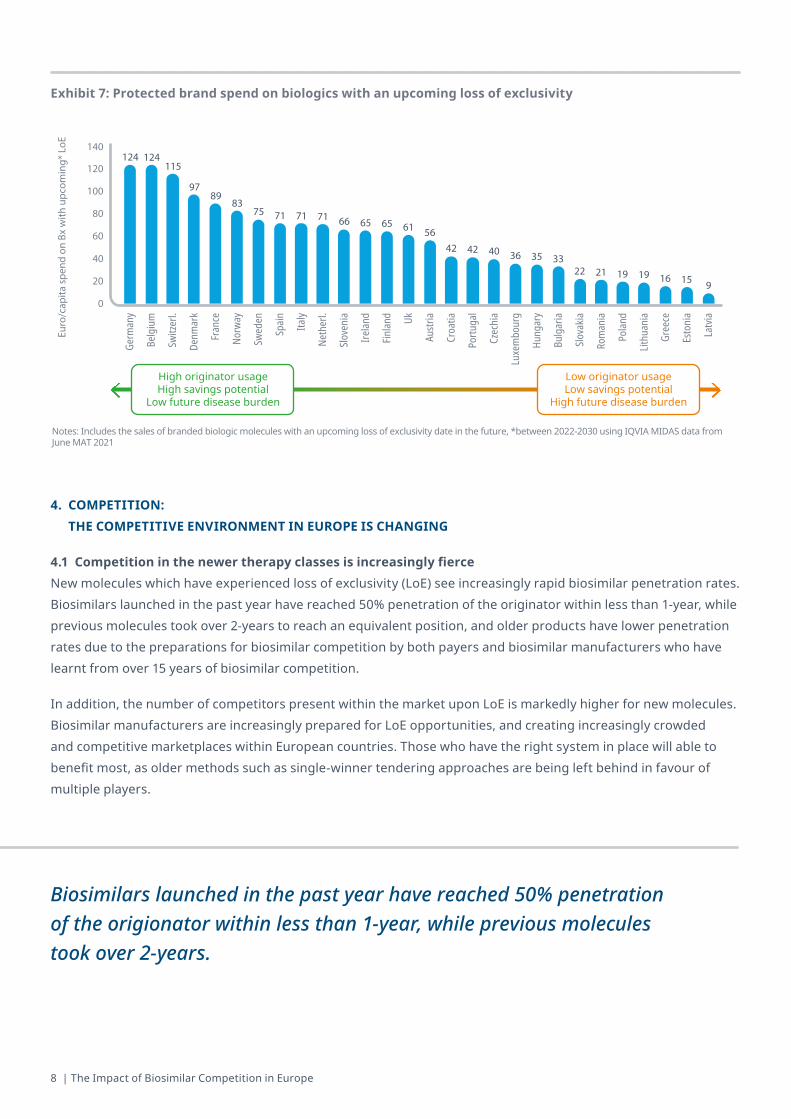
3.2 Growth in access can be limited by historic usage of protected brands Despite significant list price reductions, subsequent confidential rebates, and increasing competition to markets not all European countries have been either willing or able to increase access to biologic medicines in the available therapy classes. On a per capita basis, central and eastern European markets lag western European countries, with treatment guidelines, and approaches to biosimilars being considered as limited factors.4 One additional consideration is the usage of the protected brand prior to loss of exclusivity.
The per capita spending on the protected molecule prior to loss of exclusivity is a critical factor in being able to generate savings, and therefore being able to increase patient access to biologic therapies. A certain level of spending is needed to make future savings, and many markets fail to meet that level further compounding issues. This creates an issue where regardless of price countries are unable to increase access and provide improved treatments to patients. Price reductions of up to 80% have been recorded in some markets, but with patient volumes and a lack of usage in the originator the system is unable to function properly.
Access to biologic medicines has seen growth in some molecules (e.g., Pegfilgrastim). However, access to the molecule has not seen significant changes for several years which highlights that in many instances there were patients unable to access the treatment.
8 | The Impact of Biosimilar Competition in Europe
4.COMPETITION: THE COMPETITIVE ENVIRONMENT IN EUROPE IS CHANGING
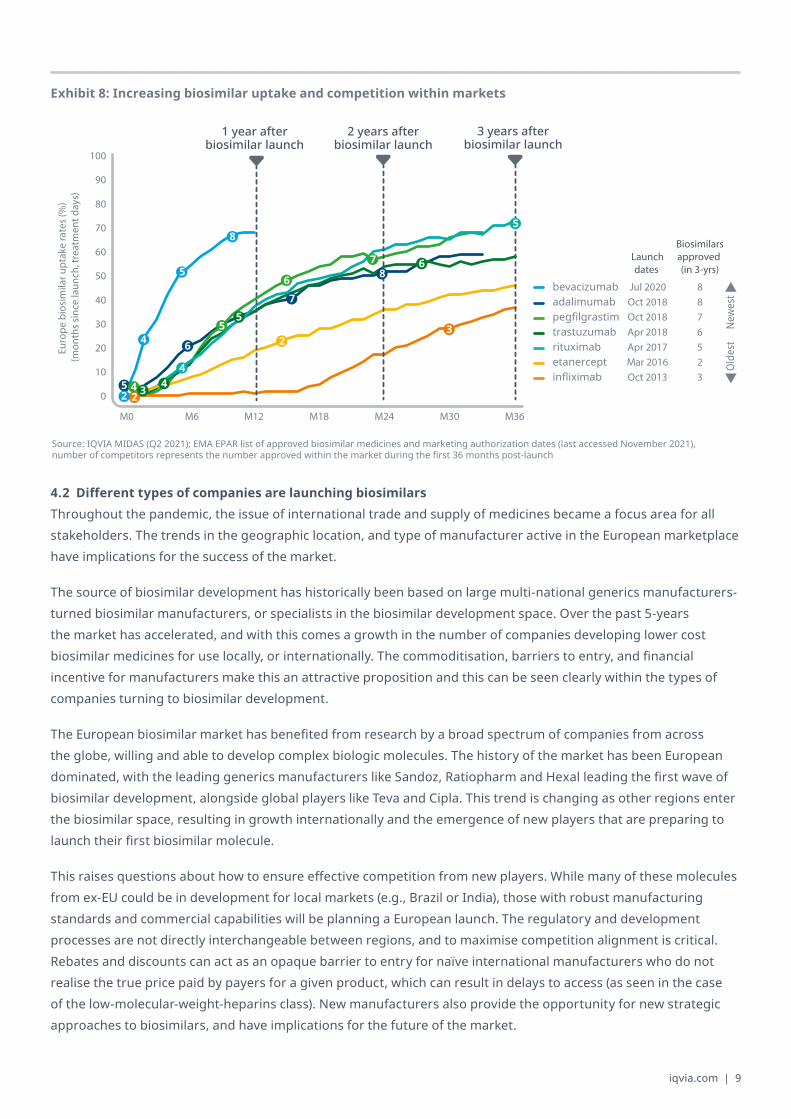
4.1Competitioninthenewertherapyclassesisincreasinglyfierce New molecules which have experienced loss of exclusivity (LoE) see increasingly rapid biosimilar penetration rates. Biosimilars launched in the past year have reached 50% penetration of the originator within less than 1-year, while previous molecules took over 2-years to reach an equivalent position, and older products have lower penetration rates due to the preparations for biosimilar competition by both payers and biosimilar manufacturers who have learnt from over 15 years of biosimilar competition.
In addition, the number of competitors present within the market upon LoE is markedly higher for new molecules. Biosimilar manufacturers are increasingly prepared for LoE opportunities, and creating increasingly crowded and competitive marketplaces within European countries. Those who have the right system in place will able to benefit most, as older methods such as single-winner tendering approaches are being left behind in favour of multiple players.
Exhibit 7: Protected brand spend on biologics with an upcoming loss of exclusivity
124 124115
9789
8375 71 71 71 66 65 65 61 56
42 42 40 36 35 3322 21 19 19 16 15 9
0
20
40
60
80
100
120
140
Swed
en
Fran
ce
Switz
erl.
Bulg
aria
Germ
any
Belg
ium
Neth
erl.
Denm
ark
Norw
ay
Euro
/cap
ita s
pend
on
Bx w
ith u
pcom
ing*
LoE
Gree
ce
Spain Ita
ly
Slove
nia
Irelan
d
Finlan
d Uk
Austr
ia
Croa
tia
Portu
gal
Czec
hia
Luxe
mbo
urg
Hung
ary
Polan
d
Slova
kia
Rom
ania
Lithu
ania
Esto
nia
Latvi
a
High originator usage High savings potential
Low future disease burden
Low originator usage Low savings potential
High future disease burden
Notes: Includes the sales of branded biologic molecules with an upcoming loss of exclusivity date in the future, *between 2022-2030 using IQVIA MIDAS data from June MAT 2021
Biosimilars launched in the past year have reached 50% penetration of the origionator within less than 1-year, while previous molecules took over 2-years.
iqvia.com | 9
Exhibit 8: Increasing biosimilar uptake and competition within markets
0
10
20
30
40
50
60
70
80
90
100
Euro
pe b
iosi
mila
r upt
ake
rate
s (%
) (m
onth
s si
nce
laun
ch, t
reat
men
t day
s)
M0 M36M6 M12 M30M18 M24
1 year after biosimilar launch
2 years after biosimilar launch
3 years after biosimilar launch
8
5
5
3
2
2
4
5
2
4 6
7
8
4
5
6
7
3 4
5
6 Launchdates
Biosimilarsapproved (in 3-yrs)
Oct 2018pegfilgrastimOct 2018adalimumabJul 2020bevacizumab
Apr 2018trastuzumabApr 2017rituximabMar 2016etanerceptOct 2013
788
6523infliximab
Olde
st
New
est
Source: IQVIA MIDAS (Q2 2021); EMA EPAR list of approved biosimilar medicines and marketing authorization dates (last accessed November 2021), number of competitors represents the number approved within the market during the first 36 months post-launch
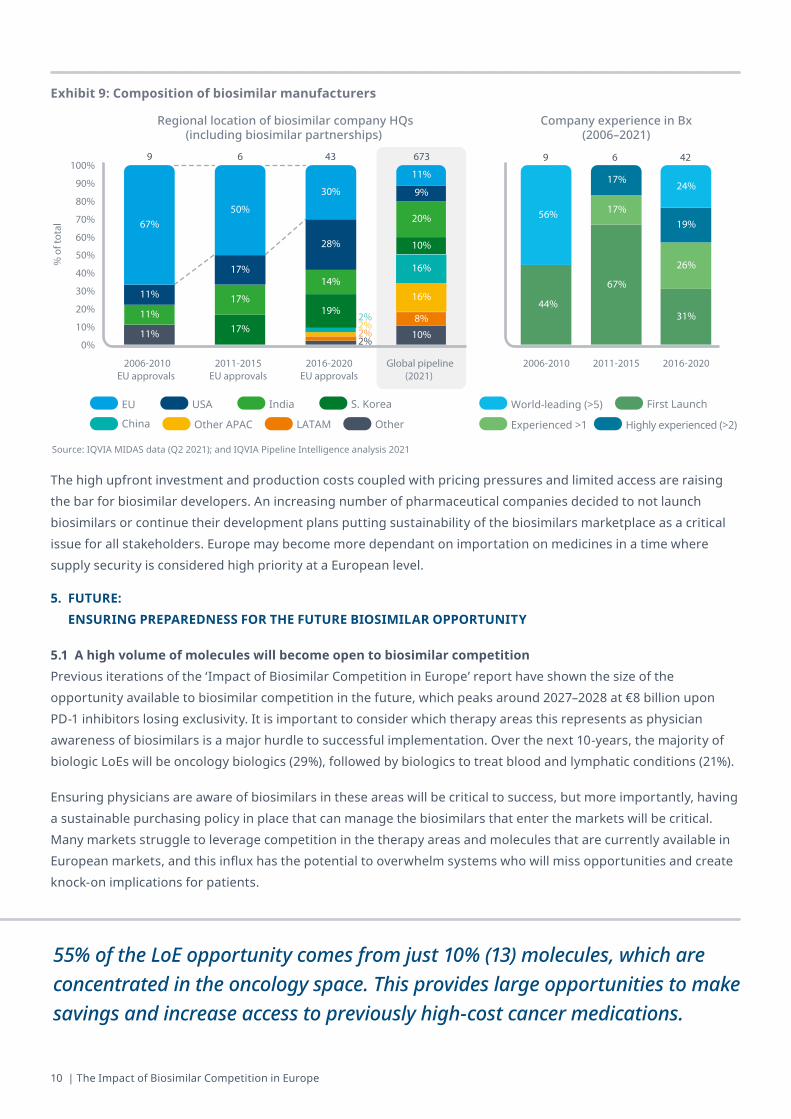
4.2Differenttypesofcompaniesarelaunchingbiosimilars Throughout the pandemic, the issue of international trade and supply of medicines became a focus area for all stakeholders. The trends in the geographic location, and type of manufacturer active in the European marketplace have implications for the success of the market.
The source of biosimilar development has historically been based on large multi-national generics manufacturers-turned biosimilar manufacturers, or specialists in the biosimilar development space. Over the past 5-years the market has accelerated, and with this comes a growth in the number of companies developing lower cost biosimilar medicines for use locally, or internationally. The commoditisation, barriers to entry, and financial incentive for manufacturers make this an attractive proposition and this can be seen clearly within the types of companies turning to biosimilar development.
The European biosimilar market has benefited from research by a broad spectrum of companies from across the globe, willing and able to develop complex biologic molecules. The history of the market has been European dominated, with the leading generics manufacturers like Sandoz, Ratiopharm and Hexal leading the first wave of biosimilar development, alongside global players like Teva and Cipla. This trend is changing as other regions enter the biosimilar space, resulting in growth internationally and the emergence of new players that are preparing to launch their first biosimilar molecule.
This raises questions about how to ensure effective competition from new players. While many of these molecules from ex-EU could be in development for local markets (e.g., Brazil or India), those with robust manufacturing standards and commercial capabilities will be planning a European launch. The regulatory and development processes are not directly interchangeable between regions, and to maximise competition alignment is critical. Rebates and discounts can act as an opaque barrier to entry for naïve international manufacturers who do not realise the true price paid by payers for a given product, which can result in delays to access (as seen in the case of the low-molecular-weight-heparins class). New manufacturers also provide the opportunity for new strategic approaches to biosimilars, and have implications for the future of the market.
10 | The Impact of Biosimilar Competition in Europe
The high upfront investment and production costs coupled with pricing pressures and limited access are raising the bar for biosimilar developers. An increasing number of pharmaceutical companies decided to not launch biosimilars or continue their development plans putting sustainability of the biosimilars marketplace as a critical issue for all stakeholders. Europe may become more dependant on importation on medicines in a time where supply security is considered high priority at a European level.
5.FUTURE: ENSURING PREPAREDNESS FOR THE FUTURE BIOSIMILAR OPPORTUNITY
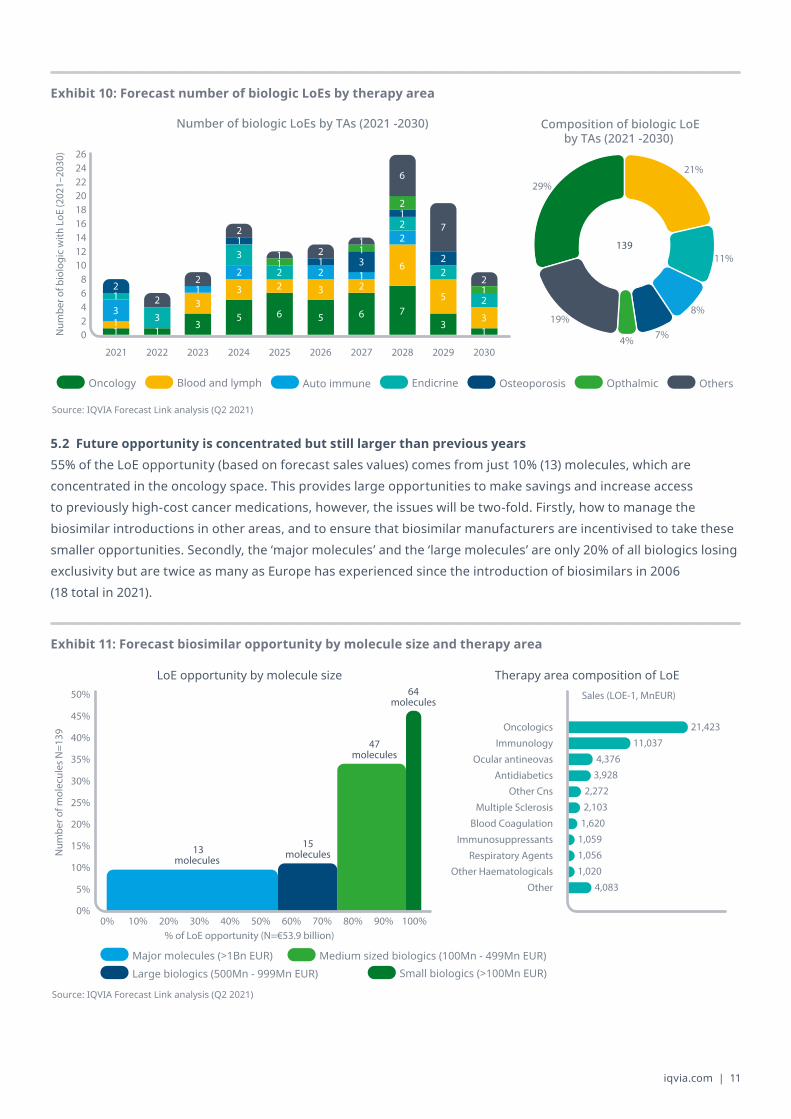
5.1 A high volume of molecules will become open to biosimilar competition Previous iterations of the ‘Impact of Biosimilar Competition in Europe’ report have shown the size of the opportunity available to biosimilar competition in the future, which peaks around 2027–2028 at €8 billion upon PD-1 inhibitors losing exclusivity. It is important to consider which therapy areas this represents as physician awareness of biosimilars is a major hurdle to successful implementation. Over the next 10-years, the majority of biologic LoEs will be oncology biologics (29%), followed by biologics to treat blood and lymphatic conditions (21%).
Ensuring physicians are aware of biosimilars in these areas will be critical to success, but more importantly, having a sustainable purchasing policy in place that can manage the biosimilars that enter the markets will be critical. Many markets struggle to leverage competition in the therapy areas and molecules that are currently available in European markets, and this influx has the potential to overwhelm systems who will miss opportunities and create knock-on implications for patients.
55% of the LoE opportunity comes from just 10% (13) molecules, which are concentrated in the oncology space. This provides large opportunities to make savings and increase access to previously high-cost cancer medications.
Exhibit 9: Composition of biosimilar manufacturers
LATAM Other
USA India S. Korea
China Other APAC
EU
Highly experienced (>2)Experienced >1
First LaunchWorld-leading (>5)
2%0%
10%
20%
30%
40%
50%
60%
70%
80%
90%
100%6
2%
% o
f tot
al
2006-2010EU approvals
2016-2020EU approvals
2011-2015EU approvals
2%
Global pipeline(2021)
9 43 673
Regional location of biosimilar company HQs(including biosimilar partnerships)
44%
67%
31%
56% 17%
26%
17%
19%
24%
6
2006-2010 2011-2015
429
2016-2020
Company experience in Bx(2006–2021)
2%
10%
8%
16%
16%
10%
20%
9%
11%
19%
14%
28%
30%
17%
17%
17%
50%
11%
11%
11%
67%
Source: IQVIA MIDAS data (Q2 2021); and IQVIA Pipeline Intelligence analysis 2021
iqvia.com | 11
5.2 Future opportunity is concentrated but still larger than previous years 55% of the LoE opportunity (based on forecast sales values) comes from just 10% (13) molecules, which are concentrated in the oncology space. This provides large opportunities to make savings and increase access to previously high-cost cancer medications, however, the issues will be two-fold. Firstly, how to manage the biosimilar introductions in other areas, and to ensure that biosimilar manufacturers are incentivised to take these smaller opportunities. Secondly, the ‘major molecules’ and the ‘large molecules’ are only 20% of all biologics losing exclusivity but are twice as many as Europe has experienced since the introduction of biosimilars in 2006 (18 total in 2021).
Exhibit 10: Forecast number of biologic LoEs by therapy area
Osteoporosis OpthalmicOncology EndicrineBlood and lymph OthersAuto immune
35 6 5 6 7
33
33 2 3 2
6
5
33
2
2 2 2
2
2
2
2
33
2
2
2
2
7
2
2
2
6
02468
101214161820222426
1
2029
Num
ber o
f bio
logi
c w
ith L
oE (2
021–
2030
)
1
1
2022
1
2021
1 1
2023
1
2024 20282025
11 1
2026
11
1
2027
1
1
2030
29%
21%
11%
8%
7%4%
19%
139
Number of biologic LoEs by TAs (2021 -2030) Composition of biologic LoEby TAs (2021 -2030)
Source: IQVIA Forecast Link analysis (Q2 2021)
Exhibit 11: Forecast biosimilar opportunity by molecule size and therapy area
Large biologics (500Mn - 999Mn EUR)Medium sized biologics (100Mn - 499Mn EUR)
Small biologics (>100Mn EUR)Major molecules (>1Bn EUR)
40%
80%0%
30%
10% 30%20%
50%
10%
40%
20%
100%
45%
70%60%
5%
50%
35%
0%90%
25%
15%
% of LoE opportunity (N=€53.9 billion)
Num
ber o
f mol
ecul
es N
=139
Oncologics
Immunology
Immunosuppressants
Ocular antineovas
Multiple Sclerosis
Antidiabetics
Other Haematologicals
Other Cns
Blood Coagulation
Respiratory Agents
Other
Sales (LOE-1, MnEUR)
21,423
11,037
4,3763,928
2,272
2,103
1,620
1,0591,056
1,020
4,083
Therapy area composition of LoELoE opportunity by molecule size
13molecules
15molecules
64molecules
47molecules
Source: IQVIA Forecast Link analysis (Q2 2021)
12 | The Impact of Biosimilar Competition in Europe
MethodologyThe indicators are intended to give a broad overview of the uptake and the implications on price and volume evolution after introduction of biosimilar medicines. There are differences in perspective between payers, providers, and different types of manufacturers. In focusing on the payer perspective, there are caveats that should be considered when interpreting the results.
• Pricing and discounts: The report is based on publicly available list prices. Discounting occurs, especially in contracting with hospitals and in countries using tenders for biological drug procurement, which can lead to larger price fluctuations than is visible through the reported IQVIA data
• Approvedindicationsandefficacy: Not all products in a specific product group in the accessible, non-accessible or total market have the same approved indications and can have differences in efficacy and individual patient outcomes. Biosimilars normally receive the same indications as the referenced products and are expected to have the same safety and efficacy.
• Volume estimates: The pack volumes reported are based on IQVIA collected data which may have been unknowingly impacted by issues such as parallel exporting. The volumes have been converted to daily doses using the published World Health Organization (WHO) defined daily doses (DDD) which can introduce bias. Consumption measures are therefore not adjusted for clinical practice guidelines, patient characteristics, indications for which the molecule is used, or other factors that may result in different volumes utilised on a per patient Treatment Day basis.
• Long-termvs.one-offuse: Hospital-only vs. retail: no distinction is made in this report between biologicals for long term (repeat use) and one-off use, nor between hospital-only and retail products, although competitive conditions and scope for biosimilar uptake are likely to differ in the various scenarios.
• Protection expiry: The intellectual property for biologicals can involve multiple patents, patent timelines, data exclusivity, and litigation for each individual product and therefore it is difficult to give an exact date for protection expiry for biologicals. It should be noted that these results are estimates as determined from IQVIA MIDAS® and ARK Patent Intelligence where available, and historical products are cross-referenced to public sources.
Other definitions found within the report include:
• Launch date: Date of first recorded sales of Biosimilar Medicinal Product in the country. Products can be approved in Europe prior to this date but it is not recorded as such.
• Price indicators: Price: the price level used is gross ex-manufacturer price (list price), which values the product at the level that the manufacturer sells out, without considering rebates or discounts. Price evolution: price per Treatment Day (TD) in 2021 (June MAT) versus year before biosimilar entry.
iqvia.com | 13
• Volume indicators: Volume: volume is measured in Treatment Days (also known as Defined Daily Dose) which is a measure of the average dose prescribed as defined by the WHO.
Biosimilar market share: number of biosimilar treatment days as a share of (i) biosimilar + referenced product(s) volume, (ii) accessible market volume and (iii) total market volume.
Volume evolution: number of Treatment Days in 2021 (June MAT) versus year before biosimilar entry.
Volume per capita 2021 (June MAT): number of Treatment Days consumed in 2021 (June MAT) normalised by population size (World Bank data).
Volume per capita year before biosimilar entrance: number of Treatment Days consumed the year before the entrance of biosimilars, normalised by population size.
Amendments in 2021 Previously unavailable data has been included for the first time in 2021, due to an improved methodology.
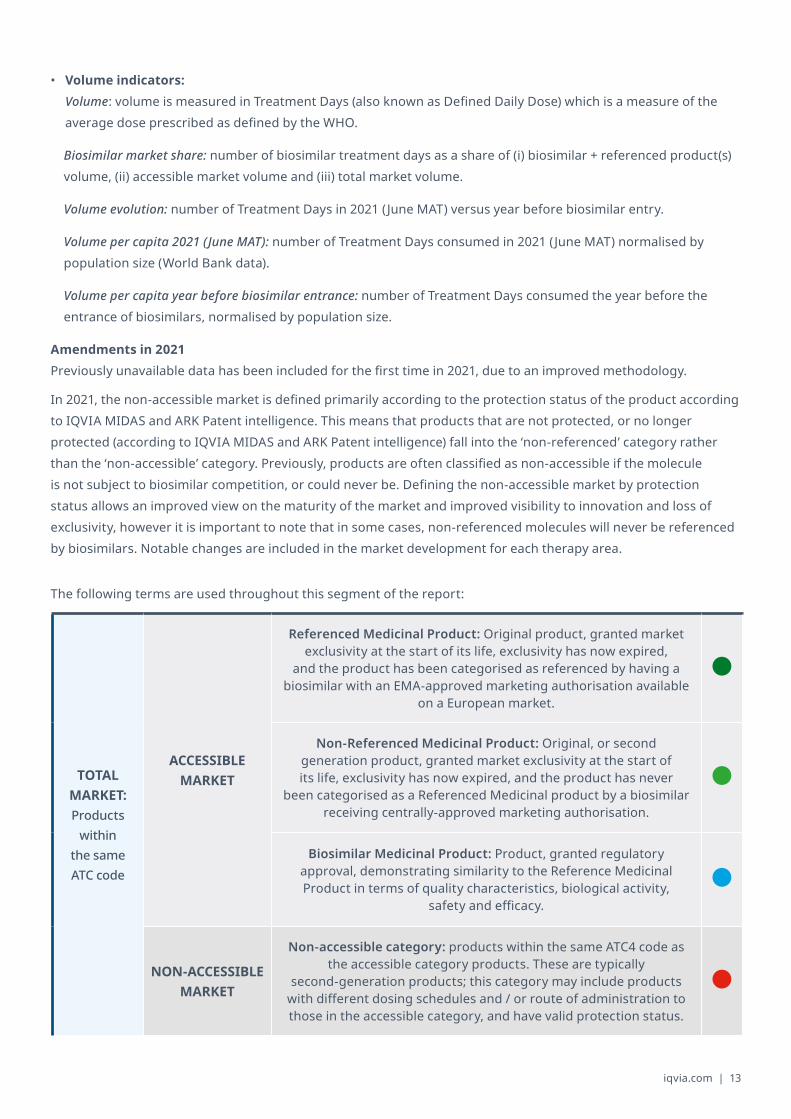
In 2021, the non-accessible market is defined primarily according to the protection status of the product according to IQVIA MIDAS and ARK Patent intelligence. This means that products that are not protected, or no longer protected (according to IQVIA MIDAS and ARK Patent intelligence) fall into the ‘non-referenced’ category rather than the ‘non-accessible’ category. Previously, products are often classified as non-accessible if the molecule is not subject to biosimilar competition, or could never be. Defining the non-accessible market by protection status allows an improved view on the maturity of the market and improved visibility to innovation and loss of exclusivity, however it is important to note that in some cases, non-referenced molecules will never be referenced by biosimilars. Notable changes are included in the market development for each therapy area.
The following terms are used throughout this segment of the report:
TOTAL MARKET: Products
within the same ATC code
ACCESSIBLE MARKET
Referenced Medicinal Product: Original product, granted market exclusivity at the start of its life, exclusivity has now expired,
and the product has been categorised as referenced by having a biosimilar with an EMA-approved marketing authorisation available
on a European market.
Non-Referenced Medicinal Product: Original, or second generation product, granted market exclusivity at the start of its life, exclusivity has now expired, and the product has never
been categorised as a Referenced Medicinal product by a biosimilar receiving centrally-approved marketing authorisation.
Biosimilar Medicinal Product: Product, granted regulatory approval, demonstrating similarity to the Reference Medicinal Product in terms of quality characteristics, biological activity,
safety and efficacy.
NON-ACCESSIBLE MARKET
Non-accessible category: products within the same ATC4 code as the accessible category products. These are typically
second-generation products; this category may include products with different dosing schedules and / or route of administration to those in the accessible category, and have valid protection status.
14 | The Impact of Biosimilar Competition in Europe
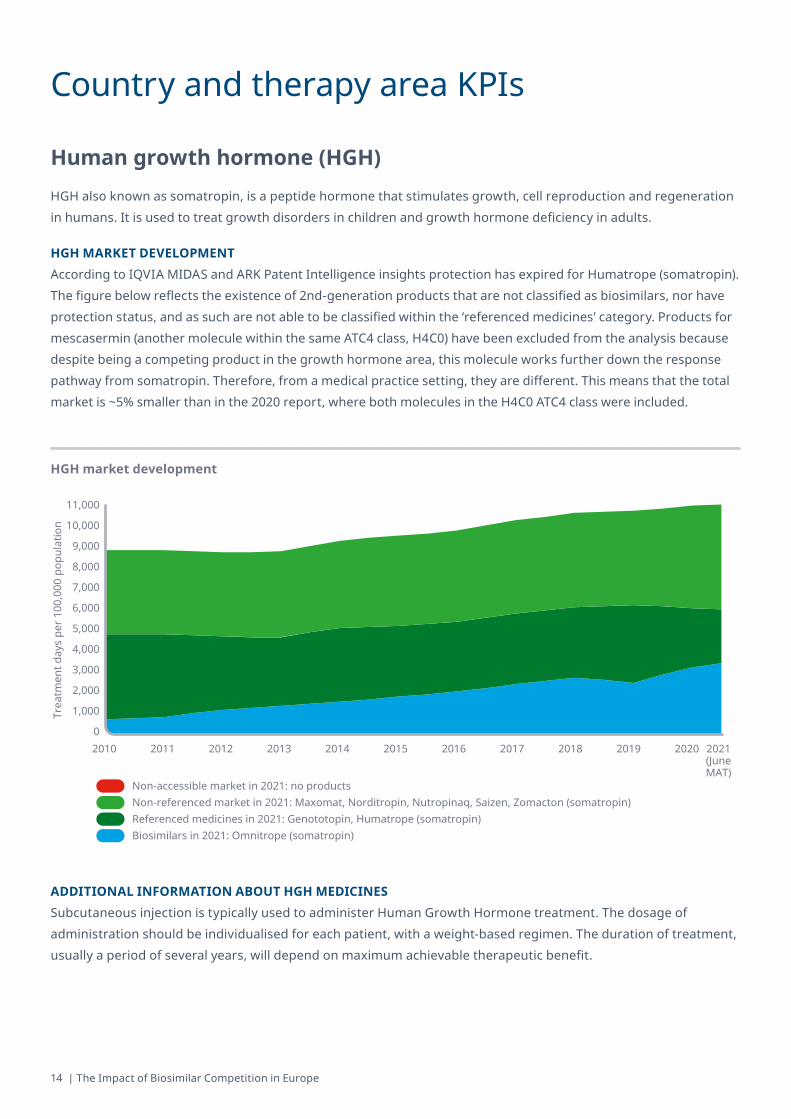
Human growth hormone (HGH)HGH also known as somatropin, is a peptide hormone that stimulates growth, cell reproduction and regeneration in humans. It is used to treat growth disorders in children and growth hormone deficiency in adults.
HGH MARKET DEVELOPMENTAccording to IQVIA MIDAS and ARK Patent Intelligence insights protection has expired for Humatrope (somatropin). The figure below reflects the existence of 2nd-generation products that are not classified as biosimilars, nor have protection status, and as such are not able to be classified within the ‘referenced medicines’ category. Products for mescasermin (another molecule within the same ATC4 class, H4C0) have been excluded from the analysis because despite being a competing product in the growth hormone area, this molecule works further down the response pathway from somatropin. Therefore, from a medical practice setting, they are different. This means that the total market is ~5% smaller than in the 2020 report, where both molecules in the H4C0 ATC4 class were included.
ADDITIONAL INFORMATION ABOUT HGH MEDICINESSubcutaneous injection is typically used to administer Human Growth Hormone treatment. The dosage of administration should be individualised for each patient, with a weight-based regimen. The duration of treatment, usually a period of several years, will depend on maximum achievable therapeutic benefit.
HGH market development
Trea
tmen
t day
s pe
r 100
,000
pop
ulat
ion
2010 2011 2012 2013 2014 2015 2016 2017 2018 20202019 2021(JuneMAT)
11,000
10,000
9,000
8,000
7,000
6,000
5,000
4,000
3,000
2,000
1,000
0
Non-accessible market in 2021: no productsNon-referenced market in 2021: Maxomat, Norditropin, Nutropinaq, Saizen, Zomacton (somatropin)Referenced medicines in 2021: Genototopin, Humatrope (somatropin)Biosimilars in 2021: Omnitrope (somatropin)
Country and therapy area KPIs
iqvia.com | 15
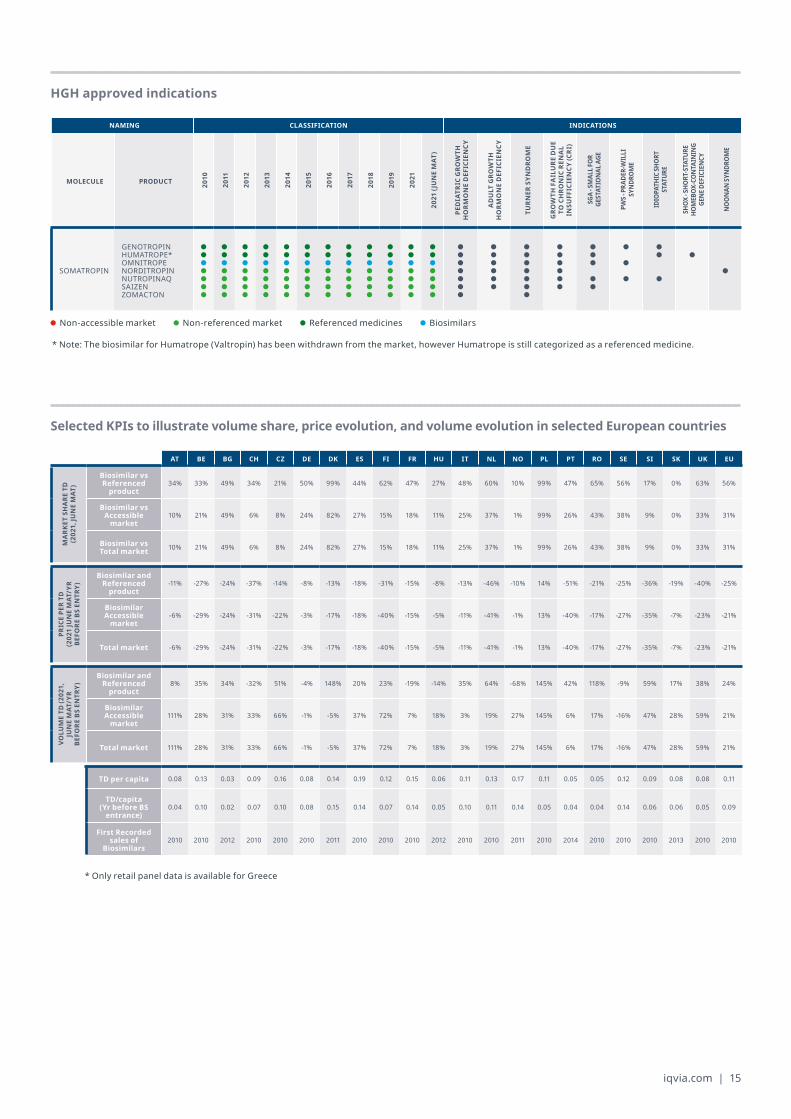
HGH approved indications
Selected KPIs to illustrate volume share, price evolution, and volume evolution in selected European countries
NAMING CLASSIFICATION INDICATIONS
MOLECULE PRODUCT 2010
2011
2012
2013
2014
2015
2016
2017
2018
2019
2021
2021(JUNEMAT
)
PED
IATR
IC G
ROW
TH
HO
RMO
NE
DEF
ICIE
NCY
AD
ULT
GRO
WTH
H
ORM
ON
E D
EFIC
IEN
CY
TURN
ER S
YND
ROM
E
GRO
WTH
FA
ILU
RE D
UE
TO C
HRO
NIC
REN
AL
INSU
FFIC
IEN
CY (C
RI)
SGA
- SM
ALL F
OR
GEST
ATIO
NAL
AGE
PWS -
PRA
DER-
WIL
LI
SYN
DRO
ME
IDIO
PATH
IC SH
ORT
ST
ATUR
E
SHOX
- SHO
RT-S
TATU
RE
HOM
EBOX
-CO
NTA
ININ
G GE
NE D
EFIC
IEN
CY
NO
ON
AN S
YNDR
OM
E
SOMATROPIN
GENOTROPINHUMATROPE*OMNITROPENORDITROPINNUTROPINAQSAIZENZOMACTON
* Note: The biosimilar for Humatrope (Valtropin) has been withdrawn from the market, however Humatrope is still categorized as a referenced medicine.
* Only retail panel data is available for Greece
Non-accessible market Non-referenced market Referenced medicines Biosimilars
AT BE BG CH CZ DE DK ES FI FR HU IT NL NO PL PT RO SE SI SK UK EU
MA
RKET
SH
ARE
TD
(202
1,JU
NEMAT
)
Biosimilar vs Referenced
product34% 33% 49% 34% 21% 50% 99% 44% 62% 47% 27% 48% 60% 10% 99% 47% 65% 56% 17% 0% 63% 56%
Biosimilar vs Accessible
market10% 21% 49% 6% 8% 24% 82% 27% 15% 18% 11% 25% 37% 1% 99% 26% 43% 38% 9% 0% 33% 31%
Biosimilar vs Total market 10% 21% 49% 6% 8% 24% 82% 27% 15% 18% 11% 25% 37% 1% 99% 26% 43% 38% 9% 0% 33% 31%
PRIC
E PE
R TD
(202
1JU
NEMAT
/YR
BEFO
RE B
S EN
TRY)
Biosimilar and Referenced
product-11% -27% -24% -37% -14% -8% -13% -18% -31% -15% -8% -13% -46% -10% 14% -51% -21% -25% -36% -19% -40% -25%
Biosimilar Accessible
market-6% -29% -24% -31% -22% -3% -17% -18% -40% -15% -5% -11% -41% -1% 13% -40% -17% -27% -35% -7% -23% -21%
Total market -6% -29% -24% -31% -22% -3% -17% -18% -40% -15% -5% -11% -41% -1% 13% -40% -17% -27% -35% -7% -23% -21%
VOLU
METD
(202
1,
JUNEMAT
/YR
BE
FORE
BS
ENTR
Y)
Biosimilar and Referenced
product8% 35% 34% -32% 51% -4% 148% 20% 23% -19% -14% 35% 64% -68% 145% 42% 118% -9% 59% 17% 38% 24%
Biosimilar Accessible
market111% 28% 31% 33% 66% -1% -5% 37% 72% 7% 18% 3% 19% 27% 145% 6% 17% -16% 47% 28% 59% 21%
Total market 111% 28% 31% 33% 66% -1% -5% 37% 72% 7% 18% 3% 19% 27% 145% 6% 17% -16% 47% 28% 59% 21%
TD per capita 0.08 0.13 0.03 0.09 0.16 0.08 0.14 0.19 0.12 0.15 0.06 0.11 0.13 0.17 0.11 0.05 0.05 0.12 0.09 0.08 0.08 0.11
TD/capita(Yr before BS
entrance)0.04 0.10 0.02 0.07 0.10 0.08 0.15 0.14 0.07 0.14 0.05 0.10 0.11 0.14 0.05 0.04 0.04 0.14 0.06 0.06 0.05 0.09
First Recorded sales of
Biosimilars2010 2010 2012 2010 2010 2010 2011 2010 2010 2010 2012 2010 2010 2011 2010 2014 2010 2010 2010 2013 2010 2010
16 | The Impact of Biosimilar Competition in Europe
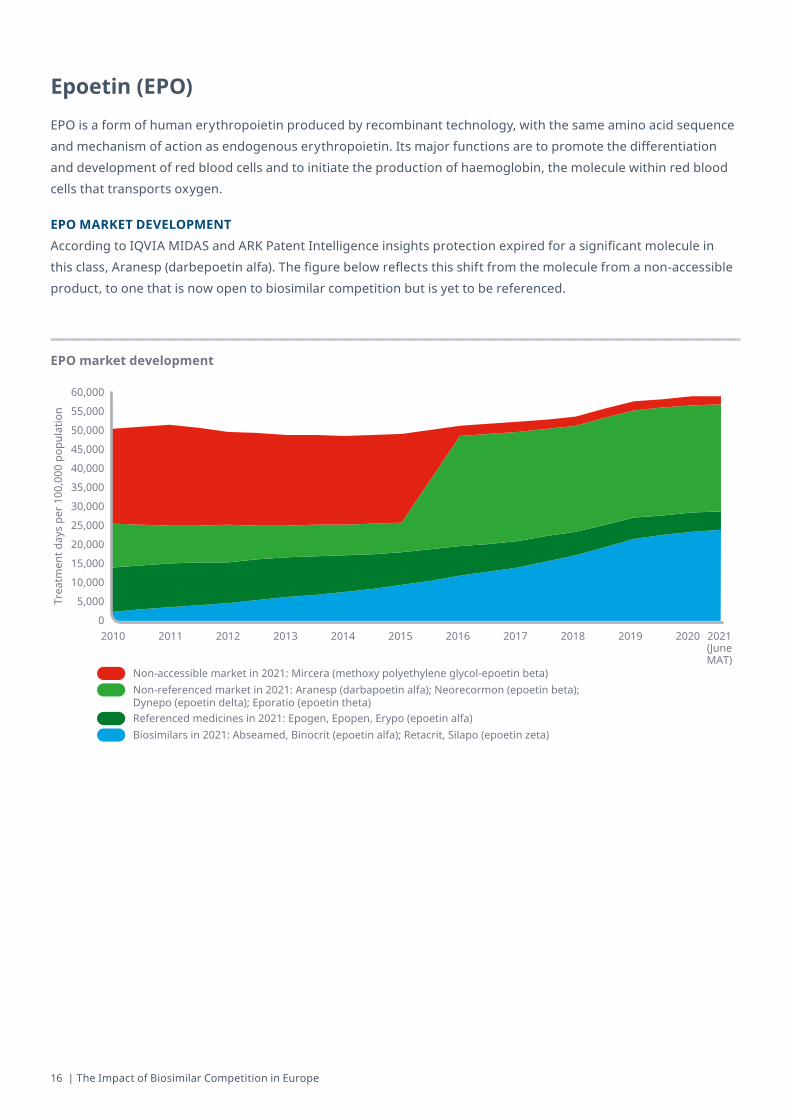
Epoetin (EPO) EPO is a form of human erythropoietin produced by recombinant technology, with the same amino acid sequence and mechanism of action as endogenous erythropoietin. Its major functions are to promote the differentiation and development of red blood cells and to initiate the production of haemoglobin, the molecule within red blood cells that transports oxygen.
EPO MARKET DEVELOPMENTAccording to IQVIA MIDAS and ARK Patent Intelligence insights protection expired for a significant molecule in this class, Aranesp (darbepoetin alfa). The figure below reflects this shift from the molecule from a non-accessible product, to one that is now open to biosimilar competition but is yet to be referenced.
EPO market development
Trea
tmen
t day
s pe
r 100
,000
pop
ulat
ion
60,000
55,000
50,000
45,000
40,000
35,000
30,000
25,000
20,000
15,000
10,000
5,000
0
Non-accessible market in 2021: Mircera (methoxy polyethylene glycol-epoetin beta)Non-referenced market in 2021: Aranesp (darbapoetin alfa); Neorecormon (epoetin beta); Dynepo (epoetin delta); Eporatio (epoetin theta)Referenced medicines in 2021: Epogen, Epopen, Erypo (epoetin alfa)Biosimilars in 2021: Abseamed, Binocrit (epoetin alfa); Retacrit, Silapo (epoetin zeta)
2010 2011 2012 2013 2014 2015 2016 2017 2018 20202019 2021(JuneMAT)
iqvia.com | 17
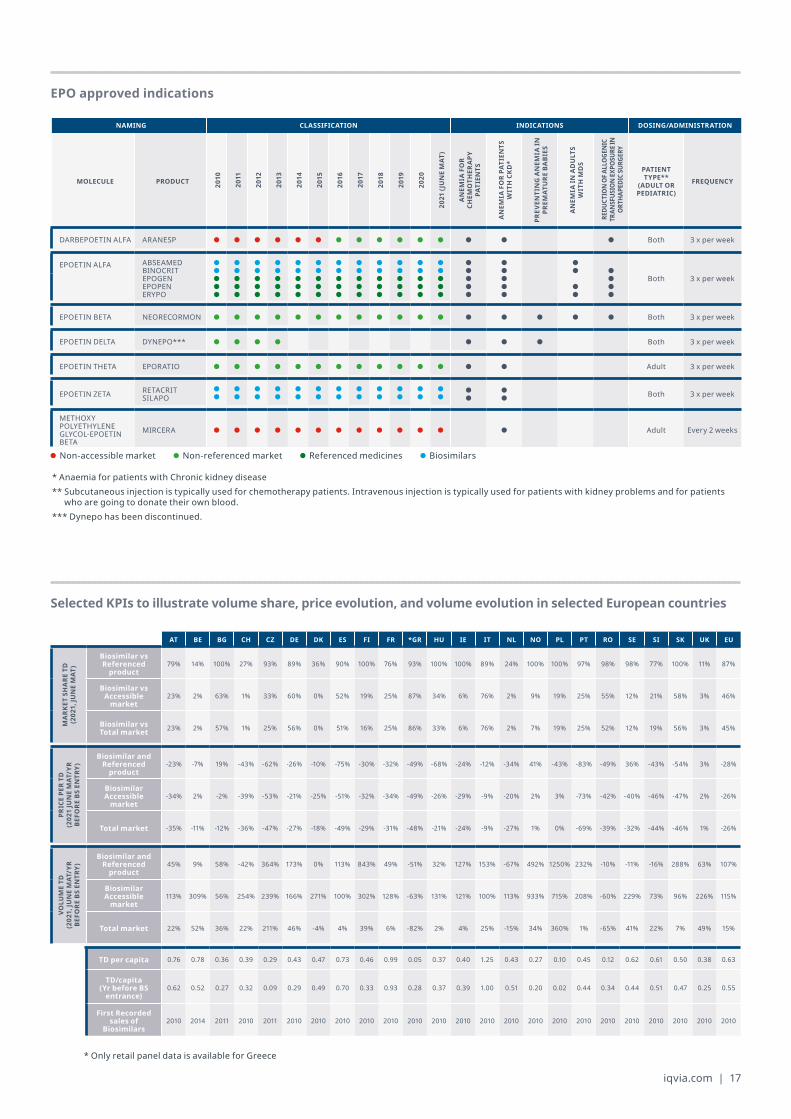
EPO approved indications
Selected KPIs to illustrate volume share, price evolution, and volume evolution in selected European countries
NAMING CLASSIFICATION INDICATIONS DOSING/ADMINISTRATION
MOLECULE PRODUCT 2010
2011
2012
2013
2014
2015
2016
2017
2018
2019
2020
2021(JUNEMAT
)
AN
EMIA
FO
R CH
EMO
THER
APY
PA
TIEN
TS
AN
EMIA
FO
R PA
TIEN
TS
WIT
H C
KD*
PREV
ENTI
NG
AN
EMIA
IN
PREM
ATU
RE B
ABI
ES
AN
EMIA
IN A
DU
LTS
WIT
H M
DS
REDU
CTIO
N O
F ALL
OGE
NIC
TR
ANSF
USIO
N EX
POSU
RE IN
O
RTHA
PEDI
C SU
RGER
Y
PATIENT TYPE**
(ADULT OR PEDIATRIC)
FREQUENCY
DARBEPOETIN ALFA ARANESP
Both 3 x per week
EPOETIN ALFA ABSEAMEDBINOCRITEPOGENEPOPEN ERYPO
Both 3 x per week
EPOETIN BETA NEORECORMON Both 3 x per week
EPOETIN DELTA DYNEPO*** Both 3 x per week
EPOETIN THETA EPORATIO Adult 3 x per week
EPOETIN ZETA RETACRIT SILAPO
Both 3 x per week
METHOXY POLYETHYLENE GLYCOL-EPOETIN BETA
MIRCERA Adult Every 2 weeks
AT BE BG CH CZ DE DK ES FI FR *GR HU IE IT NL NO PL PT RO SE SI SK UK EU
MA
RKET
SH
ARE
TD
(202
1,JU
NEMAT
)
Biosimilar vs Referenced
product79% 14% 100% 27% 93% 89% 36% 90% 100% 76% 93% 100% 100% 89% 24% 100% 100% 97% 98% 98% 77% 100% 11% 87%
Biosimilar vs Accessible
market23% 2% 63% 1% 33% 60% 0% 52% 19% 25% 87% 34% 6% 76% 2% 9% 19% 25% 55% 12% 21% 58% 3% 46%
Biosimilar vs Total market 23% 2% 57% 1% 25% 56% 0% 51% 16% 25% 86% 33% 6% 76% 2% 7% 19% 25% 52% 12% 19% 56% 3% 45%
PRIC
E PE
R TD
(202
1JU
NEMAT
/YR
BEFO
RE B
S EN
TRY)
Biosimilar and Referenced
product-23% -7% 19% -43% -62% -26% -10% -75% -30% -32% -49% -68% -24% -12% -34% 41% -43% -83% -49% 36% -43% -54% 3% -28%
Biosimilar Accessible
market-34% 2% -2% -39% -53% -21% -25% -51% -32% -34% -49% -26% -29% -9% -20% 2% 3% -73% -42% -40% -46% -47% 2% -26%
Total market -35% -11% -12% -36% -47% -27% -18% -49% -29% -31% -48% -21% -24% -9% -27% 1% 0% -69% -39% -32% -44% -46% 1% -26%
VOLU
ME
TD
(202
1,JU
NEMAT
/YR
BEFO
RE B
S EN
TRY)
Biosimilar and Referenced
product45% 9% 58% -42% 364% 173% 0% 113% 843% 49% -51% 32% 127% 153% -67% 492% 1250% 232% -10% -11% -16% 288% 63% 107%
Biosimilar Accessible
market113% 309% 56% 254% 239% 166% 271% 100% 302% 128% -63% 131% 121% 100% 113% 933% 715% 208% -60% 229% 73% 96% 226% 115%
Total market 22% 52% 36% 22% 211% 46% -4% 4% 39% 6% -82% 2% 4% 25% -15% 34% 360% 1% -65% 41% 22% 7% 49% 15%
TD per capita 0.76 0.78 0.36 0.39 0.29 0.43 0.47 0.73 0.46 0.99 0.05 0.37 0.40 1.25 0.43 0.27 0.10 0.45 0.12 0.62 0.61 0.50 0.38 0.63
TD/capita(Yr before BS
entrance)0.62 0.52 0.27 0.32 0.09 0.29 0.49 0.70 0.33 0.93 0.28 0.37 0.39 1.00 0.51 0.20 0.02 0.44 0.34 0.44 0.51 0.47 0.25 0.55
First Recorded sales of
Biosimilars2010 2014 2011 2010 2011 2010 2010 2010 2010 2010 2010 2010 2010 2010 2010 2010 2010 2010 2010 2010 2010 2010 2010 2010
* Anaemia for patients with Chronic kidney disease** Subcutaneous injection is typically used for chemotherapy patients. Intravenous injection is typically used for patients with kidney problems and for patients
who are going to donate their own blood.*** Dynepo has been discontinued.
Non-accessible market Non-referenced market Referenced medicines Biosimilars
* Only retail panel data is available for Greece
18 | The Impact of Biosimilar Competition in Europe
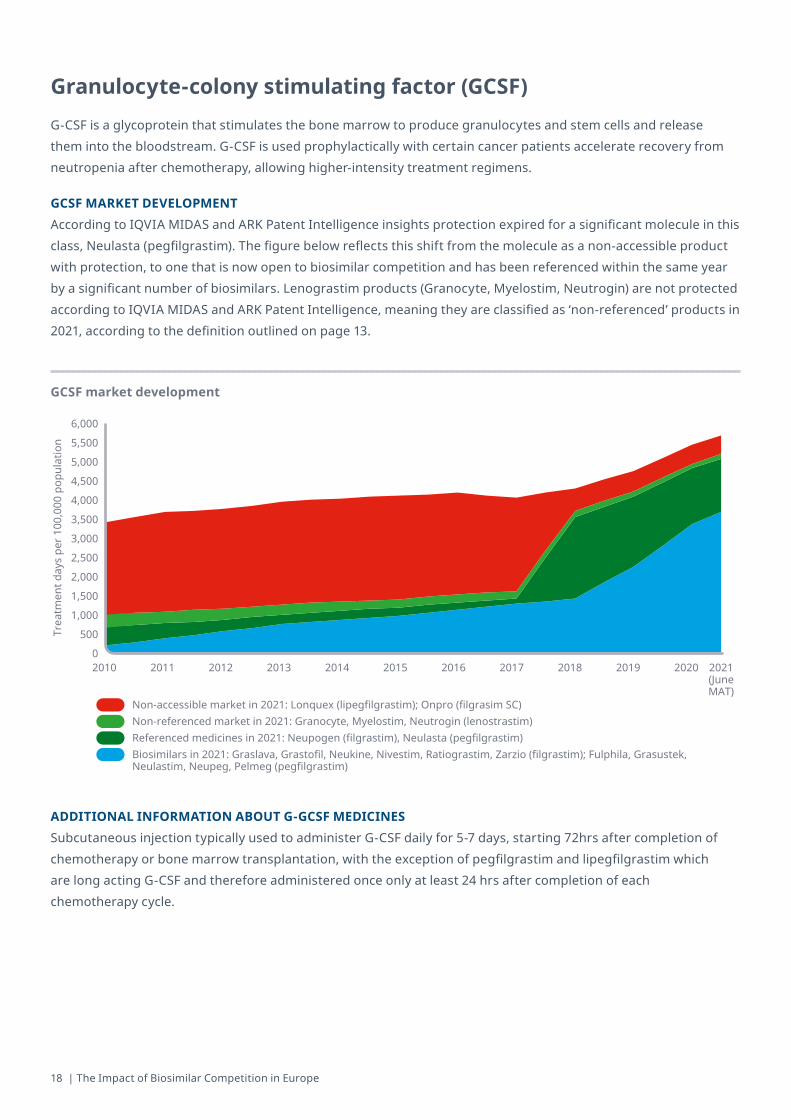
Granulocyte-colony stimulating factor (GCSF)G-CSF is a glycoprotein that stimulates the bone marrow to produce granulocytes and stem cells and release them into the bloodstream. G-CSF is used prophylactically with certain cancer patients accelerate recovery from neutropenia after chemotherapy, allowing higher-intensity treatment regimens.
GCSF MARKET DEVELOPMENTAccording to IQVIA MIDAS and ARK Patent Intelligence insights protection expired for a significant molecule in this class, Neulasta (pegfilgrastim). The figure below reflects this shift from the molecule as a non-accessible product with protection, to one that is now open to biosimilar competition and has been referenced within the same year by a significant number of biosimilars. Lenograstim products (Granocyte, Myelostim, Neutrogin) are not protected according to IQVIA MIDAS and ARK Patent Intelligence, meaning they are classified as ‘non-referenced’ products in 2021, according to the definition outlined on page 13.
ADDITIONAL INFORMATION ABOUT G-GCSF MEDICINESSubcutaneous injection typically used to administer G-CSF daily for 5-7 days, starting 72hrs after completion of chemotherapy or bone marrow transplantation, with the exception of pegfilgrastim and lipegfilgrastim which are long acting G-CSF and therefore administered once only at least 24 hrs after completion of each chemotherapy cycle.
GCSF market development
Trea
tmen
t day
s pe
r 100
,000
pop
ulat
ion
2010 2011 2012 2013 2014 2015 2016 2017 2018 2019 2020 2021(JuneMAT)
6,000
5,500
5,000
4,500
4,000
3,500
3,000
2,500
2,000
1,500
1,000
500
0
Non-accessible market in 2021: Lonquex (lipegfilgrastim); Onpro (filgrasim SC)Non-referenced market in 2021: Granocyte, Myelostim, Neutrogin (lenostrastim)Referenced medicines in 2021: Neupogen (filgrastim), Neulasta (pegfilgrastim)Biosimilars in 2021: Graslava, Grastofil, Neukine, Nivestim, Ratiograstim, Zarzio (filgrastim); Fulphila, Grasustek, Neulastim, Neupeg, Pelmeg (pegfilgrastim)
iqvia.com | 19
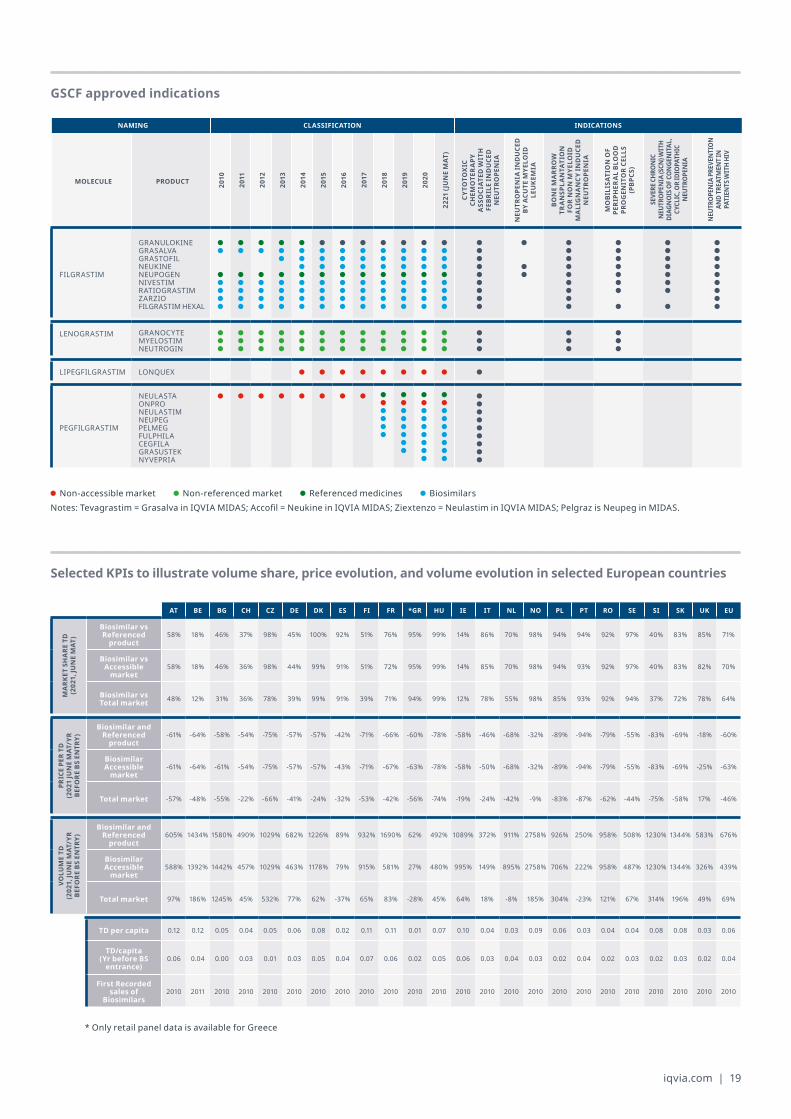
GSCF approved indications
Selected KPIs to illustrate volume share, price evolution, and volume evolution in selected European countries
NAMING CLASSIFICATION INDICATIONS
MOLECULE PRODUCT 2010
2011
2012
2013
2014
2015
2016
2017
2018
2019
2020
2221(JUNEMAT
)
CYTO
TOX
IC
CHEM
OTE
RA
PY
ASS
OCI
ATED
WIT
H
FEBR
ILE
IND
UCE
D
NEU
TRO
PEN
IA
NEU
TRO
PEN
IA IN
DU
CED
BY
ACU
TE M
YELO
ID
LEU
KEM
IA
BON
E M
ARR
OW
TR
AN
SPLA
NTA
TIO
N
FOR
NO
N M
YELO
ID
MA
LIG
NA
NCY
IND
UCE
D
NEU
TRO
PEN
IA
MO
BILI
SATI
ON
OF
PER
IPH
ERA
L BL
OO
D
PRO
GEN
ITO
R CE
LLS
(PBP
CS)
SEVE
RE C
HRO
NIC
N
EUTR
OPE
NIA
(SCN
) WIT
H DI
AGN
OIS
OF C
ON
GEN
ITAL
, CY
CLIC
, OR
IDIO
PATH
IC
NEU
TRO
PEN
IA
NEU
TRO
PEN
IA P
REVE
NTI
ON
AN
D TR
EATM
ENT I
N
PATI
ENTS
WIT
H HI
V
FILGRASTIM
GRANULOKINEGRASALVAGRASTOFILNEUKINENEUPOGENNIVESTIMRATIOGRASTIMZARZIOFILGRASTIM HEXAL
LENOGRASTIM GRANOCYTEMYELOSTIMNEUTROGIN
LIPEGFILGRASTIM LONQUEX
PEGFILGRASTIM
NEULASTAONPRONEULASTIMNEUPEGPELMEGFULPHILACEGFILAGRASUSTEKNYVEPRIA
AT BE BG CH CZ DE DK ES FI FR *GR HU IE IT NL NO PL PT RO SE SI SK UK EU
MA
RKET
SH
ARE
TD
(202
1,JU
NEMAT
)
Biosimilar vs Referenced
product58% 18% 46% 37% 98% 45% 100% 92% 51% 76% 95% 99% 14% 86% 70% 98% 94% 94% 92% 97% 40% 83% 85% 71%
Biosimilar vs Accessible
market58% 18% 46% 36% 98% 44% 99% 91% 51% 72% 95% 99% 14% 85% 70% 98% 94% 93% 92% 97% 40% 83% 82% 70%
Biosimilar vs Total market 48% 12% 31% 36% 78% 39% 99% 91% 39% 71% 94% 99% 12% 78% 55% 98% 85% 93% 92% 94% 37% 72% 78% 64%
PRIC
E PE
R TD
(202
1JU
NEMAT
/YR
BEFO
RE B
S EN
TRY)
Biosimilar and Referenced
product-61% -64% -58% -54% -75% -57% -57% -42% -71% -66% -60% -78% -58% -46% -68% -32% -89% -94% -79% -55% -83% -69% -18% -60%
Biosimilar Accessible
market-61% -64% -61% -54% -75% -57% -57% -43% -71% -67% -63% -78% -58% -50% -68% -32% -89% -94% -79% -55% -83% -69% -25% -63%
Total market -57% -48% -55% -22% -66% -41% -24% -32% -53% -42% -56% -74% -19% -24% -42% -9% -83% -87% -62% -44% -75% -58% 17% -46%
VOLU
ME
TD
(202
1,JU
NEMAT
/YR
BEFO
RE B
S EN
TRY)
Biosimilar and Referenced
product605% 1434% 1580% 490% 1029% 682% 1226% 89% 932% 1690% 62% 492% 1089% 372% 911% 2758% 926% 250% 958% 508% 1230% 1344% 583% 676%
Biosimilar Accessible
market588% 1392% 1442% 457% 1029% 463% 1178% 79% 915% 581% 27% 480% 995% 149% 895% 2758% 706% 222% 958% 487% 1230% 1344% 326% 439%
Total market 97% 186% 1245% 45% 532% 77% 62% -37% 65% 83% -28% 45% 64% 18% -8% 185% 304% -23% 121% 67% 314% 196% 49% 69%
TD per capita 0.12 0.12 0.05 0.04 0.05 0.06 0.08 0.02 0.11 0.11 0.01 0.07 0.10 0.04 0.03 0.09 0.06 0.03 0.04 0.04 0.08 0.08 0.03 0.06
TD/capita(Yr before BS
entrance)0.06 0.04 0.00 0.03 0.01 0.03 0.05 0.04 0.07 0.06 0.02 0.05 0.06 0.03 0.04 0.03 0.02 0.04 0.02 0.03 0.02 0.03 0.02 0.04
First Recorded sales of
Biosimilars2010 2011 2010 2010 2010 2010 2010 2010 2010 2010 2010 2010 2010 2010 2010 2010 2010 2010 2010 2010 2010 2010 2010 2010
Non-accessible market Non-referenced market Referenced medicines BiosimilarsNotes: Tevagrastim = Grasalva in IQVIA MIDAS; Accofil = Neukine in IQVIA MIDAS; Ziextenzo = Neulastim in IQVIA MIDAS; Pelgraz is Neupeg in MIDAS.
* Only retail panel data is available for Greece
20 | The Impact of Biosimilar Competition in Europe
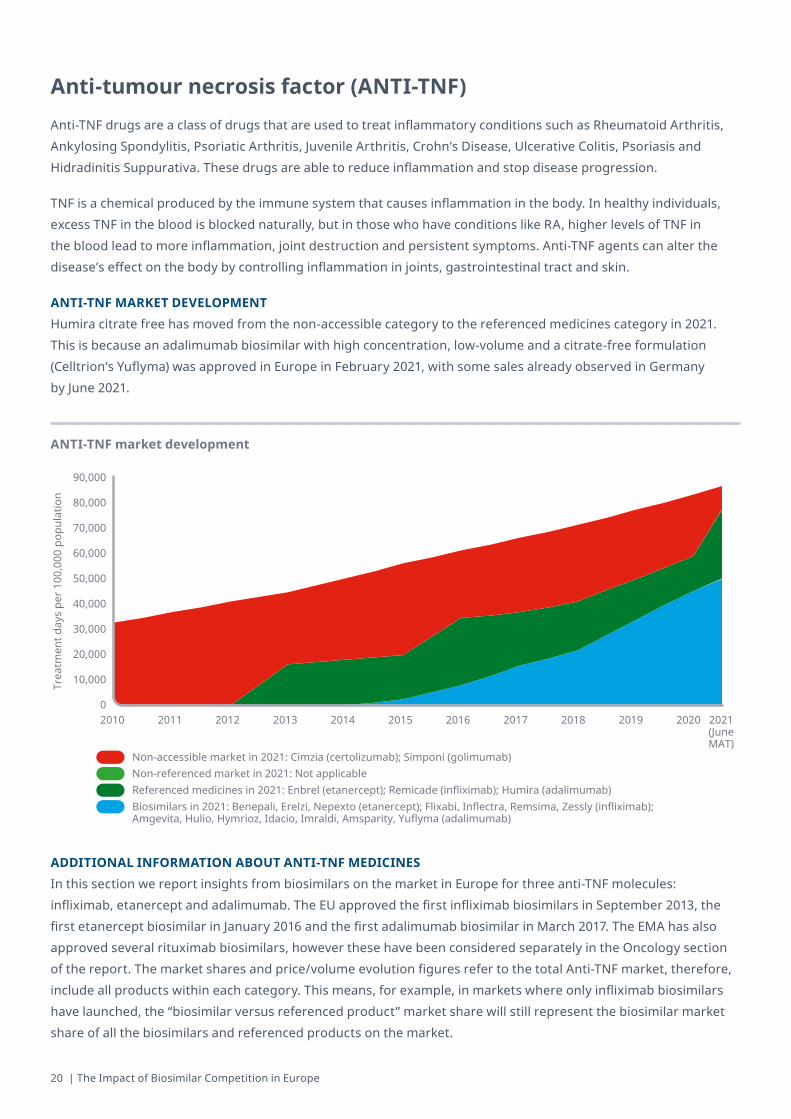
Anti-tumour necrosis factor (ANTI-TNF)Anti-TNF drugs are a class of drugs that are used to treat inflammatory conditions such as Rheumatoid Arthritis, Ankylosing Spondylitis, Psoriatic Arthritis, Juvenile Arthritis, Crohn’s Disease, Ulcerative Colitis, Psoriasis and Hidradinitis Suppurativa. These drugs are able to reduce inflammation and stop disease progression.
TNF is a chemical produced by the immune system that causes inflammation in the body. In healthy individuals, excess TNF in the blood is blocked naturally, but in those who have conditions like RA, higher levels of TNF in the blood lead to more inflammation, joint destruction and persistent symptoms. Anti-TNF agents can alter the disease’s effect on the body by controlling inflammation in joints, gastrointestinal tract and skin.
ANTI-TNF MARKET DEVELOPMENTHumira citrate free has moved from the non-accessible category to the referenced medicines category in 2021. This is because an adalimumab biosimilar with high concentration, low-volume and a citrate-free formulation (Celltrion’s Yuflyma) was approved in Europe in February 2021, with some sales already observed in Germany by June 2021.
ADDITIONAL INFORMATION ABOUT ANTI-TNF MEDICINESIn this section we report insights from biosimilars on the market in Europe for three anti-TNF molecules: infliximab, etanercept and adalimumab. The EU approved the first infliximab biosimilars in September 2013, the first etanercept biosimilar in January 2016 and the first adalimumab biosimilar in March 2017. The EMA has also approved several rituximab biosimilars, however these have been considered separately in the Oncology section of the report. The market shares and price/volume evolution figures refer to the total Anti-TNF market, therefore, include all products within each category. This means, for example, in markets where only infliximab biosimilars have launched, the “biosimilar versus referenced product” market share will still represent the biosimilar market share of all the biosimilars and referenced products on the market.
ANTI-TNF market development
Trea
tmen
t day
s pe
r 100
,000
pop
ulat
ion
2010 2011 2012 2013 2014 2015 2016 2017 2018 2019 2020 2021(JuneMAT)
90,000
80,000
70,000
60,000
50,000
40,000
30,000
20,000
10,000
0
Non-accessible market in 2021: Cimzia (certolizumab); Simponi (golimumab)Non-referenced market in 2021: Not applicable Referenced medicines in 2021: Enbrel (etanercept); Remicade (infliximab); Humira (adalimumab) Biosimilars in 2021: Benepali, Erelzi, Nepexto (etanercept); Flixabi, Inflectra, Remsima, Zessly (infliximab); Amgevita, Hulio, Hymrioz, Idacio, Imraldi, Amsparity, Yuflyma (adalimumab)
iqvia.com | 21
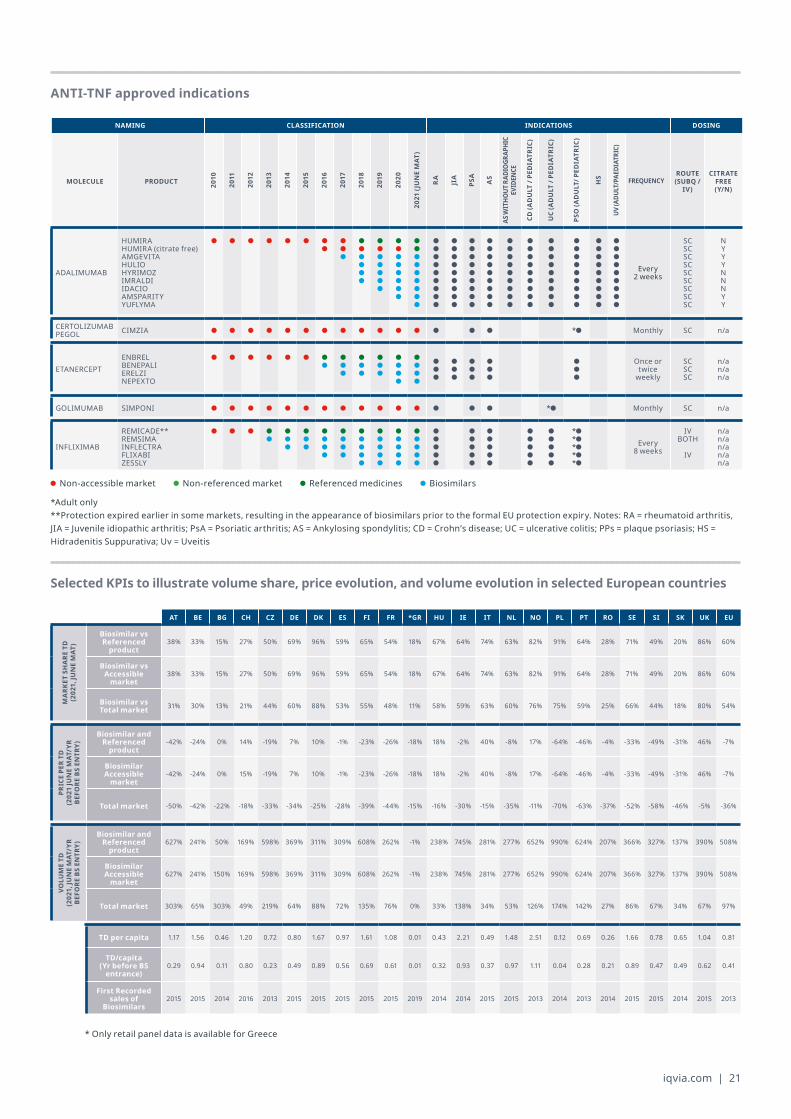
ANTI-TNF approved indications
Selected KPIs to illustrate volume share, price evolution, and volume evolution in selected European countries
NAMING CLASSIFICATION INDICATIONS DOSING
MOLECULE PRODUCT 2010
2011
2012
2013
2014
2015
2016
2017
2018
2019
2020
2021(JUNEMAT
)
RA
JIA
PSA
AS
AS W
ITHO
UT R
ADIO
GRAP
HIC
EVID
ENCE
CD(A
DULT/PE
DIATR
IC)
UC(ADULT/PE
DIATR
IC)
PSO(A
DULT/P
EDIATR
IC)
HS
UV(A
DULT/PAE
DIAT
RIC)
FREQUENCYROUTE (SUBQ/
IV)
CITRATE FREE (Y/N)
ADALIMUMAB
HUMIRAHUMIRA (citrate free)AMGEVITAHULIOHYRIMOZIMRALDIIDACIOAMSPARITYYUFLYMA
Every 2 weeks
SC SC SC SC SC SC SC SC SC
N Y Y Y N N N Y Y
CERTOLIZUMAB PEGOL CIMZIA * Monthly SC n/a
ETANERCEPTENBRELBENEPALIERELZINEPEXTO
Once or twice
weekly
SC SC SC
n/a n/a n/a
GOLIMUMAB SIMPONI * Monthly SC n/a
INFLIXIMAB
REMICADE**REMSIMAINFLECTRAFLIXABIZESSLY
* * * * *
Every 8 weeks
IV BOTH
IV
n/a n/a n/a n/a n/a
*Adult only**Protection expired earlier in some markets, resulting in the appearance of biosimilars prior to the formal EU protection expiry. Notes: RA = rheumatoid arthritis,JIA = Juvenile idiopathic arthritis; PsA = Psoriatic arthritis; AS = Ankylosing spondylitis; CD = Crohn’s disease; UC = ulcerative colitis; PPs = plaque psoriasis; HS =Hidradenitis Suppurativa; Uv = Uveitis
Non-accessible market Non-referenced market Referenced medicines Biosimilars
AT BE BG CH CZ DE DK ES FI FR *GR HU IE IT NL NO PL PT RO SE SI SK UK EU
MA
RKET
SH
ARE
TD
(202
1,JU
NEMAT
)
Biosimilar vs Referenced
product38% 33% 15% 27% 50% 69% 96% 59% 65% 54% 18% 67% 64% 74% 63% 82% 91% 64% 28% 71% 49% 20% 86% 60%
Biosimilar vs Accessible
market38% 33% 15% 27% 50% 69% 96% 59% 65% 54% 18% 67% 64% 74% 63% 82% 91% 64% 28% 71% 49% 20% 86% 60%
Biosimilar vs Total market 31% 30% 13% 21% 44% 60% 88% 53% 55% 48% 11% 58% 59% 63% 60% 76% 75% 59% 25% 66% 44% 18% 80% 54%
PRIC
E PE
R TD
(202
1JU
NEMAT
/YR
BEFO
RE B
S EN
TRY)
Biosimilar and Referenced
product-42% -24% 0% 14% -19% 7% 10% -1% -23% -26% -18% 18% -2% 40% -8% 17% -64% -46% -4% -33% -49% -31% 46% -7%
Biosimilar Accessible
market-42% -24% 0% 15% -19% 7% 10% -1% -23% -26% -18% 18% -2% 40% -8% 17% -64% -46% -4% -33% -49% -31% 46% -7%
Total market -50% -42% -22% -18% -33% -34% -25% -28% -39% -44% -15% -16% -30% -15% -35% -11% -70% -63% -37% -52% -58% -46% -5% -36%
VOLU
ME
TD
(202
1,JU
NEMAT
/YR
BEFO
RE B
S EN
TRY)
Biosimilar and Referenced
product627% 241% 50% 169% 598% 369% 311% 309% 608% 262% -1% 238% 745% 281% 277% 652% 990% 624% 207% 366% 327% 137% 390% 508%
Biosimilar Accessible
market627% 241% 150% 169% 598% 369% 311% 309% 608% 262% -1% 238% 745% 281% 277% 652% 990% 624% 207% 366% 327% 137% 390% 508%
Total market 303% 65% 303% 49% 219% 64% 88% 72% 135% 76% 0% 33% 138% 34% 53% 126% 174% 142% 27% 86% 67% 34% 67% 97%
TD per capita 1.17 1.56 0.46 1.20 0.72 0.80 1.67 0.97 1.61 1.08 0.01 0.43 2.21 0.49 1.48 2.51 0.12 0.69 0.26 1.66 0.78 0.65 1.04 0.81
TD/capita(Yr before BS
entrance)0.29 0.94 0.11 0.80 0.23 0.49 0.89 0.56 0.69 0.61 0.01 0.32 0.93 0.37 0.97 1.11 0.04 0.28 0.21 0.89 0.47 0.49 0.62 0.41
First Recorded sales of
Biosimilars2015 2015 2014 2016 2013 2015 2015 2015 2015 2015 2019 2014 2014 2015 2015 2013 2014 2013 2014 2015 2015 2014 2015 2013
* Only retail panel data is available for Greece
22 | The Impact of Biosimilar Competition in Europe
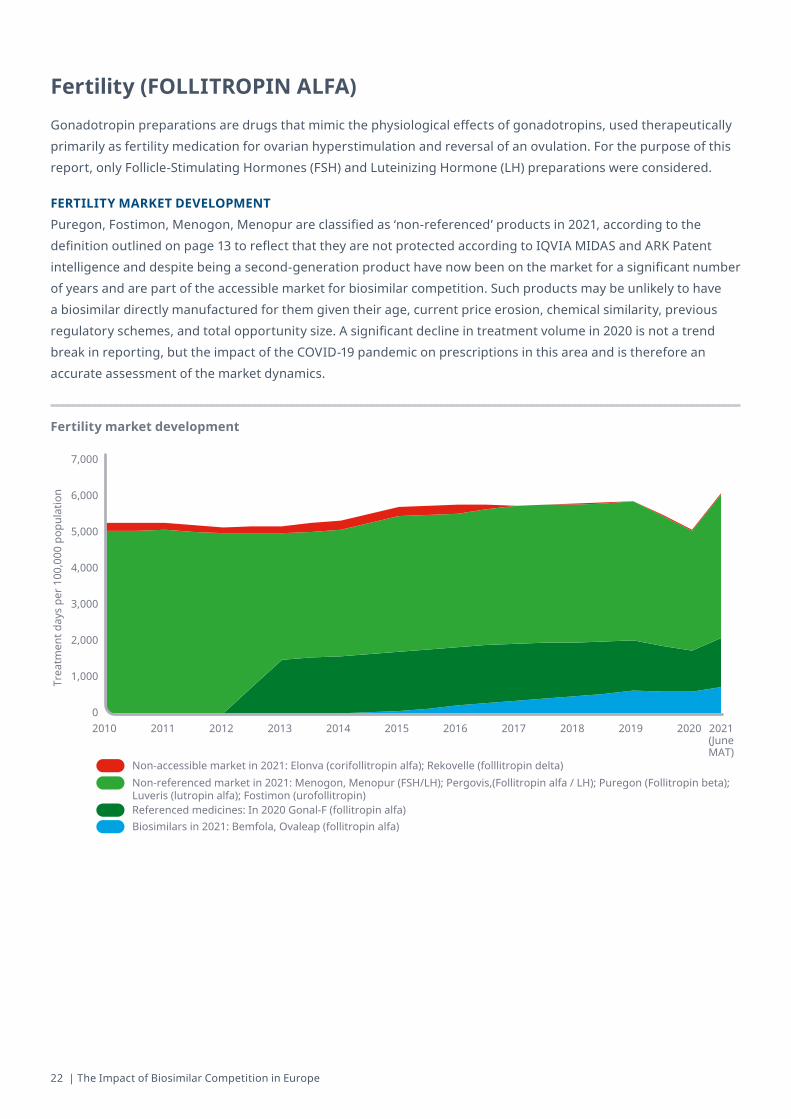
Fertility (FOLLITROPIN ALFA)Gonadotropin preparations are drugs that mimic the physiological effects of gonadotropins, used therapeutically primarily as fertility medication for ovarian hyperstimulation and reversal of an ovulation. For the purpose of this report, only Follicle-Stimulating Hormones (FSH) and Luteinizing Hormone (LH) preparations were considered.
FERTILITY MARKET DEVELOPMENTPuregon, Fostimon, Menogon, Menopur are classified as ‘non-referenced’ products in 2021, according to the definition outlined on page 13 to reflect that they are not protected according to IQVIA MIDAS and ARK Patent intelligence and despite being a second-generation product have now been on the market for a significant number of years and are part of the accessible market for biosimilar competition. Such products may be unlikely to have a biosimilar directly manufactured for them given their age, current price erosion, chemical similarity, previous regulatory schemes, and total opportunity size. A significant decline in treatment volume in 2020 is not a trend break in reporting, but the impact of the COVID-19 pandemic on prescriptions in this area and is therefore an accurate assessment of the market dynamics.
Fertility market development
Trea
tmen
t day
s pe
r 100
,000
pop
ulat
ion
2010 2011 2012 2013 2014 2015 2016 2017 2018 20202019 2021(JuneMAT)
7,000
6,000
5,000
4,000
3,000
2,000
1,000
0
Non-accessible market in 2021: Elonva (corifollitropin alfa); Rekovelle (folllitropin delta)Non-referenced market in 2021: Menogon, Menopur (FSH/LH); Pergovis,(Follitropin alfa / LH); Puregon (Follitropin beta); Luveris (lutropin alfa); Fostimon (urofollitropin)Referenced medicines: In 2020 Gonal-F (follitropin alfa)Biosimilars in 2021: Bemfola, Ovaleap (follitropin alfa)
iqvia.com | 23
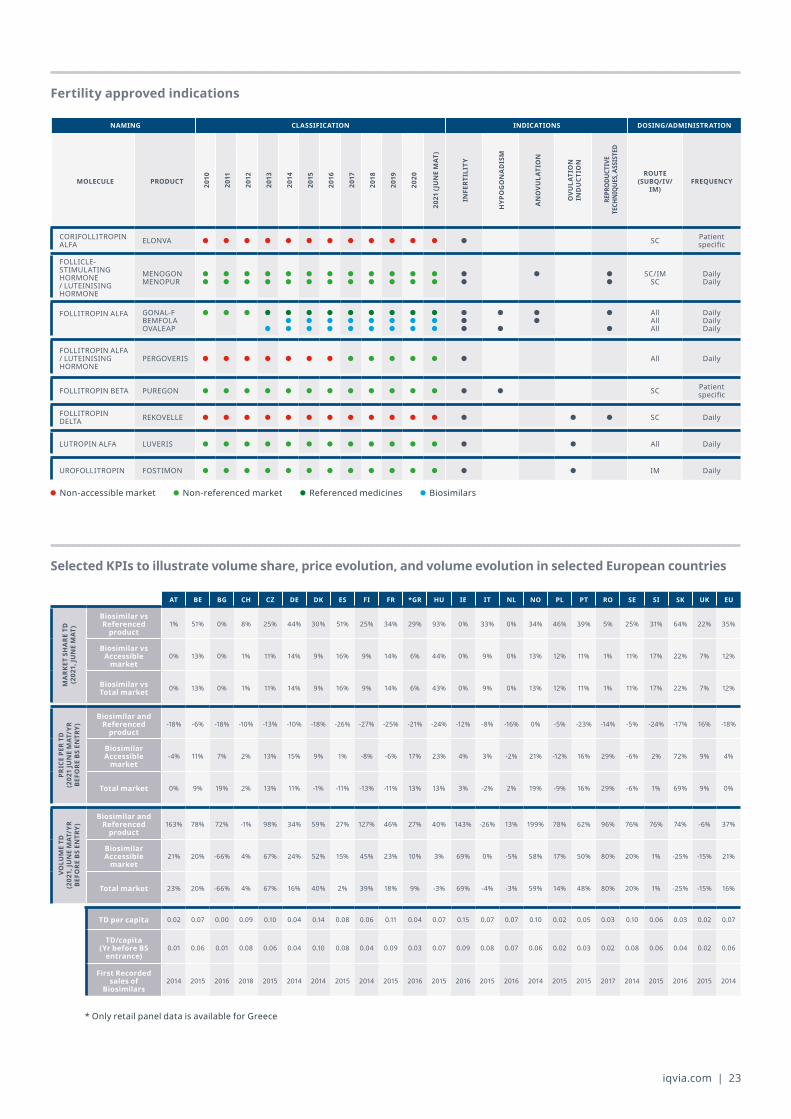
Fertility approved indications
Selected KPIs to illustrate volume share, price evolution, and volume evolution in selected European countries
AT BE BG CH CZ DE DK ES FI FR *GR HU IE IT NL NO PL PT RO SE SI SK UK EU
MA
RKET
SH
ARE
TD
(202
1,JU
NEMAT
)
Biosimilar vs Referenced
product1% 51% 0% 8% 25% 44% 30% 51% 25% 34% 29% 93% 0% 33% 0% 34% 46% 39% 5% 25% 31% 64% 22% 35%
Biosimilar vs Accessible
market0% 13% 0% 1% 11% 14% 9% 16% 9% 14% 6% 44% 0% 9% 0% 13% 12% 11% 1% 11% 17% 22% 7% 12%
Biosimilar vs Total market 0% 13% 0% 1% 11% 14% 9% 16% 9% 14% 6% 43% 0% 9% 0% 13% 12% 11% 1% 11% 17% 22% 7% 12%
PRIC
E PE
R TD
(202
1JU
NEMAT
/YR
BEFO
RE B
S EN
TRY)
Biosimilar and Referenced
product-18% -6% -18% -10% -13% -10% -18% -26% -27% -25% -21% -24% -12% -8% -16% 0% -5% -23% -14% -5% -24% -17% 16% -18%
Biosimilar Accessible
market-4% 11% 7% 2% 13% 15% 9% 1% -8% -6% 17% 23% 4% 3% -2% 21% -12% 16% 29% -6% 2% 72% 9% 4%
Total market 0% 9% 19% 2% 13% 11% -1% -11% -13% -11% 13% 13% 3% -2% 2% 19% -9% 16% 29% -6% 1% 69% 9% 0%
VOLU
ME
TD
(202
1,JU
NEMAT
/YR
BEFO
RE B
S EN
TRY)
Biosimilar and Referenced
product163% 78% 72% -1% 98% 34% 59% 27% 127% 46% 27% 40% 143% -26% 13% 199% 78% 62% 96% 76% 76% 74% -6% 37%
Biosimilar Accessible
market21% 20% -66% 4% 67% 24% 52% 15% 45% 23% 10% 3% 69% 0% -5% 58% 17% 50% 80% 20% 1% -25% -15% 21%
Total market 23% 20% -66% 4% 67% 16% 40% 2% 39% 18% 9% -3% 69% -4% -3% 59% 14% 48% 80% 20% 1% -25% -15% 16%
TD per capita 0.02 0.07 0.00 0.09 0.10 0.04 0.14 0.08 0.06 0.11 0.04 0.07 0.15 0.07 0.07 0.10 0.02 0.05 0.03 0.10 0.06 0.03 0.02 0.07
TD/capita(Yr before BS
entrance)0.01 0.06 0.01 0.08 0.06 0.04 0.10 0.08 0.04 0.09 0.03 0.07 0.09 0.08 0.07 0.06 0.02 0.03 0.02 0.08 0.06 0.04 0.02 0.06
First Recorded sales of
Biosimilars2014 2015 2016 2018 2015 2014 2014 2015 2014 2015 2016 2015 2016 2015 2016 2014 2015 2015 2017 2014 2015 2016 2015 2014
NAMING CLASSIFICATION INDICATIONS DOSING/ADMINISTRATION
MOLECULE PRODUCT 2010
2011
2012
2013
2014
2015
2016
2017
2018
2019
2020
2021(JUNEMAT
)
INFE
RTIL
ITY
HYP
OG
ON
AD
ISM
AN
OVU
LATI
ON
OVU
LATI
ON
IN
DU
CTIO
N
REPR
ODU
CTIV
E TE
CHN
IQUE
S, A
SSIS
TED
ROUTE (SUBQ/IV/
IM)FREQUENCY
CORIFOLLITROPIN ALFA ELONVA SC Patient
specific
FOLLICLE-STIMULATING HORMONE / LUTEINISING HORMONE
MENOGONMENOPUR
SC/IM SC
Daily Daily
FOLLITROPIN ALFA GONAL-FBEMFOLAOVALEAP
All All All
Daily Daily Daily
FOLLITROPIN ALFA / LUTEINISING HORMONE
PERGOVERIS All Daily
FOLLITROPIN BETA PUREGON SC Patient specific
FOLLITROPIN DELTA REKOVELLE SC Daily
LUTROPIN ALFA LUVERIS All Daily
UROFOLLITROPIN FOSTIMON IM Daily
Non-accessible market Non-referenced market Referenced medicines Biosimilars
* Only retail panel data is available for Greece
24 | The Impact of Biosimilar Competition in Europe
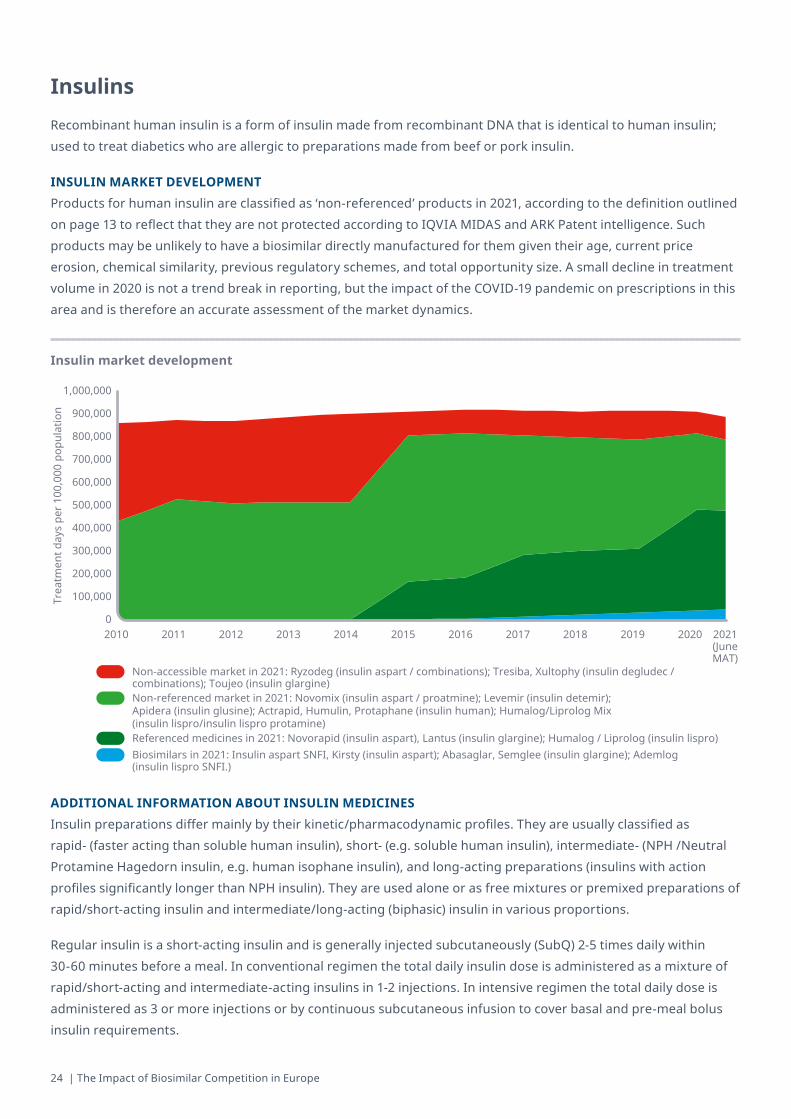
InsulinsRecombinant human insulin is a form of insulin made from recombinant DNA that is identical to human insulin; used to treat diabetics who are allergic to preparations made from beef or pork insulin.
INSULIN MARKET DEVELOPMENTProducts for human insulin are classified as ‘non-referenced’ products in 2021, according to the definition outlined on page 13 to reflect that they are not protected according to IQVIA MIDAS and ARK Patent intelligence. Such products may be unlikely to have a biosimilar directly manufactured for them given their age, current price erosion, chemical similarity, previous regulatory schemes, and total opportunity size. A small decline in treatment volume in 2020 is not a trend break in reporting, but the impact of the COVID-19 pandemic on prescriptions in this area and is therefore an accurate assessment of the market dynamics.
ADDITIONAL INFORMATION ABOUT INSULIN MEDICINESInsulin preparations differ mainly by their kinetic/pharmacodynamic profiles. They are usually classified as rapid- (faster acting than soluble human insulin), short- (e.g. soluble human insulin), intermediate- (NPH /Neutral Protamine Hagedorn insulin, e.g. human isophane insulin), and long-acting preparations (insulins with action profiles significantly longer than NPH insulin). They are used alone or as free mixtures or premixed preparations of rapid/short-acting insulin and intermediate/long-acting (biphasic) insulin in various proportions.
Regular insulin is a short-acting insulin and is generally injected subcutaneously (SubQ) 2-5 times daily within 30-60 minutes before a meal. In conventional regimen the total daily insulin dose is administered as a mixture of rapid/short-acting and intermediate-acting insulins in 1-2 injections. In intensive regimen the total daily dose is administered as 3 or more injections or by continuous subcutaneous infusion to cover basal and pre-meal bolus insulin requirements.
Insulin market development
Trea
tmen
t day
s pe
r 100
,000
pop
ulat
ion
2010 2011 2012 2013 2014 2015 2016 2017 2018 20202019 2021(JuneMAT)
1,000,000
900,000
800,000
700,000
600,000
500,000
400,000
300,000
200,000
100,000
0
Non-accessible market in 2021: Ryzodeg (insulin aspart / combinations); Tresiba, Xultophy (insulin degludec / combinations); Toujeo (insulin glargine)Non-referenced market in 2021: Novomix (insulin aspart / proatmine); Levemir (insulin detemir); Apidera (insulin glusine); Actrapid, Humulin, Protaphane (insulin human); Humalog/Liprolog Mix (insulin lispro/insulin lispro protamine) Referenced medicines in 2021: Novorapid (insulin aspart), Lantus (insulin glargine); Humalog / Liprolog (insulin lispro)Biosimilars in 2021: Insulin aspart SNFI, Kirsty (insulin aspart); Abasaglar, Semglee (insulin glargine); Ademlog (insulin lispro SNFI.)
iqvia.com | 25
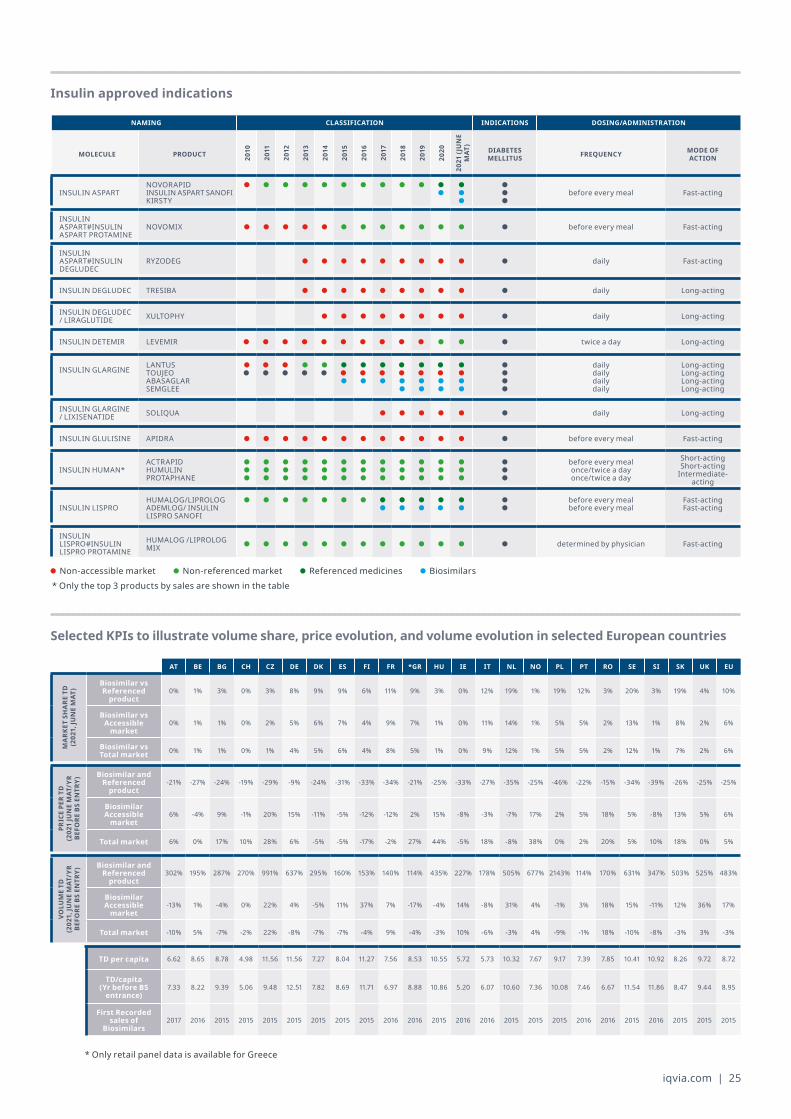
Insulin approved indications
Selected KPIs to illustrate volume share, price evolution, and volume evolution in selected European countries
NAMING CLASSIFICATION INDICATIONS DOSING/ADMINISTRATION
MOLECULE PRODUCT 2010
2011
2012
2013
2014
2015
2016
2017
2018
2019
2020
2021(JUNE
MAT
)
DIABETES MELLITUS FREQUENCY MODE OF
ACTION
INSULIN ASPARTNOVORAPIDINSULIN ASPART SANOFIKIRSTY
before every meal Fast-acting
INSULIN ASPART#INSULIN ASPART PROTAMINE
NOVOMIX before every meal Fast-acting
INSULIN ASPART#INSULIN DEGLUDEC
RYZODEG daily Fast-acting
INSULIN DEGLUDEC TRESIBA daily Long-acting
INSULIN DEGLUDEC / LIRAGLUTIDE XULTOPHY daily Long-acting
INSULIN DETEMIR LEVEMIR twice a day Long-acting
INSULIN GLARGINE LANTUSTOUJEOABASAGLARSEMGLEE
daily daily daily daily
Long-acting Long-acting Long-acting Long-acting
INSULIN GLARGINE / LIXISENATIDE SOLIQUA daily Long-acting
INSULIN GLULISINE APIDRA before every meal Fast-acting
INSULIN HUMAN*ACTRAPIDHUMULINPROTAPHANE
before every meal once/twice a day once/twice a day
Short-acting Short-acting
Intermediate-acting
INSULIN LISPROHUMALOG/LIPROLOGADEMLOG/ INSULIN LISPRO SANOFI
before every meal before every meal
Fast-acting Fast-acting
INSULIN LISPRO#INSULIN LISPRO PROTAMINE
HUMALOG /LIPROLOG MIX determined by physician Fast-acting
* Only the top 3 products by sales are shown in the table Non-accessible market Non-referenced market Referenced medicines Biosimilars
AT BE BG CH CZ DE DK ES FI FR *GR HU IE IT NL NO PL PT RO SE SI SK UK EU
MA
RKET
SH
ARE
TD
(202
1,JU
NEMAT
)
Biosimilar vs Referenced
product0% 1% 3% 0% 3% 8% 9% 9% 6% 11% 9% 3% 0% 12% 19% 1% 19% 12% 3% 20% 3% 19% 4% 10%
Biosimilar vs Accessible
market0% 1% 1% 0% 2% 5% 6% 7% 4% 9% 7% 1% 0% 11% 14% 1% 5% 5% 2% 13% 1% 8% 2% 6%
Biosimilar vs Total market 0% 1% 1% 0% 1% 4% 5% 6% 4% 8% 5% 1% 0% 9% 12% 1% 5% 5% 2% 12% 1% 7% 2% 6%
PRIC
E PE
R TD
(202
1JU
NEMAT
/YR
BEFO
RE B
S EN
TRY)
Biosimilar and Referenced
product-21% -27% -24% -19% -29% -9% -24% -31% -33% -34% -21% -25% -33% -27% -35% -25% -46% -22% -15% -34% -39% -26% -25% -25%
Biosimilar Accessible
market6% -4% 9% -1% 20% 15% -11% -5% -12% -12% 2% 15% -8% -3% -7% 17% 2% 5% 18% 5% -8% 13% 5% 6%
Total market 6% 0% 17% 10% 28% 6% -5% -5% -17% -2% 27% 44% -5% 18% -8% 38% 0% 2% 20% 5% 10% 18% 0% 5%
VOLU
ME
TD
(202
1,JU
NEMAT
/YR
BEFO
RE B
S EN
TRY)
Biosimilar and Referenced
product302% 195% 287% 270% 991% 637% 295% 160% 153% 140% 114% 435% 227% 178% 505% 677% 2143% 114% 170% 631% 347% 503% 525% 483%
Biosimilar Accessible
market-13% 1% -4% 0% 22% 4% -5% 11% 37% 7% -17% -4% 14% -8% 31% 4% -1% 3% 18% 15% -11% 12% 36% 17%
Total market -10% 5% -7% -2% 22% -8% -7% -7% -4% 9% -4% -3% 10% -6% -3% 4% -9% -1% 18% -10% -8% -3% 3% -3%
TD per capita 6.62 8.65 8.78 4.98 11.56 11.56 7.27 8.04 11.27 7.56 8.53 10.55 5.72 5.73 10.32 7.67 9.17 7.39 7.85 10.41 10.92 8.26 9.72 8.72
TD/capita(Yr before BS
entrance)7.33 8.22 9.39 5.06 9.48 12.51 7.82 8.69 11.71 6.97 8.88 10.86 5.20 6.07 10.60 7.36 10.08 7.46 6.67 11.54 11.86 8.47 9.44 8.95
First Recorded sales of
Biosimilars2017 2016 2015 2015 2015 2015 2015 2015 2015 2016 2016 2015 2016 2016 2015 2015 2015 2016 2016 2015 2016 2015 2015 2015
* Only retail panel data is available for Greece
26 | The Impact of Biosimilar Competition in Europe
OncologyMonoclonal Antibody Antineoplastic agents use monoclonal antibodies (mAb) to bind monospecifically to certain cells or proteins to treat cancer. The objective is that this treatment will stimulate the patient’s immune system to attack those cells.
In this market the non-accessible products are classified by identifying products which have a similar mechanism of action, and are used for similar indications to rituximab. There are both IV and SC forms of Mabthera available, but because the biosimilar is only available in IV form, Mabthera IV is classified as the referenced product, and Mabthera SC is classified as a non-referenced product.
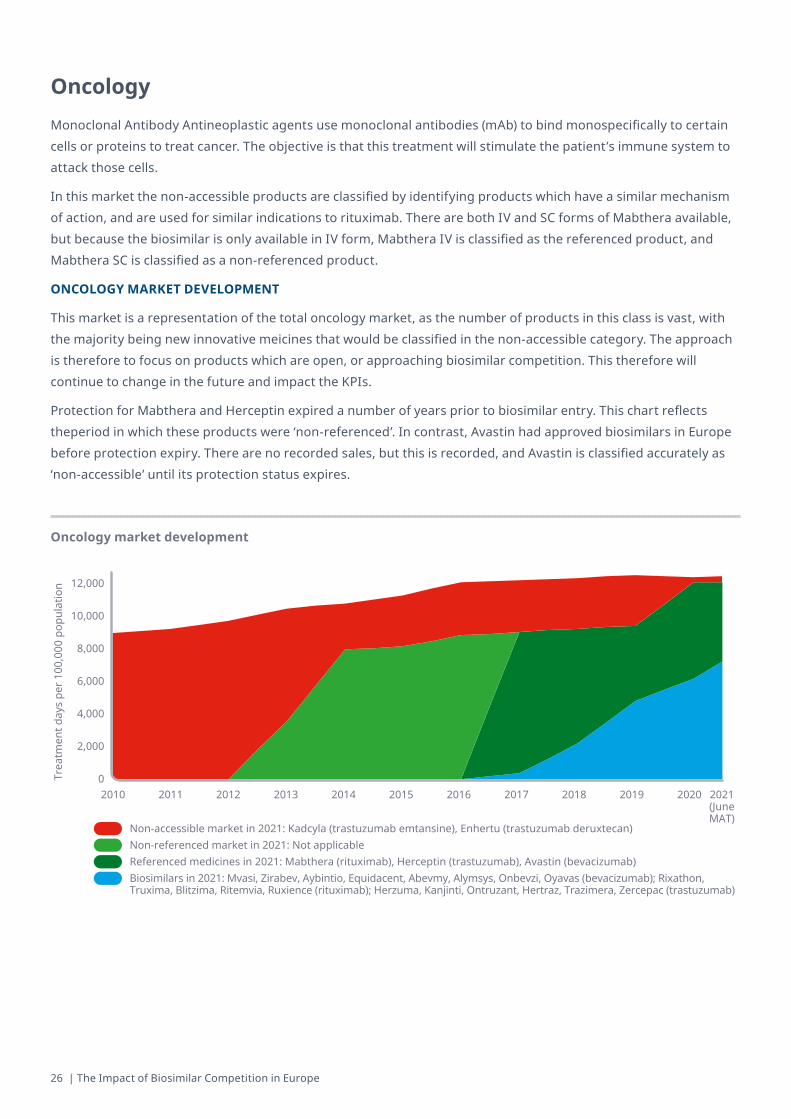
ONCOLOGY MARKET DEVELOPMENT
This market is a representation of the total oncology market, as the number of products in this class is vast, with the majority being new innovative meicines that would be classified in the non-accessible category. The approach is therefore to focus on products which are open, or approaching biosimilar competition. This therefore will continue to change in the future and impact the KPIs.
Protection for Mabthera and Herceptin expired a number of years prior to biosimilar entry. This chart reflects theperiod in which these products were ‘non-referenced’. In contrast, Avastin had approved biosimilars in Europe before protection expiry. There are no recorded sales, but this is recorded, and Avastin is classified accurately as ‘non-accessible’ until its protection status expires.
Oncology market development
Trea
tmen
t day
s pe
r 100
,000
pop
ulat
ion
2010 2011 2012 2013 2014 2015 2016 2017 2018 20202019 2021(JuneMAT)
12,000
10,000
8,000
6,000
4,000
2,000
0
Non-accessible market in 2021: Kadcyla (trastuzumab emtansine), Enhertu (trastuzumab deruxtecan)Non-referenced market in 2021: Not applicable Referenced medicines in 2021: Mabthera (rituximab), Herceptin (trastuzumab), Avastin (bevacizumab)Biosimilars in 2021: Mvasi, Zirabev, Aybintio, Equidacent, Abevmy, Alymsys, Onbevzi, Oyavas (bevacizumab); Rixathon, Truxima, Blitzima, Ritemvia, Ruxience (rituximab); Herzuma, Kanjinti, Ontruzant, Hertraz, Trazimera, Zercepac (trastuzumab)
iqvia.com | 27
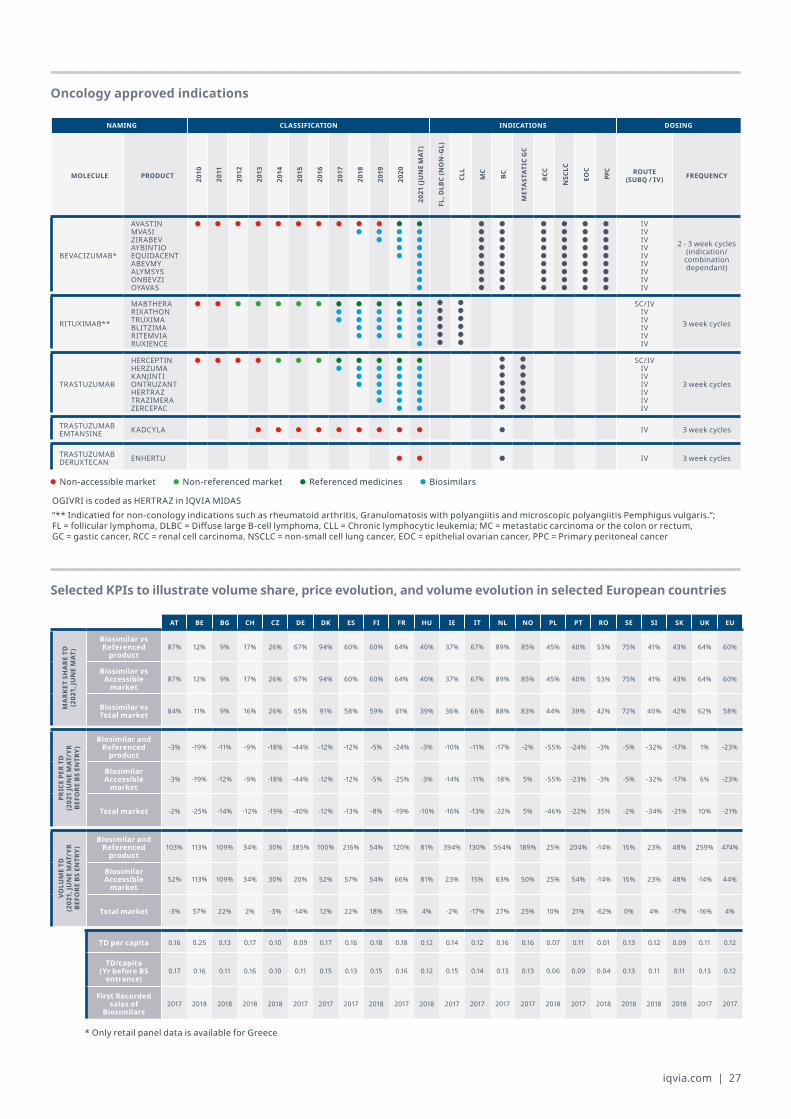
Oncology approved indications
Selected KPIs to illustrate volume share, price evolution, and volume evolution in selected European countries
AT BE BG CH CZ DE DK ES FI FR HU IE IT NL NO PL PT RO SE SI SK UK EU
MA
RKET
SH
ARE
TD
(202
1,JU
NEMAT
)
Biosimilar vs Referenced
product87% 12% 9% 17% 26% 67% 94% 60% 60% 64% 40% 37% 67% 89% 85% 45% 40% 53% 75% 41% 43% 64% 60%
Biosimilar vs Accessible
market87% 12% 9% 17% 26% 67% 94% 60% 60% 64% 40% 37% 67% 89% 85% 45% 40% 53% 75% 41% 43% 64% 60%
Biosimilar vs Total market 84% 11% 9% 16% 26% 65% 91% 58% 59% 61% 39% 36% 66% 88% 83% 44% 39% 42% 72% 40% 42% 62% 58%
PRIC
E PE
R TD
(202
1JU
NEMAT
/YR
BEFO
RE B
S EN
TRY)
Biosimilar and Referenced
product-3% -19% -11% -9% -18% -44% -12% -12% -5% -24% -3% -10% -11% -17% -2% -55% -24% -3% -5% -32% -17% 1% -23%
Biosimilar Accessible
market-3% -19% -12% -9% -18% -44% -12% -12% -5% -25% -3% -14% -11% -18% 5% -55% -23% -3% -5% -32% -17% 6% -23%
Total market -2% -25% -14% -12% -19% -40% -12% -13% -8% -19% -10% -16% -13% -22% 5% -46% -22% 35% -2% -34% -21% 10% -21%
VOLU
ME
TD
(202
1,JU
NEMAT
/YR
BEFO
RE B
S EN
TRY)
Biosimilar and Referenced
product103% 113% 109% 34% 30% 385% 100% 216% 54% 120% 81% 394% 130% 554% 189% 25% 204% -14% 15% 23% 48% 259% 474%
Biosimilar Accessible
market52% 113% 109% 34% 30% 20% 52% 57% 54% 66% 81% 23% 15% 63% 50% 25% 54% -14% 15% 23% 48% -14% 44%
Total market -3% 57% 22% 2% -3% -14% 12% 22% 18% 15% 4% -2% -17% 27% 25% 10% 21% -62% 0% 4% -17% -16% 4%
TD per capita 0.16 0.25 0.13 0.17 0.10 0.09 0.17 0.16 0.18 0.18 0.12 0.14 0.12 0.16 0.16 0.07 0.11 0.01 0.13 0.12 0.09 0.11 0.12
TD/capita(Yr before BS
entrance)0.17 0.16 0.11 0.16 0.10 0.11 0.15 0.13 0.15 0.16 0.12 0.15 0.14 0.13 0.13 0.06 0.09 0.04 0.13 0.11 0.11 0.13 0.12
First Recorded sales of
Biosimilars2017 2018 2018 2018 2018 2017 2017 2017 2018 2017 2018 2017 2017 2017 2017 2018 2017 2018 2018 2018 2018 2017 2017
NAMING CLASSIFICATION INDICATIONS DOSING
MOLECULE PRODUCT 2010
2011
2012
2013
2014
2015
2016
2017
2018
2019
2020
2021(JUNEMAT
)
FL, D
LBC
(NO
N-G
L)
CLL
MC
BC
MET
AST
ATIC
GC
RCC
NSC
LC
EOC
PPC ROUTE
(SUBQ/IV) FREQUENCY
BEVACIZUMAB*
AVASTINMVASIZIRABEVAYBINTIOEQUIDACENTABEVMYALYMSYSONBEVZIOYAVAS
IV IV IV IV IV IV IV IV IV
2 - 3 week cycles (indication/
combination dependant)
RITUXIMAB**
MABTHERARIXATHONTRUXIMABLITZIMARITEMVIARUXIENCE
SC/IV IV IV IV IV IV
3 week cycles
TRASTUZUMAB
HERCEPTINHERZUMAKANJINTIONTRUZANTHERTRAZTRAZIMERAZERCEPAC
SC/IV IV IV IV IV IV IV
3 week cycles
TRASTUZUMAB EMTANSINE KADCYLA IV 3 week cycles
TRASTUZUMAB DERUXTECAN ENHERTU IV 3 week cycles
OGIVRI is coded as HERTRAZ in IQVIA MIDAS“** Indicatied for non-conology indications such as rheumatoid arthritis, Granulomatosis with polyangiitis and microscopic polyangiitis Pemphigus vulgaris.“; FL = follicular lymphoma, DLBC = Diffuse large B-cell lymphoma, CLL = Chronic lymphocytic leukemia; MC = metastatic carcinoma or the colon or rectum, GC = gastic cancer, RCC = renal cell carcinoma, NSCLC = non-small cell lung cancer, EOC = epithelial ovarian cancer, PPC = Primary peritoneal cancer
Non-accessible market Non-referenced market Referenced medicines Biosimilars
* Only retail panel data is available for Greece
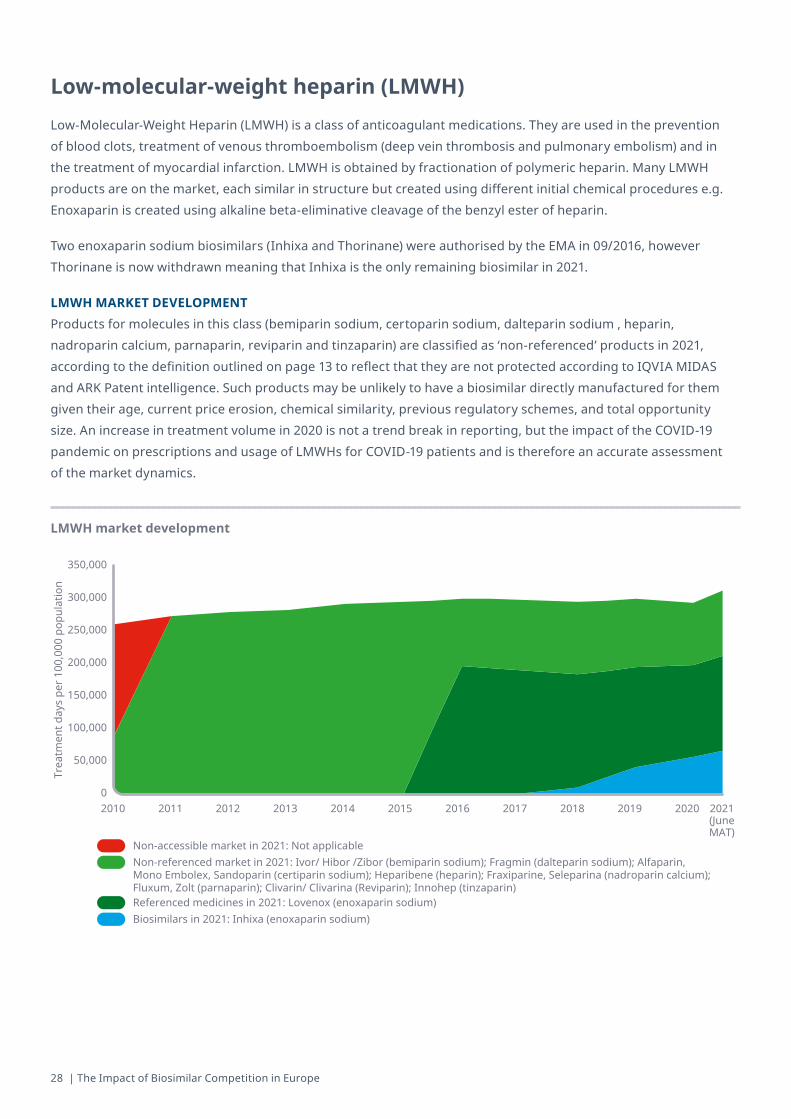
28 | The Impact of Biosimilar Competition in Europe
Low-molecular-weight heparin (LMWH)Low-Molecular-Weight Heparin (LMWH) is a class of anticoagulant medications. They are used in the prevention of blood clots, treatment of venous thromboembolism (deep vein thrombosis and pulmonary embolism) and in the treatment of myocardial infarction. LMWH is obtained by fractionation of polymeric heparin. Many LMWH products are on the market, each similar in structure but created using different initial chemical procedures e.g. Enoxaparin is created using alkaline beta-eliminative cleavage of the benzyl ester of heparin.
Two enoxaparin sodium biosimilars (Inhixa and Thorinane) were authorised by the EMA in 09/2016, however Thorinane is now withdrawn meaning that Inhixa is the only remaining biosimilar in 2021.
LMWH MARKET DEVELOPMENTProducts for molecules in this class (bemiparin sodium, certoparin sodium, dalteparin sodium , heparin, nadroparin calcium, parnaparin, reviparin and tinzaparin) are classified as ‘non-referenced’ products in 2021, according to the definition outlined on page 13 to reflect that they are not protected according to IQVIA MIDAS and ARK Patent intelligence. Such products may be unlikely to have a biosimilar directly manufactured for them given their age, current price erosion, chemical similarity, previous regulatory schemes, and total opportunity size. An increase in treatment volume in 2020 is not a trend break in reporting, but the impact of the COVID-19 pandemic on prescriptions and usage of LMWHs for COVID-19 patients and is therefore an accurate assessment of the market dynamics.
LMWH market development
Trea
tmen
t day
s pe
r 100
,000
pop
ulat
ion
2010 2011 2012 2013 2014 2015 2016 2017 2018 20202019 2021(JuneMAT)
350,000
300,000
250,000
200,000
150,000
100,000
50,000
0
Non-accessible market in 2021: Not applicableNon-referenced market in 2021: Ivor/ Hibor /Zibor (bemiparin sodium); Fragmin (dalteparin sodium); Alfaparin, Mono Embolex, Sandoparin (certiparin sodium); Heparibene (heparin); Fraxiparine, Seleparina (nadroparin calcium); Fluxum, Zolt (parnaparin); Clivarin/ Clivarina (Reviparin); Innohep (tinzaparin)Referenced medicines in 2021: Lovenox (enoxaparin sodium)Biosimilars in 2021: Inhixa (enoxaparin sodium)
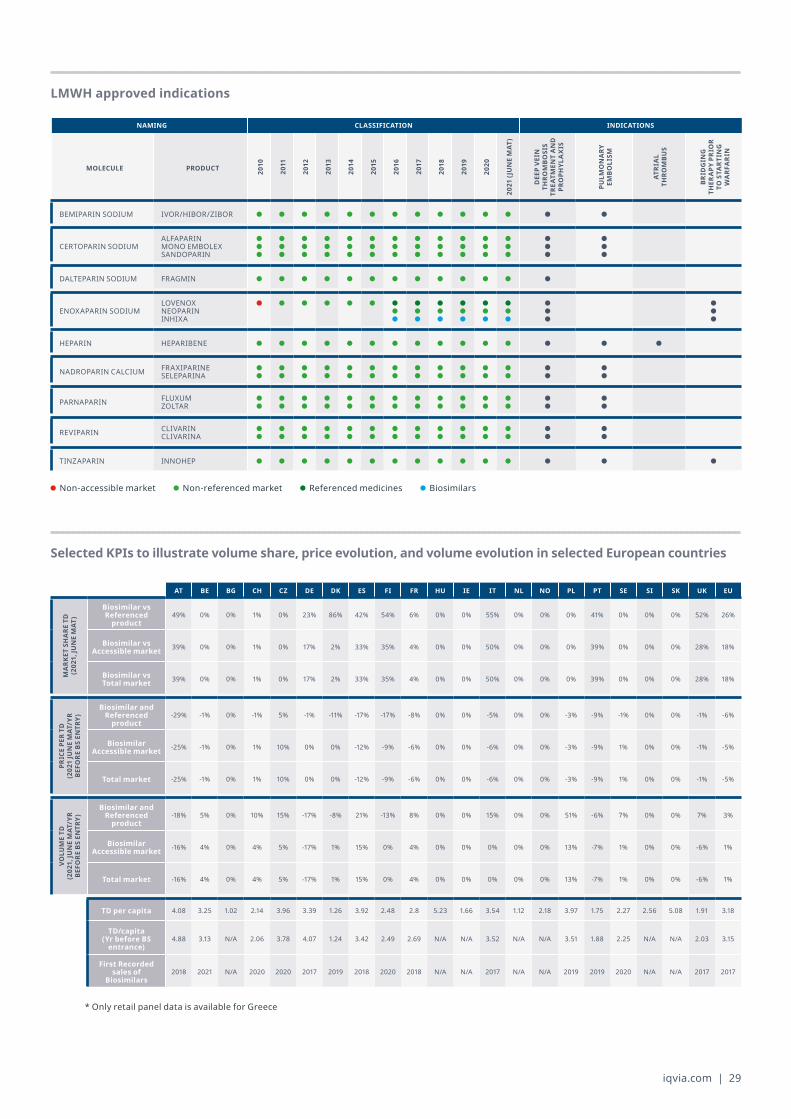
iqvia.com | 29
LMWH approved indications
Selected KPIs to illustrate volume share, price evolution, and volume evolution in selected European countries
NAMING CLASSIFICATION INDICATIONS
MOLECULE PRODUCT 2010
2011
2012
2013
2014
2015
2016
2017
2018
2019
2020
2021(JUNEMAT
)
DEE
P VE
IN
THRO
MBO
SIS
TREA
TMEN
T A
ND
PR
OPH
YLA
XIS
PULM
ON
ARY
EM
BOLI
SM
ATR
IAL
THRO
MBU
S
BRID
GIN
G
THER
APY
PR
IOR
TO S
TART
ING
W
ARF
AR
IN
BEMIPARIN SODIUM IVOR/HIBOR/ZIBOR
CERTOPARIN SODIUMALFAPARINMONO EMBOLEXSANDOPARIN
DALTEPARIN SODIUM FRAGMIN
ENOXAPARIN SODIUMLOVENOXNEOPARININHIXA
HEPARIN HEPARIBENE
NADROPARIN CALCIUM FRAXIPARINE SELEPARINA
PARNAPARIN FLUXUM ZOLTAR
REVIPARIN CLIVARIN CLIVARINA
TINZAPARIN INNOHEP
Non-accessible market Non-referenced market Referenced medicines Biosimilars
* Only retail panel data is available for Greece
AT BE BG CH CZ DE DK ES FI FR HU IE IT NL NO PL PT SE SI SK UK EU
MA
RKET
SH
ARE
TD
(202
1,JU
NEMAT
)
Biosimilar vs Referenced
product49% 0% 0% 1% 0% 23% 86% 42% 54% 6% 0% 0% 55% 0% 0% 0% 41% 0% 0% 0% 52% 26%
Biosimilar vs Accessible market 39% 0% 0% 1% 0% 17% 2% 33% 35% 4% 0% 0% 50% 0% 0% 0% 39% 0% 0% 0% 28% 18%
Biosimilar vs Total market 39% 0% 0% 1% 0% 17% 2% 33% 35% 4% 0% 0% 50% 0% 0% 0% 39% 0% 0% 0% 28% 18%
PRIC
E PE
R TD
(202
1JU
NEMAT
/YR
BEFO
RE B
S EN
TRY)
Biosimilar and Referenced
product-29% -1% 0% -1% 5% -1% -11% -17% -17% -8% 0% 0% -5% 0% 0% -3% -9% -1% 0% 0% -1% -6%
Biosimilar Accessible market -25% -1% 0% 1% 10% 0% 0% -12% -9% -6% 0% 0% -6% 0% 0% -3% -9% 1% 0% 0% -1% -5%
Total market -25% -1% 0% 1% 10% 0% 0% -12% -9% -6% 0% 0% -6% 0% 0% -3% -9% 1% 0% 0% -1% -5%
VOLU
ME
TD
(202
1,JU
NEMAT
/YR
BEFO
RE B
S EN
TRY)
Biosimilar and Referenced
product-18% 5% 0% 10% 15% -17% -8% 21% -13% 8% 0% 0% 15% 0% 0% 51% -6% 7% 0% 0% 7% 3%
Biosimilar Accessible market -16% 4% 0% 4% 5% -17% 1% 15% 0% 4% 0% 0% 0% 0% 0% 13% -7% 1% 0% 0% -6% 1%
Total market -16% 4% 0% 4% 5% -17% 1% 15% 0% 4% 0% 0% 0% 0% 0% 13% -7% 1% 0% 0% -6% 1%
TD per capita 4.08 3.25 1.02 2.14 3.96 3.39 1.26 3.92 2.48 2.8 5.23 1.66 3.54 1.12 2.18 3.97 1.75 2.27 2.56 5.08 1.91 3.18
TD/capita(Yr before BS
entrance)4.88 3.13 N/A 2.06 3.78 4.07 1.24 3.42 2.49 2.69 N/A N/A 3.52 N/A N/A 3.51 1.88 2.25 N/A N/A 2.03 3.15
First Recorded sales of
Biosimilars2018 2021 N/A 2020 2020 2017 2019 2018 2020 2018 N/A N/A 2017 N/A N/A 2019 2019 2020 N/A N/A 2017 2017
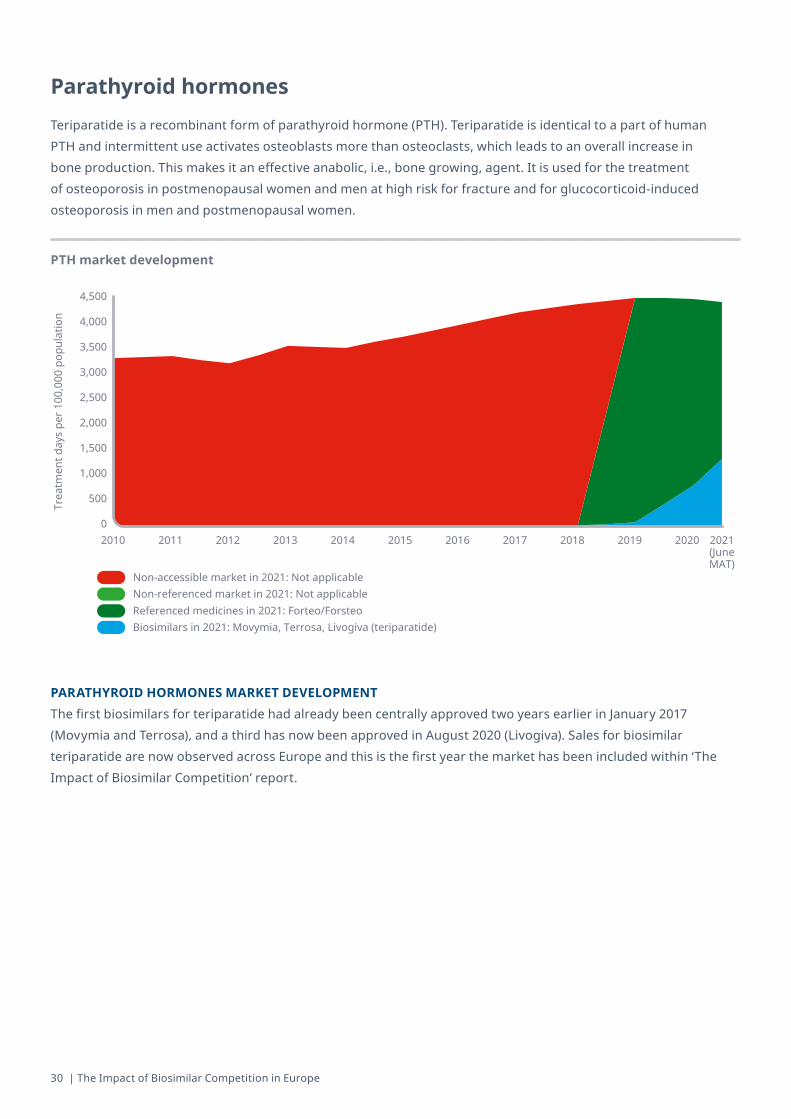
30 | The Impact of Biosimilar Competition in Europe
Parathyroid hormones Teriparatide is a recombinant form of parathyroid hormone (PTH). Teriparatide is identical to a part of human PTH and intermittent use activates osteoblasts more than osteoclasts, which leads to an overall increase in bone production. This makes it an effective anabolic, i.e., bone growing, agent. It is used for the treatment of osteoporosis in postmenopausal women and men at high risk for fracture and for glucocorticoid-induced osteoporosis in men and postmenopausal women.
PARATHYROID HORMONES MARKET DEVELOPMENTThe first biosimilars for teriparatide had already been centrally approved two years earlier in January 2017 (Movymia and Terrosa), and a third has now been approved in August 2020 (Livogiva). Sales for biosimilar teriparatide are now observed across Europe and this is the first year the market has been included within ‘The Impact of Biosimilar Competition’ report.
PTH market development
Trea
tmen
t day
s pe
r 100
,000
pop
ulat
ion
2010 2011 2012 2013 2014 2015 2016 2017 2018 20202019 2021(JuneMAT)
4,500
4,000
3,500
3,000
2,500
2,000
1,500
1,000
500
0
Non-accessible market in 2021: Not applicable Non-referenced market in 2021: Not applicable Referenced medicines in 2021: Forteo/ForsteoBiosimilars in 2021: Movymia, Terrosa, Livogiva (teriparatide)
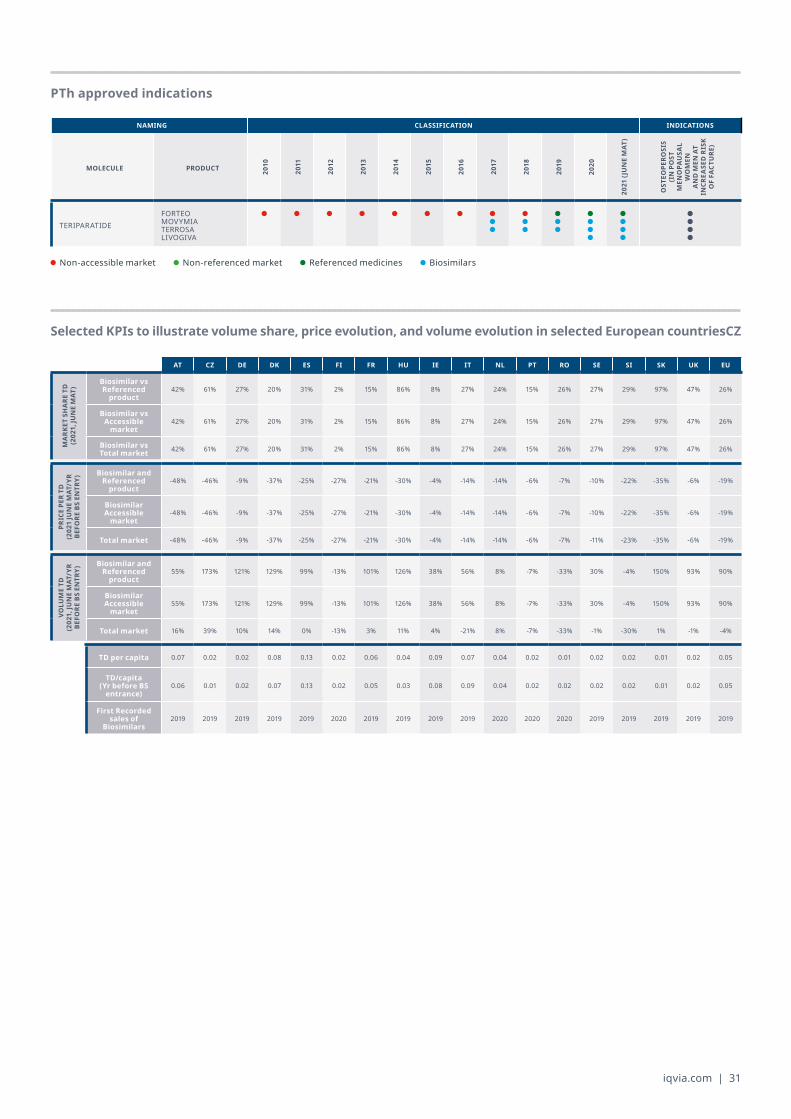
iqvia.com | 31
PTh approved indications
Selected KPIs to illustrate volume share, price evolution, and volume evolution in selected European countriesCZ
AT CZ DE DK ES FI FR HU IE IT NL PT RO SE SI SK UK EU
MA
RKET
SH
ARE
TD
(202
1,JU
NEMAT
)
Biosimilar vs Referenced
product42% 61% 27% 20% 31% 2% 15% 86% 8% 27% 24% 15% 26% 27% 29% 97% 47% 26%
Biosimilar vs Accessible
market42% 61% 27% 20% 31% 2% 15% 86% 8% 27% 24% 15% 26% 27% 29% 97% 47% 26%
Biosimilar vs Total market 42% 61% 27% 20% 31% 2% 15% 86% 8% 27% 24% 15% 26% 27% 29% 97% 47% 26%
PRIC
E PE
R TD
(202
1JU
NEMAT
/YR
BEFO
RE B
S EN
TRY)
Biosimilar and Referenced
product-48% -46% -9% -37% -25% -27% -21% -30% -4% -14% -14% -6% -7% -10% -22% -35% -6% -19%
Biosimilar Accessible
market-48% -46% -9% -37% -25% -27% -21% -30% -4% -14% -14% -6% -7% -10% -22% -35% -6% -19%
Total market -48% -46% -9% -37% -25% -27% -21% -30% -4% -14% -14% -6% -7% -11% -23% -35% -6% -19%
VOLU
ME
TD
(202
1,JU
NEMAT
/YR
BEFO
RE B
S EN
TRY)
Biosimilar and Referenced
product55% 173% 121% 129% 99% -13% 101% 126% 38% 56% 8% -7% -33% 30% -4% 150% 93% 90%
Biosimilar Accessible
market55% 173% 121% 129% 99% -13% 101% 126% 38% 56% 8% -7% -33% 30% -4% 150% 93% 90%
Total market 16% 39% 10% 14% 0% -13% 3% 11% 4% -21% 8% -7% -33% -1% -30% 1% -1% -4%
TD per capita 0.07 0.02 0.02 0.08 0.13 0.02 0.06 0.04 0.09 0.07 0.04 0.02 0.01 0.02 0.02 0.01 0.02 0.05
TD/capita(Yr before BS
entrance)0.06 0.01 0.02 0.07 0.13 0.02 0.05 0.03 0.08 0.09 0.04 0.02 0.02 0.02 0.02 0.01 0.02 0.05
First Recorded sales of
Biosimilars2019 2019 2019 2019 2019 2020 2019 2019 2019 2019 2020 2020 2020 2019 2019 2019 2019 2019
NAMING CLASSIFICATION INDICATIONS
MOLECULE PRODUCT 2010
2011
2012
2013
2014
2015
2016
2017
2018
2019
2020
2021(JUNEMAT
)
OST
EOPE
ROSI
S (I
N P
OST
M
ENO
PAU
SAL
WO
MEN
A
ND
MEN
AT
INCR
EASE
D R
ISK
OF
FACT
URE
)
TERIPARATIDEFORTEOMOVYMIATERROSALIVOGIVA
Non-accessible market Non-referenced market Referenced medicines Biosimilars
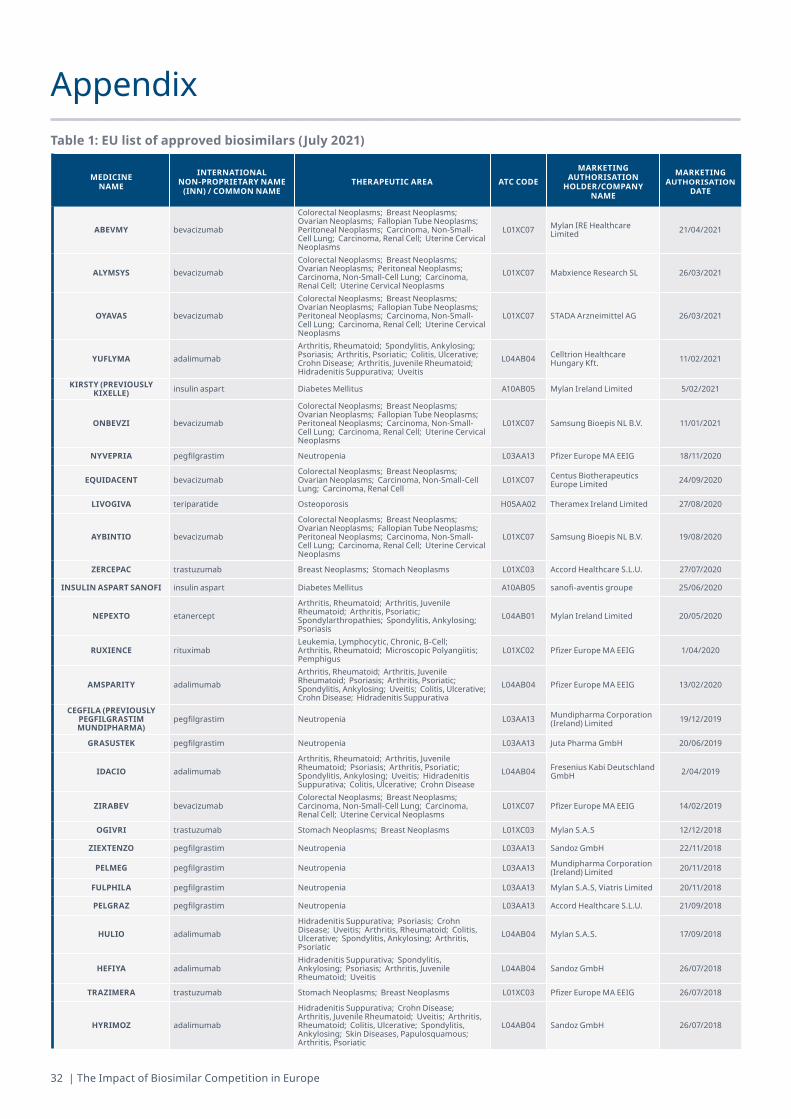
32 | The Impact of Biosimilar Competition in Europe
AppendixTable1:EUlistofapprovedbiosimilars(July2021)
MEDICINE NAME
INTERNATIONAL NON-PROPRIETARY NAME (INN)/COMMONNAME
THERAPEUTIC AREA ATC CODEMARKETING
AUTHORISATION HOLDER/COMPANY
NAME
MARKETING AUTHORISATION
DATE
ABEVMY bevacizumab
Colorectal Neoplasms; Breast Neoplasms; Ovarian Neoplasms; Fallopian Tube Neoplasms; Peritoneal Neoplasms; Carcinoma, Non-Small-Cell Lung; Carcinoma, Renal Cell; Uterine Cervical Neoplasms
L01XC07 Mylan IRE Healthcare Limited 21/04/2021
ALYMSYS bevacizumabColorectal Neoplasms; Breast Neoplasms; Ovarian Neoplasms; Peritoneal Neoplasms; Carcinoma, Non-Small-Cell Lung; Carcinoma, Renal Cell; Uterine Cervical Neoplasms
L01XC07 Mabxience Research SL 26/03/2021
OYAVAS bevacizumab
Colorectal Neoplasms; Breast Neoplasms; Ovarian Neoplasms; Fallopian Tube Neoplasms; Peritoneal Neoplasms; Carcinoma, Non-Small-Cell Lung; Carcinoma, Renal Cell; Uterine Cervical Neoplasms
L01XC07 STADA Arzneimittel AG 26/03/2021
YUFLYMA adalimumabArthritis, Rheumatoid; Spondylitis, Ankylosing; Psoriasis; Arthritis, Psoriatic; Colitis, Ulcerative; Crohn Disease; Arthritis, Juvenile Rheumatoid; Hidradenitis Suppurativa; Uveitis
L04AB04 Celltrion Healthcare Hungary Kft. 11/02/2021
KIRSTY (PREVIOUSLY KIXELLE) insulin aspart Diabetes Mellitus A10AB05 Mylan Ireland Limited 5/02/2021
ONBEVZI bevacizumab
Colorectal Neoplasms; Breast Neoplasms; Ovarian Neoplasms; Fallopian Tube Neoplasms; Peritoneal Neoplasms; Carcinoma, Non-Small-Cell Lung; Carcinoma, Renal Cell; Uterine Cervical Neoplasms
L01XC07 Samsung Bioepis NL B.V. 11/01/2021
NYVEPRIA pegfilgrastim Neutropenia L03AA13 Pfizer Europe MA EEIG 18/11/2020
EQUIDACENT bevacizumabColorectal Neoplasms; Breast Neoplasms; Ovarian Neoplasms; Carcinoma, Non-Small-Cell Lung; Carcinoma, Renal Cell
L01XC07 Centus Biotherapeutics Europe Limited 24/09/2020
LIVOGIVA teriparatide Osteoporosis H05AA02 Theramex Ireland Limited 27/08/2020
AYBINTIO bevacizumab
Colorectal Neoplasms; Breast Neoplasms; Ovarian Neoplasms; Fallopian Tube Neoplasms; Peritoneal Neoplasms; Carcinoma, Non-Small-Cell Lung; Carcinoma, Renal Cell; Uterine Cervical Neoplasms
L01XC07 Samsung Bioepis NL B.V. 19/08/2020
ZERCEPAC trastuzumab Breast Neoplasms; Stomach Neoplasms L01XC03 Accord Healthcare S.L.U. 27/07/2020
INSULIN ASPART SANOFI insulin aspart Diabetes Mellitus A10AB05 sanofi-aventis groupe 25/06/2020
NEPEXTO etanerceptArthritis, Rheumatoid; Arthritis, Juvenile Rheumatoid; Arthritis, Psoriatic; Spondylarthropathies; Spondylitis, Ankylosing; Psoriasis
L04AB01 Mylan Ireland Limited 20/05/2020
RUXIENCE rituximabLeukemia, Lymphocytic, Chronic, B-Cell; Arthritis, Rheumatoid; Microscopic Polyangiitis; Pemphigus
L01XC02 Pfizer Europe MA EEIG 1/04/2020
AMSPARITY adalimumabArthritis, Rheumatoid; Arthritis, Juvenile Rheumatoid; Psoriasis; Arthritis, Psoriatic; Spondylitis, Ankylosing; Uveitis; Colitis, Ulcerative; Crohn Disease; Hidradenitis Suppurativa
L04AB04 Pfizer Europe MA EEIG 13/02/2020
CEGFILA (PREVIOUSLY PEGFILGRASTIM MUNDIPHARMA)
pegfilgrastim Neutropenia L03AA13 Mundipharma Corporation (Ireland) Limited 19/12/2019
GRASUSTEK pegfilgrastim Neutropenia L03AA13 Juta Pharma GmbH 20/06/2019
IDACIO adalimumabArthritis, Rheumatoid; Arthritis, Juvenile Rheumatoid; Psoriasis; Arthritis, Psoriatic; Spondylitis, Ankylosing; Uveitis; Hidradenitis Suppurativa; Colitis, Ulcerative; Crohn Disease
L04AB04 Fresenius Kabi Deutschland GmbH 2/04/2019
ZIRABEV bevacizumabColorectal Neoplasms; Breast Neoplasms; Carcinoma, Non-Small-Cell Lung; Carcinoma, Renal Cell; Uterine Cervical Neoplasms
L01XC07 Pfizer Europe MA EEIG 14/02/2019
OGIVRI trastuzumab Stomach Neoplasms; Breast Neoplasms L01XC03 Mylan S.A.S 12/12/2018
ZIEXTENZO pegfilgrastim Neutropenia L03AA13 Sandoz GmbH 22/11/2018
PELMEG pegfilgrastim Neutropenia L03AA13 Mundipharma Corporation (Ireland) Limited 20/11/2018
FULPHILA pegfilgrastim Neutropenia L03AA13 Mylan S.A.S, Viatris Limited 20/11/2018
PELGRAZ pegfilgrastim Neutropenia L03AA13 Accord Healthcare S.L.U. 21/09/2018
HULIO adalimumabHidradenitis Suppurativa; Psoriasis; Crohn Disease; Uveitis; Arthritis, Rheumatoid; Colitis, Ulcerative; Spondylitis, Ankylosing; Arthritis, Psoriatic
L04AB04 Mylan S.A.S. 17/09/2018
HEFIYA adalimumabHidradenitis Suppurativa; Spondylitis, Ankylosing; Psoriasis; Arthritis, Juvenile Rheumatoid; Uveitis
L04AB04 Sandoz GmbH 26/07/2018
TRAZIMERA trastuzumab Stomach Neoplasms; Breast Neoplasms L01XC03 Pfizer Europe MA EEIG 26/07/2018
HYRIMOZ adalimumab
Hidradenitis Suppurativa; Crohn Disease; Arthritis, Juvenile Rheumatoid; Uveitis; Arthritis, Rheumatoid; Colitis, Ulcerative; Spondylitis, Ankylosing; Skin Diseases, Papulosquamous; Arthritis, Psoriatic
L04AB04 Sandoz GmbH 26/07/2018
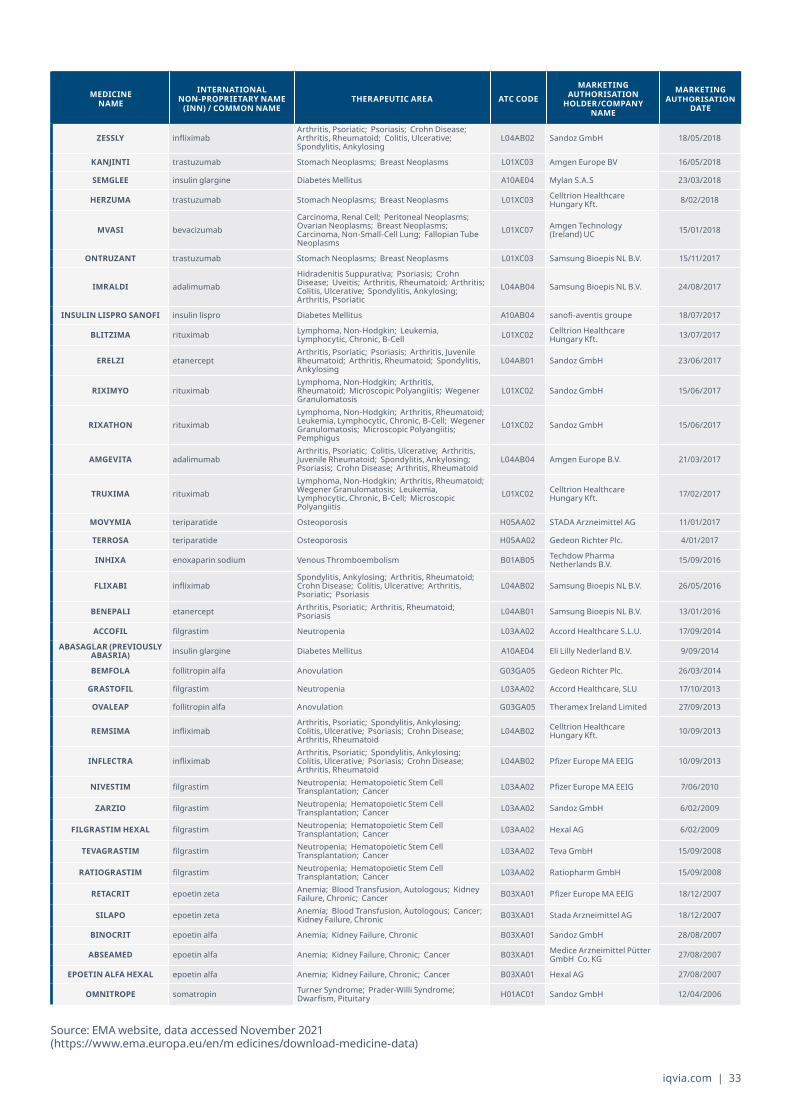
iqvia.com | 33
ZESSLY infliximabArthritis, Psoriatic; Psoriasis; Crohn Disease; Arthritis, Rheumatoid; Colitis, Ulcerative; Spondylitis, Ankylosing
L04AB02 Sandoz GmbH 18/05/2018
KANJINTI trastuzumab Stomach Neoplasms; Breast Neoplasms L01XC03 Amgen Europe BV 16/05/2018
SEMGLEE insulin glargine Diabetes Mellitus A10AE04 Mylan S.A.S 23/03/2018
HERZUMA trastuzumab Stomach Neoplasms; Breast Neoplasms L01XC03 Celltrion Healthcare Hungary Kft. 8/02/2018
MVASI bevacizumabCarcinoma, Renal Cell; Peritoneal Neoplasms; Ovarian Neoplasms; Breast Neoplasms; Carcinoma, Non-Small-Cell Lung; Fallopian Tube Neoplasms
L01XC07 Amgen Technology (Ireland) UC 15/01/2018
ONTRUZANT trastuzumab Stomach Neoplasms; Breast Neoplasms L01XC03 Samsung Bioepis NL B.V. 15/11/2017
IMRALDI adalimumabHidradenitis Suppurativa; Psoriasis; Crohn Disease; Uveitis; Arthritis, Rheumatoid; Arthritis; Colitis, Ulcerative; Spondylitis, Ankylosing; Arthritis, Psoriatic
L04AB04 Samsung Bioepis NL B.V. 24/08/2017
INSULIN LISPRO SANOFI insulin lispro Diabetes Mellitus A10AB04 sanofi-aventis groupe 18/07/2017
BLITZIMA rituximab Lymphoma, Non-Hodgkin; Leukemia, Lymphocytic, Chronic, B-Cell L01XC02 Celltrion Healthcare
Hungary Kft. 13/07/2017
ERELZI etanerceptArthritis, Psoriatic; Psoriasis; Arthritis, Juvenile Rheumatoid; Arthritis, Rheumatoid; Spondylitis, Ankylosing
L04AB01 Sandoz GmbH 23/06/2017
RIXIMYO rituximabLymphoma, Non-Hodgkin; Arthritis, Rheumatoid; Microscopic Polyangiitis; Wegener Granulomatosis
L01XC02 Sandoz GmbH 15/06/2017
RIXATHON rituximabLymphoma, Non-Hodgkin; Arthritis, Rheumatoid; Leukemia, Lymphocytic, Chronic, B-Cell; Wegener Granulomatosis; Microscopic Polyangiitis; Pemphigus
L01XC02 Sandoz GmbH 15/06/2017
AMGEVITA adalimumabArthritis, Psoriatic; Colitis, Ulcerative; Arthritis, Juvenile Rheumatoid; Spondylitis, Ankylosing; Psoriasis; Crohn Disease; Arthritis, Rheumatoid
L04AB04 Amgen Europe B.V. 21/03/2017
TRUXIMA rituximabLymphoma, Non-Hodgkin; Arthritis, Rheumatoid; Wegener Granulomatosis; Leukemia, Lymphocytic, Chronic, B-Cell; Microscopic Polyangiitis
L01XC02 Celltrion Healthcare Hungary Kft. 17/02/2017
MOVYMIA teriparatide Osteoporosis H05AA02 STADA Arzneimittel AG 11/01/2017
TERROSA teriparatide Osteoporosis H05AA02 Gedeon Richter Plc. 4/01/2017
INHIXA enoxaparin sodium Venous Thromboembolism B01AB05 Techdow Pharma Netherlands B.V. 15/09/2016
FLIXABI infliximabSpondylitis, Ankylosing; Arthritis, Rheumatoid; Crohn Disease; Colitis, Ulcerative; Arthritis, Psoriatic; Psoriasis
L04AB02 Samsung Bioepis NL B.V. 26/05/2016
BENEPALI etanercept Arthritis, Psoriatic; Arthritis, Rheumatoid; Psoriasis L04AB01 Samsung Bioepis NL B.V. 13/01/2016
ACCOFIL filgrastim Neutropenia L03AA02 Accord Healthcare S.L.U. 17/09/2014
ABASAGLAR (PREVIOUSLY ABASRIA) insulin glargine Diabetes Mellitus A10AE04 Eli Lilly Nederland B.V. 9/09/2014
BEMFOLA follitropin alfa Anovulation G03GA05 Gedeon Richter Plc. 26/03/2014
GRASTOFIL filgrastim Neutropenia L03AA02 Accord Healthcare, SLU 17/10/2013
OVALEAP follitropin alfa Anovulation G03GA05 Theramex Ireland Limited 27/09/2013
REMSIMA infliximabArthritis, Psoriatic; Spondylitis, Ankylosing; Colitis, Ulcerative; Psoriasis; Crohn Disease; Arthritis, Rheumatoid
L04AB02 Celltrion Healthcare Hungary Kft. 10/09/2013
INFLECTRA infliximabArthritis, Psoriatic; Spondylitis, Ankylosing; Colitis, Ulcerative; Psoriasis; Crohn Disease; Arthritis, Rheumatoid
L04AB02 Pfizer Europe MA EEIG 10/09/2013
NIVESTIM filgrastim Neutropenia; Hematopoietic Stem Cell Transplantation; Cancer L03AA02 Pfizer Europe MA EEIG 7/06/2010
ZARZIO filgrastim Neutropenia; Hematopoietic Stem Cell Transplantation; Cancer L03AA02 Sandoz GmbH 6/02/2009
FILGRASTIM HEXAL filgrastim Neutropenia; Hematopoietic Stem Cell Transplantation; Cancer L03AA02 Hexal AG 6/02/2009
TEVAGRASTIM filgrastim Neutropenia; Hematopoietic Stem Cell Transplantation; Cancer L03AA02 Teva GmbH 15/09/2008
RATIOGRASTIM filgrastim Neutropenia; Hematopoietic Stem Cell Transplantation; Cancer L03AA02 Ratiopharm GmbH 15/09/2008
RETACRIT epoetin zeta Anemia; Blood Transfusion, Autologous; Kidney Failure, Chronic; Cancer B03XA01 Pfizer Europe MA EEIG 18/12/2007
SILAPO epoetin zeta Anemia; Blood Transfusion, Autologous; Cancer; Kidney Failure, Chronic B03XA01 Stada Arzneimittel AG 18/12/2007
BINOCRIT epoetin alfa Anemia; Kidney Failure, Chronic B03XA01 Sandoz GmbH 28/08/2007
ABSEAMED epoetin alfa Anemia; Kidney Failure, Chronic; Cancer B03XA01 Medice Arzneimittel Pütter GmbH Co. KG 27/08/2007
EPOETIN ALFA HEXAL epoetin alfa Anemia; Kidney Failure, Chronic; Cancer B03XA01 Hexal AG 27/08/2007
OMNITROPE somatropin Turner Syndrome; Prader-Willi Syndrome; Dwarfism, Pituitary H01AC01 Sandoz GmbH 12/04/2006
MEDICINE NAME
INTERNATIONAL NON-PROPRIETARY NAME (INN)/COMMONNAME
THERAPEUTIC AREA ATC CODEMARKETING
AUTHORISATION HOLDER/COMPANY
NAME
MARKETING AUTHORISATION
DATE
Source: EMA website, data accessed November 2021 (https://www.ema.europa.eu/en/m edicines/download-medicine-data)
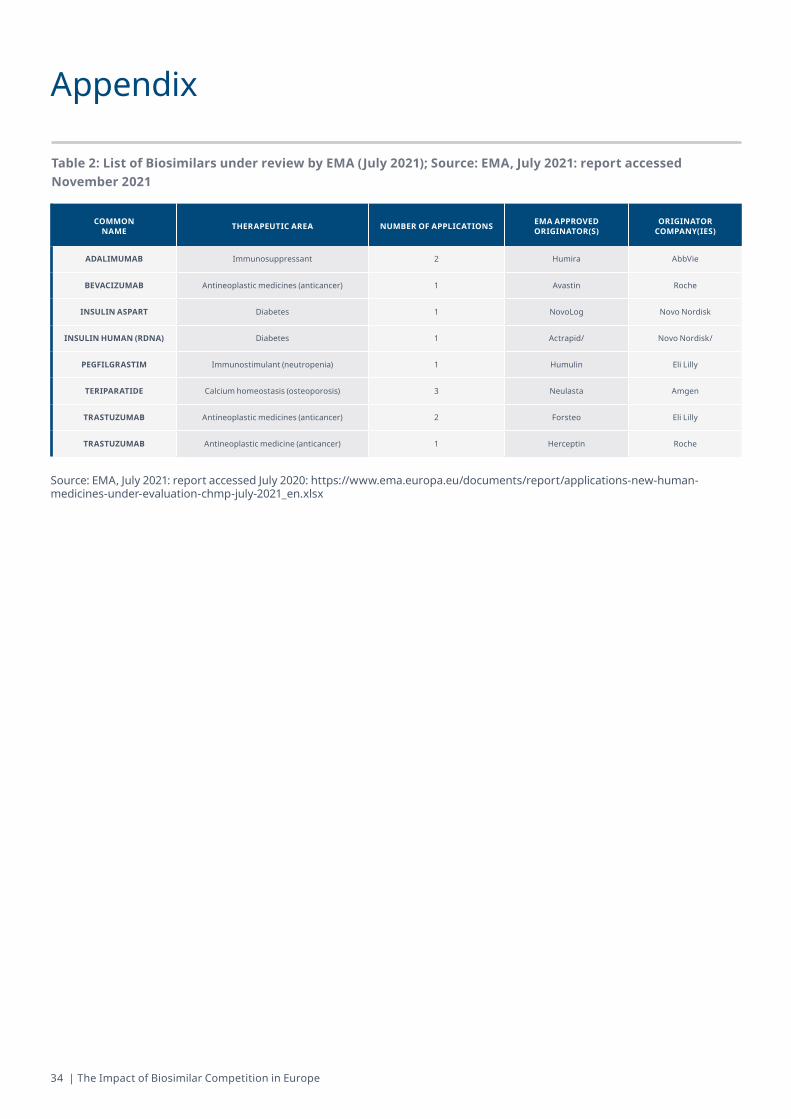
34 | The Impact of Biosimilar Competition in Europe
Appendix
Table2:ListofBiosimilarsunderreviewbyEMA(July2021);Source:EMA,July2021:reportaccessedNovember 2021
COMMON NAME THERAPEUTIC AREA NUMBER OF APPLICATIONS EMA APPROVED
ORIGINATOR(S)ORIGINATOR
COMPANY(IES)
ADALIMUMAB Immunosuppressant 2 Humira AbbVie
BEVACIZUMAB Antineoplastic medicines (anticancer) 1 Avastin Roche
INSULIN ASPART Diabetes 1 NovoLog Novo Nordisk
INSULIN HUMAN (RDNA) Diabetes 1 Actrapid/ Novo Nordisk/
PEGFILGRASTIM Immunostimulant (neutropenia) 1 Humulin Eli Lilly
TERIPARATIDE Calcium homeostasis (osteoporosis) 3 Neulasta Amgen
TRASTUZUMAB Antineoplastic medicines (anticancer) 2 Forsteo Eli Lilly
TRASTUZUMAB Antineoplastic medicine (anticancer) 1 Herceptin Roche
Source: EMA, July 2021: report accessed July 2020: https://www.ema.europa.eu/documents/report/applications-new-human-medicines-under-evaluation-chmp-july-2021_en.xlsx
© 2021. All rights reserved. IQVIA® is a registered trademark of IQVIA Inc. in the United States, the European Union, and various other countries.
12.2021.NEMEA
CONTACT USFor further information,
please contact [email protected] iqvia.com
Related Documents