Aquatic Toxicology 142–143 (2013) 185–194 Contents lists available at ScienceDirect Aquatic Toxicology jou rn al hom ep age: www.elsevier.com/locate/aquatox The immunological effects of oil sands surface waters and naphthenic acids on rainbow trout (Oncorhynchus mykiss) Liane A. Leclair a,∗ , Gillian Z. MacDonald a , Laura J. Phalen a , Bernd Köllner b , Natacha S. Hogan c,d , Michael R. van den Heuvel a a Canadian Rivers Institute, Department of Biology, University of Prince Edward Island, Charlottetown, Canada b Friedrich Loeffler Institute, Federal Research Institute of Animal Health, Institute of Immunology, Greifswald, Germany c Toxicology Centre, University of Saskatchewan, Saskatoon, Canada d Department of Animal and Poultry Science, University of Saskatchewan, Saskatoon, Canada a r t i c l e i n f o Article history: Received 15 May 2013 Received in revised form 15 August 2013 Accepted 17 August 2013 Keywords: Oil sands Naphthenic acids Polycyclic aromatic hydrocarbons Fish Immunotoxicity a b s t r a c t There is concern surrounding the immunotoxic potential of naphthenic acids (NAs), a major organic con- stituent in waters influenced by oil sands contamination. To assess the immunological response to NAs, rainbow trout (Oncorhynchus mykiss) waterborne exposures were conducted with oil sands-influenced waters, NAs extracted and purified from oil sands tailings waters, and benzo[a]pyrene (BaP) as a pos- itive control. After a 7 d exposure, blood, spleen, head kidney, and gill samples were removed from a subset of fish in order to evaluate the distribution of thrombocytes, B-lymphocytes, myeloid cells, and T-lymphocytes using fluorescent antibodies specific for those cell types coupled with flow cytometry. The remaining trout in each experimental tank were injected with inactivated Aeromonas salmonicida and held in laboratory water for 21 d and subjected to similar lymphatic cell evaluation in addition to evaluation of antibody production. Fluorescent metabolites in bile as well as liver CYP1A induction were also determined after the 7 and 21 d exposure. Oil sands waters and extracted NAs exposures resulted in an increase in bile fluorescence at phenanthrene wavelengths, though liver CYP1A was not induced in those treatments as it was with the BaP positive control. Trout in the oil sands-influenced water expo- sure showed a decrease in B- and T-lymphocytes in blood as well as B-lymphocytes and myeloid cells in spleen and an increase in B-lymphocytes in head kidney. The extracted NAs exposure showed a decrease in thrombocytes in spleen at 8 mg/L and an increase in T-lymphocytes at 1 mg/L in head kidney after 7 d. There was a significant decrease in antibody production against A. salmonicida in both oil sands- influenced water exposures. Because oil sands-influenced waters affected multiple immune parameters, while extracted NAs impacts were limited, the NAs tested here are likely not the cause of immunotoxicity found in the oil sands-influenced water. © 2013 Elsevier B.V. All rights reserved. 1. Introduction In 2009, Canadian bitumen productionaveraged 1.49 million barrels/day from the oil sands industry and is projected to produce 3.2 million barrels/day by 2019 (Government of Alberta, 2011). The Clarke hot water extraction method used to recover bitumen from oil sands requires about 3 m 3 of water for about 4 m 3 of fluid tailings (Holowenko et al., 2002). Industry is required to safely incorporate resultant tailings and tailings water back into the reclaimed landscape. However, there is concern that substances associated with oil sands mining will enter the wider environment ∗ Corresponding author at: Canadian Rivers Institute, Department of Biology, Uni- versity of Prince Edward Island, 550 University Avenue, Charlottetown, PEI, Canada. Tel.: +19025666072. E-mail address: [email protected] (L.A. Leclair). and cause detrimental effects on biota such as teleost fish (Kelly et al., 2009). The tailings and wastewaters contain clay, sand, dissolved metals, and organic compounds, including polycyclic aromatic hydrocarbons (PAHs) and naphthenic acid (NAs). NAs are a diverse group of compounds found in petroleum- derived materials such as crude oil. NAs are composed of acyclic, monocyclic, and polycyclic carboxylic acids, with the general for- mula of C n H 2n + z O 2 , where n represents the carbon number and Z specifies the hydrogen deficiency resulting from ring formation or double bonds (Clemente and Fedorak, 2005). Recent research suggests that NAs mixtures contain tricyclic diamondoid acids that differ from what has been generally conceived for NAs structure (Rowland et al., 2011, 2012). The complexity of NAs is further increased as they become transformed in the environment. The more saturated and lower molecular weight NAs tend to be elim- inated entirely through rapid biodegradation, whereas the larger more complex NAs may not be mineralized, but can be oxidized 0166-445X/$ – see front matter © 2013 Elsevier B.V. All rights reserved. http://dx.doi.org/10.1016/j.aquatox.2013.08.009

Welcome message from author
This document is posted to help you gain knowledge. Please leave a comment to let me know what you think about it! Share it to your friends and learn new things together.
Transcript
Ta
LNa
b
c
d
a
ARRA
KONPFI
1
b3Tftira
vT
0h
Aquatic Toxicology 142– 143 (2013) 185– 194
Contents lists available at ScienceDirect
Aquatic Toxicology
jou rn al hom ep age: www.elsev ier .com/ locate /aquatox
he immunological effects of oil sands surface waters and naphtheniccids on rainbow trout (Oncorhynchus mykiss)
iane A. Leclaira,∗, Gillian Z. MacDonalda, Laura J. Phalena, Bernd Köllnerb,atacha S. Hoganc,d, Michael R. van den Heuvela
Canadian Rivers Institute, Department of Biology, University of Prince Edward Island, Charlottetown, CanadaFriedrich Loeffler Institute, Federal Research Institute of Animal Health, Institute of Immunology, Greifswald, GermanyToxicology Centre, University of Saskatchewan, Saskatoon, CanadaDepartment of Animal and Poultry Science, University of Saskatchewan, Saskatoon, Canada
r t i c l e i n f o
rticle history:eceived 15 May 2013eceived in revised form 15 August 2013ccepted 17 August 2013
eywords:il sandsaphthenic acidsolycyclic aromatic hydrocarbonsishmmunotoxicity
a b s t r a c t
There is concern surrounding the immunotoxic potential of naphthenic acids (NAs), a major organic con-stituent in waters influenced by oil sands contamination. To assess the immunological response to NAs,rainbow trout (Oncorhynchus mykiss) waterborne exposures were conducted with oil sands-influencedwaters, NAs extracted and purified from oil sands tailings waters, and benzo[a]pyrene (BaP) as a pos-itive control. After a 7 d exposure, blood, spleen, head kidney, and gill samples were removed from asubset of fish in order to evaluate the distribution of thrombocytes, B-lymphocytes, myeloid cells, andT-lymphocytes using fluorescent antibodies specific for those cell types coupled with flow cytometry.The remaining trout in each experimental tank were injected with inactivated Aeromonas salmonicidaand held in laboratory water for 21 d and subjected to similar lymphatic cell evaluation in addition toevaluation of antibody production. Fluorescent metabolites in bile as well as liver CYP1A induction werealso determined after the 7 and 21 d exposure. Oil sands waters and extracted NAs exposures resultedin an increase in bile fluorescence at phenanthrene wavelengths, though liver CYP1A was not induced inthose treatments as it was with the BaP positive control. Trout in the oil sands-influenced water expo-sure showed a decrease in B- and T-lymphocytes in blood as well as B-lymphocytes and myeloid cells in
spleen and an increase in B-lymphocytes in head kidney. The extracted NAs exposure showed a decreasein thrombocytes in spleen at 8 mg/L and an increase in T-lymphocytes at 1 mg/L in head kidney after7 d. There was a significant decrease in antibody production against A. salmonicida in both oil sands-influenced water exposures. Because oil sands-influenced waters affected multiple immune parameters,while extracted NAs impacts were limited, the NAs tested here are likely not the cause of immunotoxicityuenc
found in the oil sands-infl. Introduction
In 2009, Canadian bitumen productionaveraged 1.49 millionarrels/day from the oil sands industry and is projected to produce.2 million barrels/day by 2019 (Government of Alberta, 2011).he Clarke hot water extraction method used to recover bitumenrom oil sands requires about 3 m3 of water for about 4 m3 of fluidailings (Holowenko et al., 2002). Industry is required to safely
ncorporate resultant tailings and tailings water back into theeclaimed landscape. However, there is concern that substancesssociated with oil sands mining will enter the wider environment∗ Corresponding author at: Canadian Rivers Institute, Department of Biology, Uni-ersity of Prince Edward Island, 550 University Avenue, Charlottetown, PEI, Canada.el.: +19025666072.
E-mail address: [email protected] (L.A. Leclair).
166-445X/$ – see front matter © 2013 Elsevier B.V. All rights reserved.ttp://dx.doi.org/10.1016/j.aquatox.2013.08.009
ed water.© 2013 Elsevier B.V. All rights reserved.
and cause detrimental effects on biota such as teleost fish (Kellyet al., 2009). The tailings and wastewaters contain clay, sand,dissolved metals, and organic compounds, including polycyclicaromatic hydrocarbons (PAHs) and naphthenic acid (NAs).
NAs are a diverse group of compounds found in petroleum-derived materials such as crude oil. NAs are composed of acyclic,monocyclic, and polycyclic carboxylic acids, with the general for-mula of CnH2n + zO2, where n represents the carbon number andZ specifies the hydrogen deficiency resulting from ring formationor double bonds (Clemente and Fedorak, 2005). Recent researchsuggests that NAs mixtures contain tricyclic diamondoid acids thatdiffer from what has been generally conceived for NAs structure(Rowland et al., 2011, 2012). The complexity of NAs is further
increased as they become transformed in the environment. Themore saturated and lower molecular weight NAs tend to be elim-inated entirely through rapid biodegradation, whereas the largermore complex NAs may not be mineralized, but can be oxidized
1 ology
tcae
s1oufloslHciaelf
ibfits
fttwdTeAbma
2
2
ioewo
MTeoeawtmPttgeflpfi
86 L.A. Leclair et al. / Aquatic Toxic
o other structures such as alcohols (Han et al., 2009). Due to thehemical complexity, commercially available NAs mixtures do nott all resemble the chemical profile of oil sands-derived NAs in thenvironment (MacDonald et al., 2013).
It has been demonstrated that untransformed NAs are respon-ible for acute lethality in aquatic biota (MacKinnon and Boerger,986). However, little is known regarding whether untransformedr transformed NAs are involved in chronic toxicity observedpon exposure to oil sands-influenced waters. Yellow perch (Percaavescens) exposed to waters containing elevated levels of NAs andther oil sands-related compounds in experimental ponds demon-trated an increased prevalence of opportunistic diseases includingymphocystis and severe fin erosion (Palmer et al., 2012; van deneuvel et al., 2000). Immunological impacts were observed inaged rainbow trout exposed to those same waters for 21 d, includ-ng decreased total leukocytes, and reduced antibody productiongainst Aeromonas salmonicida (McNeill et al., 2012). A laboratoryxposure demonstrated only minor short-term effects on bloodeukocyte using an intraperitoneal (I.P.) injection of NAs extractedrom oil sands tailings waters (MacDonald et al., 2013).
The purpose of this research is to determine whether oil sands-nfluenced waters and oil sands-derived NAs have the potential toe immunotoxic to rainbow trout in a laboratory exposure. Therst hypothesis is that exposure to environmentally sourced waterhat contains oil sands-derived NAs will cause an immune suppres-ion in the laboratory. The second hypothesis is that NAs, extracted
rom similar waters, will cause the same immunological effectso the pond waters. A method was established wherein rainbowrout were exposed to pond water, waterborne extracted NAs, oraterborne BaP for 7 d. The main immune endpoints were theistribution of thrombocytes, B-lymphocytes, myeloid cells, and-lymphocytes in blood, spleen, head kidney, and gill. Followingxposures, a subset of trout were injected with formalin inactivated. salmonicida and held in laboratory water for 21 d to measure anti-ody production. Water chemistry, NAs and BaP fluorescent bileetabolites as well as liver CYP1A induction were also determined
fter the 7 and 21 d exposure.
. Materials and methods
.1. Experimental design
A total of three experiments were conducted. In the first exper-ment, rainbow trout were exposed to pond waters influenced byil sands activities from the Fort McMurray region. In the secondxperiment, trout were exposed to NAs extracted and purified fromeather oil sands tailings water. In the third experiment, the effects
f waterborne BaP were examined.This experimental design has been previously described by
acDonald et al. (2013) using an I.P. injection of extracted NAs.his preliminary study helped design the study at hand thatxpanded on the research to compare the immunological effectsf waterborne extracted NAs to that of oil sands-influenced waterxposure. The current study had the addition of a component ofdaptive immune response. The following experimental designas used for all three experiments and replicated in two separately
imed trials for each experiment. Rainbow trout (Oncorhynchusykiss) were purchased from Ocean Trout Farms Ltd. (Brookvale,
E, Canada) and held in a circular 312 L flow through tank prioro exposures. Twenty-two fish were transferred from the holdingank to three 60 L flow-through, epoxy-coated, fiberglass rectan-ular tanks and were acclimated for one week prior to the start of
xposure. Fish were exposed to experimental waters for 7 d using aow through system comprised of glass reservoirs and a peristalticump with a 90% replacement time of 30 h. For all experiments, sixsh from each tank were sacrificed for examination of leukocyte142– 143 (2013) 185– 194
endpoints as well as fluorescent bile metabolites and hepatic7-ethoxyresorufin-O-deethlyase (EROD) induction at 7 d. Theremaining 16 fish from each tank were injected with A. salmonicida(108 particles/kg in PBS in 100 �L), or PBS alone using insulinneedles (291/2 0,3 mL, BD, Mississauga, Canada) and held in a312 L flow through tank with laboratory water for an additional21 d. Trout were then sacrificed and measured for similar end-points as the 7d exposure as well as antibody production againstA. salmonicida. The mean weight of the rainbow trout used for theexperiments was 59.4 ± 1.8 g. Mean dissolved oxygen saturation,temperature, conductivity, and pH of the laboratory water was98.1%, 11.3 ◦C, 811.0 �S/cm, and 8.15, respectively.
2.1.1. Experiment 1: pond watersRainbow trout were exposed to either oil sands-influenced
water, relatively uncontaminated water from the Athabasca oilsands region, or laboratory water. The oil sands-influenced waterwas derived from an experimental pond, Demonstration Pond, a19-year-old pond used to demonstrate water capping of oil sandstailings as a reclamation method. Demonstration Pond contains70,000 m3 of natural surface water (drainage water from muskegarea) that was pumped over 70,000 m3 of mature oil sands finetailings (van den Heuvel et al., 1999a). The relatively unimpactedwater used for this experiment was obtained from Horizon Lake.Horizon Lake is an artificial lake constructed in 2008. This lake wasbuilt to compensate for fish habitat loss and has now become aself-sustaining ecosystem. A total of 2000 L of exposure water wascollected by pumping it into 1000 L food-grade polyethylene totes.Totes were shipped by ground from Alberta to the University ofPrince Edward Island and experiments were initiated within twoweeks of receiving the waters. The third experimental water waslaboratory well water. The mean temperature of the experimentalwaters was 15.2 ± 0.03 ◦C throughout the exposure.
2.1.2. Experiment 2: naphthenic acidsNAs for fish exposure were extracted by acid precipitation
using aged (17-year old; Pond 10) oil sands tailings water usinga modified extraction method from Frank et al. (2006) and char-acterization is described in detail by MacDonald et al. (2013).Briefly, water was acidified to pH 2 ± 0.2 with H2SO4 (Sigma,Oakville, Canada), precipitate removed and re-dissolved in 0.1 MNaOH (Sigma). Particulate matter was removed via centrifugationand humic material was removed via DEAE cellulose filtration.After liquid–liquid extraction with dichloromethane to removeneutrals, NAs were re-precipitated, washed with distilled waterand freeze dried to produce a solid material. Classical NAs struc-tures (CnH2n + zO2) comprised 91% of the extracted and purified NAs(MacDonald et al., 2013). Stock solutions of NAs in 0.1 M NaOHwere used to make up dilutions of 1 and 8 mg/L NAs in the glassreservoirs. The control for the NAs experiment was laboratorywater spiked with NaOH carrier. The mean water temperature was11.3 ± 0.02 ◦C throughout the NAs exposure.
2.1.3. Experiment 3: benzo[a]pyreneThe flow-through BaP exposure was conducted by pumping BaP
(Sigma) dissolved in acetone carrier into a flow of laboratory water,both of which were delivered using peristaltic pumps with a 90%replacement time of 30 h. Nominal concentrations were 50 �g/Land 200 �g/L of BaP. The control for this experiment consisted ofacetone carrier only (0.002%). The mean water temperature for theBaP exposure was 12.7 ± 0.03 ◦C throughout the exposure.
2.2. Sampling
Fish were anesthetized in 0.1 g/L tricaine methanesulfonate(MS-222; Argent, WA, USA), weighed, and fork length measured.
ology
Bahrcw2wpsS3(cip−
2
uNNPl((Fcirapamg
2
Botl5wc
iBajaatcapFcdFou
L.A. Leclair et al. / Aquatic Toxic
lood was removed (200–400 �L) from the dorsal artery using hep-rinized 23 G needles (BD) and samples were placed in a 5 mLeparinized vacutainer (BD). A subsample of blood (5 �L) wasemoved and diluted in 1 mL of PBS/EDTA (Sigma) for total cellount. The remainder of blood was placed in 3 mL of L-15 mediaith glutamine (Sigma) for differential white cell count. For the
1 d A. salmonicida challenge only, a second blood sample (200 �L)as removed first using non-heparinized 23 G needles (BD) andlaced in a 1 mL non-heparinized microtainer SST (BD) containingilica and gel, initiating clotting and allowing for serum separation.pleen, head kidney, and gill samples were removed and placed in
mL of L-15 media with glutamine (gills and spleen) or PBS/EDTAhead kidney) on ice. Liver samples were removed and placed inryovials (Ultident Scientific, St. Laurent, Canada) and flash frozenn liquid nitrogen, and later stored at −80 ◦C. Bile samples werelaced in microcentrifuge tubes (Ultident Scientific) and stored at20 ◦C.
.3. Total leukocyte count
Spleen, head kidney, and gill samples were homogenizedsing Tenbroek tissue grinders (Wheaton Science International,J, USA). The homogenate was then filtered through a 100 �mitex mesh and subsamples of 50 �L were diluted with 1 mL ofBS/EDTA. The remainder of the samples was used for differentialeukocyte counts. The lipophilic dye, 3,3-dihexyloxacarbocyanineDiOC6) was added and incubated at room temperature for 15 minInoue et al., 2002) and a volume of 250 �L was transferred toACS tubes (VWR, Mississauga, Canada). Multicolour CountBriteounting beads (Invitrogen, Burlington, Canada) (20 �L) contain-ng 20,000 multicolour beads were added to the FACS tubes andead on a BD FACSCalibur flow cytometer equipped with 488 nmnd 635 nm lasers. The samples were read until 1000 beads wereassed through the fluorescent channel 4 (FL4, red). Erythrocytesnd leukocytes were separated and absolute counts were deter-ined using a plot of side scatter vs. fluorescent channel (FL1,
reen).
.4. Differential leukocyte count
Leukocytes were isolated by density gradient (Secombes, 1990).lood and homogenized samples were carefully layered over 3 mLf Lympholyte-H (1.0770 g/cm3; Cedarlane Laboratories, Burling-on, Canada) and centrifuged at 600 × g for 40 min at 4 ◦C. Theeukocytes found at the interface were removed and washed with
mL of PBS/EDTA and cells were re-suspended in L-15 media. Cellsere counted using a hemocytometer in order to obtain 400,000
ells per well in 96 round bottom plates.Monoclonal antibodies used for the differential leukocyte stain-
ng have been previously described by MacDonald et al. (2013).-lymphocytes and thrombocytes are stained using directly labeledntibodies while myeloid and T-lymphocytes are stained using con-ugated monoclonal antibodies. Plates were incubated with theirppropriate stains for 1 h at 4 ◦C and spun at 250 × g for 4 min at 4 ◦Cnd re-suspended cells were washed with 100 �L of PBS/EDTA. Forhose antibodies requiring a secondary antibody, washing was notonducted until after the secondary antibody had incubated for 1 ht 4 ◦C, after which the procedure was identical to that of labeledrimary antibodies. The cell suspensions were counted on a BDACSCalibur to a total count of 5000 events, each representing oneell. The forward scatter vs. side scatter plot was gated to remove
ebris and dead cells and erythrocytes were gated out on a plot ofL1 vs. FL3. Stained cells were evaluated using the appropriate flu-rescence vs. forward scatter for each antibody in comparison tonstained cells.142– 143 (2013) 185– 194 187
2.5. Fluorescent bile metabolites
Bile samples were analyzed after diluting 100-fold in HPLC gradewater (Caledon Laboratories, Georgetown, Canada). Samples werefiltered into glass autosampler vials using 13 mm polypropylenesyringe filters with a 0.45 �m pore size (Pall, St. Laurent, Canada).A Varian Prostar model 240 HPLC pump, a model 410 autosampler,and model 363 fluorescence detectors were used for quantifica-tion of fluorescent metabolites. Separations were conducted with a150 mm × 4.6 mm Varian Microsob-MV C18 column at a flow rate of1 mL/min at 35 ◦C. Solvent elution profile started at 5% acetonitrile(Caledon) and 95% HPLC grade water. These ratios were changed to98% acetonitrile and 2% water gradually over a 25 min period withthis ratio being held until the end of the run (5 min). Excitation andemission wavelengths used were that of phenanthrene (256 nmand 380 nm, respectively) and BaP (380 nm and 430 nm, respec-tively). The total peak area between 3 and 15 min was summed andthis was compared to the standard curve for phenanthrene and BaPto derive equivalent concentrations in �g/mL of bile.
2.6. Hepatic 7-ethoxyresorufin-O-deethlyase (EROD)
Hepatic 7-ethoxyresorufin-O-deethlyase (EROD) activity as ameasure of liver cytochrome P4501A (CYP1A) enzyme activity wasestimated in post-mitochondrial supernatant (PMS) using meth-ods previously described by van den Heuvel et al. (1995a). Liversamples were homogenized (0.1 M phosphate, 1 mM EDTA, 1 mMdithiothreitol, and 20% glycerol, pH 7.4) using a glass/Teflon homog-enizer and centrifuged at 9000 × g to obtain the PMS. EROD reactionmixture contained 0.1 M HEPES buffer pH 7.8 (Sigma), 5.0 mMMg2+, 0.5 mM NADPH (Sigma), 1.5 M 7-ethoxyresorufin (Sigma)and about 0.5 mg/mL of PMS protein. EROD activity was determinedin 96 well black plates and after 10 min the reaction was terminatedwith acetonitrile and read on a fluorescence plate reader (Bio-Tek FLx800) with 528 nm excitation and 590 nm emission filters.Protein content was estimated from fluorescamine fluorescence(390 nm excitation, 460 nm emission filters) against bovine serumalbumin standard (Sigma).
2.7. A. salmonicida antibody ELISA
Enzyme-linked immunosorbent assays (ELISAs) were used todetermine the relative quantity of inactivated A. salmonicida anti-body found in trout sera (Köllner and Kotterba, 2002). InactivatedA. salmonicida (6.4 × 10⁷ particles/mL, 200 �L/well) was added to96 well flat-bottom micro test ELISA plates (BD) and incubatedovernight at 4 ◦C. Protein free blocking buffer with 1% ovalbumin(Pierce, Rockford, IL, USA) was added to the plates and incubated for1 h at room temperature. The plates were then washed three times(PBS, pH 7.4, 0.05% Tween, Sigma). Trout serum was diluted 1:10in PBS washing buffer and added to the plates and an 8-point anti-body titer was conducted (serial two-fold dilutions). Plates wereincubated for 1 h at 4 ◦C and washed three times with PBS wash-ing buffer. Themonoclonal mouse–anti trout IgM antibody (mab4c10) (1:100 dilution in PBS Tween) was added to each well andwas incubated for 1 h at 4 ◦C. The antibody was discharged andthe plates were washed three times with PBS washing buffer. Theconjugate goat anti-mouse-IgG–HRP-peroxidase conjugate (Pierce,Germany) (1:1250 dilution in PBS Tween) was added to the platesand incubated for 1 h at 4 ◦C. The conjugate was discharged andwashed with PBS washing buffer three times. The SigmaFAST OPDsubstrate (Sigma) was added to the plates and incubated for 30 min
at room temperature. Adding 100 �L of 3 M HCl in each well termi-nated the reaction and was read at 490 nm by a micro-plate reader.The antibody titer was determined as being the first serum con-centration with an absorbance greater than three times the mean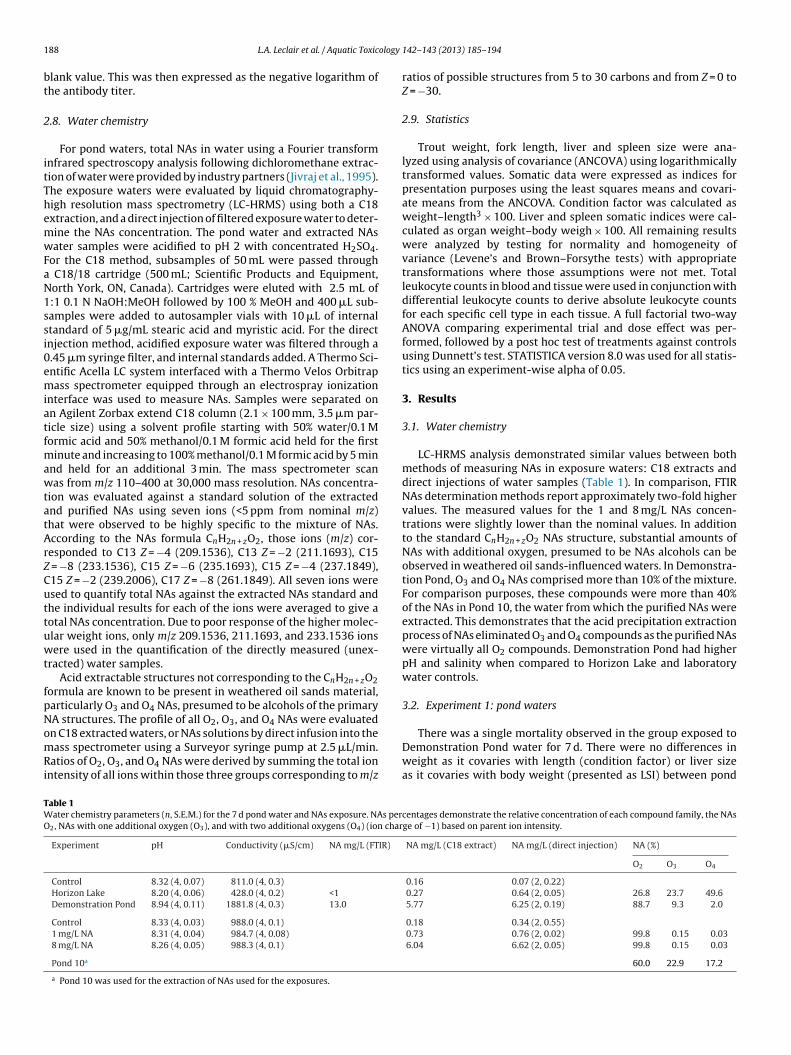
1 ology
bt
2
itThemwFaN1ssi0emiatfmawtatArZCuttuwt
fpNomRi
TWO
88 L.A. Leclair et al. / Aquatic Toxic
lank value. This was then expressed as the negative logarithm ofhe antibody titer.
.8. Water chemistry
For pond waters, total NAs in water using a Fourier transformnfrared spectroscopy analysis following dichloromethane extrac-ion of water were provided by industry partners (Jivraj et al., 1995).he exposure waters were evaluated by liquid chromatography-igh resolution mass spectrometry (LC-HRMS) using both a C18xtraction, and a direct injection of filtered exposure water to deter-ine the NAs concentration. The pond water and extracted NAsater samples were acidified to pH 2 with concentrated H2SO4.
or the C18 method, subsamples of 50 mL were passed through C18/18 cartridge (500 mL; Scientific Products and Equipment,orth York, ON, Canada). Cartridges were eluted with 2.5 mL of:1 0.1 N NaOH:MeOH followed by 100 % MeOH and 400 �L sub-amples were added to autosampler vials with 10 �L of internaltandard of 5 �g/mL stearic acid and myristic acid. For the directnjection method, acidified exposure water was filtered through a.45 �m syringe filter, and internal standards added. A Thermo Sci-ntific Acella LC system interfaced with a Thermo Velos Orbitrapass spectrometer equipped through an electrospray ionization
nterface was used to measure NAs. Samples were separated onn Agilent Zorbax extend C18 column (2.1 × 100 mm, 3.5 �m par-icle size) using a solvent profile starting with 50% water/0.1 Mormic acid and 50% methanol/0.1 M formic acid held for the first
inute and increasing to 100% methanol/0.1 M formic acid by 5 minnd held for an additional 3 min. The mass spectrometer scanas from m/z 110–400 at 30,000 mass resolution. NAs concentra-
ion was evaluated against a standard solution of the extractednd purified NAs using seven ions (<5 ppm from nominal m/z)hat were observed to be highly specific to the mixture of NAs.ccording to the NAs formula CnH2n + zO2, those ions (m/z) cor-esponded to C13 Z = −4 (209.1536), C13 Z = −2 (211.1693), C15
= −8 (233.1536), C15 Z = −6 (235.1693), C15 Z = −4 (237.1849),15 Z = −2 (239.2006), C17 Z = −8 (261.1849). All seven ions weresed to quantify total NAs against the extracted NAs standard andhe individual results for each of the ions were averaged to give aotal NAs concentration. Due to poor response of the higher molec-lar weight ions, only m/z 209.1536, 211.1693, and 233.1536 ionsere used in the quantification of the directly measured (unex-
racted) water samples.Acid extractable structures not corresponding to the CnH2n + zO2
ormula are known to be present in weathered oil sands material,articularly O3 and O4 NAs, presumed to be alcohols of the primaryA structures. The profile of all O2, O3, and O4 NAs were evaluated
n C18 extracted waters, or NAs solutions by direct infusion into theass spectrometer using a Surveyor syringe pump at 2.5 �L/min.atios of O2, O3, and O4 NAs were derived by summing the total ionntensity of all ions within those three groups corresponding to m/z
able 1ater chemistry parameters (n, S.E.M.) for the 7 d pond water and NAs exposure. NAs per
2, NAs with one additional oxygen (O3), and with two additional oxygens (O4) (ion char
Experiment pH Conductivity (�S/cm) NA mg/L (FTIR)
Control 8.32 (4, 0.07) 811.0 (4, 0.3)
Horizon Lake 8.20 (4, 0.06) 428.0 (4, 0.2) <1
Demonstration Pond 8.94 (4, 0.11) 1881.8 (4, 0.3) 13.0
Control 8.33 (4, 0.03) 988.0 (4, 0.1)
1 mg/L NA 8.31 (4, 0.04) 984.7 (4, 0.08)
8 mg/L NA 8.26 (4, 0.05) 988.3 (4, 0.1)
Pond 10a
a Pond 10 was used for the extraction of NAs used for the exposures.
142– 143 (2013) 185– 194
ratios of possible structures from 5 to 30 carbons and from Z = 0 toZ = −30.
2.9. Statistics
Trout weight, fork length, liver and spleen size were ana-lyzed using analysis of covariance (ANCOVA) using logarithmicallytransformed values. Somatic data were expressed as indices forpresentation purposes using the least squares means and covari-ate means from the ANCOVA. Condition factor was calculated asweight–length3 × 100. Liver and spleen somatic indices were cal-culated as organ weight–body weigh × 100. All remaining resultswere analyzed by testing for normality and homogeneity ofvariance (Levene’s and Brown–Forsythe tests) with appropriatetransformations where those assumptions were not met. Totalleukocyte counts in blood and tissue were used in conjunction withdifferential leukocyte counts to derive absolute leukocyte countsfor each specific cell type in each tissue. A full factorial two-wayANOVA comparing experimental trial and dose effect was per-formed, followed by a post hoc test of treatments against controlsusing Dunnett’s test. STATISTICA version 8.0 was used for all statis-tics using an experiment-wise alpha of 0.05.
3. Results
3.1. Water chemistry
LC-HRMS analysis demonstrated similar values between bothmethods of measuring NAs in exposure waters: C18 extracts anddirect injections of water samples (Table 1). In comparison, FTIRNAs determination methods report approximately two-fold highervalues. The measured values for the 1 and 8 mg/L NAs concen-trations were slightly lower than the nominal values. In additionto the standard CnH2n + zO2 NAs structure, substantial amounts ofNAs with additional oxygen, presumed to be NAs alcohols can beobserved in weathered oil sands-influenced waters. In Demonstra-tion Pond, O3 and O4 NAs comprised more than 10% of the mixture.For comparison purposes, these compounds were more than 40%of the NAs in Pond 10, the water from which the purified NAs wereextracted. This demonstrates that the acid precipitation extractionprocess of NAs eliminated O3 and O4 compounds as the purified NAswere virtually all O2 compounds. Demonstration Pond had higherpH and salinity when compared to Horizon Lake and laboratorywater controls.
3.2. Experiment 1: pond waters
There was a single mortality observed in the group exposed toDemonstration Pond water for 7 d. There were no differences inweight as it covaries with length (condition factor) or liver sizeas it covaries with body weight (presented as LSI) between pond
centages demonstrate the relative concentration of each compound family, the NAsge of −1) based on parent ion intensity.
NA mg/L (C18 extract) NA mg/L (direct injection) NA (%)
O2 O3 O4
0.16 0.07 (2, 0.22)0.27 0.64 (2, 0.05) 26.8 23.7 49.65.77 6.25 (2, 0.19) 88.7 9.3 2.0
0.18 0.34 (2, 0.55)0.73 0.76 (2, 0.02) 99.8 0.15 0.036.04 6.62 (2, 0.05) 99.8 0.15 0.03
60.0 22.9 17.2
L.A. Leclair et al. / Aquatic Toxicology 142– 143 (2013) 185– 194 189
Table 2Condition factor, liver and spleen somatic index and erythrocytes in blood (n, S.E.) in rainbow trout after 7 d exposure. Asterisks demonstrate a statistically significantdifference between the exposed group and the control by two-way ANOVA analysis.
Experiment Condition factor Liver Somatic Index Spleen Somatic Index Blood erythrocytes (billion cells mL−1)
Control 0.99 (12, 0.01) 0.92 (12, 0.01) 0.13 (12, 0.05) 1.23 (12, 0.06)Horizon Lake 1.00 (11, 0.01) 0.88 (12, 0.01) 0.11 (12, 0.05) 1.38 (12, 0.09)Demonstration Pond 1.01 (12, 0.01) 1.02 (12, 0.01) 0.09 (12, 0.05)* 1.27 (12, 0.10)
Control 1.07 (12, 0.01) 1.06 (12, 0.01) 0.17 (12, 0.05) 1.42 (12, 0.06)1 mg/L NA 1.05 (12, 0.01) 1.16 (12, 0.20)* 0.20 (12, 0.05) 1.33 (12, 0.05)8 mg/L NA 1.03 (12, 0.01) 1.43 (12, 0.02)* 0.18 (12, 0.05) 1.30 (12, 0.05)
wswcd
cbmsaT(ApaLn
Fte
Control 1.06 (11, 0.01) 1.02 (11, 0.02)50 �g/L BaP 1.02 (12, 0.01) 1.13 (12, 0.02)
200 �g/L BaP 1.01 (12, 0.01) 1.20 (12, 0.02)*
ater exposure groups after 7 d (Table 2). However, there was atatistically significant 30% decrease in spleen size as it covariesith body weight (presented as SSI) in Demonstration Pond when
ompared to the control group (Table 2). There were no significantifferences in blood total erythrocyte counts.
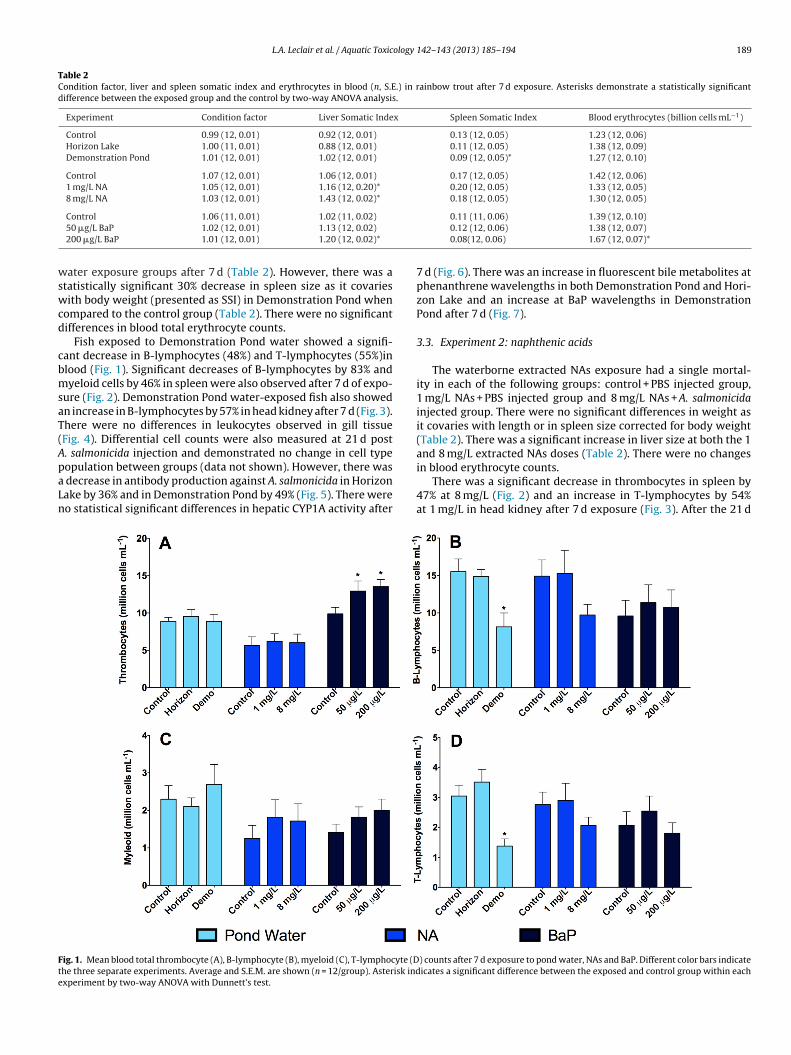
Fish exposed to Demonstration Pond water showed a signifi-ant decrease in B-lymphocytes (48%) and T-lymphocytes (55%)inlood (Fig. 1). Significant decreases of B-lymphocytes by 83% andyeloid cells by 46% in spleen were also observed after 7 d of expo-
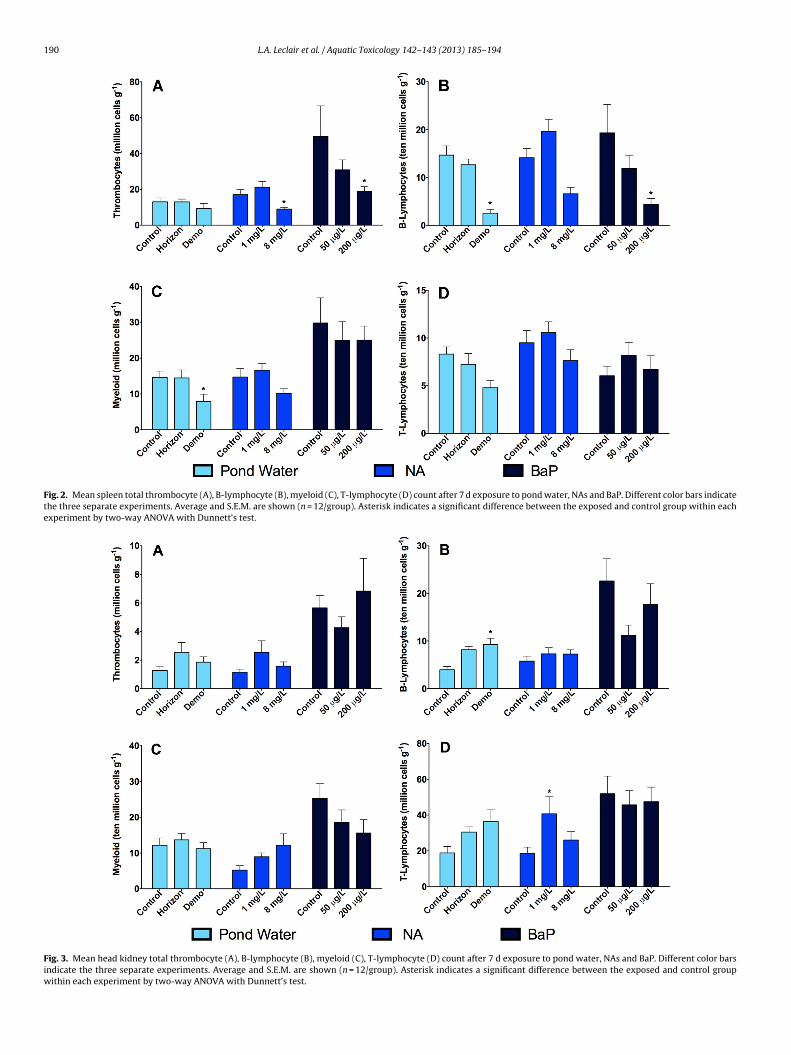
ure (Fig. 2). Demonstration Pond water-exposed fish also showedn increase in B-lymphocytes by 57% in head kidney after 7 d (Fig. 3).here were no differences in leukocytes observed in gill tissueFig. 4). Differential cell counts were also measured at 21 d post. salmonicida injection and demonstrated no change in cell type
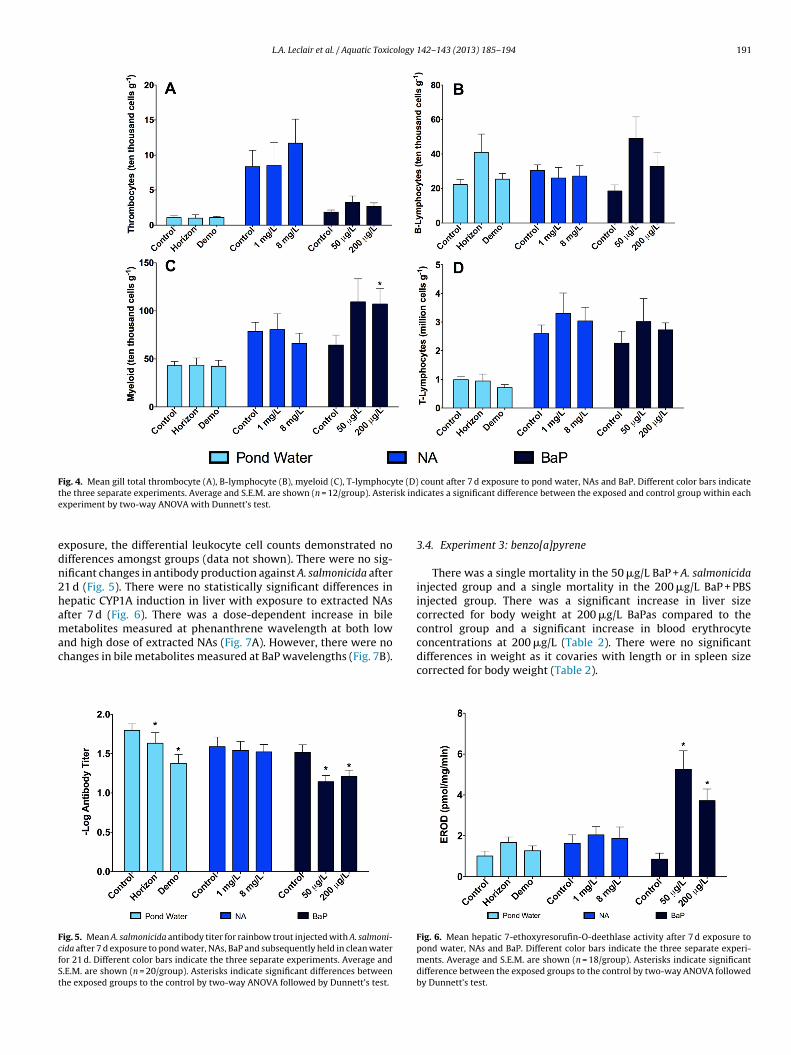
opulation between groups (data not shown). However, there wasdecrease in antibody production against A. salmonicida in Horizonake by 36% and in Demonstration Pond by 49% (Fig. 5). There wereo statistical significant differences in hepatic CYP1A activity after
ig. 1. Mean blood total thrombocyte (A), B-lymphocyte (B), myeloid (C), T-lymphocyte (Dhe three separate experiments. Average and S.E.M. are shown (n = 12/group). Asterisk indxperiment by two-way ANOVA with Dunnett’s test.
0.11 (11, 0.06) 1.39 (12, 0.10)0.12 (12, 0.06) 1.38 (12, 0.07)0.08(12, 0.06) 1.67 (12, 0.07)*
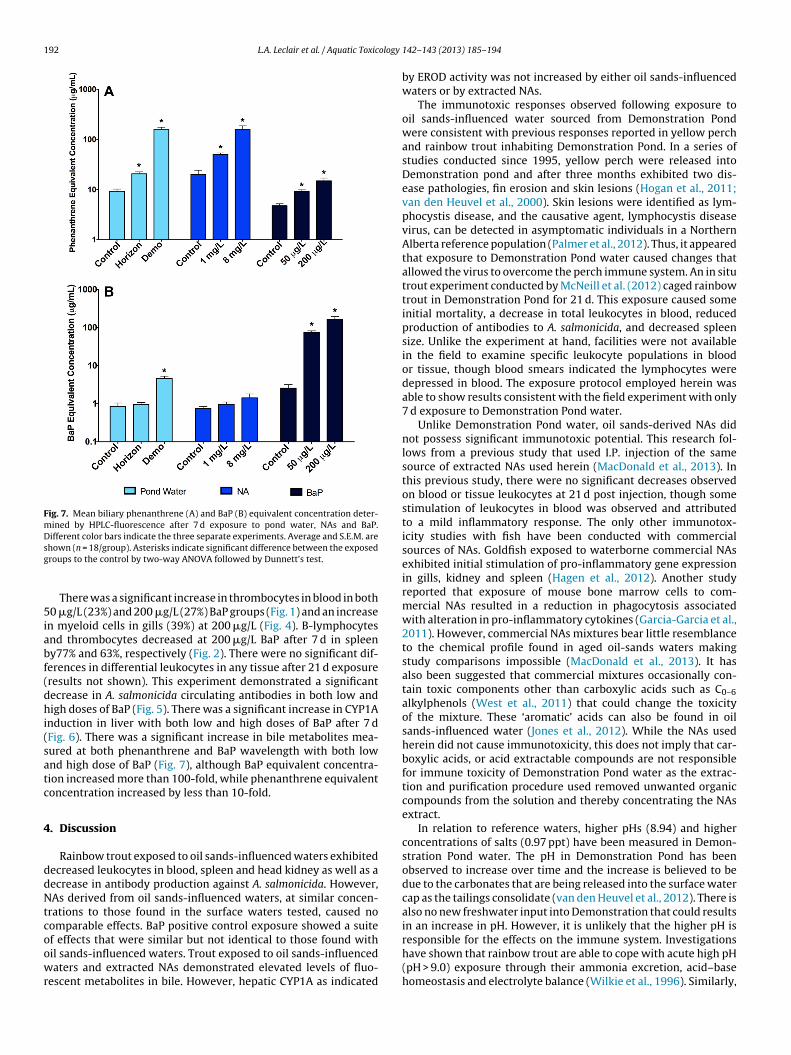
7 d (Fig. 6). There was an increase in fluorescent bile metabolites atphenanthrene wavelengths in both Demonstration Pond and Hori-zon Lake and an increase at BaP wavelengths in DemonstrationPond after 7 d (Fig. 7).
3.3. Experiment 2: naphthenic acids
The waterborne extracted NAs exposure had a single mortal-ity in each of the following groups: control + PBS injected group,1 mg/L NAs + PBS injected group and 8 mg/L NAs + A. salmonicidainjected group. There were no significant differences in weight asit covaries with length or in spleen size corrected for body weight(Table 2). There was a significant increase in liver size at both the 1and 8 mg/L extracted NAs doses (Table 2). There were no changes
in blood erythrocyte counts.There was a significant decrease in thrombocytes in spleen by47% at 8 mg/L (Fig. 2) and an increase in T-lymphocytes by 54%at 1 mg/L in head kidney after 7 d exposure (Fig. 3). After the 21 d
) counts after 7 d exposure to pond water, NAs and BaP. Different color bars indicateicates a significant difference between the exposed and control group within each
190 L.A. Leclair et al. / Aquatic Toxicology 142– 143 (2013) 185– 194
Fig. 2. Mean spleen total thrombocyte (A), B-lymphocyte (B), myeloid (C), T-lymphocyte (D) count after 7 d exposure to pond water, NAs and BaP. Different color bars indicatethe three separate experiments. Average and S.E.M. are shown (n = 12/group). Asterisk indicates a significant difference between the exposed and control group within eachexperiment by two-way ANOVA with Dunnett’s test.
Fig. 3. Mean head kidney total thrombocyte (A), B-lymphocyte (B), myeloid (C), T-lymphocyte (D) count after 7 d exposure to pond water, NAs and BaP. Different color barsindicate the three separate experiments. Average and S.E.M. are shown (n = 12/group). Asterisk indicates a significant difference between the exposed and control groupwithin each experiment by two-way ANOVA with Dunnett’s test.
L.A. Leclair et al. / Aquatic Toxicology 142– 143 (2013) 185– 194 191
Fig. 4. Mean gill total thrombocyte (A), B-lymphocyte (B), myeloid (C), T-lymphocyte (D) count after 7 d exposure to pond water, NAs and BaP. Different color bars indicatet isk inde
edn2hamac
FcfSt
he three separate experiments. Average and S.E.M. are shown (n = 12/group). Asterxperiment by two-way ANOVA with Dunnett’s test.
xposure, the differential leukocyte cell counts demonstrated noifferences amongst groups (data not shown). There were no sig-ificant changes in antibody production against A. salmonicida after1 d (Fig. 5). There were no statistically significant differences inepatic CYP1A induction in liver with exposure to extracted NAsfter 7 d (Fig. 6). There was a dose-dependent increase in bileetabolites measured at phenanthrene wavelength at both low
nd high dose of extracted NAs (Fig. 7A). However, there were nohanges in bile metabolites measured at BaP wavelengths (Fig. 7B).
ig. 5. Mean A. salmonicida antibody titer for rainbow trout injected with A. salmoni-ida after 7 d exposure to pond water, NAs, BaP and subsequently held in clean wateror 21 d. Different color bars indicate the three separate experiments. Average and.E.M. are shown (n = 20/group). Asterisks indicate significant differences betweenhe exposed groups to the control by two-way ANOVA followed by Dunnett’s test.
icates a significant difference between the exposed and control group within each
3.4. Experiment 3: benzo[a]pyrene
There was a single mortality in the 50 �g/L BaP + A. salmonicidainjected group and a single mortality in the 200 �g/L BaP + PBSinjected group. There was a significant increase in liver sizecorrected for body weight at 200 �g/L BaPas compared to thecontrol group and a significant increase in blood erythrocyte
concentrations at 200 �g/L (Table 2). There were no significantdifferences in weight as it covaries with length or in spleen sizecorrected for body weight (Table 2).Fig. 6. Mean hepatic 7-ethoxyresorufin-O-deethlase activity after 7 d exposure topond water, NAs and BaP. Different color bars indicate the three separate experi-ments. Average and S.E.M. are shown (n = 18/group). Asterisks indicate significantdifference between the exposed groups to the control by two-way ANOVA followedby Dunnett’s test.
192 L.A. Leclair et al. / Aquatic Toxicology
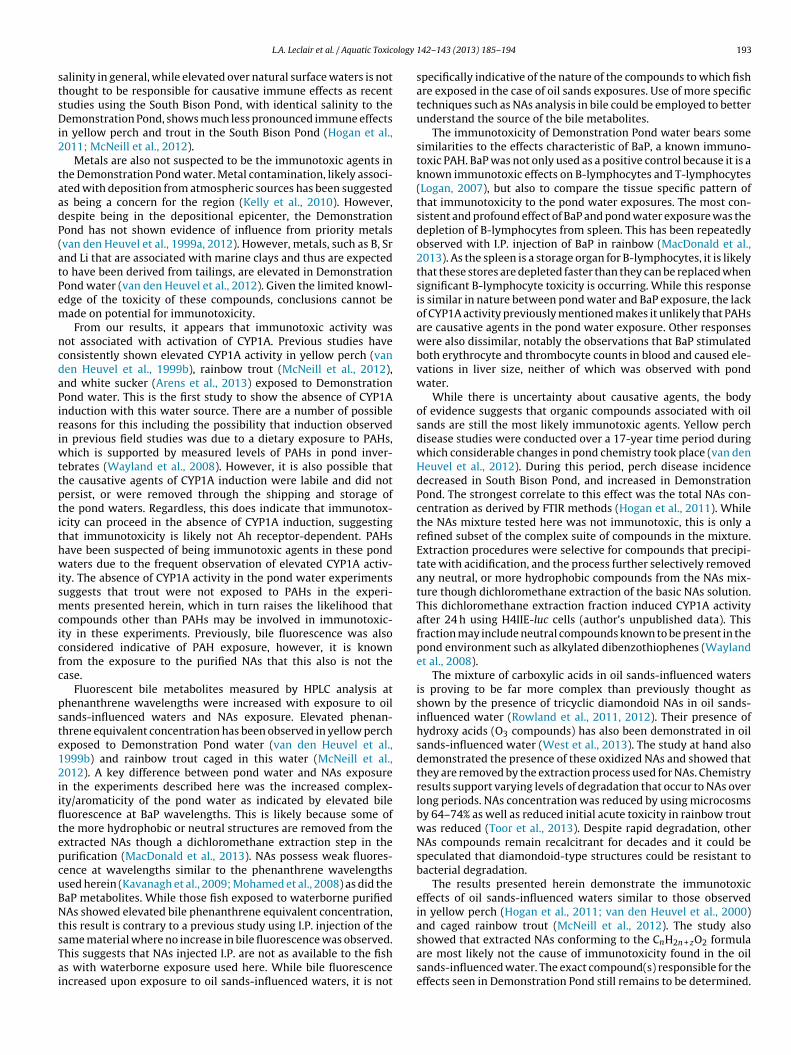
Fig. 7. Mean biliary phenanthrene (A) and BaP (B) equivalent concentration deter-mined by HPLC-fluorescence after 7 d exposure to pond water, NAs and BaP.Different color bars indicate the three separate experiments. Average and S.E.M. aresg
5iabf(dhi(satc
4
ddNtcoowr
responsible for the effects on the immune system. Investigations
hown (n = 18/group). Asterisks indicate significant difference between the exposedroups to the control by two-way ANOVA followed by Dunnett’s test.
There was a significant increase in thrombocytes in blood in both0 �g/L (23%) and 200 �g/L (27%) BaP groups (Fig. 1) and an increase
n myeloid cells in gills (39%) at 200 �g/L (Fig. 4). B-lymphocytesnd thrombocytes decreased at 200 �g/L BaP after 7 d in spleeny77% and 63%, respectively (Fig. 2). There were no significant dif-erences in differential leukocytes in any tissue after 21 d exposureresults not shown). This experiment demonstrated a significantecrease in A. salmonicida circulating antibodies in both low andigh doses of BaP (Fig. 5). There was a significant increase in CYP1A
nduction in liver with both low and high doses of BaP after 7 dFig. 6). There was a significant increase in bile metabolites mea-ured at both phenanthrene and BaP wavelength with both lownd high dose of BaP (Fig. 7), although BaP equivalent concentra-ion increased more than 100-fold, while phenanthrene equivalentoncentration increased by less than 10-fold.
. Discussion
Rainbow trout exposed to oil sands-influenced waters exhibitedecreased leukocytes in blood, spleen and head kidney as well as aecrease in antibody production against A. salmonicida. However,As derived from oil sands-influenced waters, at similar concen-
rations to those found in the surface waters tested, caused noomparable effects. BaP positive control exposure showed a suitef effects that were similar but not identical to those found with
il sands-influenced waters. Trout exposed to oil sands-influencedaters and extracted NAs demonstrated elevated levels of fluo-escent metabolites in bile. However, hepatic CYP1A as indicated
142– 143 (2013) 185– 194
by EROD activity was not increased by either oil sands-influencedwaters or by extracted NAs.
The immunotoxic responses observed following exposure tooil sands-influenced water sourced from Demonstration Pondwere consistent with previous responses reported in yellow perchand rainbow trout inhabiting Demonstration Pond. In a series ofstudies conducted since 1995, yellow perch were released intoDemonstration pond and after three months exhibited two dis-ease pathologies, fin erosion and skin lesions (Hogan et al., 2011;van den Heuvel et al., 2000). Skin lesions were identified as lym-phocystis disease, and the causative agent, lymphocystis diseasevirus, can be detected in asymptomatic individuals in a NorthernAlberta reference population (Palmer et al., 2012). Thus, it appearedthat exposure to Demonstration Pond water caused changes thatallowed the virus to overcome the perch immune system. An in situtrout experiment conducted by McNeill et al. (2012) caged rainbowtrout in Demonstration Pond for 21 d. This exposure caused someinitial mortality, a decrease in total leukocytes in blood, reducedproduction of antibodies to A. salmonicida, and decreased spleensize. Unlike the experiment at hand, facilities were not availablein the field to examine specific leukocyte populations in bloodor tissue, though blood smears indicated the lymphocytes weredepressed in blood. The exposure protocol employed herein wasable to show results consistent with the field experiment with only7 d exposure to Demonstration Pond water.
Unlike Demonstration Pond water, oil sands-derived NAs didnot possess significant immunotoxic potential. This research fol-lows from a previous study that used I.P. injection of the samesource of extracted NAs used herein (MacDonald et al., 2013). Inthis previous study, there were no significant decreases observedon blood or tissue leukocytes at 21 d post injection, though somestimulation of leukocytes in blood was observed and attributedto a mild inflammatory response. The only other immunotox-icity studies with fish have been conducted with commercialsources of NAs. Goldfish exposed to waterborne commercial NAsexhibited initial stimulation of pro-inflammatory gene expressionin gills, kidney and spleen (Hagen et al., 2012). Another studyreported that exposure of mouse bone marrow cells to com-mercial NAs resulted in a reduction in phagocytosis associatedwith alteration in pro-inflammatory cytokines (Garcia-Garcia et al.,2011). However, commercial NAs mixtures bear little resemblanceto the chemical profile found in aged oil-sands waters makingstudy comparisons impossible (MacDonald et al., 2013). It hasalso been suggested that commercial mixtures occasionally con-tain toxic components other than carboxylic acids such as C0–6alkylphenols (West et al., 2011) that could change the toxicityof the mixture. These ‘aromatic’ acids can also be found in oilsands-influenced water (Jones et al., 2012). While the NAs usedherein did not cause immunotoxicity, this does not imply that car-boxylic acids, or acid extractable compounds are not responsiblefor immune toxicity of Demonstration Pond water as the extrac-tion and purification procedure used removed unwanted organiccompounds from the solution and thereby concentrating the NAsextract.
In relation to reference waters, higher pHs (8.94) and higherconcentrations of salts (0.97 ppt) have been measured in Demon-stration Pond water. The pH in Demonstration Pond has beenobserved to increase over time and the increase is believed to bedue to the carbonates that are being released into the surface watercap as the tailings consolidate (van den Heuvel et al., 2012). There isalso no new freshwater input into Demonstration that could resultsin an increase in pH. However, it is unlikely that the higher pH is
have shown that rainbow trout are able to cope with acute high pH(pH > 9.0) exposure through their ammonia excretion, acid–basehomeostasis and electrolyte balance (Wilkie et al., 1996). Similarly,
ology
stsDi2
taadP(atPem
ncdaPiriwttptithwismcicfc
pste12iifltepcuBNtsTai
L.A. Leclair et al. / Aquatic Toxic
alinity in general, while elevated over natural surface waters is nothought to be responsible for causative immune effects as recenttudies using the South Bison Pond, with identical salinity to theemonstration Pond, shows much less pronounced immune effects
n yellow perch and trout in the South Bison Pond (Hogan et al.,011; McNeill et al., 2012).
Metals are also not suspected to be the immunotoxic agents inhe Demonstration Pond water. Metal contamination, likely associ-ted with deposition from atmospheric sources has been suggesteds being a concern for the region (Kelly et al., 2010). However,espite being in the depositional epicenter, the Demonstrationond has not shown evidence of influence from priority metalsvan den Heuvel et al., 1999a, 2012). However, metals, such as B, Srnd Li that are associated with marine clays and thus are expectedo have been derived from tailings, are elevated in Demonstrationond water (van den Heuvel et al., 2012). Given the limited knowl-dge of the toxicity of these compounds, conclusions cannot beade on potential for immunotoxicity.From our results, it appears that immunotoxic activity was
ot associated with activation of CYP1A. Previous studies haveonsistently shown elevated CYP1A activity in yellow perch (vanen Heuvel et al., 1999b), rainbow trout (McNeill et al., 2012),nd white sucker (Arens et al., 2013) exposed to Demonstrationond water. This is the first study to show the absence of CYP1Anduction with this water source. There are a number of possibleeasons for this including the possibility that induction observedn previous field studies was due to a dietary exposure to PAHs,
hich is supported by measured levels of PAHs in pond inver-ebrates (Wayland et al., 2008). However, it is also possible thathe causative agents of CYP1A induction were labile and did notersist, or were removed through the shipping and storage ofhe pond waters. Regardless, this does indicate that immunotox-city can proceed in the absence of CYP1A induction, suggestinghat immunotoxicity is likely not Ah receptor-dependent. PAHsave been suspected of being immunotoxic agents in these pondaters due to the frequent observation of elevated CYP1A activ-
ty. The absence of CYP1A activity in the pond water experimentsuggests that trout were not exposed to PAHs in the experi-ents presented herein, which in turn raises the likelihood that
ompounds other than PAHs may be involved in immunotoxic-ty in these experiments. Previously, bile fluorescence was alsoonsidered indicative of PAH exposure, however, it is knownrom the exposure to the purified NAs that this also is not thease.
Fluorescent bile metabolites measured by HPLC analysis athenanthrene wavelengths were increased with exposure to oilands-influenced waters and NAs exposure. Elevated phenan-hrene equivalent concentration has been observed in yellow perchxposed to Demonstration Pond water (van den Heuvel et al.,999b) and rainbow trout caged in this water (McNeill et al.,012). A key difference between pond water and NAs exposure
n the experiments described here was the increased complex-ty/aromaticity of the pond water as indicated by elevated bileuorescence at BaP wavelengths. This is likely because some ofhe more hydrophobic or neutral structures are removed from thextracted NAs though a dichloromethane extraction step in theurification (MacDonald et al., 2013). NAs possess weak fluores-ence at wavelengths similar to the phenanthrene wavelengthssed herein (Kavanagh et al., 2009; Mohamed et al., 2008) as did theaP metabolites. While those fish exposed to waterborne purifiedAs showed elevated bile phenanthrene equivalent concentration,
his result is contrary to a previous study using I.P. injection of the
ame material where no increase in bile fluorescence was observed.his suggests that NAs injected I.P. are not as available to the fishs with waterborne exposure used here. While bile fluorescencencreased upon exposure to oil sands-influenced waters, it is not142– 143 (2013) 185– 194 193
specifically indicative of the nature of the compounds to which fishare exposed in the case of oil sands exposures. Use of more specifictechniques such as NAs analysis in bile could be employed to betterunderstand the source of the bile metabolites.
The immunotoxicity of Demonstration Pond water bears somesimilarities to the effects characteristic of BaP, a known immuno-toxic PAH. BaP was not only used as a positive control because it is aknown immunotoxic effects on B-lymphocytes and T-lymphocytes(Logan, 2007), but also to compare the tissue specific pattern ofthat immunotoxicity to the pond water exposures. The most con-sistent and profound effect of BaP and pond water exposure was thedepletion of B-lymphocytes from spleen. This has been repeatedlyobserved with I.P. injection of BaP in rainbow (MacDonald et al.,2013). As the spleen is a storage organ for B-lymphocytes, it is likelythat these stores are depleted faster than they can be replaced whensignificant B-lymphocyte toxicity is occurring. While this responseis similar in nature between pond water and BaP exposure, the lackof CYP1A activity previously mentioned makes it unlikely that PAHsare causative agents in the pond water exposure. Other responseswere also dissimilar, notably the observations that BaP stimulatedboth erythrocyte and thrombocyte counts in blood and caused ele-vations in liver size, neither of which was observed with pondwater.
While there is uncertainty about causative agents, the bodyof evidence suggests that organic compounds associated with oilsands are still the most likely immunotoxic agents. Yellow perchdisease studies were conducted over a 17-year time period duringwhich considerable changes in pond chemistry took place (van denHeuvel et al., 2012). During this period, perch disease incidencedecreased in South Bison Pond, and increased in DemonstrationPond. The strongest correlate to this effect was the total NAs con-centration as derived by FTIR methods (Hogan et al., 2011). Whilethe NAs mixture tested here was not immunotoxic, this is only arefined subset of the complex suite of compounds in the mixture.Extraction procedures were selective for compounds that precipi-tate with acidification, and the process further selectively removedany neutral, or more hydrophobic compounds from the NAs mix-ture though dichloromethane extraction of the basic NAs solution.This dichloromethane extraction fraction induced CYP1A activityafter 24 h using H4IIE-luc cells (author’s unpublished data). Thisfraction may include neutral compounds known to be present in thepond environment such as alkylated dibenzothiophenes (Waylandet al., 2008).
The mixture of carboxylic acids in oil sands-influenced watersis proving to be far more complex than previously thought asshown by the presence of tricyclic diamondoid NAs in oil sands-influenced water (Rowland et al., 2011, 2012). Their presence ofhydroxy acids (O3 compounds) has also been demonstrated in oilsands-influenced water (West et al., 2013). The study at hand alsodemonstrated the presence of these oxidized NAs and showed thatthey are removed by the extraction process used for NAs. Chemistryresults support varying levels of degradation that occur to NAs overlong periods. NAs concentration was reduced by using microcosmsby 64–74% as well as reduced initial acute toxicity in rainbow troutwas reduced (Toor et al., 2013). Despite rapid degradation, otherNAs compounds remain recalcitrant for decades and it could bespeculated that diamondoid-type structures could be resistant tobacterial degradation.
The results presented herein demonstrate the immunotoxiceffects of oil sands-influenced waters similar to those observedin yellow perch (Hogan et al., 2011; van den Heuvel et al., 2000)and caged rainbow trout (McNeill et al., 2012). The study also
showed that extracted NAs conforming to the CnH2n + zO2 formulaare most likely not the cause of immunotoxicity found in the oilsands-influenced water. The exact compound(s) responsible for theeffects seen in Demonstration Pond still remains to be determined.
1 ology
Htmp
A
SRwaaCA
R
A
C
F
G
G
H
H
H
H
I
J
J
K
K
94 L.A. Leclair et al. / Aquatic Toxic
owever, this study along with previous evidence would suggesthat organic compounds are still the most likely candidates. Aro-
atic carboxylic acids, dibenzothiophenes, or oxidized NAs remainotential causative agents.
cknowledgements
This work was supported by Syncrude Canada, Suncor Energy,hell Albian Sands, Total E&P Canada, and Canadian Naturalesources Limited under the auspices of Canadian Oil Sands Net-ork for Research and Development and by NSERC CRD grants and
Canada Research Chair held by Michael R. van den Heuvel. Theuthors thank Scott Roloson, Gailene Tobin, Christina Pater, Michaeloffin, Kyle Knysh, Travis James, Brad Scott, Collin Arens, Ashleylberto and Jesse Hitchcock for support in the laboratory.
eferences
rens, C.J., Hogan, N.S.,vander Kraak, G.J., van den Heuvel,M.R., 2011. Evaluatingsub-lethal effects of oil sands process-affected waters on the white sucker(Catostomus commersonii). Poster Presentation,Society of Environmental Tox-icology and Chemistry,32nd Annual Meeting, Boston, USA, November 13–17,2011.
lemente, J., Fedorak, P., 2005. A review of the occurrence, analyses, toxicity, andbiodegradation of naphthenic acids. Chemosphere 60, 585–600.
rank, R.A., Kavanagh, R., Burnison, B.K., Headley, J.V., Peru, K.M., Der Kraak, G.V.,Solomon, K.R., 2006. Diethylaminoethyl-cellulose clean-up of a large volumenaphthenic acid extract. Chemosphere 64, 1346–1352.
arcia-Garcia, E., Pun, J., Perez-Estrada, L.A., Din, M.G.-E., Smith, D.W., Mar-tin, J.W., Belosevic, M., 2011. Commercial naphthenic acids and the organicfraction of oil sands process water downregulate pro-inflammatory geneexpression and macrophage antimicrobial responses. Toxicology Letters 203,62–73.
overnment of Alberta, 2011. Talk about oil sands [online], http://www.energy.alberta.ca/ (accessed January 2013).
agen, M.O., Garcia-Garcia, E., Oladiran, A., Karpman, M., Mitchell, S., El-Din, M.G.,Martin, J.W., Belosevic, M., 2012. The acute and sub-chronic exposures ofgoldfish to naphthenic acids induce different host defense responses. AquaticToxicology 109, 143–149.
an, X., MacKinnon, M.D., Martin, J.W., 2009. Estimating the in situ biodegradationof naphthenic acids in oil sands process waters by HPLC/HRMS. Chemosphere76, 63–70.
ogan, N.S., Groman, D., Phalen, L.J., van den Heuvel, M.R., 2011. Biochemicalresponses and disease incidence in yellow perch (Perca flavescens) exposed tooil sands process-affected waters. Platform presentation. In: Society of Envi-ronmental Toxicology and Chemistry, 32nd Annual Meeting, Boston, USA,November 13–17.
olowenko, F.M., MacKinnon, M.D., Fedorak, P.M., 2002. Characterization ofnaphthenic acids in oil sands wastewaters by gas chromatography–mass spec-trometry. Water Research 36, 2843–2855.
noue, T., Moritomo, T., Tamura, Y., Mamiya, S., Fujino, H., Nakanishi, T., 2002. A newmethod for fish leucocyte counting and partial differentiation by flow cytometry.Fish and Shellfish Immunology 13, 379–390.
ivraj, M.N., MacKinnon, M., Fung, B., 1995. Naphthenic acid extraction and quanti-tative analysis with FT-IR spectroscopy. In Syncrude Analytical Manuals, 4th ed.Research Department, Syncrude Canada Ltd., Edmonton, Alberta, Canada.
ones, D., West, C.E., Scarlett, A.G., Frank, R.A., Rowland, S.J., 2012. Isolation and esti-mation of the ‘aromatic’ naphthenic acid content of an oil sands process-affectedwater extract. Journal of Chromatography A 1247, 171–175.
avanagh, R.J., Burnison, B.K., Frank, R.A., Solomon, K.R., Van Der Kraak,G.J., 2009. Detecting oil sands process-affected waters in the Alberta oilsands region using synchronous fluorescence spectroscopy. Chemosphere 76,
120–126.elly, E.N., Short, J.W., Schindler, D.W., Hodson, P.V., Ma, M., Kwan, A.K., Fortin, B.L.,2009. Oil sands development contributes polycyclic aromatic compounds tothe Athabasca River and its tributaries. Proceedings of the National Academyof Sciences of the United States of America 106, 22346–22351.
142– 143 (2013) 185– 194
Kelly, E.N., Schindler, D.W., Hodson, P.V., Short, J.W., Radmanovich, R., Nielsen, C.C.,2010. OilsandsdevelopmentcontributeselementstoxicatlowconcentrationstotheAthabascaRiveranditstributaries. Proceedings of the National Academy ofSciences of the United States of America 107, 16178–16183.
Köllner, B., Kotterba, G., 2002. Temperature dependent activation of leuco-cyte populations of rainbow trout, Oncorhynchus mykiss, after intraperitonealimmunisation with Aeromonas salmonicida. Fish & Shellfish Immunology 12,35–48.
Logan, D.T., 2007. Perspective on ecotoxicology of PAHs to Fish. Human and Ecolog-ical Risk Assessment 13, 302–316.
MacDonald, G.Z., Hogan, N.S., Köllner, B., Thorpe, K.L., Phalen, L.J., Wagner, B.D., vanden Heuvel, M.R., 2013. Immunotoxic effects of oil sands-derived naphthenicacids to rainbow trout. Aquatic Toxicology 126, 95–103.
MacKinnon, M.D., Boerger, H., 1986. Description of two treatment methods fordetoxifying oil sands tailings pond water. Water Pollution Research Journal ofCanada 21, 496–512.
McNeill, S.A., Arens, C.J., Hogan, N.S., Köllner, B., van den Heuvel, M.R., 2012. Immuno-logical impacts of oil sands-affected waters on rainbow trout evaluated usingan in situ exposure. Ecotoxicology and Environmental Safety 84, 254–261.
Mohamed, M.H., Wilson, L.D., Headley, J.V., Peru, K.M., 2008. Screening of oil sandsnaphthenic acids by UV–vis absorption and fluorescence emission spectropho-tometry. Journal of Environmental Science and Health Part A 43, 1700–1705.
Palmer, L.J., Hogan, N.S., van den Heuvel, M.R., 2012. Phylogenetic analysis andmolecular methods for the detection of lymphocystis disease virus from yellowperch, Perca flavescens (Mitchell). Journal of Fish Diseases 35, 661–670.
Rowland, S.J., Scarlett, A.G., Jones, D., West, C.E., Frank, R.A., 2011. Diamonds in therough: identification of individual naphthenic acids in oil sands process water.Environmental Science & Technology 45, 3154–3159.
Rowland, S.J., West, C.E., Scarlett, A.G., Ho, C., Jones, D., 2012. Differentiation of twoindustrial oil sands process-affected waters by two-dimensional gas chromatog-raphy/mass spectrometry of diamondoid acid profiles. Rapid Communicationsin Mass Spectrometry 26, 572–576.
Secombes, C.J., 1990. Isolation of salmonid macrophages and analysis of their killingactivity. In: Van Muiswinkel, W.B. (Ed.), Techniques in Fish Immunology. SOSPublications, Fair Haven, pp. 101–103.
Toor, N.S., Franz, E.D., Fedorak, P.M., MacKinnon, M.D., Liber, K., 2013. Degradationand aquatic toxicity of naphthenic acids in oil sands process-affected watersusing simulated wetlands. Chemosphere 90, 449–458.
van den Heuvel, M.R., Munkittrick, K.R., Stegeman, J.J., Dixon, D.G., 1995a. Sec-ond round interlaboratory comparison of hepatic ethoxyresorufin-O-deethylaseactivity in white sucker (Catostomus commersoni) exposed to bleached-kraftpulp mill effluent. Environmental Toxicology and Chemistry 14, 1513–1520.
van den Heuvel, M.R., Power, M., MacKinnon, M.D., Van Meer, T., Dobson, E.P., Dixon,D.G., 1999a. Effects of oil sands related aquatic reclamation on yellow perch(Perca flavescens). I. Water quality characteristics and yellow perch physiologicaland population responses. Canadian Journal of Fisheries and Aquatic Sciences56, 1213–1225.
van den Heuvel, M.R., Power, M., MacKinnon, M.D., Dixon, D.G., 1999b. Effects of oilsands related aquatic reclamation on yellow perch (Perca flavescens). II. Chemicaland biochemical indicators of exposure to oil sands related waters. CanadianJournal of Fisheries and Aquatic Sciences 56, 1226–1233.
van den Heuvel, M.R., Power, M., Richards, J., Mackinnon, M., Dixon, D.G., 2000.Disease and gill lesions in yellow perch (Perca flavescens) exposed to oilsands mining-associated waters. Ecotoxicology and Environmental Safety 46,334–341.
van den Heuvel, M.R., Hogan, N.S., Roloson, S.D., Van Der Kraak, G.J., 2012. Reproduc-tive development of yellow perch (Perca flavescens) exposed to oil sands-affectedwaters. Environmental Toxicology and Chemistry 31, 654–662.
Wayland, M., Headley, J.V., Peru, K.M., Crosley, R., Brownlee, B.G., 2008. Levels ofpolycyclic aromatic hydrocarbons and dibenzothiophenes in wetland sedimentsand aquatic insects in the oil sands area of Northeastern Alberta, Canada. Envi-ronmental Monitoring and Assessment 136, 167–182.
West, C.E., Jones, D., Scarlett, A.G., Rowland, S.J., 2011. Compositional heterogene-ity may limit the usefulness of some commercial naphthenic acids for toxicityassays. Science of the Total Environment 409, 4125–4131.
West, C.E., Scarlett, A.G., Pureveen, J., Tegelaar, E.W., Rowland, S.J., 2013. Abun-dant naphthenic acids in oil sands process-affected water: studies by synthesis,
derivatisation and two-dimensional gas chromatography/high-resolution massspectrometry. Rapid Communications in Mass Spectrometry 27, 357–365.Wilkie, M.P., Simmons, H.E., Wood, C.M., 1996. Physiological adaptations of rain-bow troutto chronically elevated water pH (pH = 9.5). Journal of ExperimentalZoology 274, 1–14.
Related Documents