Virtual Archaeology Review VAR. Volumen 5 Número 10. ISSN: 1989-9947 Mayo 2014 21 The Idaho Virtualization Laboratory 3D Pipeline El Laboratorio de Virtualización 3D de Idaho Nicholas A. Holmer, Nicholas Clement, Kaitlyn Dehart, Herbert Maschner, Jesse Pruitt, Robert Schlader, Myriam van Walsum Idaho Virtualization Laboratory, Idaho Museum of Natural History, Idaho State University, 921 S. 8 th Ave., Stop 8096, Pocatello, Idaho 83204, USA Abstract Three dimensional (3D) virtualization and visualization is an important component of industry, art, museum curation and cultural heritage, yet the step by step process of 3D virtualization has been little discussed. Here we review the Idaho Virtualization Laboratory’s (IVL) process of virtualizing a cultural heritage item (artifact) from start to finish. Each step is thoroughly explained and illustrated including how the object and its metadata are digitally preserved and ultimately distributed to the world. Key words: 3D SCANNING, VIRTUALIZATION, CULTURAL HERITAGE, ARCHIVING. Resumen La virtualización y visualización tridimensional (3D) es un componente importante de la industria, el arte, los museos y el patrimonio cultural, sin embargo, el proceso paso a paso de virtualización 3D se ha discutido muy poco. Aquí repasamos de principio a fin el proceso de virtualizacion de un elemento del patrimonio cultural (artefacto) llevado a cabo por el Laboratorio de Virtualización de Idaho (IVL). Cada paso es explicado e ilustrado completamente incluyendo cómo el objeto y sus metadatos son preservados digitalmente y en última instancia, distribuidos en el mundo. Palabras Clave: DIGITALIZACIÓN EN 3D, LA VIRTUALIZACIÓN, PATRIMONIO CULTURAL, ARCHIVAR. 1. INTRODUCTION The Idaho Virtualization Laboratory (IVL) in the Idaho Museum of Natural History (IMNH) has been at the forefront of 3D virtualization of archaeological, paleontological, and anthropological specimens for 10 years. The recently completed Virtual Zooarchaeology of the Arctic Project (VZAP), with 6,783 3D images, 48,548 2D photographs on 264 specimens representing 169 species, their metadata, and on-line analysis tools, is a highlight of our success in this area (Betts et al., 2011; http://vzap.iri.isu.edu). VZAP is part of a larger IMNH effort in the democratization of science, with the goal of putting entire repositories on-line so that any student or scholar can conduct analyses of collections from anywhere in the world (Maschner, 2013; Maschner et al. 2013). Related projects include the Virtual Museum of Idaho and the Virtual Repository of Arctic Archaeology (http://ivl.imnh.isu.edu/), and a great number of specialized research projects (e.g. Tapanila et al., 2013).

Welcome message from author
This document is posted to help you gain knowledge. Please leave a comment to let me know what you think about it! Share it to your friends and learn new things together.
Transcript
Virtual Archaeology Review
VAR. Volumen 5 Número 10. ISSN: 1989-9947 Mayo 2014
21
The Idaho Virtualization Laboratory 3D Pipeline
El Laboratorio de Virtualización 3D de Idaho
Nicholas A. Holmer, Nicholas Clement, Kaitlyn Dehart, Herbert Maschner, Jesse Pruitt, Robert Schlader, Myriam van Walsum
Idaho Virtualization Laboratory, Idaho Museum of Natural History, Idaho State University,
921 S. 8th Ave., Stop 8096, Pocatello, Idaho 83204, USA
Abstract Three dimensional (3D) virtualization and visualization is an important component of industry, art, museum
curation and cultural heritage, yet the step by step process of 3D virtualization has been little discussed.
Here we review the Idaho Virtualization Laboratory’s (IVL) process of virtualizing a cultural heritage item
(artifact) from start to finish. Each step is thoroughly explained and illustrated including how the object and
its metadata are digitally preserved and ultimately distributed to the world.
Key words: 3D SCANNING, VIRTUALIZATION, CULTURAL HERITAGE, ARCHIVING.
Resumen La virtualización y visualización tridimensional (3D) es un componente importante de la industria, el arte,
los museos y el patrimonio cultural, sin embargo, el proceso paso a paso de virtualización 3D se ha
discutido muy poco. Aquí repasamos de principio a fin el proceso de virtualizacion de un elemento del
patrimonio cultural (artefacto) llevado a cabo por el Laboratorio de Virtualización de Idaho (IVL). Cada
paso es explicado e ilustrado completamente incluyendo cómo el objeto y sus metadatos son preservados
digitalmente y en última instancia, distribuidos en el mundo.
Palabras Clave: DIGITALIZACIÓN EN 3D, LA VIRTUALIZACIÓN, PATRIMONIO CULTURAL, ARCHIVAR.
1. INTRODUCTION
The Idaho Virtualization Laboratory (IVL) in the Idaho Museum of Natural History (IMNH) has been at the forefront of 3D virtualization of archaeological, paleontological, and anthropological specimens for 10 years. The recently completed Virtual Zooarchaeology of the Arctic Project (VZAP), with 6,783 3D images, 48,548 2D photographs on 264 specimens representing 169 species, their metadata, and on-line analysis tools, is a highlight of our success in this area (Betts et al.,
2011; http://vzap.iri.isu.edu). VZAP is part of a larger IMNH effort in the democratization of science, with the goal of putting entire repositories on-line so that any student or scholar can conduct analyses of collections from anywhere in the world (Maschner, 2013; Maschner et al. 2013). Related projects include the Virtual Museum of Idaho and the Virtual Repository of Arctic Archaeology (http://ivl.imnh.isu.edu/), and a great number of specialized research projects (e.g. Tapanila et al., 2013).
Virtual Archaeology Review
VAR. Volumen 5 Número 10. ISSN: 1989-9947 Mayo 2014
22
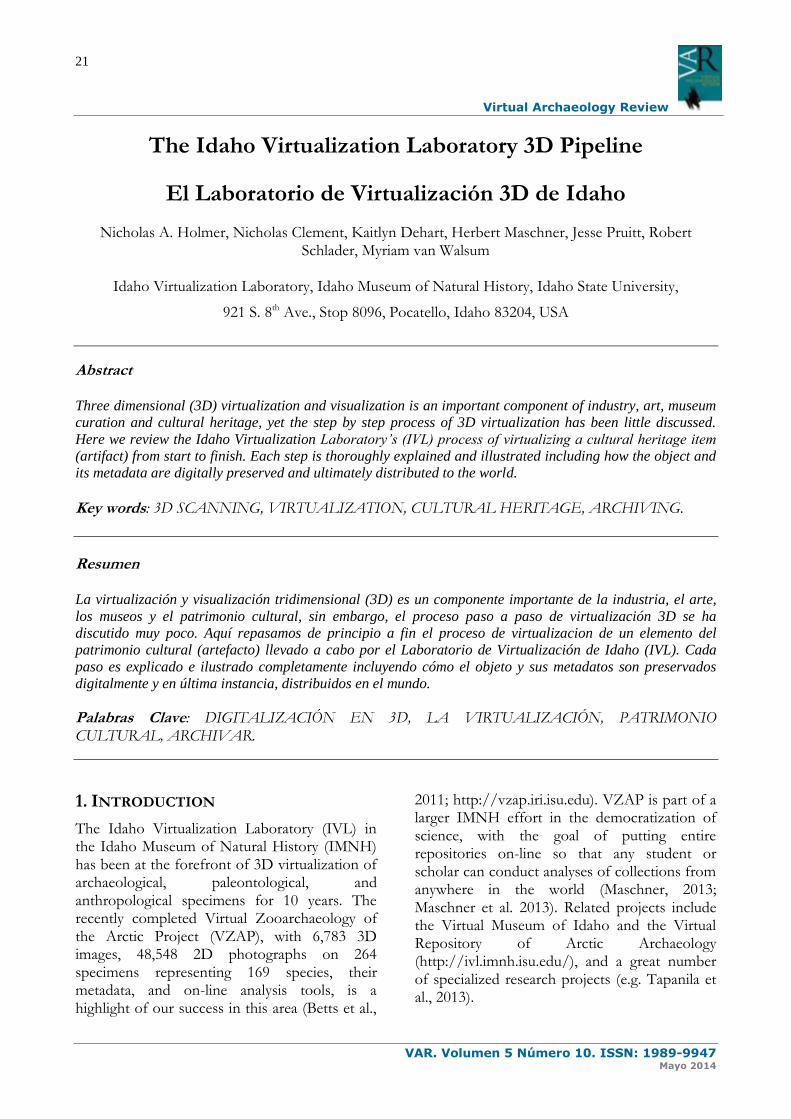
There has been much discussion recently of the process of producing virtual collections. Here we describe in detail the process by which a single item is photographed, scanned, and the resulting data processed and served to the world. For this example, we use a small, 2000 year-old, bone sea otter (Enhydra lutris) figurine from an archaeological site in Alaska (Fig. 1).
Figure 1. Sea Otter figurine prior to digitization Because it is small, highly detailed, complexly carved, and made of organic material, it provides an excellent opportunity to highlight many of the techniques we use to process archaeological and other museum specimens. Progessing from photography, to scanning, to processing the raw scan data, to editing and texturing, to its final description and storage in the database, our 3D pipeline is described and reviewed so that others might utilize these techniques to produce high-resolution 3D suragates of archaeological and museum specimens.
2. PHOTOGRAPHY
Photography is utilized in the IVL to fulfill three main goals: digital preservation (be of archival quality), 2 dimensional (2D) visualization (be of research quality) and color data capture for 3 dimensional (3D) models (texturing). A typical setup for the IVL, discussed in further detail below, is designed to fulfil the aforementioned goals with minimal setup, adjustments, editing and in as few pictures as possible.
Lighting, as with any photography, is the single most crucial aspect of our photographic process.
However, unlike typical photography uniform lighting from all directions is preferable. This 360 degree lighting allows for a shadow free environment enabling us to capture pure color data of an object. This diminishes shadow relief detail but allows for the image to be placed on a 3D model (texturing) without introducing a perpetual shadow. In turn, this allows for a more realistic 3D model when a digital light source is applied in a digital environment. Despite the diminished relief detail in the final 2D product, the true color is revealed allowing us to create a “digital surrogate” of the original object.
The second most important aspect of the IVL’s photography process is the use of a fixed zoom macro lens. These lenses create an image with minimal peripheral distortion effectively creating a research tool to collect metric data from the 2D object (i.e. distances and angles). A list of all the equipment used for photography, with the exception of such items as support material, can be found on our website ivl.imnh.isu.edu; typical camera settings and ranges of settings along with specific settings for the object in question can be found below. (Fig. 2)
CAMERA
SETTINGS TYPICAL RANGE
OBJECT IN QUESTION
STYLE Av (Aperture
Priority) Av
WHITE BALANCE
AWB or 6500K AWB
ISO 600-1000 (800) 800
AEB from +1 to -3 from -1 to -2
F-STOP 32 32
QUALITY High res JPEG and/or RAW
JPEG
Figure 2. Basic camera setttings
Several parameters must be met in order for our photography to satisfy our three objectives listed above. First, when positioning the object in frame for each photograph filling the frame as much as possible with the object is preferred. This allows for maximum data capture and resolution. Second, the point of focus must be near the ‘top’ of the object (or the closest point near the lens). Third, the presence and location of the scale (metric) must be adequate.

Virtual Archaeology Review
VAR. Volumen 5 Número 10. ISSN: 1989-9947 Mayo 2014
23
Specifically, the scale is placed at the bottom of the image and elevated to the point of focus allowing for more accurate metrics analyses. Lastly, all objects photographed are done so in their six ortogonal or anatomical positions allowing for maximum data capture.
Once a photo is taken using the on screen Canon EOS software, the image is then transferred to Adobe Photoshop for minor edits and adjustments. Typically photos are taken slightly darker than preferred so as not to over expose the object, keeping the color data intact. This, however, can be particularly troublesome when photographing bleached bone material on a black background. Simply using the auto level function, manual level function highlighting specific parameters such as lights and darks or manually adjusting the brightness and contrast is typical for image editing. On occasion images need more editing to make them adequate for analysis, 3D texturing and simple attractive presentation (i.e. support material needs to be removed and the background needs to be cleaned). (Fig.3)
When photographing a range of different objects it is important to have several background colors and a good knowledge of camera settings in order to capture an image that is best suited to the needs of its application. Once all images are taken, the object is then prepped for scanning.
Figure 3. Split image showing before and after editing
3. SCANNING
The first step in the modeling pipeline is data capture utilizing, in this case, the Faro Technologies Edge Arm non-contact surface digitizing laser system. The object is placed on a stabilized bench in such a way that the Edge Arm has full range of motion and data can be fully captured 360° around the object. To ensure object stability and to maximize scan group overlap the object is oriented perpendicular to the bench and secured in a block of low density florist foam. Once the object has been secured the scanning software, Geomagic Studio 2013, is opened and the scanning plug-in is activated. For this object the laser settings were set to Automatic Normal which allows the laser to adjust intensity as needed for Surface color variation. Next, the laser calibration is checked to verify that the laser and capture camera are functioning properly and will provide optimal scan files. The final step before starting the scan operation is to optimize the advanced settings for the size of the object and desired level of detail capture. Since this particular object is on the low end of the size range that the Edge Arm can accurately capture the target point spacing is set to a low threshold and the maximum edge length is also set to a low threshold. (Fig.4)
Figure 4. Laser and scan settings
Once the settings have all been verified, it is time to begin the actual scanning process. The object should be passed over with the laser with slow and steady airbrush-like motions, similar to using spray paint. Each scan pass is made along a straight plane of travel, rotating and tilting the
Virtual Archaeology Review
VAR. Volumen 5 Número 10. ISSN: 1989-9947 Mayo 2014
24
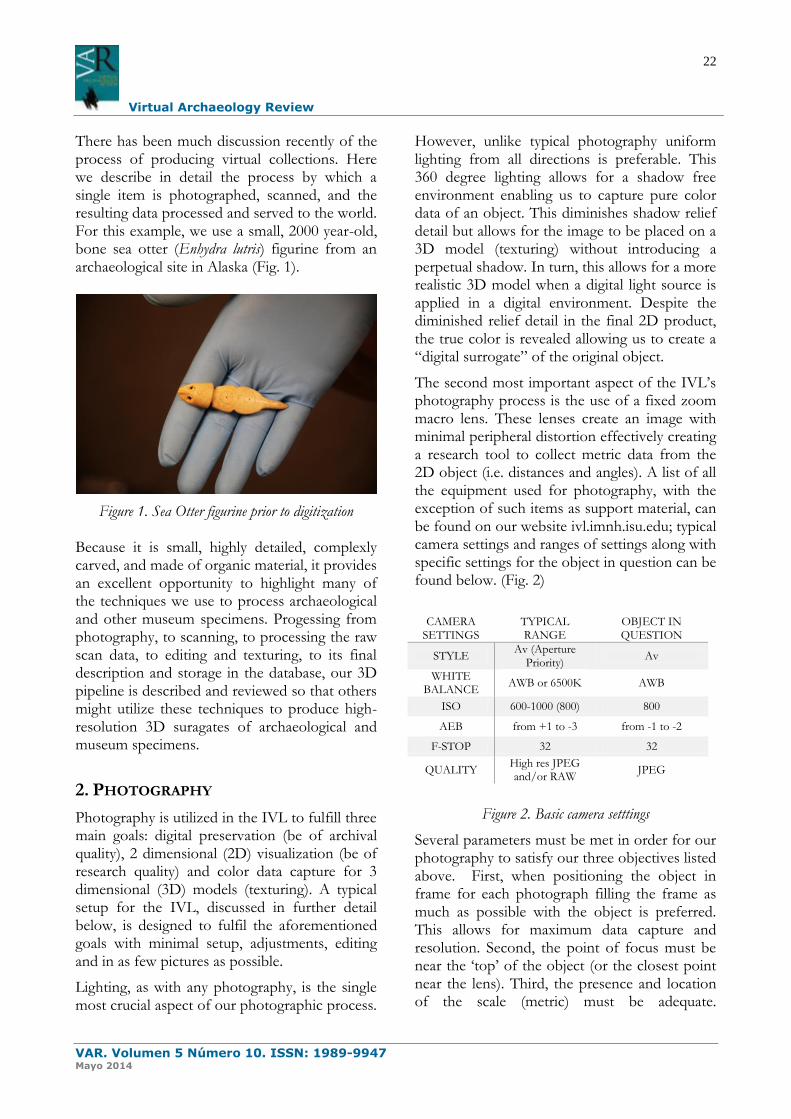
scan head is avoided to minimize scanning noise artifacts. Each subsequent scan pass should have enough overlapping scan data to make later scan alignment more efficient. After all visible surfaces of the object have been captured the scanner is stopped and this series of scans is stored as group one and a new group is started. For this new group the object is reoriented 180° along the long axis (y-axis) from the original group. The data capture process is then repeated, as with group one, and both groups are saved as a single file. (Fig.5)
Figure 5. Non-contact laser scanning with Faro Edge Arm directly into Geomagic.
4. RAW SCAN DATA PROCESSING
The next step in the pipeline is the processing of the raw scan data into a finished solid surface model. The file is opened in Geomagic Studio and the support material, florists foam, is edited out of the scan groups. Each scan group is globally aligned independently of each other and then both groups are aligned manually. After the manual alignment is complete the groups are globally aligned, the groups are broken down into individual scan files, and a single new group is created that contains all of the files. This new group is globally aligned one last time to ensure that all of the files mesh together as tightly as possible. The initial data editing can now begin, to make this process easier the object color is turned on which assigns each scan file a unique color so that outlying data can be easily isolated.
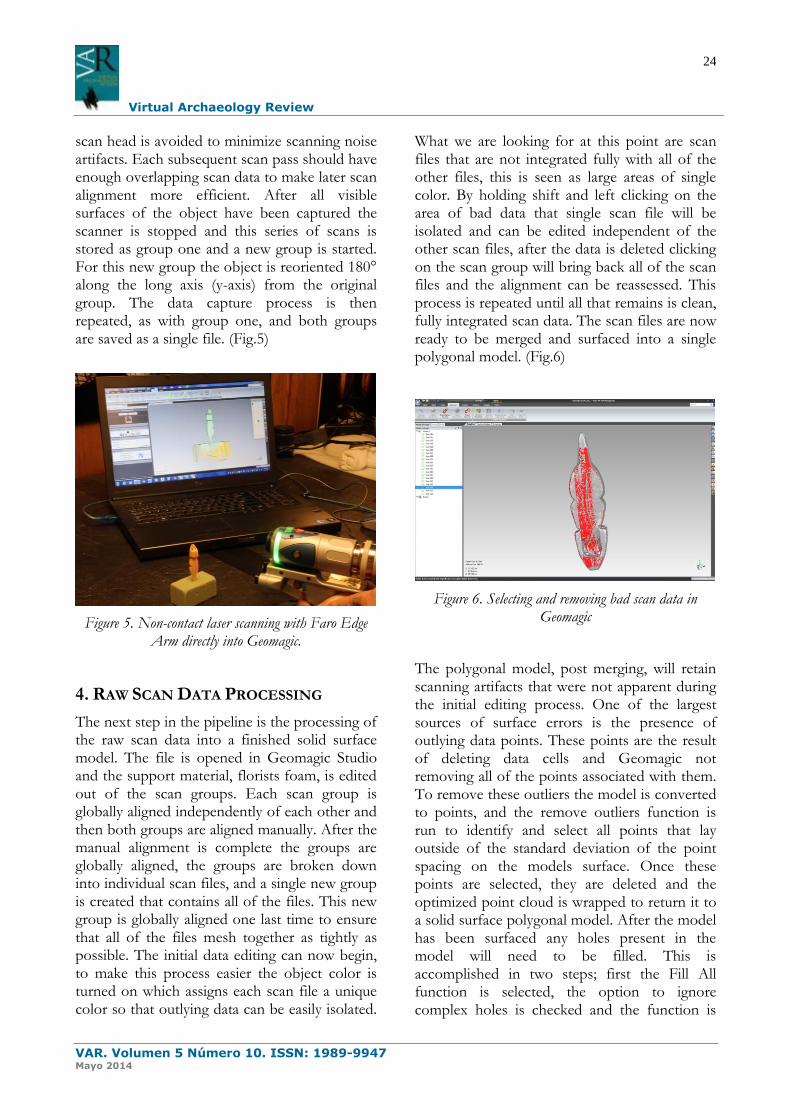
What we are looking for at this point are scan files that are not integrated fully with all of the other files, this is seen as large areas of single color. By holding shift and left clicking on the area of bad data that single scan file will be isolated and can be edited independent of the other scan files, after the data is deleted clicking on the scan group will bring back all of the scan files and the alignment can be reassessed. This process is repeated until all that remains is clean, fully integrated scan data. The scan files are now ready to be merged and surfaced into a single polygonal model. (Fig.6)
Figure 6. Selecting and removing bad scan data in Geomagic
The polygonal model, post merging, will retain scanning artifacts that were not apparent during the initial editing process. One of the largest sources of surface errors is the presence of outlying data points. These points are the result of deleting data cells and Geomagic not removing all of the points associated with them. To remove these outliers the model is converted to points, and the remove outliers function is run to identify and select all points that lay outside of the standard deviation of the point spacing on the models surface. Once these points are selected, they are deleted and the optimized point cloud is wrapped to return it to a solid surface polygonal model. After the model has been surfaced any holes present in the model will need to be filled. This is accomplished in two steps; first the Fill All function is selected, the option to ignore complex holes is checked and the function is
Virtual Archaeology Review
VAR. Volumen 5 Número 10. ISSN: 1989-9947 Mayo 2014
25
applied. The second step is selecting the Single Fill function and manually cleaning and filling all remaining holes. During this process it is often necessary to build bridges in certain areas to guide the filling process so that the resulting patch more accurately matches the original objects surface. When no holes remain in the model the final cleaning process can be started. At this point there will be a number of remaining surface artifacts that will make the later process of texturing the model difficult, these include surface spikes, highly creased edges, and small tunnels under the model surface. The Mesh Doctor function is utilized to repair these errors to the extent that it is needed in computer-aided design (CAD) models but not necessarily for heritage models. The final step of the model cleanup is using the Remesh function to even out the distribution of surface triangles. After remeshing the model is properly oriented, and moved to the origin and saved as an .obj file. (Fig.7)
Figure 7. Before and after running a Remesh function in Geomagic
5. EDITING AND TEXTURING
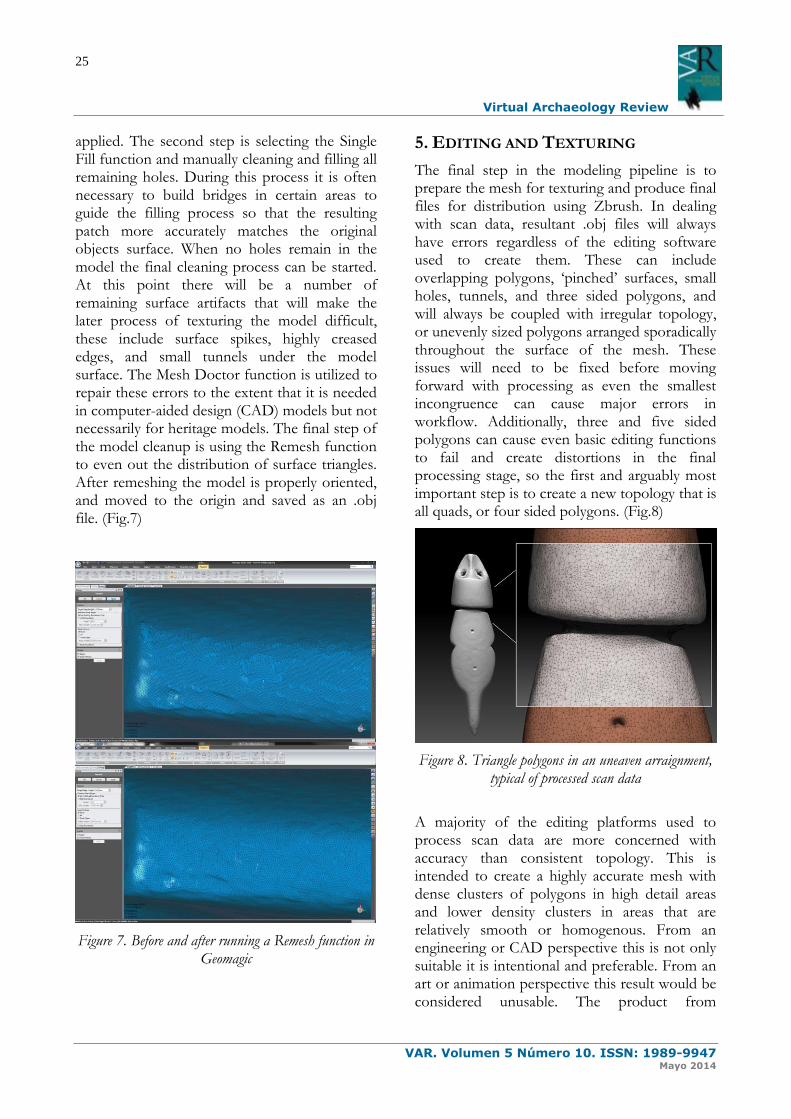
The final step in the modeling pipeline is to prepare the mesh for texturing and produce final files for distribution using Zbrush. In dealing with scan data, resultant .obj files will always have errors regardless of the editing software used to create them. These can include overlapping polygons, ‘pinched’ surfaces, small holes, tunnels, and three sided polygons, and will always be coupled with irregular topology, or unevenly sized polygons arranged sporadically throughout the surface of the mesh. These issues will need to be fixed before moving forward with processing as even the smallest incongruence can cause major errors in workflow. Additionally, three and five sided polygons can cause even basic editing functions to fail and create distortions in the final processing stage, so the first and arguably most important step is to create a new topology that is all quads, or four sided polygons. (Fig.8)
Figure 8. Triangle polygons in an uneaven arraignment, typical of processed scan data
A majority of the editing platforms used to process scan data are more concerned with accuracy than consistent topology. This is intended to create a highly accurate mesh with dense clusters of polygons in high detail areas and lower density clusters in areas that are relatively smooth or homogenous. From an engineering or CAD perspective this is not only suitable it is intentional and preferable. From an art or animation perspective this result would be considered unusable. The product from
Virtual Archaeology Review
VAR. Volumen 5 Número 10. ISSN: 1989-9947 Mayo 2014
26
digitizing heritage collections for both archiving and distribution exists between these two aspects of the 3D industry and yet should be useable for both, thus some post processing needs to occur before they can be considered finished. Of course we throw away nothing; all data are important. The original files, as well as the un-altered scan data are always kept through every step in the process. In certain digitization workflows, simply wrapping or surfacing the unaltered mesh is considered an acceptable archive and thus the end of the modeling process. However, for the purpose of this discussion a clean topology is essential to the workflow that will be outlined. It allows for much cleaner end results at varying levels of resolution, makes high density models easier for video cards to render, allows for cleaner displacement mapping, UV unwrapping, animation, reproduction via 3D printing, and so on. In short, it is good practice to ensure a product at the final stages of export that has much broader application models. To accomplish this in Zbrush, a clone is first made upon which ZRemesher is used to create a new topology and substantially reduced polygon count. The product of this re-mesh will become the lowest level of mesh density in a model with multiple division levels; it will have all quadrangles instead of triangles, no coupled maps, and no color or surface detail. The re-meshed clone can now be given several division levels upon which the original mesh will be projected, effectively emulating the native Zbrush workflow and regaining all of the detail from the original high resolution scan. (Fig.9)
Figure 9. Creating a re-meshed clone in Zbrush
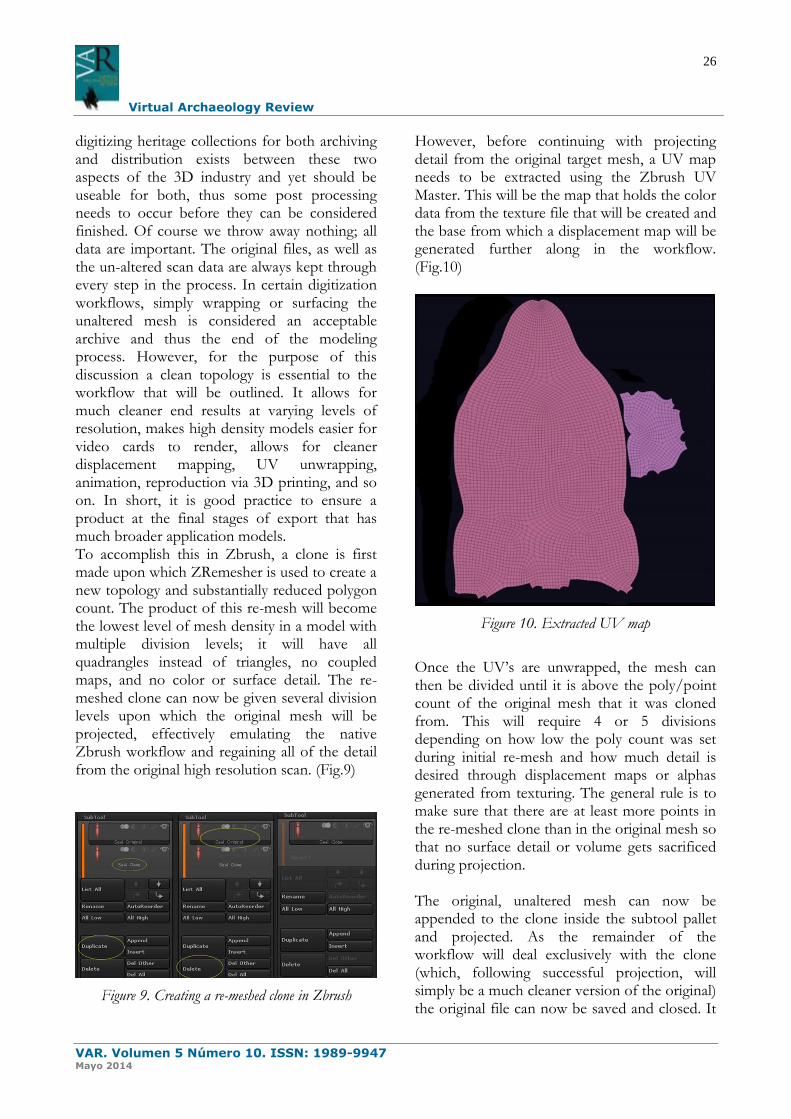
However, before continuing with projecting detail from the original target mesh, a UV map needs to be extracted using the Zbrush UV Master. This will be the map that holds the color data from the texture file that will be created and the base from which a displacement map will be generated further along in the workflow. (Fig.10)
Figure 10. Extracted UV map
Once the UV’s are unwrapped, the mesh can then be divided until it is above the poly/point count of the original mesh that it was cloned from. This will require 4 or 5 divisions depending on how low the poly count was set during initial re-mesh and how much detail is desired through displacement maps or alphas generated from texturing. The general rule is to make sure that there are at least more points in the re-meshed clone than in the original mesh so that no surface detail or volume gets sacrificed during projection. The original, unaltered mesh can now be appended to the clone inside the subtool pallet and projected. As the remainder of the workflow will deal exclusively with the clone (which, following successful projection, will simply be a much cleaner version of the original) the original file can now be saved and closed. It
Virtual Archaeology Review
VAR. Volumen 5 Número 10. ISSN: 1989-9947 Mayo 2014
27
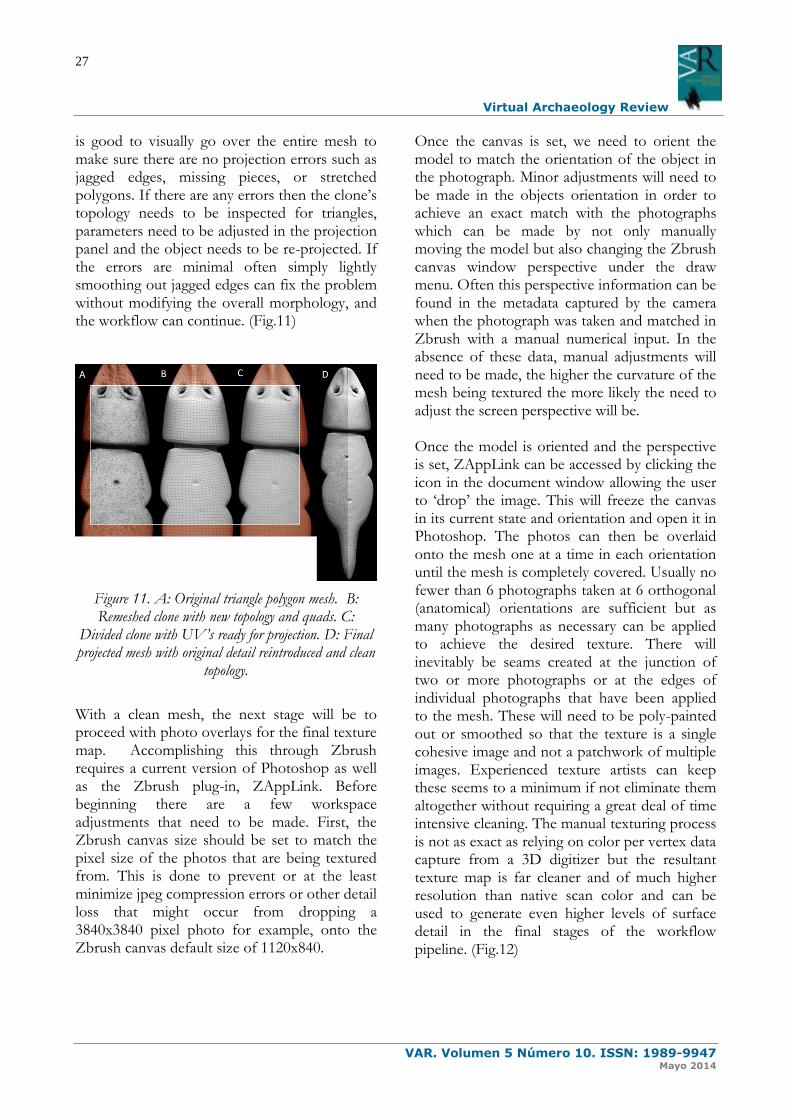
is good to visually go over the entire mesh to make sure there are no projection errors such as jagged edges, missing pieces, or stretched polygons. If there are any errors then the clone’s topology needs to be inspected for triangles, parameters need to be adjusted in the projection panel and the object needs to be re-projected. If the errors are minimal often simply lightly smoothing out jagged edges can fix the problem without modifying the overall morphology, and the workflow can continue. (Fig.11)
Figure 11. A: Original triangle polygon mesh. B: Remeshed clone with new topology and quads. C:
Divided clone with UV’s ready for projection. D: Final projected mesh with original detail reintroduced and clean
topology.
With a clean mesh, the next stage will be to proceed with photo overlays for the final texture map. Accomplishing this through Zbrush requires a current version of Photoshop as well as the Zbrush plug-in, ZAppLink. Before beginning there are a few workspace adjustments that need to be made. First, the Zbrush canvas size should be set to match the pixel size of the photos that are being textured from. This is done to prevent or at the least minimize jpeg compression errors or other detail loss that might occur from dropping a 3840x3840 pixel photo for example, onto the Zbrush canvas default size of 1120x840.
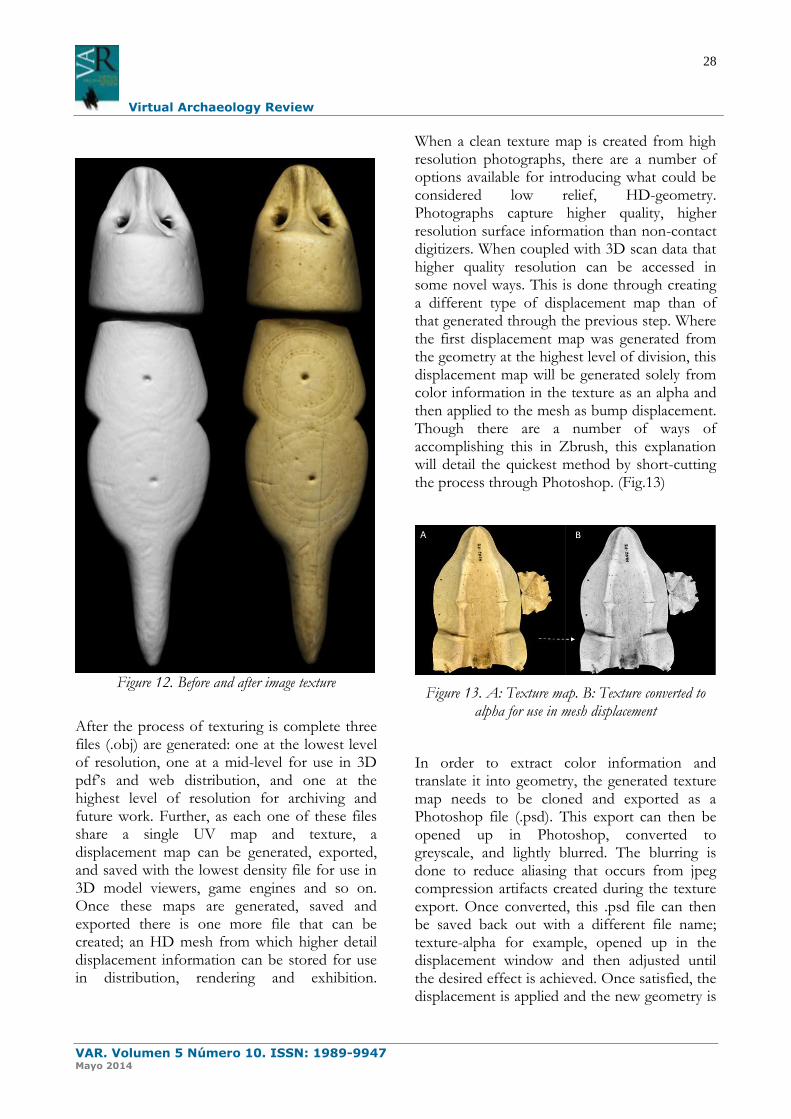
Once the canvas is set, we need to orient the model to match the orientation of the object in the photograph. Minor adjustments will need to be made in the objects orientation in order to achieve an exact match with the photographs which can be made by not only manually moving the model but also changing the Zbrush canvas window perspective under the draw menu. Often this perspective information can be found in the metadata captured by the camera when the photograph was taken and matched in Zbrush with a manual numerical input. In the absence of these data, manual adjustments will need to be made, the higher the curvature of the mesh being textured the more likely the need to adjust the screen perspective will be. Once the model is oriented and the perspective is set, ZAppLink can be accessed by clicking the icon in the document window allowing the user to ‘drop’ the image. This will freeze the canvas in its current state and orientation and open it in Photoshop. The photos can then be overlaid onto the mesh one at a time in each orientation until the mesh is completely covered. Usually no fewer than 6 photographs taken at 6 orthogonal (anatomical) orientations are sufficient but as many photographs as necessary can be applied to achieve the desired texture. There will inevitably be seams created at the junction of two or more photographs or at the edges of individual photographs that have been applied to the mesh. These will need to be poly-painted out or smoothed so that the texture is a single cohesive image and not a patchwork of multiple images. Experienced texture artists can keep these seems to a minimum if not eliminate them altogether without requiring a great deal of time intensive cleaning. The manual texturing process is not as exact as relying on color per vertex data capture from a 3D digitizer but the resultant texture map is far cleaner and of much higher resolution than native scan color and can be used to generate even higher levels of surface detail in the final stages of the workflow pipeline. (Fig.12)
Virtual Archaeology Review
VAR. Volumen 5 Número 10. ISSN: 1989-9947 Mayo 2014
28
Figure 12. Before and after image texture
After the process of texturing is complete three files (.obj) are generated: one at the lowest level of resolution, one at a mid-level for use in 3D pdf’s and web distribution, and one at the highest level of resolution for archiving and future work. Further, as each one of these files share a single UV map and texture, a displacement map can be generated, exported, and saved with the lowest density file for use in 3D model viewers, game engines and so on. Once these maps are generated, saved and exported there is one more file that can be created; an HD mesh from which higher detail displacement information can be stored for use in distribution, rendering and exhibition.
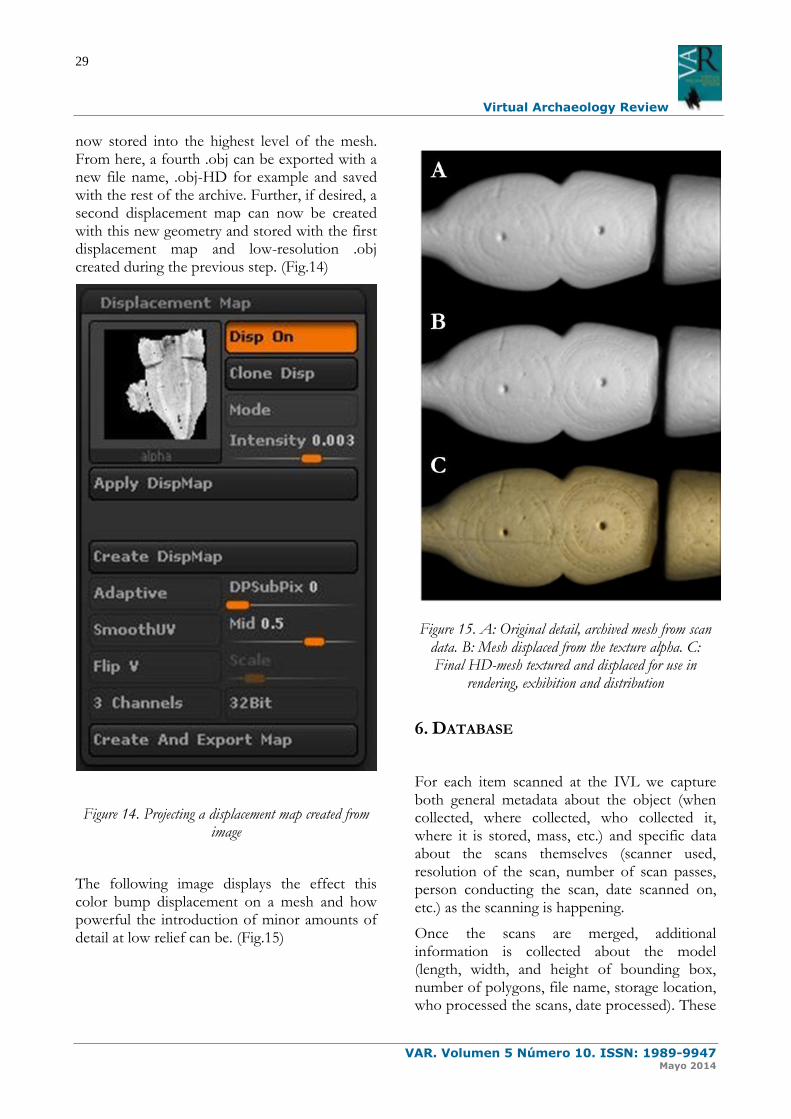
When a clean texture map is created from high resolution photographs, there are a number of options available for introducing what could be considered low relief, HD-geometry. Photographs capture higher quality, higher resolution surface information than non-contact digitizers. When coupled with 3D scan data that higher quality resolution can be accessed in some novel ways. This is done through creating a different type of displacement map than of that generated through the previous step. Where the first displacement map was generated from the geometry at the highest level of division, this displacement map will be generated solely from color information in the texture as an alpha and then applied to the mesh as bump displacement. Though there are a number of ways of accomplishing this in Zbrush, this explanation will detail the quickest method by short-cutting the process through Photoshop. (Fig.13)
Figure 13. A: Texture map. B: Texture converted to alpha for use in mesh displacement
In order to extract color information and translate it into geometry, the generated texture map needs to be cloned and exported as a Photoshop file (.psd). This export can then be opened up in Photoshop, converted to greyscale, and lightly blurred. The blurring is done to reduce aliasing that occurs from jpeg compression artifacts created during the texture export. Once converted, this .psd file can then be saved back out with a different file name; texture-alpha for example, opened up in the displacement window and then adjusted until the desired effect is achieved. Once satisfied, the displacement is applied and the new geometry is
Virtual Archaeology Review
VAR. Volumen 5 Número 10. ISSN: 1989-9947 Mayo 2014
29
now stored into the highest level of the mesh. From here, a fourth .obj can be exported with a new file name, .obj-HD for example and saved with the rest of the archive. Further, if desired, a second displacement map can now be created with this new geometry and stored with the first displacement map and low-resolution .obj created during the previous step. (Fig.14)
Figure 14. Projecting a displacement map created from image
The following image displays the effect this color bump displacement on a mesh and how powerful the introduction of minor amounts of detail at low relief can be. (Fig.15)
Figure 15. A: Original detail, archived mesh from scan data. B: Mesh displaced from the texture alpha. C: Final HD-mesh textured and displaced for use in
rendering, exhibition and distribution
6. DATABASE
For each item scanned at the IVL we capture both general metadata about the object (when collected, where collected, who collected it, where it is stored, mass, etc.) and specific data about the scans themselves (scanner used, resolution of the scan, number of scan passes, person conducting the scan, date scanned on, etc.) as the scanning is happening.
Once the scans are merged, additional information is collected about the model (length, width, and height of bounding box, number of polygons, file name, storage location, who processed the scans, date processed). These

Virtual Archaeology Review
VAR. Volumen 5 Número 10. ISSN: 1989-9947 Mayo 2014
30
data can be collected at the time the processing is completed, or at any time after that processing is finished.
As further processing occurs (texturing, re-meshing, etc.) data is collected about the resulting deliverables (names of processed meshes and where they are located, names of textures produced and their locations, who processed them, date they were processed, number of polygons in processed mesh, resolutions of the textures, what type of textures they are). These data can be collected at any time after the processing is completed, but preference is to perform the data entry immediately after the processing is finished. Data entry occurs in multiple stages: first, paper forms are filled out with all the object level metadata, and then paper forms are filled out for the model specific data when the model is processed. The information on these paper forms can be entered into our database at any time using our online data entry system. As items are processed through secondary processing, like texturing, that data is directly entered into the online system without first being written down on paper. This is done to facilitate data capture and editing at off-site locations, while all secondary processes occur in the lab offices.
7. DISCUSSION We live in a world that is dominated and ultimately defined by the services and the cost of those services available to us. As such, we at the IVL are constantly assessing the cost of our service to the world of digital heritage. The overall cost to digitally acquire data and preserve and distribute those data varies depending on the object or objects in question. Preliminary estimates for smaller museum specimens is now about $18.00 per specimen, but we are working with industry to reduce this cost to less than $10.00 per specimen by increasing automation, creating better color applications and reducing time spent on every process in our pipeline. Though the Faro Technologies Edge Arm non-contact surface digitizing laser system is capible
of very high resolution data capture there are a number of issues that can cause problems with scanning. If the object to be scanned is very large, like a sculpture or architectural friese, the amount of data being captured can easily overwelm even high end desktop PCs. For items like these a larger data sampling rate of 1mm or 2mm may be desirable to keep the file size down. Also, the sheer Surface area of the item will require more time to capture due to the relatively small (ca 4” wide) stripe being captured.
At the other end of the size spectrum, very small items require an exceptionally steady hand while scanning to keep the number of human caused scanning errors to a minimum. Also, using a fixed exposure setting on the scanner can help capture data from the object without capturing the support material or background. Reguardless, and quite counter-intuatively, the smaller the item being scanned the longer it will take to capture due to the scanner attempting to capture data from the entire length of the scanner’s laser stripe, and not simply the region actually covering the object of interest.
A final problem with doing any 3D capture work, especially for exhibition, is incorporating high resolution color data into the final model. With curent technologies, color information generated through scanning with non-contact surface digitizers is color-per-vertex; the color is applied directly to the polygon mesh and not mapped with UVs. If scanners were built with sufficiently high resolution cameras and if scan editing software produced models with good topological flow or consistant tessellation this would not be an issue, however neither of these are generally the case. Rather, the texture information at close proximity appears out of focus, and is generally not of a high enough quality to be considered useful on a finished archive. Therefore, a considerable amount of time in manual editing must be included in the processing stage to ensure that the textures are of the highest quality and clarity if color is desired with the final models.
There are other data capture solutions where color information is collected as a priority over
Virtual Archaeology Review
VAR. Volumen 5 Número 10. ISSN: 1989-9947 Mayo 2014
31
geometric information such as various photogrammetric applications. However, geometry and scale tend to be sacrificed over color information and small features can ‘web’ together as an artifact of generating geometry from, light, shadow, and color. The resultant textures are of photographic quality but the underlying wire frames are often too low in resolution to stand on their own as archival data and scale needs to be manually applied. Where
accuracy is a first priority in 3D heritage archiving, the geometry and scale cannot be comprimised. Due to this, for most scenarios outside of very large scale captures, like buildings or frescos for example, photogrammetry will not produce a high enough quality mesh for a heritage archive regardless of the color that can be created with it.
ACKNOWLEDGMENTS
The authors would like to thank the National Science Foundation (awards ARC- 0808933, 102332, 1237452 and 1321411), the Hitz Foundation, the M. J. Murdock Charitable Trust, Idaho State University, the ISU Informatics Research Institute, and the Idaho Museum of Natural History for supporting this research. The National Science Foundation, nor any other funding source, is responsible for the advancements, conclusions, or implications of this work.
REFERENCES BETTS, M. W., MASCHNER, H. D. G., SCHOU, C. D., SCHLADER, R., HOLMES, J., CLEMENT, N., SMUIN, M. (2011): “Virtual zooarchaeology: building a web-based reference collection of northern vertebrates for archaeofaunal research and education”, in Journal of Archaeological Science, Volume: 38, Issue: 4, pp. 755-762. MASCHNER, H. (2013): “Democracy in 3D”, in Museum, pp. 26-31. MASCHNER, H., SCHOU, C., HOLMES, J. (2013): “Virtualization and the democratization of science: 3D technologies revolutionize museum research and Access”, in Proceedings of the 2013 World Digital Heritage Conference. -1-4799-3169-9/13©2013 IEEE. TAPANILA, L., PRUITT, J., PRADEL, A., WILGA, C. D., RAMSAY, J. B., SCHLADER, R., DIDIER, D. A. (2013): “Jaws for a spiral-tooth whorl: CT images reveal novel adaptation and phylogeny in fossil Helicoprion”, in Biology Letters, 9, 20130057
Idiomas
Traducción
Related Documents


![IDAHO SS.4.2015.HO.Antibacterials [Read-Only]...4/6/2015 1 ANTIBACTERIALS: Recent Releases & Pipeline Promises Idaho Society of Health-Systems Pharmacists Gerry Barber, RPh, MPH Department](https://static.cupdf.com/doc/110x72/60da12c3f84d567ab30ba054/idaho-ss42015hoantibacterials-read-only-462015-1-antibacterials-recent.jpg)