© International Baccalaureate Organization 20 International Baccalaureate® | Baccalauréat International® | Bachillerato Internacional® The IB Diploma Programme WƌŽǀŝƐŝŽŶĂů Statistical Bulletin May 20Ϯϭ ƐƐĞƐƐŵĞŶƚ Session

Welcome message from author
This document is posted to help you gain knowledge. Please leave a comment to let me know what you think about it! Share it to your friends and learn new things together.
Transcript
© International Baccalaureate Organization 20International Baccalaureate® | Baccalauréat International® | Bachillerato Internacional®
The IB Diploma Programme Statistical Bulletin
May 20 Session
/
The IB Diploma Programme Provisional Statistical Bulletin, May 2021 Assessment Session.
International Baccalaureate IB Global Centre, Cardiff
Peterson House, Malthouse AvenueCardiff Gate, Cardiff, Wales
CF23 8GLUnited Kingdom
Website: www.ibo.org
© International Baccalaureate Organization 2021
/
Key to abbreviations
Categories of registrationDiploma Programme (DP) candidates must register in one of four categories:
Diploma: Candidates intending to complete the requirements for the award of an IB Diploma.Retake*: Previous IB Diploma candidates who are seeking to improve their results by retaking one or more subjects. The highest grade obtained for a subject will contribute towards the IB.Course: Candidates taking one or more subjects who are not seeking the award of the IB Diploma.Anticipated: Candidates intending to complete the requirements for one or two standard level subjects (excluding languages ab initio and pilot subjects) at the end of their first year of the Diploma Programme. They must complete all remaining IB Diploma requirements in the corresponding examination session the following year.
*Unless otherwise stated, retake candidates are included in the dataset.
IB RegionsSchools authorized to offer the IB Diploma Programme are grouped by geographical regions. The abbreviationsused in the tables are the codes describing the following geographical regions:
IBA: IB AmericasIBAEM: IB Africa, Europe, Middle EastIBAP: IB Asia-Pacific
Other Abbreviations
HL: Higher LevelSL: Standard LevelTOK/TK: Theory of KnowledgeEE: Extended Essay
Provisional dataThese data tables are provisional. They are a snapshot of outcomes taken shortly before results are released to candidates and do not reflect changes due to Enquiry upon Results or IB investigations where schools have not responded to inquiries by issue of results. A confirmed version of this statistical release will be made available at the end of September. Whilst provisional, we do not anticipate significant changes to outcomes or entries to occur when the final bulletin is released.
If you have feedback on this statistical bulletin please email [email protected].
Provisional statistical bulletin Page 1
Context for the May 2021 Statistical BulletinDue to the ongoing disruptions as a result of COVID-19 the IB offered two routes for assessment, examinations and a non-examination route. For the non-examination route the IB used the available evidence from teachers on the student achievement; the marked coursework that the student had already completed, the predicted grade from the teacher and evidence on how these two pieces of data usually related to final grades for each school.
The IB has made every effort to ensure parity between the examination and non-examination route and recommend all stakeholders to treat them as equivalent. All statistics are based on the combined examination and non- examination route.
/
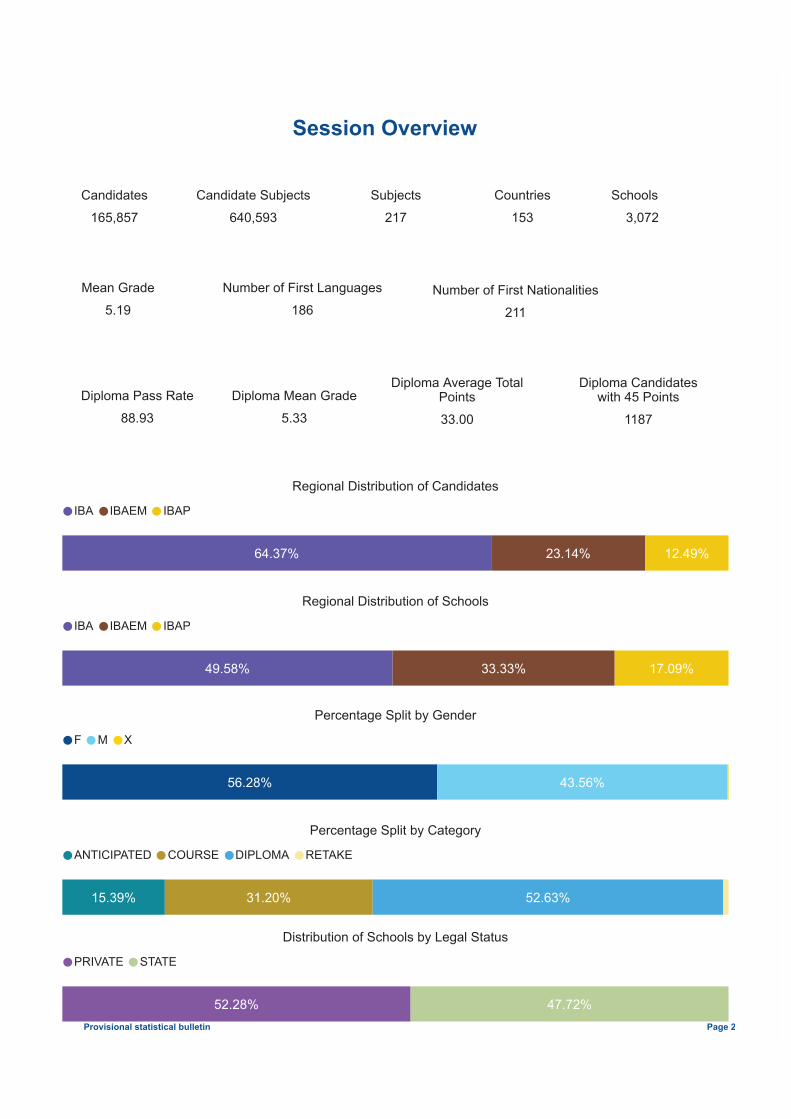
Candidates165,857
Diploma Pass Rate88.93
Schools3,072
Countries153
Number of First Nationalities211
Regional Distribution of Candidates
64.37% 23.14% 12.49%
IBA IBAEM IBAP
Regional Distribution of Schools
49.58% 33.33% 17.09%
IBA IBAEM IBAP
Percentage Split by Gender
56.28% 43.56%
F M X
Percentage Split by Category
15.39% 31.20% 52.63%
ANTICIPATED COURSE DIPLOMA RETAKE
Distribution of Schools by Legal Status
52.28% 47.72%
PRIVATE STATE
Session Overview
Subjects217
Candidate Subjects640,593
Mean Grade5.19
Provisional statistical bulletin Page 2
Number of First Languages186
Diploma Mean Grade5.33
Diploma Average TotalPoints33.00
Diploma Candidateswith 45 Points
1187
/
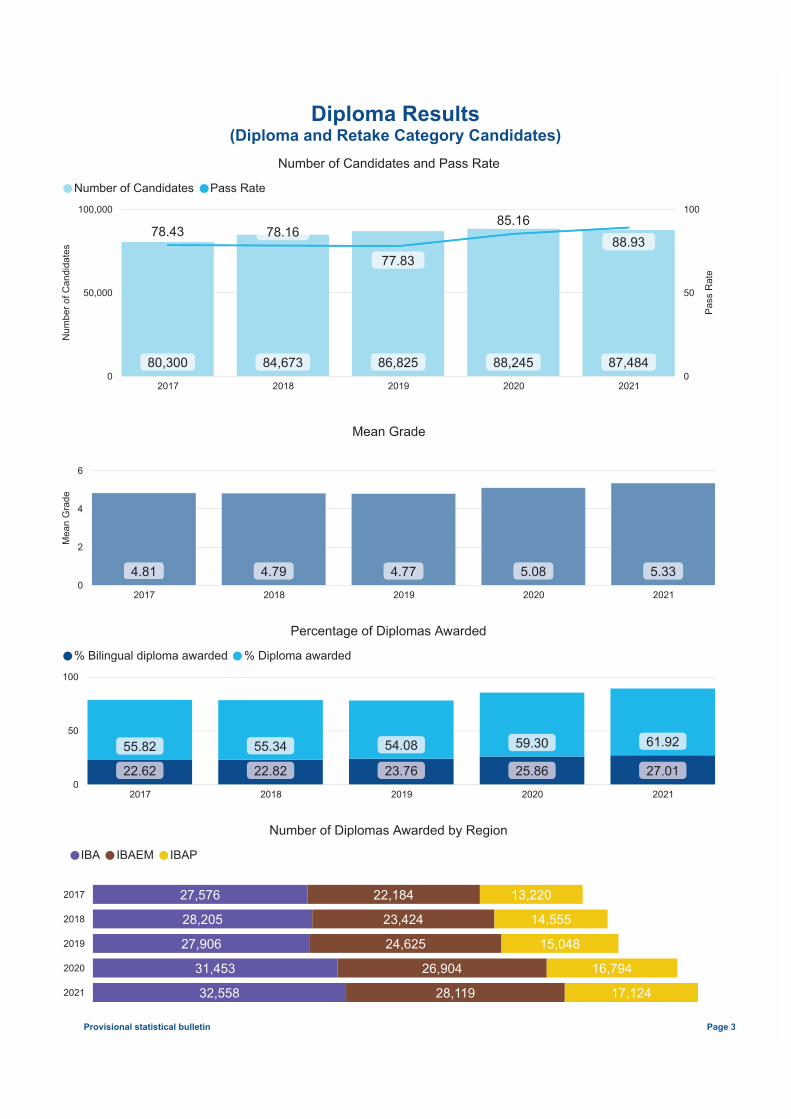
Number of Candidates and Pass Rate
0
50,000
100,000
0
50
100
Num
ber o
f Can
dida
tes
Pass
Rat
e
2017 2018 2019 2020 2021
80,300 87,48488,24586,82584,673
78.4388.93
77.83
78.1685.16
Number of Candidates Pass Rate
Number of Diplomas Awarded by Region
2017
2018
2019
2020
2021
27,576
28,205
27,906
31,453
32,558
22,184
23,424
24,625
26,904
28,119
13,220
14,555
15,048
16,794
17,124
IBA IBAEM IBAP
Percentage of Diplomas Awarded
0
50
100
2017 2018 2019 2020 2021
22.62 27.0123.7622.82 25.86
55.82 61.9254.0855.34 59.30
% Bilingual diploma awarded % Diploma awarded
Diploma Results(Diploma and Retake Category Candidates)
Provisional statistical bulletin Page 3
Mean Grade
0
2
4
6
Mea
n G
rade
2017 2018 2019 2020 2021
4.81 5.334.774.79 5.08
/
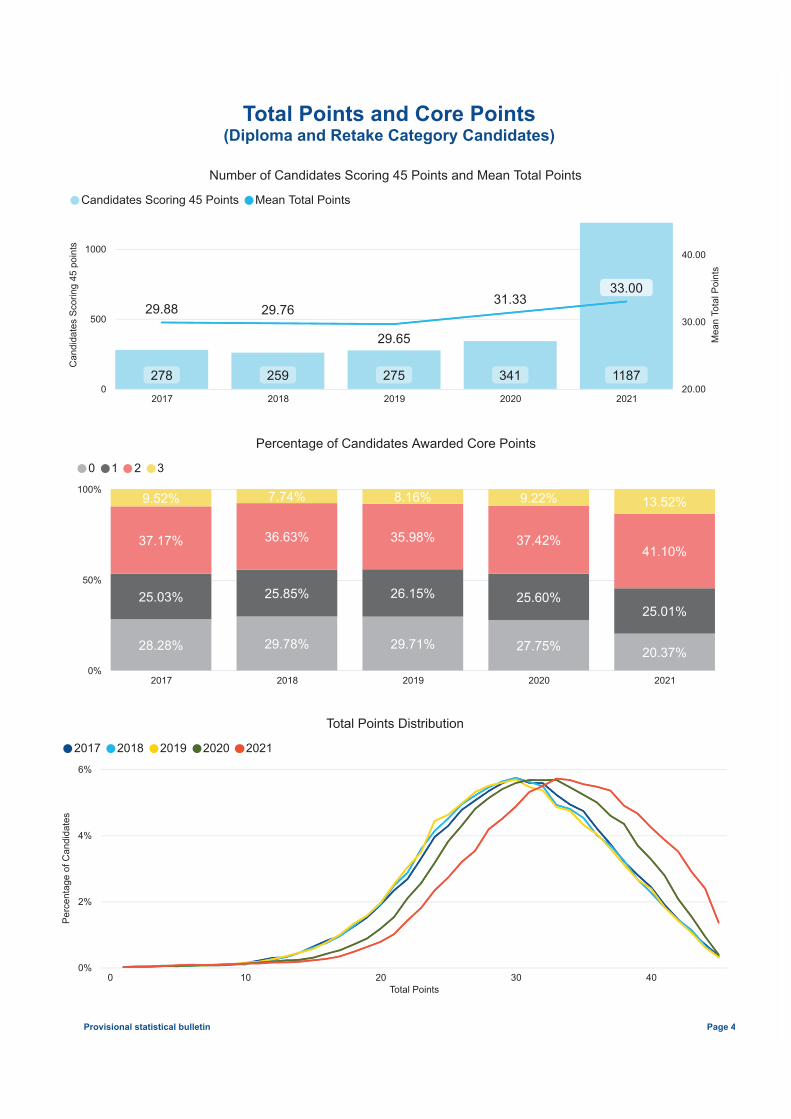
Number of Candidates Scoring 45 Points and Mean Total Points
0
500
1000
20.00
30.00
40.00
Can
dida
tes
Scor
ing
45 p
oint
s
Mea
n To
tal P
oint
s
2017 2018 2019 2020 2021
278 1187259 341275
29.8833.00
29.65
29.7631.33
Candidates Scoring 45 Points Mean Total Points
Percentage of Candidates Awarded Core Points
0%
50%
100%
2017 2018 2019 2020 2021
28.28% 20.37%29.78% 27.75%29.71%
25.03%25.01%
26.15%25.85% 25.60%
37.17%41.10%
35.98%36.63% 37.42%
9.52% 13.52%7.74% 9.22%8.16%
0 1 2 3
Total Points Distribution
0%
2%
4%
6%
Total Points
Perc
enta
ge o
f Can
dida
tes
0 10 20 30 40
2017 2018 2019 2020 2021
Total Points and Core Points(Diploma and Retake Category Candidates)
Provisional statistical bulletin Page 4
/
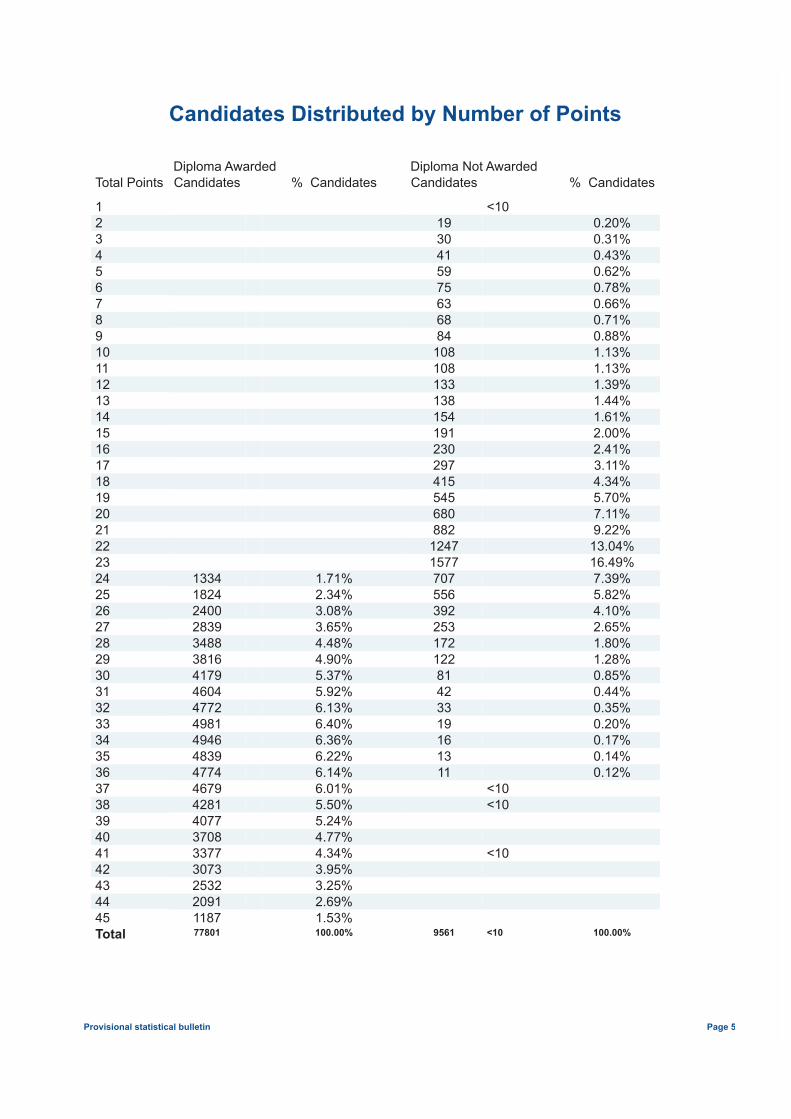
Candidates Distributed by Number of Points
Total Points
Diploma AwardedCandidates
% Candidates
Diploma Not AwardedCandidates
% Candidates
123456789101112131415161718192021222324252627282930313233343536373839404142434445
1930415975636884
108108133138154191230297415545680
<10
0.20%0.31%0.43%0.62%0.78%0.66%0.71%0.88%1.13%1.13%1.39%1.44%1.61%2.00%2.41%3.11%4.34%5.70%7.11%
13341824240028393488381641794604477249814946483947744679428140773708
1.71%2.34%3.08%3.65%4.48%4.90%5.37%5.92%6.13%6.40%6.36%6.22%6.14%6.01%5.50%5.24%4.77%
8821247157770755639225317212281423319161311
<10<10
9.22%13.04%16.49%7.39%5.82%4.10%2.65%1.80%1.28%0.85%0.44%0.35%0.20%0.17%0.14%0.12%
33773073253220911187
4.34%3.95%3.25%2.69%1.53%
<10
Total 77801 100.00% 9561 <10 100.00%
Provisional statistical bulletin Page 5
/
Gradeawarded
No gradeawarded
Total
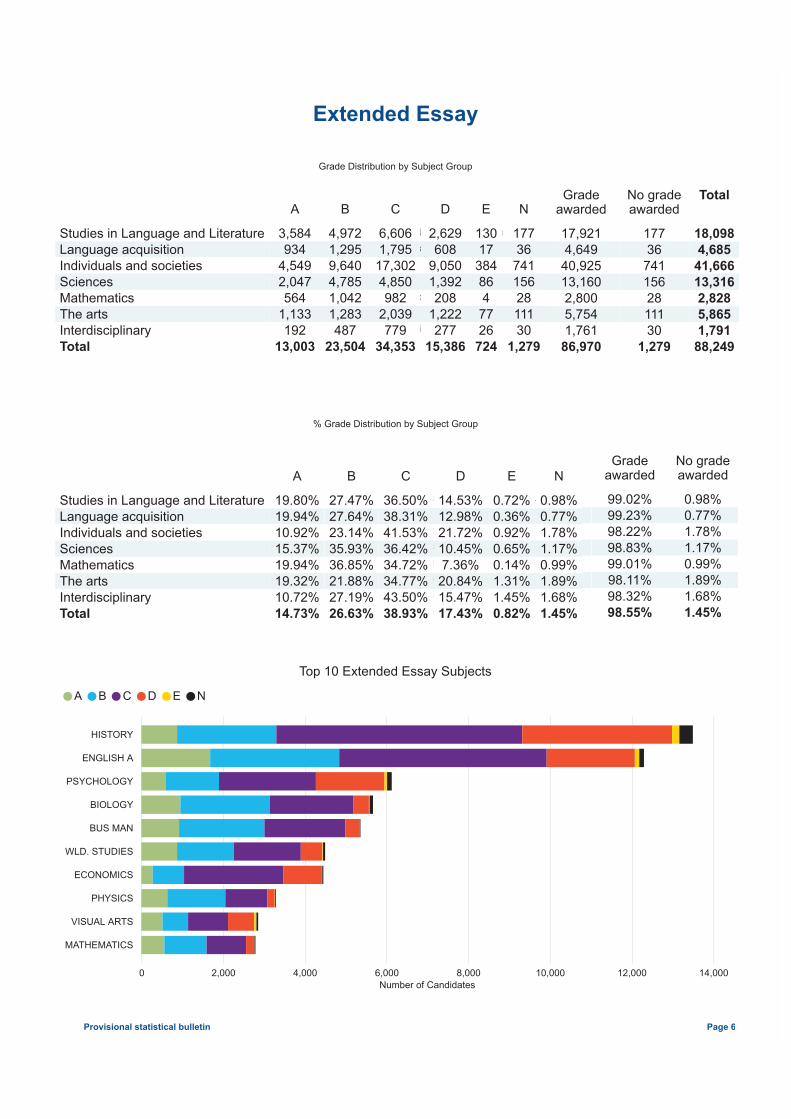
Studies in Language and LiteratureLanguage acquisitionIndividuals and societiesSciencesMathematicsThe artsInterdisciplinary
17,9214,649
40,92513,1602,8005,7541,761
17736
7411562811130
18,0984,685
41,66613,3162,8285,8651,791
Total 86,970 1,279 88,249
Grade Distribution by Subject Group
Gradeawarded
No gradeawarded
Studies in Language and LiteratureLanguage acquisitionIndividuals and societiesSciencesMathematicsThe artsInterdisciplinary
99.02%99.23%98.22%98.83%99.01%98.11%98.32%
0.98%0.77%1.78%1.17%0.99%1.89%1.68%
Total 98.55% 1.45%
A
B
C
D
E
N
Studies in Language and LiteratureLanguage acquisitionIndividuals and societiesSciencesMathematicsThe artsInterdisciplinary
3,584934
4,5492,047564
1,133192
4,9721,2959,6404,7851,0421,283487
6,6061,795
17,3024,850982
2,039779
2,629608
9,0501,392208
1,222277
13017
384864
7726
17736
7411562811130
Total 13,003 23,504 34,353 15,386 724 1,279
A
B
C
D
E
N
Studies in Language and LiteratureLanguage acquisitionIndividuals and societiesSciencesMathematicsThe artsInterdisciplinary
19.80%19.94%10.92%15.37%19.94%19.32%10.72%
27.47%27.64%23.14%35.93%36.85%21.88%27.19%
36.50%38.31%41.53%36.42%34.72%34.77%43.50%
14.53%12.98%21.72%10.45%7.36%
20.84%15.47%
0.72%0.36%0.92%0.65%0.14%1.31%1.45%
0.98%0.77%1.78%1.17%0.99%1.89%1.68%
Total 14.73% 26.63% 38.93% 17.43% 0.82% 1.45%
Extended Essay
Top 10 Extended Essay Subjects
0 2,000 4,000 6,000 8,000 10,000 12,000 14,000Number of Candidates
HISTORY
ENGLISH A
PSYCHOLOGY
BIOLOGY
BUS MAN
WLD. STUDIES
ECONOMICS
PHYSICS
VISUAL ARTS
MATHEMATICS
A B C D E N
Provisional statistical bulletin Page 6
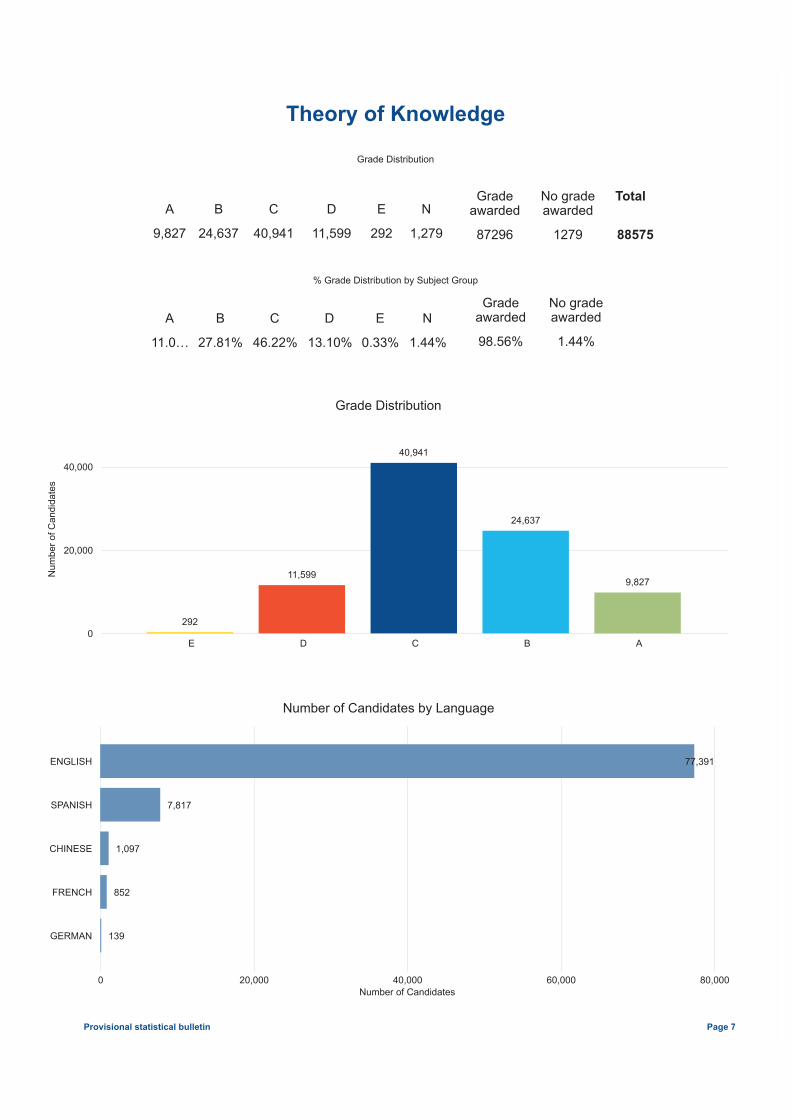
% Grade Distribution by Subject Group
/
Gradeawarded
No gradeawarded
98.56% 1.44%
Gradeawarded
No gradeawarded
Total
87296 1279 88575
A
B
C
D
E
N
9,827 24,637 40,941 11,599 292 1,279
Theory of Knowledge
A
B
C
D
E
N
11.0… 27.81% 46.22% 13.10% 0.33% 1.44%
Grade Distribution
0
20,000
40,000
Num
ber o
f Can
dida
tes
E D C B A
292
11,599
40,941
24,637
9,827
Number of Candidates by Language
0 20,000 40,000 60,000 80,000Number of Candidates
ENGLISH
SPANISH
CHINESE
FRENCH
GERMAN
77,391
7,817
1,097
852
139
Provisional statistical bulletin Page 7
Grade Distribution
% Grade Distribution by Subject Group
/
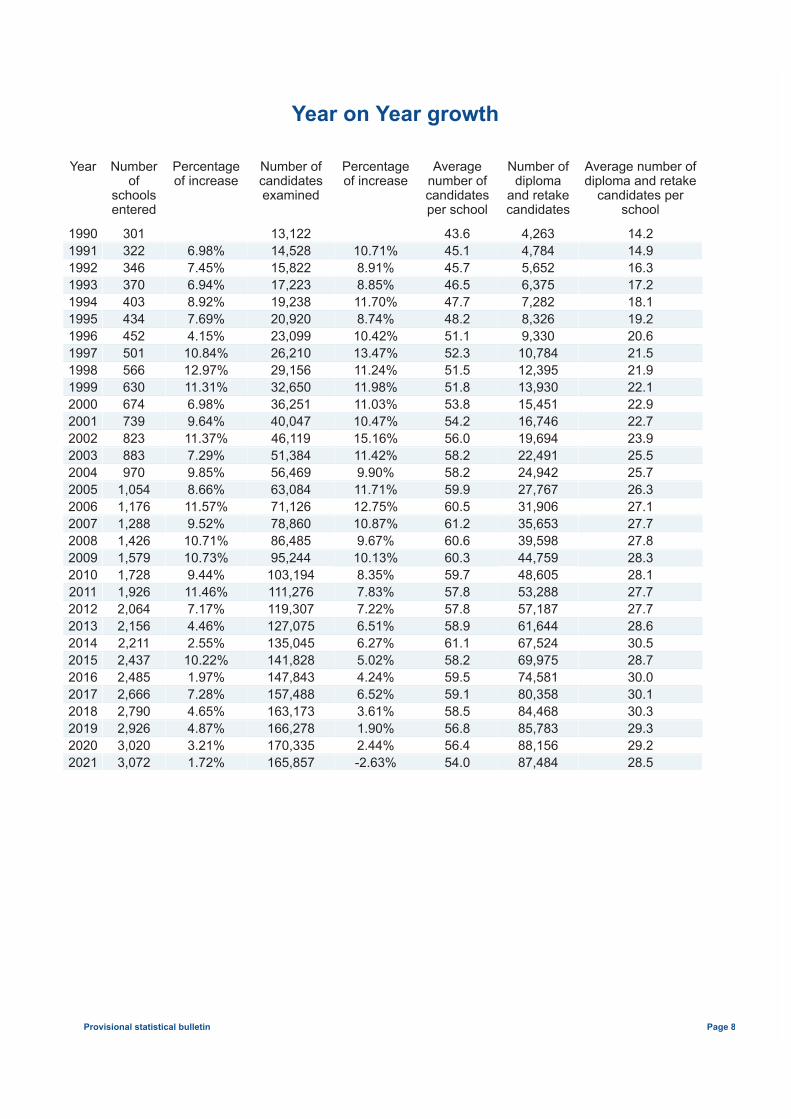
Year on Year growth
Year Numberof
schoolsentered
Percentageof increase
Number ofcandidatesexamined
Percentageof increase
Averagenumber ofcandidatesper school
Number ofdiploma
and retakecandidates
Average number ofdiploma and retake
candidates perschool
19901991199219931994199519961997199819992000200120022003200420052006200720082009
301322346370403434452501566630674739823883970
1,0541,1761,2881,4261,579
6.98%7.45%6.94%8.92%7.69%4.15%
10.84%12.97%11.31%6.98%9.64%11.37%7.29%9.85%8.66%11.57%9.52%
10.71%10.73%
13,12214,52815,82217,22319,23820,92023,09926,21029,15632,65036,25140,04746,11951,38456,46963,08471,12678,86086,48595,244
10.71%8.91%8.85%11.70%8.74%
10.42%13.47%11.24%11.98%11.03%10.47%15.16%11.42%9.90%11.71%12.75%10.87%9.67%
10.13%
43.645.145.746.547.748.251.152.351.551.853.854.256.058.258.259.960.561.260.660.3
4,2634,7845,6526,3757,2828,3269,330
10,78412,39513,93015,45116,74619,69422,49124,94227,76731,90635,65339,59844,759
14.214.916.317.218.119.220.621.521.922.122.922.723.925.525.726.327.127.727.828.3
201020112012201320142015201620172018201920202021
1,7281,9262,0642,1562,2112,4372,4852,6662,7902,9263,0203,072
9.44%11.46%7.17%4.46%2.55%
10.22%1.97%7.28%4.65%4.87%3.21%1.72%
103,194111,276119,307127,075135,045141,828147,843157,488163,173166,278170,335165,857
8.35%7.83%7.22%6.51%6.27%5.02%4.24%6.52%3.61%1.90%2.44%-2.63%
59.757.857.858.961.158.259.559.158.556.856.454.0
48,60553,28857,18761,64467,52469,97574,58180,35884,46885,78388,15687,484
28.127.727.728.630.528.730.030.130.329.329.228.5
Provisional statistical bulletin Page 8
/
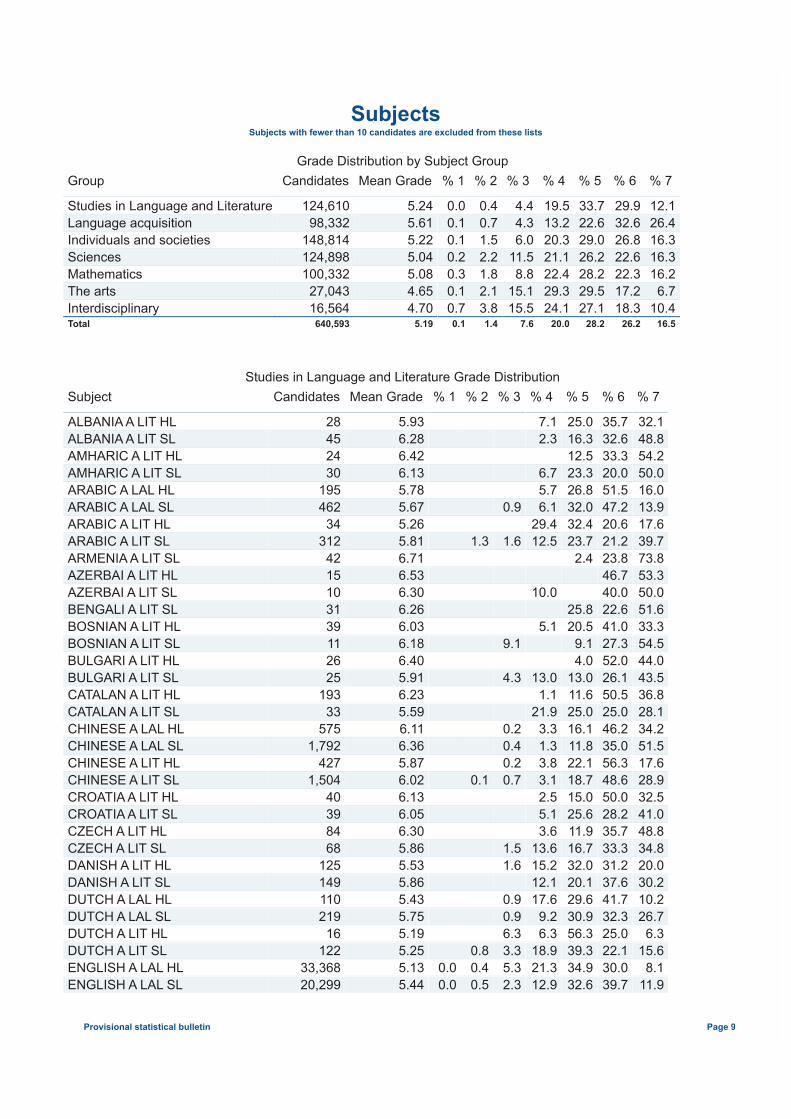
SubjectsSubjects with fewer than 10 candidates are excluded from these lists
Studies in Language and Literature Grade DistributionSubject Candidates Mean Grade % 1 % 2 % 3 % 4 % 5 % 6 % 7
ALBANIA A LIT HLALBANIA A LIT SLAMHARIC A LIT HLAMHARIC A LIT SLARABIC A LAL HLARABIC A LAL SLARABIC A LIT HLARABIC A LIT SLARMENIA A LIT SLAZERBAI A LIT HLAZERBAI A LIT SLBENGALI A LIT SLBOSNIAN A LIT HLBOSNIAN A LIT SLBULGARI A LIT HLBULGARI A LIT SLCATALAN A LIT HLCATALAN A LIT SLCHINESE A LAL HLCHINESE A LAL SL
28452430
195462
34312
4215103139112625
19333
5751,792
5.936.286.426.135.785.675.265.816.716.536.306.266.036.186.405.916.235.596.116.36
1.3
0.9
1.6
9.1
4.3
0.20.4
7.12.3
6.75.76.1
29.412.5
10.0
5.1
13.01.1
21.93.31.3
25.016.312.523.326.832.032.423.7
2.4
25.820.5
9.14.0
13.011.625.016.111.8
35.732.633.320.051.547.220.621.223.846.740.022.641.027.352.026.150.525.046.235.0
32.148.854.250.016.013.917.639.773.853.350.051.633.354.544.043.536.828.134.251.5
CHINESE A LIT HLCHINESE A LIT SLCROATIA A LIT HLCROATIA A LIT SLCZECH A LIT HLCZECH A LIT SLDANISH A LIT HLDANISH A LIT SLDUTCH A LAL HLDUTCH A LAL SLDUTCH A LIT HLDUTCH A LIT SLENGLISH A LAL HLENGLISH A LAL SL
4271,504
40398468
125149110219
16122
33,36820,299
5.876.026.136.056.305.865.535.865.435.755.195.255.135.44
0.00.0
0.1
0.80.40.5
0.20.7
1.51.6
0.90.96.33.35.32.3
3.83.12.55.13.6
13.615.212.117.6
9.26.3
18.921.312.9
22.118.715.025.611.916.732.020.129.630.956.339.334.932.6
56.348.650.028.235.733.331.237.641.732.325.022.130.039.7
17.628.932.541.048.834.820.030.210.226.7
6.315.6
8.111.9
Grade Distribution by Subject GroupGroup Candidates Mean Grade % 1 % 2 % 3 % 4 % 5 % 6 % 7
Studies in Language and LiteratureLanguage acquisitionIndividuals and societiesSciencesMathematicsThe artsInterdisciplinary
124,61098,332
148,814124,898100,332
27,04316,564
5.245.615.225.045.084.654.70
0.00.10.10.20.30.10.7
0.40.71.52.21.82.13.8
4.44.36.0
11.58.8
15.115.5
19.513.220.321.122.429.324.1
33.722.629.026.228.229.527.1
29.932.626.822.622.317.218.3
12.126.416.316.316.2
6.710.4
Total 640,593 5.19 0.1 1.4 7.6 20.0 28.2 26.2 16.5
Provisional statistical bulletin Page 9
/
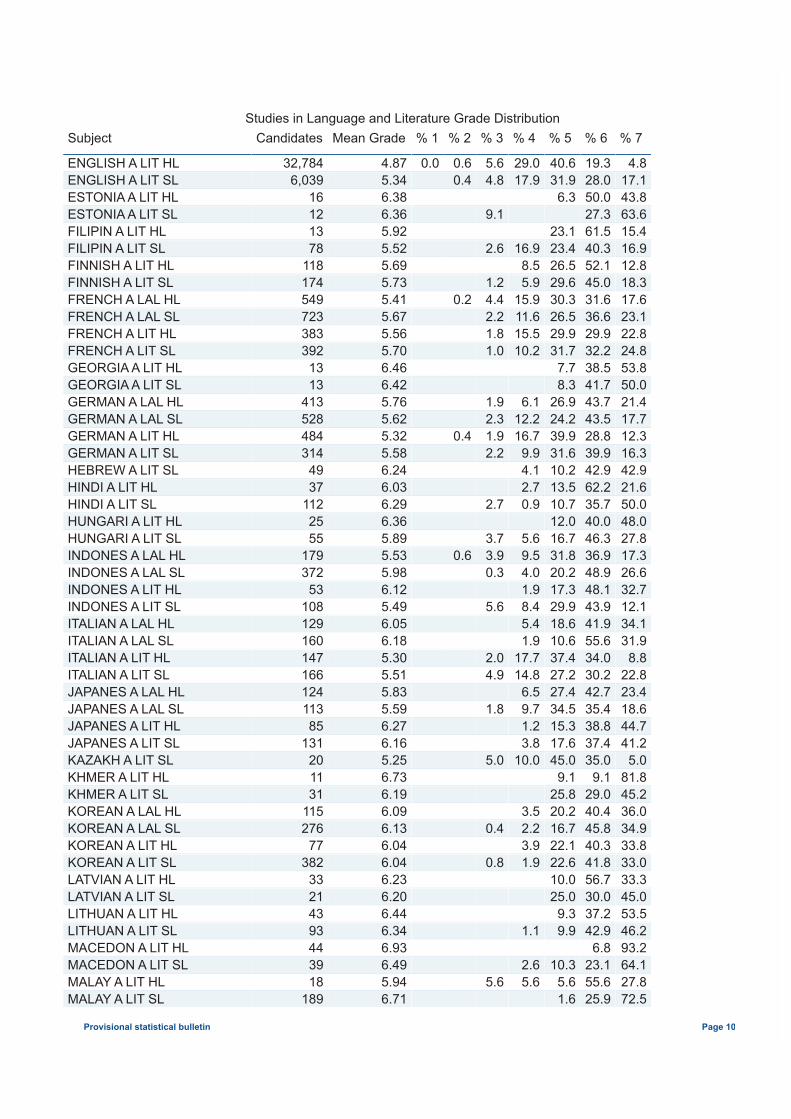
Studies in Language and Literature Grade DistributionSubject Candidates Mean Grade % 1 % 2 % 3 % 4 % 5 % 6 % 7
ENGLISH A LIT HLENGLISH A LIT SLESTONIA A LIT HLESTONIA A LIT SLFILIPIN A LIT HLFILIPIN A LIT SLFINNISH A LIT HLFINNISH A LIT SLFRENCH A LAL HLFRENCH A LAL SLFRENCH A LIT HLFRENCH A LIT SLGEORGIA A LIT HLGEORGIA A LIT SLGERMAN A LAL HLGERMAN A LAL SLGERMAN A LIT HLGERMAN A LIT SLHEBREW A LIT SLHINDI A LIT HL
32,7846,039
16121378
118174549723383392
1313
413528484314
4937
4.875.346.386.365.925.525.695.735.415.675.565.706.466.425.765.625.325.586.246.03
0.0
0.60.4
0.2
0.4
5.64.8
9.1
2.6
1.24.42.21.81.0
1.92.31.92.2
29.017.9
16.98.55.9
15.911.615.510.2
6.112.216.7
9.94.12.7
40.631.9
6.3
23.123.426.529.630.326.529.931.7
7.78.3
26.924.239.931.610.213.5
19.328.050.027.361.540.352.145.031.636.629.932.238.541.743.743.528.839.942.962.2
4.817.143.863.615.416.912.818.317.623.122.824.853.850.021.417.712.316.342.921.6
HINDI A LIT SLHUNGARI A LIT HLHUNGARI A LIT SLINDONES A LAL HLINDONES A LAL SLINDONES A LIT HLINDONES A LIT SLITALIAN A LAL HLITALIAN A LAL SLITALIAN A LIT HLITALIAN A LIT SLJAPANES A LAL HLJAPANES A LAL SLJAPANES A LIT HLJAPANES A LIT SLKAZAKH A LIT SLKHMER A LIT HLKHMER A LIT SLKOREAN A LAL HLKOREAN A LAL SL
1122555
179372
5310812916014716612411385
131201131
115276
6.296.365.895.535.986.125.496.056.185.305.515.835.596.276.165.256.736.196.096.13
0.6
2.7
3.73.90.3
5.6
2.04.9
1.8
5.0
0.4
0.9
5.69.54.01.98.45.41.9
17.714.8
6.59.71.23.8
10.0
3.52.2
10.712.016.731.820.217.329.918.610.637.427.227.434.515.317.645.0
9.125.820.216.7
35.740.046.336.948.948.143.941.955.634.030.242.735.438.837.435.0
9.129.040.445.8
50.048.027.817.326.632.712.134.131.9
8.822.823.418.644.741.2
5.081.845.236.034.9
KOREAN A LIT HLKOREAN A LIT SLLATVIAN A LIT HLLATVIAN A LIT SLLITHUAN A LIT HLLITHUAN A LIT SLMACEDON A LIT HLMACEDON A LIT SLMALAY A LIT HLMALAY A LIT SL
77382
33214393443918
189
6.046.046.236.206.446.346.936.495.946.71
0.8
5.6
3.91.9
1.1
2.65.6
22.122.610.025.0
9.39.9
10.3
5.61.6
40.341.856.730.037.242.9
6.823.155.625.9
33.833.033.345.053.546.293.264.127.872.5
Provisional statistical bulletin Page 10
/
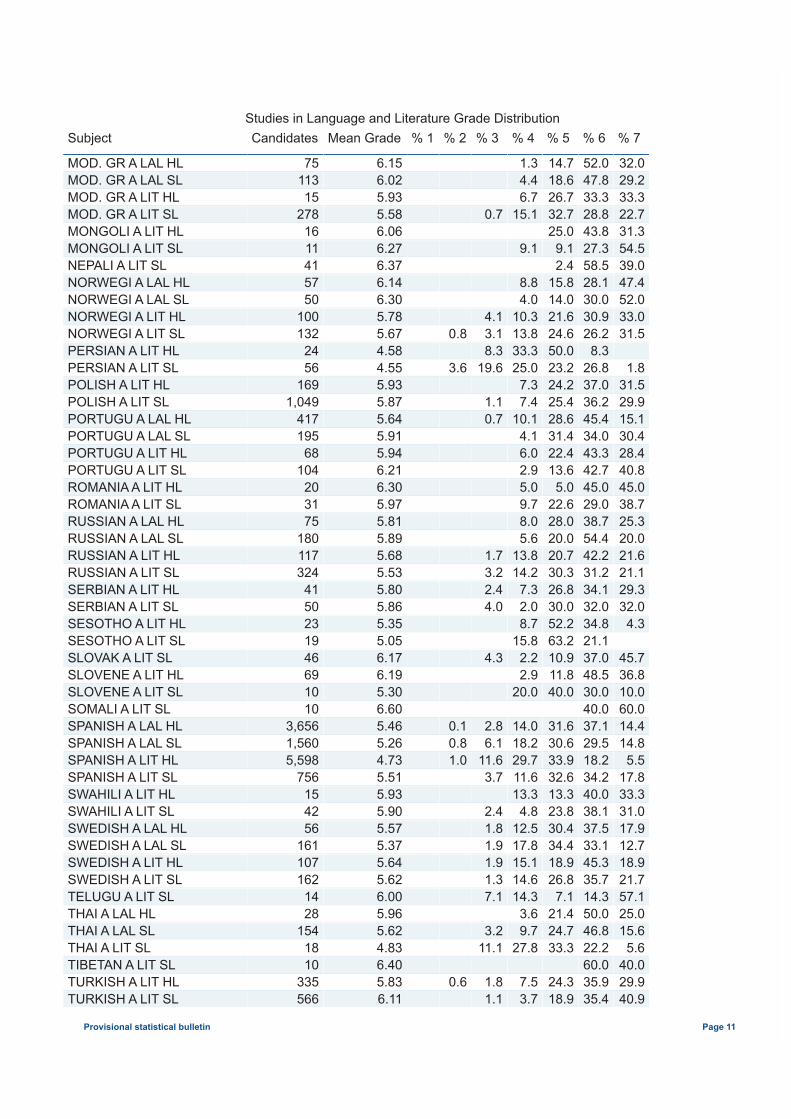
Studies in Language and Literature Grade DistributionSubject Candidates Mean Grade % 1 % 2 % 3 % 4 % 5 % 6 % 7
MOD. GR A LAL HLMOD. GR A LAL SLMOD. GR A LIT HLMOD. GR A LIT SLMONGOLI A LIT HLMONGOLI A LIT SLNEPALI A LIT SLNORWEGI A LAL HLNORWEGI A LAL SLNORWEGI A LIT HLNORWEGI A LIT SLPERSIAN A LIT HLPERSIAN A LIT SLPOLISH A LIT HLPOLISH A LIT SLPORTUGU A LAL HLPORTUGU A LAL SLPORTUGU A LIT HLPORTUGU A LIT SLROMANIA A LIT HL
7511315
2781611415750
100132
2456
1691,049
417195
68104
20
6.156.025.935.586.066.276.376.146.305.785.674.584.555.935.875.645.915.946.216.30
0.8
3.6
0.7
4.13.18.3
19.6
1.10.7
1.34.46.7
15.1
9.1
8.84.0
10.313.833.325.0
7.37.4
10.14.16.02.95.0
14.718.626.732.725.0
9.12.4
15.814.021.624.650.023.224.225.428.631.422.413.6
5.0
52.047.833.328.843.827.358.528.130.030.926.2
8.326.837.036.245.434.043.342.745.0
32.029.233.322.731.354.539.047.452.033.031.5
1.8
31.529.915.130.428.440.845.0
ROMANIA A LIT SLRUSSIAN A LAL HLRUSSIAN A LAL SLRUSSIAN A LIT HLRUSSIAN A LIT SLSERBIAN A LIT HLSERBIAN A LIT SLSESOTHO A LIT HLSESOTHO A LIT SLSLOVAK A LIT SLSLOVENE A LIT HLSLOVENE A LIT SLSOMALI A LIT SLSPANISH A LAL HLSPANISH A LAL SLSPANISH A LIT HLSPANISH A LIT SLSWAHILI A LIT HLSWAHILI A LIT SLSWEDISH A LAL HL
3175
180117324
4150231946691010
3,6561,5605,598
756154256
5.975.815.895.685.535.805.865.355.056.176.195.306.605.465.264.735.515.935.905.57
0.10.81.0
1.73.22.44.0
4.3
2.86.1
11.63.7
2.41.8
9.78.05.6
13.814.2
7.32.08.7
15.82.22.9
20.0
14.018.229.711.613.3
4.812.5
22.628.020.020.730.326.830.052.263.210.911.840.0
31.630.633.932.613.323.830.4
29.038.754.442.231.234.132.034.821.137.048.530.040.037.129.518.234.240.038.137.5
38.725.320.021.621.129.332.0
4.3
45.736.810.060.014.414.8
5.517.833.331.017.9
SWEDISH A LAL SLSWEDISH A LIT HLSWEDISH A LIT SLTELUGU A LIT SLTHAI A LAL HLTHAI A LAL SLTHAI A LIT SLTIBETAN A LIT SLTURKISH A LIT HLTURKISH A LIT SL
161107162
1428
1541810
335566
5.375.645.626.005.965.624.836.405.836.11
0.6
1.91.91.37.1
3.2
11.1
1.81.1
17.815.114.614.3
3.69.7
27.8
7.53.7
34.418.926.8
7.121.424.733.3
24.318.9
33.145.335.714.350.046.822.260.035.935.4
12.718.921.757.125.015.6
5.640.029.940.9
Provisional statistical bulletin Page 11
/
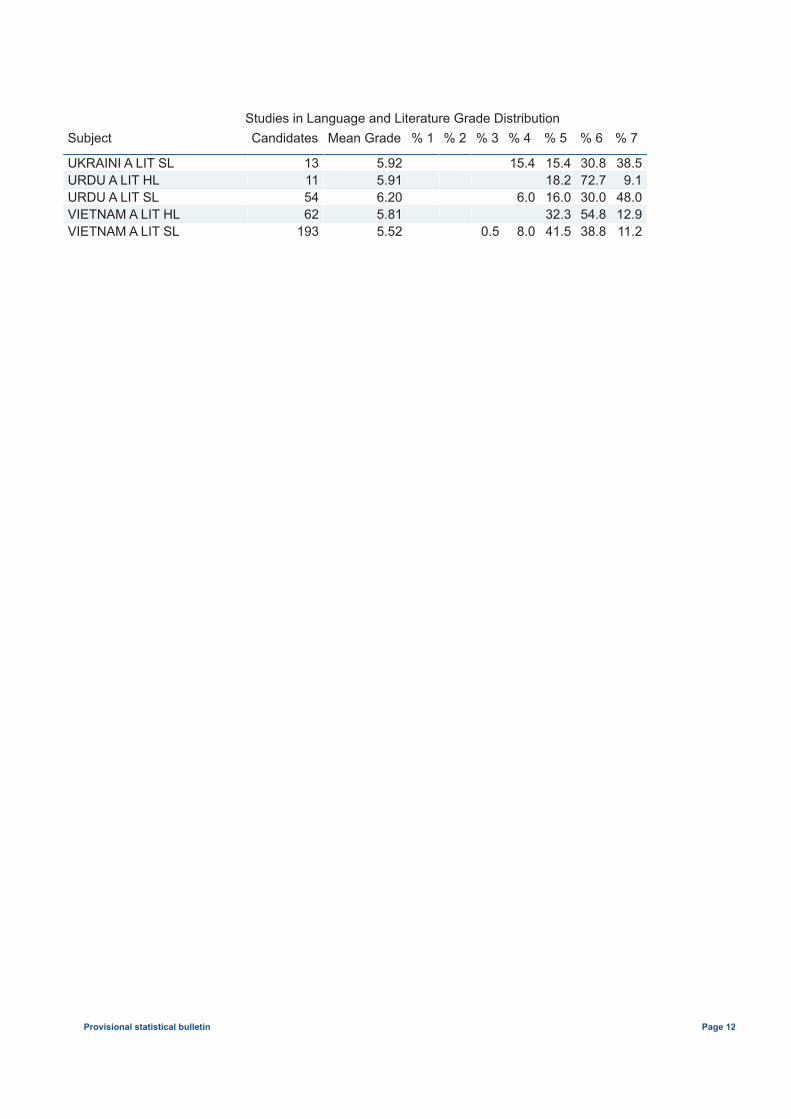
Studies in Language and Literature Grade DistributionSubject Candidates Mean Grade % 1 % 2 % 3 % 4 % 5 % 6 % 7
UKRAINI A LIT SLURDU A LIT HLURDU A LIT SLVIETNAM A LIT HLVIETNAM A LIT SL
13115462
193
5.925.916.205.815.52
0.5
15.4
6.0
8.0
15.418.216.032.341.5
30.872.730.054.838.8
38.59.1
48.012.911.2
Provisional statistical bulletin Page 12
/
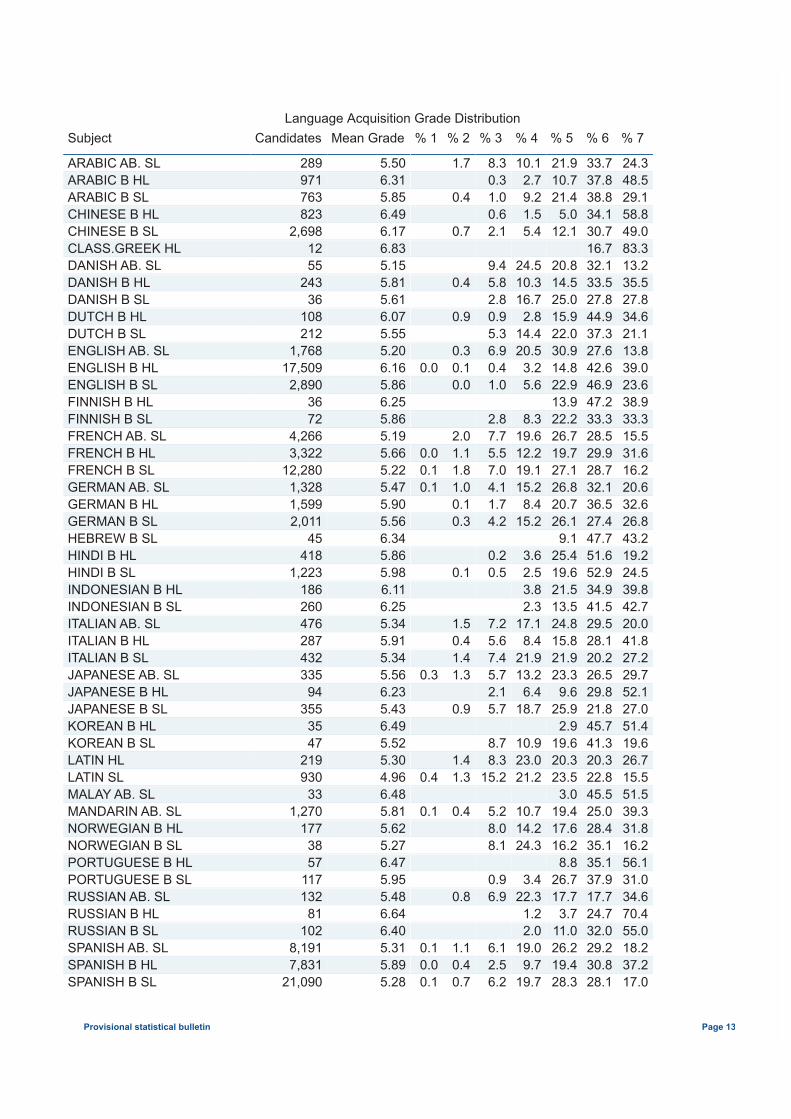
Language Acquisition Grade DistributionSubject Candidates Mean Grade % 1 % 2 % 3 % 4 % 5 % 6 % 7
ARABIC AB. SLARABIC B HLARABIC B SLCHINESE B HLCHINESE B SLCLASS.GREEK HLDANISH AB. SLDANISH B HLDANISH B SLDUTCH B HLDUTCH B SLENGLISH AB. SLENGLISH B HLENGLISH B SLFINNISH B HLFINNISH B SLFRENCH AB. SLFRENCH B HLFRENCH B SLGERMAN AB. SL
289971763823
2,6981255
24336
108212
1,76817,509
2,8903672
4,2663,322
12,2801,328
5.506.315.856.496.176.835.155.815.616.075.555.206.165.866.255.865.195.665.225.47
0.0
0.00.10.1
1.7
0.4
0.7
0.4
0.9
0.30.10.0
2.01.11.81.0
8.30.31.00.62.1
9.45.82.80.95.36.90.41.0
2.87.75.57.04.1
10.12.79.21.55.4
24.510.316.7
2.814.420.5
3.25.6
8.3
19.612.219.115.2
21.910.721.4
5.012.1
20.814.525.015.922.030.914.822.913.922.226.719.727.126.8
33.737.838.834.130.716.732.133.527.844.937.327.642.646.947.233.328.529.928.732.1
24.348.529.158.849.083.313.235.527.834.621.113.839.023.638.933.315.531.616.220.6
GERMAN B HLGERMAN B SLHEBREW B SLHINDI B HLHINDI B SLINDONESIAN B HLINDONESIAN B SLITALIAN AB. SLITALIAN B HLITALIAN B SLJAPANESE AB. SLJAPANESE B HLJAPANESE B SLKOREAN B HLKOREAN B SLLATIN HLLATIN SLMALAY AB. SLMANDARIN AB. SLNORWEGIAN B HL
1,5992,011
45418
1,223186260476287432335
94355
3547
219930
331,270
177
5.905.566.345.865.986.116.255.345.915.345.566.235.436.495.525.304.966.485.815.62
0.3
0.4
0.1
0.10.3
0.1
1.50.41.41.3
0.9
1.41.3
0.4
1.74.2
0.20.5
7.25.67.45.72.15.7
8.78.3
15.2
5.28.0
8.415.2
3.62.53.82.3
17.18.4
21.913.2
6.418.7
10.923.021.2
10.714.2
20.726.1
9.125.419.621.513.524.815.821.923.3
9.625.9
2.919.620.323.5
3.019.417.6
36.527.447.751.652.934.941.529.528.120.226.529.821.845.741.320.322.845.525.028.4
32.626.843.219.224.539.842.720.041.827.229.752.127.051.419.626.715.551.539.331.8
NORWEGIAN B SLPORTUGUESE B HLPORTUGUESE B SLRUSSIAN AB. SLRUSSIAN B HLRUSSIAN B SLSPANISH AB. SLSPANISH B HLSPANISH B SL
3857
117132
81102
8,1917,831
21,090
5.276.475.955.486.646.405.315.895.28
0.10.00.1
0.8
1.10.40.7
8.1
0.96.9
6.12.56.2
24.3
3.422.3
1.22.0
19.09.7
19.7
16.28.8
26.717.7
3.711.026.219.428.3
35.135.137.917.724.732.029.230.828.1
16.256.131.034.670.455.018.237.217.0
Provisional statistical bulletin Page 13
/
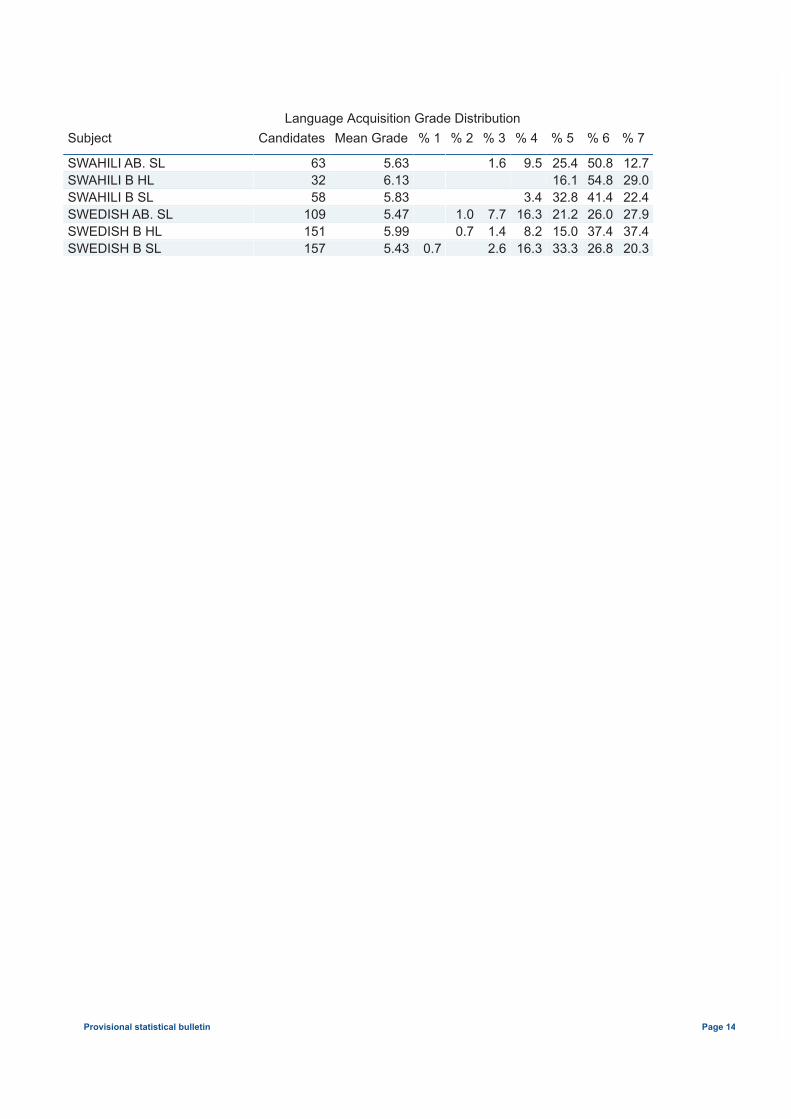
Language Acquisition Grade DistributionSubject Candidates Mean Grade % 1 % 2 % 3 % 4 % 5 % 6 % 7
SWAHILI AB. SLSWAHILI B HLSWAHILI B SLSWEDISH AB. SLSWEDISH B HLSWEDISH B SL
633258
109151157
5.636.135.835.475.995.43
0.7
1.00.7
1.6
7.71.42.6
9.5
3.416.3
8.216.3
25.416.132.821.215.033.3
50.854.841.426.037.426.8
12.729.022.427.937.420.3
Provisional statistical bulletin Page 14
/
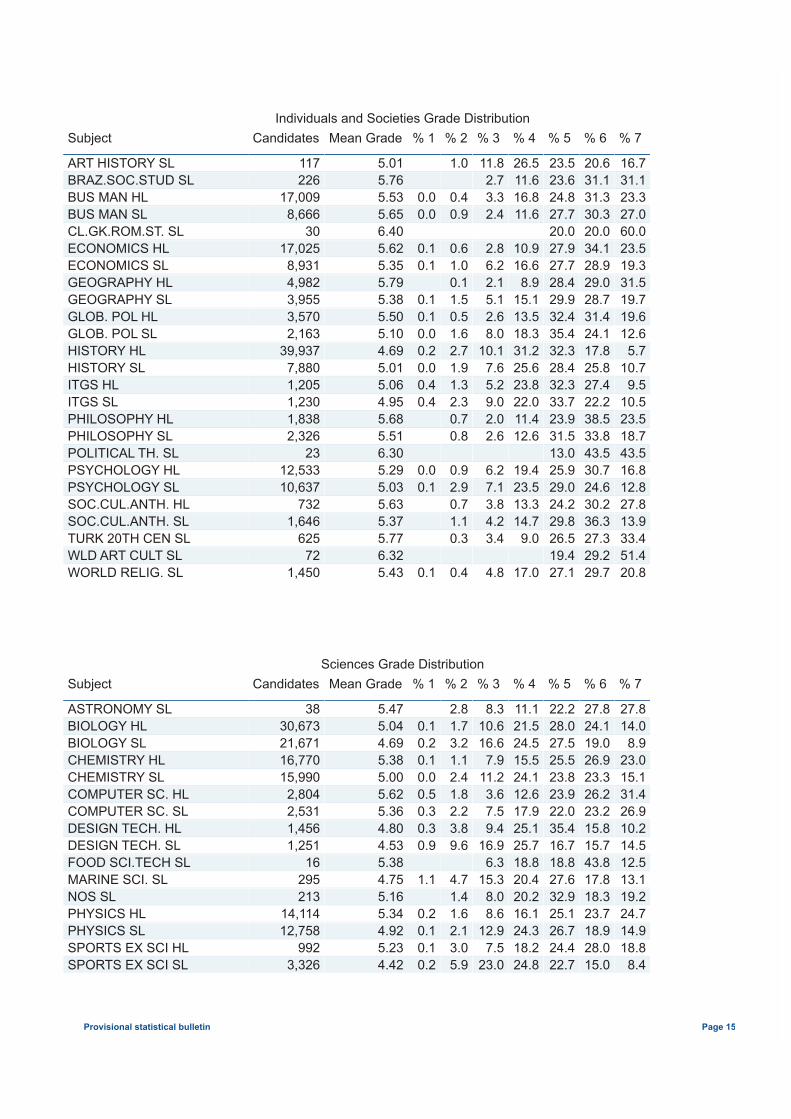
Individuals and Societies Grade DistributionSubject Candidates Mean Grade % 1 % 2 % 3 % 4 % 5 % 6 % 7
ART HISTORY SLBRAZ.SOC.STUD SLBUS MAN HLBUS MAN SLCL.GK.ROM.ST. SLECONOMICS HLECONOMICS SLGEOGRAPHY HLGEOGRAPHY SLGLOB. POL HLGLOB. POL SLHISTORY HLHISTORY SLITGS HLITGS SLPHILOSOPHY HLPHILOSOPHY SLPOLITICAL TH. SLPSYCHOLOGY HLPSYCHOLOGY SL
117226
17,0098,666
3017,025
8,9314,9823,9553,5702,163
39,9377,8801,2051,2301,8382,326
2312,53310,637
5.015.765.535.656.405.625.355.795.385.505.104.695.015.064.955.685.516.305.295.03
0.00.0
0.10.1
0.10.10.00.20.00.40.4
0.00.1
1.0
0.40.9
0.61.00.11.50.51.62.71.91.32.30.70.8
0.92.9
11.82.73.32.4
2.86.22.15.12.68.0
10.17.65.29.02.02.6
6.27.1
26.511.616.811.6
10.916.6
8.915.113.518.331.225.623.822.011.412.6
19.423.5
23.523.624.827.720.027.927.728.429.932.435.432.328.432.333.723.931.513.025.929.0
20.631.131.330.320.034.128.929.028.731.424.117.825.827.422.238.533.843.530.724.6
16.731.123.327.060.023.519.331.519.719.612.6
5.710.7
9.510.523.518.743.516.812.8
SOC.CUL.ANTH. HLSOC.CUL.ANTH. SLTURK 20TH CEN SLWLD ART CULT SLWORLD RELIG. SL
7321,646
62572
1,450
5.635.375.776.325.43
0.1
0.71.10.3
0.4
3.84.23.4
4.8
13.314.7
9.0
17.0
24.229.826.519.427.1
30.236.327.329.229.7
27.813.933.451.420.8
Sciences Grade DistributionSubject Candidates Mean Grade % 1 % 2 % 3 % 4 % 5 % 6 % 7
ASTRONOMY SLBIOLOGY HLBIOLOGY SLCHEMISTRY HLCHEMISTRY SLCOMPUTER SC. HLCOMPUTER SC. SLDESIGN TECH. HLDESIGN TECH. SLFOOD SCI.TECH SLMARINE SCI. SLNOS SLPHYSICS HLPHYSICS SLSPORTS EX SCI HLSPORTS EX SCI SL
3830,67321,67116,77015,990
2,8042,5311,4561,251
16295213
14,11412,758
9923,326
5.475.044.695.385.005.625.364.804.535.384.755.165.344.925.234.42
0.10.20.10.00.50.30.30.9
1.1
0.20.10.10.2
2.81.73.21.12.41.82.23.89.6
4.71.41.62.13.05.9
8.310.616.6
7.911.23.67.59.4
16.96.3
15.38.08.6
12.97.5
23.0
11.121.524.515.524.112.617.925.125.718.820.420.216.124.318.224.8
22.228.027.525.523.823.922.035.416.718.827.632.925.126.724.422.7
27.824.119.026.923.326.223.215.815.743.817.818.323.718.928.015.0
27.814.0
8.923.015.131.426.910.214.512.513.119.224.714.918.8
8.4
Provisional statistical bulletin Page 15
/
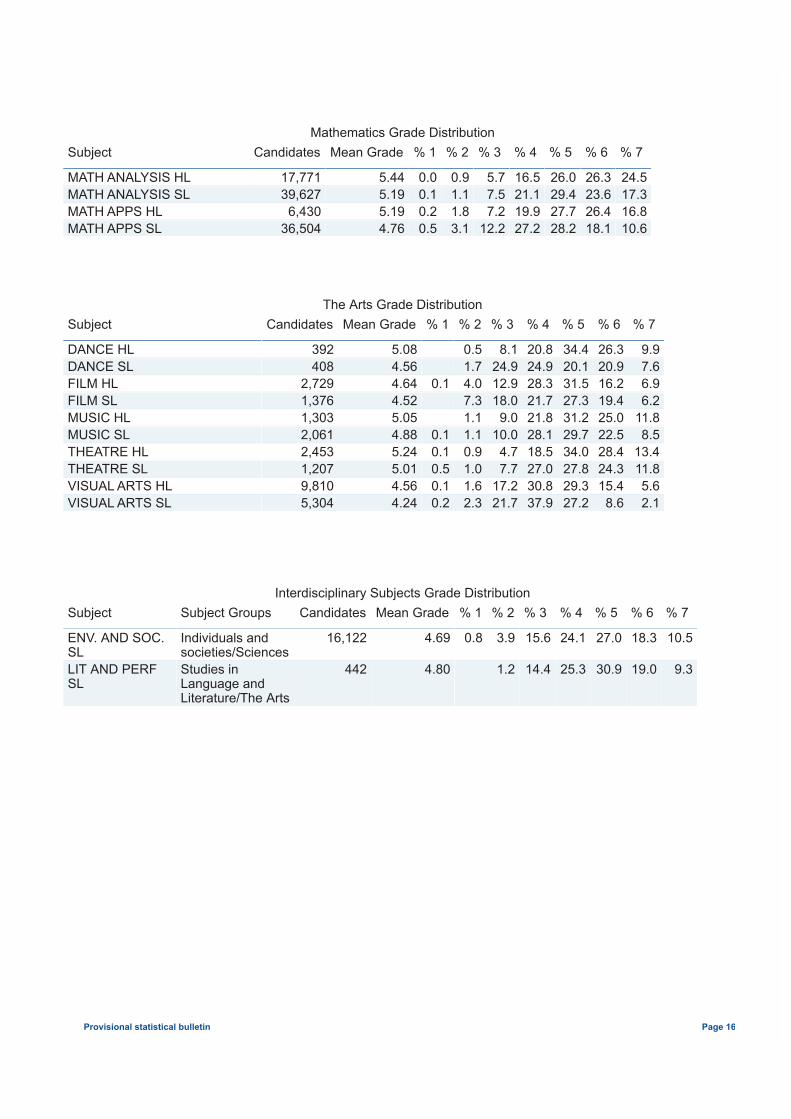
Mathematics Grade DistributionSubject Candidates Mean Grade % 1 % 2 % 3 % 4 % 5 % 6 % 7
MATH ANALYSIS HLMATH ANALYSIS SLMATH APPS HLMATH APPS SL
17,77139,627
6,43036,504
5.445.195.194.76
0.00.10.20.5
0.91.11.83.1
5.77.57.2
12.2
16.521.119.927.2
26.029.427.728.2
26.323.626.418.1
24.517.316.810.6
The Arts Grade DistributionSubject Candidates Mean Grade % 1 % 2 % 3 % 4 % 5 % 6 % 7
DANCE HLDANCE SLFILM HLFILM SLMUSIC HLMUSIC SLTHEATRE HLTHEATRE SLVISUAL ARTS HLVISUAL ARTS SL
392408
2,7291,3761,3032,0612,4531,2079,8105,304
5.084.564.644.525.054.885.245.014.564.24
0.1
0.10.10.50.10.2
0.51.74.07.31.11.10.91.01.62.3
8.124.912.918.0
9.010.0
4.77.7
17.221.7
20.824.928.321.721.828.118.527.030.837.9
34.420.131.527.331.229.734.027.829.327.2
26.320.916.219.425.022.528.424.315.4
8.6
9.97.66.96.2
11.88.5
13.411.85.62.1
Interdisciplinary Subjects Grade DistributionSubject Subject Groups Candidates Mean Grade % 1 % 2 % 3 % 4 % 5 % 6 % 7
ENV. AND SOC.SLLIT AND PERFSL
Individuals andsocieties/SciencesStudies inLanguage andLiterature/The Arts
16,122
442
4.69
4.80
0.8
3.9
1.2
15.6
14.4
24.1
25.3
27.0
30.9
18.3
19.0
10.5
9.3
Provisional statistical bulletin Page 16
/
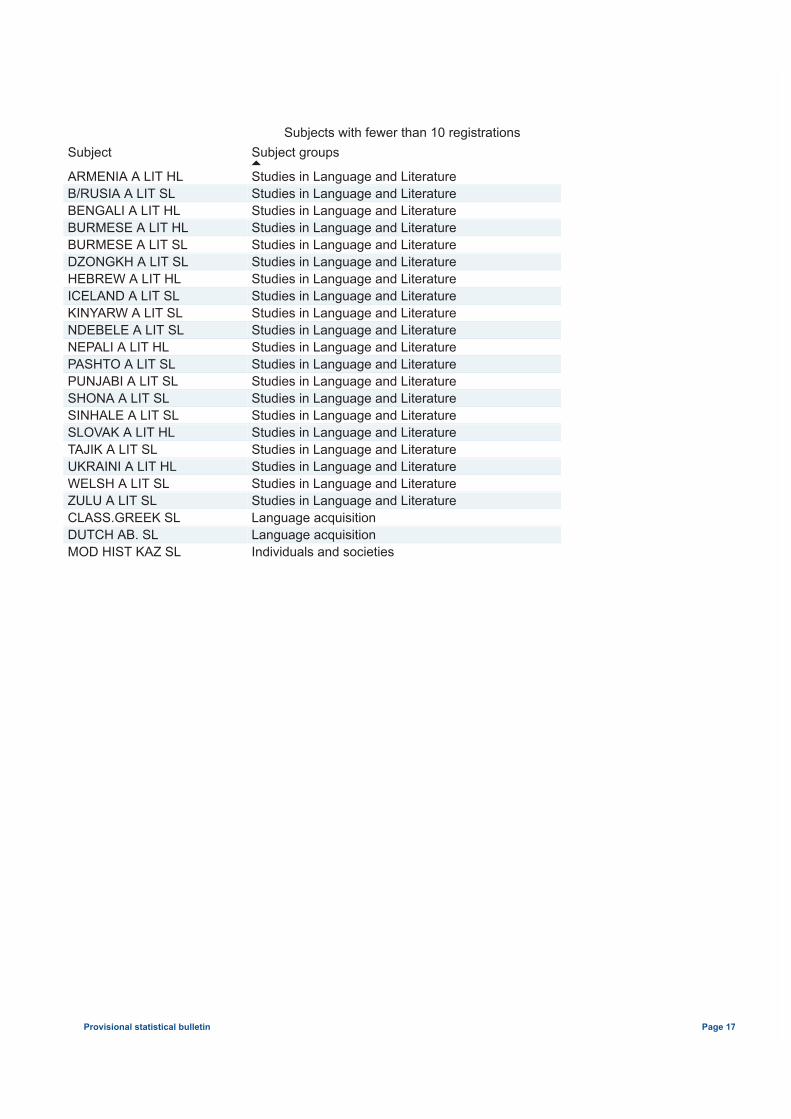
Subjects with fewer than 10 registrationsSubject Subject groups
ARMENIA A LIT HLB/RUSIA A LIT SLBENGALI A LIT HLBURMESE A LIT HLBURMESE A LIT SLDZONGKH A LIT SLHEBREW A LIT HLICELAND A LIT SLKINYARW A LIT SLNDEBELE A LIT SLNEPALI A LIT HLPASHTO A LIT SLPUNJABI A LIT SLSHONA A LIT SLSINHALE A LIT SLSLOVAK A LIT HLTAJIK A LIT SLUKRAINI A LIT HLWELSH A LIT SLZULU A LIT SL
Studies in Language and LiteratureStudies in Language and LiteratureStudies in Language and LiteratureStudies in Language and LiteratureStudies in Language and LiteratureStudies in Language and LiteratureStudies in Language and LiteratureStudies in Language and LiteratureStudies in Language and LiteratureStudies in Language and LiteratureStudies in Language and LiteratureStudies in Language and LiteratureStudies in Language and LiteratureStudies in Language and LiteratureStudies in Language and LiteratureStudies in Language and LiteratureStudies in Language and LiteratureStudies in Language and LiteratureStudies in Language and LiteratureStudies in Language and Literature
CLASS.GREEK SLDUTCH AB. SLMOD HIST KAZ SL
Language acquisitionLanguage acquisitionIndividuals and societies
Provisional statistical bulletin Page 17
/
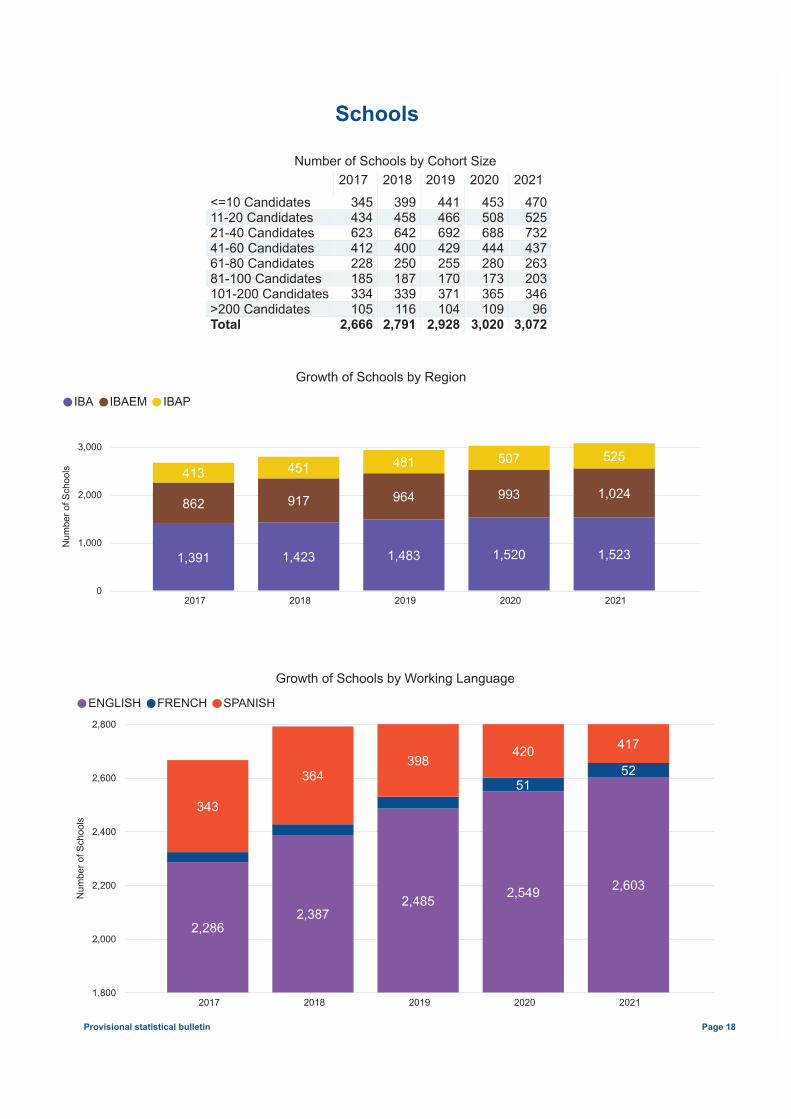
Growth of Schools by Region
0
1,000
2,000
3,000
Num
ber o
f Sch
ools
2017 2018 2019 2020 2021
1,391 1,423 1,483 1,520 1,523
862 917 964 993 1,024413 451 481 507 525
IBA IBAEM IBAP
Number of Schools by Cohort Size 2017
2018
2019
2020
2021
<=10 Candidates11-20 Candidates21-40 Candidates41-60 Candidates61-80 Candidates81-100 Candidates101-200 Candidates>200 Candidates
345434623412228185334105
399458642400250187339116
441466692429255170371104
453508688444280173365109
470525732437263203346
96Total 2,666 2,791 2,928 3,020 3,072
Growth of Schools by Working Language
1,800
2,000
2,200
2,400
2,600
2,800
Num
ber o
f Sch
ools
2017 2018 2019 2020 2021
2,2862,387
2,485 2,549 2,603
5152
343
364398
420 417
ENGLISH FRENCH SPANISH
Schools
Provisional statistical bulletin Page 18
/
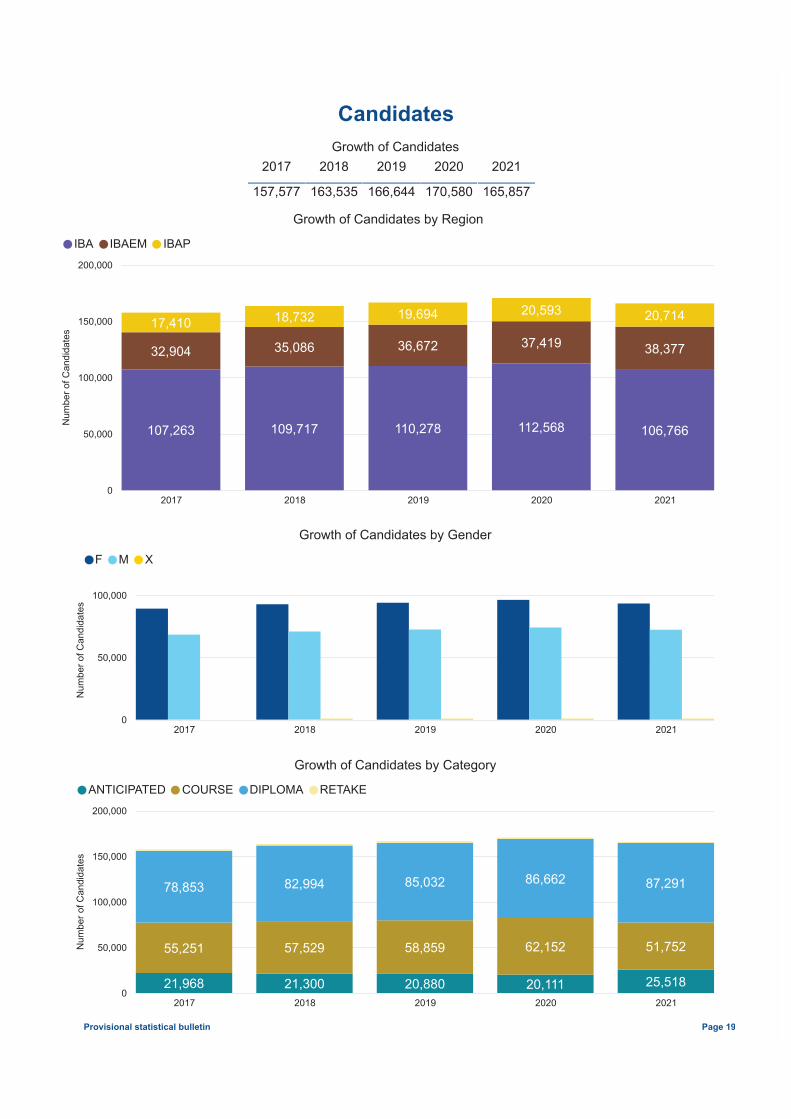
Growth of Candidates by Region
0
50,000
100,000
150,000
200,000
Num
ber o
f Can
dida
tes
2017 2018 2019 2020 2021
107,263 106,766112,568110,278109,717
32,904 38,37736,67235,086 37,41917,410 20,71419,69418,732 20,593
IBA IBAEM IBAP
Growth of Candidates by Category
0
50,000
100,000
150,000
200,000
Num
ber o
f Can
dida
tes
2017 2018 2019 2020 2021
21,968 25,51820,11120,88021,300
55,251 51,75262,15258,85957,529
78,853 87,29185,03282,994 86,662
ANTICIPATED COURSE DIPLOMA RETAKE
Growth of Candidates by Gender
0
50,000
100,000
Num
ber o
f Can
dida
tes
2017 2018 2019 2020 2021
F M X
Growth of Candidates
2017
2018
2019
2020
2021
157,577 163,535 166,644 170,580 165,857
Candidates
Provisional statistical bulletin Page 19
/
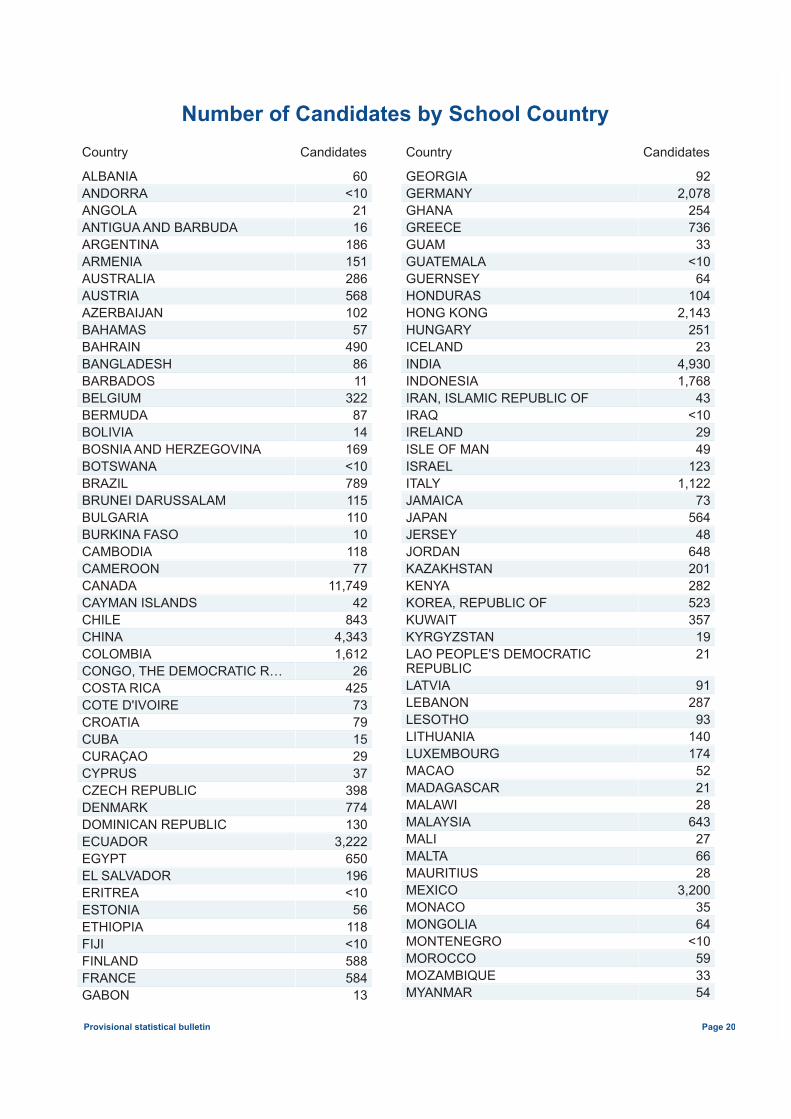
Number of Candidates by School CountryCountry Candidates
ALBANIAANDORRAANGOLAANTIGUA AND BARBUDAARGENTINAARMENIAAUSTRALIAAUSTRIAAZERBAIJANBAHAMASBAHRAINBANGLADESHBARBADOSBELGIUMBERMUDABOLIVIABOSNIA AND HERZEGOVINABOTSWANABRAZILBRUNEI DARUSSALAM
60<10
2116
186151286568102
57490
8611
3228714
169<10789115
BULGARIABURKINA FASOCAMBODIACAMEROONCANADACAYMAN ISLANDSCHILECHINACOLOMBIACONGO, THE DEMOCRATIC R…COSTA RICACOTE D'IVOIRECROATIACUBACURAÇAOCYPRUSCZECH REPUBLICDENMARKDOMINICAN REPUBLICECUADOR
11010
11877
11,74942
8434,3431,612
26425
7379152937
398774130
3,222EGYPTEL SALVADORERITREAESTONIAETHIOPIAFIJIFINLANDFRANCEGABON
650196<10
56118<10588584
13
Country Candidates
GEORGIAGERMANYGHANAGREECEGUAMGUATEMALAGUERNSEYHONDURASHONG KONGHUNGARYICELANDINDIAINDONESIAIRAN, ISLAMIC REPUBLIC OFIRAQIRELANDISLE OF MANISRAELITALYJAMAICA
922,078
254736
33<10
64104
2,143251
234,9301,768
43<10
2949
1231,122
73JAPANJERSEYJORDANKAZAKHSTANKENYAKOREA, REPUBLIC OFKUWAITKYRGYZSTANLAO PEOPLE'S DEMOCRATICREPUBLICLATVIALEBANONLESOTHOLITHUANIALUXEMBOURGMACAOMADAGASCARMALAWIMALAYSIAMALIMALTA
56448
648201282523357
1921
91287
93140174
522128
6432766
MAURITIUSMEXICOMONACOMONGOLIAMONTENEGROMOROCCOMOZAMBIQUEMYANMAR
283,200
3564
<10593354
Provisional statistical bulletin Page 20
/
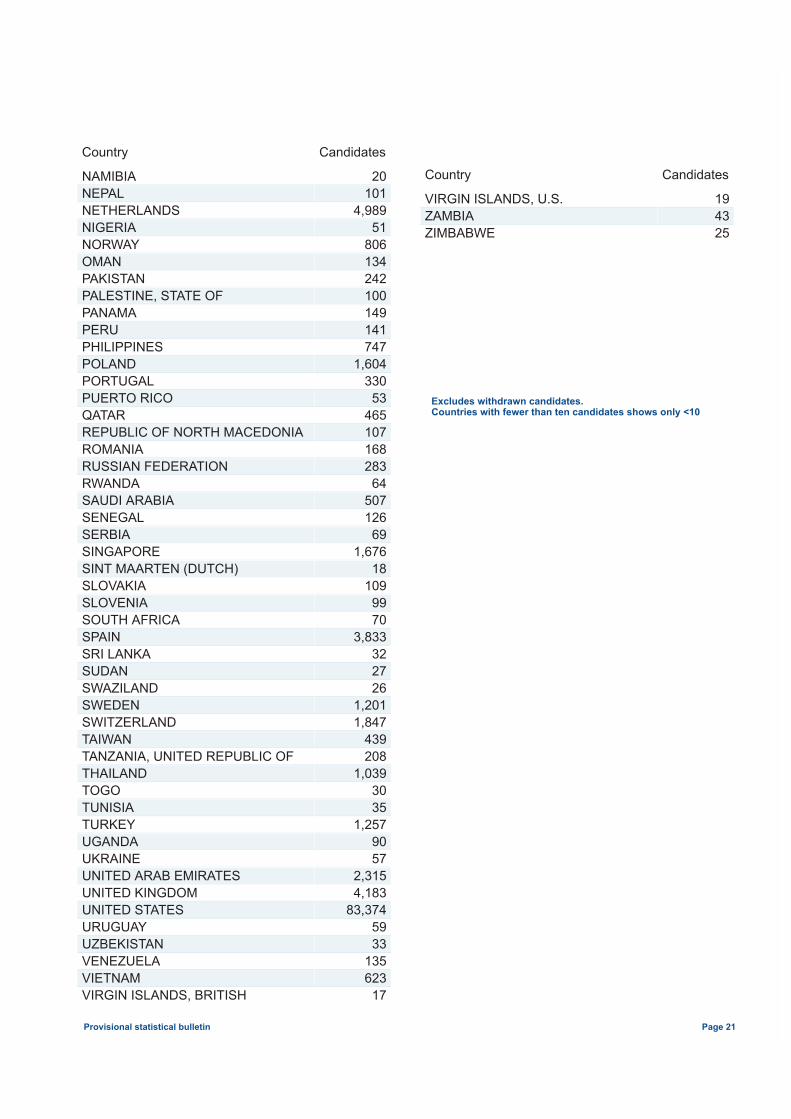
Excludes withdrawn candidates.Countries with fewer than ten candidates shows only <10
Country Candidates
NAMIBIANEPALNETHERLANDSNIGERIANORWAYOMANPAKISTANPALESTINE, STATE OFPANAMAPERUPHILIPPINESPOLANDPORTUGALPUERTO RICOQATARREPUBLIC OF NORTH MACEDONIAROMANIARUSSIAN FEDERATIONRWANDASAUDI ARABIA
20101
4,98951
806134242100149141747
1,604330
53465107168283
64507
SENEGALSERBIASINGAPORESINT MAARTEN (DUTCH)SLOVAKIASLOVENIASOUTH AFRICASPAINSRI LANKASUDANSWAZILANDSWEDENSWITZERLANDTAIWANTANZANIA, UNITED REPUBLIC OFTHAILANDTOGOTUNISIATURKEYUGANDA
12669
1,67618
1099970
3,833322726
1,2011,847
439208
1,0393035
1,25790
UKRAINEUNITED ARAB EMIRATESUNITED KINGDOMUNITED STATESURUGUAYUZBEKISTANVENEZUELAVIETNAMVIRGIN ISLANDS, BRITISH
572,3154,183
83,3745933
135623
17
Provisional statistical bulletin Page 21
Country Candidates
VIRGIN ISLANDS, U.S.ZAMBIAZIMBABWE
194325
Related Documents