eschweizerbartxxx_ingenta The hydrogen-bond system in pumpellyite MARIKO NAGASHIMA 1, * ,THOMAS ARMBRUSTER 1 and EUGEN LIBOWITZKY 2 1 Mineralogical Crystallography, Institute of Geological Sciences, University of Bern, Freiestrasse 3, 3012, Bern, Switzerland *Corresponding author, e-mail: [email protected] 2 Institute of Mineralogy and Crystallography, University of Vienna – Geocenter, Althanstraße 14, 1090, Vienna, Austria Abstract: The hydrogen-bond system of pumpellyite, simplified formula W Ca 2 XY 2 Z Si 4 O 14-n (OH) n (Z ¼ 4), from Oberhalbstein, Grisons, Switzerland (OHS) and Cr-rich pumpellyite from Sarany, Ural, Russia (SAR) was studied using electron-microprobe analysis (EMPA), attenuated total reflection Fourier transformed infrared spectroscopy (ATR-FTIR), and single-crystal X-ray diffraction. Structure refinements converged at R 1 factors of 2.91 % for OHS and 2.46 % for SAR. The site occupancies at X and Y are X (Mg 0.48 Al 0.494(3) Fe 0.026(3) ) Y (Al 1.0 ) for OHS, and X (Mg 0.49 Cr 0.285(5) Al 0.225(5) ) Y (Al 0.744(4) Cr 0.256(4) ) for SAR, respectively. Both bond-valence calculations and located hydrogen sites indicated that the O5, O7, O10, and O11 positions host hydroxyl groups. One additional new hydrogen position was found in this study. Thus, two alternate hydrogen sites are linked to O5. The ATR-FTIR spectrum in the region of the OH stretching vibrations is mainly characterized by two intense OH bands at 3522 and 3379 cm 1 and an additional broad band around 3100 cm 1 . The exact number of hydroxyl groups depends on the concentration of divalent and trivalent cations at the X site. With only divalent cations at X, pumpellyite has four hydroxyl groups pfu (1) bifurcated O5–H5O1/O5–H5O5, (2) bifurcated O7–H7O3/O7–H7O7, (3) O10–H10O5, and (4) O11–H11O7. If there are only trivalent cations at X, only three OH groups pfu, (1) O5–H5 0 O10, (2) bifurcated O7–H7O3/O7–H7O7, and (3) O11–H11O7, are necessary for charge balance. The latter system with 3OH groups is very similar to that in sursassite. Key-words: pumpellyite, hydrogen, macfallite, sursassite, Jahn-Teller effect, crystal structure. 1. Introduction The crystal chemistry of many minerals formed under low-grade metamorphism and by low-temperature hydro- thermal activity is not completely understood. Low- temperature silicates are often complex both structurally and compositionally. Pumpellyite is such a relatively low- temperature silicate, which has monoclinic A2/m symme- try, consists of isolated [SiO 4 ] tetrahedral and disilicate [Si 2 O 6 (OH)] groups, and contains two symmetrically inde- pendent chains of octahedra, oriented parallel to the b axis. The general formula is VII W 2 VI X VI Y 2 IV Z 3 O 14–n (OH) n (Z ¼ 4, Passaglia & Gottardi, 1973). The W site is subdivided into W1 and W2. If viewed parallel to the b axis (Fig. 1), the pumpellyite structure displays five-membered rings formed by corner-sharing disilicate, orthosilicate, X, and Y octahe- dra. Half of the rings are open and have W1 at their center, the others are closed and encase W2 (Deer et al., 1986). The W sites are predominantly occupied by Ca, and the Z sites by Si. Both X and Y are octahedrally coordinated but the [XO 6 ] octahedron is larger than the [YO 6 ] one. Both divalent and trivalent cations, such as Mg 2þ , Al 3þ , Mn 2þ , Mn 3þ , Fe 2þ , Fe 3þ ,V 3þ and Cr 3þ , occupy X, whereas Y is occupied by trivalent cations only. In the idealized formula it is com- monly assumed that one half of the X sites are occupied by divalent ions yielding 3.5OH and 10.5O for charge balance (Z ¼ 4). However, results of analyses listed by Deer et al. (1986) and Passaglia & Gottardi (1973) may imply that a wide range of M 2þ /M 3þ ratios exist in pumpellyite-group minerals. Pumpellyite has four hydroxyl groups, if X is only occupied by divalent cations but it has three hydroxyl groups if only trivalent cations occupy the X site. Hydrogen positions in pumpellyite-group minerals were determined for poppiite (V-analogue of pumpellyite: Brigatti et al., 2006) by an X-ray single-crystal study and for Cr-rich pumpellyite (Nagashima & Akasaka, 2007) by a neutron powder-diffraction study. In addition, infrared spectra of pumpellyite-(Al) were analyzed by Hatert et al. (2007). However, details of the hydrogen-bond system in pumpellyite have not yet been investigated. Here, we studied the hydrogen-bond systems of pum- pellyite using samples from Oberhalbstein, Grisons, Switzerland and Cr-rich pumpellyite from Sarany, Ural, Russia. The following experimental methods were used: electron microprobe analysis (EMPA), attenuated total reflection Fourier transformed infrared spectroscopy 935-1221/10/0022-2033 $ 4.50 DOI: 10.1127/0935-1221/2010/0022-2033 # 2010 E. Schweizerbart’sche Verlagsbuchhandlung, D-70176 Stuttgart Eur. J. Mineral. 2010, 22, 333–342

Welcome message from author
This document is posted to help you gain knowledge. Please leave a comment to let me know what you think about it! Share it to your friends and learn new things together.
Transcript

eschweizerbartxxx_ingenta
The hydrogen-bond system in pumpellyite
MARIKO NAGASHIMA1,*, THOMAS ARMBRUSTER1 and EUGEN LIBOWITZKY2
1 Mineralogical Crystallography, Institute of Geological Sciences, University of Bern,Freiestrasse 3, 3012, Bern, Switzerland
*Corresponding author, e-mail: [email protected] Institute of Mineralogy and Crystallography, University of Vienna – Geocenter,
Althanstraße 14, 1090, Vienna, Austria
Abstract: The hydrogen-bond system of pumpellyite, simplified formula WCa2XY2ZSi4O14-n(OH)n (Z ¼ 4), from Oberhalbstein,
Grisons, Switzerland (OHS) and Cr-rich pumpellyite from Sarany, Ural, Russia (SAR) was studied using electron-microprobeanalysis (EMPA), attenuated total reflection Fourier transformed infrared spectroscopy (ATR-FTIR), and single-crystal X-raydiffraction. Structure refinements converged at R1 factors of 2.91 % for OHS and 2.46 % for SAR. The site occupancies at X and Yare X(Mg0.48Al0.494(3)Fe0.026(3))
Y(Al1.0) for OHS, and X(Mg0.49Cr0.285(5)Al0.225(5))Y(Al0.744(4)Cr0.256(4)) for SAR, respectively. Both
bond-valence calculations and located hydrogen sites indicated that the O5, O7, O10, and O11 positions host hydroxyl groups. Oneadditional new hydrogen position was found in this study. Thus, two alternate hydrogen sites are linked to O5. The ATR-FTIRspectrum in the region of the OH stretching vibrations is mainly characterized by two intense OH bands at 3522 and 3379 cm�1 and anadditional broad band around 3100 cm�1. The exact number of hydroxyl groups depends on the concentration of divalent andtrivalent cations at the X site. With only divalent cations at X, pumpellyite has four hydroxyl groups pfu (1) bifurcatedO5–H5���O1/O5–H5���O5, (2) bifurcated O7–H7���O3/O7–H7���O7, (3) O10–H10���O5, and (4) O11–H11���O7. If there are onlytrivalent cations at X, only three OH groups pfu, (1) O5–H50���O10, (2) bifurcated O7–H7���O3/O7–H7���O7, and (3) O11–H11���O7,are necessary for charge balance. The latter system with 3OH groups is very similar to that in sursassite.
Key-words: pumpellyite, hydrogen, macfallite, sursassite, Jahn-Teller effect, crystal structure.
1. Introduction
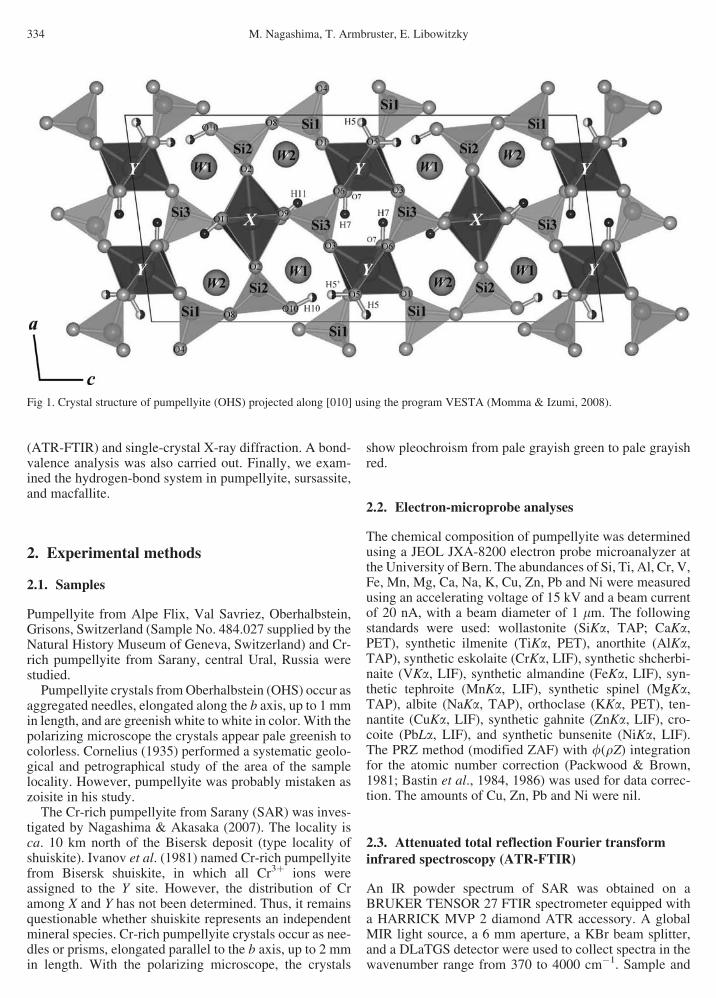
The crystal chemistry of many minerals formed underlow-grade metamorphism and by low-temperature hydro-thermal activity is not completely understood. Low-temperature silicates are often complex both structurallyand compositionally. Pumpellyite is such a relatively low-temperature silicate, which has monoclinic A2/m symme-try, consists of isolated [SiO4] tetrahedral and disilicate[Si2O6(OH)] groups, and contains two symmetrically inde-pendent chains of octahedra, oriented parallel to the b axis.The general formula is VIIW2
VIXVIY2IVZ3O14–n(OH)n (Z¼ 4,
Passaglia & Gottardi, 1973). The W site is subdivided intoW1 and W2. If viewed parallel to the b axis (Fig. 1), thepumpellyite structure displays five-membered rings formedby corner-sharing disilicate, orthosilicate, X, and Y octahe-dra. Half of the rings are open and have W1 at their center, theothers are closed and encase W2 (Deer et al., 1986). The Wsites are predominantly occupied by Ca, and the Z sites by Si.Both X and Y are octahedrally coordinated but the [XO6]octahedron is larger than the [YO6] one. Both divalent andtrivalent cations, such as Mg2þ, Al3þ, Mn2þ, Mn3þ, Fe2þ,Fe3þ, V3þ and Cr3þ, occupy X, whereas Y is occupied by
trivalent cations only. In the idealized formula it is com-monly assumed that one half of the X sites are occupied bydivalent ions yielding 3.5OH and 10.5O for charge balance(Z ¼ 4). However, results of analyses listed by Deer et al.(1986) and Passaglia & Gottardi (1973) may imply that awide range of M2þ/M3þ ratios exist in pumpellyite-groupminerals. Pumpellyite has four hydroxyl groups, if X is onlyoccupied by divalent cations but it has three hydroxyl groupsif only trivalent cations occupy the X site.
Hydrogen positions in pumpellyite-group minerals weredetermined for poppiite (V-analogue of pumpellyite:Brigatti et al., 2006) by an X-ray single-crystal study andfor Cr-rich pumpellyite (Nagashima & Akasaka, 2007) bya neutron powder-diffraction study. In addition, infraredspectra of pumpellyite-(Al) were analyzed by Hatert et al.(2007). However, details of the hydrogen-bond system inpumpellyite have not yet been investigated.
Here, we studied the hydrogen-bond systems of pum-pellyite using samples from Oberhalbstein, Grisons,Switzerland and Cr-rich pumpellyite from Sarany, Ural,Russia. The following experimental methods were used:electron microprobe analysis (EMPA), attenuated totalreflection Fourier transformed infrared spectroscopy
935-1221/10/0022-2033 $ 4.50DOI: 10.1127/0935-1221/2010/0022-2033 # 2010 E. Schweizerbart’sche Verlagsbuchhandlung, D-70176 Stuttgart
Eur. J. Mineral.
2010, 22, 333–342
eschweizerbartxxx_ingenta
(ATR-FTIR) and single-crystal X-ray diffraction. A bond-valence analysis was also carried out. Finally, we exam-ined the hydrogen-bond system in pumpellyite, sursassite,and macfallite.
2. Experimental methods
2.1. Samples
Pumpellyite from Alpe Flix, Val Savriez, Oberhalbstein,Grisons, Switzerland (Sample No. 484.027 supplied by theNatural History Museum of Geneva, Switzerland) and Cr-rich pumpellyite from Sarany, central Ural, Russia werestudied.
Pumpellyite crystals from Oberhalbstein (OHS) occur asaggregated needles, elongated along the b axis, up to 1 mmin length, and are greenish white to white in color. With thepolarizing microscope the crystals appear pale greenish tocolorless. Cornelius (1935) performed a systematic geolo-gical and petrographical study of the area of the samplelocality. However, pumpellyite was probably mistaken aszoisite in his study.
The Cr-rich pumpellyite from Sarany (SAR) was inves-tigated by Nagashima & Akasaka (2007). The locality isca. 10 km north of the Bisersk deposit (type locality ofshuiskite). Ivanov et al. (1981) named Cr-rich pumpellyitefrom Bisersk shuiskite, in which all Cr3þ ions wereassigned to the Y site. However, the distribution of Cramong X and Y has not been determined. Thus, it remainsquestionable whether shuiskite represents an independentmineral species. Cr-rich pumpellyite crystals occur as nee-dles or prisms, elongated parallel to the b axis, up to 2 mmin length. With the polarizing microscope, the crystals
show pleochroism from pale grayish green to pale grayishred.
2.2. Electron-microprobe analyses
The chemical composition of pumpellyite was determinedusing a JEOL JXA-8200 electron probe microanalyzer atthe University of Bern. The abundances of Si, Ti, Al, Cr, V,Fe, Mn, Mg, Ca, Na, K, Cu, Zn, Pb and Ni were measuredusing an accelerating voltage of 15 kV and a beam currentof 20 nA, with a beam diameter of 1 mm. The followingstandards were used: wollastonite (SiKa, TAP; CaKa,PET), synthetic ilmenite (TiKa, PET), anorthite (AlKa,TAP), synthetic eskolaite (CrKa, LIF), synthetic shcherbi-naite (VKa, LIF), synthetic almandine (FeKa, LIF), syn-thetic tephroite (MnKa, LIF), synthetic spinel (MgKa,TAP), albite (NaKa, TAP), orthoclase (KKa, PET), ten-nantite (CuKa, LIF), synthetic gahnite (ZnKa, LIF), cro-coite (PbLa, LIF), and synthetic bunsenite (NiKa, LIF).The PRZ method (modified ZAF) with f(rZ) integrationfor the atomic number correction (Packwood & Brown,1981; Bastin et al., 1984, 1986) was used for data correc-tion. The amounts of Cu, Zn, Pb and Ni were nil.
2.3. Attenuated total reflection Fourier transforminfrared spectroscopy (ATR-FTIR)
An IR powder spectrum of SAR was obtained on aBRUKER TENSOR 27 FTIR spectrometer equipped witha HARRICK MVP 2 diamond ATR accessory. A globalMIR light source, a 6 mm aperture, a KBr beam splitter,and a DLaTGS detector were used to collect spectra in thewavenumber range from 370 to 4000 cm�1. Sample and
Fig 1. Crystal structure of pumpellyite (OHS) projected along [010] using the program VESTA (Momma & Izumi, 2008).
334 M. Nagashima, T. Armbruster, E. Libowitzky
eschweizerbartxxx_ingenta
background spectra were averaged from each 32 scans at4 cm�1 resolution. The former were acquired from undi-luted sample powder pressed to the ATR crystal, the latterfrom the empty ATR unit in air. Data handling was per-formed with OPUS 5.5 software.
2.4 Single-crystal X-ray structural analysis
The diffraction data of OHS (0.02� 0.03� 0.09 mm) andSAR (0.1 � 0.1 � 0.6 mm) were collected at room tem-perature with graphite-monochromated MoKa X-radiation(l ¼ 0.71069 A) using a Bruker SMART APEX II CCDdiffractometer of Bruker AXS K.K.(OHS) and an Enraf-Nonius CAD4 diffractometer (SAR), respectively.
OHS: Preliminary lattice parameters and an orientationmatrix were obtained from three sets of frames and refinedduring the integration process of the intensity data.Diffraction data were collected with o scans with differentj settings (j-o scan) (Bruker, 1999). Data were processedusing SAINT (Bruker, 1999). An empirical absorptioncorrection using SADABS (Sheldrick, 1996) was applied.
SAR: Data reduction, including background andLorentz polarization corrections, and an empirical absorp-tion correction based on c scans, were done using the SDPprogram library (Enraf-Nonius, 1983).
For both samples structural refinements were performedusing the program SHELXL-97 (Sheldrick, 2008).Scattering factors for neutral atoms were employed. Atthe primary stage populations of Ca at W1 and W2, Si atSi1, Si2 and Si3 for both samples and Al at Y for OHS wererefined. However, these sites turned out to be fully occu-pied within one standard deviation. Thus, the site occupan-cies at these sites were fixed at 1.0. Mg2þwas assigned to Xon the basis of the TOF neutron and X-ray Rietveld studies(Nagashima & Akasaka, 2007). Positions of the hydrogenatoms of the hydroxyl groups were derived from differ-ence-Fourier syntheses. Subsequently, hydrogen positionswere refined assuming full or half occupancy with fixedUiso ¼ 0.05 A2. In addition, a bond distance constraint ofO–H ¼ 0.980(1) A (Franks, 1973) was applied.
3. Results
3.1. Chemical composition of pumpellyite
Table 1 shows the average chemical composition of OHS(n ¼ 17). The average FeO content is 1.25 � 0.40 wt%.There was no evidence of chemical zoning or of a domainstructure with variable composition in the crystals examined.The average formula is (Ca2.00Na0.01)�2.01(Mg0.48Al0.42
Fe0.08Mn2þ0.01)�0.99(Al1.99Ti0.01)�2.00Si3.00O10.42–10.50
(OH)3.50–3.58(Z ¼ 4), where the total number of cations,except H ions, was normalized to 8 and the amount ofOH was calculated using charge balance considerations.There are upper and lower limits to the number of O andOH, depending on whether Fe at X is considered Fe2þ
or Fe3þ. In this study, the chemical composition of SAR
was adopted from Nagashima & Akasaka (2007), i.e.(Ca1.95Na0.02K0.01)�1.98(Mg0.49Cr3þ
0.52Fe3þ0.01)�1.02(Al1.58
Cr3þ0.42) �2.00(Si2.95Al0.05)�3.00O10.45 (OH)3.55(Z ¼ 4),
where the hydrogen content was calculated based on chargebalance. The oxidation state of chromium is trivalent asconfirmed by optical spectroscopy (Nagashima et al., inpress.). The above formulae for OHS and SAR were calcu-lated following the cation assignments suggested byPassaglia & Gottardi (1973). Accordingly, OHS and SARshould be considered pumpellyite-(Mg) and ‘‘pumpellyite-(Cr),’’ respectively. However, as it will be shown below,this arbitrary cation assignment and naming is not in agree-ment with the results of structure refinement.
Pumpellyite crystals used for EMPA and X-ray single-crystal refinements were from the same hand specimen.Therefore, average chemical compositions were used toconstrain the Mg content in subsequent site populationrefinements.
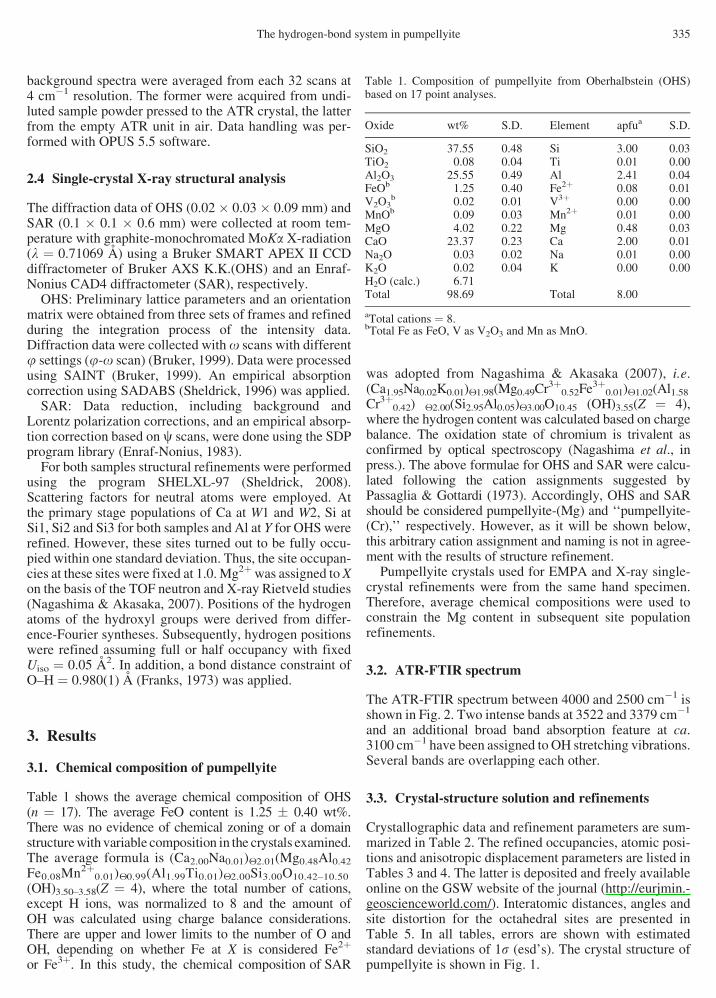
3.2. ATR-FTIR spectrum
The ATR-FTIR spectrum between 4000 and 2500 cm�1 isshown in Fig. 2. Two intense bands at 3522 and 3379 cm�1
and an additional broad band absorption feature at ca.3100 cm�1 have been assigned to OH stretching vibrations.Several bands are overlapping each other.
3.3. Crystal-structure solution and refinements
Crystallographic data and refinement parameters are sum-marized in Table 2. The refined occupancies, atomic posi-tions and anisotropic displacement parameters are listed inTables 3 and 4. The latter is deposited and freely availableonline on the GSW website of the journal (http://eurjmin.-geoscienceworld.com/). Interatomic distances, angles andsite distortion for the octahedral sites are presented inTable 5. In all tables, errors are shown with estimatedstandard deviations of 1s (esd’s). The crystal structure ofpumpellyite is shown in Fig. 1.
Table 1. Composition of pumpellyite from Oberhalbstein (OHS)based on 17 point analyses.
Oxide wt% S.D. Element apfua S.D.
SiO2 37.55 0.48 Si 3.00 0.03TiO2 0.08 0.04 Ti 0.01 0.00Al2O3 25.55 0.49 Al 2.41 0.04FeOb 1.25 0.40 Fe2þ 0.08 0.01V2O3
b 0.02 0.01 V3þ 0.00 0.00MnOb 0.09 0.03 Mn2þ 0.01 0.00MgO 4.02 0.22 Mg 0.48 0.03CaO 23.37 0.23 Ca 2.00 0.01Na2O 0.03 0.02 Na 0.01 0.00K2O 0.02 0.04 K 0.00 0.00H2O (calc.) 6.71Total 98.69 Total 8.00
aTotal cations ¼ 8.bTotal Fe as FeO, V as V2O3 and Mn as MnO.
The hydrogen-bond system in pumpellyite 335
eschweizerbartxxx_ingenta
Structure refinements converged at R1 factors of 2.91 %for OHS and 2.46 % for SAR. As obtained by structurerefinements, the site occupancies at X and Y are X(Mg0.48
Al0.494(3)Fe0.026(3))Y(Al1.0) for OHS, and X(Mg0.49Cr0.285(5)
Al0.225(5))Y(Al0.744(4)Cr0.256(4)) for SAR, respectively.
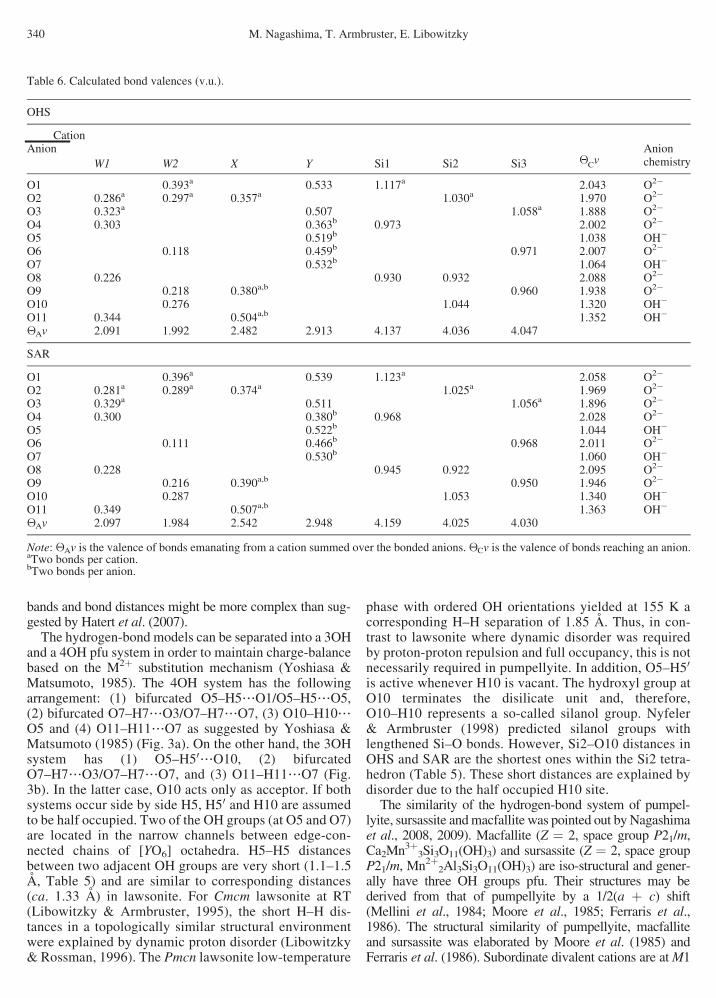
Bond-valence sums were calculated using the electro-static strength function of Brown & Altermatt (1985) andthe bond-valence parameters of Brese & O’Keeffe (1991).The results are given in Table 6. Both bond valence calcula-tions and located hydrogen sites indicated that the O5, O7,O10 and O11 positions host hydroxyl groups. The bond-valence result is consistent with previous studies (Allmann& Donnay, 1971, 1973; Yoshiasa & Matsumoto, 1985;Nagashima et al., 2006; Nagashima & Akasaka, 2007).Bond-valence sums for O5 and O7 are close to 1.0 v.u.,suggesting full occupancy by OH, whereas bond-valencesums for O10 and O11 are about 1.3 v.u. possibly indicatingpartial occupancy and OH�/O2� disorder.
In addition to four H sites (some of them partiallyoccupied) already reported (Brigatti et al., 2006;Nagashima & Akasaka, 2007), a new additional hydrogen
Fig 2. ATR-FTIR spectrum of Cr-rich pumpellyite (SAR) between4000 and 1500 cm�1. Weak C–H bands probably are derived fromlaboratory air.
Table 2. Experimental details of the single-crystal X-ray diffraction analysis of pumpellyite.
Sample OHS SAR
Sample locality Oberhalbstein, Grisons, Switzerland Sarany, Ural, RussiaCrystal size (mm) 0.02 � 0.03 � 0.09 0.1 � 0.1 � 0.6Space group A2/m A2/mCell parameters
a (A) 8.8177 (2) 8.805 (2)b (A) 5.8999 (1) 5.931 (2)c (A) 19.1056 (4) 19.133 (5)b (�) 97.401 (1) 97.49 (4)V (A3) 985.66 (1) 990.7 (5)
Dcalc (g/cm3) 3.17 3.29Radiation MoKa (l ¼ 0.71069 A) MoKa (l ¼ 0.71069 A)Monochromator Graphite GraphiteDiffractometer Bruker APEX CCD Enraf-Nonius CAD4Scan type j�o scan (Bruker, 1999) o scan (Enraf-Nonius, 1983)Absorption correction SADABS (Sheldrick, 1996) c-scan (Enraf-Nonius, 1983)ymin (�) 2.2 2.2ymax (�) 32.9 29.9m (mm�1) 2.63 2.43Collected reflections 14,185 2136Unique reflections 1958 1566Rint (%) 4.54 3.12Rs (%) 3.55 3.06Miller index limits �13 � h � 13, �8 � k � 8, �28 � l � 27 �1 � h � 12, �8� k �1, �26 � l � 26Refinement on F2 using SHELXL-97 (Sheldrick, 2008) SHELXL-97 (Sheldrick, 2008)R1 (%) 2.91 2.46wR2 (%) 7.40 6.89No. of parameters 133 134Weighting schemea w ¼ 1=½s2ðF2
o Þ þ ð0:0319PÞ2 þ 1:56P� w ¼ 1=½s2ðF2
o Þ þ ð0:0381PÞ2 þ 0:83P�
�rmax (e A�3) 0.728 at 0.86 A from O8 0.750 at 0.75 A from W1�rmin (e A�3) �0.644 at 0.57 A from Si3 �0.468 at 0.83 A from Y
Chemical formulae of OHS and SAR are represented as (Ca2.00Na0.01)�2.01(Mg0.48Al0.42Fe0.08Mn2þ0.01)�0.99(Al1.99Ti0.01)�2.00Si3.00
O10.42–10.50(OH)3.50–3.58 (Z ¼ 4) and (Ca1.95Na0.02K0.01)�1.98(Mg0.49Cr3þ0.52Fe3þ
0.01)�1.02(Al1.58Cr3þ0.42)�2.00(Si2.95Al0.05)�3.00O10.45
(OH)3.55 (Z ¼ 4, Nagashima & Akasaka, 2007), respectively.aThe function of the weighting scheme is w ¼ 1=ðs2ðF2
0 Þ þ ða � PÞ2þb � PÞ, where (P ¼ ðMaxðF2
o Þ þ 2F2c Þ=3, and the parameters a and b are
chosen to minimize the differences in the variances for reflections in different ranges of intensity and diffraction angle.
336 M. Nagashima, T. Armbruster, E. Libowitzky

eschweizerbartxxx_ingenta
Table 3. Site occupancies, atomic positions and equivalent displacement parameters (A2).
Site OHS SAR Site OHS SAR
W1 x 0.24963 (6) 0.25044 (7) O6 x 0.3693 (2) 0.3701 (2)y 1/2 1/2 y 1/2 1/2z 0.33951 (3) 0.33951 (3) z 0.04524 (10) 0.04488 (10)Ueq 0.01245 (12) 0.00970 (14) Ueq 0.0109 (4) 0.0089 (4)
Occup. Ca1.0 Ca1.0 O7 x 0.3671 (2) 0.3696 (2)W2 x 0.18990 (7) 0.18851 (8) y 0 0
y 1/2 1/2 z 0.03295 (10) 0.03352 (11)z 0.15427 (3) 0.15438 (3) Ueq 0.0130 (4) 0.0113 (4)Ueq 0.01573 (13) 0.01278 (14) O8 x 0.0369 (2) 0.0361 (2)
Occup. Ca1.0 Ca1.0 y 0 0X x 1/2 1/2 z 0.17578 (10) 0.17598 (10)
y 1/4 1/4 Ueq 0.0125 (4) 0.0103 (4)z 1/4 1/4 O9 x 0.4779 (2) 0.4776 (2)Ueq 0.0095 (2) 0.0067 (2) y 1/2 1/2
Occup. Mg0.48Al0.494(3)Fe0.026(3) Mg0.49Cr0.285(5)Al0.225(5) z 0.17645 (10) 0.17645 (11)Y x 0.25510 (6) 0.25439 (5) Ueq 0.0146 (4) 0.0106 (4)
y 0.24583 (9) 0.24651 (8) O10 x 0.0672 (2) 0.0670 (3)z 0.49578 (3) 0.49560 (2) y 0 0Ueq 0.00814 (12) 0.00579 (15) z 0.31357 (11) 0.31357 (11)
Occup. Al1.0 Al0.744 (4)Cr0.256 (4) Ueq 0.0180 (4) 0.0142 (5)Si1 x 0.05043 (8) 0.05104 (9) O11 x 0.5014 (2) 0.5025 (2)
y 0 0 y 1/2 1/2z 0.08955 (4) 0.09034 (4) z 0.31405 (10) 0.31484 (11)Ueq 0.00896 (14) 0.00635 (16) Ueq 0.0133 (4) 0.0104 (4)
Occup. Si1.0 Si1.0 H5 x 0.035 (4) 0.021 (3)Si2 x 0.16614 (8) 0.16596 (9) y 0 0
y 0 0 z 0.477 (4) 0.464 (5)z 0.24753 (4) 0.24784 (4) Uiso 0.05 0.05Ueq 0.00996 (15) 0.00724 (16) Occup. H0.5 (half) H0.5 (half)
Occup. Si1.0 Si1.0 H50 x 0.132 (11) 0.163 (11)Si3 x 0.46571 (8) 0.46522 (9) y 0 0
y 0 0 z 0.4065 (6) 0.411 (2)z 0.40292 (4) 0.40279 (4) Uiso 0.05 0.05Ueq 0.00912 (15) 0.00637 (16) Occup. H0.5 (half) H0.5 (half)
Occup. Si1.0 Si1.0 H7 x 0.4791 (3) 0.4815 (5)O1 x 0.13735 (15) 0.13779 (16) y 0 0
y 0.2254 (2) 0.2243 (3) z 0.041 (2) 0.044 (3)z 0.07079 (7) 0.07186 (7) Uiso 0.05 0.05Ueq 0.0119 (3) 0.0091 (3) Occup. H1.0 (full) H1.0 (full)
O2 x 0.26649 (15) 0.26624 (17) H10 x 0.118 (9) 0.103 (12)y 0.2313 (2) 0.2306 (3) y 0 0z 0.24593 (7) 0.24605 (7) z 0.3623 (16) 0.3642 (12)Ueq 0.0132 (3) 0.0098 (3) Uiso 0.05 0.05
O3 x 0.36708 (15) 0.36684 (17) Occup. H0.5 (half) H0.5 (half)y 0.2228 (2) 0.2228 (3) H11 x 0.574 (4) 0.562 (5)z 0.41739 (7) 0.41651 (8) y 1/2 1/2Ueq 0.0119 (3) 0.0097 (3) z 0.3575 (13) 0.3618 (12)
O4 x 0.1311 (2) 0.1307 (2) Uiso 0.05 0.05y 1/2 1/2 Occup. H1.0 (full) H1.0 (full)z 0.44488 (10) 0.44461 (10)Ueq 0.0099 (3) 0.0077 (4)
O5 x 0.1332 (2) 0.1303 (2)y 0 0z 0.45788 (10) 0.45777 (11)Ueq 0.0116 (4) 0.0094 (4)
Note: All oxygen occupancies were fixed at 1.0.
The hydrogen-bond system in pumpellyite 337

eschweizerbartxxx_ingenta
position, H50, has been found in both studied samples(OHS and SAR). Thus, O5 may form hydroxyl groupswith two different O–H orientations.
4. Discussion
4.1. Nomenclature of pumpellyite-group minerals
‘‘The unit-cell content should be calculated on the basis of 56oxygens’’ was proposed by Passaglia & Gottardi (1973) asthe first step for the calculation of pumpellyite chemical-formula. This rule can only be applied if the amount of H2Oand the oxidation state of the transition elements, such as Feand Mn, has been directly determined. If the chemical com-positions is evaluated using conventional microprobe analy-sis, the pumpellyite formula must be normalized to a total of32 cations (Z¼ 1) instead of O¼ 56 because of the uncertainoxidation state of transition elements and unknown watercontent. According to the nomenclature of pumpellyite-group minerals (Passaglia & Gottardi, 1973), the root nameis determined by the dominant cation at Y, and the dominantcation at X is represented as a suffix designation. The rule toassign the cations to the X and Y octahedral sites proposed byPassaglia & Gottardi (1973) is: (a) Al and Ti are assigned toY; if this assignment is not enough for full occupancy of Y,Fe3þ is added until the site is filled. (b) Mn, Fe2þ and Mg areassigned to X together with possibly remaining Fe3þ and Al.Based on this precept, the amount of Al at Y is in many casesoverestimated. Following this procedure the chemical formu-lae of OHS and SAR lead to the names pumpellyite-(Mg) and‘‘pumpellyite-(Cr),’’ respectively. ‘‘Pumpellyite-(Cr)’’ hasnot yet been reported as an independent species. However,based on site occupancies obtained by X-ray structure-refine-ments, OHS and SAR must be named pumpellyite-(Al) andpumpellyite-(Mg), respectively. Thus, the names determinedfrom the chemical formula (Passaglia & Gottardi, 1973), andthe refined site-occupancies, are inconsistent. The discre-pancy is caused by the Al distribution over X and Y.Refined site-occupancies clearly indicate that Al occupies Xbefore Y is filled with Al (e.g., Artioli & Geiger, 1994; Artioliet al., 1996; Brigatti et al., 2006; Nagashima et al., 2006;Nagashima & Akasaka, 2007). We have to consider that, notonly for pumpellyite, mineral naming is a compromisebetween a rather arbitrary rule of building up a chemicalformula from analytical results only and a more realisticformula obtained by a combination of chemical analysesand cation distribution by structure refinement. Probably thebest way out of this dilemma is to state only the mineral group(e.g., pumpellyite) whenever analytical data are not sufficientfor assignment of a mineral species.
4.2. Cation distribution among the octahedral sites
Previous studies suggested that the mean Y–O distance andthe mean ionic radius of atoms at the Y site are positivelycorrelated whereas the mean X–O distance and the meanionic radius of ions at the X site show no correlation
(Nagashima et al., 2006; Nagashima & Akasaka, 2007).The regression line of the ,Y-O. distance versus themean ionic radius at Y is y ¼ 0.927x þ 1.426, where y is,Y-O. distance (A) and x represents the mean ionic radius(A) (Nagashima & Akasaka, 2007). According to this func-tion, the expected Y-O distances are 1.92 A for OHS and1.94 A for SAR. They agree well with the observed values(1.922 A for OHS and 1.936 A for SAR) in this study.
The polyhedral distortions at X and Y were examined bybond-length distortion parameters ,loct. defined byRobinson et al. (1971), DI(oct) by Baur (1974), and theangular distortion parameter sy(oct)2 of Robinson et al.(1971). All distortion parameters for the Y site of OHS arelarger than those of SAR (Table 5). These results confirmthat expansion of the Y octahedra, due to substitution oflarger cations for Al, makes the Y octahedron geometricallymore regular (Nagashima et al., 2006; Nagashima &Akasaka, 2007).
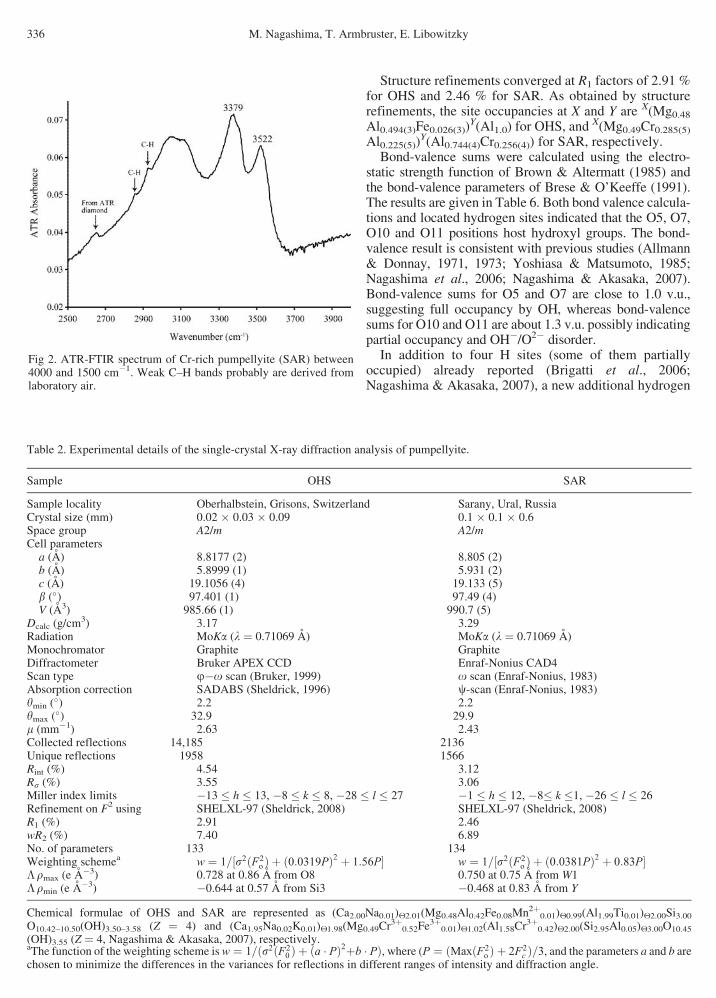
4.3. Hydrogen positions and hydrogen bonds
The positions of hydrogen atoms and hydrogen bonds inpumpellyite are shown in Fig. 3. In general, there are fourhydroxyl groups (Fig. 3a). All donor oxygen-hydrogenbonds of pumpellyite are located on mirror planes parallelto (010) as suggested by Yoshiasa & Matsumoto (1985).The relationship between donor and acceptor oxygens andtheir hydrogen bonds can be summarized as follows: (1)bifurcated O5–H5���O1/O5–H5���O5, (2) O5–H50���O10,(3) bifurcated O7–H7���O3/O7–H7���O7, (4) O10–H10���O5, and (5) O11–H11���O7. The H5 and H50 sites areassumed to be half-occupied (Fig. 3).
Bond valences of O5 and O7 are lower than those of O10and O11 (Table 6). Therefore, O5 and O7 are privileged to actsimultaneously as donor and as acceptor. Ferraris & Ivaldi(1988) have shown that for short O–H���O donor acceptordistances, the acceptor benefits from additional ca. 0.25 v.u.O5 acts as donor for H5 or H50 and forms the hydrogen bondsystem O5–H5���O5 or O5–H50���O10. O7 acts as donor forH7, and forms the O7–H7���O7 hydrogen bond, crossing thenarrow channels. This hydrogen bond may be bifurcatedconnecting H7 to both O7 and O3. In addition, O5 and O7act as acceptors of H10 and H11, respectively.
The IR spectrum of SAR in the region of the OH stretch-ing vibration is mainly characterized by two bands at 3522and 3379 cm�1, and one broad band at ca. 3100 cm�1
(Fig. 2). The associated OH���O distances were estimatedusing the correlation between observed OH stretchingwavenumber and the O���O separation given byLibowitzky (1999). The estimated O���O separations are2.93 (3522 cm�1), 2.78 (3379 cm�1) and 2.67 A (3100cm�1). Yoshiasa & Matsumoto (1985) suggested the fol-lowing substitutional mechanism: M3þ þ O2� $ M2þ þOH�. Thus, depending on M2þ at X, pumpellyite isassumed to have two different hydroxyl systems. H50 isan indicator of an additional new hydrogen-bond system.These two systems might also be the reason for the complexIR spectra.
338 M. Nagashima, T. Armbruster, E. Libowitzky

eschweizerbartxxx_ingenta
A similar IR spectrum as described here has also beenreported for pumpellyite-(Al) by Hatert et al. (2007).According to their description, the estimated OH���O dis-tances using the correlation by Libowitzky (1999) are ingood agreement with those determined from the X-rayRietveld refinement. Hatert et al. (2007) suggested that theobserved wavenumbers correspond to the following O-H���Odistances: 2.65 (3010 cm�1), 2.68 (3127 cm�1), 2.80(3407 cm�1), 2.89 (3499 cm�1), and 2.98 A (3542 cm�1).As result of their structural refinement, the distances betweenoxygen atoms involved in hydrogen bonds are as follows:2.708 (O7���O7), 2.771 (O10���O5), 2.867 (O5���O5), and2.915 A (O11���O7) (Hartert et al., 2007). As shown in thisstudy, two different systems of hydrogen bonds may developin pumpellyite. Thus, the corresponding relations between IR
Table 5. Selected interatomic distances (A), angles (�), volume and distortion.
OHS SAR OHS SAR
W1–O2 �2 2.409 (1) 2.416 (2) Si1–O1 �2 1.599 (1) 1.597 (2)–O3 �2 2.359 (1) 2.352 (2) –O4 1.650 (2) 1.652 (2)–O4 2.385 (2) 2.389 (2) –O8 1.667 (2) 1.661 (2)–O8 2.506 (2) 2.502 (2) Mean 1.629 1.627–O11 2.333 (2) 2.328 (2)
Mean 2.394 2.394 Si2–O2 �2 1.629 (1) 1.631 (2)–O8 1.666 (2) 1.670 (2)
W2–O1 �2 2.279 (1) 2.276 (2) –O10 1.624 (2) 1.621 (2)–O2 �2 2.394 (1) 2.405 (2) Mean 1.637 1.638–O6 2.773 (2) 2.796 (2)–O9 2.520 (2) 2.525 (2) Si3 –O3 �2 1.619 (1) 1.620 (2)–O10 2.424 (2) 2.408 (2) –O6 1.651 (2) 1.652 (2)
Mean 2.438 2.442 –O9 1.655 (2) 1.659 (2)Mean 1.636 1.638
X–O2 �2 2.053 (1) 2.053 (2) Y–O1 1.883 (1) 1.898 (2)–O9 �2 2.029 (1) 2.036 (2) –O3 1.902 (1) 1.918 (2)–O11 �2 1.916 (1) 1.932 (1) –O4 2.029 (1) 2.030 (2)
Mean 1.999 2.007 –O5 1.893 (1) 1.910 (2)V(VI) (A3) 10.58 10.68 –O6 1.940 (1) 1.953 (2)DI (oct) 0.028 0.025 –O7 1.884 (1) 1.904 (2),l oct. 1.007 1.007 Mean 1.922 1.936sy (oct)2 18.98 18.34 V(VI) (A3) 9.31 9.52
DI (oct) 0.022 0.019O5���O1 – 2.867 (2) ,l oct. 1.012 1.011O5���O5 3.014 (2) 2.974 (3) sy (oct)2 37.34 35.64O7���O3 2.915 (2) 2.902 (2)O7���O7 2.800 (2) 2.772 (2) O1–Si1–O1 112.6 (1) 112.9 (1)O10���O5 2.744 (3) 2.734 (3) O1–Si1–O4 �2 112.27 (6) 112.12 (7)O11���O7 3.003 (3) 2.972 (3) O1–Si1–O8 �2 108.61 (6) 108.68 (7)H5–H5 1.14 (8) 1.47 (12) O4–Si1–O8 101.8 (1) 101.7 (1)H7–H7 1.66 (5) 1.76 (7)
O2–Si2–O2 113.8 (1) 114.0 (1)O5–H5–O1 – 124 (1) O2–Si2–O8 �2 107.48 (6) 107.29 (7)O5–H5–O5 165 (1) 143 (1) O2–Si2–O10 �2 111.23 (6) 111.33 (7)O5–H50–O10 162 (2) 137 (2) O8–Si2–O10 105.1 (1) 105.0 (1)O7–H7–O3 128.1 (9) 129 (1)O7–H7–O7 128.7 (9) 124 (1) O3–Si3–O3 108.5 (1) 109.3 (1)O10–H10–O5 157 (2) 169 (2) O3–Si3–O6 �2 110.41 (7) 110.34 (7)O11–H11–O7 153.9 (9) 165 (1) O3–Si3–O9 �2 112.81 (6) 112.37 (7)
O6–Si3–O9 101.8 (1) 101.9 (1)
Note: DI(oct) ¼ 1/6�|Ri – Rav.|/Rav. (Ri: each bond length, Rav.: average distance for an octahedron) (Baur, 1974), loct¼P6
i¼1 li � l0ð Þ2.6
(li: each bond length, l0: center-to-vertex distance for an octahedron with Oh symmetry, whose volume is equal to that of a distortedoctahedron with bond lengths li) (Robinson et al., 1971), and syðoctÞ2 ¼
P12i¼1 yi � 90�ð Þ2
.11 (yi: O–M–O angle) (Robinson et al., 1971).
Fig 3. Hydrogen-bond system with 4OH (a) and 3OH (b), in pumpel-lyite (SAR) projected along [010]. Dashed lines indicate H���O bonds.
The hydrogen-bond system in pumpellyite 339
eschweizerbartxxx_ingenta
bands and bond distances might be more complex than sug-gested by Hatert et al. (2007).
The hydrogen-bond models can be separated into a 3OHand a 4OH pfu system in order to maintain charge-balancebased on the M2þ substitution mechanism (Yoshiasa &Matsumoto, 1985). The 4OH system has the followingarrangement: (1) bifurcated O5–H5���O1/O5–H5���O5,(2) bifurcated O7–H7���O3/O7–H7���O7, (3) O10–H10���O5 and (4) O11–H11���O7 as suggested by Yoshiasa &Matsumoto (1985) (Fig. 3a). On the other hand, the 3OHsystem has (1) O5–H50���O10, (2) bifurcatedO7–H7���O3/O7–H7���O7, and (3) O11–H11���O7 (Fig.3b). In the latter case, O10 acts only as acceptor. If bothsystems occur side by side H5, H50 and H10 are assumedto be half occupied. Two of the OH groups (at O5 and O7)are located in the narrow channels between edge-con-nected chains of [YO6] octahedra. H5–H5 distancesbetween two adjacent OH groups are very short (1.1–1.5A, Table 5) and are similar to corresponding distances(ca. 1.33 A) in lawsonite. For Cmcm lawsonite at RT(Libowitzky & Armbruster, 1995), the short H–H dis-tances in a topologically similar structural environmentwere explained by dynamic proton disorder (Libowitzky& Rossman, 1996). The Pmcn lawsonite low-temperature
phase with ordered OH orientations yielded at 155 K acorresponding H–H separation of 1.85 A. Thus, in con-trast to lawsonite where dynamic disorder was requiredby proton-proton repulsion and full occupancy, this is notnecessarily required in pumpellyite. In addition, O5–H50
is active whenever H10 is vacant. The hydroxyl group atO10 terminates the disilicate unit and, therefore,O10–H10 represents a so-called silanol group. Nyfeler& Armbruster (1998) predicted silanol groups withlengthened Si–O bonds. However, Si2–O10 distances inOHS and SAR are the shortest ones within the Si2 tetra-hedron (Table 5). These short distances are explained bydisorder due to the half occupied H10 site.
The similarity of the hydrogen-bond system of pumpel-lyite, sursassite and macfallite was pointed out by Nagashimaet al., 2008, 2009). Macfallite (Z ¼ 2, space group P21/m,Ca2Mn3þ
3Si3O11(OH)3) and sursassite (Z ¼ 2, space groupP21/m, Mn2þ
2Al3Si3O11(OH)3) are iso-structural and gener-ally have three OH groups pfu. Their structures may bederived from that of pumpellyite by a 1/2(a þ c) shift(Mellini et al., 1984; Moore et al., 1985; Ferraris et al.,1986). The structural similarity of pumpellyite, macfalliteand sursassite was elaborated by Moore et al. (1985) andFerraris et al. (1986). Subordinate divalent cations are at M1
Table 6. Calculated bond valences (v.u.).
OHS
CationAnion
W1 W2 X Y Si1 Si2 Si3 �C
vAnionchemistry
O1 0.393a 0.533 1.117a 2.043 O2�
O2 0.286a 0.297a 0.357a 1.030a 1.970 O2�
O3 0.323a 0.507 1.058a 1.888 O2�
O4 0.303 0.363b 0.973 2.002 O2�
O5 0.519b 1.038 OH�
O6 0.118 0.459b 0.971 2.007 O2�
O7 0.532b 1.064 OH�
O8 0.226 0.930 0.932 2.088 O2�
O9 0.218 0.380a,b 0.960 1.938 O2�
O10 0.276 1.044 1.320 OH�
O11 0.344 0.504a,b 1.352 OH�
�Av 2.091 1.992 2.482 2.913 4.137 4.036 4.047
SAR
O1 0.396a 0.539 1.123a 2.058 O2�
O2 0.281a 0.289a 0.374a 1.025a 1.969 O2�
O3 0.329a 0.511 1.056a 1.896 O2�
O4 0.300 0.380b 0.968 2.028 O2�
O5 0.522b 1.044 OH�
O6 0.111 0.466b 0.968 2.011 O2�
O7 0.530b 1.060 OH�
O8 0.228 0.945 0.922 2.095 O2�
O9 0.216 0.390a,b 0.950 1.946 O2�
O10 0.287 1.053 1.340 OH�
O11 0.349 0.507a,b 1.363 OH�
�Av 2.097 1.984 2.542 2.948 4.159 4.025 4.030
Note: �Av is the valence of bonds emanating from a cation summed over the bonded anions. �Cv is the valence of bonds reaching an anion.aTwo bonds per cation.bTwo bonds per anion.
340 M. Nagashima, T. Armbruster, E. Libowitzky

eschweizerbartxxx_ingenta
in sursassite (Nagashima et al., 2009) and macfallite(Nagashima et al., 2008) and at X in pumpellyite. [XO6]-octahedra in pumpellyite and [M1O6]-octahedra in sursassiteand macfallite are topologically similar to each other, and[YO6]-octahedra in pumpellyite are topologically similar to[M2O6]- and [M3O6]-octahedra in sursassite and macfallite.The hydrogen-bond systems in macfallite and sursassite wereresolved by Nagashima et al., 2008, 2009). In the case ofmacfallite, there is only one OH group in the narrow channelsbetween edge-connected chains of [M2O6] and [M3O6] octa-hedra, although in the case of pumpellyite and sursassite,there are two hydroxyl groups located in the channel.
The IR spectra of macfallite and sursassite showed abroad band around 2900 cm�1 (Fig. 2 in Nagashima et al.,2008) and 2950 cm�1 (Fig. 1 in Nagashima et al., 2009),which are similar to the one of pumpellyite (ca. 3100cm�1). In macfallite the broad band was assigned to thehydrogen bond O6���O11 with a distance of about 2.63 A,crossing the narrow channel. In contrast, the broad IR bandat 2950 cm�1 in sursassite was assigned to O6���O10 with adistance of 2.66–2.67 A, which represents the open edge ofthe Mn1 channel. In the case of pumpellyite (this study),this broad band is assigned to O10���O5, which is the openedge of the W1 channel. This edge is topologically verysimilar to O6���O10 in sursassite. The O5���O5 andO7���O7 distances of pumpellyite, crossing the narrowchannel, are considerably longer. The possible reason forthe different assignment of the broad IR band (2900 cm�1)in macfallite are distortions due to the Jahn-Teller effect ofMn3þ at the M2 and M3 sites. The M2 and M3 sites insursassite are mainly occupied by Al, as is the Y site ofOHS and SAR pumpellyite. However, in the case of pum-pellyite, Al at Y may also be substituted by Mn3þ. It isknown that in pumpellyite the size and electronic structureof the ion (Cr3þ, Fe3þ, Mn3þ, and Al) at Y are crucialfactors determining the size of the channels because thevolume of the [YO6] octahedron simply reflects the sub-stitution at Y. This implies that Mn3þ substituting for Al atY in Mn3þ-rich pumpellyite, i.e. okhotskite, leads to anincreased volume of the [YO6] octahedra simultaneouslyshortening the distance across the narrow channels. Thus,depending on chemistry the assignment of OH-specific IRbands in pumpellyite may be different.
The 3OH systems of isostructural macfalliteCa2Mn3þ
3Si3O11(OH)3 (Fig. 4 in Nagashima et al., 2008)and sursassite Mn2þ
2Al3Si3O11(OH)3 (Fig. 6 in Nagashimaet al., 2009) are different. The influence of Mn3þ Jahn-Teller distortion on hydrogen bonds has been describedabove. Isostructural mozartite CaMn3þSiO4(OH) andvuagnatite CaAlSiO4(OH) also show a different arrange-ment of hydrogen-bond acceptors and donors because ofthe active role of the Mn3þ Jahn-Teller effect (Nyfeleret al., 1997). Thus, the investigation of the hydrogen-bond system in Mn3þ-rich pumpellyite-group mineralsand the systematic understanding of the hydrogen-bondsystems in pumpellyite, sursassite, macfallite and otherstructurally and compositionally related minerals aremandatory.
Acknowledgements: We thank Dr. E. Gnos at the NaturalHistory Museum of Geneva, Switzerland, for supplying uswith the pumpellyite (Sample No. 484.027). We also thankchief editor Prof. Oberhansli, associate editor Prof. M.Pasero, and an anonymous reviewer for their constructivecomments on this manuscript. This research was supportedby the Japan Society for the Promotion of Science (JSPS)for research abroad to M. Nagashima.
References
Allmann, R. & Donnay, G. (1971): Structural relations between
pumpellyite and ardennite. Acta Crystallogr. B, 27, 1871–1875.
—, — (1973): The crystal structure of julgoldite. Mineral. Mag., 39,
371–281.
Artioli, G. & Geiger, C.A. (1994): The crystal chemistry of pumpel-
lyite: an X-ray Rietveld refinement and 57Fe Mossbauer study.
Phys. Chem. Minerals, 20, 443–453.
Artioli, G., Pavese, A., Belotto, M., Collins, S.P., Luchetti, G.
(1996): Mn crystal chemistry in pumpellyite: a resonant-scatter-
ing powder diffraction Rietveld study using synchrotron radia-
tion. Am. Mineral., 81, 603–610.
Bastin, G.F., van Loo, F.J.J., Heijlingers, H.J.M. (1984): Evaluation
of the use of Gaussian f(rz) curves in quantitative electron
probe microanalysis: a new optimization. X-ray Spectrom., 13,
91–97.
Bastin, G.F., Heijlingers, H.J.M., van Loo, F.J.J. (1986): A further
improvement in the Gaussian f(rz) approach for matrix correc-
tion in quantitative electron probe microanalysis. Scanning, 8,
45–67.
Baur, H. (1974): The geometry of polyhedral distortions. Predictive
relationships for the phosphate group. Acta Crystallogr. B, 30,
1195–1215.
Brese, N.E. & O’Keeffe, M. (1991): Bond-valence parameters for
solids. Acta Crystallogr. B, 47, 192–197.
Brigatti, M.F., Caprilli, E., Marchesini, M. (2006): Poppiite, the V3þ
end-member of the pumpellyite group: description and crystal
structure. Am. Mineral., 91, 584–588.
Brown, I.D. & Altermatt, D. (1985): Bond-valence parameters
obtained from a systematic analysis of the inorganic crystal
structure database. Acta Crystallogr. B, 41, 244–247.
Bruker (1999): SMART and SAINT-Plus. Versions 6.01. Bruker
AXS Inc., Madison, WI, USA.
Cornelius, H.P. (1935): Geologie der Err-Julier-Gruppe I. Teil: Das
Baumaterial (Stratigraphie und Petrographie, excl. Quartar).
Beitrage zur Geologischen Karte der Schweiz. Neue Folge, 70.
I. Teil., Geologische Kommission der Schweizerischen
Naturforschenden Gesellschaft, 321 p.
Deer, W.A., Howie, R.A., Zussman, J. (1986): Rock-forming miner-
als. 1B (2nd ed.), disilicates and ring silicates. Geological Society
Publishing House, UK, 629 p.
Enraf-Nonius (1983): Structure determination package (SDP) (com-
puter program). Enraf Nonius, Delft, The Netherlands.
Ferraris, G. & Ivaldi, G. (1988): Bond valence vs bond length in
O. . .O hydrogen bonds. Acta Crystallogr. B, 44, 341–344.
Ferraris, G., Mellini, M., Merlino, S. (1986): Polysomatism and the
classification of minerals. Rend. Soc. Ital. Mineral. Petrol., 44,
181–192.
The hydrogen-bond system in pumpellyite 341
eschweizerbartxxx_ingenta
Franks, F. (1973): Water: a comprehensive treatise, Vol. 2. Plenum,
New York, 684 p.
Hatert, F., Pasero, M., Perchiazzi, N., Theye, T. (2007): Pumpellyite-
(Al), a new mineral from Bertrix, Belgian Ardennes. Eur. J.
Mineral., 19, 247–253.
Ivanov, O.K., Arkhangel’skaya, V.A., Miroshnikova, L.O., Shilova,
T.A. (1981): Shuiskite, the chromium analogue of pumpellyite,
from the Bisersk deposit, Urals. Zap. Vses. Mineral. Obshchest,
110, 508–512 (in Russian).
Libowitzky, E. (1999): Correlation of O–H stretching frequencies
and O–H���O hydrogen bond lengths in minerals. Mh. Chem.,
130, 1047–1059.
Libowitzky, E. & Armbruster, T. (1995): Low-temperature phase
transitions and the role of hydrogen bonds in lawsonite. Am.
Mineral., 80, 1277–1285.
Libowitzky, E. & Rossman, G.R. (1996): FTIR spectroscopy of
lawsonite between 82 and 325 K. Am. Mineral., 81, 1080–1091.
Mellini, M., Merlino, S., Pasero, M. (1984): X-ray and HRTEM
study of sursassite: crystal structure, stacking disorder and sur-
sassite-pumpellyite intergrowth. Phys. Chem. Minerals, 10,
99–105.
Momma, K. & Izumi, F. (2008): VESTA: a three-dimensional
visualization system for electronic and structural analysis. J.
Appl. Crystallogr., 41, 653–658.
Moore, P.B., Shen, J., Araki, T. (1985): Crystal chemistry of the21 M3þ
2 f2 TO4ð Þ2� �
sheet: structural principles and crystal struc-
tures of ruizite, macfallite and orientite. Am. Mineral., 70,
171–181.
Nagashima, M. & Akasaka, M. (2007): The distribution of chromium
in chromian pumpellyite from Sarany, Urals, Russia: a TOF
neutron and X-ray Rietveld study. Can. Mineral., 45, 837–846.
Nagashima, M., Ishida, T., Akasaka, M. (2006): Distribution of Fe
among octahedral sites and its effect on the crystal structure of
pumpellyite. Phys. Chem. Minerals, 33, 178–191.
Nagashima, M., Rahmoun, N.-S., Alekseev, E.V., Geiger, C.A.,
Armbruster, T., Akasaka, M. (2008): Crystal chemistry of
macfallite: relationships to sursassite and pumpellyite. Am.
Mineral., 93, 1851–1857.
Nagashima, M., Akasaka, M., Minakawa, T., Libowitzky, E.,
Armbruster, T. (2009): Sursassite: hydrogen bonding, cation
order, and pumpellyite intergrowth. Am. Mineral., 94,
1440–1449.
Nagashima, M., Akasaka, M., Ikeda, K., Kyono, A., Makino, K. (in
press): X-ray single-crystal and optical study of chromian pum-
pellyite from Sarany, Urals, Russia. J. Mineral. Petrol. Sci.
Nyfeler, D. & Armbruster, T. (1998): Silanol groups in minerals and
inorganic compounds. Am. Mineral., 83, 119–125.
Nyfeler, D., Hoffmann, C., Armbruster, T., Kunz, M., Libowitzky,
E. (1997): Orthorhombic Jahn-Teller distortion and Si–OH in
mozartite, CaMn3þO[SiO3OH]: a single-crystal X-ray, FTIR,
and structure modelling study. Am. Mineral., 82, 841–848.
Packwood, R.H. & Brown, J.D. (1981): A Gaussian expression to
describe f(rz) curves for quantitative electron probe microana-
lysis. X-ray Spectrom., 10, 138–146.
Passaglia, E. & Gottardi, G. (1973): Crystal chemistry and nomen-
clature of pumpellyites and julgoldites. Can. Mineral., 12,
219–223.
Robinson, K., Gibbs, G.V., Ribbe, P.H. (1971): Quadratic elonga-
tion: a quantitative measure of distortion in coordination poly-
hedra. Science, 172, 567–570.
Sheldrick, G.M. (1996): SADABS. University of Gottingen,
Germany.
— (2008): A short history of SHELX. Acta Crystallgr. A, 64,
112–122.
Yoshiasa, A. & Matsumoto, T. (1985): Crystal structure refinement
and crystal chemistry of pumpellyite. Am. Mineral., 70,
1011–1019.
Received 15 July 2009
Modified version received 22 February 2010
Accepted 9 March 2010
342 M. Nagashima, T. Armbruster, E. Libowitzky
Related Documents