The Journal of Nutrition Genomics, Proteomics, and Metabolomics The Human Milk Metabolome Reveals Diverse Oligosaccharide Profiles 1–3 Jennifer T. Smilowitz, 4,6 Aifric OÕSullivan, 4–7 Daniela Barile, 4,6 J. Bruce German, 4,6 Bo Lo ¨ nnerdal, 5,6 and Carolyn M. Slupsky 4–6 * Departments of 4 Food Science and Technology, 5 Nutrition, and 6 Foods for Health Institute, University of California, Davis, Davis, CA Abstract Breast milk delivers nutrition and protection to the developing infant. There has been considerable research on the large molecular weight milk components; however, low-molecular-weight metabolites have received less attention. To determine the effect of maternal phenotype and diet on the human milk metabolome, milk collected at day 90 postpartum from 52 healthy women was analyzed by using proton nuclear magnetic resonance spectroscopy. Sixty-five milk metabolites were quantified (mono-, di-, and oligosaccharides; amino acids and derivatives; energy metabolites; fatty acids and associated metabolites; vitamins, nucleotides, and derivatives; and others). The biological variation represented as the percentage CV of each metabolite varied widely (4–120%), with several metabolites having low variation (<20%), including lactose, urea, glutamate, myo-inositol, and creatinine. Principal components analysis identified 2 clear groups of participants who were differentiable on the basis of milk oligosaccharide concentration and who were classified as secretors or nonsecretors of the fucosyltransferase 2 (FUT2) gene according to the concentration of 2#-fucosyllactose, lactodifucotetraose, and lacto-N-fucopentaose I. Exploration of the interrelations between the milk sugars by using Spearman rank correlations revealed significant positive and negative associations, including positive correlations between fucose and products of the FUT2 gene and negative correlations between fucose and products of the FUT3 gene. The total concentration of milk oligosaccharides was conserved among participants (%CV = 18%), suggesting tight regulation of total oligosaccharide production; however, concentrations of specific oligosaccharides varied widely between participants (%CV = 30.4–84.3%). The variability in certain milk metabolites suggests possible roles in infant or infant gut microbial development. This trial was registered at clinicaltrials.gov as NCT01817127. J. Nutr. doi: 10.3945/jn.113.178772. Introduction For the developing infant, breast milk provides specific physi- ologic advantages over other sources of nutrition. Milk contains proteins, fats, carbohydrates, electrolytes, water, micronutrients, and organic molecules, that when ingested support infant growth by acting upon specific metabolic, immunologic, phys- iologic, and bacterial targets (1). The mammary gland synthe- sizes and transports many components including oligosaccharides both free and conjugated to lipids and proteins, intact immune and immunomodulatory cells, toxin-binding and growth fac- tors, and a wide range of small molecule metabolites, all of which are presumed to promote health, growth, development, and protection of the neonate (2–5). Furthermore, breast milk is proposed to promote immunologic programming of infants through the delivery of viable microbes (6). Understanding both the composition and function of the components of milk is vital to infant health. However, whereas much research has been performed on the highly abundant components of human milk, a complete understanding of all of its components is lacking, particularly of the metabolites present in milk. Metabolites in milk come from both maternal blood and de novo synthesis in the mammary gland (7) and are influenced by the metabolic states of both the mammary gland and the lac- tating mother (8). This influence is so acute that milk has been used to monitor bovine health through measurement of acetone and acetoacetate concentrations as indicators of subclinical ketosis (9). Human milk oligosaccharides (HMOs) 8 have been associated with diverse benefits to infants by promoting specific bacterial 1 Supported in part by the University of California Discovery Program (05GEB01NHB), the NIH (HD059127 and HD061923), and the California Dairy Research Foundation. 2 Author disclosures: J. T. Smilowitz, A. OÕSullivan, D. Barile, J. B. German, B. Lo ¨ nnerdal, and C. M. Slupsky, no conflicts of interest. 3 Supplemental Tables 1 and 2 are available from the ‘‘Online Supporting Material’’ link in the online posting of the article and from the same link in the online table of contents at http://jn.nutrition.org. 7 Present address: UCD Institute of Food and Health, University College Dublin, Belfield, Dublin 4, Ireland. * To whom correspondence should be addressed. E-mail: [email protected]. 8 Abbreviations used: FUT, fucosyltransferase; HMO, human milk oligosac- charide; LDFT, lactodifucotetraose; LNFP, lacto-N-fucopentaose; LNnT, lacto- N-neotetraose; LNT, lacto-N-tetraose; NMR, nuclear magnetic resonance; PAL, physical activity level; PCA, principal components analysis; PLS-DA, partial least squares–discriminant analysis; UC-Davis, University of California, Davis; VIP, variable importance to the projection; 2#-FL, 2#-fucosyllactose; 3#-FL, 3#-fucosyllactose; 3#-SL, 3#-sialyllactose; 6#-SL, 6#-sialyllactose. ã 2013 American Society for Nutrition. Manuscript received April 19, 2013. Initial review completed June 15, 2013. Revision accepted August 26, 2013. 1 of 10 doi: 10.3945/jn.113.178772. The Journal of Nutrition. First published ahead of print September 11, 2013 as doi: 10.3945/jn.113.178772. Copyright (C) 2013 by the American Society for Nutrition at UNIVERSITY OF CALIFORNIA DAVIS on September 16, 2013 jn.nutrition.org Downloaded from

Welcome message from author
This document is posted to help you gain knowledge. Please leave a comment to let me know what you think about it! Share it to your friends and learn new things together.
Transcript

The Journal of Nutrition
Genomics, Proteomics, and Metabolomics
The Human Milk Metabolome Reveals DiverseOligosaccharide Profiles1–3
Jennifer T. Smilowitz,4,6 Aifric O�Sullivan,4–7 Daniela Barile,4,6 J. Bruce German,4,6 Bo Lonnerdal,5,6
and Carolyn M. Slupsky4–6*
Departments of 4Food Science and Technology, 5Nutrition, and 6Foods for Health Institute, University of California, Davis, Davis, CA
Abstract
Breast milk delivers nutrition and protection to the developing infant. There has been considerable research on the large
molecular weight milk components; however, low-molecular-weight metabolites have received less attention. To
determine the effect of maternal phenotype and diet on the humanmilk metabolome, milk collected at day 90 postpartum
from 52 healthy women was analyzed by using proton nuclear magnetic resonance spectroscopy. Sixty-five milk
metaboliteswere quantified (mono-, di-, and oligosaccharides; amino acids and derivatives; energymetabolites; fatty acids
and associatedmetabolites; vitamins, nucleotides, and derivatives; and others). The biological variation represented as the
percentage CV of each metabolite varied widely (4–120%), with several metabolites having low variation (<20%),
including lactose, urea, glutamate,myo-inositol, and creatinine. Principal components analysis identified 2 clear groups of
participants who were differentiable on the basis of milk oligosaccharide concentration and who were classified as
secretors or nonsecretors of the fucosyltransferase 2 (FUT2) gene according to the concentration of 2#-fucosyllactose,
lactodifucotetraose, and lacto-N-fucopentaose I. Exploration of the interrelations between the milk sugars by using
Spearman rank correlations revealed significant positive and negative associations, including positive correlations
between fucose and products of the FUT2 gene and negative correlations between fucose and products of the FUT3 gene.
The total concentration of milk oligosaccharides was conserved among participants (%CV = 18%), suggesting tight regulation
of total oligosaccharide production; however, concentrations of specific oligosaccharides varied widely between participants
(%CV = 30.4–84.3%). The variability in certain milk metabolites suggests possible roles in infant or infant gut microbial
development. This trial was registered at clinicaltrials.gov as NCT01817127. J. Nutr. doi: 10.3945/jn.113.178772.
Introduction
For the developing infant, breast milk provides specific physi-ologic advantages over other sources of nutrition. Milk containsproteins, fats, carbohydrates, electrolytes, water, micronutrients,and organic molecules, that when ingested support infantgrowth by acting upon specific metabolic, immunologic, phys-iologic, and bacterial targets (1). The mammary gland synthe-sizes and transports many components including oligosaccharidesboth free and conjugated to lipids and proteins, intact immuneand immunomodulatory cells, toxin-binding and growth fac-tors, and a wide range of small molecule metabolites, all ofwhich are presumed to promote health, growth, development,and protection of the neonate (2–5). Furthermore, breast milk is
proposed to promote immunologic programming of infantsthrough the delivery of viable microbes (6). Understanding boththe composition and function of the components of milk is vitalto infant health. However, whereas much research has beenperformed on the highly abundant components of humanmilk, acomplete understanding of all of its components is lacking,particularly of the metabolites present in milk.
Metabolites in milk come from both maternal blood and denovo synthesis in the mammary gland (7) and are influenced bythe metabolic states of both the mammary gland and the lac-tating mother (8). This influence is so acute that milk has beenused to monitor bovine health through measurement of acetoneand acetoacetate concentrations as indicators of subclinicalketosis (9).
Humanmilk oligosaccharides (HMOs)8 have been associatedwith diverse benefits to infants by promoting specific bacterial
1 Supported in part by the University of California Discovery Program
(05GEB01NHB), the NIH (HD059127 and HD061923), and the California Dairy
Research Foundation.2 Author disclosures: J. T. Smilowitz, A. O�Sullivan, D. Barile, J. B. German,
B. Lonnerdal, and C. M. Slupsky, no conflicts of interest.3 Supplemental Tables 1 and 2 are available from the ‘‘Online Supporting
Material’’ link in the online posting of the article and from the same link in the
online table of contents at http://jn.nutrition.org.7 Present address: UCD Institute of Food and Health, University College Dublin,
Belfield, Dublin 4, Ireland.
* To whom correspondence should be addressed. E-mail: [email protected].
8 Abbreviations used: FUT, fucosyltransferase; HMO, human milk oligosac-
charide; LDFT, lactodifucotetraose; LNFP, lacto-N-fucopentaose; LNnT, lacto-
N-neotetraose; LNT, lacto-N-tetraose; NMR, nuclear magnetic resonance; PAL,
physical activity level; PCA, principal components analysis; PLS-DA, partial least
squares–discriminant analysis; UC-Davis, University of California, Davis; VIP, variable
importance to the projection; 2#-FL, 2#-fucosyllactose; 3#-FL, 3#-fucosyllactose;3#-SL, 3#-sialyllactose; 6#-SL, 6#-sialyllactose.
ã 2013 American Society for Nutrition.
Manuscript received April 19, 2013. Initial review completed June 15, 2013. Revision accepted August 26, 2013. 1 of 10doi: 10.3945/jn.113.178772.
The Journal of Nutrition. First published ahead of print September 11, 2013 as doi: 10.3945/jn.113.178772.
Copyright (C) 2013 by the American Society for Nutrition
at UN
IVE
RS
ITY
OF
CA
LIFO
RN
IA D
AV
IS on S
eptember 16, 2013
jn.nutrition.orgD
ownloaded from

colonization of the infant gastrointestinal tract. These HMOsare complex sugars containing a lactose core bound to $1 glu-cose, galactose, N-acetylglucosamine, fucose, or sialic acidresidues (5). Fucose residues may be attached to HMOs by ana1,2-linkage, which is catalyzed by a fucosyltransferase genet-ically encoded by the secretor gene (FUT2) or via a1,3- or a1,4-linkages, which are catalyzed by the Lewis gene (FUT3) family (10).In some individuals, allelic variation in the FUT2 gene results in lowor undetectable concentrations of a1,2-linked fucosylated HMOssuch as 2#-fucosyllactose (2#-FL), lactodifucotetraose (LDFT),lacto-N-fucopentaose (LNFP) I, or lacto-N-difucohexose I; andthese individuals are referred to as ‘‘nonsecretors’’ (11–17). Milkproduced from secretor mothers has been shown to be protectiveagainst diarrhea in their infants (18), including diarrhea caused bycampylobacter and calicivirus (19). In adults, secretor status wasshown to be associated with the diversity and composition of thegastrointestinal microbiota (20) and implicated in protectionagainst celiac disease (21). With the growing realization of theabundant functions and health consequences of oligosaccharides,studies are beginning to address the diversity and function of me-tabolites of human milk.
Here we report the composition of abundant human milkmetabolites measured by NMR of mature milk collected at day90 postpartum from 52 healthy, lactating women who gave birthto singleton term healthy infants. We hypothesized that interin-dividual variation in the milk metabolome is largely explainedby maternal secretor status, phenotype, and diet. We discuss theimpact of maternal phenotype and diet on the milk metabolomeand postulate the role that various milk metabolites may play inthe developing infant.
Participants and Methods
Participants. Milk samples were obtained from 52 healthy women en-
rolled in the Foods for Health Institute Lactation Study at the University
of California, Davis (UC-Davis). Participants were enrolled at 34- to
38-week gestation and asked to fill out detailed health history question-naires regarding demographic and anthropometric characteristics, preg-
nancy history, current and prior health history, dietary habits and
restrictions, physical activity level (PAL), as well as medication and
supplementation intake history. Reported physical activity, intensity, andfrequency were converted into metabolic equivalents (22), which were
used to calculate the impact of each reported physical activity on energy
expenditure (D PAL). The PAL was calculated as follows: 1.1 + sum ofDPALi, where DPALi is the list of each reported activity affect on energy
expenditure (DPAL) (23). Half of the participants also completed an
online Muldoon Omega-3 FFQ that contains 444 items (Modified Block
2006–Bodnar FFQ, 2006; NutritionQuest/Block Dietary Data Systems).Participants reported the mode of delivery of their infants (C-section vs.
vaginal) and infant sex, weight, length, and gestational age at birth; and
filled out questionnaires regarding their health and the health of their
infants as well as their diet throughout the study. Participants receivedlactation support and training on proper sample collection from the
study�s lactation consultant. At day 60 postpartum, participants visited
the UC-Davis Ragle Human Nutrition Center to provide a fasting bloodsample, and heart rate, blood pressure, weight, and height were mea-
sured. BMI measured at day 60 postpartum was used as a surrogate for
maternal weight at day 90 because maternal weight loss between 1 to 3
mo postpartum has been shown to be steady (24). The UC-Davis Ins-titutional Review Board approved all aspects of the study, and informed
consent was obtained from all participants.
Human milk samples. Participants were instructed to write on allsample tubes the time, date of collection, time of last meal before col-
lection, and contents of the meals. Samples were considered fasted if milk
collection occurred $10 h after the participant consumed her last meal
and postprandial if milk collection occurred within 4 h of the last meal.
From all participants delivering full-term infants, milk samples were
collected in the morning on day 90 postpartum according to a modified
published method (25) involving milk collection from 1 breast by using aHarmony Manual Breast pump (Medela Inc.) by the participant 2–4 h
after feeding her infant. Participants fully pumped 1 breast into a bottle,
inverted 6 times, separated into 12-mL aliquots into a 15-mL polypro-
pylene tube, and subsequently froze the sample in the kitchen freezer(220�C). Samples were picked up, transported to the laboratory on
dry ice, and stored at 280�C until processing.
Sample preparation and analytical repeatability. The methodologicprecision associated with sample preparation and NMR measurement
were determined by preparing and analyzing 8 milk samples that were
separated into aliquots in triplicate for a total of 24 samples. The
researchers were blinded to the experiment, and the samples wereprepared and analyzed in a random order. The identity of each sample
was unblinded only after analysis was completed.
Sample preparation. Milk samples were prepared for NMR analysis by
removing them from 280�C storage and defrosting at room temperature.
Each sample (1 mL) was centrifuged, and the aqueous layer carefullyremoved and filtered through a 3000molecular weight cutoff filter (Amicon
Ultra-0.5; Millipore) composed of low-protein-binding regenerated cellu-
lose to remove lipids and proteins. To 585 mL of filtrate, 65 mL of internal
standard containing 5 mmol/L 3-(trimethylsilyl)-1-propanesulfonic acid-d6and 0.2% NaN3 in 99.8% D2O was added. The pH of each sample was
adjusted to 6.8 6 0.1 by adding small amounts (1 mL at a time) of NaOH
or HCl after adding the internal standard to minimize pH-based peak
movement and to ensure easier compound identification and quantification.A 600-mL aliquot was transferred to a 5-mm Bruker NMR tube and stored
at 4�C until NMR acquisition (within 24 h of sample preparation).
Data acquisition and analysis. 1H NMR spectra were acquired as
previously described (26) on a Bruker Avance 600-MHz NMR equipped
with a SampleJet autosampler using a NOESY-presaturation pulsesequence (noesypr) at 25�C. Water saturation was achieved during the
prescan delay (2.5 s) and mixing time (100 ms). Spectra were acquired
with 8 dummy scans and 32 transients over a spectral width of 12 ppm
with a total acquisition time of 2.5 s. Once acquired, all spectra werezero-filled to 128-k data points, Fourier transformed with a 0.5-Hz line
broadening applied, and manually phased and baseline corrected by
using an NMR Suite v7.1 Processor (Chenomx). Metabolite quantifica-
tion was achieved as previously described (27) by using a combinationof the 600-MHz library from a Chenomx NMR Suite v7.1 Profiler and
an in-house library of metabolites prepared by analytically weighing
out pure material, dissolving in a precise concentration of 5 mmol/L
potassium phosphate buffer (pH 6.8), acquiring NMR data as describedabove, and creating a new compound by using a combination of Spin
Simulator and Compound Builder in Chenomx NMR Suite v7.1. Final
reported metabolite concentrations were obtained after correcting fordilution by the added internal standard. The correction factor used to
calculate the actual metabolite concentration was the final sample
volume (650 mL) divided by the initial volume of milk filtrate (585 mL).
Unless otherwise indicated, all concentrations are presented as mmol/Land reported as means 6 SDs.
Statistical analyses. Statistical procedures were conducted by using a
combination of Simca v13 (MKS Umetrics AB), SPSS version 20.0 for
Windows, Prism v6.0 (GraphPad Software Inc.) and R (R Development
Core Team, 2013; http://www.R-project.org). Means6 SDs are reportedfor participant characteristics, diet activity, and metabolite concentra-
tion, as well as percentage CV (%CV) for metabolites. For multivariate
analysis, all metabolite variables were log10 transformed before analysis.Methodologic precision associated with sample preparation and NMR
measurement combined were determined as described above and reported
as the means6 SDs of the%CV for each of 8 different triplicate samples.
Measurement error by NMR has previously been published and shownto be low for metabolites that are not volatile and do not interact with
the sample matrix, with citrate being the least accurate (;20% error) of
all metabolites due to the effects of pH and ionic strength (particularly
2 of 10 Smilowitz et al.
at UN
IVE
RS
ITY
OF
CA
LIFO
RN
IA D
AV
IS on S
eptember 16, 2013
jn.nutrition.orgD
ownloaded from
divalent cation concentration) altering its spectral characteristics and
hence quantitative accuracy (26).
Principal components analysis (PCA) and partial least-squares dis-criminant analysis (PLS-DA) were used to explore the relations within
the milk metabolome. Variable importance to the projection (VIP) values
were used to identify discriminating metabolites. To predict the post-
prandial state of the participant, forward logistic regression was per-formed by using a set of metabolites from various biofluids associated
with the postprandial and fasted states (28–34). To explore relations
between milk metabolites, Spearman rank correlations were performed
on milk sugars and subsets of metabolites reported in the literature to beassociated with diet, physical activity, and BMI (Table 1) (35–47). A heat
map was generated on the Spearman rank correlations (r) of milk sugars
by using R (package ‘‘corrplot’’). The a level was set at 0.05.
Results
Self-reported participant demographic and pregnancy historydata are shown in Supplemental Table 1. Most women werewhite and delivered their infant vaginally. Approximately equalnumbers of male and female infants were born. Maternal habi-tual diet at enrollment, reported activity level before pregnancyand at enrollment, clinical characteristics measured on day 60postpartum, and infant gestational age, weight, and length atbirth are reported in Supplemental Table 2. Throughout thestudy, all infants were healthy and did not experience any ill-nesses related to feeding.
A total of 65 metabolites were identified from NMR spectraof human milk samples. These metabolites were classified asfollows: sugars, amino acids and derivatives, energy metabolites,fatty acids and associated metabolites, vitamins, nucleotides andderivatives, and others (Table 2). Of these metabolites, 14 wereclassified as sugars, including monosaccharides (glucose, galac-tose, and fucose), disaccharides (lactose), and oligosaccharides[2#-FL, 3#-fucosyllactose (3#-FL), 3#-sialyllactose (3#-SL), 6#-sialyllactose (6#-SL), LDFT, LNFP I, LNFP II, LNFP III, lacto-N-neotetraose (LNnT), and lacto-N-tetraose (LNT)]; 21 were relevantto amino acid metabolism and nitrogen balance (2-aminobutyrate,acetylcarnitine, alanine, asparagine, aspartate, betaine, carnitine,
glutamate, glutamine, histidine, isoleucine, leucine, lysine, phen-ylalanine, proline, taurine, threonine, tryptophan, tyrosine,urea, valine); 11 were associated with glycolysis, tricarboxylicacid cycle intermediates, and products of energy metabolism(2-oxoglutarate, acetone, cis-aconitate, citrate, creatine, creatinephosphate, creatinine, fumarate, lactate, pyruvate, succinate);and the rest were linked with metabolic processes involvingfatty acids, vitamins or nucleic acids, and microbial metabolism(acetate, azelate, butyrate, caprate, caprylate, choline, ethanol-amine, glycero-3-phosphate, myo-inositol, phosphocholine, as-corbate, niacinamide, pantothenate, cytidine, hypoxanthine,uridine, formate, hippurate, methanol). Accurate quantitationof several metabolites byNMR, including glycine, serine, cysteine,cystine, arginine, methionine, and sialic acid, was difficult due totheir low concentrations or severe spectral overlap and was thusnot reported. In addition, several oligosaccharides were notmeasured because commercial standards were not available.
To determine the extent of methodologic precision, 8 randommilk samples were separated into aliquots in triplicate andfrozen before analysis (for a total of 24 samples). Each triplicatemilk sample was individually prepared and analyzed blinded.The average %CV for the triplicate sample analysis was ;5%(Table 2). Metabolites with the highest methodologic %CV (10–15%) were galactose, histidine, fumarate, and hypoxanthine.These results support that NMR spectroscopy has good repro-ducibility and provides a reference point to allow comparison ofbiological variability.
The most abundant category of milk metabolites was sugars,of which lactose dominated at a concentration of;170 mmol/L.The next most abundant metabolites were also sugars and in-cluded the oligosaccharides: 2#-FL, 3#-FL, and LNT. Otherabundant metabolites in humanmilk included urea (;4mmol/L),citrate (;3 mmol/L), and glutamate (;2 mmol/L) (48–50). Thebiological variation among this cohort of women estimated bythe %CV for each metabolite was relatively high (>30%). Yet, ahandful of metabolites had moderate to low%CVs (#25%) andincluded lactose (4%), urea (18%), creatinine (20%), glutamate(20%), myo-inositol (20%), valine (23%), and citrate (25%).
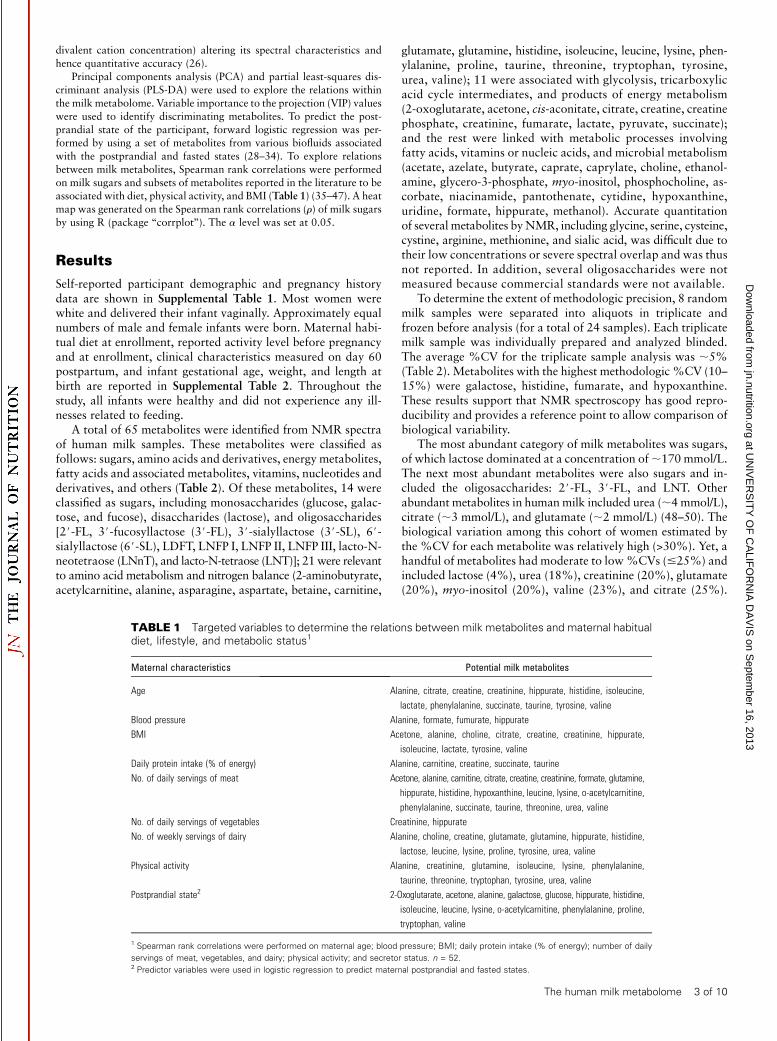
TABLE 1 Targeted variables to determine the relations between milk metabolites and maternal habitualdiet, lifestyle, and metabolic status1
Maternal characteristics Potential milk metabolites
Age Alanine, citrate, creatine, creatinine, hippurate, histidine, isoleucine,
lactate, phenylalanine, succinate, taurine, tyrosine, valine
Blood pressure Alanine, formate, fumurate, hippurate
BMI Acetone, alanine, choline, citrate, creatine, creatinine, hippurate,
isoleucine, lactate, tyrosine, valine
Daily protein intake (% of energy) Alanine, carnitine, creatine, succinate, taurine
No. of daily servings of meat Acetone, alanine, carnitine, citrate, creatine, creatinine, formate, glutamine,
hippurate, histidine, hypoxanthine, leucine, lysine, o-acetylcarnitine,
phenylalanine, succinate, taurine, threonine, urea, valine
No. of daily servings of vegetables Creatinine, hippurate
No. of weekly servings of dairy Alanine, choline, creatine, glutamate, glutamine, hippurate, histidine,
lactose, leucine, lysine, proline, tyrosine, urea, valine
Physical activity Alanine, creatinine, glutamine, isoleucine, lysine, phenylalanine,
taurine, threonine, tryptophan, tyrosine, urea, valine
Postprandial state2 2-Oxoglutarate, acetone, alanine, galactose, glucose, hippurate, histidine,
isoleucine, leucine, lysine, o-acetylcarnitine, phenylalanine, proline,
tryptophan, valine
1 Spearman rank correlations were performed on maternal age; blood pressure; BMI; daily protein intake (% of energy); number of daily
servings of meat, vegetables, and dairy; physical activity; and secretor status. n = 52.2 Predictor variables were used in logistic regression to predict maternal postprandial and fasted states.
The human milk metabolome 3 of 10
at UN
IVE
RS
ITY
OF
CA
LIFO
RN
IA D
AV
IS on S
eptember 16, 2013
jn.nutrition.orgD
ownloaded from
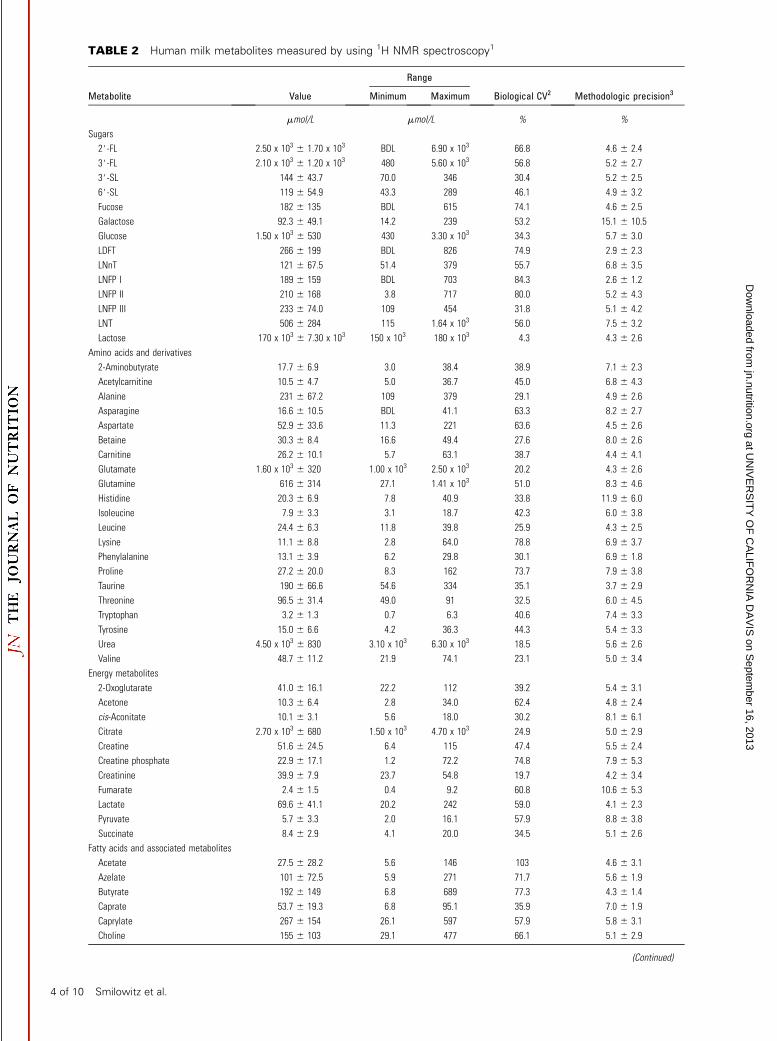
TABLE 2 Human milk metabolites measured by using 1H NMR spectroscopy1
Range
Metabolite Value Minimum Maximum Biological CV2 Methodologic precision3
mmol/L mmol/L % %
Sugars
2#-FL 2.50 x 10³ 6 1.70 x 10³ BDL 6.90 x 10³ 66.8 4.6 6 2.4
3#-FL 2.10 x 10³ 6 1.20 x 10³ 480 5.60 x 10³ 56.8 5.2 6 2.7
3#-SL 144 6 43.7 70.0 346 30.4 5.2 6 2.5
6#-SL 119 6 54.9 43.3 289 46.1 4.9 6 3.2
Fucose 182 6 135 BDL 615 74.1 4.6 6 2.5
Galactose 92.3 6 49.1 14.2 239 53.2 15.1 6 10.5
Glucose 1.50 x 10³ 6 530 430 3.30 x 10³ 34.3 5.7 6 3.0
LDFT 266 6 199 BDL 826 74.9 2.9 6 2.3
LNnT 121 6 67.5 51.4 379 55.7 6.8 6 3.5
LNFP I 189 6 159 BDL 703 84.3 2.6 6 1.2
LNFP II 210 6 168 3.8 717 80.0 5.2 6 4.3
LNFP III 233 6 74.0 109 454 31.8 5.1 6 4.2
LNT 506 6 284 115 1.64 x 10³ 56.0 7.5 6 3.2
Lactose 170 x 103 6 7.30 x 10³ 150 x 103 180 x 103 4.3 4.3 6 2.6
Amino acids and derivatives
2-Aminobutyrate 17.7 6 6.9 3.0 38.4 38.9 7.1 6 2.3
Acetylcarnitine 10.5 6 4.7 5.0 36.7 45.0 6.8 6 4.3
Alanine 231 6 67.2 109 379 29.1 4.9 6 2.6
Asparagine 16.6 6 10.5 BDL 41.1 63.3 8.2 6 2.7
Aspartate 52.9 6 33.6 11.3 221 63.6 4.5 6 2.6
Betaine 30.3 6 8.4 16.6 49.4 27.6 8.0 6 2.6
Carnitine 26.2 6 10.1 5.7 63.1 38.7 4.4 6 4.1
Glutamate 1.60 x 10³ 6 320 1.00 x 10³ 2.50 x 10³ 20.2 4.3 6 2.6
Glutamine 616 6 314 27.1 1.41 x 10³ 51.0 8.3 6 4.6
Histidine 20.3 6 6.9 7.8 40.9 33.8 11.9 6 6.0
Isoleucine 7.9 6 3.3 3.1 18.7 42.3 6.0 6 3.8
Leucine 24.4 6 6.3 11.8 39.8 25.9 4.3 6 2.5
Lysine 11.1 6 8.8 2.8 64.0 78.8 6.9 6 3.7
Phenylalanine 13.1 6 3.9 6.2 29.8 30.1 6.9 6 1.8
Proline 27.2 6 20.0 8.3 162 73.7 7.9 6 3.8
Taurine 190 6 66.6 54.6 334 35.1 3.7 6 2.9
Threonine 96.5 6 31.4 49.0 91 32.5 6.0 6 4.5
Tryptophan 3.2 6 1.3 0.7 6.3 40.6 7.4 6 3.3
Tyrosine 15.0 6 6.6 4.2 36.3 44.3 5.4 6 3.3
Urea 4.50 x 10³ 6 830 3.10 x 10³ 6.30 x 10³ 18.5 5.6 6 2.6
Valine 48.7 6 11.2 21.9 74.1 23.1 5.0 6 3.4
Energy metabolites
2-Oxoglutarate 41.0 6 16.1 22.2 112 39.2 5.4 6 3.1
Acetone 10.3 6 6.4 2.8 34.0 62.4 4.8 6 2.4
cis-Aconitate 10.1 6 3.1 5.6 18.0 30.2 8.1 6 6.1
Citrate 2.70 x 10³ 6 680 1.50 x 10³ 4.70 x 10³ 24.9 5.0 6 2.9
Creatine 51.6 6 24.5 6.4 115 47.4 5.5 6 2.4
Creatine phosphate 22.9 6 17.1 1.2 72.2 74.8 7.9 6 5.3
Creatinine 39.9 6 7.9 23.7 54.8 19.7 4.2 6 3.4
Fumarate 2.4 6 1.5 0.4 9.2 60.8 10.6 6 5.3
Lactate 69.6 6 41.1 20.2 242 59.0 4.1 6 2.3
Pyruvate 5.7 6 3.3 2.0 16.1 57.9 8.8 6 3.8
Succinate 8.4 6 2.9 4.1 20.0 34.5 5.1 6 2.6
Fatty acids and associated metabolites
Acetate 27.5 6 28.2 5.6 146 103 4.6 6 3.1
Azelate 101 6 72.5 5.9 271 71.7 5.6 6 1.9
Butyrate 192 6 149 6.8 689 77.3 4.3 6 1.4
Caprate 53.7 6 19.3 6.8 95.1 35.9 7.0 6 1.9
Caprylate 267 6 154 26.1 597 57.9 5.8 6 3.1
Choline 155 6 103 29.1 477 66.1 5.1 6 2.9
(Continued)
4 of 10 Smilowitz et al.
at UN
IVE
RS
ITY
OF
CA
LIFO
RN
IA D
AV
IS on S
eptember 16, 2013
jn.nutrition.orgD
ownloaded from
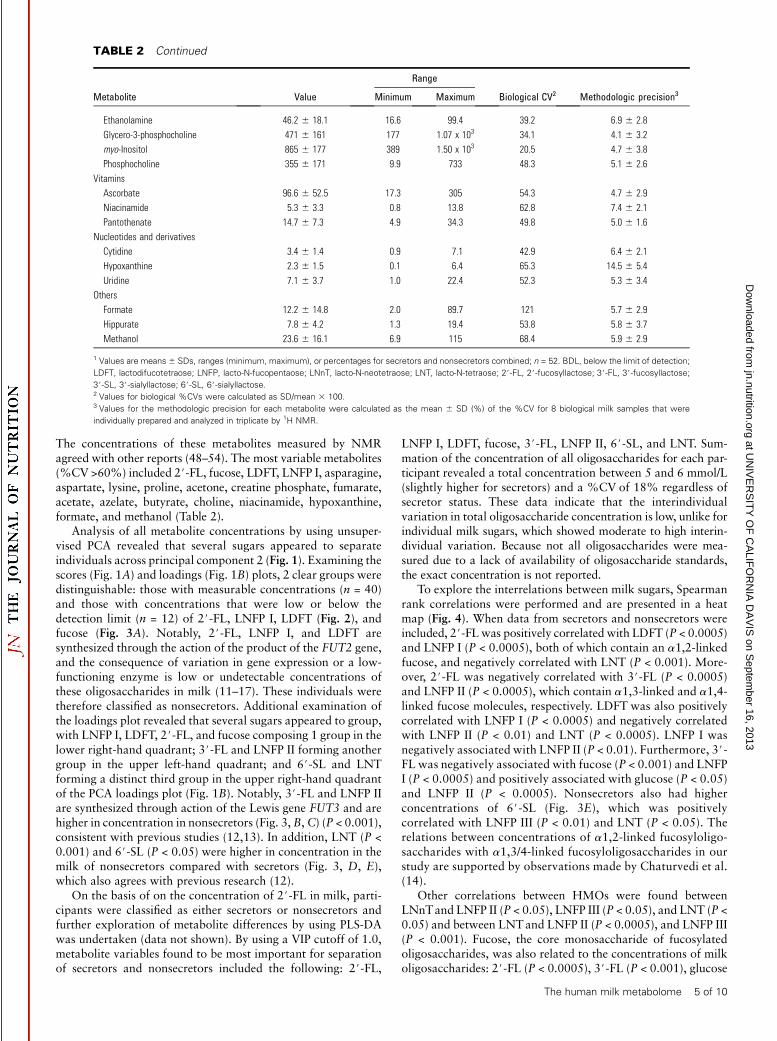
The concentrations of these metabolites measured by NMRagreed with other reports (48–54). The most variable metabolites(%CV >60%) included 2#-FL, fucose, LDFT, LNFP I, asparagine,aspartate, lysine, proline, acetone, creatine phosphate, fumarate,acetate, azelate, butyrate, choline, niacinamide, hypoxanthine,formate, and methanol (Table 2).
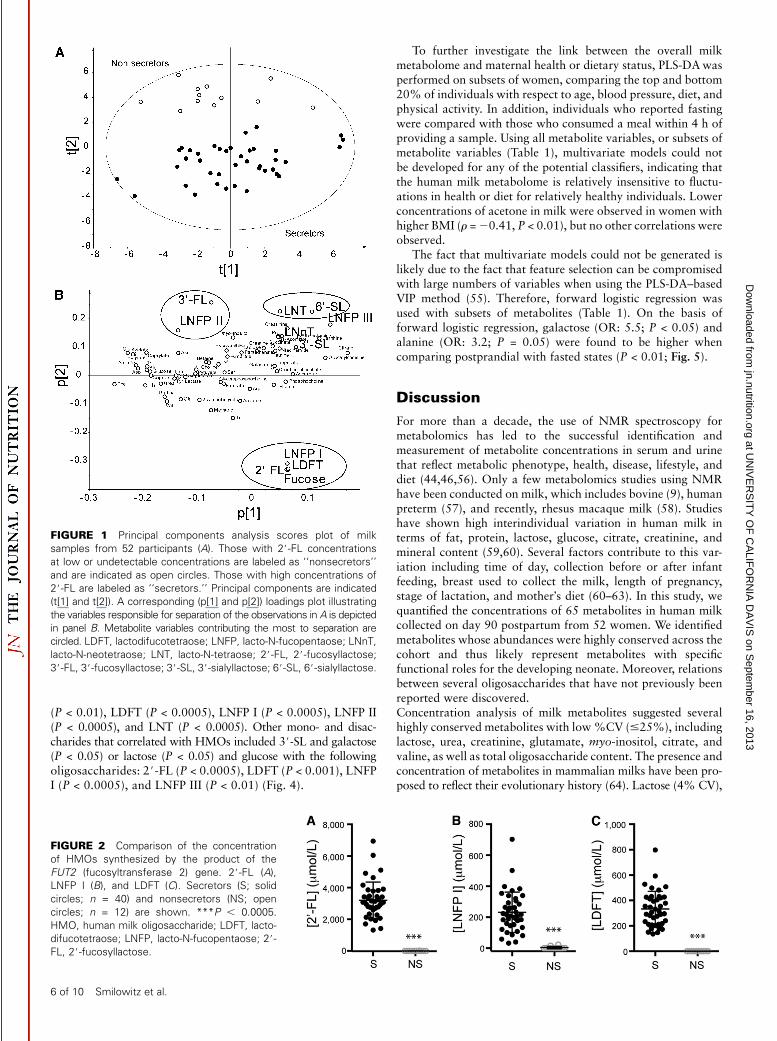
Analysis of all metabolite concentrations by using unsuper-vised PCA revealed that several sugars appeared to separateindividuals across principal component 2 (Fig. 1). Examining thescores (Fig. 1A) and loadings (Fig. 1B) plots, 2 clear groups weredistinguishable: those with measurable concentrations (n = 40)and those with concentrations that were low or below thedetection limit (n = 12) of 2#-FL, LNFP I, LDFT (Fig. 2), andfucose (Fig. 3A). Notably, 2#-FL, LNFP I, and LDFT aresynthesized through the action of the product of the FUT2 gene,and the consequence of variation in gene expression or a low-functioning enzyme is low or undetectable concentrations ofthese oligosaccharides in milk (11–17). These individuals weretherefore classified as nonsecretors. Additional examination ofthe loadings plot revealed that several sugars appeared to group,with LNFP I, LDFT, 2#-FL, and fucose composing 1 group in thelower right-hand quadrant; 3#-FL and LNFP II forming anothergroup in the upper left-hand quadrant; and 6#-SL and LNTforming a distinct third group in the upper right-hand quadrantof the PCA loadings plot (Fig. 1B). Notably, 3#-FL and LNFP IIare synthesized through action of the Lewis gene FUT3 and arehigher in concentration in nonsecretors (Fig. 3,B,C) (P < 0.001),consistent with previous studies (12,13). In addition, LNT (P <0.001) and 6#-SL (P < 0.05) were higher in concentration in themilk of nonsecretors compared with secretors (Fig. 3, D, E),which also agrees with previous research (12).
On the basis of on the concentration of 2#-FL in milk, parti-cipants were classified as either secretors or nonsecretors andfurther exploration of metabolite differences by using PLS-DAwas undertaken (data not shown). By using a VIP cutoff of 1.0,metabolite variables found to be most important for separationof secretors and nonsecretors included the following: 2#-FL,
LNFP I, LDFT, fucose, 3#-FL, LNFP II, 6#-SL, and LNT. Sum-mation of the concentration of all oligosaccharides for each par-ticipant revealed a total concentration between 5 and 6 mmol/L(slightly higher for secretors) and a %CV of 18% regardless ofsecretor status. These data indicate that the interindividualvariation in total oligosaccharide concentration is low, unlike forindividual milk sugars, which showed moderate to high interin-dividual variation. Because not all oligosaccharides were mea-sured due to a lack of availability of oligosaccharide standards,the exact concentration is not reported.
To explore the interrelations between milk sugars, Spearmanrank correlations were performed and are presented in a heatmap (Fig. 4). When data from secretors and nonsecretors wereincluded, 2#-FL was positively correlated with LDFT (P < 0.0005)and LNFP I (P < 0.0005), both of which contain an a1,2-linkedfucose, and negatively correlated with LNT (P < 0.001). More-over, 2#-FL was negatively correlated with 3#-FL (P < 0.0005)and LNFP II (P < 0.0005), which contain a1,3-linked and a1,4-linked fucose molecules, respectively. LDFT was also positivelycorrelated with LNFP I (P < 0.0005) and negatively correlatedwith LNFP II (P < 0.01) and LNT (P < 0.0005). LNFP I wasnegatively associated with LNFP II (P < 0.01). Furthermore, 3#-FL was negatively associated with fucose (P < 0.001) and LNFPI (P < 0.0005) and positively associated with glucose (P < 0.05)and LNFP II (P < 0.0005). Nonsecretors also had higherconcentrations of 6#-SL (Fig. 3E), which was positivelycorrelated with LNFP III (P < 0.01) and LNT (P < 0.05). Therelations between concentrations of a1,2-linked fucosyloligo-saccharides with a1,3/4-linked fucosyloligosaccharides in ourstudy are supported by observations made by Chaturvedi et al.(14).
Other correlations between HMOs were found betweenLNnTand LNFP II (P < 0.05), LNFP III (P < 0.05), and LNT (P <0.05) and between LNTand LNFP II (P < 0.0005), and LNFP III(P < 0.001). Fucose, the core monosaccharide of fucosylatedoligosaccharides, was also related to the concentrations of milkoligosaccharides: 2#-FL (P < 0.0005), 3#-FL (P < 0.001), glucose
TABLE 2 Continued
Range
Metabolite Value Minimum Maximum Biological CV2 Methodologic precision3
Ethanolamine 46.2 6 18.1 16.6 99.4 39.2 6.9 6 2.8
Glycero-3-phosphocholine 471 6 161 177 1.07 x 10³ 34.1 4.1 6 3.2
myo-Inositol 865 6 177 389 1.50 x 10³ 20.5 4.7 6 3.8
Phosphocholine 355 6 171 9.9 733 48.3 5.1 6 2.6
Vitamins
Ascorbate 96.6 6 52.5 17.3 305 54.3 4.7 6 2.9
Niacinamide 5.3 6 3.3 0.8 13.8 62.8 7.4 6 2.1
Pantothenate 14.7 6 7.3 4.9 34.3 49.8 5.0 6 1.6
Nucleotides and derivatives
Cytidine 3.4 6 1.4 0.9 7.1 42.9 6.4 6 2.1
Hypoxanthine 2.3 6 1.5 0.1 6.4 65.3 14.5 6 5.4
Uridine 7.1 6 3.7 1.0 22.4 52.3 5.3 6 3.4
Others
Formate 12.2 6 14.8 2.0 89.7 121 5.7 6 2.9
Hippurate 7.8 6 4.2 1.3 19.4 53.8 5.8 6 3.7
Methanol 23.6 6 16.1 6.9 115 68.4 5.9 6 2.9
1 Values are means6 SDs, ranges (minimum, maximum), or percentages for secretors and nonsecretors combined; n = 52. BDL, below the limit of detection;
LDFT, lactodifucotetraose; LNFP, lacto-N-fucopentaose; LNnT, lacto-N-neotetraose; LNT, lacto-N-tetraose; 2#-FL, 2#-fucosyllactose; 3#-FL, 3#-fucosyllactose;
3#-SL, 3#-sialyllactose; 6#-SL, 6#-sialyllactose.2 Values for biological %CVs were calculated as SD/mean 3 100.3 Values for the methodologic precision for each metabolite were calculated as the mean 6 SD (%) of the %CV for 8 biological milk samples that were
individually prepared and analyzed in triplicate by 1H NMR.
The human milk metabolome 5 of 10
at UN
IVE
RS
ITY
OF
CA
LIFO
RN
IA D
AV
IS on S
eptember 16, 2013
jn.nutrition.orgD
ownloaded from
(P < 0.01), LDFT (P < 0.0005), LNFP I (P < 0.0005), LNFP II(P < 0.0005), and LNT (P < 0.0005). Other mono- and disac-charides that correlated with HMOs included 3#-SL and galactose(P < 0.05) or lactose (P < 0.05) and glucose with the followingoligosaccharides: 2#-FL (P < 0.0005), LDFT (P < 0.001), LNFPI (P < 0.0005), and LNFP III (P < 0.01) (Fig. 4).
To further investigate the link between the overall milkmetabolome and maternal health or dietary status, PLS-DAwasperformed on subsets of women, comparing the top and bottom20% of individuals with respect to age, blood pressure, diet, andphysical activity. In addition, individuals who reported fastingwere compared with those who consumed a meal within 4 h ofproviding a sample. Using all metabolite variables, or subsets ofmetabolite variables (Table 1), multivariate models could notbe developed for any of the potential classifiers, indicating thatthe human milk metabolome is relatively insensitive to fluctu-ations in health or diet for relatively healthy individuals. Lowerconcentrations of acetone in milk were observed in women withhigher BMI (r =20.41, P < 0.01), but no other correlations wereobserved.
The fact that multivariate models could not be generated islikely due to the fact that feature selection can be compromisedwith large numbers of variables when using the PLS-DA–basedVIP method (55). Therefore, forward logistic regression wasused with subsets of metabolites (Table 1). On the basis offorward logistic regression, galactose (OR: 5.5; P < 0.05) andalanine (OR: 3.2; P = 0.05) were found to be higher whencomparing postprandial with fasted states (P < 0.01; Fig. 5).
Discussion
For more than a decade, the use of NMR spectroscopy formetabolomics has led to the successful identification andmeasurement of metabolite concentrations in serum and urinethat reflect metabolic phenotype, health, disease, lifestyle, anddiet (44,46,56). Only a few metabolomics studies using NMRhave been conducted on milk, which includes bovine (9), humanpreterm (57), and recently, rhesus macaque milk (58). Studieshave shown high interindividual variation in human milk interms of fat, protein, lactose, glucose, citrate, creatinine, andmineral content (59,60). Several factors contribute to this var-iation including time of day, collection before or after infantfeeding, breast used to collect the milk, length of pregnancy,stage of lactation, and mother�s diet (60–63). In this study, wequantified the concentrations of 65 metabolites in human milkcollected on day 90 postpartum from 52 women. We identifiedmetabolites whose abundances were highly conserved across thecohort and thus likely represent metabolites with specificfunctional roles for the developing neonate. Moreover, relationsbetween several oligosaccharides that have not previously beenreported were discovered.Concentration analysis of milk metabolites suggested severalhighly conserved metabolites with low%CV (#25%), includinglactose, urea, creatinine, glutamate, myo-inositol, citrate, andvaline, as well as total oligosaccharide content. The presence andconcentration of metabolites in mammalian milks have been pro-posed to reflect their evolutionary history (64). Lactose (4% CV),
FIGURE 1 Principal components analysis scores plot of milk
samples from 52 participants (A). Those with 2#-FL concentrations
at low or undetectable concentrations are labeled as ‘‘nonsecretors’’
and are indicated as open circles. Those with high concentrations of
2#-FL are labeled as ‘‘secretors.’’ Principal components are indicated
(t[1] and t[2]). A corresponding (p[1] and p[2]) loadings plot illustrating
the variables responsible for separation of the observations in A is depicted
in panel B. Metabolite variables contributing the most to separation are
circled. LDFT, lactodifucotetraose; LNFP, lacto-N-fucopentaose; LNnT,
lacto-N-neotetraose; LNT, lacto-N-tetraose; 2#-FL, 2#-fucosyllactose;3#-FL, 3#-fucosyllactose; 3#-SL, 3#-sialyllactose; 6#-SL, 6#-sialyllactose.
FIGURE 2 Comparison of the concentration
of HMOs synthesized by the product of the
FUT2 (fucosyltransferase 2) gene. 2#-FL (A),
LNFP I (B), and LDFT (C). Secretors (S; solid
circles; n = 40) and nonsecretors (NS; open
circles; n = 12) are shown. ***P , 0.0005.
HMO, human milk oligosaccharide; LDFT, lacto-
difucotetraose; LNFP, lacto-N-fucopentaose; 2#-FL, 2#-fucosyllactose.
6 of 10 Smilowitz et al.
at UN
IVE
RS
ITY
OF
CA
LIFO
RN
IA D
AV
IS on S
eptember 16, 2013
jn.nutrition.orgD
ownloaded from

the most abundant component in milk after water (;7% wt:v),comprising ;40% of total energy intake of the infant, is themajor osmotic component regulating milk volume (65). Thatlactose concentration in milk is closely conserved among motherssuggests that there is value in consistent delivery to the neonate,and furthermore that osmotic balance in milk is important.Another osmolyte with low%CV wasmyo-inositol (20%). Thismetabolite, which is also relatively high in concentration, isimportant in infant development as an osmoregulator (66) anda precursor of phospholipids (67). A previous study reportedthat myo-inositol supplementation during the early neonatalperiod decreases the likelihood of injury to the retina and lung inpremature infants with respiratory distress syndrome (68).
The next highest abundant metabolite in human milk wasurea (4.5 6 0.8 mmol/L), with the second lowest %CV (18%).This is unlike the high variation in urea concentrations in theurine and serum of infants <6 mo of age (77% and 44%, re-spectively; unpublished observations) and is higher than urea inserum (1.2–3.5 mmol/L). The low %CV and abundant concen-trations of urea in milk suggest regulation at the level of themammary gland. A study by Mepham and Linzell (69) revealedthat 3 times more L-arginine accumulates in the mammary glandthan is required for milk protein synthesis. Moreover, infusion ofradiolabeled arginine into the lactating goat mammary glandresulted in 18% of it being recovered as urea in milk and none inblood (69). Tight regulation of urea concentration by the mam-mary gland suggests that urea may have an important role in thedeveloping neonate. One such role could be to provide com-mensal gut microbiota with a readily available nitrogen source(70,71). Gut microbes use urea and ammonia for protein syn-thesis, which is driven by the energy produced by carbohydratefermentation (72). Indeed, ingestion of lactulose for 4 wk resultedin a significant reduction in urinary 15N accompanied by signif-icant increases in fecal amounts of 15N and Bifidobacterium (73).Because HMOs enrich the growth of bifidobacteria in breastfedinfants (74), and total HMOs had a %CV similar to urea (18%),it is interesting to speculate that urea may be an importantnitrogen source for gut bacteria.
In agreement with other studies (49,75), the most abundantfree amino acids in human milk were the nonessential amino
acids: glutamate, taurine, alanine, and glutamine. The biologicalvariation for glutamate was 20%, which may be explained by itsmultifunctional effects on gut health, energy metabolism, andsignaling. Glutamate is not absorbed at similar rates as otherdietary amino acids and is therefore considered to act as a majoroxidative fuel for enterocytes. Glutamate is also a signalingmolecule that supports neuroendocrine reflexes and gastroin-testinal barrier function (76). The low variability in valine inbreastmilkmay be related to ensuring enough glutamate is presentin the gastrointestinal tract. Indeed, branched-chain amino acidaminotransferase is found in intestinal cells and in the mammarygland and is the first step in catabolism of branched-chain aminoacids, producing glutamate from a-ketoglutarate (77). Similarly,citrate, which is a key metabolite in the tricarboxylic acid cycle, isimportant for glutamate production from 2-oxoglutarate. The factthat fumarate and succinate do not have low %CVs suggests thatat least part of the function of citratemay be to produce glutamate.These conserved milk metabolites may play essential roles inregulating infant growth and support the development of gutmicrobial colonization.
The most variable metabolites in milk included the following:2#-FL, fucose, LDFT, LNFP I, LNFP II, aspartate, lysine, proline,acetone, creatine phosphate, fumarate, acetate, azelate, buty-rate, choline, niacinamide, hypoxanthine, formate, and metha-nol as well as the essential nutrients obtained from maternal dietthat include choline, niacinamide, ascorbate, and pantothenate.As previously indicated, 2#-FL, LDFT, and LNFP I reflect maternalsecretor status, because their production is a consequence of thefucosyltransferase encoded by the FUT2 gene. Similarly, thecorrelation between 3#-FL and LNFP II is expected based on thefact that their production is a consequence of the fucosyltransferaseencoded by the FUT3 gene. Interestingly, positive correlationsamong 6#-SL, LNT, and LNFP III were also observed. Theextensive correlation (both positive and negative) of milk mono-saccharides, disaccharides, and oligosaccharides coupled with theconserved total oligosaccharide concentration suggests diversematernal phenotypes that regulate the concentrations of milksugars, and in particular milk oligosaccharides.
Fucose was positively correlated with the a1,2-linked, and neg-atively correlated with the a1,3/4-linked, fucosyloligosaccharides,
FIGURE 3 Comparison of the concentration
of sugars not produced by the product of the
FUT2 (fucosyltransferase 2) gene. Fucose (A),
3#-FL (B), LNFP II (C), LNT(D), and 6#-SL (E).
Secretors (S; solid circles; n = 40) and non-
secretors (NS; white circles; n = 12) are shown.
*P , 0.05, **P , 0.01, ***P , 0.0005. LNFP,
lacto-N-fucopentaose; LNT, lacto-N-tetraose; 3#-FL, 3#-fucosyllactose; 6#-SL, 6#-sialyllactose.
The human milk metabolome 7 of 10
at UN
IVE
RS
ITY
OF
CA
LIFO
RN
IA D
AV
IS on S
eptember 16, 2013
jn.nutrition.orgD
ownloaded from

suggesting that free fucose in milk could be a consequence ofmetabolism of a1,2-linked fucosyloligosaccharides. Humanmilk fucosyltransferase and fucosidase activities vary accordingto lactation stage (78) and are susceptible to sample handling(79). In addition, human milk contains anaerobic bacteria in-cluding bifidobacteria (6) that express fucosidase (74). Whethermilk fucose concentrations are reflected by endogenous enzy-matic activity in the mammary gland or by bacterial actionremains to be clarified.
To further elucidate causes of variation in the milk meta-bolome, associations between maternal diet, lifestyle, andphenotype with milk metabolites were investigated. A negativeassociation between maternal BMI measured at day 60 postpar-tum and milk concentrations of acetone in this study agree witha previous study that reported higher plasma acetone concen-trations in lean compared with obese participants (28). Ananalysis of fasted compared with fed states by participants at thetime of sample collection revealed that galactose and alaninewere 65% and 36%, respectively, higher in milk collected fromwomen who had consumed a meal within 4 h of milk collectioncompared with women who reported collecting milk after atleast a 10 h fast. These data are consistent with other reports
illustrating that plasma alanine increases by 40% in adultparticipants 1 h after consuming a protein-rich meal (80), and68% of galactose in milk is derived from plasma glucose duringthe postprandial state compared with 50% in the fasted state(34). Future studies will be aimed at using global metabolomics
FIGURE 4 Spearman correlation heatmap of human milk sugars. The size of the circle in the upper right triangle represents the magnitude of
the correlation, whereas the color represents the direction of the relationship (black = positively correlated; white = negatively correlated). The
values located at the bottom left are the Spearman r values corresponding to the pairwise correlation. LDFT, lactodifucotetraose; LNFP, lacto-N-
fucopentaose; LNnT, lacto-N-neotetraose; LNT, lacto-N-tetraose; 2#-FL, 2#-fucosyllactose; 3#-FL, 3#-fucosyllactose; 3#-SL, 3#-sialyllactose; 6#-SL,6#-sialyllactose.
FIGURE 5 Comparison of metabolites that differentiate fasting (black
circles; n = 12) from fed (white circles; n = 16) states: alanine (A) and
galactose (B). Values are means 6 SEMs, *P , 0.01, *** P , 0.0001.
8 of 10 Smilowitz et al.
at UN
IVE
RS
ITY
OF
CA
LIFO
RN
IA D
AV
IS on S
eptember 16, 2013
jn.nutrition.orgD
ownloaded from

to determine relations between specific analytes derived from thediet and excreted by the mammary gland.
AcknowledgmentsThe authors thank Darya Mishchuk for technical assistance andXuan He for helpful suggestions and critical reading of themanuscript. C.M.S., J.T.S., J.B.G., and B.L. designed the study;J.T.S. and C.M.S. conducted the research and wrote themanuscript; D.B. provided oligosaccharide standards essentialfor this project; J.T.S., A.O., and C.M.S. analyzed the data; andC.M.S. had primary responsibility for final content. All authorsread and approved the final manuscript.
Literature Cited
1. Le Huerou-Luron I, Blat S, Boudry G. Breast- v. formula-feeding:impacts on the digestive tract and immediate and long-term healtheffects. Nutr Res Rev. 2010;23:23–36.
2. Brandtzaeg P. The mucosal immune system and its integration with themammary glands. J Pediatr. 2010;156:S8–15.
3. Morrow AL, Ruiz-Palacios GM, Jiang X, Newburg DS. Human milkglycans that inhibit pathogen binding protect breast-feeding infantsagainst infectious diarrhea. J Nutr. 2005;135:1304–7.
4. Lonnerdal B. Bioactive proteins in human milk: mechanisms of action.J Pediatr. 2010;156:S26–30.
5. Kunz C, Rudloff S, Baier W, Klein N, Strobel S. Oligosaccharides inhuman milk: structural, functional, and metabolic aspects. Annu RevNutr. 2000;20:699–722.
6. Cabrera-Rubio R, Collado MC, Laitinen K, Salminen S, Isolauri E,Mira A. The human milk microbiome changes over lactation and isshaped by maternal weight and mode of delivery. Am J Clin Nutr.2012;96:544–51.
7. Anderson SM, Rudolph MC. Secretory activation in the mammarygland: it’s not just about milk protein synthesis. Breast Cancer Res.2007;9:204–7.
8. Duffield TF, Lissemore KD, McBride BW, Leslie KE. Impact ofhyperketonemia in early lactation dairy cows on health and production.J Dairy Sci. 2009;92:571–80.
9. Klein MS, Buttchereit N, Miemczyk SP, Immervoll A-K, Louis C,Wiedemann S, Junge W, Thaller G, Oefner PJ, Gronwald W. NMRmetabolomic analysis of dairy cows reveals milk glycerophosphocholineto phosphocholine ratio as prognostic biomarker for risk of ketosis.J Proteome Res. 2012;11:1373–81.
10. Oriol R, Pendu J, Mollicone R. Genetics of ABO, H, Lewis, X andrelated antigens. Vox Sang. 1986;51:161–71.
11. De Leoz MLA, Gaerlan SC, Strum JS, Dimapasoc LM, Mirmiran M,Tancredi DJ, Smilowitz JT, Kalanetra KM, Mills DA, German JB.Lacto-N-tetraose, fucosylation, and secretor status are highly variablein human milk oligosaccharides from women delivering preterm.J Proteome Res. 2012;11:4662–72.
12. Thurl S, Munzert M, Henker J, Boehm G, Muller-Werner B, Jelinek J,Stahl B. Variation of human milk oligosaccharides in relation to milkgroups and lactational periods. Br J Nutr. 2010;104:1261–71.
13. Totten SM, Zivkovic AM, Wu S, Ngyuen U, Freeman SL, Ruhaak LR,Darboe MK, German JB, Prentice AM, Lebrilla CB. Comprehensiveprofiles of human milk oligosaccharides yield highly sensitive andspecific markers for determining secretor status in lactating mothers.J Proteome Res. 2012;11:6124–33.
14. Chaturvedi P, Warren CD, Altaye M, Morrow AL, Ruiz-Palacios G,Pickering LK, Newburg DS. Fucosylated human milk oligosaccharidesvary between individuals and over the course of lactation. Glycobiology.2001;11:365–72.
15. Grollman EF, Ginsburg V. Correlation between secretor status and theoccurrence of 2#-fucosyllactose in human milk. Biochem Biophys ResCommun. 1967;28:50–3.
16. Shen L, Grollman EF, Ginsburg V. An enzymatic basis for secretor statusand blood group substance specificity in humans. Proc Natl Acad SciUSA. 1968;59:224–30.
17. Viverge D, Grimmonprez L, Cassanas G, Bardet L, Solere M. Discrim-inant carbohydrate components of human milk according to donorsecretor types. J Pediatr Gastroenterol Nutr. 1990;11:365–70.
18. Newburg DS, Ruiz-Palacios GM, Altaye M, Chaturvedi P, Meinzen-Derr J, Guerrero Mde L, Morrow AL. Innate protection conferred byfucosylated oligosaccharides of human milk against diarrhea inbreastfed infants. Glycobiology. 2004;14:253–63.
19. Morrow AL, Ruiz-Palacios GM, Altaye M, Jiang X, Guerrero ML,Meinzen-Derr JK, Farkas T, Chaturvedi P, Pickering LK, Newburg DS.Human milk oligosaccharides are associated with protection againstdiarrhea in breast-fed infants. J Pediatr. 2004;145:297–303.
20. Wacklin P, Makivuokko H, Alakulppi N, Nikkila J, Tenkanen H,Rabina J, Partanen J, Aranko K, Matto J. Secretor genotype (FUT2gene) is strongly associated with the composition of Bifidobacteria in thehuman intestine. PLoS ONE. 2011;6:e20113.
21. Parmar AS, Alakulppi N, Paavola-Sakki P, Kurppa K, Halme L,Farkkila M, Turunen U, Lappalainen M, Kontula K, Kaukinen K, et al.Association study of FUT2 (rs601338) with celiac disease and inflam-matory bowel disease in the Finnish population. Tissue Antigens.2012;80:488–93.
22. Jette M, Sidney K, Blumchen G. Metabolic equivalents (METS) inexercise testing, exercise prescription, and evaluation of functionalcapacity. Clin Cardiol. 1990;13:555–65.
23. Gerrior S, Juan WY, Basiotis P. An easy approach to calculating es-timated energy requirements. Prev Chronic Dis. 2006;3:A129–32.
24. Dewey KG, Heinig MJ, Nommsen LA. Maternal weight-loss patternsduring prolonged lactation. Am J Clin Nutr. 1993;58:162–6.
25. Ferris AM, Jensen RG. Lipids in human milk: a review. 1: sampling, de-termination, and content. J Pediatr Gastroenterol Nutr. 1984;3:108–22.
26. Slupsky CM, Rankin KN, Wagner J, Fu H, Chang D, Weljie AM, SaudeEJ, Lix B, Adamko DJ, Shah S, et al. Investigations of the effects ofgender, diurnal variation, and age in human urinary metabolomicprofiles. Anal Chem. 2007;79:6995–7004.
27. Weljie AM, Newton J, Mercier P, Carlson E, Slupsky CM. Targetedprofiling: quantitative analysis of 1H NMR metabolomics data. AnalChem. 2006;78:4430–42.
28. Reichard GA Jr, Haff A, Skutches C, Paul P, Holroyde C, Owen O.Plasma acetone metabolism in the fasting human. J Clin Invest.1979;63:619–26.
29. Graham TE, Sgro V, Friars D, Gibala M. Glutamate ingestion: theplasma and muscle free amino acid pools of resting humans. Am JPhysiol Endocrinol Metab. 2000;278:E83–9.
30. Vina JR, Puertes IR, Rodriguez A, Saez GT, Vina J. Effect of fasting onamino acid metabolism by lactating mammary gland: studies in womenand rats. J Nutr. 1987;117:533–8.
31. Bales JR, Bell JD, Nicholson JK, Sadler PJ. 1H NMR studies of urineduring fasting: excretion of ketone bodies and acetylcarnitine. MagnReson Med. 1986;3:849–56.
32. Chaiyabutr N, Faulkner A, Peaker M. Changes in the concentrations ofthe minor constituents of goat’s milk during starvation and on refeedingof the lactating animal and their relationship to mammary glandmetabolism. Br J Nutr. 1981;45:149–57.
33. Lenz EM, Bright J, Wilson ID, Morgan SR, Nash AFP. A 1H NMR-based metabonomic study of urine and plasma samples obtained fromhealthy human subjects. J Pharm Biomed Anal. 2003;33:1103–15.
34. Sunehag A, Tigas S, Haymond MW. Contribution of plasma galactoseand glucose to milk lactose synthesis during galactose ingestion. J ClinEndocrinol Metab. 2003;88:225–9.
35. Rasmussen LG, Winning H, Savorani F, Toft H, Larsen TM, DragstedLO, Astrup A, Engelsen SB. Assessment of the effect of high or lowprotein diet on the human urine metabolome as measured by NMR.Nutrients. 2012;4:112–31.
36. Bertram HC, Hoppe C, Petersen BO, Duus J, Molgaard C, MichaelsenKF. An NMR-based metabonomic investigation on effects of milk andmeat protein diets given to 8-year-old boys. Br J Nutr. 2007;97:758–63.
37. Stella C, Beckwith-Hall B, Cloarec O, Holmes E, Lindon JC, Powell J,van der Ouderaa F, Bingham S, Cross AJ, Nicholson JK. Susceptibilityof human metabolic phenotypes to dietary modulation. J Proteome Res.2006;5:2780–8.
38. Rasmussen LG, Winning H, Savorani F, Ritz C, Engelsen S, Astrup A,Larsen T, Dragsted L. Assessment of dietary exposure related to dietaryGI and fibre intake in a nutritional metabolomic study of human urine.Genes Nutr. 2012;7:281–93.
39. Xu J, Yang S, Cai S, Dong J, Li X, Chen Z. Identification of biochemicalchanges in lactovegetarian urine using 1H NMR spectroscopy andpattern recognition. Anal Bioanal Chem. 2010;396:1451–63.
The human milk metabolome 9 of 10
at UN
IVE
RS
ITY
OF
CA
LIFO
RN
IA D
AV
IS on S
eptember 16, 2013
jn.nutrition.orgD
ownloaded from
40. Walsh MC, Brennan L, Pujos-Guillot E, Sebedio J-L, Scalbert A, FaganA, Higgins DG, Gibney MJ. Influence of acute phytochemical intakeon human urinary metabolomic profiles. Am J Clin Nutr. 2007;86:1687–93.
41. Chorell E, Svensson MB, Moritz T, Antti H. Physical fitness level isreflected by alterations in the human plasma metabolome. Mol Biosyst.2012;8:1187–96.
42. Psihogios NG, Gazi IF, Elisaf MS, Seferiadis KI, Bairaktari ET. Gender-related and age-related urinalysis of healthy subjects by NMR-basedmetabonomics. NMR Biomed. 2008;21:195–207.
43. Kochhar S, JacobsDM,RamadanZ, Berruex F, Fuerholz A, Fay LB. Probinggender-specific metabolism differences in humans by nuclear magneticresonance-based metabonomics. Anal Biochem. 2006;352:274–81.
44. Holmes E, Loo RL, Stamler J, Bictash M, Yap IKS, Chan Q, Ebbels T,De Iorio M, Brown IJ, Veselkov KA, et al. Human metabolic phenotypediversity and its association with diet and blood pressure. Nature.2008;453:396–400.
45. Krupp D, Doberstein N, Shi L, Remer T. Hippuric acid in 24-hour urinecollections is a potential biomarker for fruit and vegetable consumptionin healthy children and adolescents. J Nutr. 2012;142:1314–20.
46. O’Sullivan A, Gibney MJ, Brennan L. Dietary intake patterns arereflected in metabolomic profiles: potential role in dietary assessmentstudies. Am J Clin Nutr. 2011;93:314–21.
47. Rana SK, Sanders T. Taurine concentrations in the diet, plasma, urineand breast milk of vegans compared with omnivores. Br J Nutr.1986;56:17–27.
48. Agostoni C, Carratu B, Boniglia C, Lammardo AM, Riva E, Sanzini E.Free glutamine and glutamic acid increase in human milk through athree-month lactation period. J Pediatr Gastroenterol Nutr. 2000;31:508–12.
49. Harzer G, Franzke V, Bindels JG. Human milk nonprotein nitrogencomponents: changing patterns of free amino acids and urea in thecourse of early lactation. Am J Clin Nutr. 1984;40:303–9.
50. Hoppe B, Roth B, Bauerfed C, Langman CB. Oxalate, citrate, andsulfate concentration in human milk compared with formula prepara-tions: influence on urinary anion excretion. J Pediatr GastroenterolNutr. 1998;27:383–6.
51. Coppa GV, Gabrielli O, Pierani P, Catassi C, Carlucci A, Giorgi PL.Changes in carbohydrate composition in human milk over 4 months oflactation. Pediatrics. 1993;91:637–41.
52. Hulsemann J, Manz F, Wember T, Schoch G. Administration of creatineand creatinine with breast milk and infant milk preparations. KlinPadiatr. 1987;199:292–5.
53. Ogasa K, Kuboyama M, Kiyosawa I, Suzuki T, Itoh M. The content offree and bound inositol in human and cow’s milk. J Nutr Sci Vitaminol(Tokyo). 1975;21:129–35.
54. Neville MC, Keller RP, Seacat J, Casey CE, Allen JC, Archer P. Studieson human lactation. I. Within-feed and between-breast variation inselected components of human milk. Am J Clin Nutr. 1984;40:635–46.
55. Mahadevan S, Shah SL, Marrie TJ, Slupsky CM. Analysis ofmetabolomic data using support vector machines. Anal Chem. 2008;80:7562–70.
56. McNiven EMS, German JB, Slupsky CM. Analytical metabolomics:nutritional opportunities for personalized health. J Nutr Biochem.2011;22:995–1002.
57. Marincola FC, Noto A, Caboni P, Reali A, Barberini L, Lussu M,Murgia F, SantoruML, Atzori L, Fanos V. A metabolomic study of pretermhuman and formula milk by high resolution NMR and GC/MS analysis:preliminary results. J Matern Fetal Neonatal Med. 2012;25:62–7.
58. O’Sullivan A, He X, McNiven EMS, Hinde K, Haggarty NW,Lonnerdal B, Slupsky CM. Metabolomic phenotyping validates theinfant rhesus monkey as a model of human infant metabolism. J PediatrGastroenterol Nutr. 2013;56:355–63.
59. Allen JC, Keller RP, Archer P, Neville MC. Studies in human lactation:milk composition and daily secretion rates of macronutrients in the firstyear of lactation. Am J Clin Nutr. 1991;54:69–80.
60. Mitoulas LR, Kent JC, Cox DB, Owens RA, Sherriff JL, Hartmann PE.Variation in fat, lactose and protein in human milk over 24h andthroughout the first year of lactation. Br J Nutr. 2002;88:29–37.
61. Bauer J, Gerss J. Longitudinal analysis of macronutrients and mineralsin human milk produced by mothers of preterm infants. Clin Nutr.2011;30:215–20.
62. Kent JC, Mitoulas LR, Cregan MD, Ramsay DT, Doherty DA,Hartmann PE. Volume and frequency of breastfeedings and fat contentof breast milk throughout the day. Pediatrics. 2006;117:e387–95.
63. Khan S, Prime DK, Hepworth AR, Lai CT, Trengove NJ, Hartmann PE.Investigation of short-term variations in term breast milk compositionduring repeated breast cxpression sessions. J Hum Lact. 2013;29:196–204.
64. Hinde K, German J. Food in an evolutionary context: insights frommother’s milk. J Sci Food Agric. 2012;92:2219–23.
65. Neville MC. The physiological basis of milk secretiona. Ann N Y AcadSci. 1990;586:1–11.
66. Beck FX, Schmolke M, Guder WG. Osmolytes. Curr Opin NephrolHypertens. 1992;1:43–52.
67. Holub BJ. Metabolism and function of myo-inositol and inositolphospholipids. Annu Rev Nutr. 1986;6:563–97.
68. Hallman M, Bry K, Hoppu K, Lappi M, Pohjavuori M. Inositolsupplementation in premature infants with respiratory distress syn-drome. N Engl J Med. 1992;326:1233–9.
69. Mepham TB, Linzell J. Urea formation by the lactating goat mammarygland. Nature. 1967;214:507–8.
70. Metges CC. Contribution of microbial amino acids to amino acidhomeostasis of the host. J Nutr. 2000;130 Suppl:1857S–64S.
71. Metges CC, Petzke KJ, El-Khoury AE, Henneman L, Grant I, Bedri S,Regan MM, Fuller MF, Young VR. Incorporation of urea and ammonianitrogen into ileal and fecal microbial proteins and plasma free aminoacids in normal men and ileostomates. Am J Clin Nutr. 1999;70:1046–58.
72. Li X, Min X, Xiao J, Kawasaki K, Ohta N, Sakaguchi E. Utilization ofdietary urea nitrogen is stimulated by D-mannitol feeding in rabbits.Anim Sci J. 2012;83:605–9.
73. De Preter V, Vanhoutte T, Huys G, Swings J, Rutgeerts P, Verbeke K.Effect of lactulose and Saccharomyces boulardii administration on thecolonic urea-nitrogen metabolism and the bifidobacteria concentrationin healthy human subjects. Aliment Pharmacol Ther. 2006;23:963–74.
74. Sela DA, Chapman J, Adeuya A, Kim JH, Chen F, Whitehead TR,Lapidus A, Rokhsar DS, Lebrilla CB, German JB, et al. The genomesequence of Bifidobacterium longum subsp. infantis reveals adaptationsfor milk utilization within the infant microbiome. Proc Natl Acad SciUSA. 2008;105:18964–9.
75. Rassin DK, Gaull GE, Heinonen K, Raihaa NC. Milk protein quantityand quality in low-birth-weight infants: II. Effects on selected aliphaticamino acids in plasma and urine. Pediatrics. 1977;59:407–22.
76. Burrin DG, Stoll B. Metabolic fate and function of dietary glutamate inthe gut. Am J Clin Nutr. 2009;90 Suppl:850S–6S.
77. Brosnan JT, Brosnan ME. Branched-chain amino acids: enzyme andsubstrate regulation. J Nutr. 2006;136 Suppl:207S–11S.
78. Wiederschain GY, Newburg DS. Human milk fucosyltransferase anda-L-fucosidase activities change during the course of lactation. J NutrBiochem. 1995;6:582–7.
79. Wiederschain GY, Newburg DS. Glycoconjugate stability in human milk:glycosidase activities and sugar release. J Nutr Biochem. 2001;12:559–64.
80. Adibi SA, Mercer DW. Protein digestion in human intestine as reflectedin luminal, mucosal, and plasma amino acid concentrations after meals.J Clin Invest. 1973;52:1586–94.
10 of 10 Smilowitz et al.
at UN
IVE
RS
ITY
OF
CA
LIFO
RN
IA D
AV
IS on S
eptember 16, 2013
jn.nutrition.orgD
ownloaded from
Related Documents